Zip Codes with the Highest Percentage of Families with Income Above $100,000 in Louisiana
RELATED REPORTS & OPTIONS
Family Income | $100k+
Louisiana
Compare Zip Codes
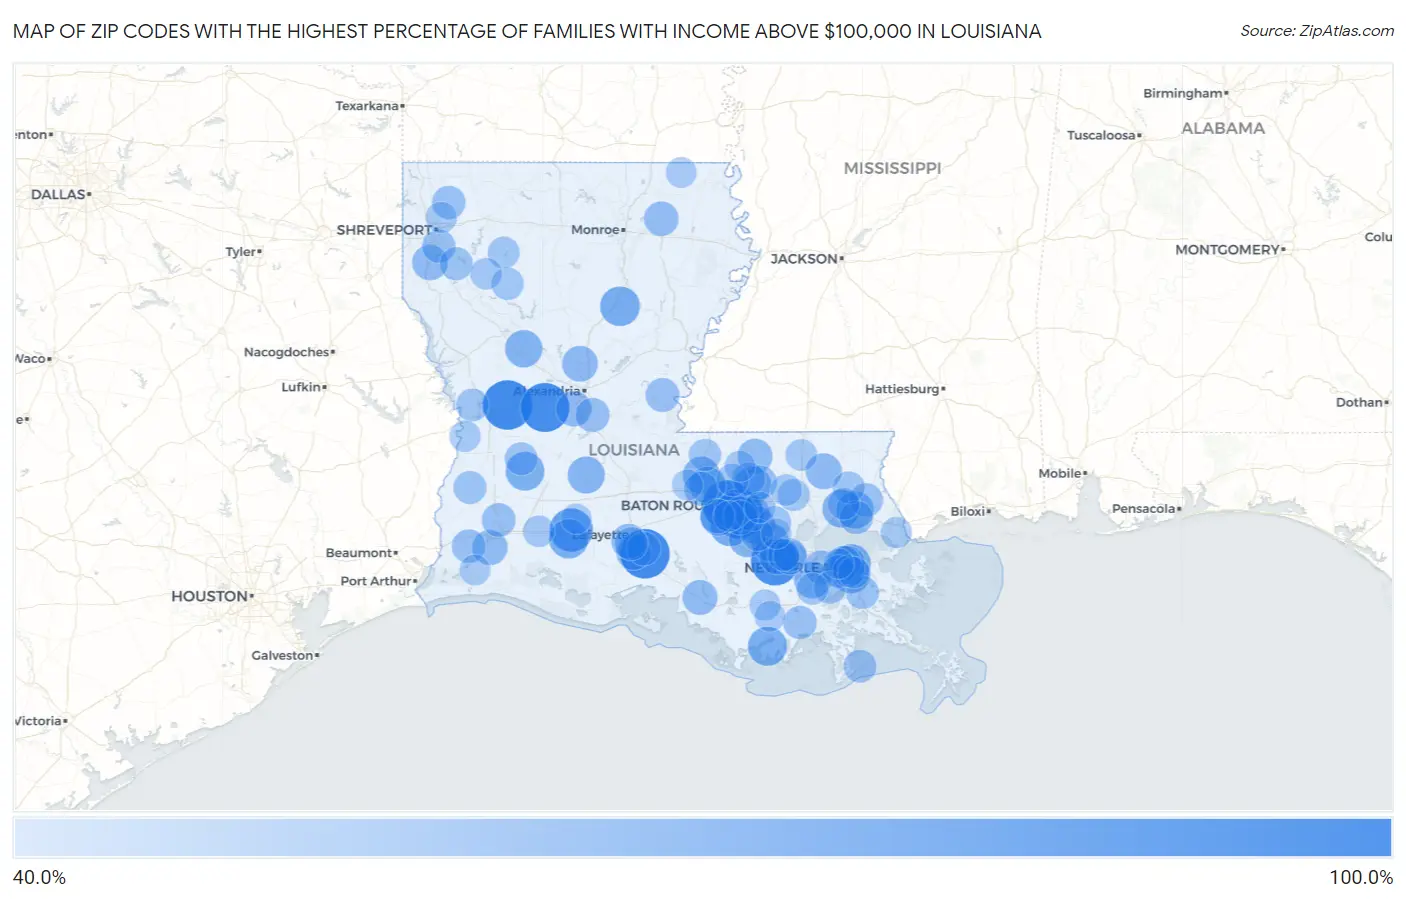
Map of Zip Codes with the Highest Percentage of Families with Income Above $100,000 in Louisiana
40.0%
100.0%
Zip Codes with the Highest Percentage of Families with Income Above $100,000 in Louisiana
| Zip Code | Families with Income > $100k | vs State | vs National | |
| 1. | 70801 | 100.0% | 36.7%(+63.3)#1 | 46.1%(+53.9)#38 |
| 2. | 70836 | 100.0% | 36.7%(+63.3)#2 | 46.1%(+53.9)#47 |
| 3. | 70519 | 100.0% | 36.7%(+63.3)#3 | 46.1%(+53.9)#208 |
| 4. | 71475 | 100.0% | 36.7%(+63.3)#4 | 46.1%(+53.9)#256 |
| 5. | 71472 | 98.0% | 36.7%(+61.3)#5 | 46.1%(+51.9)#275 |
| 6. | 70743 | 96.3% | 36.7%(+59.6)#6 | 46.1%(+50.2)#281 |
| 7. | 70537 | 81.5% | 36.7%(+44.8)#7 | 46.1%(+35.4)#866 |
| 8. | 71441 | 70.6% | 36.7%(+33.9)#8 | 46.1%(+24.5)#2,492 |
| 9. | 70780 | 70.5% | 36.7%(+33.8)#9 | 46.1%(+24.4)#2,515 |
| 10. | 70556 | 69.6% | 36.7%(+32.9)#10 | 46.1%(+23.5)#2,702 |
| 11. | 70124 | 69.4% | 36.7%(+32.7)#11 | 46.1%(+23.3)#2,740 |
| 12. | 70397 | 69.0% | 36.7%(+32.3)#12 | 46.1%(+22.9)#2,826 |
| 13. | 70637 | 67.8% | 36.7%(+31.1)#13 | 46.1%(+21.7)#3,076 |
| 14. | 70115 | 67.7% | 36.7%(+31.0)#14 | 46.1%(+21.6)#3,089 |
| 15. | 70778 | 66.5% | 36.7%(+29.8)#15 | 46.1%(+20.4)#3,375 |
| 16. | 70769 | 65.2% | 36.7%(+28.5)#16 | 46.1%(+19.1)#3,687 |
| 17. | 70447 | 64.7% | 36.7%(+28.0)#17 | 46.1%(+18.6)#3,824 |
| 18. | 70471 | 64.2% | 36.7%(+27.5)#18 | 46.1%(+18.1)#3,945 |
| 19. | 70739 | 63.8% | 36.7%(+27.1)#19 | 46.1%(+17.7)#4,070 |
| 20. | 71456 | 63.8% | 36.7%(+27.1)#20 | 46.1%(+17.7)#4,080 |
| 21. | 70580 | 63.0% | 36.7%(+26.3)#21 | 46.1%(+16.9)#4,294 |
| 22. | 70734 | 62.5% | 36.7%(+25.8)#22 | 46.1%(+16.4)#4,417 |
| 23. | 70783 | 62.3% | 36.7%(+25.6)#23 | 46.1%(+16.2)#4,481 |
| 24. | 70080 | 62.1% | 36.7%(+25.4)#24 | 46.1%(+16.0)#4,534 |
| 25. | 70729 | 61.6% | 36.7%(+24.9)#25 | 46.1%(+15.5)#4,685 |
| 26. | 70710 | 61.2% | 36.7%(+24.5)#26 | 46.1%(+15.1)#4,794 |
| 27. | 70808 | 61.0% | 36.7%(+24.3)#27 | 46.1%(+14.9)#4,847 |
| 28. | 70763 | 60.8% | 36.7%(+24.1)#28 | 46.1%(+14.7)#4,917 |
| 29. | 70442 | 59.8% | 36.7%(+23.1)#29 | 46.1%(+13.7)#5,212 |
| 30. | 71407 | 58.9% | 36.7%(+22.2)#30 | 46.1%(+12.8)#5,498 |
| 31. | 71078 | 58.7% | 36.7%(+22.0)#31 | 46.1%(+12.6)#5,551 |
| 32. | 70005 | 58.4% | 36.7%(+21.7)#32 | 46.1%(+12.3)#5,644 |
| 33. | 71485 | 58.4% | 36.7%(+21.7)#33 | 46.1%(+12.3)#5,654 |
| 34. | 70605 | 57.4% | 36.7%(+20.7)#34 | 46.1%(+11.3)#5,973 |
| 35. | 70722 | 57.1% | 36.7%(+20.4)#35 | 46.1%(+11.0)#6,072 |
| 36. | 70522 | 57.1% | 36.7%(+20.4)#36 | 46.1%(+11.0)#6,085 |
| 37. | 70592 | 56.8% | 36.7%(+20.1)#37 | 46.1%(+10.7)#6,156 |
| 38. | 70503 | 56.5% | 36.7%(+19.8)#38 | 46.1%(+10.4)#6,251 |
| 39. | 70817 | 56.2% | 36.7%(+19.5)#39 | 46.1%(+10.1)#6,360 |
| 40. | 70809 | 55.8% | 36.7%(+19.1)#40 | 46.1%(+9.70)#6,510 |
| 41. | 70810 | 55.7% | 36.7%(+19.0)#41 | 46.1%(+9.60)#6,536 |
| 42. | 70719 | 55.7% | 36.7%(+19.0)#42 | 46.1%(+9.60)#6,559 |
| 43. | 71264 | 55.5% | 36.7%(+18.8)#43 | 46.1%(+9.40)#6,640 |
| 44. | 70752 | 54.3% | 36.7%(+17.6)#44 | 46.1%(+8.20)#7,081 |
| 45. | 71346 | 54.2% | 36.7%(+17.5)#45 | 46.1%(+8.10)#7,109 |
| 46. | 70076 | 54.2% | 36.7%(+17.5)#46 | 46.1%(+8.10)#7,117 |
| 47. | 70047 | 54.1% | 36.7%(+17.4)#47 | 46.1%(+8.00)#7,130 |
| 48. | 71316 | 53.6% | 36.7%(+16.9)#48 | 46.1%(+7.50)#7,341 |
| 49. | 70611 | 53.3% | 36.7%(+16.6)#49 | 46.1%(+7.20)#7,422 |
| 50. | 70518 | 53.2% | 36.7%(+16.5)#50 | 46.1%(+7.10)#7,462 |
| 51. | 70665 | 53.2% | 36.7%(+16.5)#51 | 46.1%(+7.10)#7,465 |
| 52. | 70706 | 53.1% | 36.7%(+16.4)#52 | 46.1%(+7.00)#7,496 |
| 53. | 70420 | 52.9% | 36.7%(+16.2)#53 | 46.1%(+6.80)#7,588 |
| 54. | 70002 | 52.8% | 36.7%(+16.1)#54 | 46.1%(+6.70)#7,618 |
| 55. | 70448 | 52.4% | 36.7%(+15.7)#55 | 46.1%(+6.30)#7,796 |
| 56. | 70508 | 52.1% | 36.7%(+15.4)#56 | 46.1%(+6.00)#7,923 |
| 57. | 71106 | 52.1% | 36.7%(+15.4)#57 | 46.1%(+6.00)#7,926 |
| 58. | 71006 | 52.1% | 36.7%(+15.4)#58 | 46.1%(+6.00)#7,937 |
| 59. | 70343 | 52.0% | 36.7%(+15.3)#59 | 46.1%(+5.90)#7,995 |
| 60. | 70051 | 51.8% | 36.7%(+15.1)#60 | 46.1%(+5.70)#8,075 |
| 61. | 71115 | 51.3% | 36.7%(+14.6)#61 | 46.1%(+5.20)#8,281 |
| 62. | 70037 | 51.2% | 36.7%(+14.5)#62 | 46.1%(+5.10)#8,323 |
| 63. | 70660 | 51.1% | 36.7%(+14.4)#63 | 46.1%(+5.00)#8,380 |
| 64. | 70358 | 50.7% | 36.7%(+14.0)#64 | 46.1%(+4.60)#8,547 |
| 65. | 70770 | 50.6% | 36.7%(+13.9)#65 | 46.1%(+4.50)#8,580 |
| 66. | 70662 | 50.5% | 36.7%(+13.8)#66 | 46.1%(+4.40)#8,642 |
| 67. | 71403 | 50.0% | 36.7%(+13.3)#67 | 46.1%(+3.90)#8,817 |
| 68. | 70123 | 49.9% | 36.7%(+13.2)#68 | 46.1%(+3.80)#8,910 |
| 69. | 70070 | 49.6% | 36.7%(+12.9)#69 | 46.1%(+3.50)#9,022 |
| 70. | 70791 | 49.4% | 36.7%(+12.7)#70 | 46.1%(+3.30)#9,099 |
| 71. | 70733 | 49.3% | 36.7%(+12.6)#71 | 46.1%(+3.20)#9,174 |
| 72. | 71002 | 49.0% | 36.7%(+12.3)#72 | 46.1%(+2.90)#9,301 |
| 73. | 70775 | 48.9% | 36.7%(+12.2)#73 | 46.1%(+2.80)#9,318 |
| 74. | 70737 | 48.8% | 36.7%(+12.1)#74 | 46.1%(+2.70)#9,346 |
| 75. | 70435 | 48.8% | 36.7%(+12.1)#75 | 46.1%(+2.70)#9,357 |
| 76. | 70118 | 48.4% | 36.7%(+11.7)#76 | 46.1%(+2.30)#9,550 |
| 77. | 70711 | 48.3% | 36.7%(+11.6)#77 | 46.1%(+2.20)#9,607 |
| 78. | 70433 | 48.1% | 36.7%(+11.4)#78 | 46.1%(+2.00)#9,691 |
| 79. | 70052 | 47.8% | 36.7%(+11.1)#79 | 46.1%(+1.70)#9,874 |
| 80. | 70030 | 47.7% | 36.7%(+11.0)#80 | 46.1%(+1.60)#9,920 |
| 81. | 71045 | 47.7% | 36.7%(+11.0)#81 | 46.1%(+1.60)#9,937 |
| 82. | 71034 | 47.3% | 36.7%(+10.6)#82 | 46.1%(+1.20)#10,171 |
| 83. | 70130 | 47.2% | 36.7%(+10.5)#83 | 46.1%(+1.10)#10,195 |
| 84. | 70436 | 47.2% | 36.7%(+10.5)#84 | 46.1%(+1.10)#10,225 |
| 85. | 70744 | 46.7% | 36.7%(+10.00)#85 | 46.1%(+0.600)#10,461 |
| 86. | 70591 | 46.7% | 36.7%(+10.00)#86 | 46.1%(+0.600)#10,462 |
| 87. | 70726 | 46.2% | 36.7%(+9.50)#87 | 46.1%(+0.100)#10,694 |
| 88. | 70639 | 46.2% | 36.7%(+9.50)#88 | 46.1%(+0.100)#10,734 |
| 89. | 71111 | 46.0% | 36.7%(+9.30)#89 | 46.1%(-0.100)#10,812 |
| 90. | 70461 | 45.9% | 36.7%(+9.20)#90 | 46.1%(-0.200)#10,867 |
| 91. | 70777 | 45.3% | 36.7%(+8.60)#91 | 46.1%(-0.800)#11,181 |
| 92. | 70755 | 45.1% | 36.7%(+8.40)#92 | 46.1%(-1.00)#11,305 |
| 93. | 70395 | 45.0% | 36.7%(+8.30)#93 | 46.1%(-1.10)#11,346 |
| 94. | 70645 | 44.9% | 36.7%(+8.20)#94 | 46.1%(-1.20)#11,424 |
| 95. | 70820 | 44.6% | 36.7%(+7.90)#95 | 46.1%(-1.50)#11,565 |
| 96. | 71250 | 44.4% | 36.7%(+7.70)#96 | 46.1%(-1.70)#11,724 |
| 97. | 70360 | 44.3% | 36.7%(+7.60)#97 | 46.1%(-1.80)#11,746 |
| 98. | 70774 | 43.8% | 36.7%(+7.10)#98 | 46.1%(-2.30)#12,017 |
| 99. | 70543 | 43.7% | 36.7%(+7.00)#99 | 46.1%(-2.40)#12,092 |
| 100. | 70003 | 43.5% | 36.7%(+6.80)#100 | 46.1%(-2.60)#12,168 |
Common Questions
What are the Top 10 Zip Codes with the Highest Percentage of Families with Income Above $100,000 in Louisiana?
Top 10 Zip Codes with the Highest Percentage of Families with Income Above $100,000 in Louisiana are:
What zip code has the Highest Percentage of Families with Income Above $100,000 in Louisiana?
70801 has the Highest Percentage of Families with Income Above $100,000 in Louisiana with 100.0%.
What is the Percentage of Families with Income Above $100,000 in the State of Louisiana?
Percentage of Families with Income Above $100,000 in Louisiana is 36.7%.
What is the Percentage of Families with Income Above $100,000 in the United States?
Percentage of Families with Income Above $100,000 in the United States is 46.1%.