Zip Codes with the Highest Percentage of Families with Income Above $100,000 in Wyoming
RELATED REPORTS & OPTIONS
Family Income | $100k+
Wyoming
Compare Zip Codes
Map of Zip Codes with the Highest Percentage of Families with Income Above $100,000 in Wyoming
30.0%
100.0%
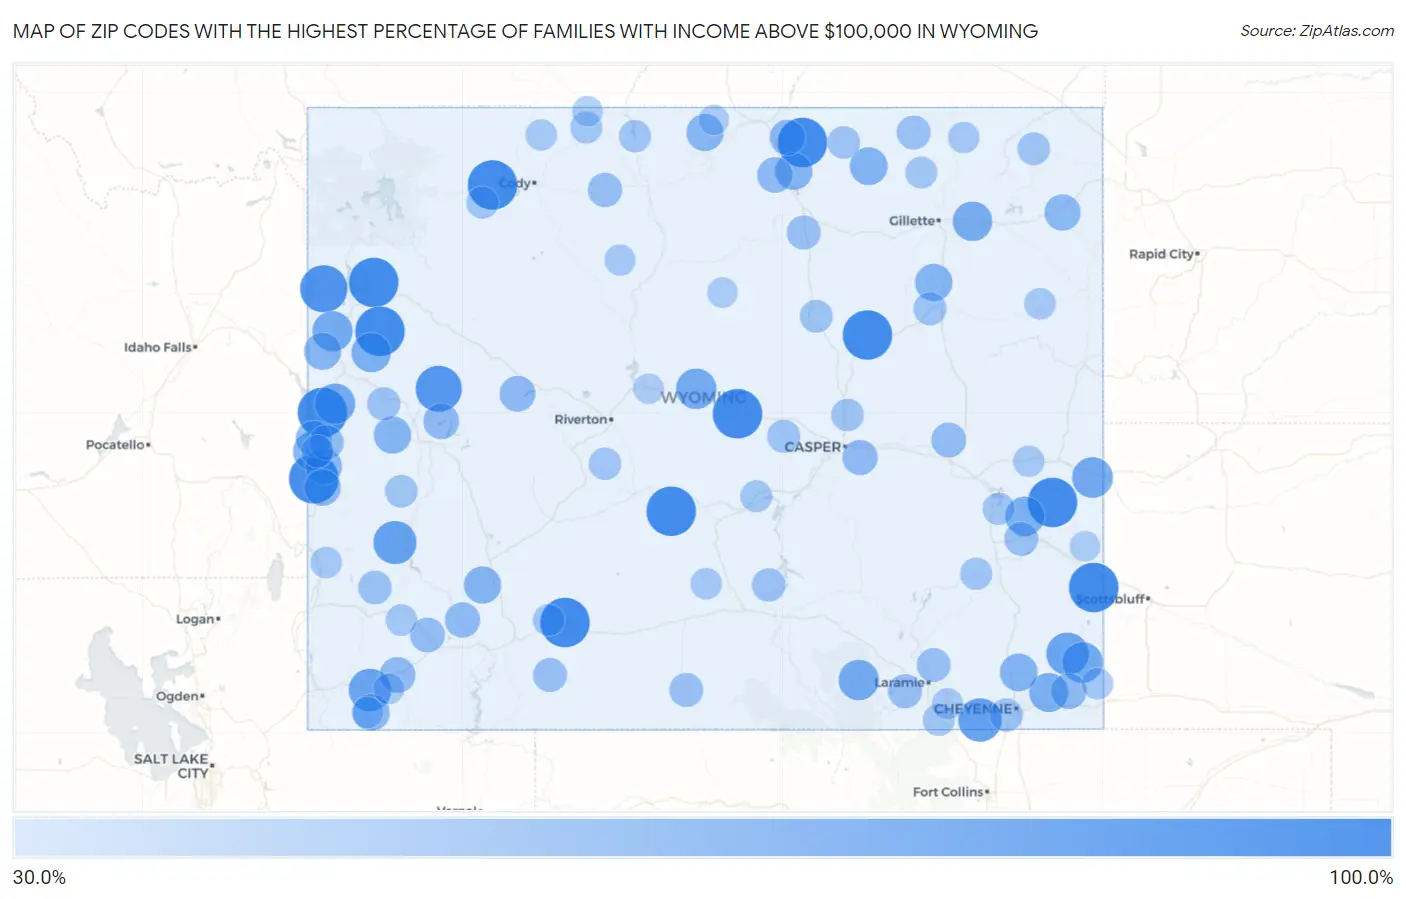
Zip Codes with the Highest Percentage of Families with Income Above $100,000 in Wyoming
| Zip Code | Families with Income > $100k | vs State | vs National | |
| 1. | 83013 | 100.0% | 45.0% (+55.0)#1 | 46.1% (+53.9)#26 |
| 2. | 83118 | 100.0% | 45.0% (+55.0)#2 | 46.1% (+53.9)#33 |
| 3. | 83011 | 100.0% | 45.0% (+55.0)#3 | 46.1% (+53.9)#36 |
| 4. | 82450 | 100.0% | 45.0% (+55.0)#4 | 46.1% (+53.9)#57 |
| 5. | 83119 | 100.0% | 45.0% (+55.0)#5 | 46.1% (+53.9)#60 |
| 6. | 82638 | 100.0% | 45.0% (+55.0)#6 | 46.1% (+53.9)#120 |
| 7. | 82640 | 100.0% | 45.0% (+55.0)#7 | 46.1% (+53.9)#121 |
| 8. | 82845 | 100.0% | 45.0% (+55.0)#8 | 46.1% (+53.9)#154 |
| 9. | 82942 | 100.0% | 45.0% (+55.0)#9 | 46.1% (+53.9)#167 |
| 10. | 82219 | 100.0% | 45.0% (+55.0)#10 | 46.1% (+53.9)#217 |
| 11. | 82310 | 100.0% | 45.0% (+55.0)#11 | 46.1% (+53.9)#223 |
| 12. | 82218 | 100.0% | 45.0% (+55.0)#12 | 46.1% (+53.9)#260 |
| 13. | 83414 | 92.1% | 45.0% (+47.1)#13 | 46.1% (+46.0)#323 |
| 14. | 82925 | 88.5% | 45.0% (+43.5)#14 | 46.1% (+42.4)#406 |
| 15. | 82059 | 79.3% | 45.0% (+34.3)#15 | 46.1% (+33.2)#1,113 |
| 16. | 83123 | 78.1% | 45.0% (+33.1)#16 | 46.1% (+32.0)#1,255 |
| 17. | 82933 | 75.6% | 45.0% (+30.6)#17 | 46.1% (+29.5)#1,615 |
| 18. | 82081 | 75.0% | 45.0% (+30.0)#18 | 46.1% (+28.9)#1,714 |
| 19. | 82050 | 69.7% | 45.0% (+24.7)#19 | 46.1% (+23.6)#2,681 |
| 20. | 82242 | 69.6% | 45.0% (+24.6)#20 | 46.1% (+23.5)#2,704 |
| 21. | 83128 | 68.7% | 45.0% (+23.7)#21 | 46.1% (+22.6)#2,888 |
| 22. | 82642 | 68.5% | 45.0% (+23.5)#22 | 46.1% (+22.4)#2,933 |
| 23. | 82055 | 68.3% | 45.0% (+23.3)#23 | 46.1% (+22.2)#2,963 |
| 24. | 83025 | 67.9% | 45.0% (+22.9)#24 | 46.1% (+21.8)#3,047 |
| 25. | 82727 | 65.6% | 45.0% (+20.6)#25 | 46.1% (+19.5)#3,593 |
| 26. | 83001 | 65.2% | 45.0% (+20.2)#26 | 46.1% (+19.1)#3,697 |
| 27. | 82215 | 64.8% | 45.0% (+19.8)#27 | 46.1% (+18.7)#3,812 |
| 28. | 82060 | 64.1% | 45.0% (+19.1)#28 | 46.1% (+18.0)#3,992 |
| 29. | 83111 | 63.3% | 45.0% (+18.3)#29 | 46.1% (+17.2)#4,209 |
| 30. | 82831 | 59.7% | 45.0% (+14.7)#30 | 46.1% (+13.6)#5,243 |
| 31. | 82009 | 59.3% | 45.0% (+14.3)#31 | 46.1% (+13.2)#5,344 |
| 32. | 82718 | 58.2% | 45.0% (+13.2)#32 | 46.1% (+12.1)#5,700 |
| 33. | 82832 | 57.8% | 45.0% (+12.8)#33 | 46.1% (+11.7)#5,859 |
| 34. | 82932 | 57.5% | 45.0% (+12.5)#34 | 46.1% (+11.4)#5,965 |
| 35. | 83115 | 57.5% | 45.0% (+12.5)#35 | 46.1% (+11.4)#5,968 |
| 36. | 83014 | 56.9% | 45.0% (+11.9)#36 | 46.1% (+10.8)#6,145 |
| 37. | 82836 | 56.8% | 45.0% (+11.8)#37 | 46.1% (+10.7)#6,168 |
| 38. | 82944 | 55.9% | 45.0% (+10.9)#38 | 46.1% (+9.80)#6,496 |
| 39. | 83110 | 55.4% | 45.0% (+10.4)#39 | 46.1% (+9.30)#6,667 |
| 40. | 83126 | 55.3% | 45.0% (+10.3)#40 | 46.1% (+9.20)#6,711 |
| 41. | 82729 | 54.1% | 45.0% (+9.10)#41 | 46.1% (+8.00)#7,140 |
| 42. | 83127 | 53.6% | 45.0% (+8.60)#42 | 46.1% (+7.50)#7,321 |
| 43. | 82937 | 52.7% | 45.0% (+7.70)#43 | 46.1% (+6.60)#7,677 |
| 44. | 82512 | 52.7% | 45.0% (+7.70)#44 | 46.1% (+6.60)#7,689 |
| 45. | 82053 | 52.6% | 45.0% (+7.60)#45 | 46.1% (+6.50)#7,725 |
| 46. | 82941 | 52.5% | 45.0% (+7.50)#46 | 46.1% (+6.40)#7,766 |
| 47. | 82801 | 52.2% | 45.0% (+7.20)#47 | 46.1% (+6.10)#7,882 |
| 48. | 82842 | 52.0% | 45.0% (+7.00)#48 | 46.1% (+5.90)#8,009 |
| 49. | 82609 | 50.9% | 45.0% (+5.90)#49 | 46.1% (+4.80)#8,450 |
| 50. | 82935 | 50.9% | 45.0% (+5.90)#50 | 46.1% (+4.80)#8,454 |
| 51. | 83112 | 49.5% | 45.0% (+4.50)#51 | 46.1% (+3.40)#9,083 |
| 52. | 82633 | 49.2% | 45.0% (+4.20)#52 | 46.1% (+3.10)#9,193 |
| 53. | 82934 | 49.2% | 45.0% (+4.20)#53 | 46.1% (+3.10)#9,215 |
| 54. | 82411 | 47.8% | 45.0% (+2.80)#54 | 46.1% (+1.70)#9,891 |
| 55. | 82070 | 46.8% | 45.0% (+1.80)#55 | 46.1% (+0.700)#10,390 |
| 56. | 82901 | 46.7% | 45.0% (+1.70)#56 | 46.1% (+0.600)#10,446 |
| 57. | 82321 | 46.5% | 45.0% (+1.50)#57 | 46.1% (+0.400)#10,591 |
| 58. | 82834 | 46.4% | 45.0% (+1.40)#58 | 46.1% (+0.300)#10,611 |
| 59. | 82725 | 46.3% | 45.0% (+1.30)#59 | 46.1% (+0.200)#10,692 |
| 60. | 82072 | 46.2% | 45.0% (+1.20)#60 | 46.1% (+0.100)#10,704 |
| 61. | 82214 | 46.0% | 45.0% (+1.00)#61 | 46.1% (-0.100)#10,850 |
| 62. | 83101 | 45.0% | 45.0% (=0.000)#62 | 46.1% (-1.10)#11,348 |
| 63. | 82334 | 44.6% | 45.0% (-0.400)#63 | 46.1% (-1.50)#11,603 |
| 64. | 82001 | 44.2% | 45.0% (-0.800)#64 | 46.1% (-1.90)#11,790 |
| 65. | 82922 | 44.1% | 45.0% (-0.900)#65 | 46.1% (-2.00)#11,890 |
| 66. | 82732 | 43.6% | 45.0% (-1.40)#66 | 46.1% (-2.50)#12,146 |
| 67. | 82604 | 43.3% | 45.0% (-1.70)#67 | 46.1% (-2.80)#12,301 |
| 68. | 82639 | 42.9% | 45.0% (-2.10)#68 | 46.1% (-3.20)#12,589 |
| 69. | 82720 | 42.3% | 45.0% (-2.70)#69 | 46.1% (-3.80)#12,963 |
| 70. | 83122 | 42.0% | 45.0% (-3.00)#70 | 46.1% (-4.10)#13,130 |
| 71. | 82835 | 42.0% | 45.0% (-3.00)#71 | 46.1% (-4.10)#13,143 |
| 72. | 82601 | 41.9% | 45.0% (-3.10)#72 | 46.1% (-4.20)#13,159 |
| 73. | 83113 | 41.8% | 45.0% (-3.20)#73 | 46.1% (-4.30)#13,238 |
| 74. | 82520 | 41.4% | 45.0% (-3.60)#74 | 46.1% (-4.70)#13,493 |
| 75. | 82414 | 41.0% | 45.0% (-4.00)#75 | 46.1% (-5.10)#13,722 |
| 76. | 82431 | 40.7% | 45.0% (-4.30)#76 | 46.1% (-5.40)#13,938 |
| 77. | 82201 | 40.6% | 45.0% (-4.40)#77 | 46.1% (-5.50)#14,006 |
| 78. | 82213 | 40.4% | 45.0% (-4.60)#78 | 46.1% (-5.70)#14,160 |
| 79. | 82620 | 39.6% | 45.0% (-5.40)#79 | 46.1% (-6.50)#14,718 |
| 80. | 82716 | 39.5% | 45.0% (-5.50)#80 | 46.1% (-6.60)#14,729 |
| 81. | 82084 | 39.5% | 45.0% (-5.50)#81 | 46.1% (-6.60)#14,781 |
| 82. | 82421 | 39.4% | 45.0% (-5.60)#82 | 46.1% (-6.70)#14,845 |
| 83. | 82945 | 39.2% | 45.0% (-5.80)#83 | 46.1% (-6.90)#14,987 |
| 84. | 83124 | 38.4% | 45.0% (-6.60)#84 | 46.1% (-7.70)#15,521 |
| 85. | 82701 | 38.2% | 45.0% (-6.80)#85 | 46.1% (-7.90)#15,613 |
| 86. | 82930 | 38.1% | 45.0% (-6.90)#86 | 46.1% (-8.00)#15,666 |
| 87. | 83114 | 38.1% | 45.0% (-6.90)#87 | 46.1% (-8.00)#15,715 |
| 88. | 82731 | 38.0% | 45.0% (-7.00)#88 | 46.1% (-8.10)#15,808 |
| 89. | 82301 | 37.9% | 45.0% (-7.10)#89 | 46.1% (-8.20)#15,833 |
| 90. | 82082 | 37.9% | 45.0% (-7.10)#90 | 46.1% (-8.20)#15,851 |
| 91. | 82073 | 37.5% | 45.0% (-7.50)#91 | 46.1% (-8.60)#16,177 |
| 92. | 82435 | 37.4% | 45.0% (-7.60)#92 | 46.1% (-8.70)#16,202 |
| 93. | 82227 | 37.4% | 45.0% (-7.60)#93 | 46.1% (-8.70)#16,253 |
| 94. | 82401 | 36.9% | 45.0% (-8.10)#94 | 46.1% (-9.20)#16,584 |
| 95. | 82939 | 36.0% | 45.0% (-9.00)#95 | 46.1% (-10.1)#17,226 |
| 96. | 82423 | 35.1% | 45.0% (-9.90)#96 | 46.1% (-11.0)#17,880 |
| 97. | 82442 | 34.9% | 45.0% (-10.1)#97 | 46.1% (-11.2)#18,000 |
| 98. | 82240 | 34.8% | 45.0% (-10.2)#98 | 46.1% (-11.3)#18,035 |
| 99. | 82649 | 34.5% | 45.0% (-10.5)#99 | 46.1% (-11.6)#18,278 |
| 100. | 82838 | 34.4% | 45.0% (-10.6)#100 | 46.1% (-11.7)#18,345 |
1
2Common Questions
What are the Top 10 Zip Codes with the Highest Percentage of Families with Income Above $100,000 in Wyoming?
Top 10 Zip Codes with the Highest Percentage of Families with Income Above $100,000 in Wyoming are:
What zip code has the Highest Percentage of Families with Income Above $100,000 in Wyoming?
83013 has the Highest Percentage of Families with Income Above $100,000 in Wyoming with 100.0%.
What is the Percentage of Families with Income Above $100,000 in the State of Wyoming?
Percentage of Families with Income Above $100,000 in Wyoming is 45.0%.
What is the Percentage of Families with Income Above $100,000 in the United States?
Percentage of Families with Income Above $100,000 in the United States is 46.1%.