Area Code 470 Map & Demographics
Area Code 470 Map

Area Code 470 Overview
$44,474
PER CAPITA INCOME
$104,890
AVG FAMILY INCOME
$84,585
AVG HOUSEHOLD INCOME
26.5%
WAGE / INCOME GAP [ % ]
73.5¢/ $1
WAGE / INCOME GAP [ $ ]
$11,219
FAMILY INCOME DEFICIT
27.27
INEQUALITY / GINI INDEX
2,053,607
TOTAL POPULATION
1,008,120
MALE POPULATION
1,045,487
FEMALE POPULATION
96.43
MALES / 100 FEMALES
103.71
FEMALES / 100 MALES
36.9
MEDIAN AGE
3.2
AVG FAMILY SIZE
2.6
AVG HOUSEHOLD SIZE
1,066,751
LABOR FORCE [ PEOPLE ]
65.7%
PERCENT IN LABOR FORCE
4.2%
UNEMPLOYMENT RATE
Income in Area Code 470
Income Overview in Area Code 470
Per Capita Income in Area Code 470 is $44,474, while median incomes of families and households are $104,890 and $84,585 respectively.
| Characteristic | Number | Measure |
| Per Capita Income | 2,053,607 | $44,474 |
| Median Family Income | 507,123 | $104,890 |
| Mean Family Income | 507,123 | $8,411,349 |
| Median Household Income | 754,989 | $84,585 |
| Mean Household Income | 754,989 | $6,924,811 |
| Income Deficit | 507,123 | $11,219 |
| Wage / Income Gap (%) | 2,053,607 | 26.53% |
| Wage / Income Gap ($) | 2,053,607 | 73.47¢ per $1 |
| Gini / Inequality Index | 2,053,607 | 27.27 |
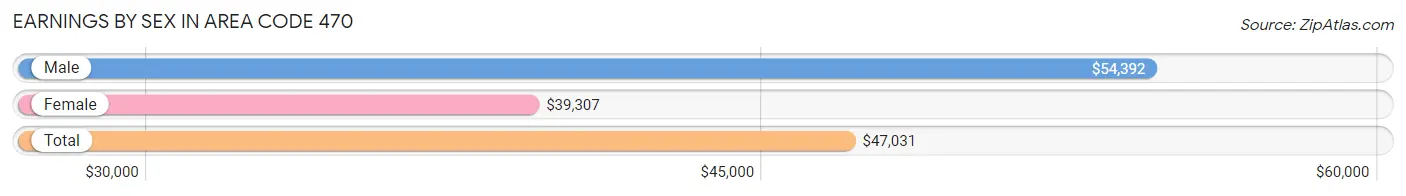
Earnings by Sex in Area Code 470
Average Earnings in Area Code 470 are $47,031, $54,392 for men and $39,307 for women, a difference of 27.7%.
| Sex | Number | Average Earnings |
| Male | 601,630 (53.0%) | $54,392 |
| Female | 532,548 (46.9%) | $39,307 |
| Total | 1,134,178 (100.0%) | $47,031 |
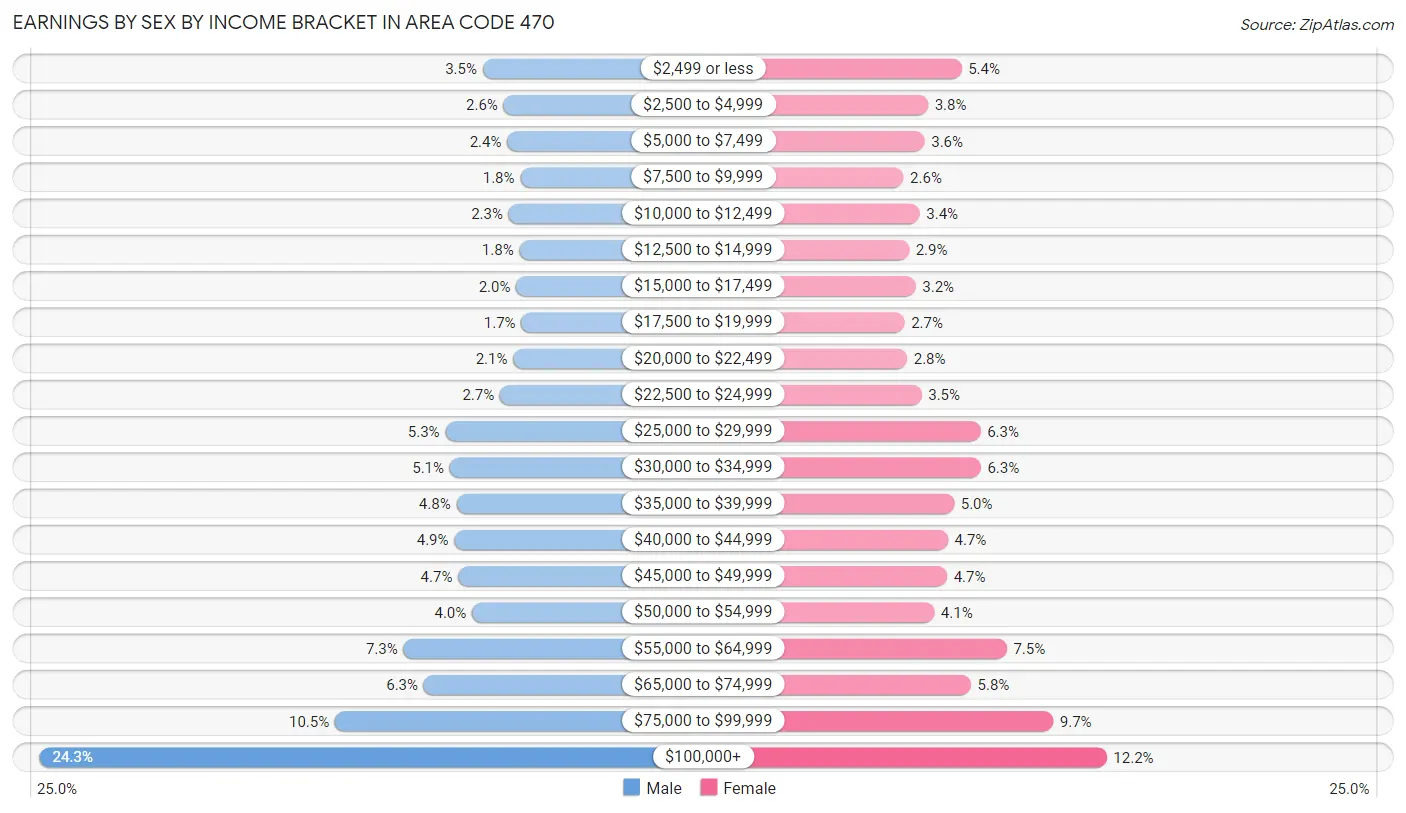
Earnings by Sex by Income Bracket in Area Code 470
The most common earnings brackets in Area Code 470 are $100,000+ for men (146,168 | 24.3%) and $100,000+ for women (64,732 | 12.2%).
| Income | Male | Female |
| $2,499 or less | 21,300 (3.5%) | 28,545 (5.4%) |
| $2,500 to $4,999 | 15,406 (2.6%) | 20,157 (3.8%) |
| $5,000 to $7,499 | 14,358 (2.4%) | 19,342 (3.6%) |
| $7,500 to $9,999 | 10,694 (1.8%) | 14,062 (2.6%) |
| $10,000 to $12,499 | 13,984 (2.3%) | 18,085 (3.4%) |
| $12,500 to $14,999 | 10,965 (1.8%) | 15,465 (2.9%) |
| $15,000 to $17,499 | 11,881 (2.0%) | 17,115 (3.2%) |
| $17,500 to $19,999 | 10,408 (1.7%) | 14,306 (2.7%) |
| $20,000 to $22,499 | 12,699 (2.1%) | 14,964 (2.8%) |
| $22,500 to $24,999 | 16,439 (2.7%) | 18,586 (3.5%) |
| $25,000 to $29,999 | 31,829 (5.3%) | 33,269 (6.2%) |
| $30,000 to $34,999 | 30,556 (5.1%) | 33,321 (6.3%) |
| $35,000 to $39,999 | 28,726 (4.8%) | 26,671 (5.0%) |
| $40,000 to $44,999 | 29,293 (4.9%) | 25,161 (4.7%) |
| $45,000 to $49,999 | 28,203 (4.7%) | 24,914 (4.7%) |
| $50,000 to $54,999 | 24,297 (4.0%) | 21,711 (4.1%) |
| $55,000 to $64,999 | 43,623 (7.2%) | 39,831 (7.5%) |
| $65,000 to $74,999 | 37,874 (6.3%) | 30,914 (5.8%) |
| $75,000 to $99,999 | 62,927 (10.5%) | 51,397 (9.7%) |
| $100,000+ | 146,168 (24.3%) | 64,732 (12.2%) |
| Total | 601,630 (100.0%) | 532,548 (100.0%) |
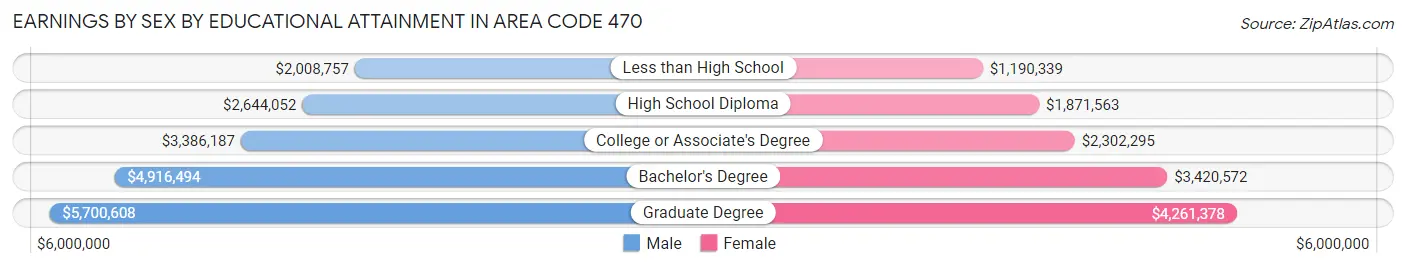
Earnings by Sex by Educational Attainment in Area Code 470
Average earnings in Area Code 470 are $3,886,516 for men and $2,860,183 for women, a difference of 26.4%. Men with an educational attainment of graduate degree enjoy the highest average annual earnings of $5,700,608, while those with less than high school education earn the least with $2,008,757. Women with an educational attainment of graduate degree earn the most with the average annual earnings of $4,261,378, while those with less than high school education have the smallest earnings of $1,190,339.
| Educational Attainment | Male Income | Female Income |
| Less than High School | $2,008,757 | $1,190,339 |
| High School Diploma | $2,644,052 | $1,871,563 |
| College or Associate's Degree | $3,386,187 | $2,302,295 |
| Bachelor's Degree | $4,916,494 | $3,420,572 |
| Graduate Degree | $5,700,608 | $4,261,378 |
| Total | $3,886,516 | $2,860,183 |
Family Income in Area Code 470
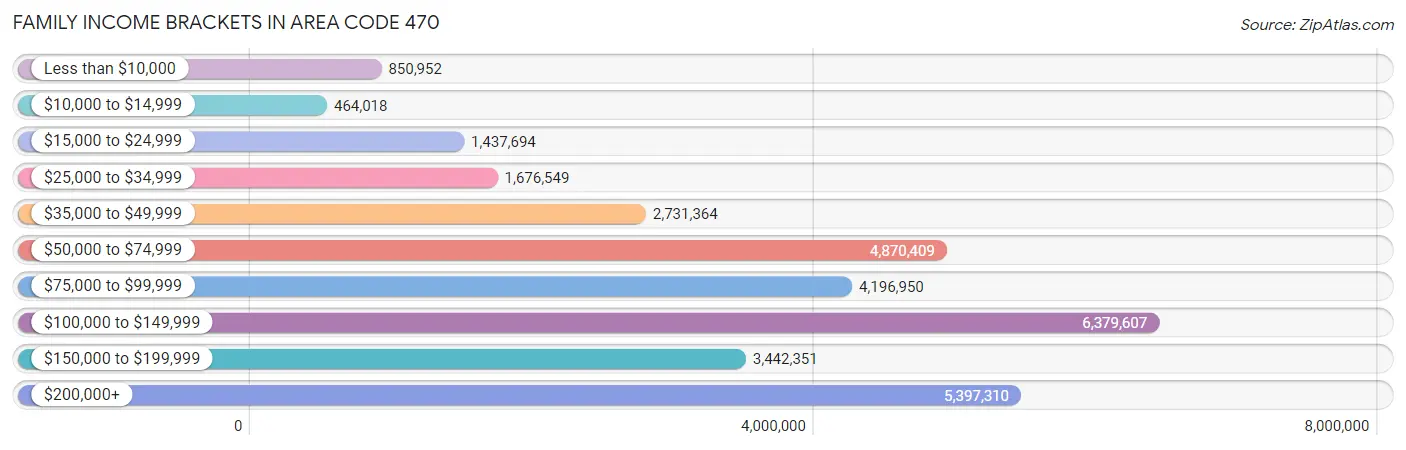
Family Income Brackets in Area Code 470
According to the Area Code 470 family income data, there are 6,379,607 families falling into the $100,000 to $149,999 income range, which is the most common income bracket and makes up 1,258.0% of all families. Conversely, the $10,000 to $14,999 income bracket is the least frequent group with only 464,018 families (91.5%) belonging to this category.
| Income Bracket | # Families | % Families |
| Less than $10,000 | 850,952 | 167.8% |
| $10,000 to $14,999 | 464,018 | 91.5% |
| $15,000 to $24,999 | 1,437,694 | 283.5% |
| $25,000 to $34,999 | 1,676,549 | 330.6% |
| $35,000 to $49,999 | 2,731,364 | 538.6% |
| $50,000 to $74,999 | 4,870,409 | 960.4% |
| $75,000 to $99,999 | 4,196,950 | 827.6% |
| $100,000 to $149,999 | 6,379,607 | 1,258.0% |
| $150,000 to $199,999 | 3,442,351 | 678.8% |
| $200,000+ | 5,397,310 | 1,064.3% |
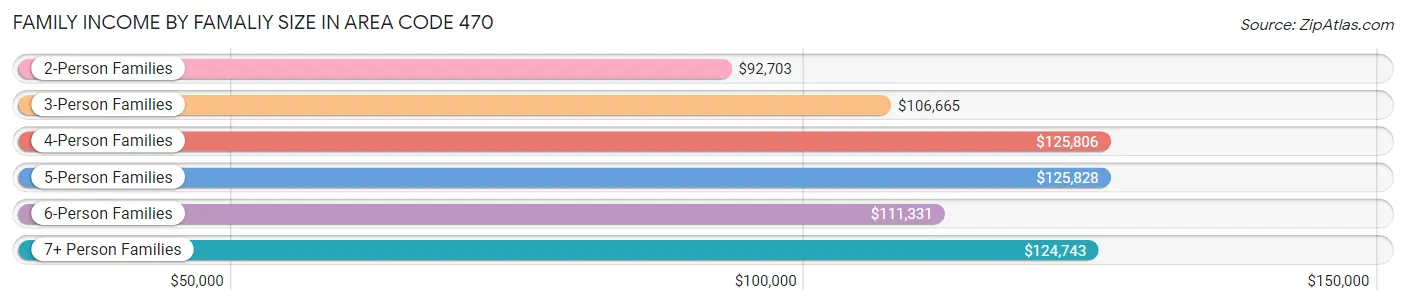
Family Income by Famaliy Size in Area Code 470
5-person families (45,473 | 9.0%) account for the highest median family income in Area Code 470 with $125,828 per family, while 2-person families (213,882 | 42.2%) have the highest median income of $46,352 per family member.
| Income Bracket | # Families | Median Income |
| 2-Person Families | 213,882 (42.2%) | $92,703 |
| 3-Person Families | 117,368 (23.1%) | $106,665 |
| 4-Person Families | 105,225 (20.7%) | $125,806 |
| 5-Person Families | 45,473 (9.0%) | $125,828 |
| 6-Person Families | 16,158 (3.2%) | $111,331 |
| 7+ Person Families | 9,017 (1.8%) | $124,743 |
| Total | 507,123 (100.0%) | $104,890 |
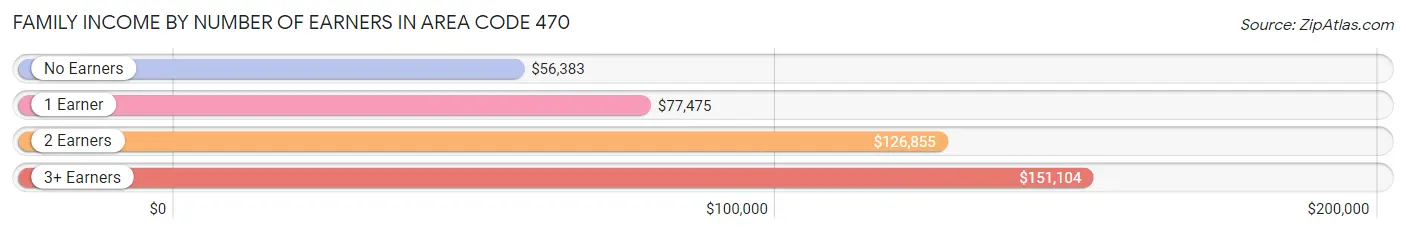
Family Income by Number of Earners in Area Code 470
The median family income in Area Code 470 is $104,890, with families comprising 3+ earners (64,961) having the highest median family income of $151,104, while families with no earners (57,180) have the lowest median family income of $56,383, accounting for 12.8% and 11.3% of families, respectively.
| Number of Earners | # Families | Median Income |
| No Earners | 57,180 (11.3%) | $56,383 |
| 1 Earner | 158,480 (31.2%) | $77,475 |
| 2 Earners | 226,502 (44.7%) | $126,855 |
| 3+ Earners | 64,961 (12.8%) | $151,104 |
| Total | 507,123 (100.0%) | $104,890 |
Household Income in Area Code 470
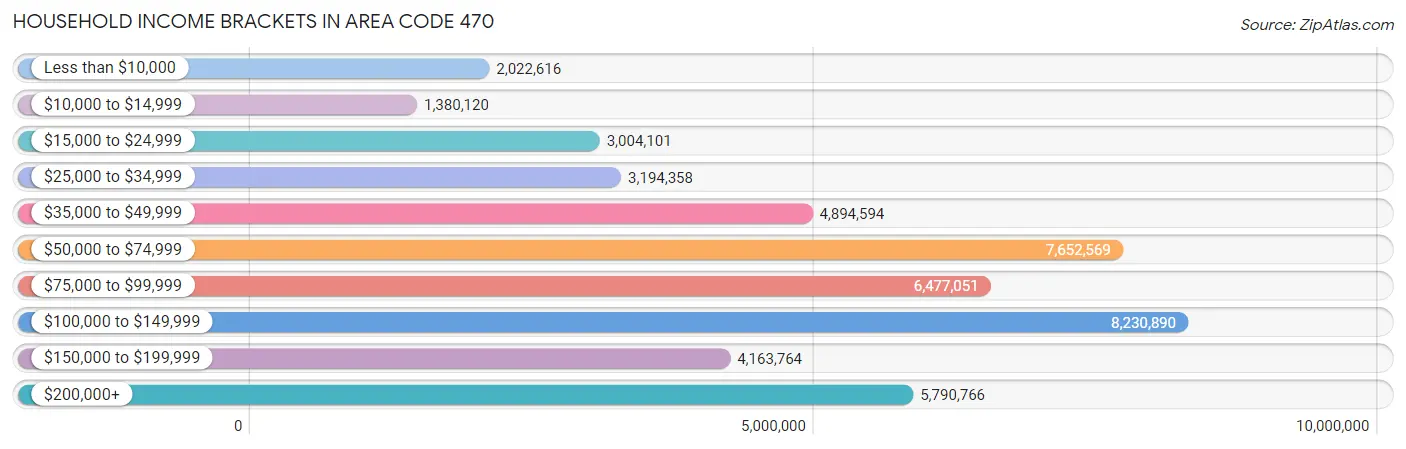
Household Income Brackets in Area Code 470
With 8,230,890 households falling in the category, the $100,000 to $149,999 income range is the most frequent in Area Code 470, accounting for 1,090.2% of all households. In contrast, only 1,380,120 households (182.8%) fall into the $10,000 to $14,999 income bracket, making it the least populous group.
| Income Bracket | # Households | % Households |
| Less than $10,000 | 2,022,616 | 267.9% |
| $10,000 to $14,999 | 1,380,120 | 182.8% |
| $15,000 to $24,999 | 3,004,101 | 397.9% |
| $25,000 to $34,999 | 3,194,358 | 423.1% |
| $35,000 to $49,999 | 4,894,594 | 648.3% |
| $50,000 to $74,999 | 7,652,569 | 1,013.6% |
| $75,000 to $99,999 | 6,477,051 | 857.9% |
| $100,000 to $149,999 | 8,230,890 | 1,090.2% |
| $150,000 to $199,999 | 4,163,764 | 551.5% |
| $200,000+ | 5,790,766 | 767.0% |
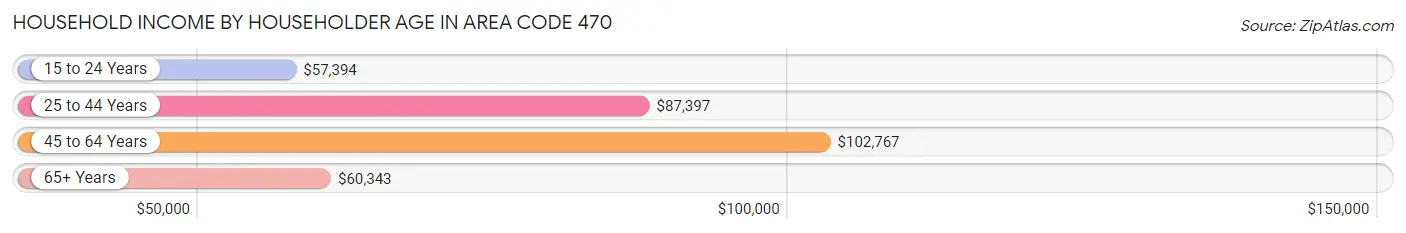
Household Income by Householder Age in Area Code 470
The median household income in Area Code 470 is $84,585, with the highest median household income of $102,767 found in the 45 to 64 years age bracket for the primary householder. A total of 295,207 households (39.1%) fall into this category. Meanwhile, the 15 to 24 years age bracket for the primary householder has the lowest median household income of $57,394, with 26,972 households (3.6%) in this group.
| Income Bracket | # Households | Median Income |
| 15 to 24 Years | 26,972 (3.6%) | $57,394 |
| 25 to 44 Years | 276,401 (36.6%) | $87,397 |
| 45 to 64 Years | 295,207 (39.1%) | $102,767 |
| 65+ Years | 156,409 (20.7%) | $60,343 |
| Total | 754,989 (100.0%) | $84,585 |
Poverty in Area Code 470
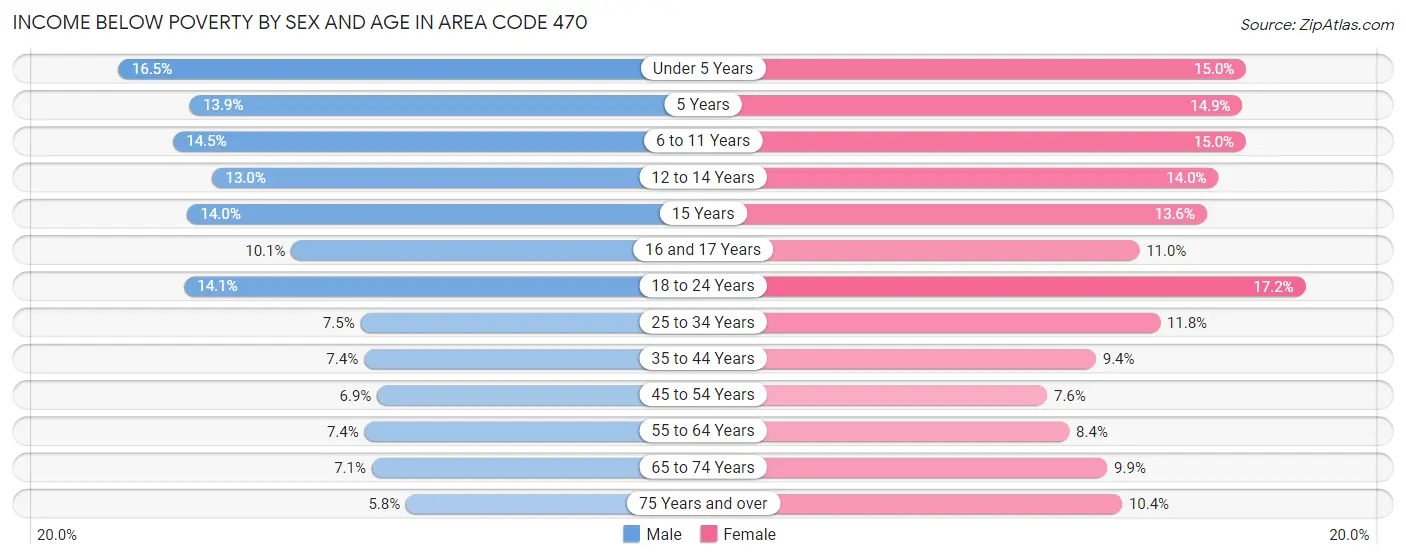
Income Below Poverty by Sex and Age in Area Code 470
With 9.5% poverty level for males and 11.3% for females among the residents of Area Code 470, under 5 year old males and 18 to 24 year old females are the most vulnerable to poverty, with 10,169 males (16.5%) and 15,532 females (17.2%) in their respective age groups living below the poverty level.
| Age Bracket | Male | Female |
| Under 5 Years | 10,169 (16.5%) | 9,022 (15.0%) |
| 5 Years | 1,740 (13.9%) | 1,799 (14.9%) |
| 6 to 11 Years | 11,774 (14.5%) | 12,002 (15.0%) |
| 12 to 14 Years | 5,709 (13.0%) | 5,828 (14.0%) |
| 15 Years | 2,224 (14.0%) | 2,166 (13.6%) |
| 16 and 17 Years | 3,004 (10.1%) | 3,205 (11.0%) |
| 18 to 24 Years | 12,690 (14.1%) | 15,532 (17.2%) |
| 25 to 34 Years | 10,511 (7.5%) | 17,077 (11.8%) |
| 35 to 44 Years | 10,278 (7.4%) | 13,661 (9.4%) |
| 45 to 54 Years | 9,790 (6.9%) | 10,990 (7.6%) |
| 55 to 64 Years | 8,635 (7.4%) | 10,409 (8.4%) |
| 65 to 74 Years | 5,279 (7.1%) | 8,630 (9.9%) |
| 75 Years and over | 2,338 (5.8%) | 6,133 (10.4%) |
| Total | 94,141 (9.5%) | 116,454 (11.3%) |
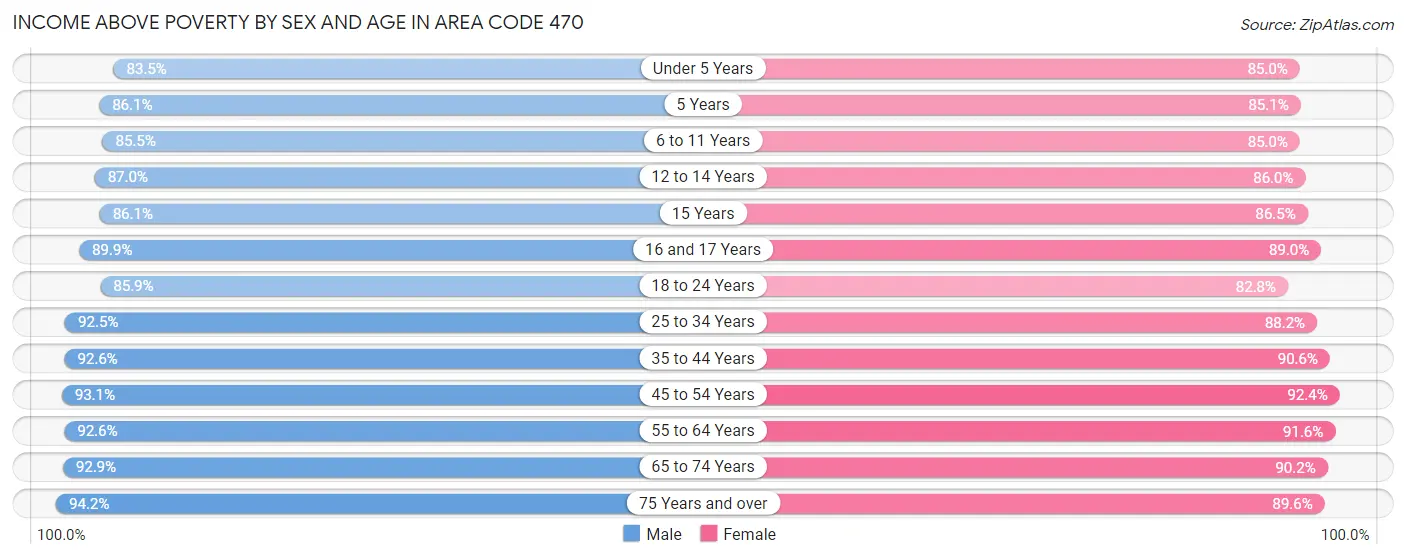
Income Above Poverty by Sex and Age in Area Code 470
According to the poverty statistics in Area Code 470, males aged 75 years and over and females aged 45 to 54 years are the age groups that are most secure financially, with 94.2% of males and 92.4% of females in these age groups living above the poverty line.
| Age Bracket | Male | Female |
| Under 5 Years | 51,446 (83.5%) | 51,087 (85.0%) |
| 5 Years | 10,816 (86.1%) | 10,299 (85.1%) |
| 6 to 11 Years | 69,551 (85.5%) | 68,025 (85.0%) |
| 12 to 14 Years | 38,141 (87.0%) | 35,847 (86.0%) |
| 15 Years | 13,723 (86.1%) | 13,823 (86.5%) |
| 16 and 17 Years | 26,725 (89.9%) | 25,835 (89.0%) |
| 18 to 24 Years | 77,472 (85.9%) | 74,692 (82.8%) |
| 25 to 34 Years | 129,086 (92.5%) | 127,524 (88.2%) |
| 35 to 44 Years | 128,617 (92.6%) | 131,267 (90.6%) |
| 45 to 54 Years | 131,818 (93.1%) | 133,178 (92.4%) |
| 55 to 64 Years | 108,431 (92.6%) | 112,881 (91.6%) |
| 65 to 74 Years | 69,017 (92.9%) | 78,959 (90.1%) |
| 75 Years and over | 37,693 (94.2%) | 52,860 (89.6%) |
| Total | 892,536 (90.5%) | 916,277 (88.7%) |
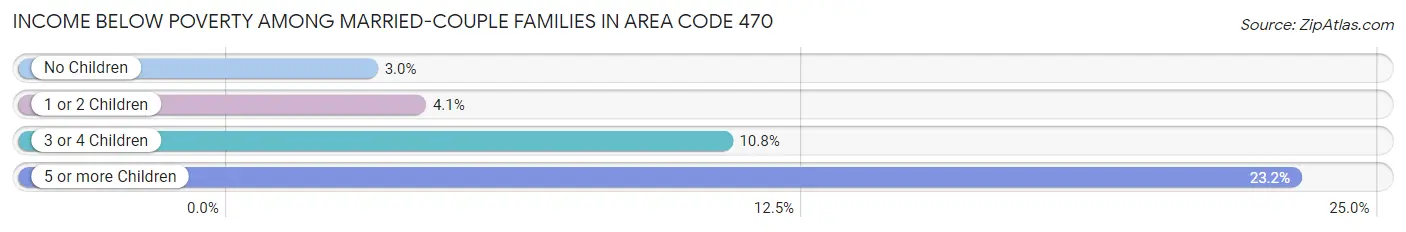
Income Below Poverty Among Married-Couple Families in Area Code 470
The poverty statistics for married-couple families in Area Code 470 show that 4.2% or 15,726 of the total 377,426 families live below the poverty line. Families with 5 or more children have the highest poverty rate of 23.2%, comprising of 447 families. On the other hand, families with no children have the lowest poverty rate of 3.0%, which includes 6,133 families.
| Children | Above Poverty | Below Poverty |
| No Children | 195,529 (97.0%) | 6,133 (3.0%) |
| 1 or 2 Children | 137,455 (95.9%) | 5,864 (4.1%) |
| 3 or 4 Children | 27,232 (89.2%) | 3,282 (10.8%) |
| 5 or more Children | 1,484 (76.8%) | 447 (23.2%) |
| Total | 361,700 (95.8%) | 15,726 (4.2%) |
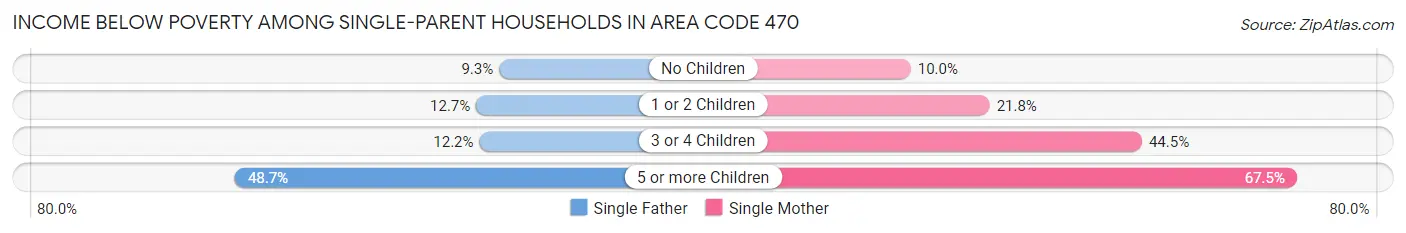
Income Below Poverty Among Single-Parent Households in Area Code 470
According to the poverty data in Area Code 470, 11.6% or 4,199 single-father households and 20.2% or 18,892 single-mother households are living below the poverty line. Among single-father households, those with 5 or more children have the highest poverty rate, with 216 households (48.6%) experiencing poverty. Likewise, among single-mother households, those with 5 or more children have the highest poverty rate, with 644 households (67.5%) falling below the poverty line.
| Children | Single Father | Single Mother |
| No Children | 1,516 (9.3%) | 3,436 (10.0%) |
| 1 or 2 Children | 2,117 (12.7%) | 10,564 (21.8%) |
| 3 or 4 Children | 350 (12.2%) | 4,248 (44.5%) |
| 5 or more Children | 216 (48.6%) | 644 (67.5%) |
| Total | 4,199 (11.6%) | 18,892 (20.2%) |
Income Below Poverty Among Married-Couple vs Single-Parent Households in Area Code 470
The poverty data for Area Code 470 shows that 15,726 of the married-couple family households (4.2%) and 23,091 of the single-parent households (17.8%) are living below the poverty level. Within the married-couple family households, those with 5 or more children have the highest poverty rate, with 447 households (23.2%) falling below the poverty line. Among the single-parent households, those with 5 or more children have the highest poverty rate, with 860 household (61.5%) living below poverty.
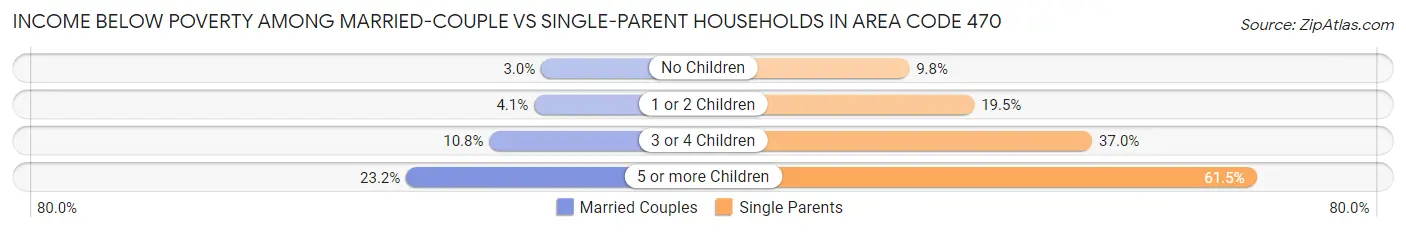
| Children | Married-Couple Families | Single-Parent Households |
| No Children | 6,133 (3.0%) | 4,952 (9.8%) |
| 1 or 2 Children | 5,864 (4.1%) | 12,681 (19.5%) |
| 3 or 4 Children | 3,282 (10.8%) | 4,598 (37.0%) |
| 5 or more Children | 447 (23.2%) | 860 (61.5%) |
| Total | 15,726 (4.2%) | 23,091 (17.8%) |
Race in Area Code 470
The most populous races in Area Code 470 are White / Caucasian (1,153,406 | 56.2%), Black / African American (467,323 | 22.8%), and Hispanic or Latino (300,109 | 14.6%).
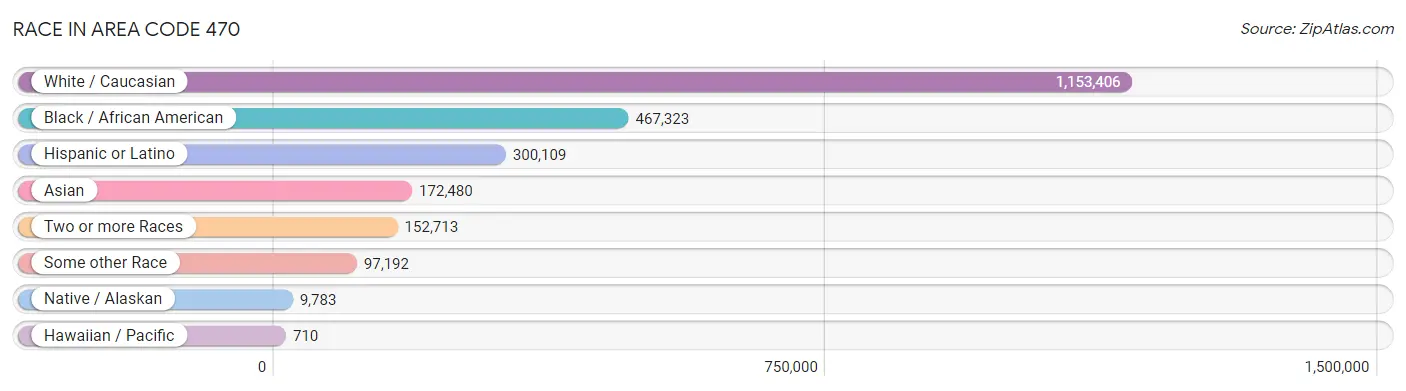
| Race | # Population | % Population |
| Asian | 172,480 | 8.4% |
| Black / African American | 467,323 | 22.8% |
| Hawaiian / Pacific | 710 | 0.0% |
| Hispanic or Latino | 300,109 | 14.6% |
| Native / Alaskan | 9,783 | 0.5% |
| White / Caucasian | 1,153,406 | 56.2% |
| Two or more Races | 152,713 | 7.4% |
| Some other Race | 97,192 | 4.7% |
| Total | 2,053,607 | 100.0% |
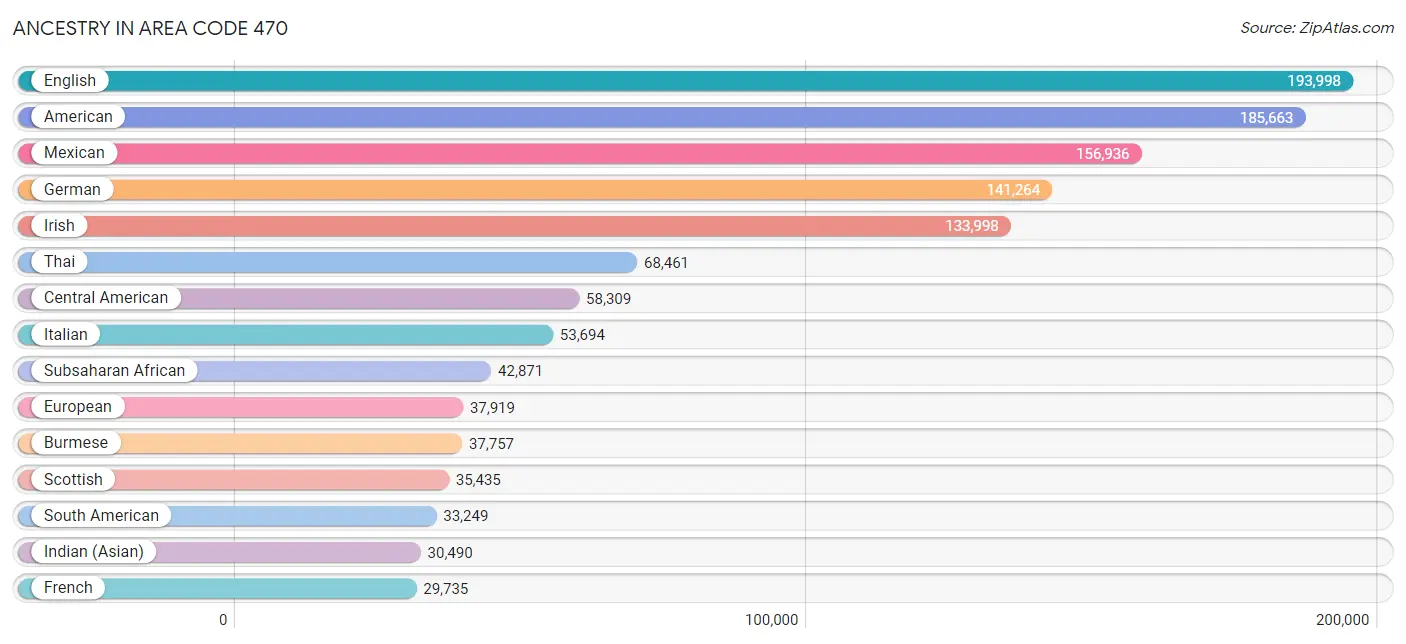
Ancestry in Area Code 470
The most populous ancestries reported in Area Code 470 are English (193,998 | 9.5%), American (185,663 | 9.0%), Mexican (156,936 | 7.6%), German (141,264 | 6.9%), and Irish (133,998 | 6.5%), together accounting for 39.5% of all Area Code 470 residents.
| Ancestry | # Population | % Population |
| Afghan | 151 | 0.0% |
| African | 16,684 | 0.8% |
| Alaska Native | 8 | 0.0% |
| Alaskan Athabascan | 13 | 0.0% |
| Albanian | 367 | 0.0% |
| Aleut | 29 | 0.0% |
| Alsatian | 9 | 0.0% |
| American | 185,663 | 9.0% |
| Apache | 249 | 0.0% |
| Arab | 10,547 | 0.5% |
| Argentinean | 1,374 | 0.1% |
| Armenian | 949 | 0.1% |
| Assyrian / Chaldean / Syriac | 88 | 0.0% |
| Australian | 480 | 0.0% |
| Austrian | 2,916 | 0.1% |
| Bahamian | 910 | 0.0% |
| Bangladeshi | 2,851 | 0.1% |
| Barbadian | 635 | 0.0% |
| Basque | 115 | 0.0% |
| Belgian | 1,005 | 0.1% |
| Belizean | 282 | 0.0% |
| Bermudan | 187 | 0.0% |
| Bhutanese | 6,564 | 0.3% |
| Blackfeet | 415 | 0.0% |
| Bolivian | 474 | 0.0% |
| Brazilian | 3,760 | 0.2% |
| British | 13,410 | 0.6% |
| British West Indian | 2,977 | 0.1% |
| Bulgarian | 561 | 0.0% |
| Burmese | 37,757 | 1.8% |
| Cajun | 785 | 0.0% |
| Cambodian | 71 | 0.0% |
| Canadian | 2,295 | 0.1% |
| Cape Verdean | 188 | 0.0% |
| Carpatho Rusyn | 17 | 0.0% |
| Celtic | 476 | 0.0% |
| Central American | 58,309 | 2.8% |
| Central American Indian | 3,414 | 0.2% |
| Cherokee | 5,920 | 0.3% |
| Chickasaw | 52 | 0.0% |
| Chilean | 825 | 0.0% |
| Chinese | 150 | 0.0% |
| Chippewa | 187 | 0.0% |
| Choctaw | 472 | 0.0% |
| Colombian | 13,618 | 0.7% |
| Costa Rican | 2,615 | 0.1% |
| Creek | 394 | 0.0% |
| Croatian | 1,129 | 0.1% |
| Crow | 34 | 0.0% |
| Cuban | 7,642 | 0.4% |
| Czech | 2,972 | 0.1% |
| Czechoslovakian | 414 | 0.0% |
| Danish | 4,047 | 0.2% |
| Delaware | 37 | 0.0% |
| Dominican | 8,697 | 0.4% |
| Dutch | 11,555 | 0.6% |
| Dutch West Indian | 102 | 0.0% |
| Eastern European | 6,264 | 0.3% |
| Ecuadorian | 2,311 | 0.1% |
| Egyptian | 1,310 | 0.1% |
| English | 193,998 | 9.5% |
| Estonian | 40 | 0.0% |
| Ethiopian | 4,334 | 0.2% |
| European | 37,919 | 1.8% |
| Filipino | 1,563 | 0.1% |
| Finnish | 1,351 | 0.1% |
| French | 29,735 | 1.5% |
| French American Indian | 51 | 0.0% |
| French Canadian | 5,442 | 0.3% |
| German | 141,264 | 6.9% |
| German Russian | 51 | 0.0% |
| Ghanaian | 2,921 | 0.1% |
| Greek | 5,853 | 0.3% |
| Guamanian / Chamorro | 228 | 0.0% |
| Guatemalan | 24,346 | 1.2% |
| Guyanese | 2,009 | 0.1% |
| Haitian | 8,628 | 0.4% |
| Honduran | 9,154 | 0.4% |
| Hungarian | 3,766 | 0.2% |
| Icelander | 276 | 0.0% |
| Indian (Asian) | 30,490 | 1.5% |
| Indonesian | 121 | 0.0% |
| Inupiat | 59 | 0.0% |
| Iranian | 3,511 | 0.2% |
| Iraqi | 1,077 | 0.1% |
| Irish | 133,998 | 6.5% |
| Iroquois | 233 | 0.0% |
| Israeli | 473 | 0.0% |
| Italian | 53,694 | 2.6% |
| Jamaican | 16,823 | 0.8% |
| Japanese | 1,520 | 0.1% |
| Jordanian | 241 | 0.0% |
| Kenyan | 778 | 0.0% |
| Korean | 10,431 | 0.5% |
| Laotian | 1,393 | 0.1% |
| Latvian | 697 | 0.0% |
| Lebanese | 2,809 | 0.1% |
| Liberian | 1,526 | 0.1% |
| Lithuanian | 2,066 | 0.1% |
| Lumbee | 105 | 0.0% |
| Luxembourger | 86 | 0.0% |
| Macedonian | 185 | 0.0% |
| Malaysian | 1,644 | 0.1% |
| Maltese | 152 | 0.0% |
| Menominee | 5 | 0.0% |
| Mexican | 156,936 | 7.6% |
| Mexican American Indian | 4,749 | 0.2% |
| Mongolian | 380 | 0.0% |
| Moroccan | 1,616 | 0.1% |
| Native Hawaiian | 1,197 | 0.1% |
| Navajo | 164 | 0.0% |
| New Zealander | 40 | 0.0% |
| Nicaraguan | 1,445 | 0.1% |
| Nigerian | 10,423 | 0.5% |
| Northern European | 2,562 | 0.1% |
| Norwegian | 9,699 | 0.5% |
| Okinawan | 26 | 0.0% |
| Osage | 34 | 0.0% |
| Paiute | 32 | 0.0% |
| Pakistani | 1,576 | 0.1% |
| Palestinian | 333 | 0.0% |
| Panamanian | 1,597 | 0.1% |
| Paraguayan | 252 | 0.0% |
| Pennsylvania German | 549 | 0.0% |
| Peruvian | 4,347 | 0.2% |
| Polish | 26,940 | 1.3% |
| Portuguese | 3,132 | 0.2% |
| Potawatomi | 31 | 0.0% |
| Pueblo | 30 | 0.0% |
| Puerto Rican | 23,070 | 1.1% |
| Puget Sound Salish | 78 | 0.0% |
| Romanian | 4,891 | 0.2% |
| Russian | 9,950 | 0.5% |
| Salvadoran | 19,139 | 0.9% |
| Samoan | 189 | 0.0% |
| Scandinavian | 2,884 | 0.1% |
| Scotch-Irish | 22,759 | 1.1% |
| Scottish | 35,435 | 1.7% |
| Seminole | 234 | 0.0% |
| Senegalese | 103 | 0.0% |
| Serbian | 469 | 0.0% |
| Sierra Leonean | 89 | 0.0% |
| Sioux | 194 | 0.0% |
| Slavic | 509 | 0.0% |
| Slovak | 1,331 | 0.1% |
| Slovene | 254 | 0.0% |
| Somali | 840 | 0.0% |
| South African | 1,337 | 0.1% |
| South American | 33,249 | 1.6% |
| South American Indian | 683 | 0.0% |
| Soviet Union | 178 | 0.0% |
| Spaniard | 2,928 | 0.1% |
| Spanish | 1,582 | 0.1% |
| Spanish American | 70 | 0.0% |
| Sri Lankan | 18,209 | 0.9% |
| Subsaharan African | 42,871 | 2.1% |
| Swedish | 10,089 | 0.5% |
| Swiss | 2,456 | 0.1% |
| Syrian | 717 | 0.0% |
| Thai | 68,461 | 3.3% |
| Tlingit-Haida | 8 | 0.0% |
| Tohono O'Odham | 35 | 0.0% |
| Tongan | 51 | 0.0% |
| Trinidadian and Tobagonian | 1,514 | 0.1% |
| Turkish | 1,525 | 0.1% |
| U.S. Virgin Islander | 463 | 0.0% |
| Ugandan | 233 | 0.0% |
| Ukrainian | 4,325 | 0.2% |
| Uruguayan | 1,163 | 0.1% |
| Ute | 7 | 0.0% |
| Venezuelan | 8,802 | 0.4% |
| Vietnamese | 3,697 | 0.2% |
| Welsh | 9,615 | 0.5% |
| West Indian | 3,629 | 0.2% |
| Yaqui | 36 | 0.0% |
| Yugoslavian | 3,198 | 0.2% |
| Zimbabwean | 122 | 0.0% | View All 177 Rows |
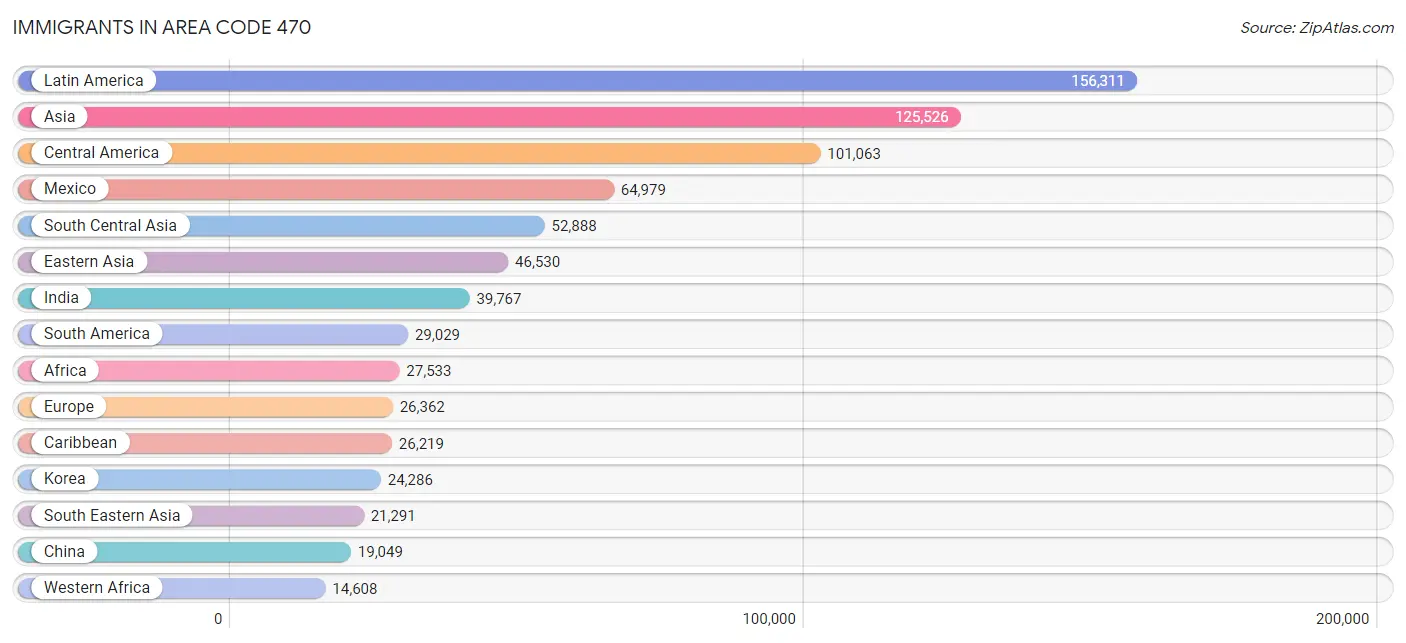
Immigrants in Area Code 470
The most numerous immigrant groups reported in Area Code 470 came from Latin America (156,311 | 7.6%), Asia (125,526 | 6.1%), Central America (101,063 | 4.9%), Mexico (64,979 | 3.2%), and South Central Asia (52,888 | 2.6%), together accounting for 24.4% of all Area Code 470 residents.
| Immigration Origin | # Population | % Population |
| Afghanistan | 473 | 0.0% |
| Africa | 27,533 | 1.3% |
| Albania | 29 | 0.0% |
| Argentina | 805 | 0.0% |
| Armenia | 135 | 0.0% |
| Asia | 125,526 | 6.1% |
| Australia | 484 | 0.0% |
| Austria | 237 | 0.0% |
| Azores | 16 | 0.0% |
| Bahamas | 418 | 0.0% |
| Bangladesh | 3,653 | 0.2% |
| Barbados | 288 | 0.0% |
| Belarus | 334 | 0.0% |
| Belgium | 390 | 0.0% |
| Belize | 171 | 0.0% |
| Bolivia | 365 | 0.0% |
| Bosnia and Herzegovina | 1,575 | 0.1% |
| Brazil | 3,801 | 0.2% |
| Bulgaria | 359 | 0.0% |
| Cabo Verde | 17 | 0.0% |
| Cambodia | 637 | 0.0% |
| Cameroon | 1,287 | 0.1% |
| Canada | 4,672 | 0.2% |
| Caribbean | 26,219 | 1.3% |
| Central America | 101,063 | 4.9% |
| Chile | 701 | 0.0% |
| China | 19,049 | 0.9% |
| Colombia | 8,900 | 0.4% |
| Congo | 540 | 0.0% |
| Costa Rica | 1,380 | 0.1% |
| Croatia | 219 | 0.0% |
| Cuba | 2,743 | 0.1% |
| Czechoslovakia | 316 | 0.0% |
| Denmark | 291 | 0.0% |
| Dominica | 784 | 0.0% |
| Dominican Republic | 3,789 | 0.2% |
| Eastern Africa | 5,965 | 0.3% |
| Eastern Asia | 46,530 | 2.3% |
| Eastern Europe | 12,167 | 0.6% |
| Ecuador | 1,335 | 0.1% |
| Egypt | 914 | 0.0% |
| El Salvador | 11,700 | 0.6% |
| England | 2,179 | 0.1% |
| Eritrea | 472 | 0.0% |
| Ethiopia | 2,732 | 0.1% |
| Europe | 26,362 | 1.3% |
| Fiji | 12 | 0.0% |
| France | 1,015 | 0.1% |
| Germany | 3,463 | 0.2% |
| Ghana | 4,070 | 0.2% |
| Greece | 541 | 0.0% |
| Grenada | 121 | 0.0% |
| Guatemala | 14,093 | 0.7% |
| Guyana | 2,116 | 0.1% |
| Haiti | 3,897 | 0.2% |
| Honduras | 6,855 | 0.3% |
| Hong Kong | 1,196 | 0.1% |
| Hungary | 183 | 0.0% |
| India | 39,767 | 1.9% |
| Indonesia | 901 | 0.0% |
| Iran | 2,290 | 0.1% |
| Iraq | 1,090 | 0.1% |
| Ireland | 266 | 0.0% |
| Israel | 552 | 0.0% |
| Italy | 723 | 0.0% |
| Jamaica | 10,349 | 0.5% |
| Japan | 3,180 | 0.2% |
| Jordan | 265 | 0.0% |
| Kazakhstan | 243 | 0.0% |
| Kenya | 1,464 | 0.1% |
| Korea | 24,286 | 1.2% |
| Kuwait | 193 | 0.0% |
| Laos | 1,492 | 0.1% |
| Latin America | 156,311 | 7.6% |
| Latvia | 237 | 0.0% |
| Lebanon | 584 | 0.0% |
| Liberia | 1,161 | 0.1% |
| Lithuania | 66 | 0.0% |
| Malaysia | 1,116 | 0.1% |
| Mexico | 64,979 | 3.2% |
| Micronesia | 2 | 0.0% |
| Middle Africa | 2,606 | 0.1% |
| Moldova | 446 | 0.0% |
| Morocco | 752 | 0.0% |
| Nepal | 587 | 0.0% |
| Netherlands | 512 | 0.0% |
| Nicaragua | 818 | 0.0% |
| Nigeria | 7,121 | 0.4% |
| North Macedonia | 16 | 0.0% |
| Northern Africa | 2,032 | 0.1% |
| Northern Europe | 5,962 | 0.3% |
| Norway | 151 | 0.0% |
| Oceania | 644 | 0.0% |
| Pakistan | 4,772 | 0.2% |
| Panama | 868 | 0.0% |
| Peru | 2,901 | 0.1% |
| Philippines | 4,083 | 0.2% |
| Poland | 1,375 | 0.1% |
| Portugal | 351 | 0.0% |
| Romania | 2,890 | 0.1% |
| Russia | 1,543 | 0.1% |
| Saudi Arabia | 272 | 0.0% |
| Scotland | 193 | 0.0% |
| Senegal | 161 | 0.0% |
| Serbia | 117 | 0.0% |
| Sierra Leone | 207 | 0.0% |
| Singapore | 139 | 0.0% |
| Somalia | 55 | 0.0% |
| South Africa | 1,810 | 0.1% |
| South America | 29,029 | 1.4% |
| South Central Asia | 52,888 | 2.6% |
| South Eastern Asia | 21,291 | 1.0% |
| Southern Europe | 2,366 | 0.1% |
| Spain | 735 | 0.0% |
| Sri Lanka | 704 | 0.0% |
| St. Vincent and the Grenadines | 205 | 0.0% |
| Sudan | 46 | 0.0% |
| Sweden | 118 | 0.0% |
| Switzerland | 102 | 0.0% |
| Syria | 426 | 0.0% |
| Taiwan | 2,038 | 0.1% |
| Thailand | 1,094 | 0.1% |
| Trinidad and Tobago | 1,703 | 0.1% |
| Turkey | 805 | 0.0% |
| Uganda | 397 | 0.0% |
| Ukraine | 1,488 | 0.1% |
| Uruguay | 807 | 0.0% |
| Uzbekistan | 201 | 0.0% |
| Venezuela | 7,117 | 0.4% |
| Vietnam | 11,686 | 0.6% |
| West Indies | 143 | 0.0% |
| Western Africa | 14,608 | 0.7% |
| Western Asia | 4,773 | 0.2% |
| Western Europe | 5,734 | 0.3% |
| Zaire | 650 | 0.0% |
| Zimbabwe | 131 | 0.0% | View All 136 Rows |
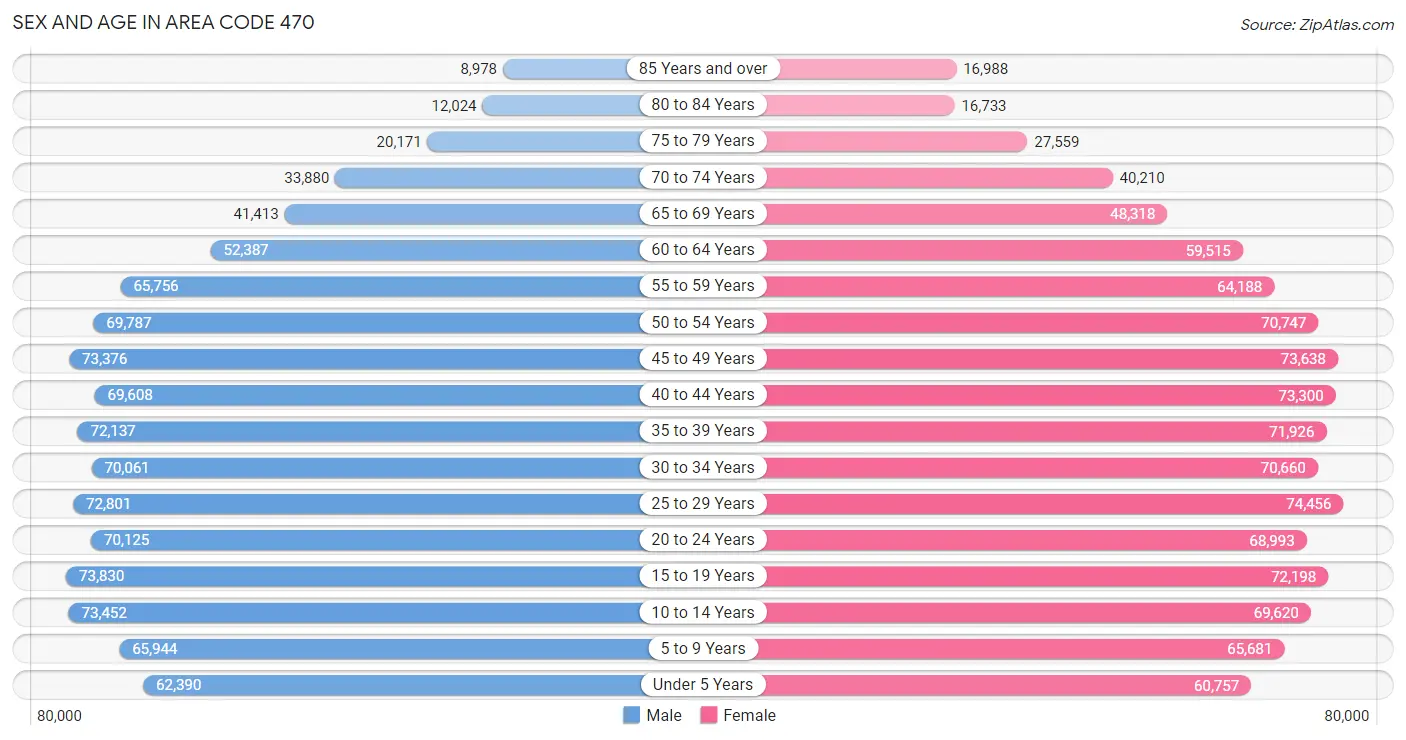
Sex and Age in Area Code 470
Sex and Age in Area Code 470
The most populous age groups in Area Code 470 are 15 to 19 Years (73,830 | 7.3%) for men and 25 to 29 Years (74,456 | 7.1%) for women.
| Age Bracket | Male | Female |
| Under 5 Years | 62,390 (6.2%) | 60,757 (5.8%) |
| 5 to 9 Years | 65,944 (6.5%) | 65,681 (6.3%) |
| 10 to 14 Years | 73,452 (7.3%) | 69,620 (6.7%) |
| 15 to 19 Years | 73,830 (7.3%) | 72,198 (6.9%) |
| 20 to 24 Years | 70,125 (7.0%) | 68,993 (6.6%) |
| 25 to 29 Years | 72,801 (7.2%) | 74,456 (7.1%) |
| 30 to 34 Years | 70,061 (7.0%) | 70,660 (6.8%) |
| 35 to 39 Years | 72,137 (7.2%) | 71,926 (6.9%) |
| 40 to 44 Years | 69,608 (6.9%) | 73,300 (7.0%) |
| 45 to 49 Years | 73,376 (7.3%) | 73,638 (7.0%) |
| 50 to 54 Years | 69,787 (6.9%) | 70,747 (6.8%) |
| 55 to 59 Years | 65,756 (6.5%) | 64,188 (6.1%) |
| 60 to 64 Years | 52,387 (5.2%) | 59,515 (5.7%) |
| 65 to 69 Years | 41,413 (4.1%) | 48,318 (4.6%) |
| 70 to 74 Years | 33,880 (3.4%) | 40,210 (3.8%) |
| 75 to 79 Years | 20,171 (2.0%) | 27,559 (2.6%) |
| 80 to 84 Years | 12,024 (1.2%) | 16,733 (1.6%) |
| 85 Years and over | 8,978 (0.9%) | 16,988 (1.6%) |
| Total | 1,008,120 (100.0%) | 1,045,487 (100.0%) |
Families and Households in Area Code 470
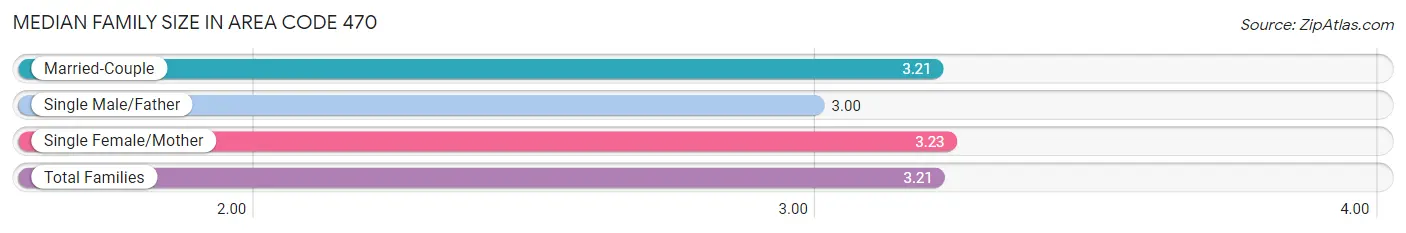
Median Family Size in Area Code 470
The median family size in Area Code 470 is 3.21 persons per family, with single female/mother families (93,445 | 18.4%) accounting for the largest median family size of 3.23213 persons per family. On the other hand, single male/father families (36,252 | 7.1%) represent the smallest median family size with 3.00 persons per family.
| Family Type | # Families | Family Size |
| Married-Couple | 377,426 (74.4%) | 3.21 |
| Single Male/Father | 36,252 (7.1%) | 3.00 |
| Single Female/Mother | 93,445 (18.4%) | 3.23 |
| Total Families | 507,123 (100.0%) | 3.21 |
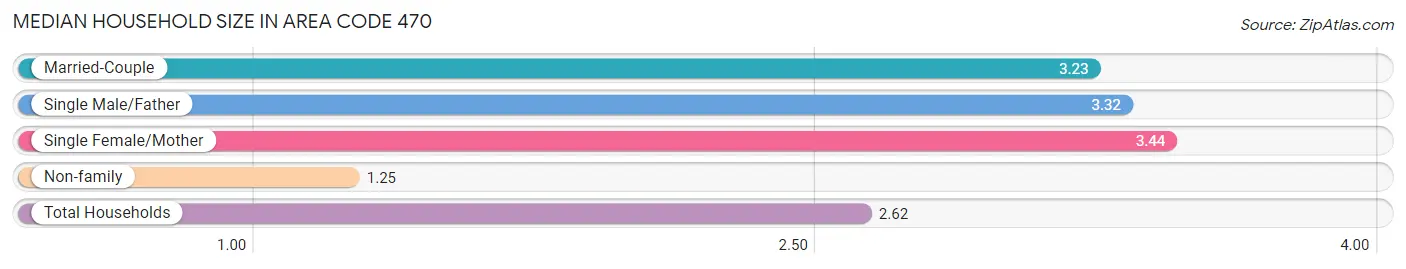
Median Household Size in Area Code 470
The median household size in Area Code 470 is 2.62 persons per household, with single female/mother households (93,445 | 12.4%) accounting for the largest median household size of 3.43885 persons per household. non-family households (247,866 | 32.8%) represent the smallest median household size with 1.25 persons per household.
| Household Type | # Households | Household Size |
| Married-Couple | 377,426 (50.0%) | 3.23 |
| Single Male/Father | 36,252 (4.8%) | 3.32 |
| Single Female/Mother | 93,445 (12.4%) | 3.44 |
| Non-family | 247,866 (32.8%) | 1.25 |
| Total Households | 754,989 (100.0%) | 2.62 |
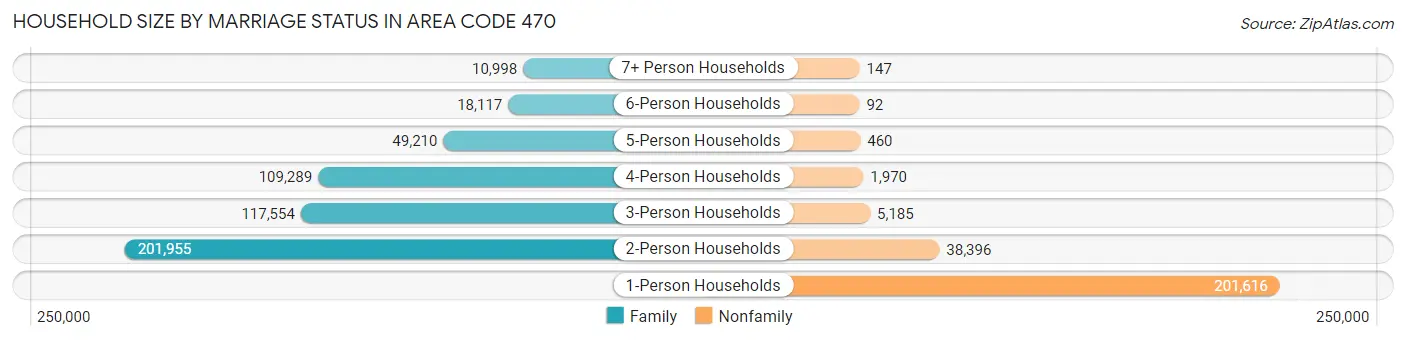
Household Size by Marriage Status in Area Code 470
Out of a total of 754,989 households in Area Code 470, 507,123 (67.2%) are family households, while 247,866 (32.8%) are nonfamily households. The most numerous type of family households are 2-person households, comprising 201,955, and the most common type of nonfamily households are 1-person households, comprising 201,616.
| Household Size | Family Households | Nonfamily Households |
| 1-Person Households | - | 201,616 (26.7%) |
| 2-Person Households | 201,955 (26.8%) | 38,396 (5.1%) |
| 3-Person Households | 117,554 (15.6%) | 5,185 (0.7%) |
| 4-Person Households | 109,289 (14.5%) | 1,970 (0.3%) |
| 5-Person Households | 49,210 (6.5%) | 460 (0.1%) |
| 6-Person Households | 18,117 (2.4%) | 92 (0.0%) |
| 7+ Person Households | 10,998 (1.5%) | 147 (0.0%) |
| Total | 507,123 (67.2%) | 247,866 (32.8%) |
Female Fertility in Area Code 470
Fertility by Age in Area Code 470
Average fertility rate in Area Code 470 is 44.9 births per 1,000 women. Women in the age bracket of 20 to 34 years have the highest fertility rate with 81.3 births per 1,000 women. Women in the age bracket of 20 to 34 years acount for 68.4% of all women with births.
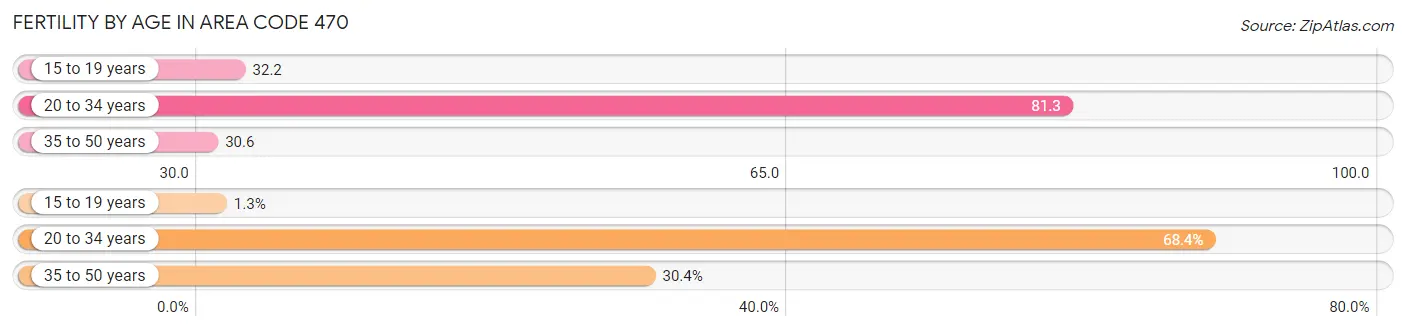
| Age Bracket | Women with Births | Births / 1,000 Women |
| 15 to 19 years | 290 (1.3%) | 32.2 |
| 20 to 34 years | 15,525 (68.4%) | 81.3 |
| 35 to 50 years | 6,897 (30.4%) | 30.6 |
| Total | 22,712 (100.0%) | 44.9 |
Fertility by Age by Marriage Status in Area Code 470
69.1% of women with births (22,712) in Area Code 470 are married. The highest percentage of unmarried women with births falls into 15 to 19 years age bracket with 92.4% of them unmarried at the time of birth, while the lowest percentage of unmarried women with births belong to 35 to 50 years age bracket with 31.8% of them unmarried.
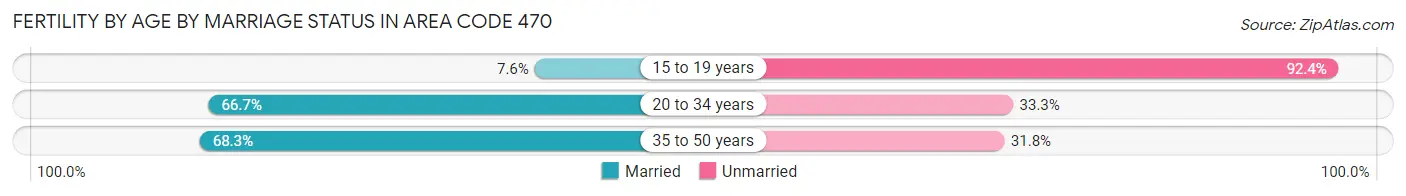
| Age Bracket | Married | Unmarried |
| 15 to 19 years | 22 (7.6%) | 268 (92.4%) |
| 20 to 34 years | 10,351 (66.7%) | 5,174 (33.3%) |
| 35 to 50 years | 4,707 (68.2%) | 2,190 (31.8%) |
| Total | 15,685 (69.1%) | 7,027 (30.9%) |
Fertility by Education in Area Code 470
Average fertility rate in Area Code 470 is 44.9 births per 1,000 women. Women with the education attainment of graduate degree have the highest fertility rate of 73.4 births per 1,000 women, while women with the education attainment of less than high school have the lowest fertility at 38.9 births per 1,000 women. Women with the education attainment of bachelor's degree represent 26.9% of all women with births.
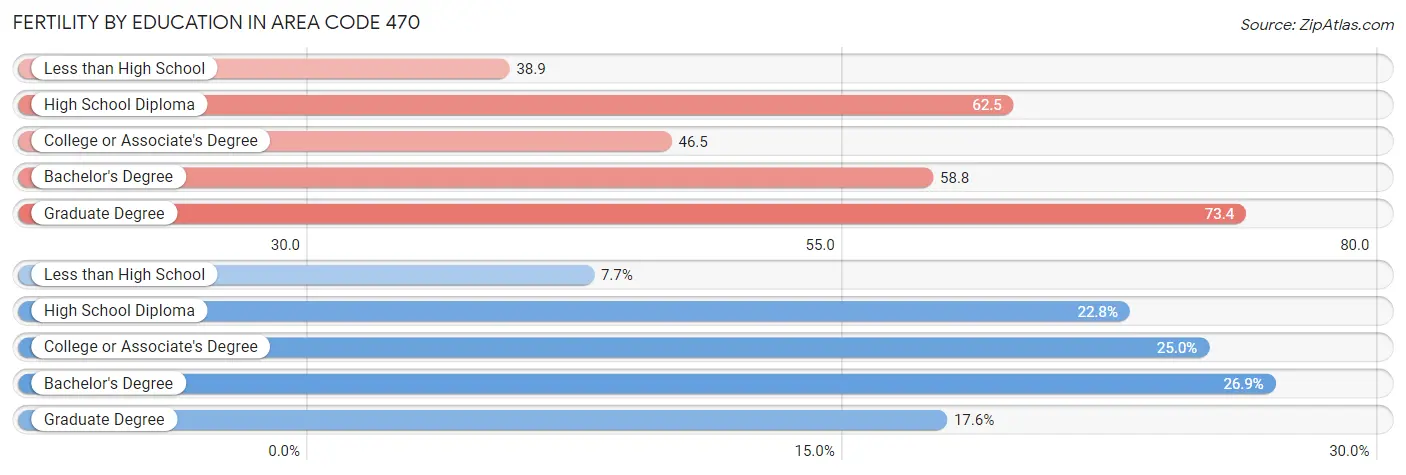
| Educational Attainment | Women with Births | Births / 1,000 Women |
| Less than High School | 1,754 (7.7%) | 38.9 |
| High School Diploma | 5,172 (22.8%) | 62.5 |
| College or Associate's Degree | 5,677 (25.0%) | 46.5 |
| Bachelor's Degree | 6,103 (26.9%) | 58.8 |
| Graduate Degree | 4,006 (17.6%) | 73.4 |
| Total | 22,712 (100.0%) | 44.9 |
Fertility by Education by Marriage Status in Area Code 470
30.9% of women with births in Area Code 470 are unmarried. Women with the educational attainment of graduate degree are most likely to be married with 78.9% of them married at childbirth, while women with the educational attainment of less than high school are least likely to be married with 70.9% of them unmarried at childbirth.
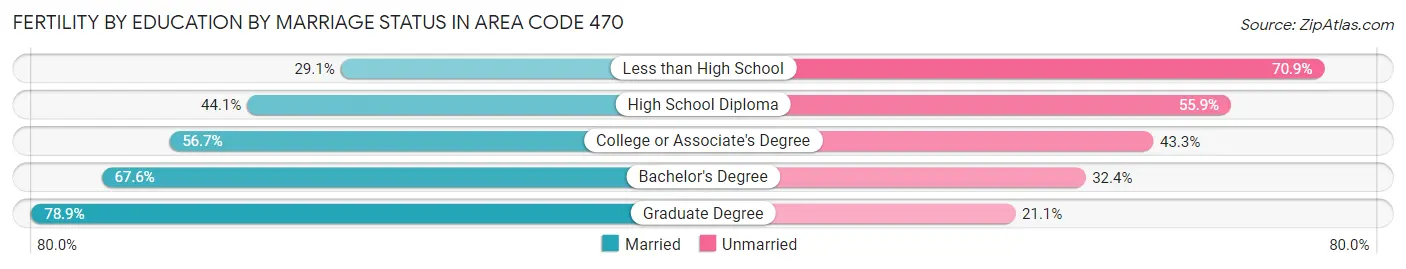
| Educational Attainment | Married | Unmarried |
| Less than High School | 510 (29.1%) | 1,244 (70.9%) |
| High School Diploma | 2,282 (44.1%) | 2,890 (55.9%) |
| College or Associate's Degree | 3,218 (56.7%) | 2,459 (43.3%) |
| Bachelor's Degree | 4,126 (67.6%) | 1,977 (32.4%) |
| Graduate Degree | 3,161 (78.9%) | 845 (21.1%) |
| Total | 15,685 (69.1%) | 7,027 (30.9%) |
Employment Characteristics in Area Code 470
Employment by Class of Employer in Area Code 470
Among the 1,020,434 employed individuals in Area Code 470, private company employees (733,328 | 71.9%), local government employees (64,988 | 6.4%), and not-for-profit organizations (62,214 | 6.1%) make up the most common classes of employment.
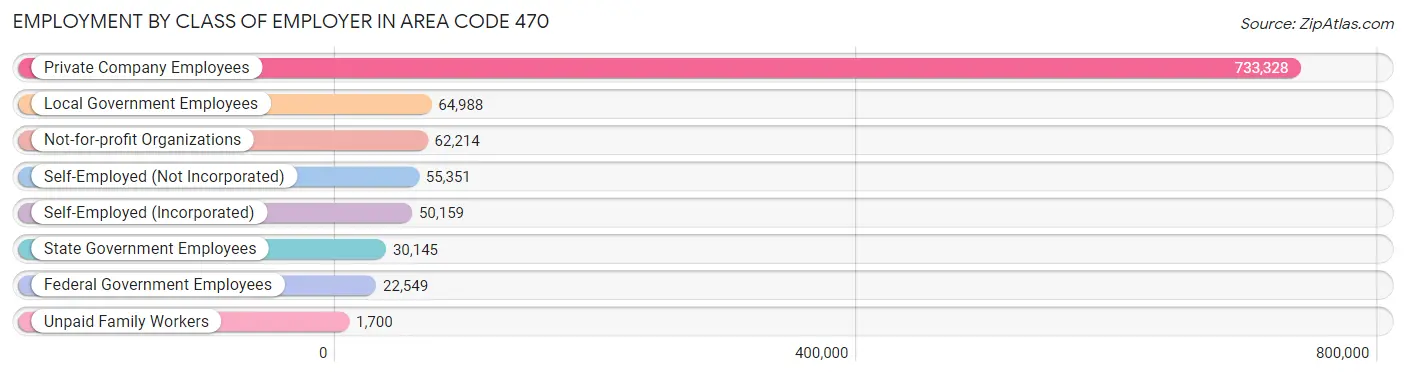
| Employer Class | # Employees | % Employees |
| Private Company Employees | 733,328 | 71.9% |
| Self-Employed (Incorporated) | 50,159 | 4.9% |
| Self-Employed (Not Incorporated) | 55,351 | 5.4% |
| Not-for-profit Organizations | 62,214 | 6.1% |
| Local Government Employees | 64,988 | 6.4% |
| State Government Employees | 30,145 | 2.9% |
| Federal Government Employees | 22,549 | 2.2% |
| Unpaid Family Workers | 1,700 | 0.2% |
| Total | 1,020,434 | 100.0% |
Employment Status by Age in Area Code 470
According to the labor force statistics for Area Code 470, out of the total population over 16 years of age (1,623,789), 65.7% or 1,066,829 individuals are in the labor force, with 4.2% or 44,914 of them unemployed. The age group with the highest labor force participation rate is 25 to 29 years, with 84.4% or 124,300 individuals in the labor force. Within the labor force, the 16 to 19 years age range has the highest percentage of unemployed individuals, with 695.7% or 295,172 of them being unemployed.
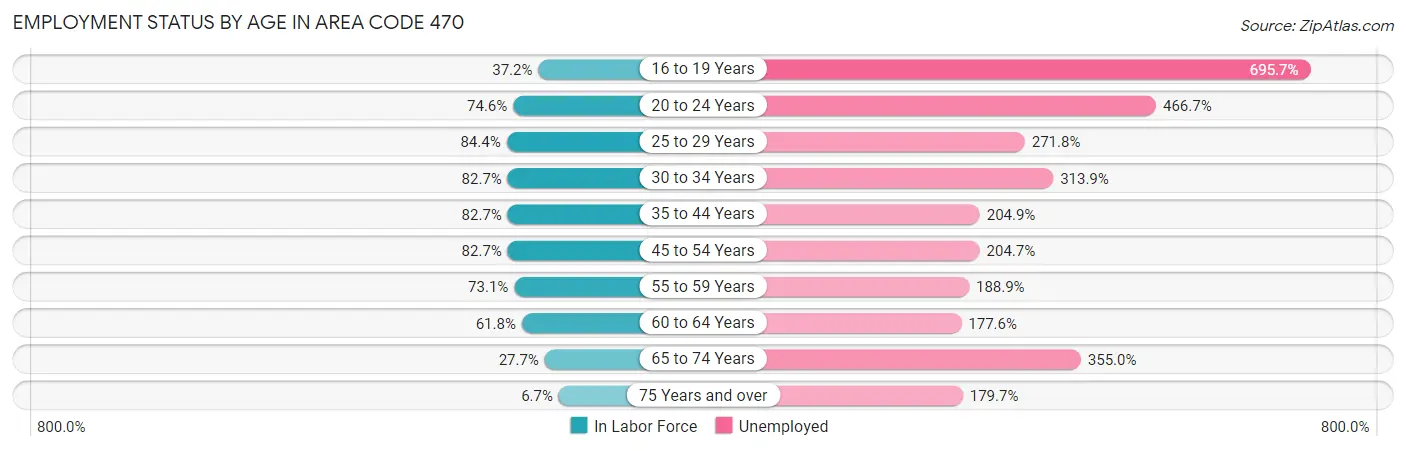
| Age Bracket | In Labor Force | Unemployed |
| 16 to 19 Years | 42,430 (37.2%) | 295,172 (695.7%) |
| 20 to 24 Years | 103,737 (74.6%) | 484,155 (466.7%) |
| 25 to 29 Years | 124,306 (84.4%) | 337,847 (271.8%) |
| 30 to 34 Years | 116,424 (82.7%) | 365,436 (313.9%) |
| 35 to 44 Years | 237,381 (82.7%) | 486,396 (204.9%) |
| 45 to 54 Years | 237,760 (82.7%) | 486,721 (204.7%) |
| 55 to 59 Years | 94,926 (73.1%) | 179,311 (188.9%) |
| 60 to 64 Years | 69,179 (61.8%) | 122,860 (177.6%) |
| 65 to 74 Years | 45,344 (27.7%) | 160,978 (355.0%) |
| 75 Years and over | 6,906 (6.7%) | 12,408 (179.7%) |
| Total | 1,066,751 (65.7%) | 44,876 (4.2%) |
Employment Status by Educational Attainment in Area Code 470
According to labor force statistics for Area Code 470, 79.5% of individuals (877,621) out of the total population between 25 and 64 years of age (1,104,343) are in the labor force, with 214.8% or 1,885,130 of them being unemployed. The group with the highest labor force participation rate are those with the educational attainment of bachelor's degree or higher, with 87.0% or 420,750 individuals in the labor force. Within the labor force, individuals with less than high school education have the highest percentage of unemployment, with 404.2% or 275,454 of them being unemployed.
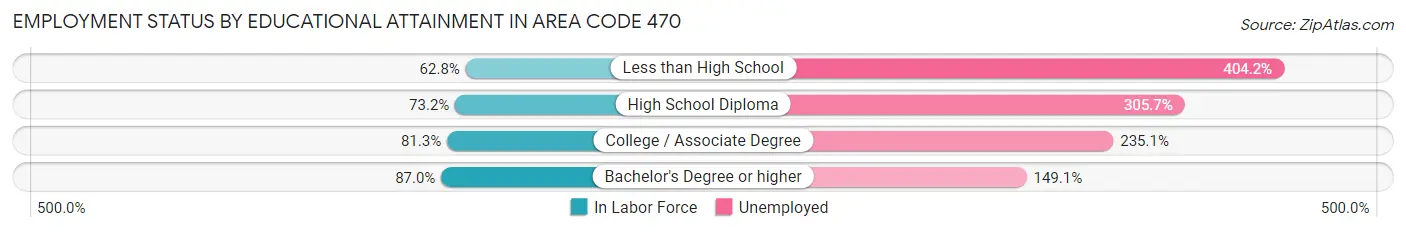
| Educational Attainment | In Labor Force | Unemployed |
| Less than High School | 68,147 (62.8%) | 438,694 (404.2%) |
| High School Diploma | 170,566 (73.2%) | 712,639 (305.7%) |
| College / Associate Degree | 226,804 (81.3%) | 656,096 (235.1%) |
| Bachelor's Degree or higher | 420,727 (87.0%) | 721,079 (149.1%) |
| Total | 877,650 (79.5%) | 2,372,129 (214.8%) |
Employment Occupations by Sex in Area Code 470
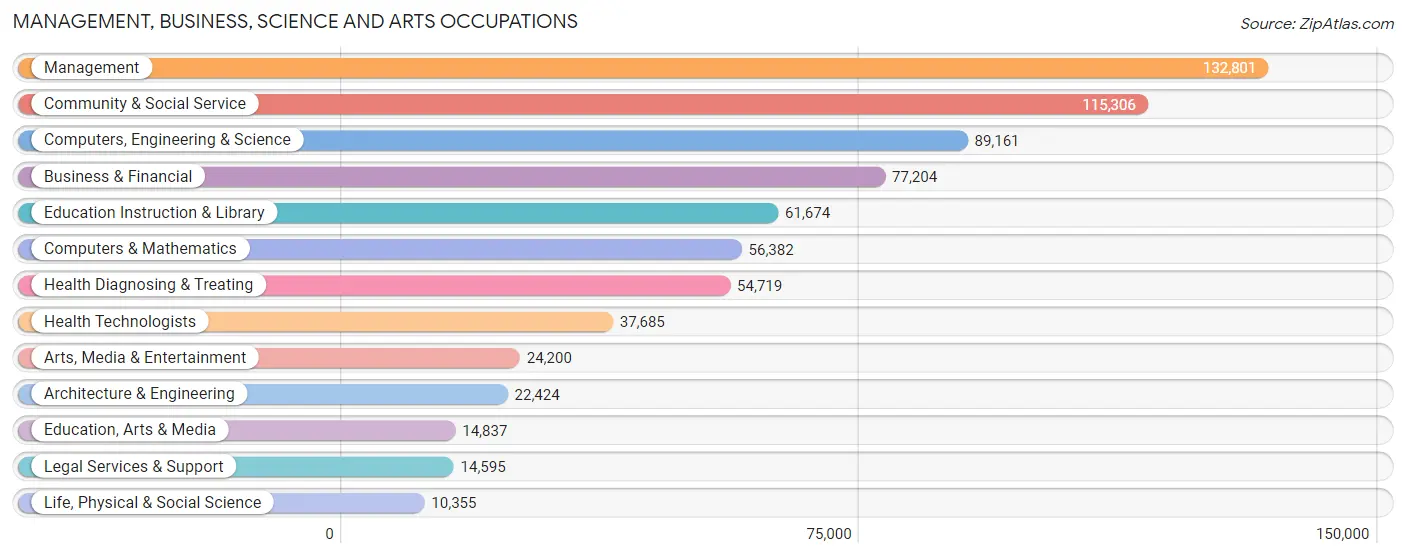
Management, Business, Science and Arts Occupations
The most common Management, Business, Science and Arts occupations in Area Code 470 are Management (132,801 | 12.7%), Community & Social Service (115,306 | 11.1%), Computers, Engineering & Science (89,161 | 8.6%), Business & Financial (77,204 | 7.4%), and Education Instruction & Library (61,674 | 5.9%).
Management, Business, Science and Arts Occupations by Sex
Within the Management, Business, Science and Arts occupations in Area Code 470, the most male-oriented occupations are Architecture & Engineering (81.5%), Computers & Mathematics (71.3%), and Computers, Engineering & Science (71.2%), while the most female-oriented occupations are Health Diagnosing & Treating (75.7%), Education Instruction & Library (75.6%), and Health Technologists (75.2%).
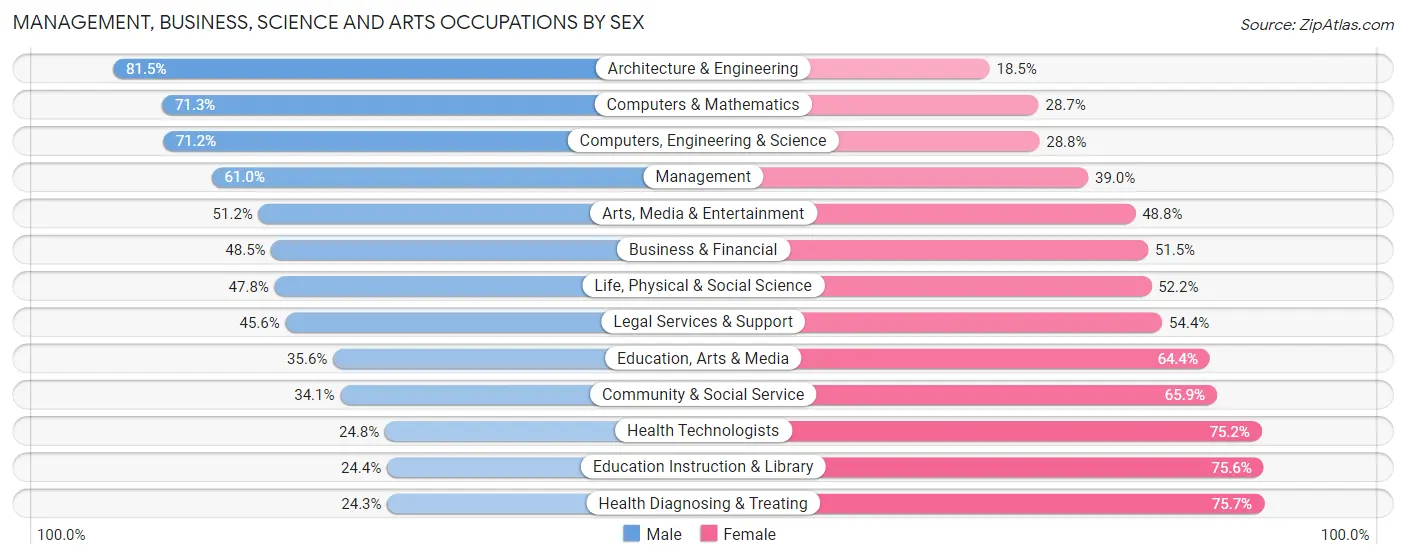
| Occupation | Male | Female |
| Management | 81,021 (61.0%) | 51,780 (39.0%) |
| Business & Financial | 37,459 (48.5%) | 39,745 (51.5%) |
| Computers, Engineering & Science | 63,461 (71.2%) | 25,700 (28.8%) |
| Computers & Mathematics | 40,223 (71.3%) | 16,159 (28.7%) |
| Architecture & Engineering | 18,284 (81.5%) | 4,140 (18.5%) |
| Life, Physical & Social Science | 4,954 (47.8%) | 5,401 (52.2%) |
| Community & Social Service | 39,363 (34.1%) | 75,943 (65.9%) |
| Education, Arts & Media | 5,286 (35.6%) | 9,551 (64.4%) |
| Legal Services & Support | 6,649 (45.6%) | 7,946 (54.4%) |
| Education Instruction & Library | 15,044 (24.4%) | 46,630 (75.6%) |
| Arts, Media & Entertainment | 12,384 (51.2%) | 11,816 (48.8%) |
| Health Diagnosing & Treating | 13,315 (24.3%) | 41,404 (75.7%) |
| Health Technologists | 9,346 (24.8%) | 28,339 (75.2%) |
| Total (Category) | 234,619 (50.0%) | 234,572 (50.0%) |
| Total (Overall) | 556,343 (53.3%) | 486,428 (46.7%) |
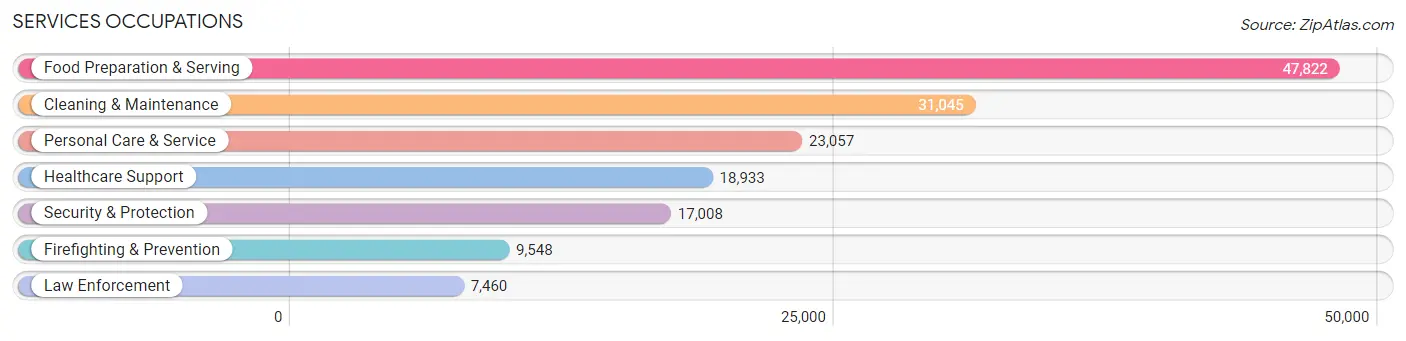
Services Occupations
The most common Services occupations in Area Code 470 are Food Preparation & Serving (47,822 | 4.6%), Cleaning & Maintenance (31,045 | 3.0%), Personal Care & Service (23,057 | 2.2%), Healthcare Support (18,933 | 1.8%), and Security & Protection (17,008 | 1.6%).
Services Occupations by Sex
Within the Services occupations in Area Code 470, the most male-oriented occupations are Law Enforcement (73.9%), Security & Protection (73.0%), and Firefighting & Prevention (72.3%), while the most female-oriented occupations are Healthcare Support (88.0%), Personal Care & Service (77.1%), and Food Preparation & Serving (54.1%).
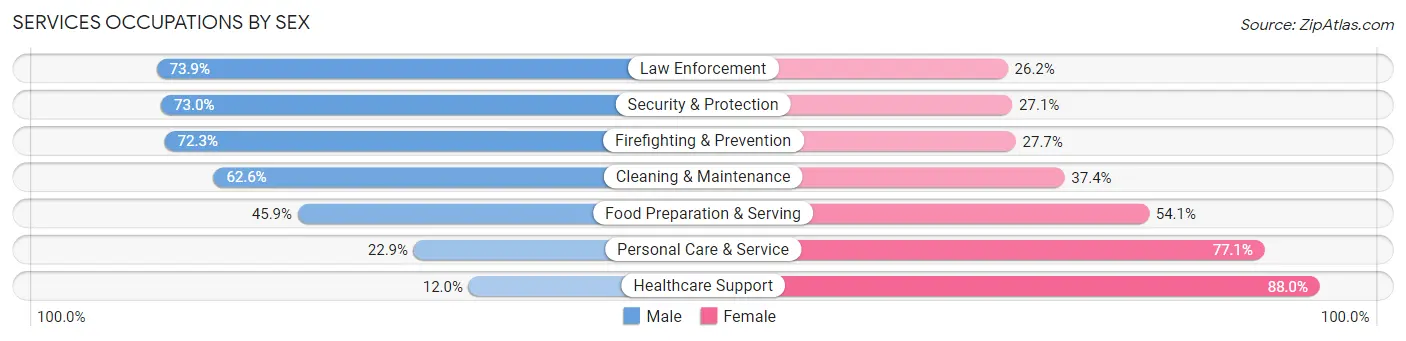
| Occupation | Male | Female |
| Healthcare Support | 2,280 (12.0%) | 16,653 (88.0%) |
| Security & Protection | 12,408 (73.0%) | 4,600 (27.1%) |
| Firefighting & Prevention | 6,899 (72.3%) | 2,649 (27.7%) |
| Law Enforcement | 5,509 (73.9%) | 1,951 (26.2%) |
| Food Preparation & Serving | 21,945 (45.9%) | 25,877 (54.1%) |
| Cleaning & Maintenance | 19,433 (62.6%) | 11,612 (37.4%) |
| Personal Care & Service | 5,284 (22.9%) | 17,773 (77.1%) |
| Total (Category) | 61,350 (44.5%) | 76,515 (55.5%) |
| Total (Overall) | 556,343 (53.3%) | 486,428 (46.7%) |
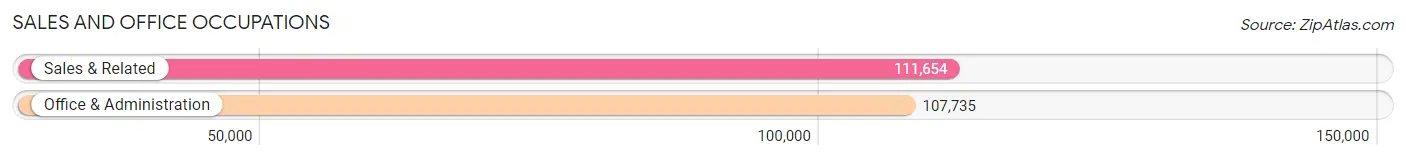
Sales and Office Occupations
The most common Sales and Office occupations in Area Code 470 are Sales & Related (111,654 | 10.7%), and Office & Administration (107,735 | 10.3%).
Sales and Office Occupations by Sex
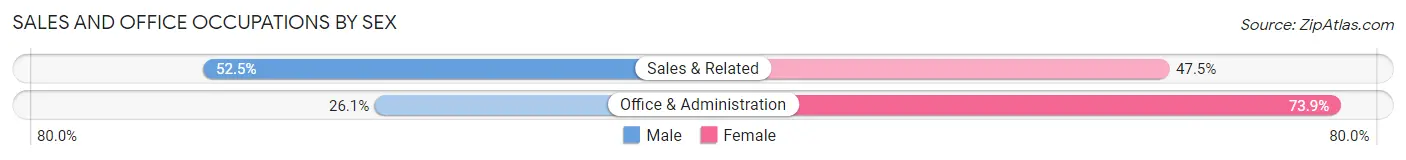
| Occupation | Male | Female |
| Sales & Related | 58,650 (52.5%) | 53,004 (47.5%) |
| Office & Administration | 28,110 (26.1%) | 79,625 (73.9%) |
| Total (Category) | 86,760 (39.6%) | 132,629 (60.5%) |
| Total (Overall) | 556,343 (53.3%) | 486,428 (46.7%) |
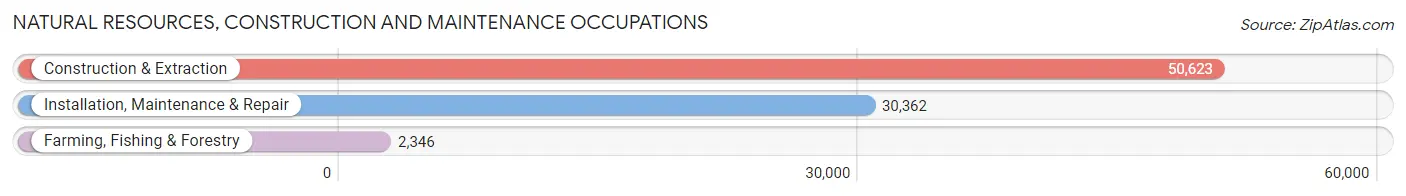
Natural Resources, Construction and Maintenance Occupations
The most common Natural Resources, Construction and Maintenance occupations in Area Code 470 are Construction & Extraction (50,623 | 4.9%), Installation, Maintenance & Repair (30,362 | 2.9%), and Farming, Fishing & Forestry (2,346 | 0.2%).
Natural Resources, Construction and Maintenance Occupations by Sex
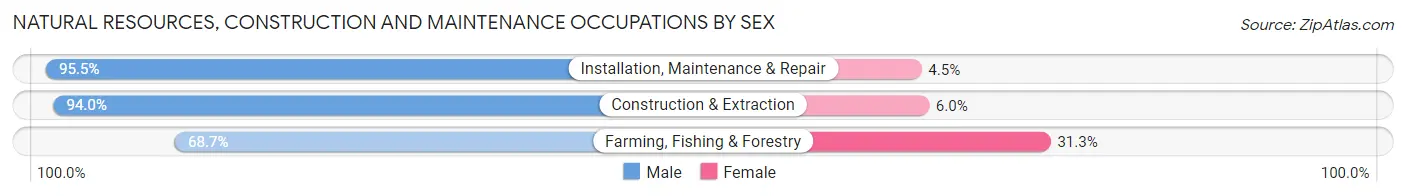
| Occupation | Male | Female |
| Farming, Fishing & Forestry | 1,611 (68.7%) | 735 (31.3%) |
| Construction & Extraction | 47,568 (94.0%) | 3,055 (6.0%) |
| Installation, Maintenance & Repair | 29,004 (95.5%) | 1,358 (4.5%) |
| Total (Category) | 78,183 (93.8%) | 5,148 (6.2%) |
| Total (Overall) | 556,343 (53.3%) | 486,428 (46.7%) |
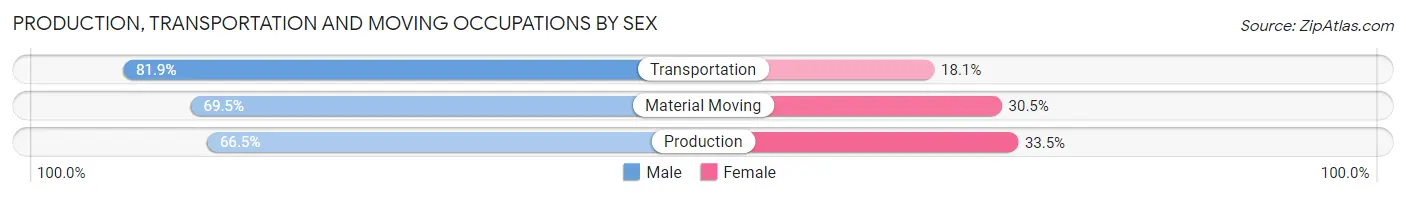
Production, Transportation and Moving Occupations
The most common Production, Transportation and Moving occupations in Area Code 470 are Production (55,648 | 5.3%), Material Moving (39,967 | 3.8%), and Transportation (37,380 | 3.6%).
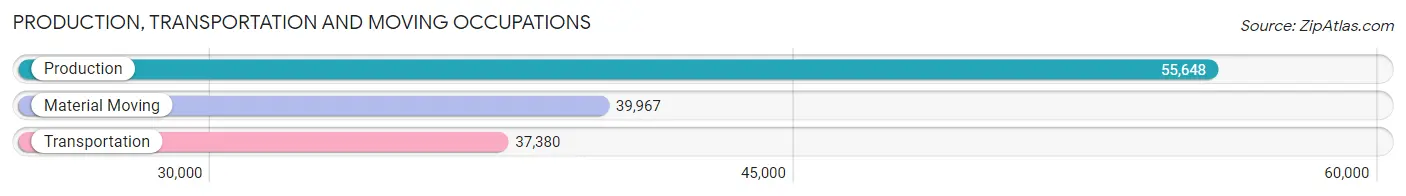
Production, Transportation and Moving Occupations by Sex
| Occupation | Male | Female |
| Production | 37,020 (66.5%) | 18,628 (33.5%) |
| Transportation | 30,621 (81.9%) | 6,759 (18.1%) |
| Material Moving | 27,790 (69.5%) | 12,177 (30.5%) |
| Total (Category) | 95,431 (71.8%) | 37,564 (28.2%) |
| Total (Overall) | 556,343 (53.3%) | 486,428 (46.7%) |
Employment Industries by Sex in Area Code 470
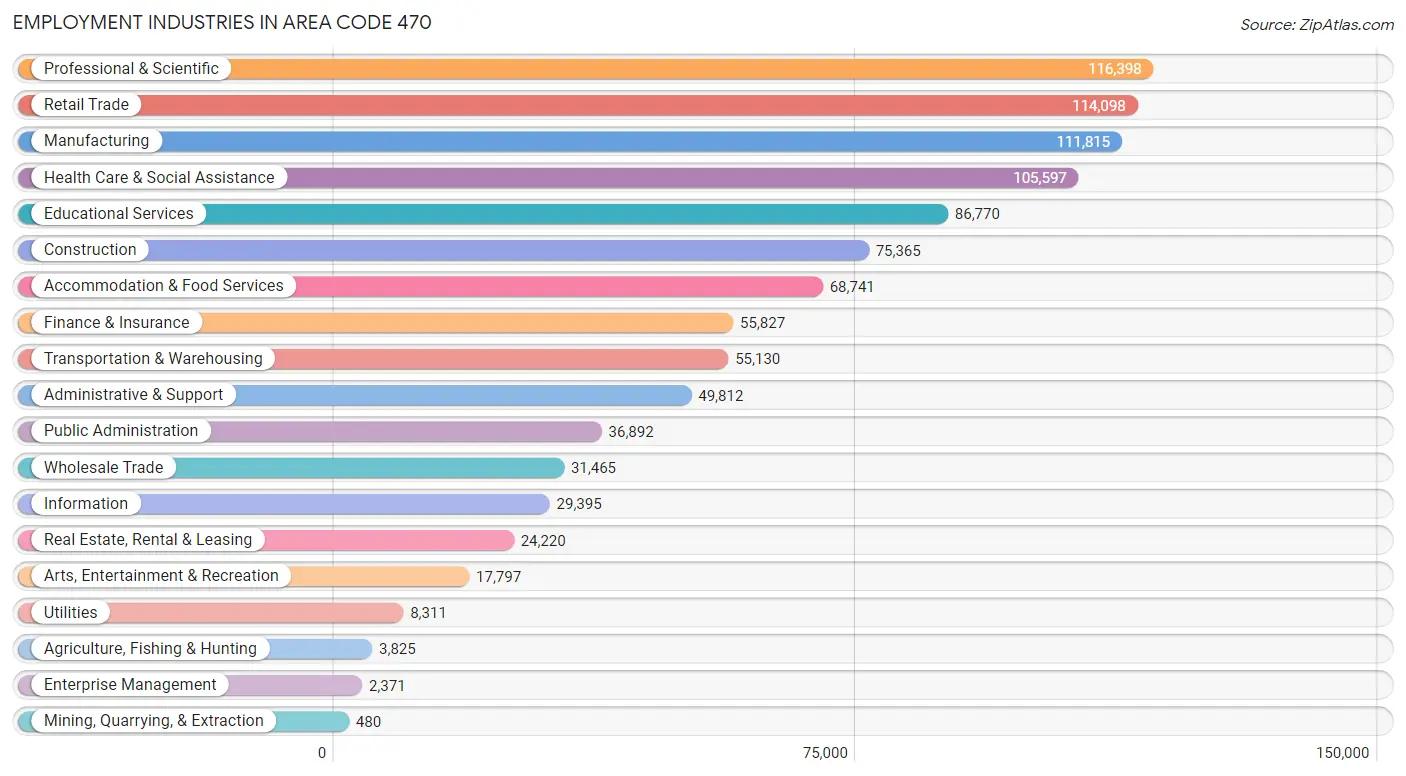
Employment Industries in Area Code 470
The major employment industries in Area Code 470 include Professional & Scientific (116,398 | 11.2%), Retail Trade (114,098 | 10.9%), Manufacturing (111,815 | 10.7%), Health Care & Social Assistance (105,597 | 10.1%), and Educational Services (86,770 | 8.3%).
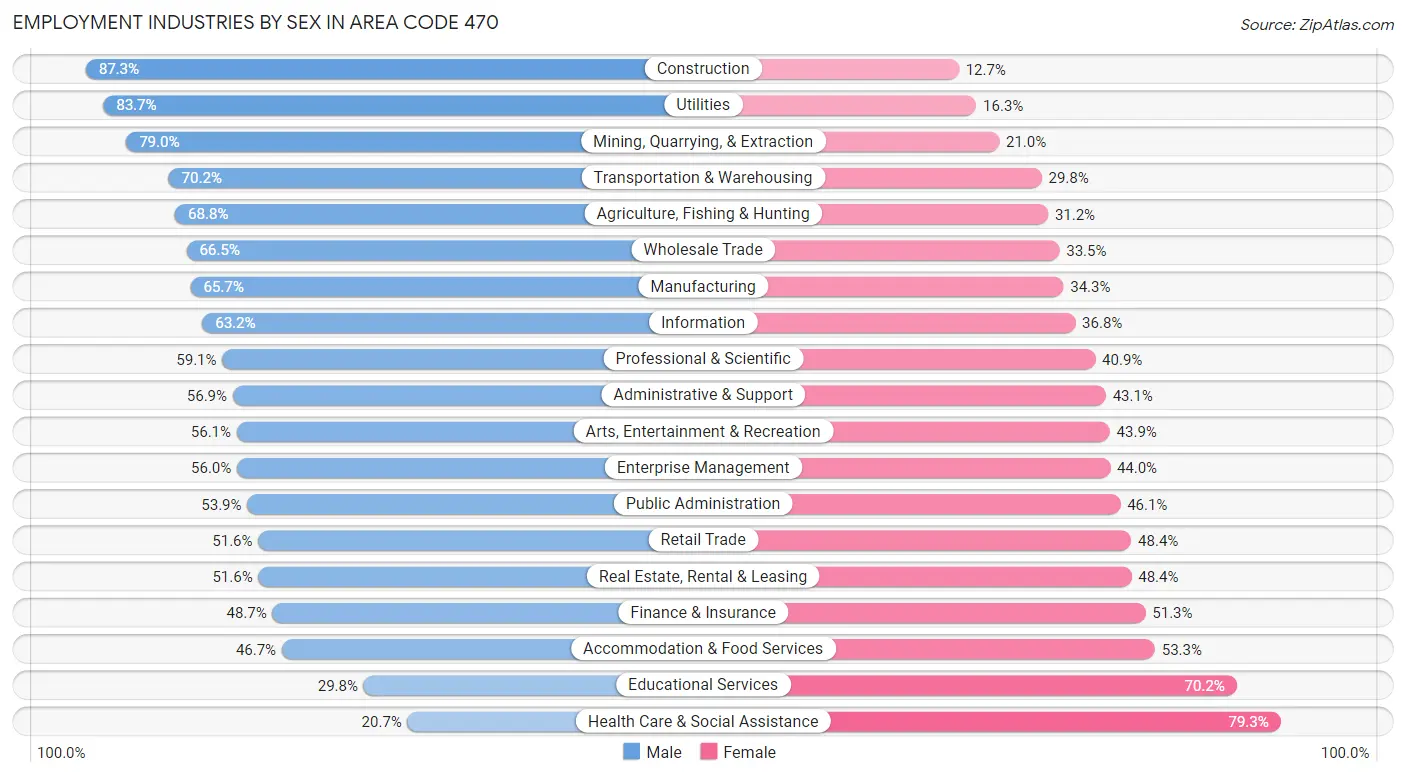
Employment Industries by Sex in Area Code 470
The Area Code 470 industries that see more men than women are Construction (87.3%), Utilities (83.7%), and Mining, Quarrying, & Extraction (79.0%), whereas the industries that tend to have a higher number of women are Health Care & Social Assistance (79.3%), Educational Services (70.2%), and Accommodation & Food Services (53.3%).
| Industry | Male | Female |
| Agriculture, Fishing & Hunting | 2,633 (68.8%) | 1,192 (31.2%) |
| Mining, Quarrying, & Extraction | 379 (79.0%) | 101 (21.0%) |
| Construction | 65,805 (87.3%) | 9,560 (12.7%) |
| Manufacturing | 73,421 (65.7%) | 38,394 (34.3%) |
| Wholesale Trade | 20,922 (66.5%) | 10,543 (33.5%) |
| Retail Trade | 58,897 (51.6%) | 55,201 (48.4%) |
| Transportation & Warehousing | 38,683 (70.2%) | 16,447 (29.8%) |
| Utilities | 6,956 (83.7%) | 1,355 (16.3%) |
| Information | 18,582 (63.2%) | 10,813 (36.8%) |
| Finance & Insurance | 27,176 (48.7%) | 28,651 (51.3%) |
| Real Estate, Rental & Leasing | 12,496 (51.6%) | 11,724 (48.4%) |
| Professional & Scientific | 68,751 (59.1%) | 47,647 (40.9%) |
| Enterprise Management | 1,328 (56.0%) | 1,043 (44.0%) |
| Administrative & Support | 28,336 (56.9%) | 21,476 (43.1%) |
| Educational Services | 25,845 (29.8%) | 60,925 (70.2%) |
| Health Care & Social Assistance | 21,868 (20.7%) | 83,729 (79.3%) |
| Arts, Entertainment & Recreation | 9,979 (56.1%) | 7,818 (43.9%) |
| Accommodation & Food Services | 32,122 (46.7%) | 36,619 (53.3%) |
| Public Administration | 19,881 (53.9%) | 17,011 (46.1%) |
| Total | 556,343 (53.3%) | 486,428 (46.7%) |
Education in Area Code 470
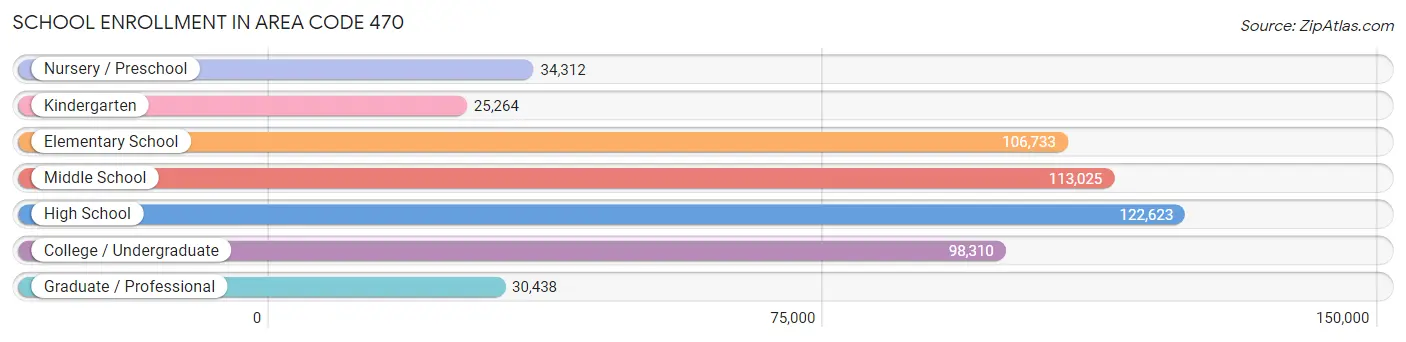
School Enrollment in Area Code 470
The most common levels of schooling among the 530,705 students in Area Code 470 are high school (122,623 | 23.1%), middle school (113,025 | 21.3%), and elementary school (106,733 | 20.1%).
| School Level | # Students | % Students |
| Nursery / Preschool | 34,312 | 6.5% |
| Kindergarten | 25,264 | 4.8% |
| Elementary School | 106,733 | 20.1% |
| Middle School | 113,025 | 21.3% |
| High School | 122,623 | 23.1% |
| College / Undergraduate | 98,310 | 18.5% |
| Graduate / Professional | 30,438 | 5.7% |
| Total | 530,705 | 100.0% |
School Enrollment by Age by Funding Source in Area Code 470
Out of a total of 530,705 students who are enrolled in schools in Area Code 470, 92,593 (17.4%) attend a private institution, while the remaining 438,112 (82.6%) are enrolled in public schools. The age group of 3 to 4 year olds has the highest likelihood of being enrolled in private schools, with 12,378 (46.2% in the age bracket) enrolled. Conversely, the age group of 15 to 17 year olds has the lowest likelihood of being enrolled in a private school, with 77,205 (87.6% in the age bracket) attending a public institution.
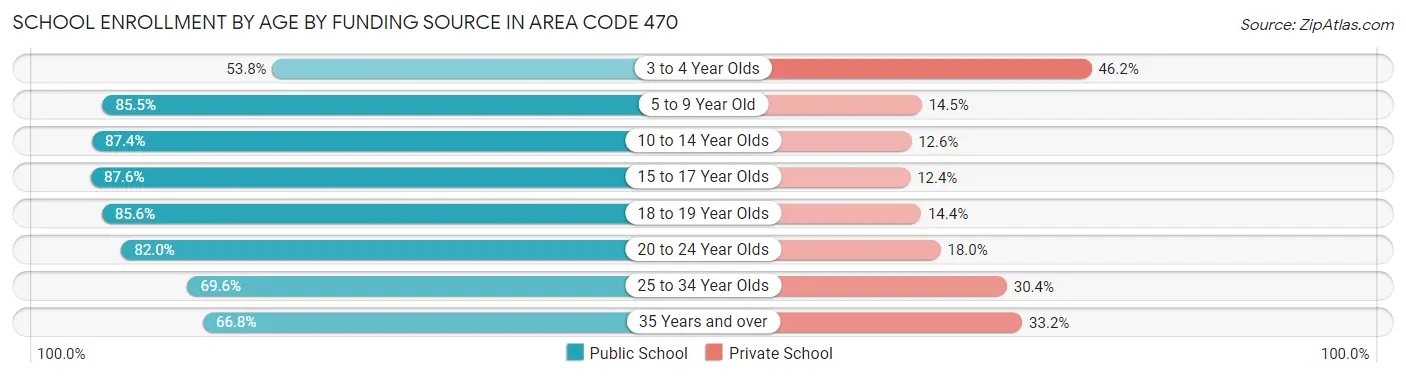
| Age Bracket | Public School | Private School |
| 3 to 4 Year Olds | 14,435 (53.8%) | 12,378 (46.2%) |
| 5 to 9 Year Old | 106,910 (85.5%) | 18,178 (14.5%) |
| 10 to 14 Year Olds | 122,611 (87.4%) | 17,651 (12.6%) |
| 15 to 17 Year Olds | 77,205 (87.6%) | 10,922 (12.4%) |
| 18 to 19 Year Olds | 33,913 (85.6%) | 5,704 (14.4%) |
| 20 to 24 Year Olds | 44,338 (82.0%) | 9,756 (18.0%) |
| 25 to 34 Year Olds | 20,637 (69.6%) | 9,006 (30.4%) |
| 35 Years and over | 18,066 (66.8%) | 8,995 (33.2%) |
| Total | 438,112 (82.6%) | 92,593 (17.4%) |
Educational Attainment by Field of Study in Area Code 470
Business (150,495 | 24.6%), education (56,658 | 9.2%), engineering (53,339 | 8.7%), science & technology (51,521 | 8.4%), and social sciences (46,676 | 7.6%) are the most common fields of study among 612,542 individuals in Area Code 470 who have obtained a bachelor's degree or higher.
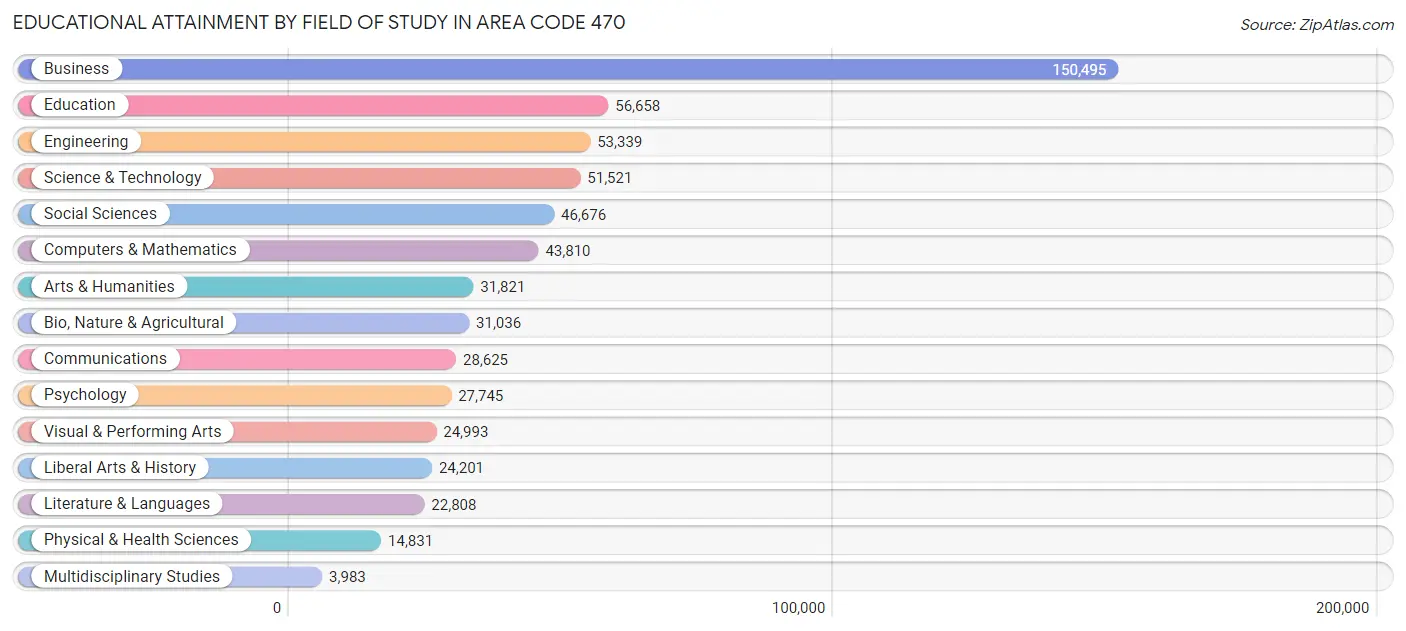
| Field of Study | # Graduates | % Graduates |
| Computers & Mathematics | 43,810 | 7.1% |
| Bio, Nature & Agricultural | 31,036 | 5.1% |
| Physical & Health Sciences | 14,831 | 2.4% |
| Psychology | 27,745 | 4.5% |
| Social Sciences | 46,676 | 7.6% |
| Engineering | 53,339 | 8.7% |
| Multidisciplinary Studies | 3,983 | 0.6% |
| Science & Technology | 51,521 | 8.4% |
| Business | 150,495 | 24.6% |
| Education | 56,658 | 9.2% |
| Literature & Languages | 22,808 | 3.7% |
| Liberal Arts & History | 24,201 | 4.0% |
| Visual & Performing Arts | 24,993 | 4.1% |
| Communications | 28,625 | 4.7% |
| Arts & Humanities | 31,821 | 5.2% |
| Total | 612,542 | 100.0% |
Transportation & Commute in Area Code 470
Vehicle Availability by Sex in Area Code 470
The most prevalent vehicle ownership categories in Area Code 470 are males with 2 vehicles (231,761, accounting for 42.6%) and females with 2 vehicles (195,960, making up 49.0%).
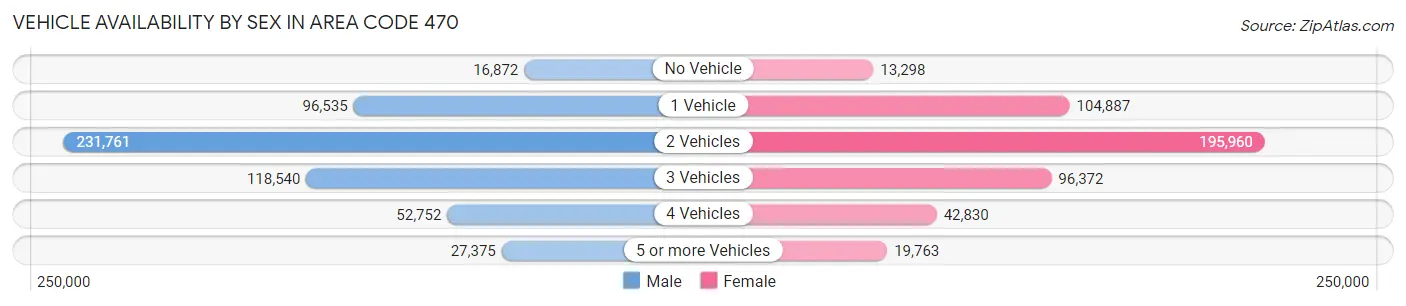
| Vehicles Available | Male | Female |
| No Vehicle | 16,872 (3.1%) | 13,298 (2.8%) |
| 1 Vehicle | 96,535 (17.7%) | 104,887 (22.2%) |
| 2 Vehicles | 231,761 (42.6%) | 195,960 (41.4%) |
| 3 Vehicles | 118,540 (21.8%) | 96,372 (20.4%) |
| 4 Vehicles | 52,752 (9.7%) | 42,830 (9.0%) |
| 5 or more Vehicles | 27,375 (5.0%) | 19,763 (4.2%) |
| Total | 543,835 (100.0%) | 473,110 (100.0%) |
Commute Time in Area Code 470
The most frequently occuring commute durations in Area Code 470 are 30 to 34 minutes (129,900 commuters, 15.1%), 15 to 19 minutes (123,677 commuters, 14.4%), and 20 to 24 minutes (119,243 commuters, 13.9%).
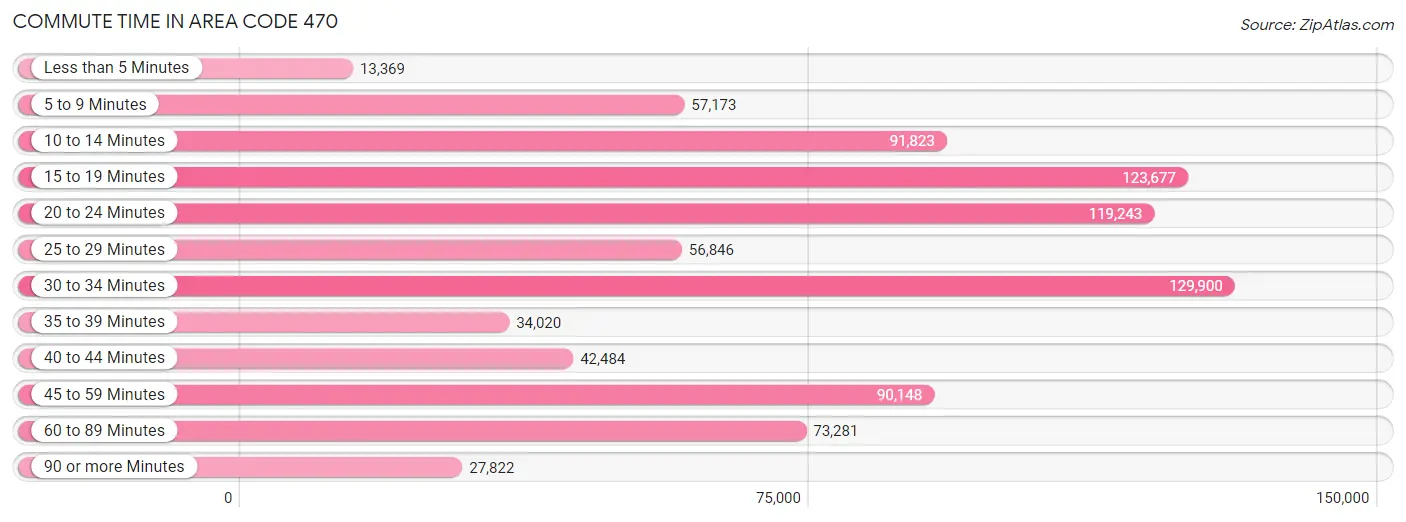
| Commute Time | # Commuters | % Commuters |
| Less than 5 Minutes | 13,369 | 1.5% |
| 5 to 9 Minutes | 57,173 | 6.7% |
| 10 to 14 Minutes | 91,823 | 10.7% |
| 15 to 19 Minutes | 123,677 | 14.4% |
| 20 to 24 Minutes | 119,243 | 13.9% |
| 25 to 29 Minutes | 56,846 | 6.6% |
| 30 to 34 Minutes | 129,900 | 15.1% |
| 35 to 39 Minutes | 34,020 | 4.0% |
| 40 to 44 Minutes | 42,484 | 4.9% |
| 45 to 59 Minutes | 90,148 | 10.5% |
| 60 to 89 Minutes | 73,281 | 8.5% |
| 90 or more Minutes | 27,822 | 3.2% |
Commute Time by Sex in Area Code 470
The most common commute times in Area Code 470 are 30 to 34 minutes (73,037 commuters, 15.8%) for males and 15 to 19 minutes (59,435 commuters, 15.0%) for females.
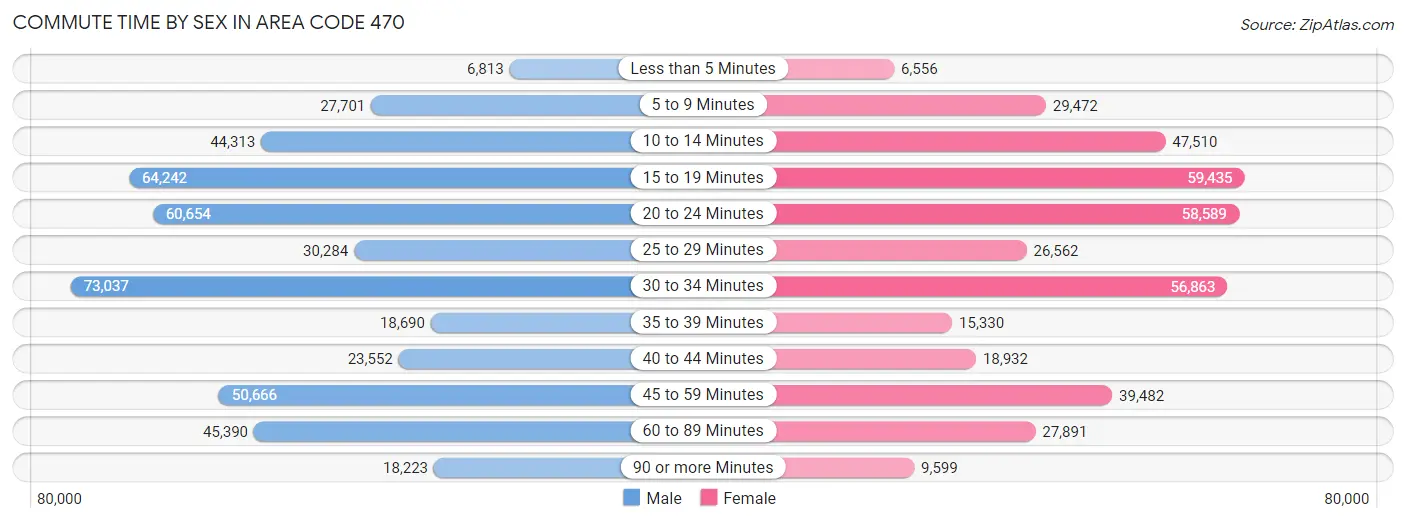
| Commute Time | Male | Female |
| Less than 5 Minutes | 6,813 (1.5%) | 6,556 (1.7%) |
| 5 to 9 Minutes | 27,701 (6.0%) | 29,472 (7.4%) |
| 10 to 14 Minutes | 44,313 (9.6%) | 47,510 (12.0%) |
| 15 to 19 Minutes | 64,242 (13.9%) | 59,435 (15.0%) |
| 20 to 24 Minutes | 60,654 (13.1%) | 58,589 (14.8%) |
| 25 to 29 Minutes | 30,284 (6.5%) | 26,562 (6.7%) |
| 30 to 34 Minutes | 73,037 (15.8%) | 56,863 (14.3%) |
| 35 to 39 Minutes | 18,690 (4.0%) | 15,330 (3.9%) |
| 40 to 44 Minutes | 23,552 (5.1%) | 18,932 (4.8%) |
| 45 to 59 Minutes | 50,666 (10.9%) | 39,482 (10.0%) |
| 60 to 89 Minutes | 45,390 (9.8%) | 27,891 (7.0%) |
| 90 or more Minutes | 18,223 (3.9%) | 9,599 (2.4%) |
Time of Departure to Work by Sex in Area Code 470
The most frequent times of departure to work in Area Code 470 are 7:00 AM to 7:29 AM (69,693, 15.0%) for males and 7:00 AM to 7:29 AM (60,053, 15.2%) for females.
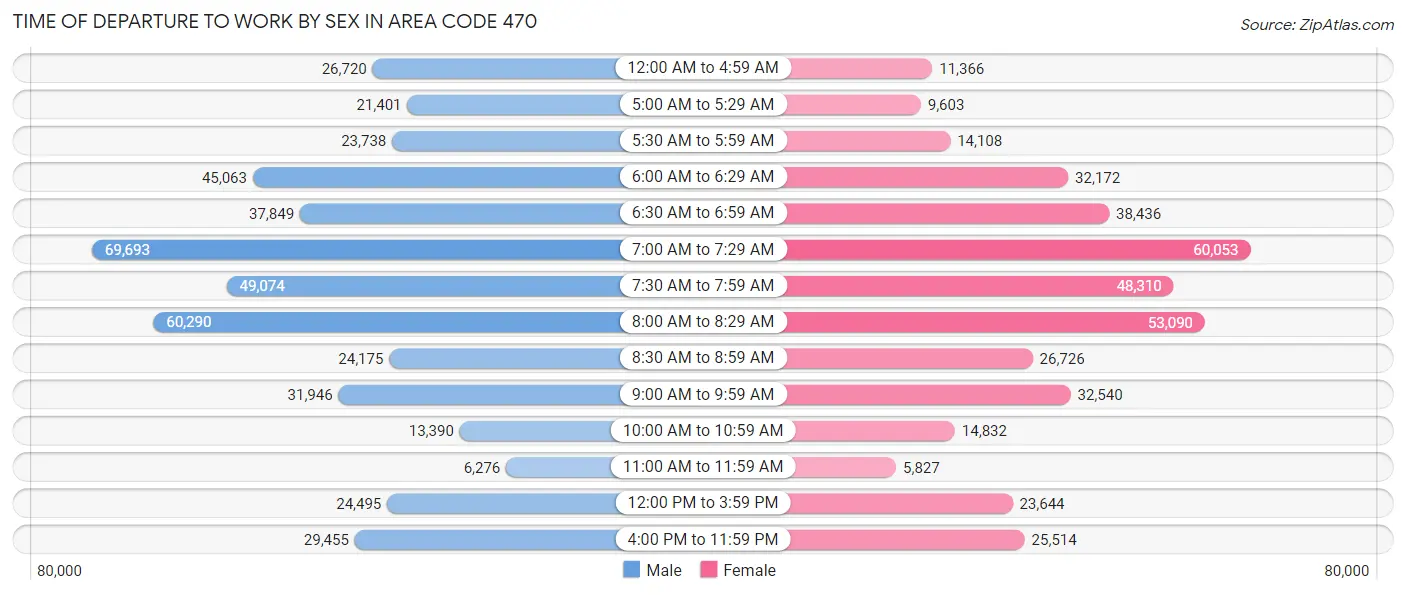
| Time of Departure | Male | Female |
| 12:00 AM to 4:59 AM | 26,720 (5.8%) | 11,366 (2.9%) |
| 5:00 AM to 5:29 AM | 21,401 (4.6%) | 9,603 (2.4%) |
| 5:30 AM to 5:59 AM | 23,738 (5.1%) | 14,108 (3.6%) |
| 6:00 AM to 6:29 AM | 45,063 (9.7%) | 32,172 (8.1%) |
| 6:30 AM to 6:59 AM | 37,849 (8.2%) | 38,436 (9.7%) |
| 7:00 AM to 7:29 AM | 69,693 (15.0%) | 60,053 (15.2%) |
| 7:30 AM to 7:59 AM | 49,074 (10.6%) | 48,310 (12.2%) |
| 8:00 AM to 8:29 AM | 60,290 (13.0%) | 53,090 (13.4%) |
| 8:30 AM to 8:59 AM | 24,175 (5.2%) | 26,726 (6.8%) |
| 9:00 AM to 9:59 AM | 31,946 (6.9%) | 32,540 (8.2%) |
| 10:00 AM to 10:59 AM | 13,390 (2.9%) | 14,832 (3.7%) |
| 11:00 AM to 11:59 AM | 6,276 (1.3%) | 5,827 (1.5%) |
| 12:00 PM to 3:59 PM | 24,495 (5.3%) | 23,644 (6.0%) |
| 4:00 PM to 11:59 PM | 29,455 (6.4%) | 25,514 (6.4%) |
| Total | 463,565 (100.0%) | 396,221 (100.0%) |
Housing Occupancy in Area Code 470
Occupancy by Ownership in Area Code 470
Of the total 754,989 dwellings in Area Code 470, owner-occupied units account for 492,184 (65.2%), while renter-occupied units make up 262,805 (34.8%).
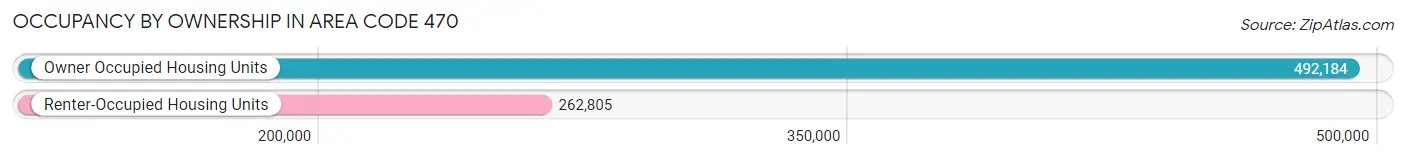
| Occupancy | # Housing Units | % Housing Units |
| Owner Occupied Housing Units | 492,184 | 65.2% |
| Renter-Occupied Housing Units | 262,805 | 34.8% |
| Total Occupied Housing Units | 754,989 | 100.0% |
Occupancy by Household Size in Area Code 470
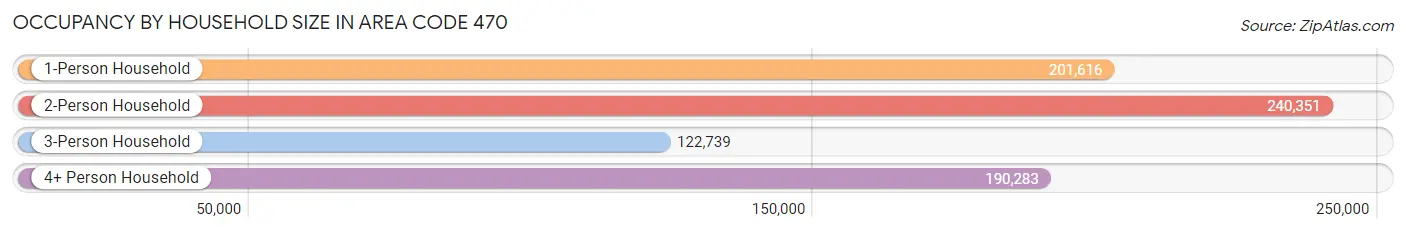
| Household Size | # Housing Units | % Housing Units |
| 1-Person Household | 201,616 | 26.7% |
| 2-Person Household | 240,351 | 31.8% |
| 3-Person Household | 122,739 | 16.3% |
| 4+ Person Household | 190,283 | 25.2% |
| Total Housing Units | 754,989 | 100.0% |
Occupancy by Ownership by Household Size in Area Code 470
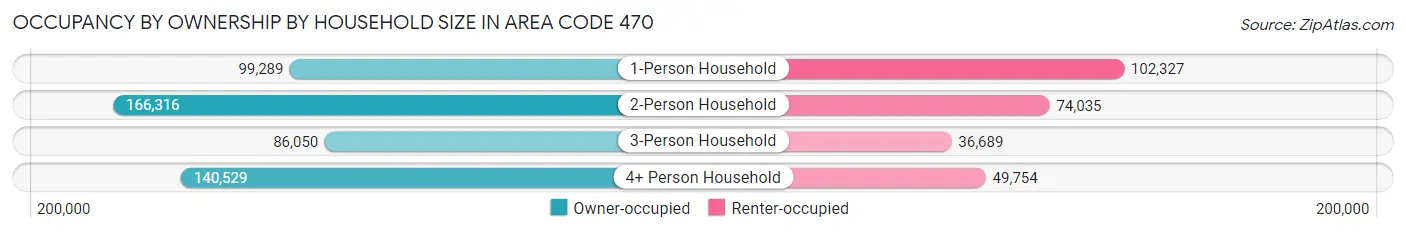
| Household Size | Owner-occupied | Renter-occupied |
| 1-Person Household | 99,289 (49.2%) | 102,327 (50.7%) |
| 2-Person Household | 166,316 (69.2%) | 74,035 (30.8%) |
| 3-Person Household | 86,050 (70.1%) | 36,689 (29.9%) |
| 4+ Person Household | 140,529 (73.9%) | 49,754 (26.2%) |
| Total Housing Units | 492,184 (65.2%) | 262,805 (34.8%) |
Occupancy by Educational Attainment in Area Code 470
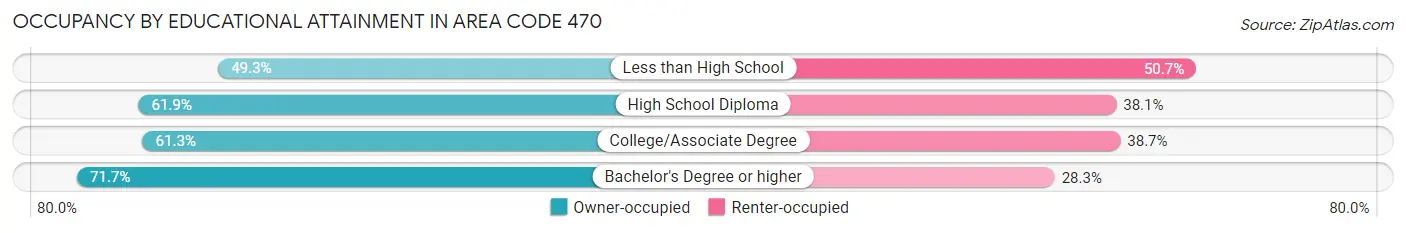
| Household Size | Owner-occupied | Renter-occupied |
| Less than High School | 30,721 (49.3%) | 31,623 (50.7%) |
| High School Diploma | 89,944 (61.9%) | 55,315 (38.1%) |
| College/Associate Degree | 122,649 (61.3%) | 77,522 (38.7%) |
| Bachelor's Degree or higher | 248,870 (71.7%) | 98,345 (28.3%) |
Occupancy by Age of Householder in Area Code 470
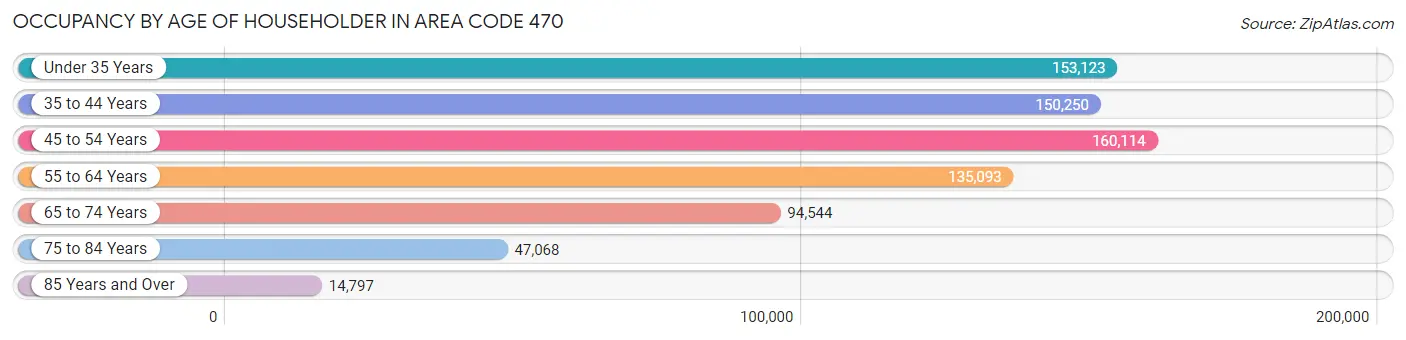
| Age Bracket | # Households | % Households |
| Under 35 Years | 153,123 | 20.3% |
| 35 to 44 Years | 150,250 | 19.9% |
| 45 to 54 Years | 160,114 | 21.2% |
| 55 to 64 Years | 135,093 | 17.9% |
| 65 to 74 Years | 94,544 | 12.5% |
| 75 to 84 Years | 47,068 | 6.2% |
| 85 Years and Over | 14,797 | 2.0% |
| Total | 754,989 | 100.0% |
Housing Finances in Area Code 470
Median Income by Occupancy in Area Code 470
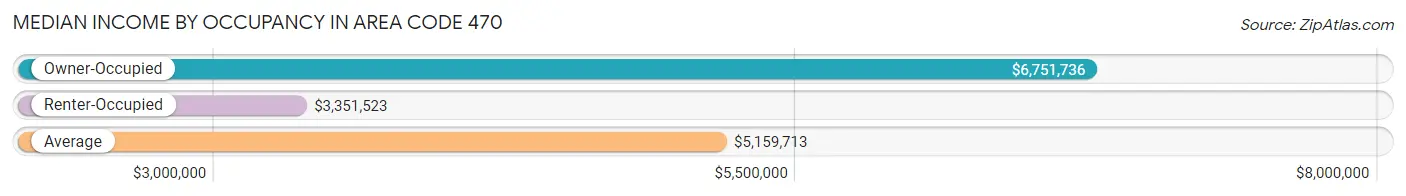
| Occupancy Type | # Households | Median Income |
| Owner-Occupied | 492,184 (65.2%) | $6,751,736 |
| Renter-Occupied | 262,805 (34.8%) | $3,351,523 |
| Average | 754,989 (100.0%) | $5,159,713 |
Occupancy by Householder Income Bracket in Area Code 470
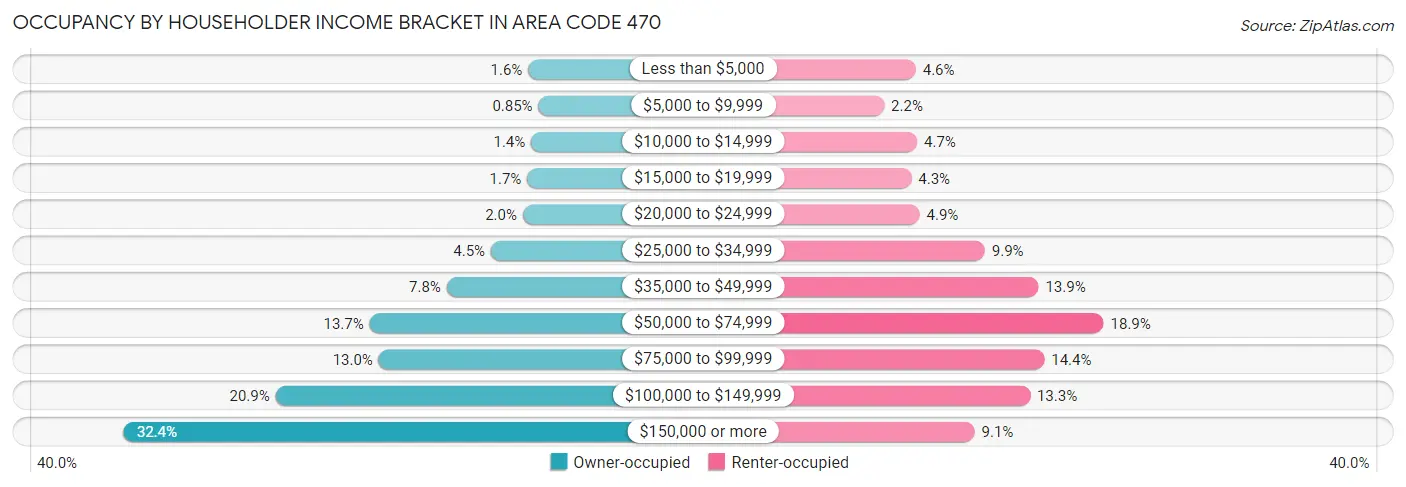
| Income Bracket | Owner-occupied | Renter-occupied |
| Less than $5,000 | 8,001 (1.6%) | 12,068 (4.6%) |
| $5,000 to $9,999 | 4,199 (0.9%) | 5,723 (2.2%) |
| $10,000 to $14,999 | 6,958 (1.4%) | 12,317 (4.7%) |
| $15,000 to $19,999 | 8,396 (1.7%) | 11,160 (4.3%) |
| $20,000 to $24,999 | 10,032 (2.0%) | 12,836 (4.9%) |
| $25,000 to $34,999 | 21,980 (4.5%) | 25,878 (9.9%) |
| $35,000 to $49,999 | 38,583 (7.8%) | 36,625 (13.9%) |
| $50,000 to $74,999 | 67,505 (13.7%) | 49,670 (18.9%) |
| $75,000 to $99,999 | 64,100 (13.0%) | 37,782 (14.4%) |
| $100,000 to $149,999 | 102,766 (20.9%) | 34,914 (13.3%) |
| $150,000 or more | 159,664 (32.4%) | 23,832 (9.1%) |
| Total | 492,184 (100.0%) | 262,805 (100.0%) |
Monthly Housing Cost Tiers in Area Code 470
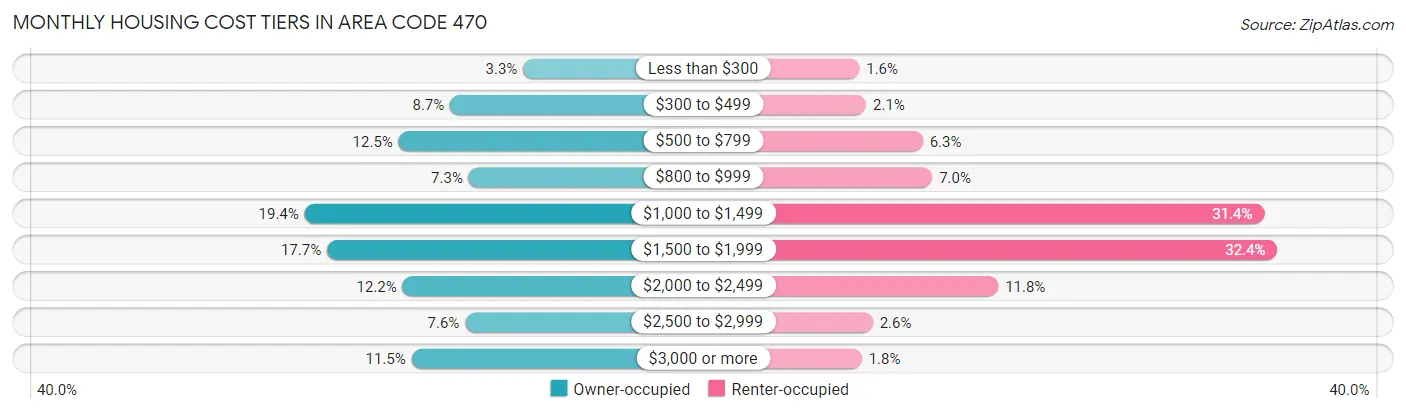
| Monthly Cost | Owner-occupied | Renter-occupied |
| Less than $300 | 16,163 (3.3%) | 4,220 (1.6%) |
| $300 to $499 | 42,610 (8.7%) | 5,543 (2.1%) |
| $500 to $799 | 61,295 (12.4%) | 16,506 (6.3%) |
| $800 to $999 | 35,872 (7.3%) | 18,344 (7.0%) |
| $1,000 to $1,499 | 95,404 (19.4%) | 82,618 (31.4%) |
| $1,500 to $1,999 | 87,240 (17.7%) | 85,144 (32.4%) |
| $2,000 to $2,499 | 59,831 (12.2%) | 31,127 (11.8%) |
| $2,500 to $2,999 | 37,157 (7.5%) | 6,827 (2.6%) |
| $3,000 or more | 56,612 (11.5%) | 4,696 (1.8%) |
| Total | 492,184 (100.0%) | 262,805 (100.0%) |
Physical Housing Characteristics in Area Code 470
Housing Structures in Area Code 470
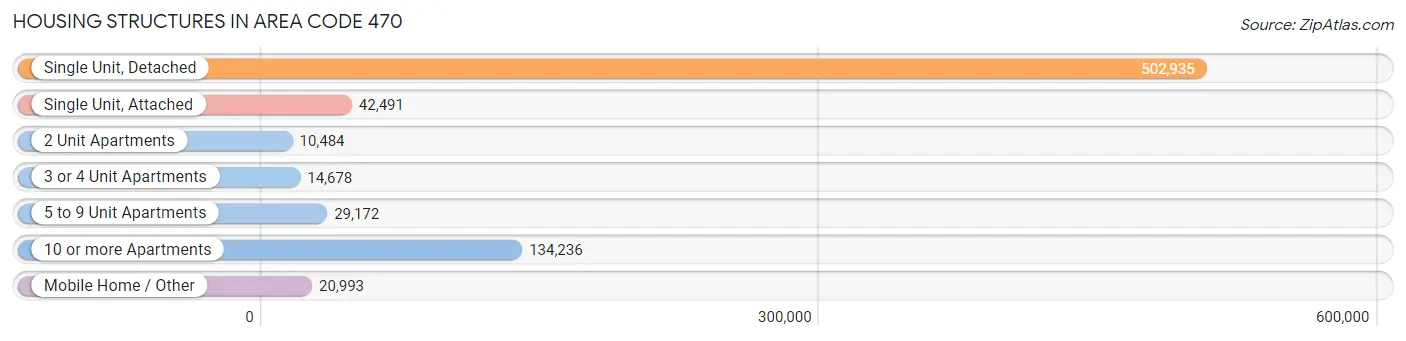
| Structure Type | # Housing Units | % Housing Units |
| Single Unit, Detached | 502,935 | 66.6% |
| Single Unit, Attached | 42,491 | 5.6% |
| 2 Unit Apartments | 10,484 | 1.4% |
| 3 or 4 Unit Apartments | 14,678 | 1.9% |
| 5 to 9 Unit Apartments | 29,172 | 3.9% |
| 10 or more Apartments | 134,236 | 17.8% |
| Mobile Home / Other | 20,993 | 2.8% |
| Total | 754,989 | 100.0% |
Housing Structures by Occupancy in Area Code 470
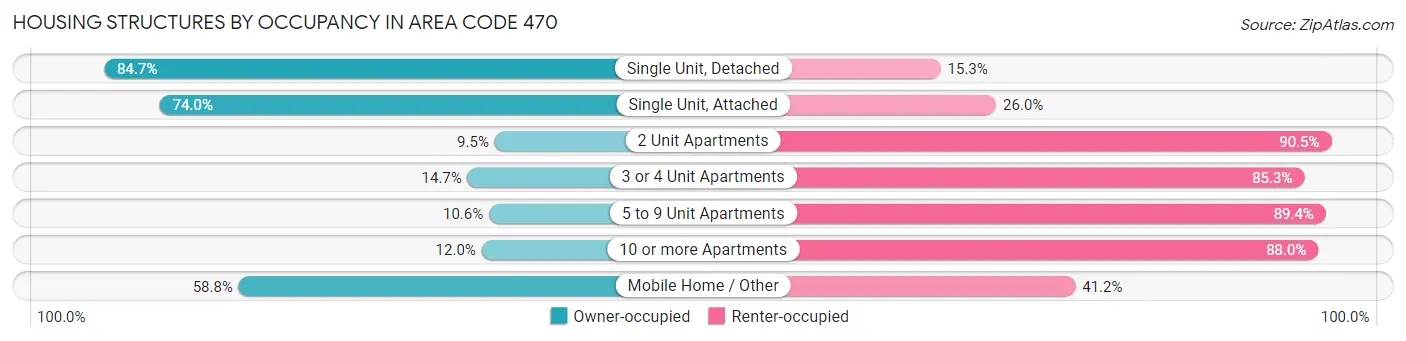
| Structure Type | Owner-occupied | Renter-occupied |
| Single Unit, Detached | 426,052 (84.7%) | 76,883 (15.3%) |
| Single Unit, Attached | 31,446 (74.0%) | 11,045 (26.0%) |
| 2 Unit Apartments | 994 (9.5%) | 9,490 (90.5%) |
| 3 or 4 Unit Apartments | 2,158 (14.7%) | 12,520 (85.3%) |
| 5 to 9 Unit Apartments | 3,083 (10.6%) | 26,089 (89.4%) |
| 10 or more Apartments | 16,112 (12.0%) | 118,124 (88.0%) |
| Mobile Home / Other | 12,339 (58.8%) | 8,654 (41.2%) |
| Total | 492,184 (65.2%) | 262,805 (34.8%) |
Housing Structures by Number of Rooms in Area Code 470
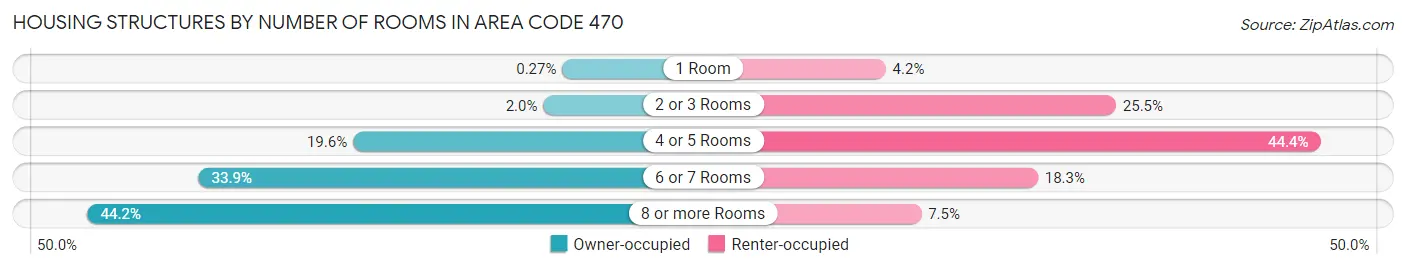
| Number of Rooms | Owner-occupied | Renter-occupied |
| 1 Room | 1,348 (0.3%) | 11,121 (4.2%) |
| 2 or 3 Rooms | 9,998 (2.0%) | 67,059 (25.5%) |
| 4 or 5 Rooms | 96,622 (19.6%) | 116,766 (44.4%) |
| 6 or 7 Rooms | 166,834 (33.9%) | 48,095 (18.3%) |
| 8 or more Rooms | 217,382 (44.2%) | 19,764 (7.5%) |
| Total | 492,184 (100.0%) | 262,805 (100.0%) |
Housing Structure by Heating Type in Area Code 470
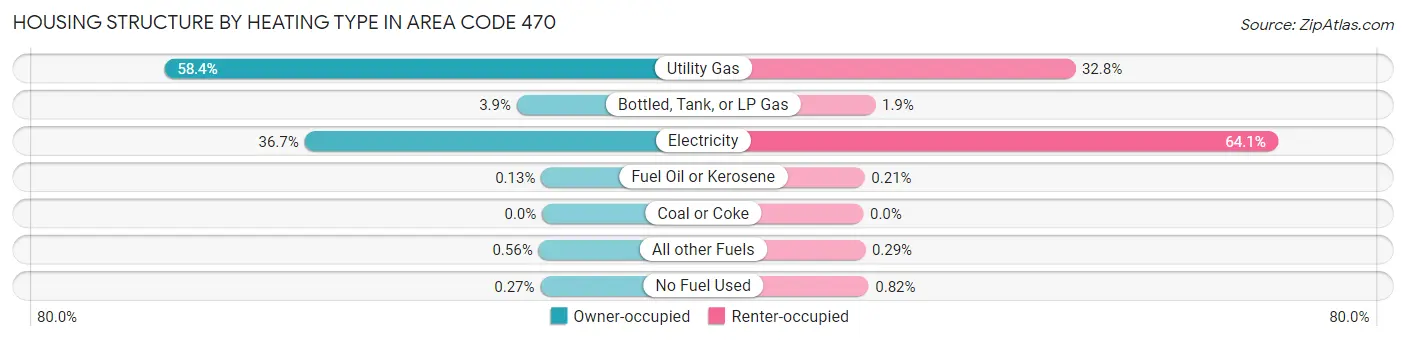
| Heating Type | Owner-occupied | Renter-occupied |
| Utility Gas | 287,443 (58.4%) | 86,106 (32.8%) |
| Bottled, Tank, or LP Gas | 19,234 (3.9%) | 4,864 (1.8%) |
| Electricity | 180,721 (36.7%) | 168,361 (64.1%) |
| Fuel Oil or Kerosene | 653 (0.1%) | 554 (0.2%) |
| Coal or Coke | 12 (0.0%) | 0 (0.0%) |
| All other Fuels | 2,776 (0.6%) | 767 (0.3%) |
| No Fuel Used | 1,345 (0.3%) | 2,153 (0.8%) |
| Total | 492,184 (100.0%) | 262,805 (100.0%) |
Household Vehicle Usage in Area Code 470
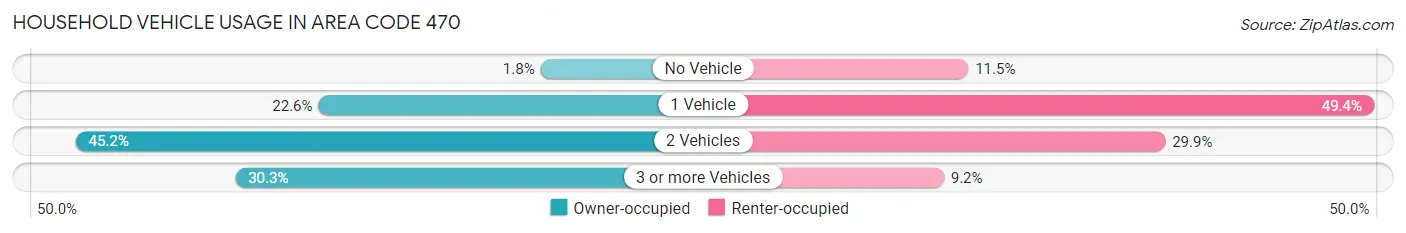
| Vehicles per Household | Owner-occupied | Renter-occupied |
| No Vehicle | 9,070 (1.8%) | 30,242 (11.5%) |
| 1 Vehicle | 111,129 (22.6%) | 129,743 (49.4%) |
| 2 Vehicles | 222,642 (45.2%) | 78,570 (29.9%) |
| 3 or more Vehicles | 149,343 (30.3%) | 24,250 (9.2%) |
| Total | 492,184 (100.0%) | 262,805 (100.0%) |
Real Estate & Mortgages in Area Code 470
Real Estate and Mortgage Overview in Area Code 470
| Characteristic | Without Mortgage | With Mortgage |
| Housing Units | 148,267 | 343,917 |
| Median Property Value | $18,878,600 | $20,830,900 |
| Median Household Income | $4,909,756 | $126,735 |
| Monthly Housing Costs | $39,639 | $55,455 |
| Real Estate Taxes | $163,432 | $5,765 |
Property Value by Mortgage Status in Area Code 470
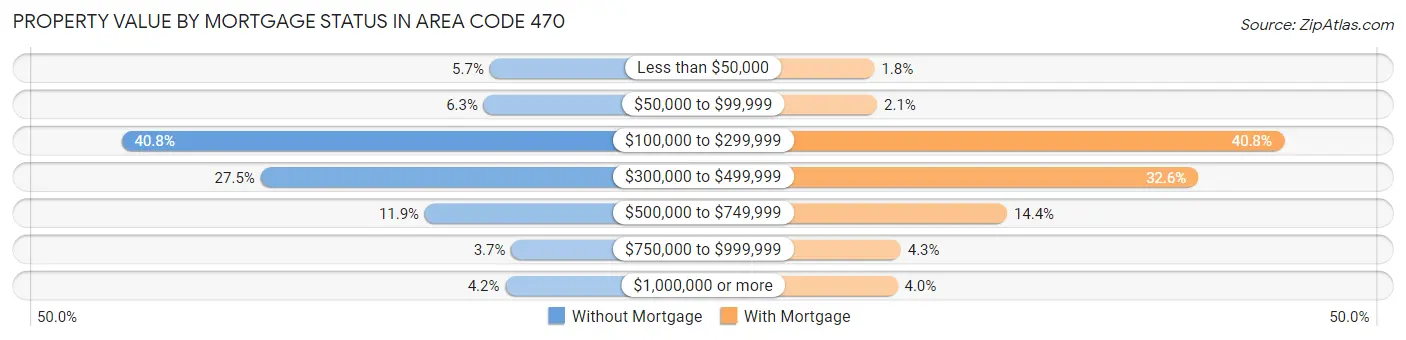
| Property Value | Without Mortgage | With Mortgage |
| Less than $50,000 | 8,456 (5.7%) | 6,204 (1.8%) |
| $50,000 to $99,999 | 9,303 (6.3%) | 7,066 (2.1%) |
| $100,000 to $299,999 | 60,443 (40.8%) | 140,280 (40.8%) |
| $300,000 to $499,999 | 40,806 (27.5%) | 112,208 (32.6%) |
| $500,000 to $749,999 | 17,594 (11.9%) | 49,594 (14.4%) |
| $750,000 to $999,999 | 5,413 (3.6%) | 14,823 (4.3%) |
| $1,000,000 or more | 6,252 (4.2%) | 13,742 (4.0%) |
| Total | 148,267 (100.0%) | 343,917 (100.0%) |
Household Income by Mortgage Status in Area Code 470
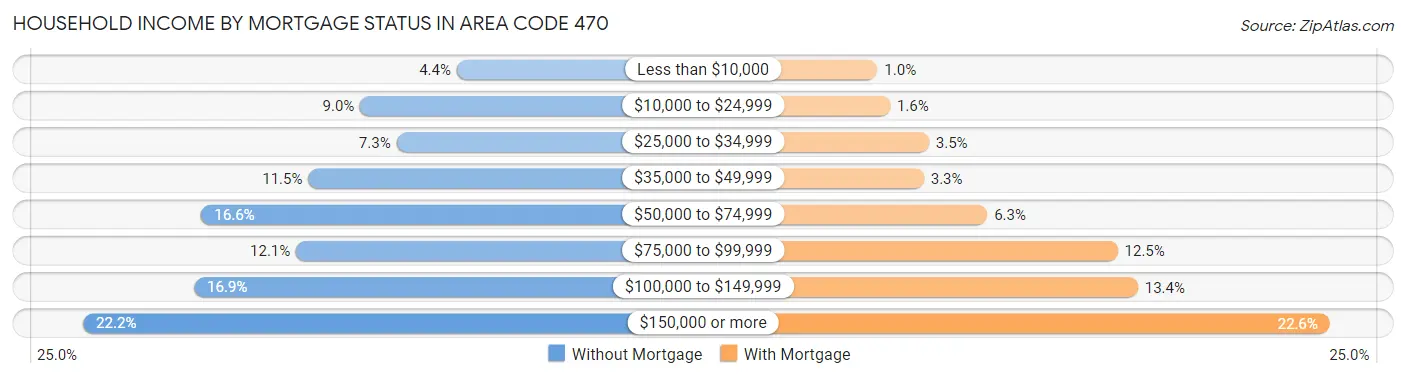
| Household Income | Without Mortgage | With Mortgage |
| Less than $10,000 | 6,557 (4.4%) | 3,574 (1.0%) |
| $10,000 to $24,999 | 13,368 (9.0%) | 5,643 (1.6%) |
| $25,000 to $34,999 | 10,803 (7.3%) | 12,018 (3.5%) |
| $35,000 to $49,999 | 17,034 (11.5%) | 11,177 (3.3%) |
| $50,000 to $74,999 | 24,589 (16.6%) | 21,549 (6.3%) |
| $75,000 to $99,999 | 17,889 (12.1%) | 42,916 (12.5%) |
| $100,000 to $149,999 | 25,098 (16.9%) | 46,211 (13.4%) |
| $150,000 or more | 32,929 (22.2%) | 77,668 (22.6%) |
| Total | 148,267 (100.0%) | 343,917 (100.0%) |
Property Value to Household Income Ratio in Area Code 470
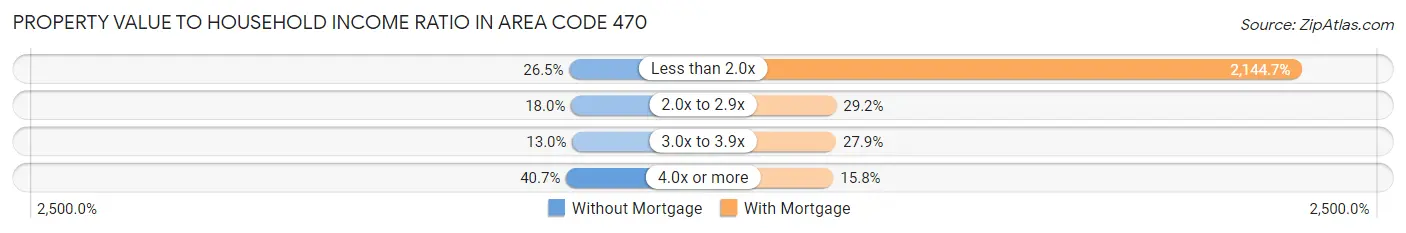
| Value-to-Income Ratio | Without Mortgage | With Mortgage |
| Less than 2.0x | 39,353 (26.5%) | 7,375,912 (2,144.7%) |
| 2.0x to 2.9x | 26,731 (18.0%) | 100,396 (29.2%) |
| 3.0x to 3.9x | 19,285 (13.0%) | 95,927 (27.9%) |
| 4.0x or more | 60,366 (40.7%) | 54,324 (15.8%) |
| Total | 148,267 (100.0%) | 343,917 (100.0%) |
Real Estate Taxes by Mortgage Status in Area Code 470
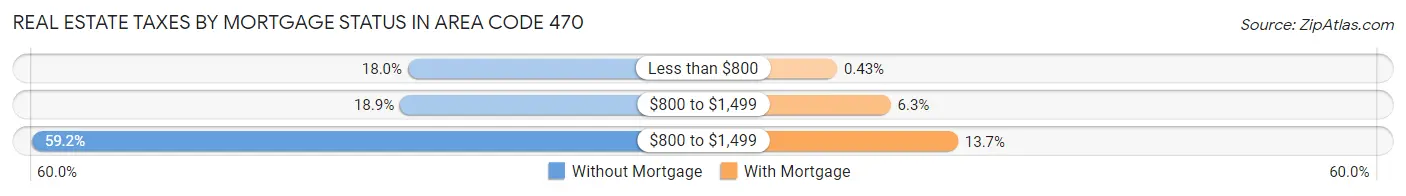
| Property Taxes | Without Mortgage | With Mortgage |
| Less than $800 | 26,691 (18.0%) | 1,493 (0.4%) |
| $800 to $1,499 | 27,966 (18.9%) | 21,718 (6.3%) |
| $800 to $1,499 | 87,783 (59.2%) | 47,053 (13.7%) |
| Total | 148,267 (100.0%) | 343,917 (100.0%) |
Health & Disability in Area Code 470
Health Insurance Coverage by Age in Area Code 470
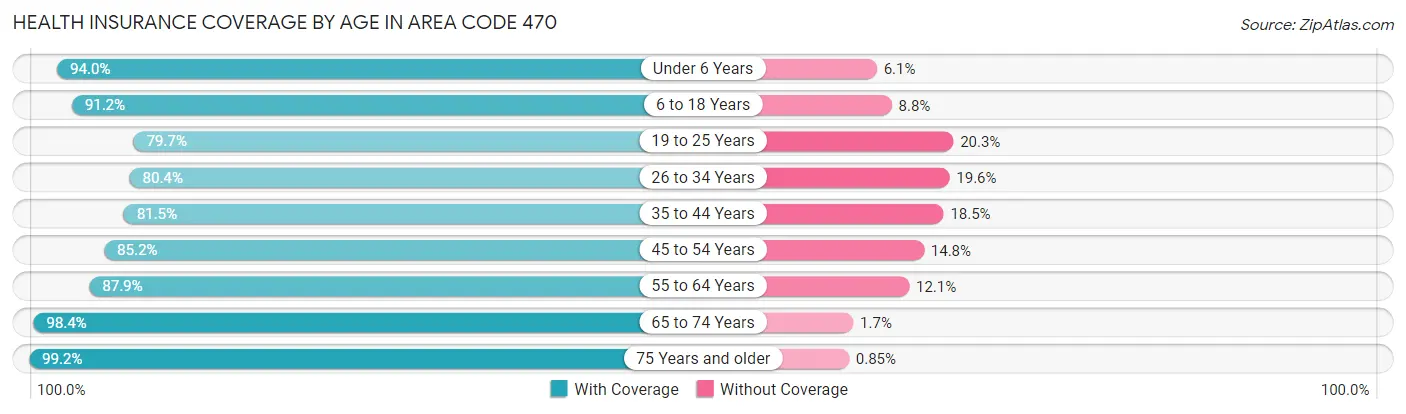
| Age Bracket | With Coverage | Without Coverage |
| Under 6 Years | 139,164 (94.0%) | 8,968 (6.0%) |
| 6 to 18 Years | 337,801 (91.2%) | 32,678 (8.8%) |
| 19 to 25 Years | 151,273 (79.7%) | 38,546 (20.3%) |
| 26 to 34 Years | 205,607 (80.4%) | 50,102 (19.6%) |
| 35 to 44 Years | 231,050 (81.5%) | 52,427 (18.5%) |
| 45 to 54 Years | 243,241 (85.2%) | 42,394 (14.8%) |
| 55 to 64 Years | 211,299 (87.9%) | 29,024 (12.1%) |
| 65 to 74 Years | 159,209 (98.4%) | 2,676 (1.7%) |
| 75 Years and older | 98,186 (99.2%) | 838 (0.9%) |
| Total | 1,776,830 (87.3%) | 257,653 (12.7%) |
Health Insurance Coverage by Citizenship Status in Area Code 470
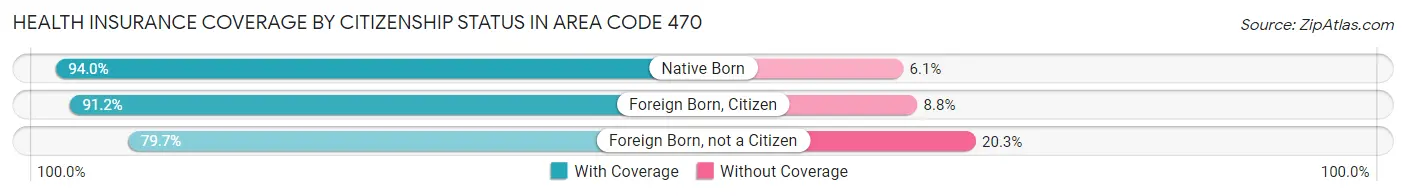
| Citizenship Status | With Coverage | Without Coverage |
| Native Born | 139,164 (94.0%) | 8,968 (6.0%) |
| Foreign Born, Citizen | 337,801 (91.2%) | 32,678 (8.8%) |
| Foreign Born, not a Citizen | 151,273 (79.7%) | 38,546 (20.3%) |
Health Insurance Coverage by Household Income in Area Code 470
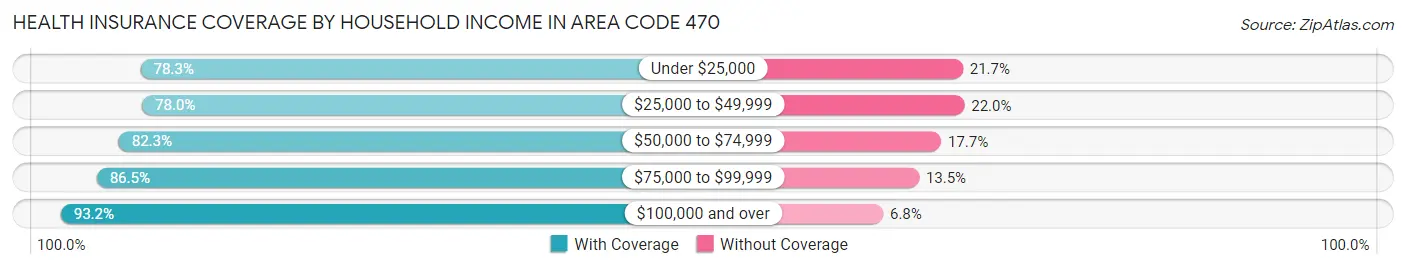
| Household Income | With Coverage | Without Coverage |
| Under $25,000 | 136,487 (78.3%) | 37,902 (21.7%) |
| $25,000 to $49,999 | 214,805 (78.0%) | 60,608 (22.0%) |
| $50,000 to $74,999 | 241,008 (82.3%) | 51,686 (17.7%) |
| $75,000 to $99,999 | 237,826 (86.5%) | 37,175 (13.5%) |
| $100,000 and over | 933,041 (93.2%) | 67,938 (6.8%) |
Public vs Private Health Insurance Coverage by Age in Area Code 470
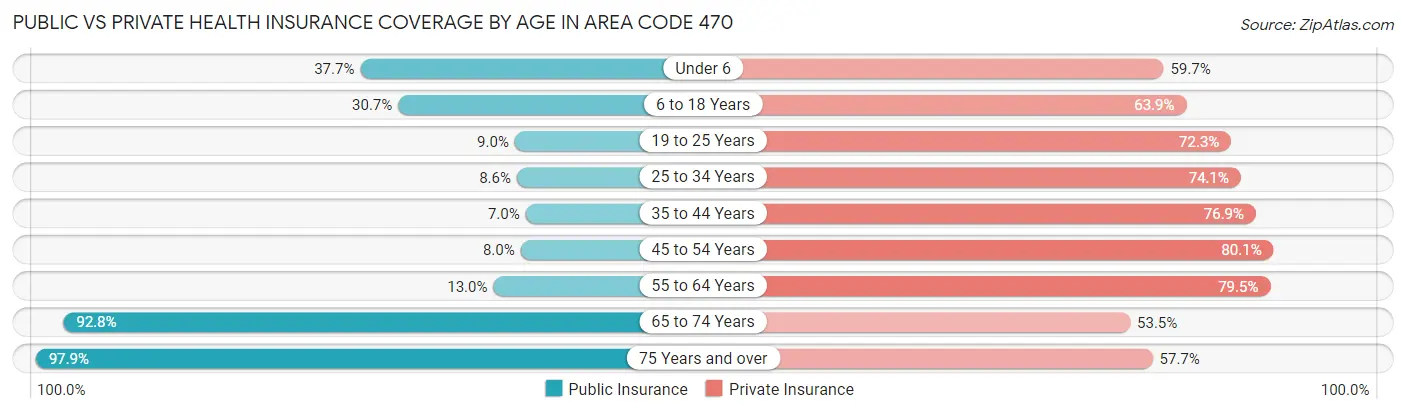
| Age Bracket | Public Insurance | Private Insurance |
| Under 6 | 55,848 (37.7%) | 88,449 (59.7%) |
| 6 to 18 Years | 113,608 (30.7%) | 236,873 (63.9%) |
| 19 to 25 Years | 17,122 (9.0%) | 137,161 (72.3%) |
| 25 to 34 Years | 22,082 (8.6%) | 189,361 (74.1%) |
| 35 to 44 Years | 19,885 (7.0%) | 217,857 (76.8%) |
| 45 to 54 Years | 22,721 (8.0%) | 228,860 (80.1%) |
| 55 to 64 Years | 31,266 (13.0%) | 191,107 (79.5%) |
| 65 to 74 Years | 150,244 (92.8%) | 86,646 (53.5%) |
| 75 Years and over | 96,972 (97.9%) | 57,131 (57.7%) |
| Total | 529,748 (26.0%) | 1,433,445 (70.5%) |
Disability Status by Sex by Age in Area Code 470
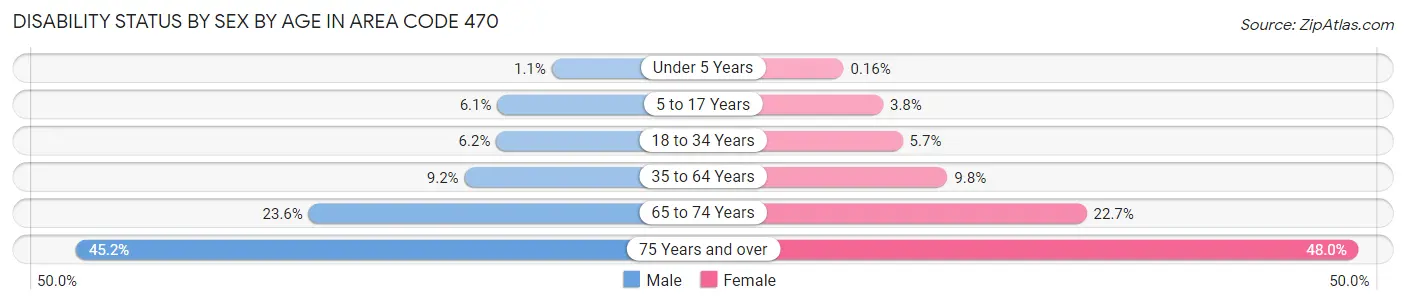
| Age Bracket | Male | Female |
| Under 5 Years | 682 (1.1%) | 99 (0.2%) |
| 5 to 17 Years | 11,356 (6.1%) | 6,907 (3.8%) |
| 18 to 34 Years | 14,664 (6.2%) | 13,572 (5.7%) |
| 35 to 64 Years | 36,469 (9.2%) | 40,403 (9.8%) |
| 65 to 74 Years | 17,566 (23.6%) | 19,904 (22.7%) |
| 75 Years and over | 18,105 (45.2%) | 28,291 (48.0%) |
Disability Class by Sex by Age in Area Code 470
Disability Class: Hearing Difficulty
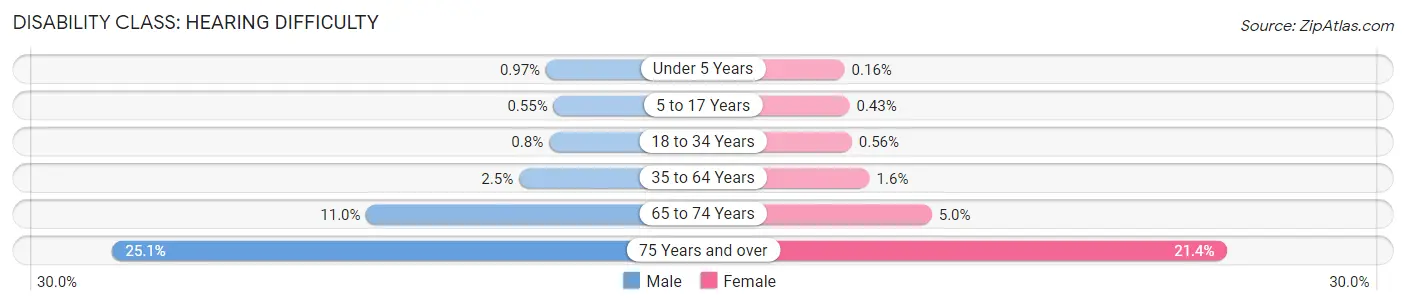
| Age Bracket | Male | Female |
| Under 5 Years | 603 (1.0%) | 99 (0.2%) |
| 5 to 17 Years | 1,022 (0.5%) | 777 (0.4%) |
| 18 to 34 Years | 1,873 (0.8%) | 1,336 (0.6%) |
| 35 to 64 Years | 9,790 (2.5%) | 6,387 (1.5%) |
| 65 to 74 Years | 8,152 (11.0%) | 4,387 (5.0%) |
| 75 Years and over | 10,051 (25.1%) | 12,632 (21.4%) |
Disability Class: Vision Difficulty
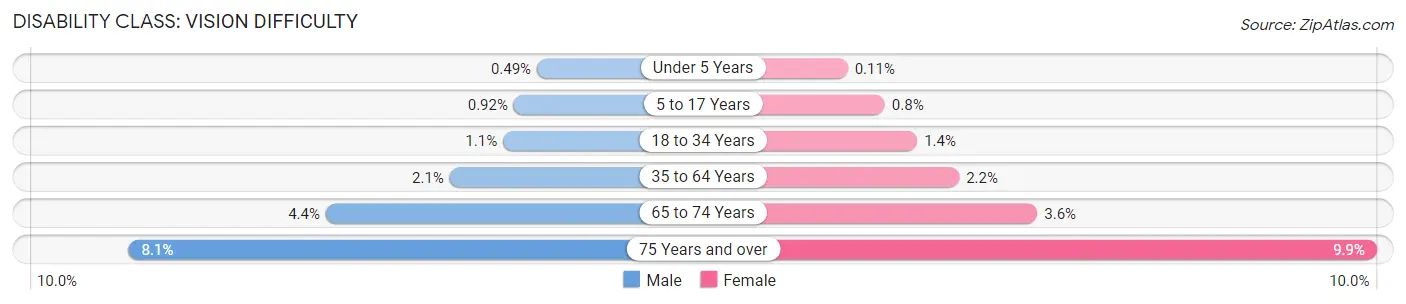
| Age Bracket | Male | Female |
| Under 5 Years | 306 (0.5%) | 64 (0.1%) |
| 5 to 17 Years | 1,708 (0.9%) | 1,446 (0.8%) |
| 18 to 34 Years | 2,639 (1.1%) | 3,363 (1.4%) |
| 35 to 64 Years | 8,369 (2.1%) | 8,998 (2.2%) |
| 65 to 74 Years | 3,280 (4.4%) | 3,178 (3.6%) |
| 75 Years and over | 3,231 (8.1%) | 5,856 (9.9%) |
Disability Class: Cognitive Difficulty
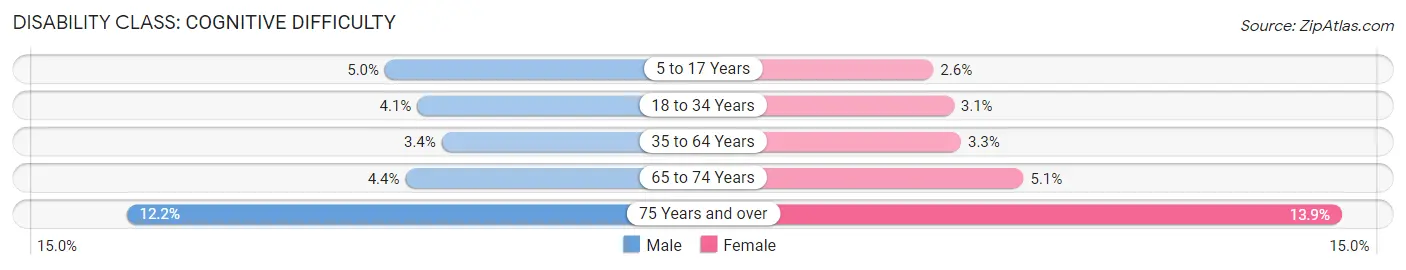
| Age Bracket | Male | Female |
| 5 to 17 Years | 9,199 (5.0%) | 4,604 (2.5%) |
| 18 to 34 Years | 9,583 (4.1%) | 7,500 (3.1%) |
| 35 to 64 Years | 13,469 (3.4%) | 13,677 (3.3%) |
| 65 to 74 Years | 3,266 (4.4%) | 4,435 (5.1%) |
| 75 Years and over | 4,869 (12.2%) | 8,214 (13.9%) |
Disability Class: Ambulatory Difficulty
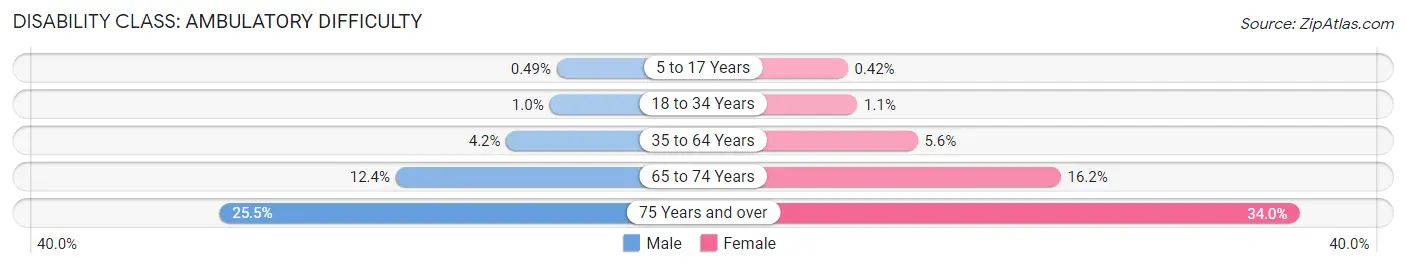
| Age Bracket | Male | Female |
| 5 to 17 Years | 899 (0.5%) | 749 (0.4%) |
| 18 to 34 Years | 2,415 (1.0%) | 2,743 (1.1%) |
| 35 to 64 Years | 16,812 (4.2%) | 23,177 (5.6%) |
| 65 to 74 Years | 9,240 (12.4%) | 14,225 (16.2%) |
| 75 Years and over | 10,224 (25.5%) | 20,042 (34.0%) |
Disability Class: Self-Care Difficulty
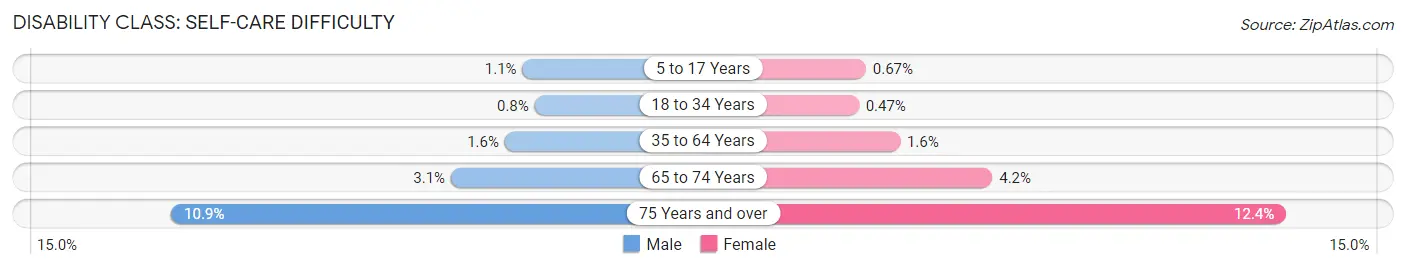
| Age Bracket | Male | Female |
| 5 to 17 Years | 2,105 (1.1%) | 1,211 (0.7%) |
| 18 to 34 Years | 1,885 (0.8%) | 1,139 (0.5%) |
| 35 to 64 Years | 6,476 (1.6%) | 6,679 (1.6%) |
| 65 to 74 Years | 2,329 (3.1%) | 3,672 (4.2%) |
| 75 Years and over | 4,371 (10.9%) | 7,299 (12.4%) |
Technology Access in Area Code 470
Computing Device Access in Area Code 470
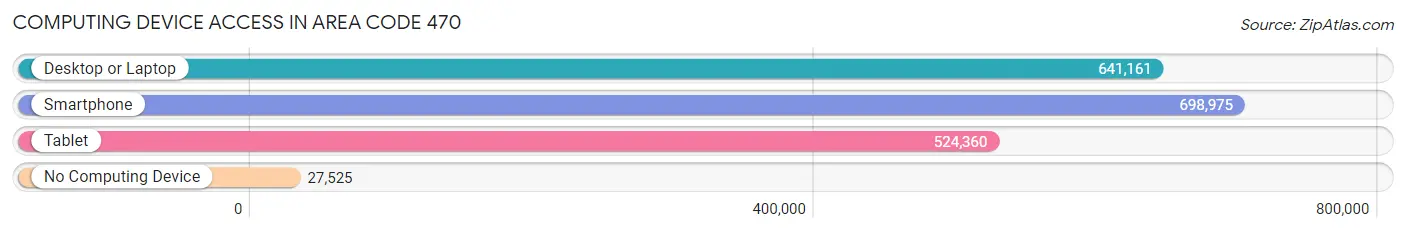
| Device Type | # Households | % Households |
| Desktop or Laptop | 641,161 | 84.9% |
| Smartphone | 698,975 | 92.6% |
| Tablet | 524,360 | 69.5% |
| No Computing Device | 27,525 | 3.6% |
| Total | 754,989 | 100.0% |
Internet Access in Area Code 470
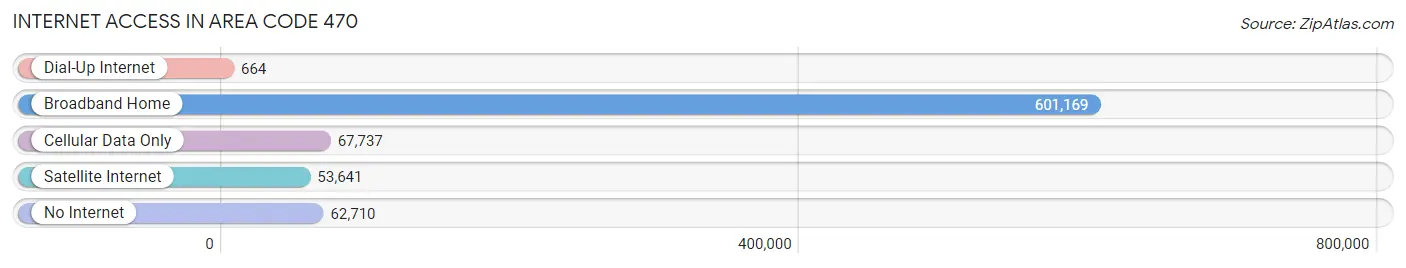
| Internet Type | # Households | % Households |
| Dial-Up Internet | 664 | 0.1% |
| Broadband Home | 601,169 | 79.6% |
| Cellular Data Only | 67,737 | 9.0% |
| Satellite Internet | 53,641 | 7.1% |
| No Internet | 62,710 | 8.3% |
| Total | 754,989 | 100.0% |
Area Code 470 Summary
Geography
Area code 470 is an overlay area code that covers the Atlanta metropolitan area in the state of Georgia. It was created in 2001 as an overlay to area code 404 and 678. It covers the counties of Fulton, DeKalb, Cobb, Gwinnett, Clayton, Douglas, and Henry.
Social
Area code 470 is a major metropolitan area, and is home to many of the state's largest cities, including Atlanta, Sandy Springs, Marietta, and Alpharetta. It is also home to many of the state's major universities, including Georgia Tech, Emory University, and Georgia State University.
Economics
Area code 470 is a major economic hub in the state of Georgia. It is home to many of the state's largest companies, including Coca-Cola, Delta Air Lines, Home Depot, and UPS. It is also home to many of the state's major financial institutions, including SunTrust Bank, Bank of America, and Wells Fargo.
Demographics
Area code 470 is home to a diverse population, with a population of over 5 million people. The population is made up of a variety of ethnic and racial backgrounds, including African American, Hispanic, Asian, and White. The median household income in the area is $60,000, and the median age is 34.
Common Questions
What is Per Capita Income in Area Code 470?
Per Capita income in Area Code 470 is $44,474.
What is the Median Family Income in Area Code 470?
Median Family Income in Area Code 470 is $104,890.
What is the Median Household income in Area Code 470?
Median Household Income in Area Code 470 is $84,585.
What is Income or Wage Gap in Area Code 470?
Income or Wage Gap in Area Code 470 is 26.5%.
Women in Area Code 470 earn 73.5 cents for every dollar earned by a man.
What is Family Income Deficit in Area Code 470?
Family Income Deficit in Area Code 470 is $11,219.
Families that are below poverty line in Area Code 470 earn $11,219 less on average than the poverty threshold level.
What is Inequality or Gini Index in Area Code 470?
Inequality or Gini Index in Area Code 470 is 27.27.
What is the Total Population of Area Code 470?
Total Population of Area Code 470 is 2,053,607.
What is the Total Male Population of Area Code 470?
Total Male Population of Area Code 470 is 1,008,120.
What is the Total Female Population of Area Code 470?
Total Female Population of Area Code 470 is 1,045,487.
What is the Ratio of Males per 100 Females in Area Code 470?
There are 96.43 Males per 100 Females in Area Code 470.
What is the Ratio of Females per 100 Males in Area Code 470?
There are 103.71 Females per 100 Males in Area Code 470.
What is the Median Population Age in Area Code 470?
Median Population Age in Area Code 470 is 36.9 Years.
What is the Average Family Size in Area Code 470
Average Family Size in Area Code 470 is 3.2 People.
What is the Average Household Size in Area Code 470
Average Household Size in Area Code 470 is 2.6 People.
How Large is the Labor Force in Area Code 470?
There are 1,066,751 People in the Labor Forcein in Area Code 470.
What is the Percentage of People in the Labor Force in Area Code 470?
65.7% of People are in the Labor Force in Area Code 470.
What is the Unemployment Rate in Area Code 470?
Unemployment Rate in Area Code 470 is 4.2%.