Area Code 229 Map & Demographics
Area Code 229 Map
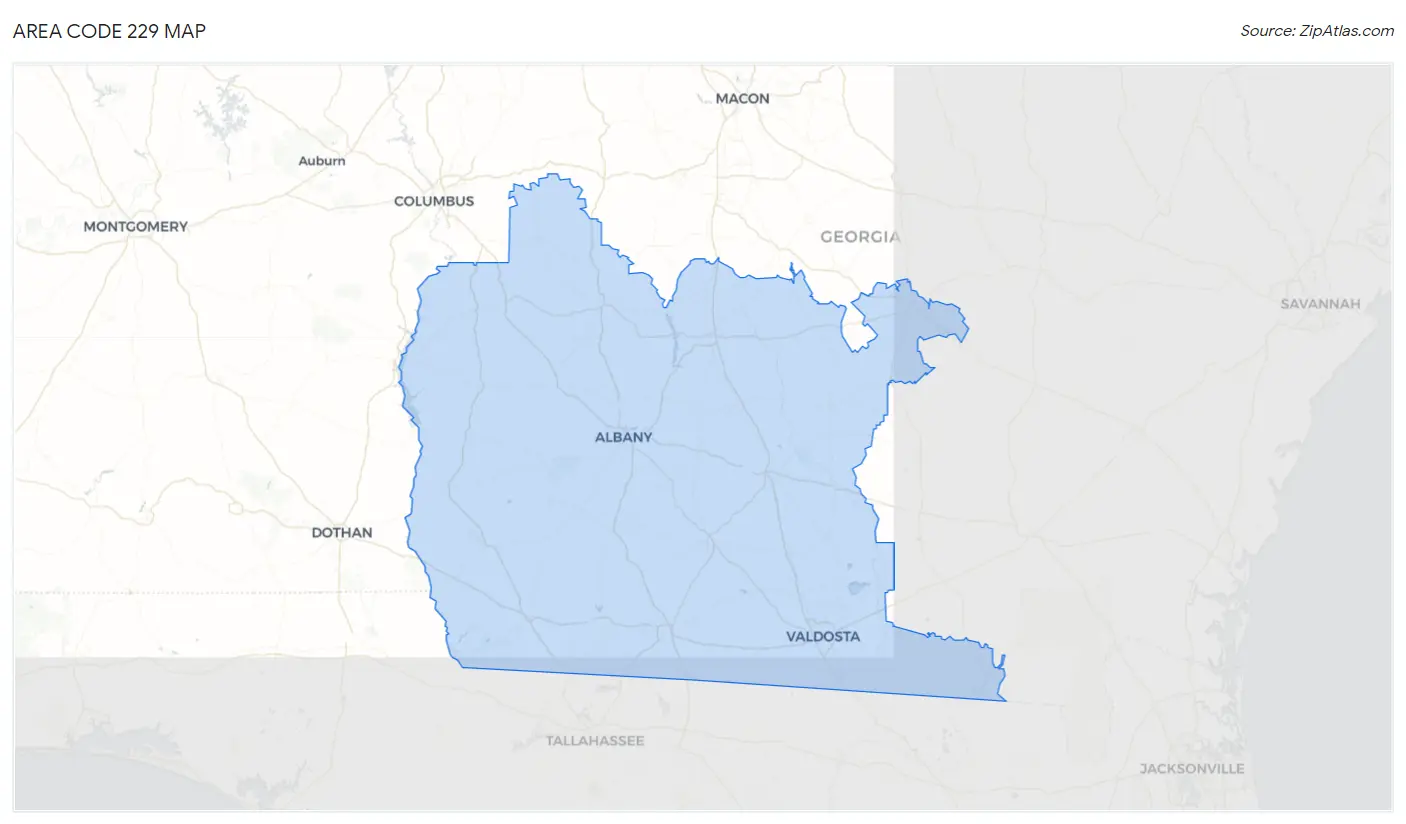
Area Code 229 Overview
$26,273
PER CAPITA INCOME
$61,551
AVG FAMILY INCOME
$49,269
AVG HOUSEHOLD INCOME
26.5%
WAGE / INCOME GAP [ % ]
73.5¢/ $1
WAGE / INCOME GAP [ $ ]
$11,443
FAMILY INCOME DEFICIT
52.75
INEQUALITY / GINI INDEX
709,242
TOTAL POPULATION
347,979
MALE POPULATION
361,263
FEMALE POPULATION
96.32
MALES / 100 FEMALES
103.82
FEMALES / 100 MALES
41.1
MEDIAN AGE
3.2
AVG FAMILY SIZE
2.6
AVG HOUSEHOLD SIZE
305,256
LABOR FORCE [ PEOPLE ]
54.5%
PERCENT IN LABOR FORCE
6.2%
UNEMPLOYMENT RATE
Income in Area Code 229
Income Overview in Area Code 229
Per Capita Income in Area Code 229 is $26,273, while median incomes of families and households are $61,551 and $49,269 respectively.
| Characteristic | Number | Measure |
| Per Capita Income | 709,242 | $26,273 |
| Median Family Income | 171,347 | $61,551 |
| Mean Family Income | 171,347 | $8,831,027 |
| Median Household Income | 264,263 | $49,269 |
| Mean Household Income | 264,263 | $7,579,411 |
| Income Deficit | 171,347 | $11,443 |
| Wage / Income Gap (%) | 709,242 | 26.48% |
| Wage / Income Gap ($) | 709,242 | 73.52¢ per $1 |
| Gini / Inequality Index | 709,242 | 52.75 |
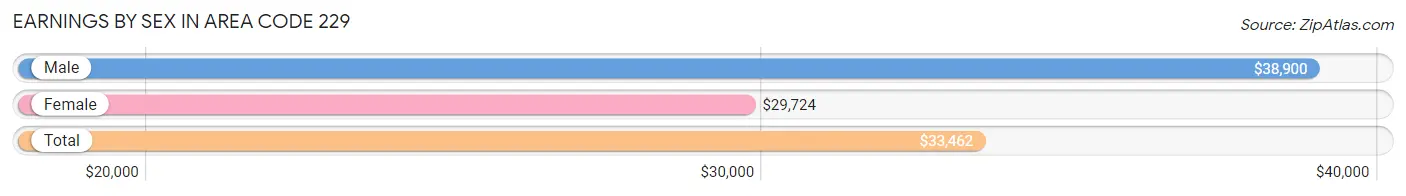
Earnings by Sex in Area Code 229
Average Earnings in Area Code 229 are $33,462, $38,900 for men and $29,724 for women, a difference of 23.6%.
| Sex | Number | Average Earnings |
| Male | 168,011 (51.5%) | $38,900 |
| Female | 158,247 (48.5%) | $29,724 |
| Total | 326,258 (100.0%) | $33,462 |
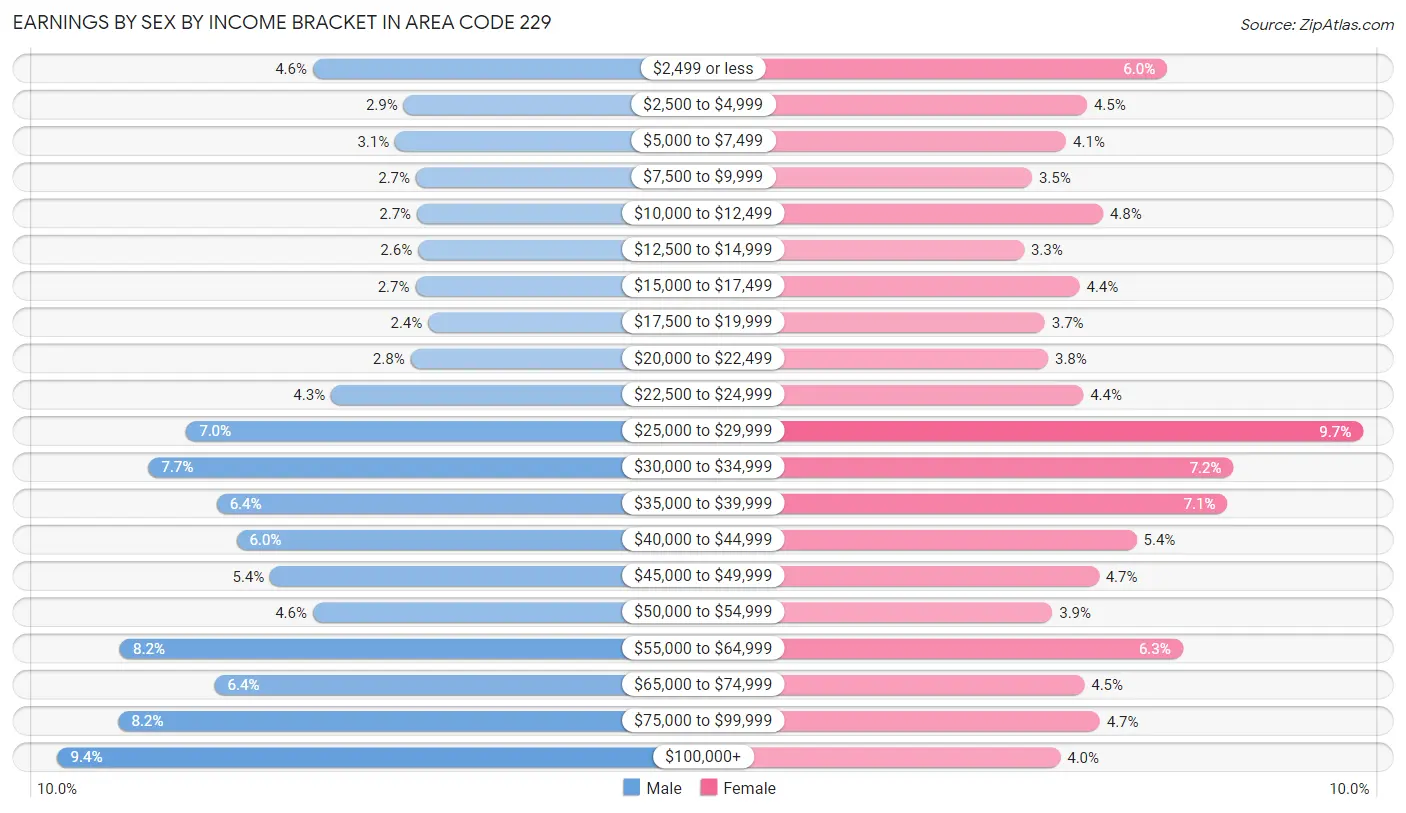
Earnings by Sex by Income Bracket in Area Code 229
The most common earnings brackets in Area Code 229 are $100,000+ for men (15,755 | 9.4%) and $25,000 to $29,999 for women (15,296 | 9.7%).
| Income | Male | Female |
| $2,499 or less | 7,729 (4.6%) | 9,498 (6.0%) |
| $2,500 to $4,999 | 4,876 (2.9%) | 7,124 (4.5%) |
| $5,000 to $7,499 | 5,136 (3.1%) | 6,508 (4.1%) |
| $7,500 to $9,999 | 4,484 (2.7%) | 5,490 (3.5%) |
| $10,000 to $12,499 | 4,457 (2.6%) | 7,590 (4.8%) |
| $12,500 to $14,999 | 4,414 (2.6%) | 5,256 (3.3%) |
| $15,000 to $17,499 | 4,495 (2.7%) | 6,907 (4.4%) |
| $17,500 to $19,999 | 4,104 (2.4%) | 5,871 (3.7%) |
| $20,000 to $22,499 | 4,651 (2.8%) | 5,960 (3.8%) |
| $22,500 to $24,999 | 7,154 (4.3%) | 7,005 (4.4%) |
| $25,000 to $29,999 | 11,717 (7.0%) | 15,296 (9.7%) |
| $30,000 to $34,999 | 12,899 (7.7%) | 11,462 (7.2%) |
| $35,000 to $39,999 | 10,747 (6.4%) | 11,290 (7.1%) |
| $40,000 to $44,999 | 10,127 (6.0%) | 8,589 (5.4%) |
| $45,000 to $49,999 | 9,071 (5.4%) | 7,472 (4.7%) |
| $50,000 to $54,999 | 7,735 (4.6%) | 6,096 (3.8%) |
| $55,000 to $64,999 | 13,795 (8.2%) | 9,952 (6.3%) |
| $65,000 to $74,999 | 10,818 (6.4%) | 7,043 (4.4%) |
| $75,000 to $99,999 | 13,847 (8.2%) | 7,507 (4.7%) |
| $100,000+ | 15,755 (9.4%) | 6,331 (4.0%) |
| Total | 168,011 (100.0%) | 158,247 (100.0%) |
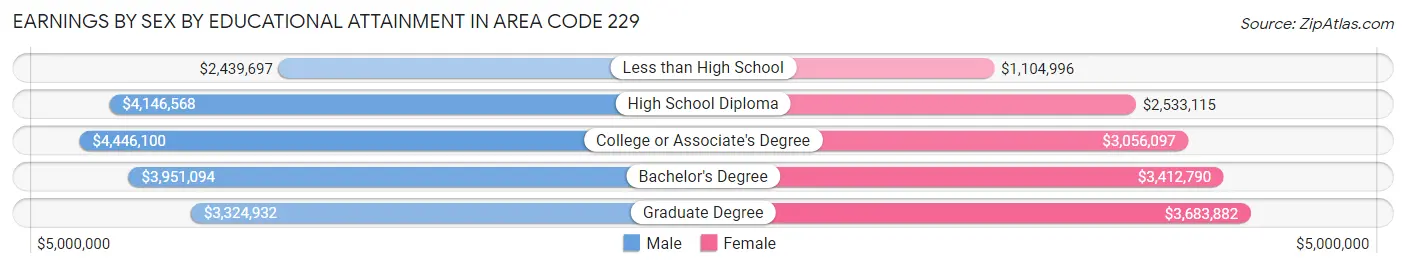
Earnings by Sex by Educational Attainment in Area Code 229
Average earnings in Area Code 229 are $4,852,864 for men and $3,462,315 for women, a difference of 28.6%. Men with an educational attainment of college or associate's degree enjoy the highest average annual earnings of $4,446,100, while those with less than high school education earn the least with $2,439,697. Women with an educational attainment of graduate degree earn the most with the average annual earnings of $3,683,882, while those with less than high school education have the smallest earnings of $1,104,996.
| Educational Attainment | Male Income | Female Income |
| Less than High School | $2,439,697 | $1,104,996 |
| High School Diploma | $4,146,568 | $2,533,115 |
| College or Associate's Degree | $4,446,100 | $3,056,097 |
| Bachelor's Degree | $3,951,094 | $3,412,790 |
| Graduate Degree | $3,324,932 | $3,683,882 |
| Total | $4,852,864 | $3,462,315 |
Family Income in Area Code 229
Family Income Brackets in Area Code 229
According to the Area Code 229 family income data, there are 3,436,535 families falling into the $50,000 to $74,999 income range, which is the most common income bracket and makes up 2,005.6% of all families. Conversely, the $10,000 to $14,999 income bracket is the least frequent group with only 716,059 families (417.9%) belonging to this category.
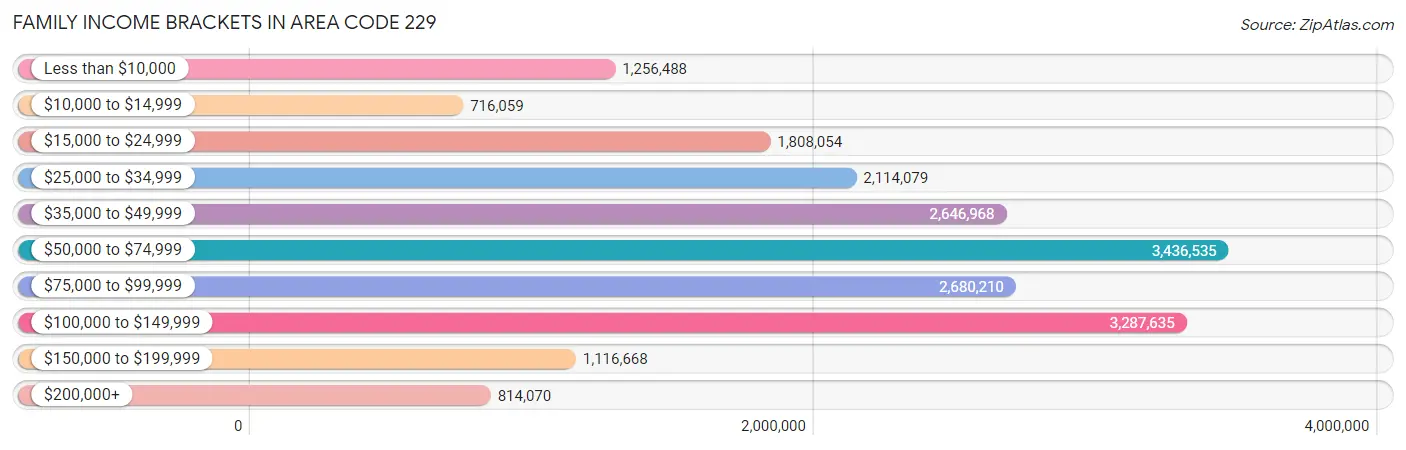
| Income Bracket | # Families | % Families |
| Less than $10,000 | 1,256,488 | 733.3% |
| $10,000 to $14,999 | 716,059 | 417.9% |
| $15,000 to $24,999 | 1,808,054 | 1,055.2% |
| $25,000 to $34,999 | 2,114,079 | 1,233.8% |
| $35,000 to $49,999 | 2,646,968 | 1,544.8% |
| $50,000 to $74,999 | 3,436,535 | 2,005.6% |
| $75,000 to $99,999 | 2,680,210 | 1,564.2% |
| $100,000 to $149,999 | 3,287,635 | 1,918.7% |
| $150,000 to $199,999 | 1,116,668 | 651.7% |
| $200,000+ | 814,070 | 475.1% |
Family Income by Famaliy Size in Area Code 229
7+ person families (2,374 | 1.4%) account for the highest median family income in Area Code 229 with $99,381 per family, while 2-person families (82,624 | 48.2%) have the highest median income of $29,317 per family member.
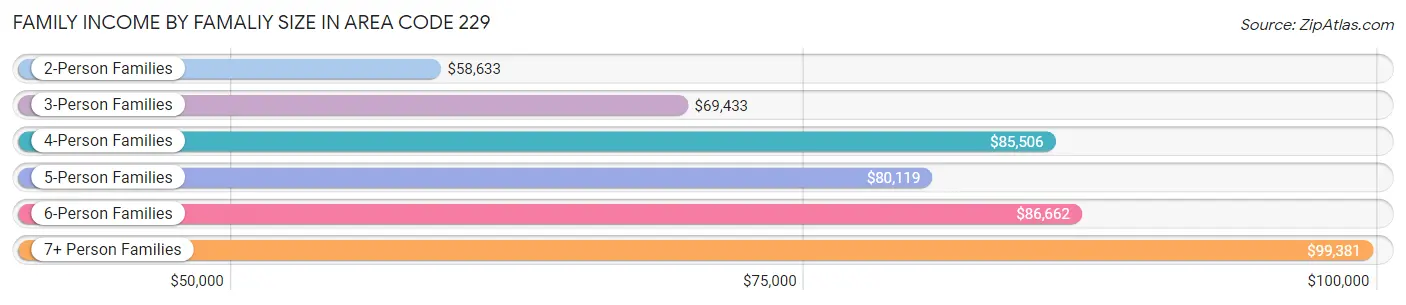
| Income Bracket | # Families | Median Income |
| 2-Person Families | 82,624 (48.2%) | $58,633 |
| 3-Person Families | 40,838 (23.8%) | $69,433 |
| 4-Person Families | 27,524 (16.1%) | $85,506 |
| 5-Person Families | 13,220 (7.7%) | $80,119 |
| 6-Person Families | 4,767 (2.8%) | $86,662 |
| 7+ Person Families | 2,374 (1.4%) | $99,381 |
| Total | 171,347 (100.0%) | $61,551 |
Family Income by Number of Earners in Area Code 229
The median family income in Area Code 229 is $61,551, with families comprising 3+ earners (12,697) having the highest median family income of $116,060, while families with no earners (32,963) have the lowest median family income of $30,779, accounting for 7.4% and 19.2% of families, respectively.
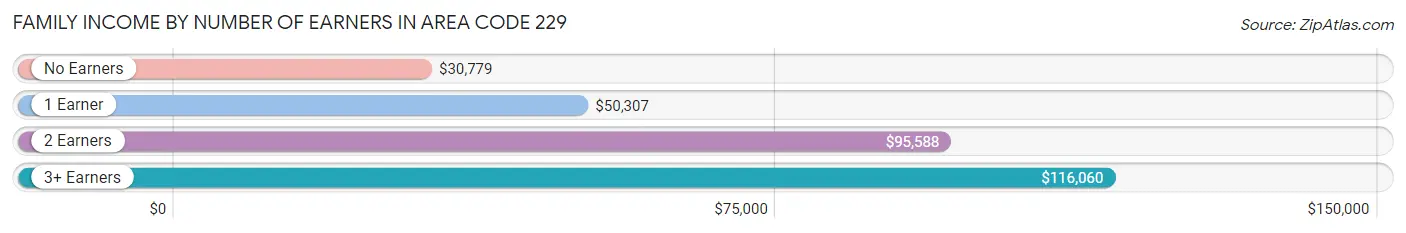
| Number of Earners | # Families | Median Income |
| No Earners | 32,963 (19.2%) | $30,779 |
| 1 Earner | 63,554 (37.1%) | $50,307 |
| 2 Earners | 62,133 (36.3%) | $95,588 |
| 3+ Earners | 12,697 (7.4%) | $116,060 |
| Total | 171,347 (100.0%) | $61,551 |
Household Income in Area Code 229
Household Income Brackets in Area Code 229
With 4,934,847 households falling in the category, the $50,000 to $74,999 income range is the most frequent in Area Code 229, accounting for 1,867.4% of all households. In contrast, only 946,590 households (358.2%) fall into the $200,000+ income bracket, making it the least populous group.
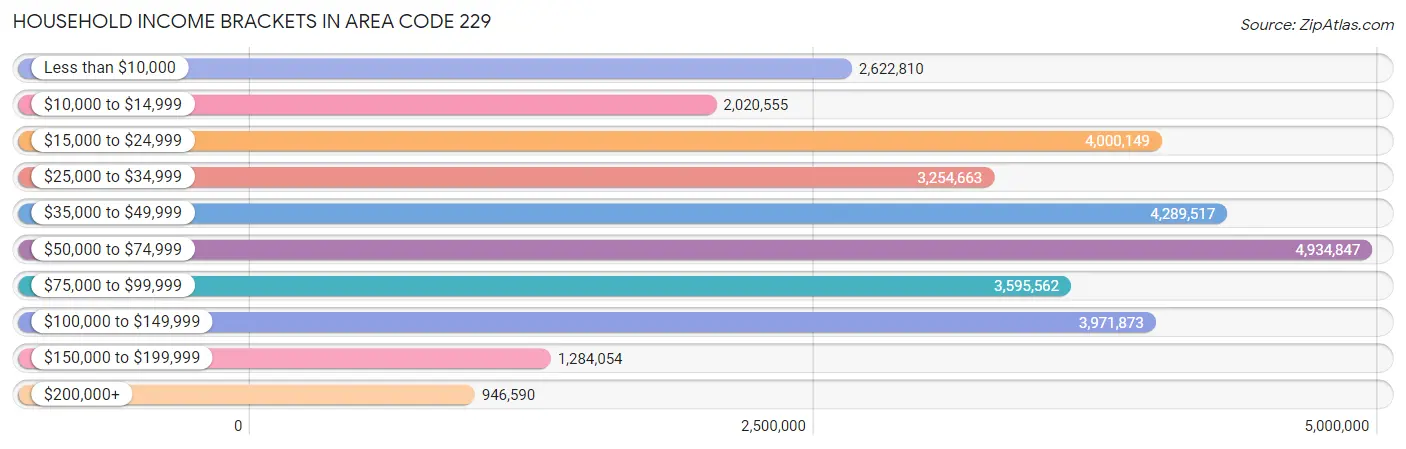
| Income Bracket | # Households | % Households |
| Less than $10,000 | 2,622,810 | 992.5% |
| $10,000 to $14,999 | 2,020,555 | 764.6% |
| $15,000 to $24,999 | 4,000,149 | 1,513.7% |
| $25,000 to $34,999 | 3,254,663 | 1,231.6% |
| $35,000 to $49,999 | 4,289,517 | 1,623.2% |
| $50,000 to $74,999 | 4,934,847 | 1,867.4% |
| $75,000 to $99,999 | 3,595,562 | 1,360.6% |
| $100,000 to $149,999 | 3,971,873 | 1,503.0% |
| $150,000 to $199,999 | 1,284,054 | 485.9% |
| $200,000+ | 946,590 | 358.2% |
Household Income by Householder Age in Area Code 229
The median household income in Area Code 229 is $49,269, with the highest median household income of $63,346 found in the 45 to 64 years age bracket for the primary householder. A total of 93,588 households (35.4%) fall into this category. Meanwhile, the 65+ years age bracket for the primary householder has the lowest median household income of $37,344, with 74,463 households (28.2%) in this group.
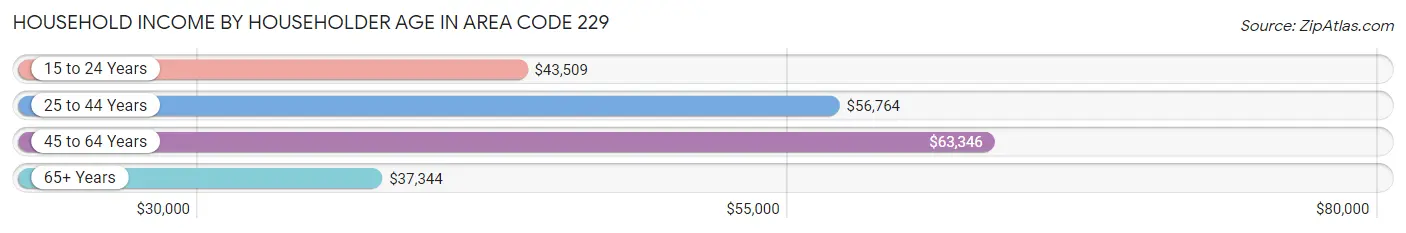
| Income Bracket | # Households | Median Income |
| 15 to 24 Years | 13,880 (5.2%) | $43,509 |
| 25 to 44 Years | 82,332 (31.2%) | $56,764 |
| 45 to 64 Years | 93,588 (35.4%) | $63,346 |
| 65+ Years | 74,463 (28.2%) | $37,344 |
| Total | 264,263 (100.0%) | $49,269 |
Poverty in Area Code 229
Income Below Poverty by Sex and Age in Area Code 229
With 20.3% poverty level for males and 24.5% for females among the residents of Area Code 229, 5 year old males and 5 year old females are the most vulnerable to poverty, with 1,828 males (39.5%) and 1,491 females (37.6%) in their respective age groups living below the poverty level.
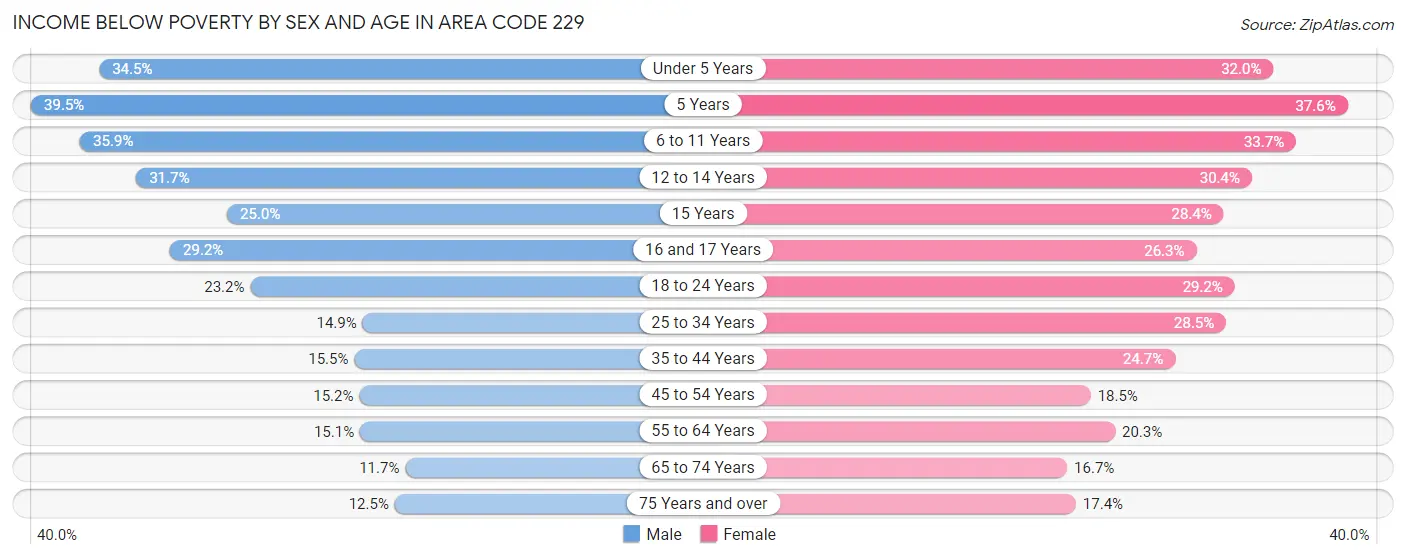
| Age Bracket | Male | Female |
| Under 5 Years | 7,665 (34.5%) | 6,616 (32.0%) |
| 5 Years | 1,828 (39.5%) | 1,491 (37.6%) |
| 6 to 11 Years | 10,180 (35.9%) | 9,416 (33.7%) |
| 12 to 14 Years | 4,950 (31.7%) | 4,157 (30.4%) |
| 15 Years | 1,297 (25.0%) | 1,388 (28.3%) |
| 16 and 17 Years | 2,845 (29.2%) | 2,355 (26.3%) |
| 18 to 24 Years | 7,897 (23.2%) | 9,889 (29.2%) |
| 25 to 34 Years | 5,950 (14.9%) | 12,603 (28.5%) |
| 35 to 44 Years | 6,188 (15.5%) | 10,885 (24.7%) |
| 45 to 54 Years | 5,812 (15.1%) | 7,708 (18.5%) |
| 55 to 64 Years | 6,066 (15.1%) | 9,252 (20.3%) |
| 65 to 74 Years | 3,716 (11.7%) | 6,229 (16.7%) |
| 75 Years and over | 2,235 (12.5%) | 4,704 (17.4%) |
| Total | 66,629 (20.3%) | 86,693 (24.5%) |
Income Above Poverty by Sex and Age in Area Code 229
According to the poverty statistics in Area Code 229, males aged 65 to 74 years and females aged 65 to 74 years are the age groups that are most secure financially, with 88.3% of males and 83.3% of females in these age groups living above the poverty line.
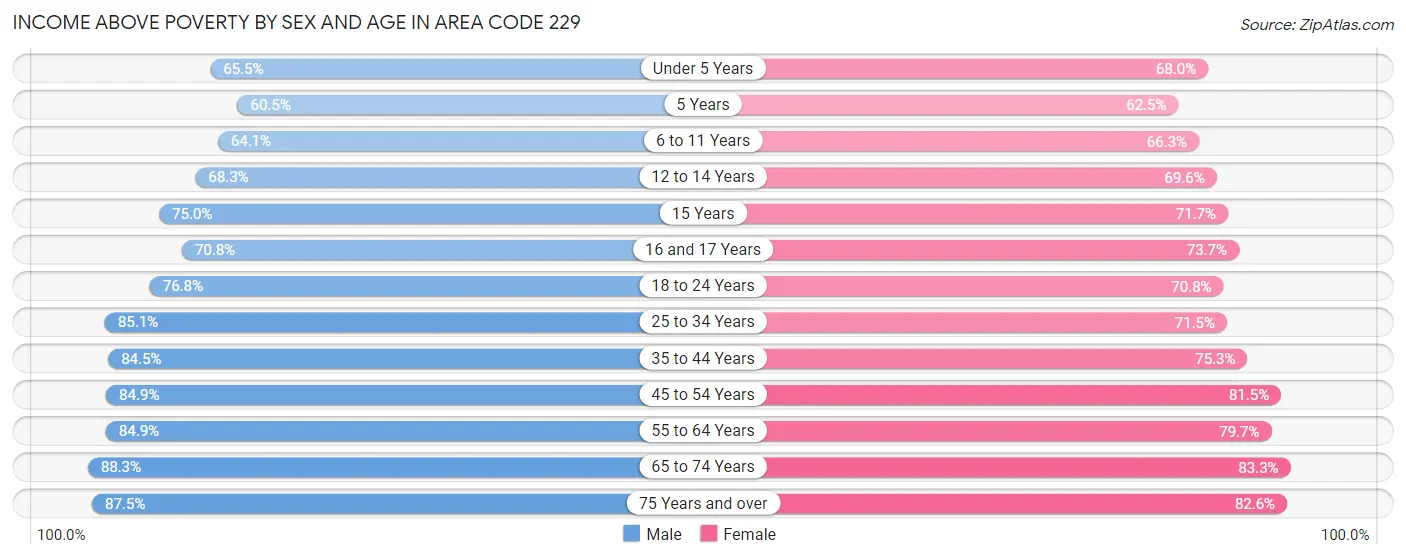
| Age Bracket | Male | Female |
| Under 5 Years | 14,576 (65.5%) | 14,037 (68.0%) |
| 5 Years | 2,796 (60.5%) | 2,480 (62.5%) |
| 6 to 11 Years | 18,195 (64.1%) | 18,510 (66.3%) |
| 12 to 14 Years | 10,659 (68.3%) | 9,501 (69.6%) |
| 15 Years | 3,898 (75.0%) | 3,508 (71.7%) |
| 16 and 17 Years | 6,896 (70.8%) | 6,591 (73.7%) |
| 18 to 24 Years | 26,076 (76.8%) | 24,012 (70.8%) |
| 25 to 34 Years | 33,969 (85.1%) | 31,564 (71.5%) |
| 35 to 44 Years | 33,682 (84.5%) | 33,116 (75.3%) |
| 45 to 54 Years | 32,547 (84.9%) | 34,001 (81.5%) |
| 55 to 64 Years | 34,109 (84.9%) | 36,356 (79.7%) |
| 65 to 74 Years | 27,927 (88.3%) | 31,003 (83.3%) |
| 75 Years and over | 15,613 (87.5%) | 22,354 (82.6%) |
| Total | 260,943 (79.7%) | 267,033 (75.5%) |
Income Below Poverty Among Married-Couple Families in Area Code 229
The poverty statistics for married-couple families in Area Code 229 show that 7.9% or 8,574 of the total 108,393 families live below the poverty line. Families with 5 or more children have the highest poverty rate of 29.9%, comprising of 184 families. On the other hand, families with no children have the lowest poverty rate of 6.1%, which includes 4,110 families.
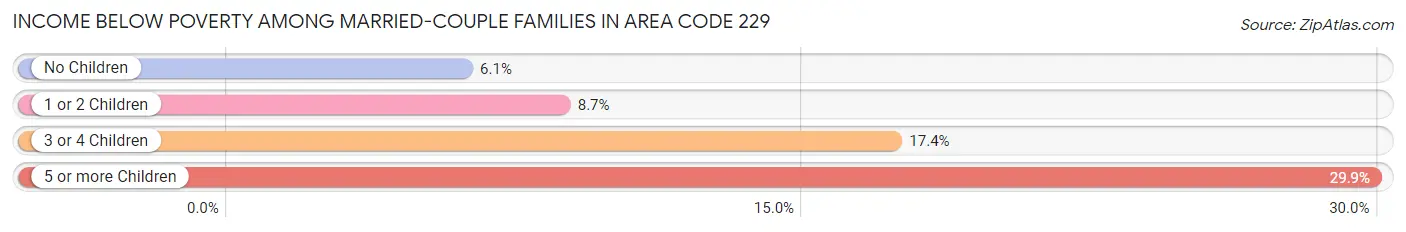
| Children | Above Poverty | Below Poverty |
| No Children | 62,808 (93.9%) | 4,110 (6.1%) |
| 1 or 2 Children | 29,619 (91.3%) | 2,819 (8.7%) |
| 3 or 4 Children | 6,960 (82.7%) | 1,461 (17.3%) |
| 5 or more Children | 432 (70.1%) | 184 (29.9%) |
| Total | 99,819 (92.1%) | 8,574 (7.9%) |
Income Below Poverty Among Single-Parent Households in Area Code 229
According to the poverty data in Area Code 229, 22.6% or 3,170 single-father households and 37.2% or 18,207 single-mother households are living below the poverty line. Among single-father households, those with 5 or more children have the highest poverty rate, with 265 households (97.8%) experiencing poverty. Likewise, among single-mother households, those with 5 or more children have the highest poverty rate, with 611 households (91.1%) falling below the poverty line.
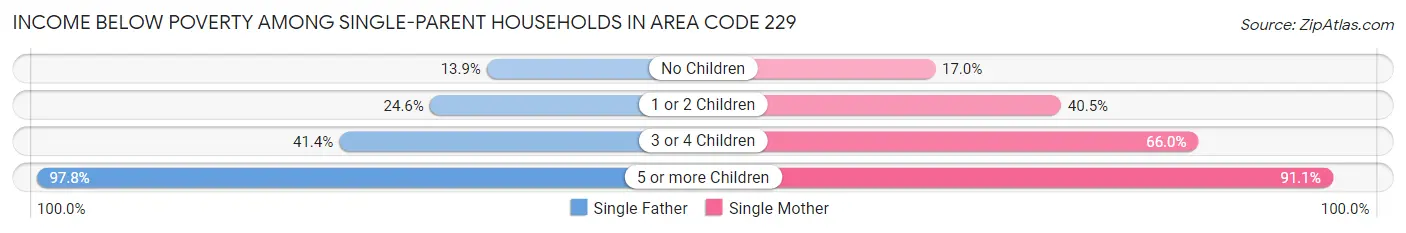
| Children | Single Father | Single Mother |
| No Children | 844 (13.9%) | 2,704 (17.0%) |
| 1 or 2 Children | 1,631 (24.6%) | 10,279 (40.5%) |
| 3 or 4 Children | 430 (41.4%) | 4,613 (66.0%) |
| 5 or more Children | 265 (97.8%) | 611 (91.1%) |
| Total | 3,170 (22.6%) | 18,207 (37.2%) |
Income Below Poverty Among Married-Couple vs Single-Parent Households in Area Code 229
The poverty data for Area Code 229 shows that 8,574 of the married-couple family households (7.9%) and 21,377 of the single-parent households (34.0%) are living below the poverty level. Within the married-couple family households, those with 5 or more children have the highest poverty rate, with 184 households (29.9%) falling below the poverty line. Among the single-parent households, those with 5 or more children have the highest poverty rate, with 876 household (93.0%) living below poverty.
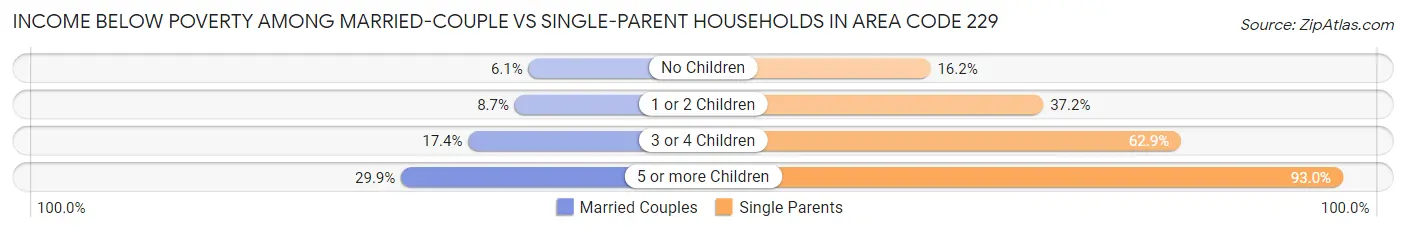
| Children | Married-Couple Families | Single-Parent Households |
| No Children | 4,110 (6.1%) | 3,548 (16.2%) |
| 1 or 2 Children | 2,819 (8.7%) | 11,910 (37.2%) |
| 3 or 4 Children | 1,461 (17.3%) | 5,043 (62.9%) |
| 5 or more Children | 184 (29.9%) | 876 (93.0%) |
| Total | 8,574 (7.9%) | 21,377 (34.0%) |
Race in Area Code 229
The most populous races in Area Code 229 are White / Caucasian (374,446 | 52.8%), Black / African American (277,751 | 39.2%), and Hispanic or Latino (49,683 | 7.0%).
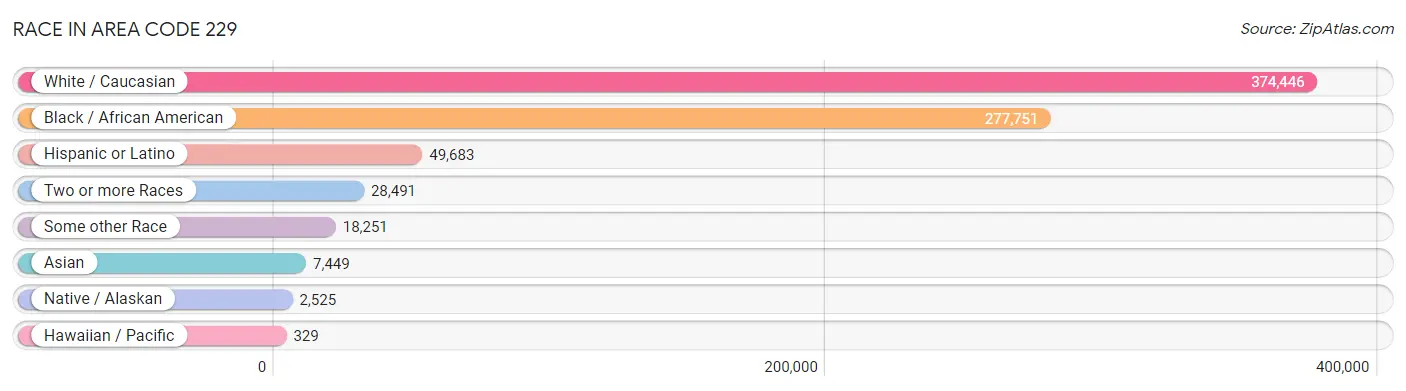
| Race | # Population | % Population |
| Asian | 7,449 | 1.1% |
| Black / African American | 277,751 | 39.2% |
| Hawaiian / Pacific | 329 | 0.1% |
| Hispanic or Latino | 49,683 | 7.0% |
| Native / Alaskan | 2,525 | 0.4% |
| White / Caucasian | 374,446 | 52.8% |
| Two or more Races | 28,491 | 4.0% |
| Some other Race | 18,251 | 2.6% |
| Total | 709,242 | 100.0% |
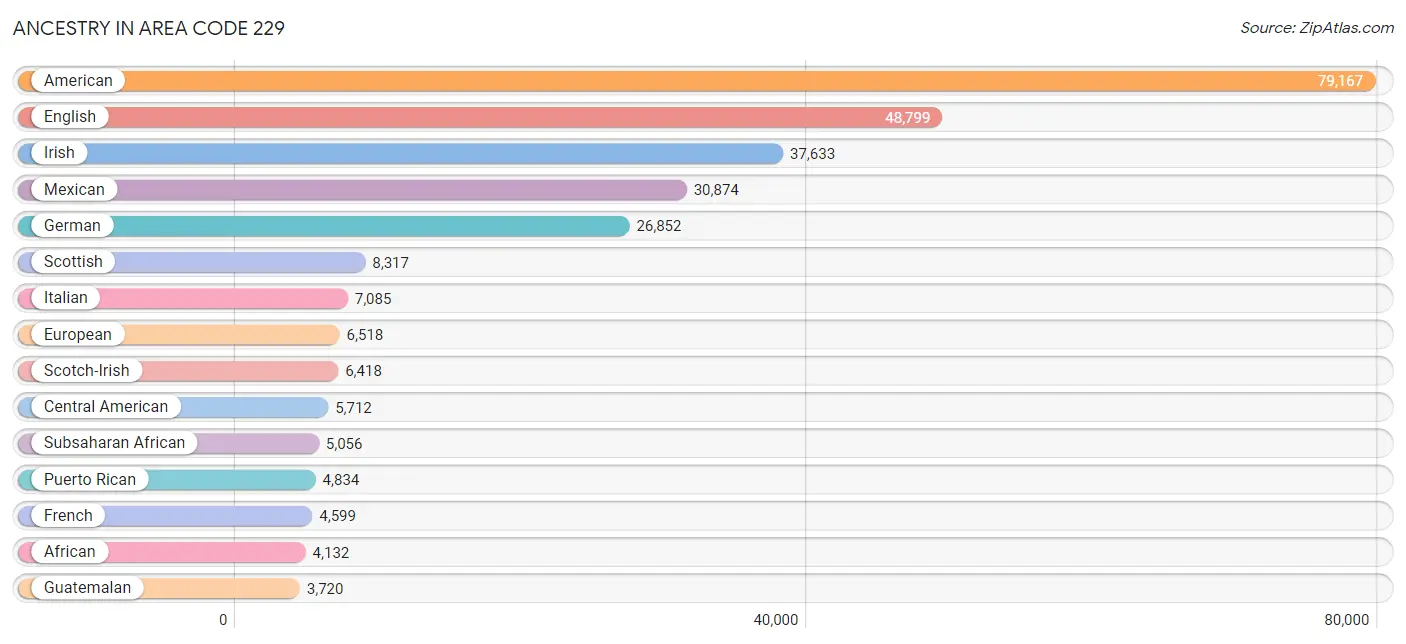
Ancestry in Area Code 229
The most populous ancestries reported in Area Code 229 are American (79,167 | 11.2%), English (48,799 | 6.9%), Irish (37,633 | 5.3%), Mexican (30,874 | 4.3%), and German (26,852 | 3.8%), together accounting for 31.5% of all Area Code 229 residents.
| Ancestry | # Population | % Population |
| Afghan | 24 | 0.0% |
| African | 4,132 | 0.6% |
| Alaska Native | 9 | 0.0% |
| Alaskan Athabascan | 10 | 0.0% |
| American | 79,167 | 11.2% |
| Apache | 206 | 0.0% |
| Arab | 774 | 0.1% |
| Arapaho | 7 | 0.0% |
| Argentinean | 46 | 0.0% |
| Armenian | 39 | 0.0% |
| Australian | 199 | 0.0% |
| Austrian | 273 | 0.0% |
| Bahamian | 313 | 0.0% |
| Barbadian | 25 | 0.0% |
| Belgian | 56 | 0.0% |
| Belizean | 34 | 0.0% |
| Bhutanese | 1,072 | 0.2% |
| Blackfeet | 93 | 0.0% |
| Bolivian | 14 | 0.0% |
| Brazilian | 204 | 0.0% |
| British | 1,879 | 0.3% |
| British West Indian | 71 | 0.0% |
| Burmese | 1,146 | 0.2% |
| Cajun | 94 | 0.0% |
| Canadian | 508 | 0.1% |
| Celtic | 141 | 0.0% |
| Central American | 5,712 | 0.8% |
| Central American Indian | 501 | 0.1% |
| Cherokee | 2,366 | 0.3% |
| Chickasaw | 3 | 0.0% |
| Chilean | 98 | 0.0% |
| Chinese | 17 | 0.0% |
| Chippewa | 52 | 0.0% |
| Choctaw | 147 | 0.0% |
| Colombian | 716 | 0.1% |
| Colville | 7 | 0.0% |
| Costa Rican | 41 | 0.0% |
| Cree | 26 | 0.0% |
| Creek | 444 | 0.1% |
| Croatian | 102 | 0.0% |
| Crow | 59 | 0.0% |
| Cuban | 2,262 | 0.3% |
| Czech | 292 | 0.0% |
| Czechoslovakian | 38 | 0.0% |
| Danish | 325 | 0.1% |
| Dominican | 853 | 0.1% |
| Dutch | 2,786 | 0.4% |
| Dutch West Indian | 19 | 0.0% |
| Eastern European | 612 | 0.1% |
| Ecuadorian | 185 | 0.0% |
| Egyptian | 51 | 0.0% |
| English | 48,799 | 6.9% |
| Ethiopian | 263 | 0.0% |
| European | 6,518 | 0.9% |
| Filipino | 21 | 0.0% |
| Finnish | 153 | 0.0% |
| French | 4,599 | 0.6% |
| French American Indian | 50 | 0.0% |
| French Canadian | 753 | 0.1% |
| German | 26,852 | 3.8% |
| Ghanaian | 130 | 0.0% |
| Greek | 620 | 0.1% |
| Guamanian / Chamorro | 82 | 0.0% |
| Guatemalan | 3,720 | 0.5% |
| Guyanese | 122 | 0.0% |
| Haitian | 1,321 | 0.2% |
| Honduran | 1,044 | 0.2% |
| Hopi | 13 | 0.0% |
| Hungarian | 629 | 0.1% |
| Icelander | 40 | 0.0% |
| Indian (Asian) | 1,396 | 0.2% |
| Indonesian | 179 | 0.0% |
| Iranian | 41 | 0.0% |
| Iraqi | 23 | 0.0% |
| Irish | 37,633 | 5.3% |
| Iroquois | 34 | 0.0% |
| Israeli | 136 | 0.0% |
| Italian | 7,085 | 1.0% |
| Jamaican | 660 | 0.1% |
| Japanese | 4 | 0.0% |
| Kenyan | 52 | 0.0% |
| Korean | 3,035 | 0.4% |
| Laotian | 6 | 0.0% |
| Latvian | 14 | 0.0% |
| Lebanese | 462 | 0.1% |
| Lithuanian | 167 | 0.0% |
| Lumbee | 260 | 0.0% |
| Malaysian | 44 | 0.0% |
| Menominee | 18 | 0.0% |
| Mexican | 30,874 | 4.3% |
| Mexican American Indian | 297 | 0.0% |
| Moroccan | 146 | 0.0% |
| Native Hawaiian | 422 | 0.1% |
| Navajo | 40 | 0.0% |
| New Zealander | 18 | 0.0% |
| Nicaraguan | 176 | 0.0% |
| Nigerian | 358 | 0.1% |
| Northern European | 326 | 0.1% |
| Norwegian | 1,161 | 0.2% |
| Pakistani | 361 | 0.1% |
| Palestinian | 2 | 0.0% |
| Panamanian | 160 | 0.0% |
| Pennsylvania German | 166 | 0.0% |
| Peruvian | 272 | 0.0% |
| Polish | 2,870 | 0.4% |
| Portuguese | 375 | 0.1% |
| Potawatomi | 4 | 0.0% |
| Puerto Rican | 4,834 | 0.7% |
| Romanian | 353 | 0.1% |
| Russian | 530 | 0.1% |
| Salvadoran | 571 | 0.1% |
| Samoan | 88 | 0.0% |
| Scandinavian | 986 | 0.1% |
| Scotch-Irish | 6,418 | 0.9% |
| Scottish | 8,317 | 1.2% |
| Seminole | 112 | 0.0% |
| Sioux | 67 | 0.0% |
| Slavic | 50 | 0.0% |
| Slovak | 150 | 0.0% |
| Slovene | 181 | 0.0% |
| Somali | 9 | 0.0% |
| South American | 1,562 | 0.2% |
| South American Indian | 39 | 0.0% |
| Spaniard | 501 | 0.1% |
| Spanish | 1,057 | 0.2% |
| Sri Lankan | 1,526 | 0.2% |
| Subsaharan African | 5,056 | 0.7% |
| Swedish | 1,227 | 0.2% |
| Swiss | 490 | 0.1% |
| Syrian | 9 | 0.0% |
| Thai | 972 | 0.1% |
| Tongan | 44 | 0.0% |
| Trinidadian and Tobagonian | 130 | 0.0% |
| Turkish | 26 | 0.0% |
| U.S. Virgin Islander | 11 | 0.0% |
| Ukrainian | 191 | 0.0% |
| Uruguayan | 7 | 0.0% |
| Venezuelan | 224 | 0.0% |
| Vietnamese | 27 | 0.0% |
| Welsh | 1,862 | 0.3% |
| West Indian | 94 | 0.0% |
| Yaqui | 13 | 0.0% |
| Yugoslavian | 91 | 0.0% | View All 143 Rows |
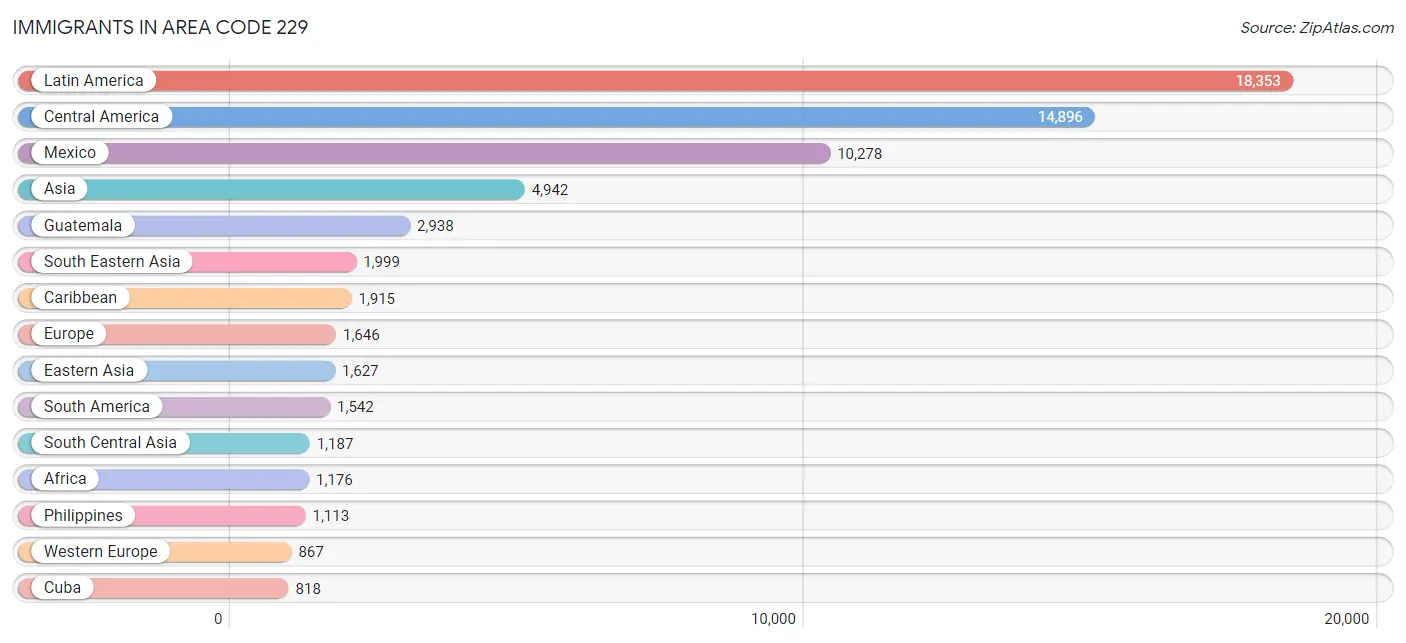
Immigrants in Area Code 229
The most numerous immigrant groups reported in Area Code 229 came from Latin America (18,353 | 2.6%), Central America (14,896 | 2.1%), Mexico (10,278 | 1.5%), Asia (4,942 | 0.7%), and Guatemala (2,938 | 0.4%), together accounting for 7.3% of all Area Code 229 residents.
| Immigration Origin | # Population | % Population |
| Afghanistan | 24 | 0.0% |
| Africa | 1,176 | 0.2% |
| Argentina | 59 | 0.0% |
| Asia | 4,942 | 0.7% |
| Australia | 57 | 0.0% |
| Austria | 35 | 0.0% |
| Bahamas | 48 | 0.0% |
| Bangladesh | 18 | 0.0% |
| Barbados | 25 | 0.0% |
| Belgium | 8 | 0.0% |
| Belize | 25 | 0.0% |
| Bolivia | 13 | 0.0% |
| Brazil | 126 | 0.0% |
| Bulgaria | 9 | 0.0% |
| Cambodia | 20 | 0.0% |
| Cameroon | 49 | 0.0% |
| Canada | 379 | 0.1% |
| Caribbean | 1,915 | 0.3% |
| Central America | 14,896 | 2.1% |
| Chile | 21 | 0.0% |
| China | 729 | 0.1% |
| Colombia | 671 | 0.1% |
| Congo | 9 | 0.0% |
| Cuba | 818 | 0.1% |
| Czechoslovakia | 19 | 0.0% |
| Dominica | 24 | 0.0% |
| Dominican Republic | 243 | 0.0% |
| Eastern Africa | 388 | 0.1% |
| Eastern Asia | 1,627 | 0.2% |
| Eastern Europe | 272 | 0.0% |
| Ecuador | 123 | 0.0% |
| Egypt | 25 | 0.0% |
| El Salvador | 587 | 0.1% |
| England | 181 | 0.0% |
| Eritrea | 8 | 0.0% |
| Ethiopia | 261 | 0.0% |
| Europe | 1,646 | 0.2% |
| France | 68 | 0.0% |
| Germany | 676 | 0.1% |
| Ghana | 212 | 0.0% |
| Greece | 24 | 0.0% |
| Guatemala | 2,938 | 0.4% |
| Guyana | 203 | 0.0% |
| Haiti | 158 | 0.0% |
| Honduras | 651 | 0.1% |
| Hong Kong | 11 | 0.0% |
| Hungary | 33 | 0.0% |
| India | 674 | 0.1% |
| Indonesia | 17 | 0.0% |
| Iraq | 4 | 0.0% |
| Israel | 9 | 0.0% |
| Italy | 44 | 0.0% |
| Jamaica | 449 | 0.1% |
| Japan | 264 | 0.0% |
| Kenya | 29 | 0.0% |
| Korea | 634 | 0.1% |
| Laos | 48 | 0.0% |
| Latin America | 18,353 | 2.6% |
| Latvia | 14 | 0.0% |
| Liberia | 49 | 0.0% |
| Lithuania | 12 | 0.0% |
| Mexico | 10,278 | 1.5% |
| Micronesia | 6 | 0.0% |
| Middle Africa | 58 | 0.0% |
| Morocco | 8 | 0.0% |
| Nepal | 70 | 0.0% |
| Netherlands | 55 | 0.0% |
| Nicaragua | 117 | 0.0% |
| Nigeria | 160 | 0.0% |
| Northern Africa | 33 | 0.0% |
| Northern Europe | 408 | 0.1% |
| Norway | 4 | 0.0% |
| Oceania | 93 | 0.0% |
| Pakistan | 299 | 0.0% |
| Panama | 241 | 0.0% |
| Peru | 150 | 0.0% |
| Philippines | 1,113 | 0.2% |
| Poland | 13 | 0.0% |
| Romania | 24 | 0.0% |
| Russia | 108 | 0.0% |
| Saudi Arabia | 37 | 0.0% |
| Scotland | 42 | 0.0% |
| Sierra Leone | 45 | 0.0% |
| Somalia | 18 | 0.0% |
| South Africa | 117 | 0.0% |
| South America | 1,542 | 0.2% |
| South Central Asia | 1,187 | 0.2% |
| South Eastern Asia | 1,999 | 0.3% |
| Southern Europe | 99 | 0.0% |
| Spain | 31 | 0.0% |
| Sri Lanka | 3 | 0.0% |
| Switzerland | 25 | 0.0% |
| Taiwan | 56 | 0.0% |
| Thailand | 198 | 0.0% |
| Trinidad and Tobago | 76 | 0.0% |
| Turkey | 43 | 0.0% |
| Ukraine | 40 | 0.0% |
| Uruguay | 7 | 0.0% |
| Venezuela | 147 | 0.0% |
| Vietnam | 533 | 0.1% |
| Western Africa | 493 | 0.1% |
| Western Asia | 95 | 0.0% |
| Western Europe | 867 | 0.1% |
| Zimbabwe | 23 | 0.0% | View All 104 Rows |
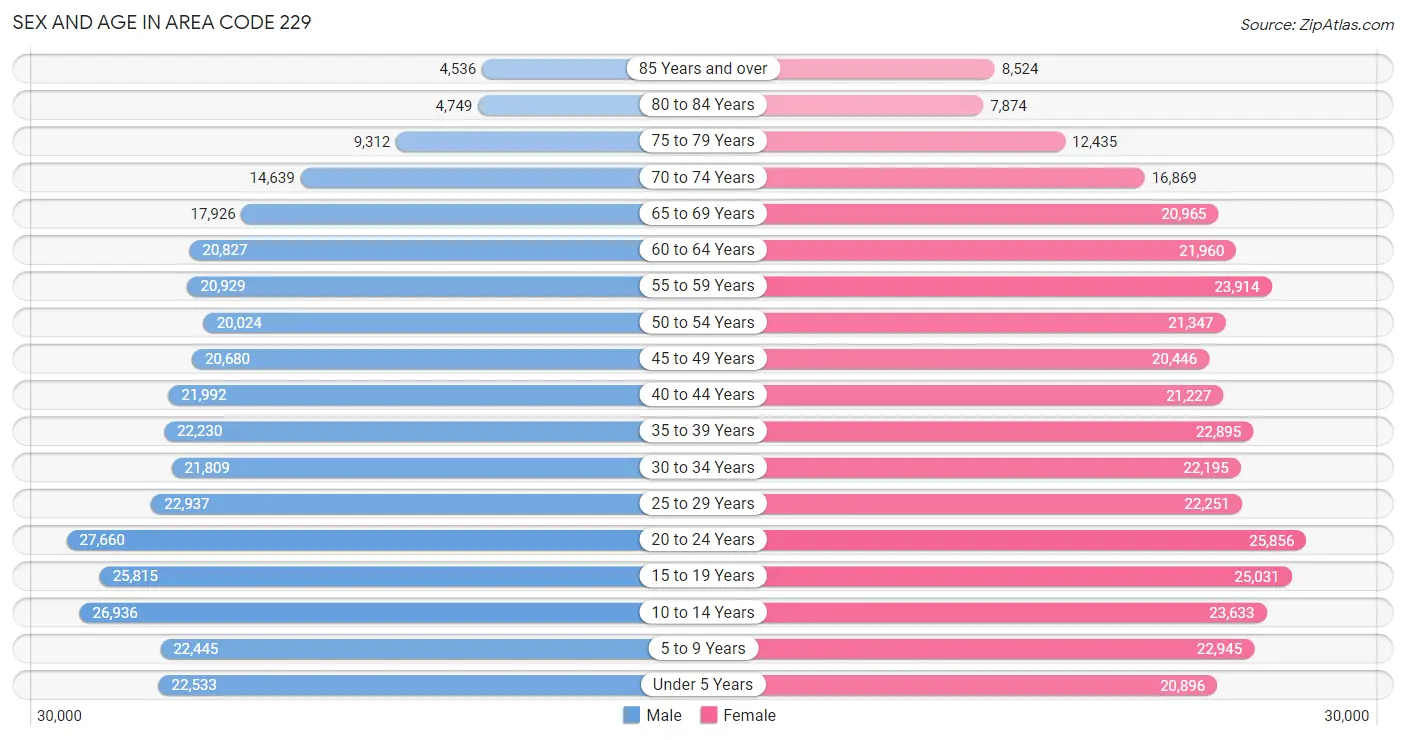
Sex and Age in Area Code 229
Sex and Age in Area Code 229
The most populous age groups in Area Code 229 are 20 to 24 Years (27,660 | 8.0%) for men and 20 to 24 Years (25,856 | 7.2%) for women.
| Age Bracket | Male | Female |
| Under 5 Years | 22,533 (6.5%) | 20,896 (5.8%) |
| 5 to 9 Years | 22,445 (6.5%) | 22,945 (6.4%) |
| 10 to 14 Years | 26,936 (7.7%) | 23,633 (6.5%) |
| 15 to 19 Years | 25,815 (7.4%) | 25,031 (6.9%) |
| 20 to 24 Years | 27,660 (8.0%) | 25,856 (7.2%) |
| 25 to 29 Years | 22,937 (6.6%) | 22,251 (6.2%) |
| 30 to 34 Years | 21,809 (6.3%) | 22,195 (6.1%) |
| 35 to 39 Years | 22,230 (6.4%) | 22,895 (6.3%) |
| 40 to 44 Years | 21,992 (6.3%) | 21,227 (5.9%) |
| 45 to 49 Years | 20,680 (5.9%) | 20,446 (5.7%) |
| 50 to 54 Years | 20,024 (5.8%) | 21,347 (5.9%) |
| 55 to 59 Years | 20,929 (6.0%) | 23,914 (6.6%) |
| 60 to 64 Years | 20,827 (6.0%) | 21,960 (6.1%) |
| 65 to 69 Years | 17,926 (5.1%) | 20,965 (5.8%) |
| 70 to 74 Years | 14,639 (4.2%) | 16,869 (4.7%) |
| 75 to 79 Years | 9,312 (2.7%) | 12,435 (3.4%) |
| 80 to 84 Years | 4,749 (1.4%) | 7,874 (2.2%) |
| 85 Years and over | 4,536 (1.3%) | 8,524 (2.4%) |
| Total | 347,979 (100.0%) | 361,263 (100.0%) |
Families and Households in Area Code 229
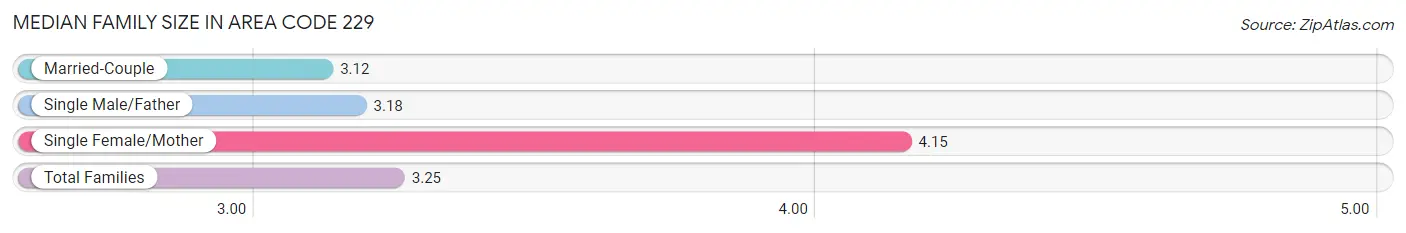
Median Family Size in Area Code 229
The median family size in Area Code 229 is 3.25 persons per family, with single female/mother families (48,945 | 28.6%) accounting for the largest median family size of 4.15232 persons per family. On the other hand, married-couple families (108,393 | 63.3%) represent the smallest median family size with 3.12 persons per family.
| Family Type | # Families | Family Size |
| Married-Couple | 108,393 (63.3%) | 3.12 |
| Single Male/Father | 14,009 (8.2%) | 3.18 |
| Single Female/Mother | 48,945 (28.6%) | 4.15 |
| Total Families | 171,347 (100.0%) | 3.25 |
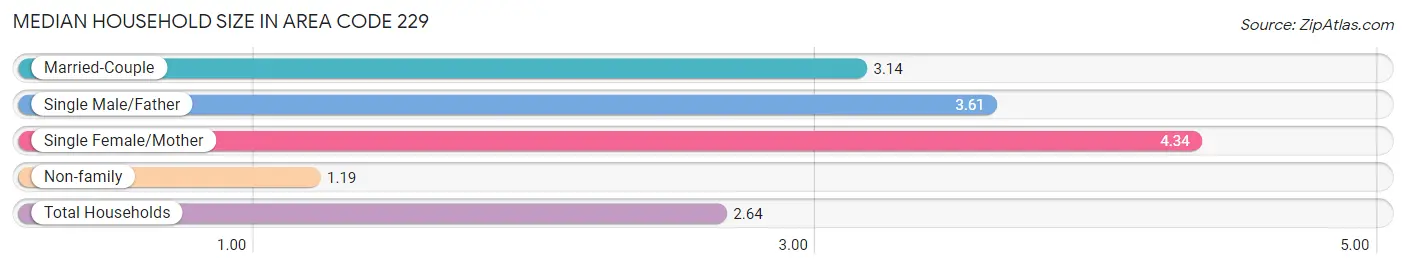
Median Household Size in Area Code 229
The median household size in Area Code 229 is 2.64 persons per household, with single female/mother households (48,945 | 18.5%) accounting for the largest median household size of 4.33883 persons per household. non-family households (92,916 | 35.2%) represent the smallest median household size with 1.19 persons per household.
| Household Type | # Households | Household Size |
| Married-Couple | 108,393 (41.0%) | 3.14 |
| Single Male/Father | 14,009 (5.3%) | 3.61 |
| Single Female/Mother | 48,945 (18.5%) | 4.34 |
| Non-family | 92,916 (35.2%) | 1.19 |
| Total Households | 264,263 (100.0%) | 2.64 |
Household Size by Marriage Status in Area Code 229
Out of a total of 264,263 households in Area Code 229, 171,347 (64.8%) are family households, while 92,916 (35.2%) are nonfamily households. The most numerous type of family households are 2-person households, comprising 77,643, and the most common type of nonfamily households are 1-person households, comprising 79,827.
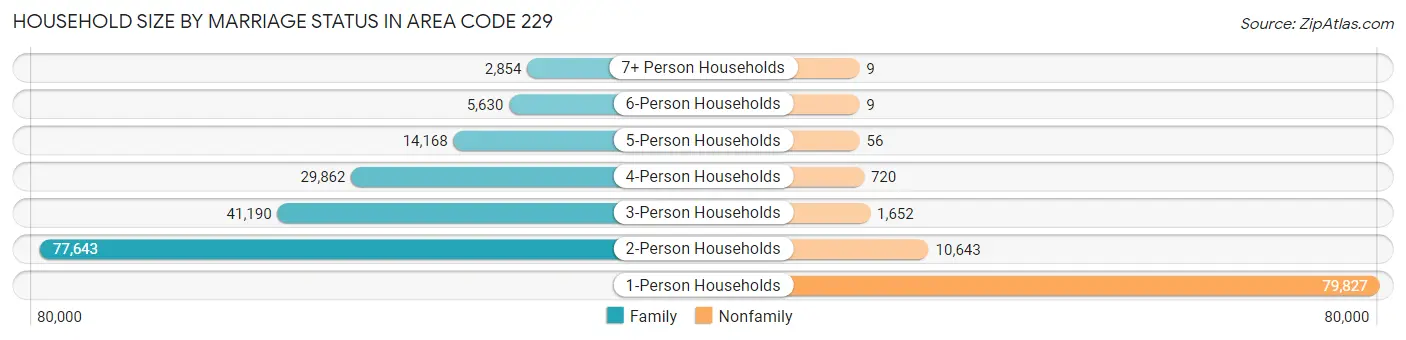
| Household Size | Family Households | Nonfamily Households |
| 1-Person Households | - | 79,827 (30.2%) |
| 2-Person Households | 77,643 (29.4%) | 10,643 (4.0%) |
| 3-Person Households | 41,190 (15.6%) | 1,652 (0.6%) |
| 4-Person Households | 29,862 (11.3%) | 720 (0.3%) |
| 5-Person Households | 14,168 (5.4%) | 56 (0.0%) |
| 6-Person Households | 5,630 (2.1%) | 9 (0.0%) |
| 7+ Person Households | 2,854 (1.1%) | 9 (0.0%) |
| Total | 171,347 (64.8%) | 92,916 (35.2%) |
Female Fertility in Area Code 229
Fertility by Age in Area Code 229
Average fertility rate in Area Code 229 is 58.3 births per 1,000 women. Women in the age bracket of 20 to 34 years have the highest fertility rate with 121.2 births per 1,000 women. Women in the age bracket of 20 to 34 years acount for 78.8% of all women with births.
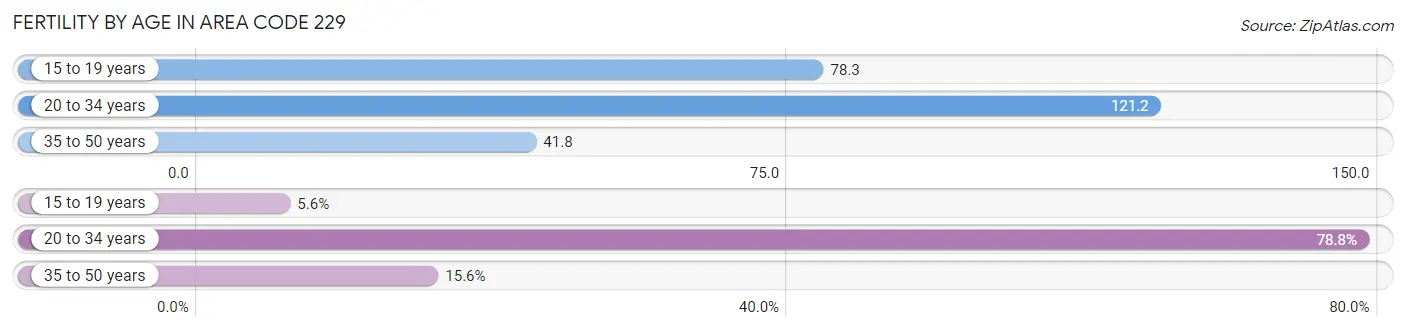
| Age Bracket | Women with Births | Births / 1,000 Women |
| 15 to 19 years | 520 (5.6%) | 78.3 |
| 20 to 34 years | 7,326 (78.8%) | 121.2 |
| 35 to 50 years | 1,454 (15.6%) | 41.8 |
| Total | 9,300 (100.0%) | 58.3 |
Fertility by Age by Marriage Status in Area Code 229
42.3% of women with births (9,300) in Area Code 229 are married. The highest percentage of unmarried women with births falls into 15 to 19 years age bracket with 100.0% of them unmarried at the time of birth, while the lowest percentage of unmarried women with births belong to 20 to 34 years age bracket with 63.1% of them unmarried.
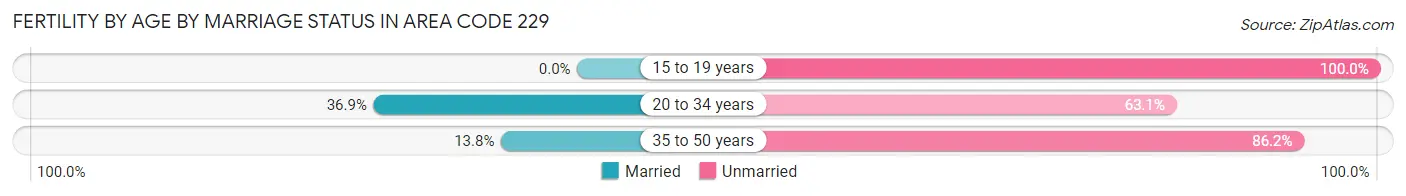
| Age Bracket | Married | Unmarried |
| 15 to 19 years | 0 (0.0%) | 520 (100.0%) |
| 20 to 34 years | 2,705 (36.9%) | 4,621 (63.1%) |
| 35 to 50 years | 201 (13.8%) | 1,253 (86.2%) |
| Total | 3,930 (42.3%) | 5,370 (57.7%) |
Fertility by Education in Area Code 229
Average fertility rate in Area Code 229 is 58.3 births per 1,000 women. Women with the education attainment of graduate degree have the highest fertility rate of 196.7 births per 1,000 women, while women with the education attainment of college or associate's degree have the lowest fertility at 73.0 births per 1,000 women. Women with the education attainment of high school diploma represent 33.6% of all women with births.
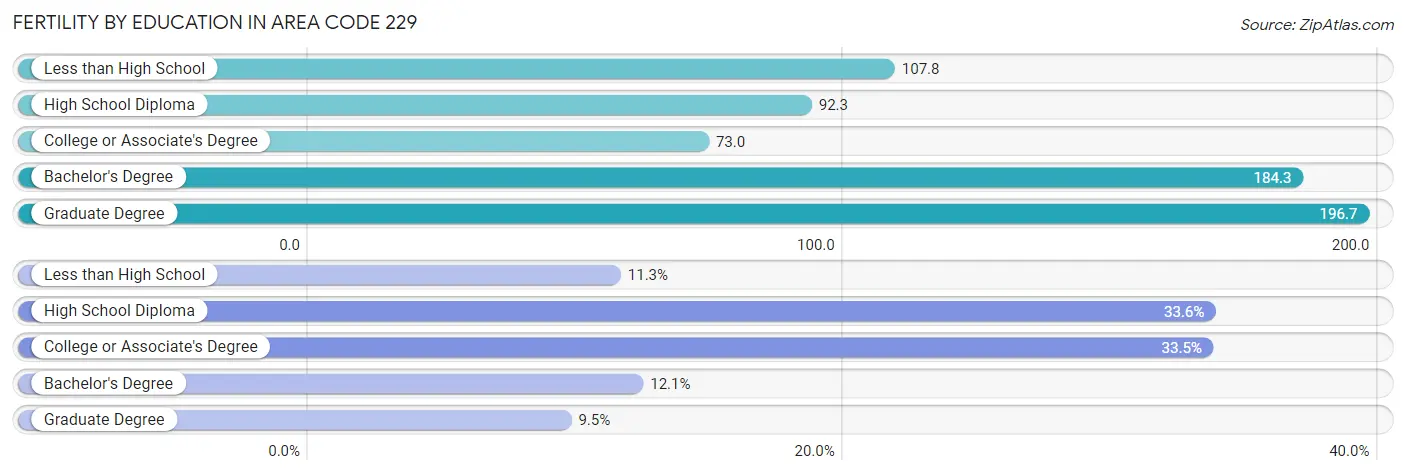
| Educational Attainment | Women with Births | Births / 1,000 Women |
| Less than High School | 1,051 (11.3%) | 107.8 |
| High School Diploma | 3,125 (33.6%) | 92.3 |
| College or Associate's Degree | 3,116 (33.5%) | 73.0 |
| Bachelor's Degree | 1,129 (12.1%) | 184.3 |
| Graduate Degree | 879 (9.5%) | 196.7 |
| Total | 9,300 (100.0%) | 58.3 |
Fertility by Education by Marriage Status in Area Code 229
57.7% of women with births in Area Code 229 are unmarried. Women with the educational attainment of college or associate's degree are most likely to be married with 35.4% of them married at childbirth, while women with the educational attainment of less than high school are least likely to be married with 90.7% of them unmarried at childbirth.
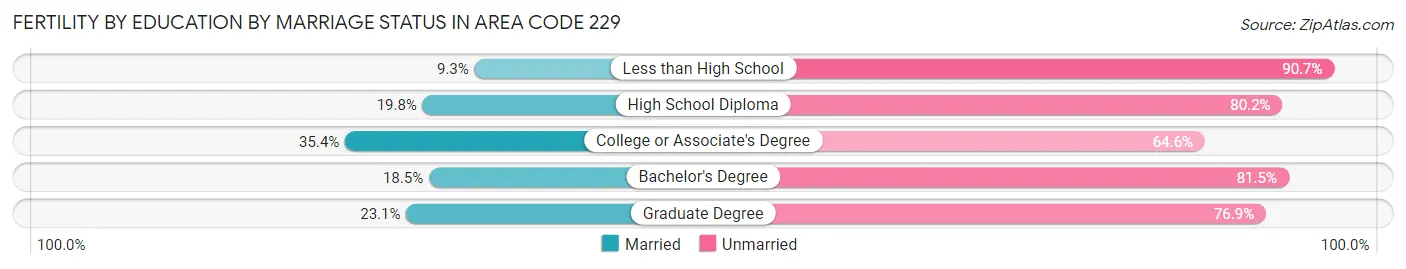
| Educational Attainment | Married | Unmarried |
| Less than High School | 98 (9.3%) | 953 (90.7%) |
| High School Diploma | 618 (19.8%) | 2,507 (80.2%) |
| College or Associate's Degree | 1,103 (35.4%) | 2,013 (64.6%) |
| Bachelor's Degree | 209 (18.5%) | 920 (81.5%) |
| Graduate Degree | 203 (23.1%) | 676 (76.9%) |
| Total | 3,930 (42.3%) | 5,370 (57.7%) |
Employment Characteristics in Area Code 229
Employment by Class of Employer in Area Code 229
Among the 289,948 employed individuals in Area Code 229, private company employees (189,748 | 65.4%), local government employees (24,028 | 8.3%), and state government employees (18,204 | 6.3%) make up the most common classes of employment.
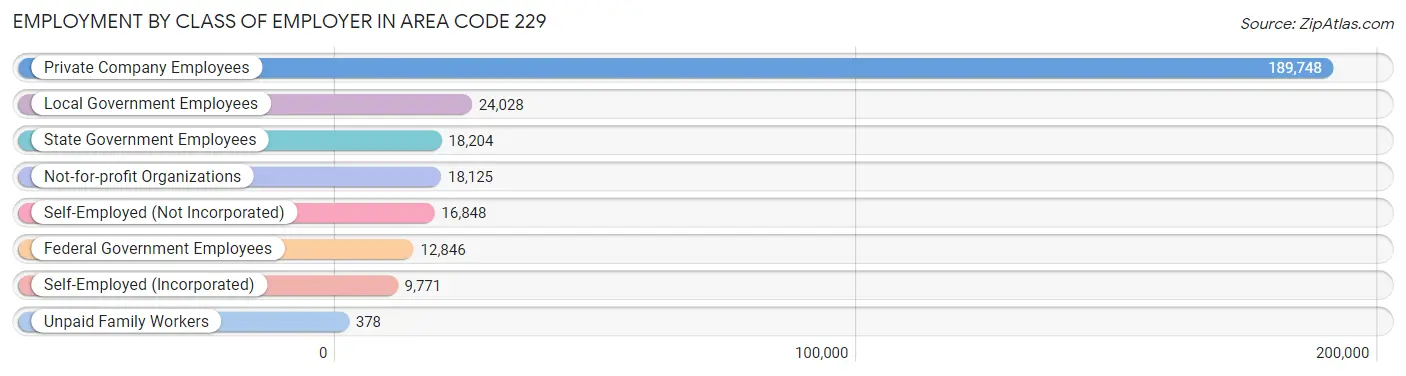
| Employer Class | # Employees | % Employees |
| Private Company Employees | 189,748 | 65.4% |
| Self-Employed (Incorporated) | 9,771 | 3.4% |
| Self-Employed (Not Incorporated) | 16,848 | 5.8% |
| Not-for-profit Organizations | 18,125 | 6.2% |
| Local Government Employees | 24,028 | 8.3% |
| State Government Employees | 18,204 | 6.3% |
| Federal Government Employees | 12,846 | 4.4% |
| Unpaid Family Workers | 378 | 0.1% |
| Total | 289,948 | 100.0% |
Employment Status by Age in Area Code 229
According to the labor force statistics for Area Code 229, out of the total population over 16 years of age (559,706), 54.5% or 305,264 individuals are in the labor force, with 6.2% or 18,804 of them unemployed. The age group with the highest labor force participation rate is 25 to 29 years, with 77.7% or 35,107 individuals in the labor force. Within the labor force, the 16 to 19 years age range has the highest percentage of unemployed individuals, with 1,791.6% or 259,137 of them being unemployed.
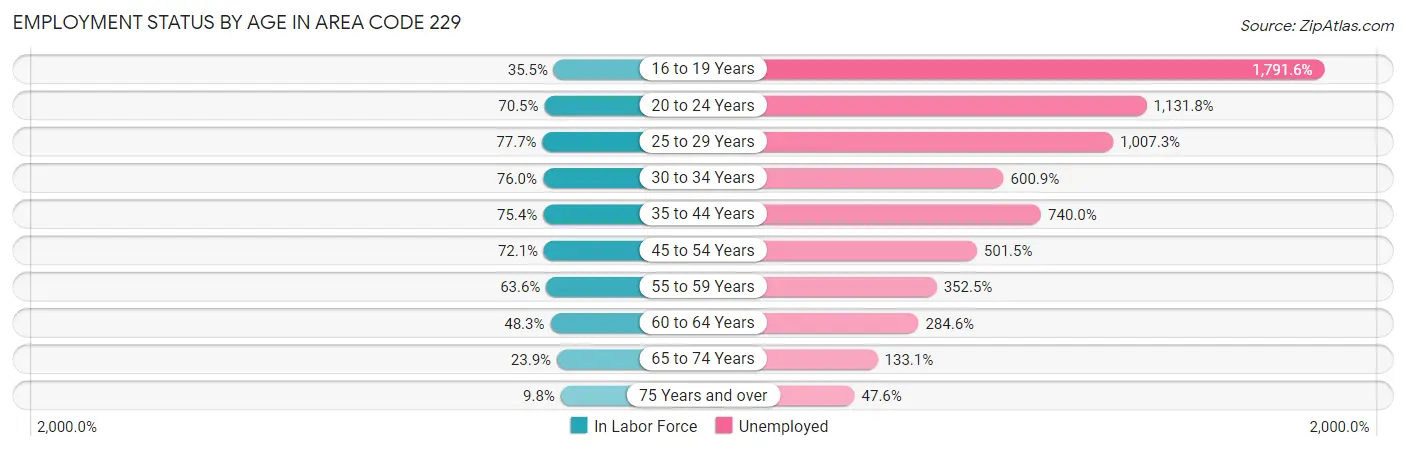
| Age Bracket | In Labor Force | Unemployed |
| 16 to 19 Years | 14,463 (35.5%) | 259,137 (1,791.6%) |
| 20 to 24 Years | 37,746 (70.5%) | 427,198 (1,131.8%) |
| 25 to 29 Years | 35,107 (77.7%) | 353,633 (1,007.3%) |
| 30 to 34 Years | 33,462 (76.0%) | 201,067 (600.9%) |
| 35 to 44 Years | 66,574 (75.4%) | 492,662 (740.0%) |
| 45 to 54 Years | 59,449 (72.1%) | 298,127 (501.5%) |
| 55 to 59 Years | 28,534 (63.6%) | 100,582 (352.5%) |
| 60 to 64 Years | 20,678 (48.3%) | 58,852 (284.6%) |
| 65 to 74 Years | 16,806 (23.9%) | 22,366 (133.1%) |
| 75 Years and over | 4,662 (9.8%) | 2,219 (47.6%) |
| Total | 305,256 (54.5%) | 18,796 (6.2%) |
Employment Status by Educational Attainment in Area Code 229
According to labor force statistics for Area Code 229, 70.3% of individuals (244,546) out of the total population between 25 and 64 years of age (347,663) are in the labor force, with 546.9% or 1,337,422 of them being unemployed. The group with the highest labor force participation rate are those with the educational attainment of bachelor's degree or higher, with 81.9% or 55,453 individuals in the labor force. Within the labor force, individuals with less than high school education have the highest percentage of unemployment, with 996.5% or 252,473 of them being unemployed.
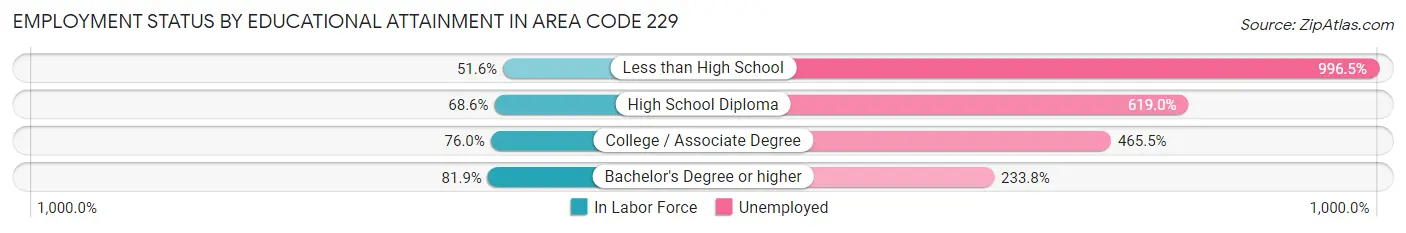
| Educational Attainment | In Labor Force | Unemployed |
| Less than High School | 25,334 (51.6%) | 489,092 (996.5%) |
| High School Diploma | 82,533 (68.6%) | 744,409 (619.0%) |
| College / Associate Degree | 84,108 (76.0%) | 514,945 (465.5%) |
| Bachelor's Degree or higher | 55,452 (81.9%) | 158,283 (233.8%) |
| Total | 244,551 (70.3%) | 1,901,369 (546.9%) |
Employment Occupations by Sex in Area Code 229
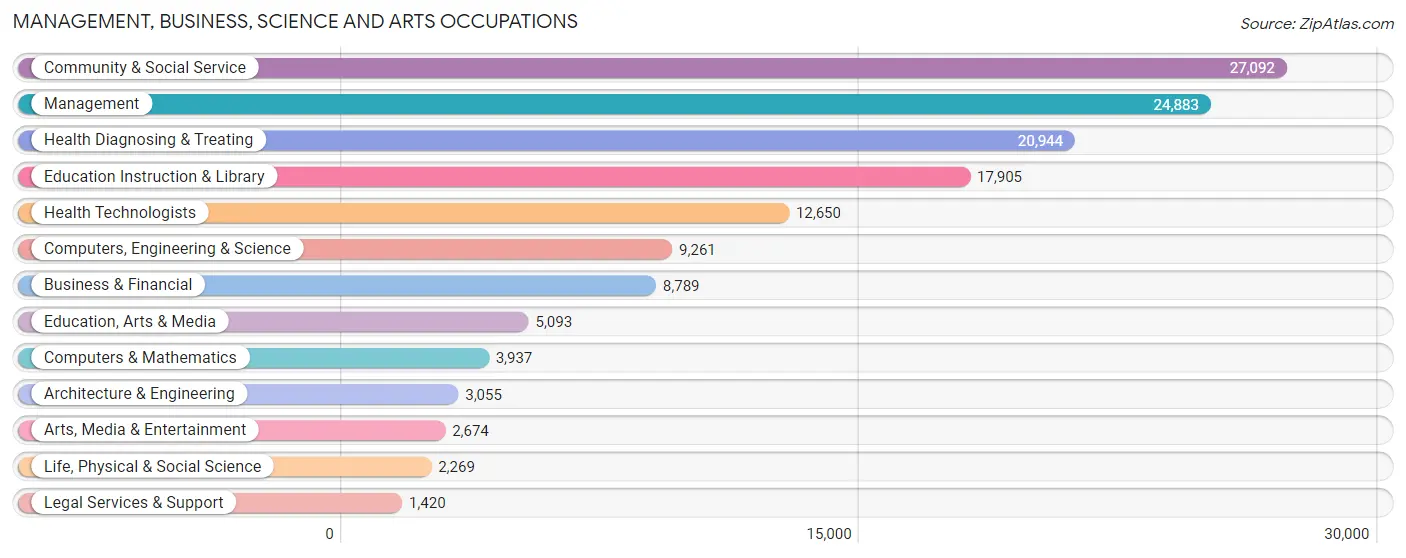
Management, Business, Science and Arts Occupations
The most common Management, Business, Science and Arts occupations in Area Code 229 are Community & Social Service (27,092 | 9.3%), Management (24,883 | 8.6%), Health Diagnosing & Treating (20,944 | 7.2%), Education Instruction & Library (17,905 | 6.2%), and Health Technologists (12,650 | 4.3%).
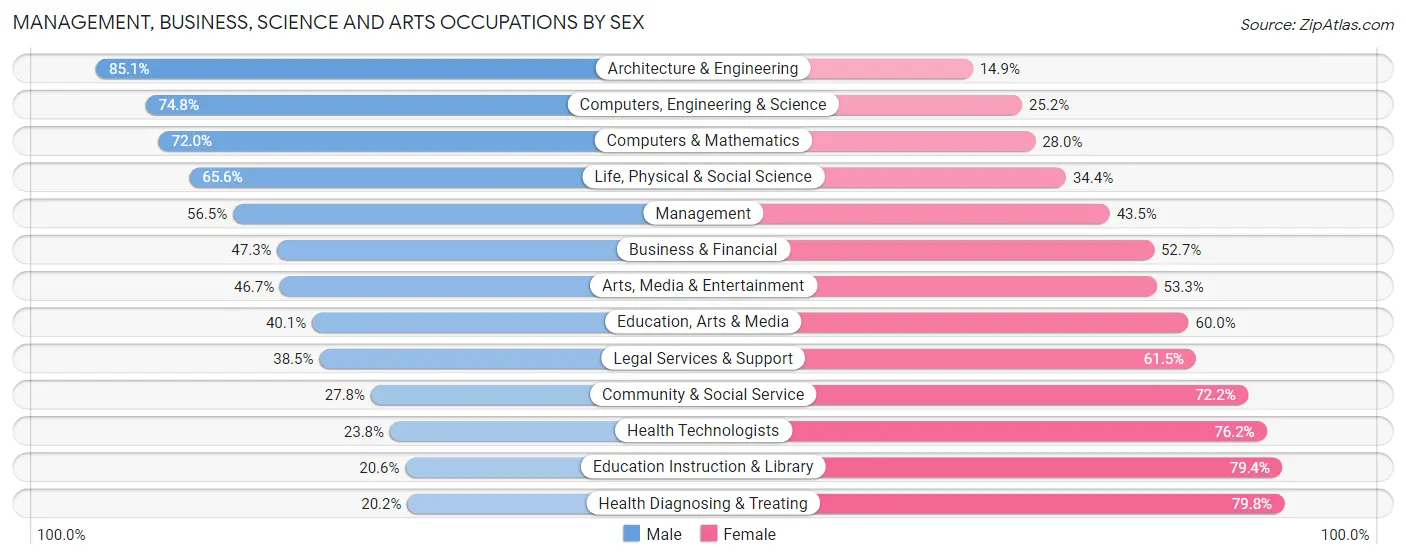
Management, Business, Science and Arts Occupations by Sex
Within the Management, Business, Science and Arts occupations in Area Code 229, the most male-oriented occupations are Architecture & Engineering (85.1%), Computers, Engineering & Science (74.8%), and Computers & Mathematics (72.0%), while the most female-oriented occupations are Health Diagnosing & Treating (79.8%), Education Instruction & Library (79.4%), and Health Technologists (76.2%).
| Occupation | Male | Female |
| Management | 14,060 (56.5%) | 10,823 (43.5%) |
| Business & Financial | 4,154 (47.3%) | 4,635 (52.7%) |
| Computers, Engineering & Science | 6,924 (74.8%) | 2,337 (25.2%) |
| Computers & Mathematics | 2,836 (72.0%) | 1,101 (28.0%) |
| Architecture & Engineering | 2,599 (85.1%) | 456 (14.9%) |
| Life, Physical & Social Science | 1,489 (65.6%) | 780 (34.4%) |
| Community & Social Service | 7,523 (27.8%) | 19,569 (72.2%) |
| Education, Arts & Media | 2,040 (40.1%) | 3,053 (60.0%) |
| Legal Services & Support | 547 (38.5%) | 873 (61.5%) |
| Education Instruction & Library | 3,687 (20.6%) | 14,218 (79.4%) |
| Arts, Media & Entertainment | 1,249 (46.7%) | 1,425 (53.3%) |
| Health Diagnosing & Treating | 4,222 (20.2%) | 16,722 (79.8%) |
| Health Technologists | 3,012 (23.8%) | 9,638 (76.2%) |
| Total (Category) | 36,883 (40.5%) | 54,086 (59.5%) |
| Total (Overall) | 147,970 (50.9%) | 142,888 (49.1%) |
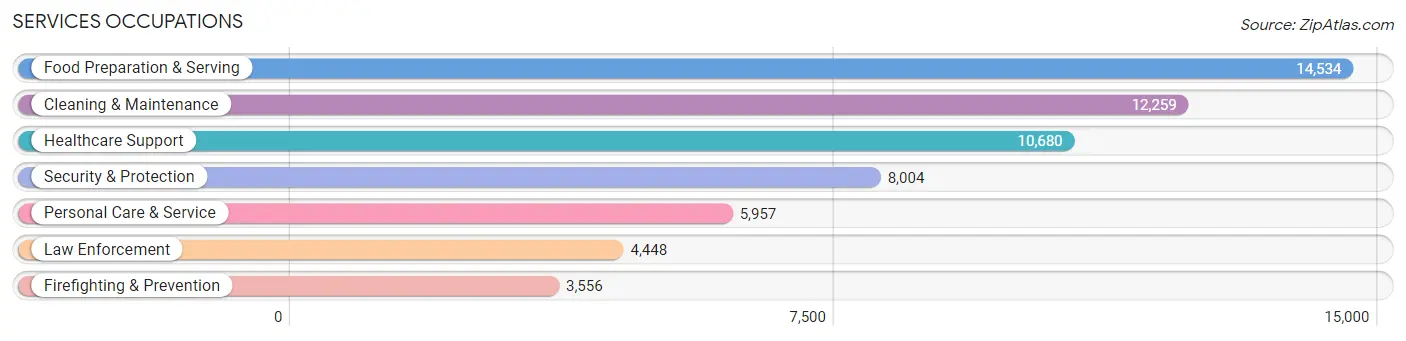
Services Occupations
The most common Services occupations in Area Code 229 are Food Preparation & Serving (14,534 | 5.0%), Cleaning & Maintenance (12,259 | 4.2%), Healthcare Support (10,680 | 3.7%), Security & Protection (8,004 | 2.8%), and Personal Care & Service (5,957 | 2.1%).
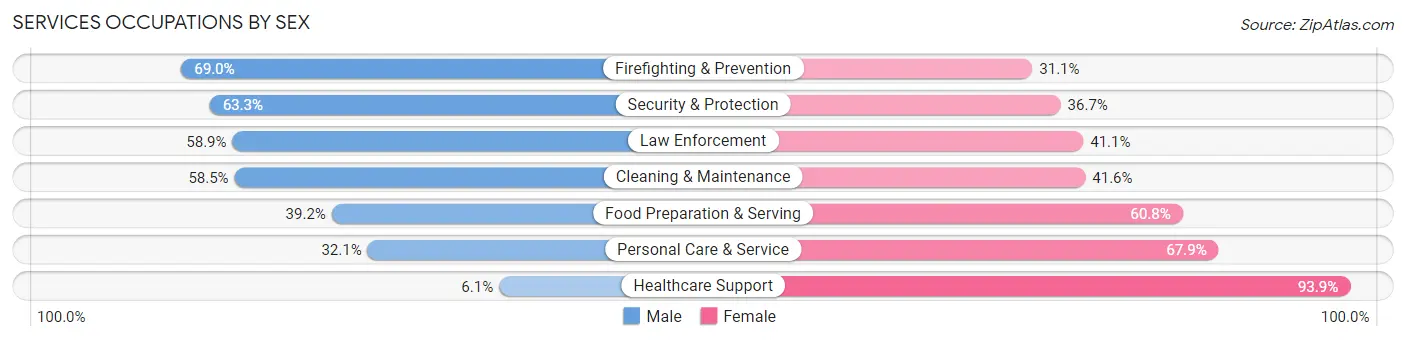
Services Occupations by Sex
Within the Services occupations in Area Code 229, the most male-oriented occupations are Firefighting & Prevention (69.0%), Security & Protection (63.3%), and Law Enforcement (58.9%), while the most female-oriented occupations are Healthcare Support (93.9%), Personal Care & Service (67.9%), and Food Preparation & Serving (60.8%).
| Occupation | Male | Female |
| Healthcare Support | 647 (6.1%) | 10,033 (93.9%) |
| Security & Protection | 5,070 (63.3%) | 2,934 (36.7%) |
| Firefighting & Prevention | 2,452 (69.0%) | 1,104 (31.0%) |
| Law Enforcement | 2,618 (58.9%) | 1,830 (41.1%) |
| Food Preparation & Serving | 5,697 (39.2%) | 8,837 (60.8%) |
| Cleaning & Maintenance | 7,165 (58.5%) | 5,094 (41.5%) |
| Personal Care & Service | 1,912 (32.1%) | 4,045 (67.9%) |
| Total (Category) | 20,491 (39.8%) | 30,943 (60.2%) |
| Total (Overall) | 147,970 (50.9%) | 142,888 (49.1%) |
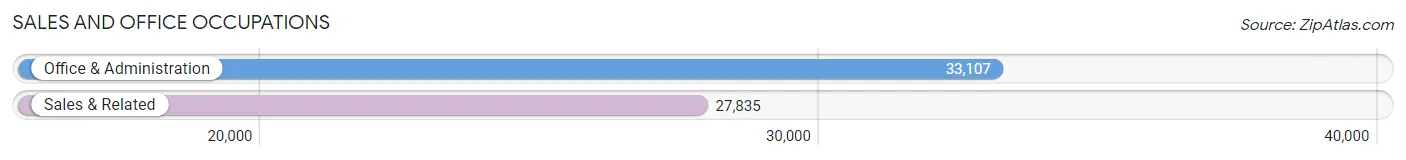
Sales and Office Occupations
The most common Sales and Office occupations in Area Code 229 are Office & Administration (33,107 | 11.4%), and Sales & Related (27,835 | 9.6%).
Sales and Office Occupations by Sex
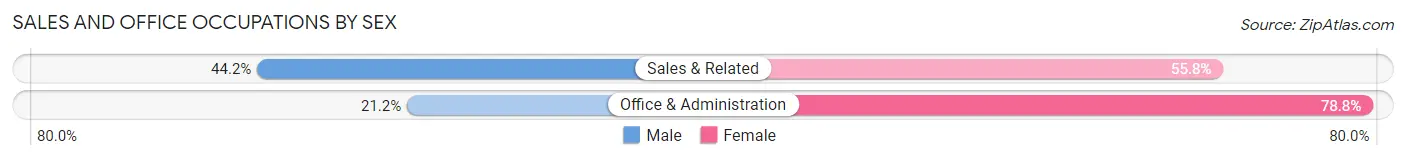
| Occupation | Male | Female |
| Sales & Related | 12,309 (44.2%) | 15,526 (55.8%) |
| Office & Administration | 7,004 (21.2%) | 26,103 (78.8%) |
| Total (Category) | 19,313 (31.7%) | 41,629 (68.3%) |
| Total (Overall) | 147,970 (50.9%) | 142,888 (49.1%) |
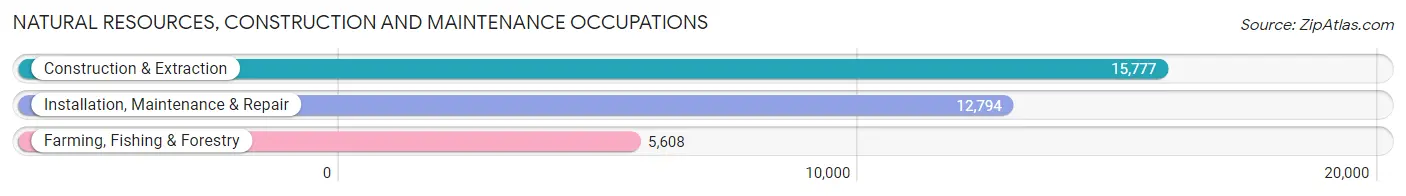
Natural Resources, Construction and Maintenance Occupations
The most common Natural Resources, Construction and Maintenance occupations in Area Code 229 are Construction & Extraction (15,777 | 5.4%), Installation, Maintenance & Repair (12,794 | 4.4%), and Farming, Fishing & Forestry (5,608 | 1.9%).
Natural Resources, Construction and Maintenance Occupations by Sex
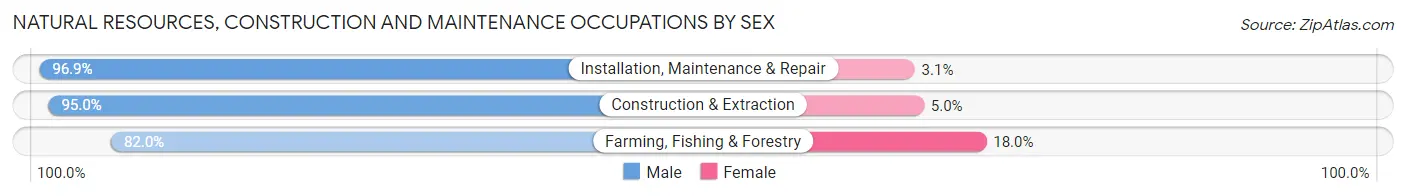
| Occupation | Male | Female |
| Farming, Fishing & Forestry | 4,600 (82.0%) | 1,008 (18.0%) |
| Construction & Extraction | 14,993 (95.0%) | 784 (5.0%) |
| Installation, Maintenance & Repair | 12,402 (96.9%) | 392 (3.1%) |
| Total (Category) | 31,995 (93.6%) | 2,184 (6.4%) |
| Total (Overall) | 147,970 (50.9%) | 142,888 (49.1%) |
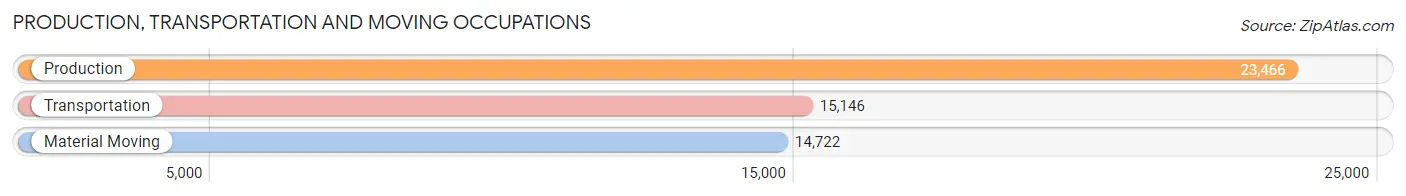
Production, Transportation and Moving Occupations
The most common Production, Transportation and Moving occupations in Area Code 229 are Production (23,466 | 8.1%), Transportation (15,146 | 5.2%), and Material Moving (14,722 | 5.1%).
Production, Transportation and Moving Occupations by Sex
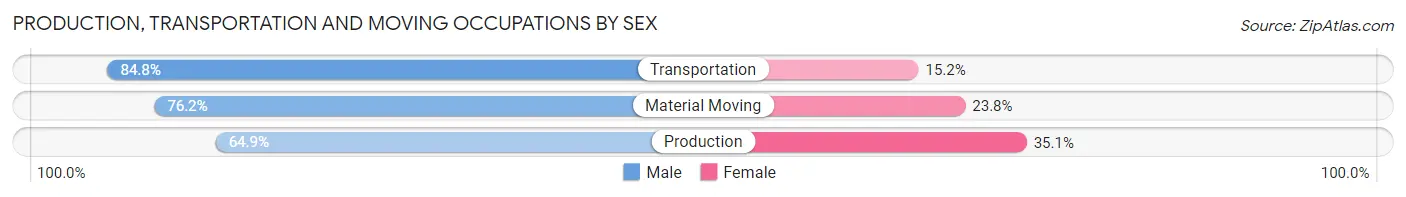
| Occupation | Male | Female |
| Production | 15,234 (64.9%) | 8,232 (35.1%) |
| Transportation | 12,839 (84.8%) | 2,307 (15.2%) |
| Material Moving | 11,215 (76.2%) | 3,507 (23.8%) |
| Total (Category) | 39,288 (73.7%) | 14,046 (26.3%) |
| Total (Overall) | 147,970 (50.9%) | 142,888 (49.1%) |
Employment Industries by Sex in Area Code 229
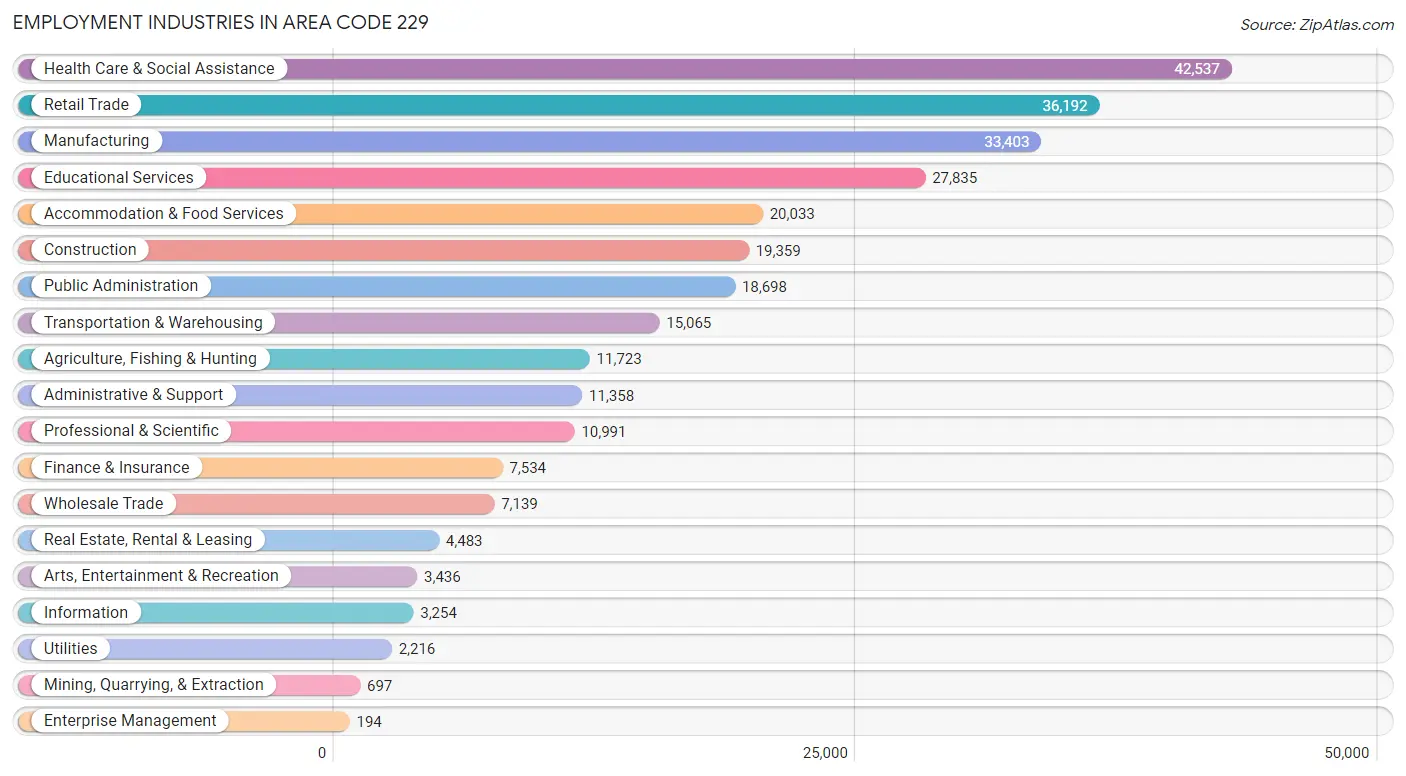
Employment Industries in Area Code 229
The major employment industries in Area Code 229 include Health Care & Social Assistance (42,537 | 14.6%), Retail Trade (36,192 | 12.4%), Manufacturing (33,403 | 11.5%), Educational Services (27,835 | 9.6%), and Accommodation & Food Services (20,033 | 6.9%).
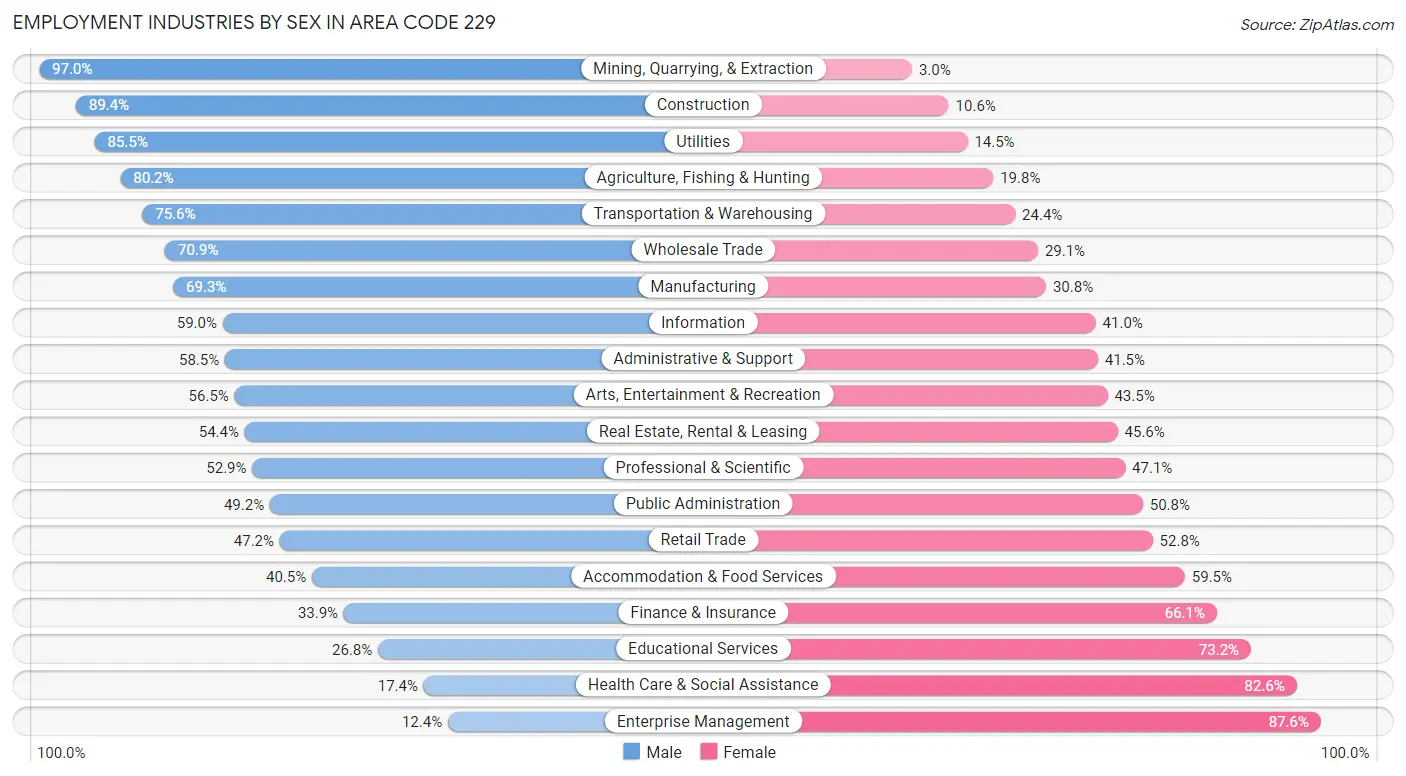
Employment Industries by Sex in Area Code 229
The Area Code 229 industries that see more men than women are Mining, Quarrying, & Extraction (97.0%), Construction (89.4%), and Utilities (85.5%), whereas the industries that tend to have a higher number of women are Enterprise Management (87.6%), Health Care & Social Assistance (82.6%), and Educational Services (73.2%).
| Industry | Male | Female |
| Agriculture, Fishing & Hunting | 9,398 (80.2%) | 2,325 (19.8%) |
| Mining, Quarrying, & Extraction | 676 (97.0%) | 21 (3.0%) |
| Construction | 17,306 (89.4%) | 2,053 (10.6%) |
| Manufacturing | 23,133 (69.3%) | 10,270 (30.7%) |
| Wholesale Trade | 5,062 (70.9%) | 2,077 (29.1%) |
| Retail Trade | 17,070 (47.2%) | 19,122 (52.8%) |
| Transportation & Warehousing | 11,393 (75.6%) | 3,672 (24.4%) |
| Utilities | 1,895 (85.5%) | 321 (14.5%) |
| Information | 1,919 (59.0%) | 1,335 (41.0%) |
| Finance & Insurance | 2,554 (33.9%) | 4,980 (66.1%) |
| Real Estate, Rental & Leasing | 2,440 (54.4%) | 2,043 (45.6%) |
| Professional & Scientific | 5,810 (52.9%) | 5,181 (47.1%) |
| Enterprise Management | 24 (12.4%) | 170 (87.6%) |
| Administrative & Support | 6,645 (58.5%) | 4,713 (41.5%) |
| Educational Services | 7,468 (26.8%) | 20,367 (73.2%) |
| Health Care & Social Assistance | 7,387 (17.4%) | 35,150 (82.6%) |
| Arts, Entertainment & Recreation | 1,942 (56.5%) | 1,494 (43.5%) |
| Accommodation & Food Services | 8,114 (40.5%) | 11,919 (59.5%) |
| Public Administration | 9,202 (49.2%) | 9,496 (50.8%) |
| Total | 147,970 (50.9%) | 142,888 (49.1%) |
Education in Area Code 229
School Enrollment in Area Code 229
The most common levels of schooling among the 179,946 students in Area Code 229 are middle school (39,758 | 22.1%), high school (37,958 | 21.1%), and college / undergraduate (37,779 | 21.0%).
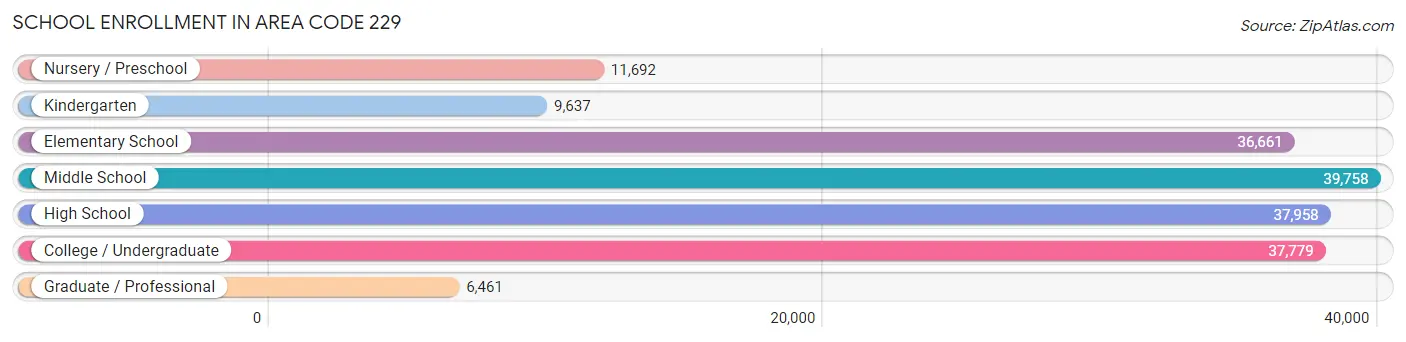
| School Level | # Students | % Students |
| Nursery / Preschool | 11,692 | 6.5% |
| Kindergarten | 9,637 | 5.4% |
| Elementary School | 36,661 | 20.4% |
| Middle School | 39,758 | 22.1% |
| High School | 37,958 | 21.1% |
| College / Undergraduate | 37,779 | 21.0% |
| Graduate / Professional | 6,461 | 3.6% |
| Total | 179,946 | 100.0% |
School Enrollment by Age by Funding Source in Area Code 229
Out of a total of 179,946 students who are enrolled in schools in Area Code 229, 18,356 (10.2%) attend a private institution, while the remaining 161,590 (89.8%) are enrolled in public schools. The age group of 35 years and over has the highest likelihood of being enrolled in private schools, with 2,097 (22.9% in the age bracket) enrolled. Conversely, the age group of 18 to 19 year olds has the lowest likelihood of being enrolled in a private school, with 13,741 (94.4% in the age bracket) attending a public institution.
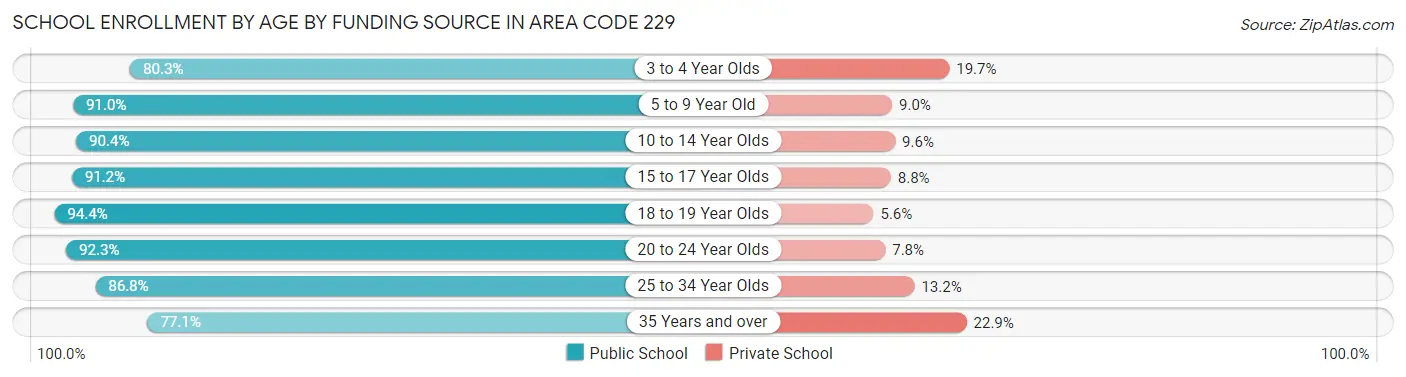
| Age Bracket | Public School | Private School |
| 3 to 4 Year Olds | 7,202 (80.3%) | 1,764 (19.7%) |
| 5 to 9 Year Old | 39,336 (91.0%) | 3,902 (9.0%) |
| 10 to 14 Year Olds | 44,106 (90.4%) | 4,680 (9.6%) |
| 15 to 17 Year Olds | 24,951 (91.2%) | 2,405 (8.8%) |
| 18 to 19 Year Olds | 13,741 (94.4%) | 809 (5.6%) |
| 20 to 24 Year Olds | 16,764 (92.2%) | 1,409 (7.7%) |
| 25 to 34 Year Olds | 8,438 (86.8%) | 1,282 (13.2%) |
| 35 Years and over | 7,060 (77.1%) | 2,097 (22.9%) |
| Total | 161,590 (89.8%) | 18,356 (10.2%) |
Educational Attainment by Field of Study in Area Code 229
Education (19,778 | 21.2%), business (18,960 | 20.3%), science & technology (10,932 | 11.7%), arts & humanities (8,021 | 8.6%), and bio, nature & agricultural (6,867 | 7.4%) are the most common fields of study among 93,337 individuals in Area Code 229 who have obtained a bachelor's degree or higher.
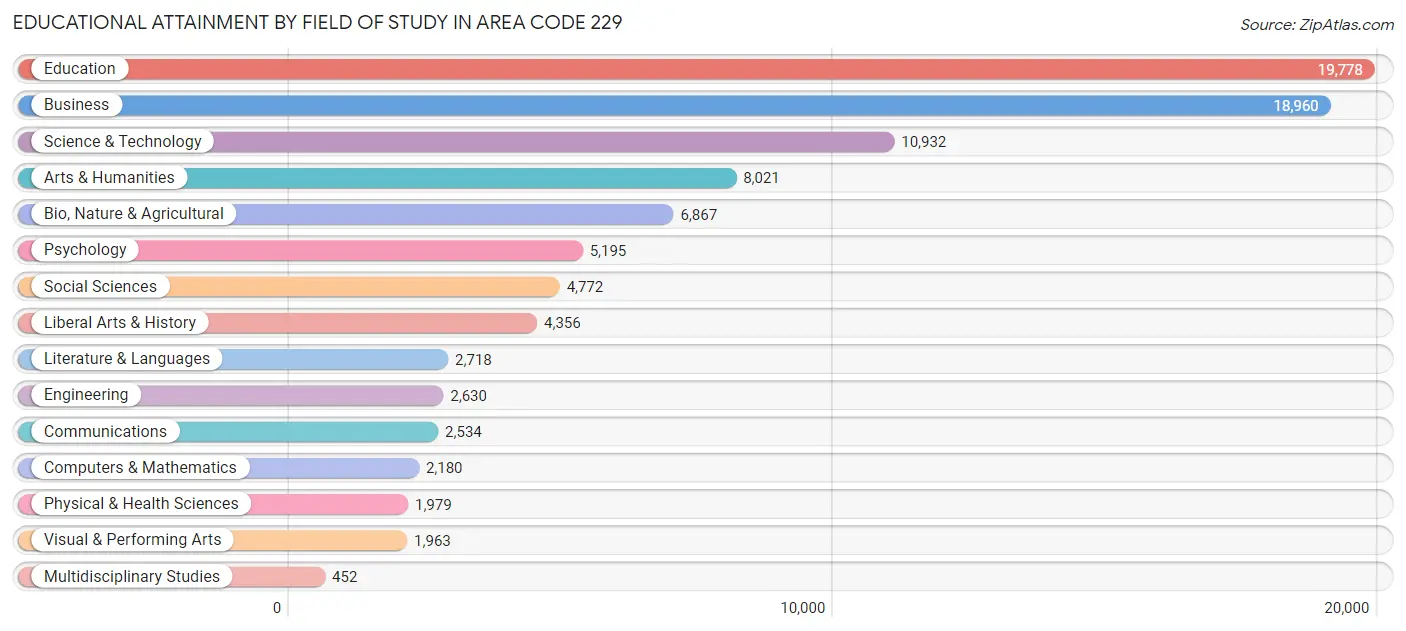
| Field of Study | # Graduates | % Graduates |
| Computers & Mathematics | 2,180 | 2.3% |
| Bio, Nature & Agricultural | 6,867 | 7.4% |
| Physical & Health Sciences | 1,979 | 2.1% |
| Psychology | 5,195 | 5.6% |
| Social Sciences | 4,772 | 5.1% |
| Engineering | 2,630 | 2.8% |
| Multidisciplinary Studies | 452 | 0.5% |
| Science & Technology | 10,932 | 11.7% |
| Business | 18,960 | 20.3% |
| Education | 19,778 | 21.2% |
| Literature & Languages | 2,718 | 2.9% |
| Liberal Arts & History | 4,356 | 4.7% |
| Visual & Performing Arts | 1,963 | 2.1% |
| Communications | 2,534 | 2.7% |
| Arts & Humanities | 8,021 | 8.6% |
| Total | 93,337 | 100.0% |
Transportation & Commute in Area Code 229
Vehicle Availability by Sex in Area Code 229
The most prevalent vehicle ownership categories in Area Code 229 are males with 2 vehicles (60,737, accounting for 41.2%) and females with 2 vehicles (51,682, making up 43.7%).
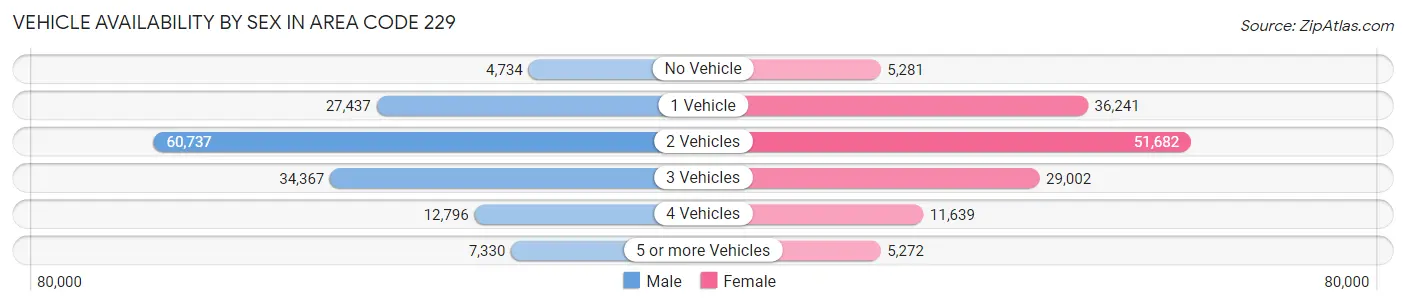
| Vehicles Available | Male | Female |
| No Vehicle | 4,734 (3.2%) | 5,281 (3.8%) |
| 1 Vehicle | 27,437 (18.6%) | 36,241 (26.1%) |
| 2 Vehicles | 60,737 (41.2%) | 51,682 (37.1%) |
| 3 Vehicles | 34,367 (23.3%) | 29,002 (20.8%) |
| 4 Vehicles | 12,796 (8.7%) | 11,639 (8.4%) |
| 5 or more Vehicles | 7,330 (5.0%) | 5,272 (3.8%) |
| Total | 147,401 (100.0%) | 139,117 (100.0%) |
Commute Time in Area Code 229
The most frequently occuring commute durations in Area Code 229 are 10 to 14 minutes (51,807 commuters, 18.7%), 15 to 19 minutes (50,331 commuters, 18.2%), and 5 to 9 minutes (37,780 commuters, 13.6%).
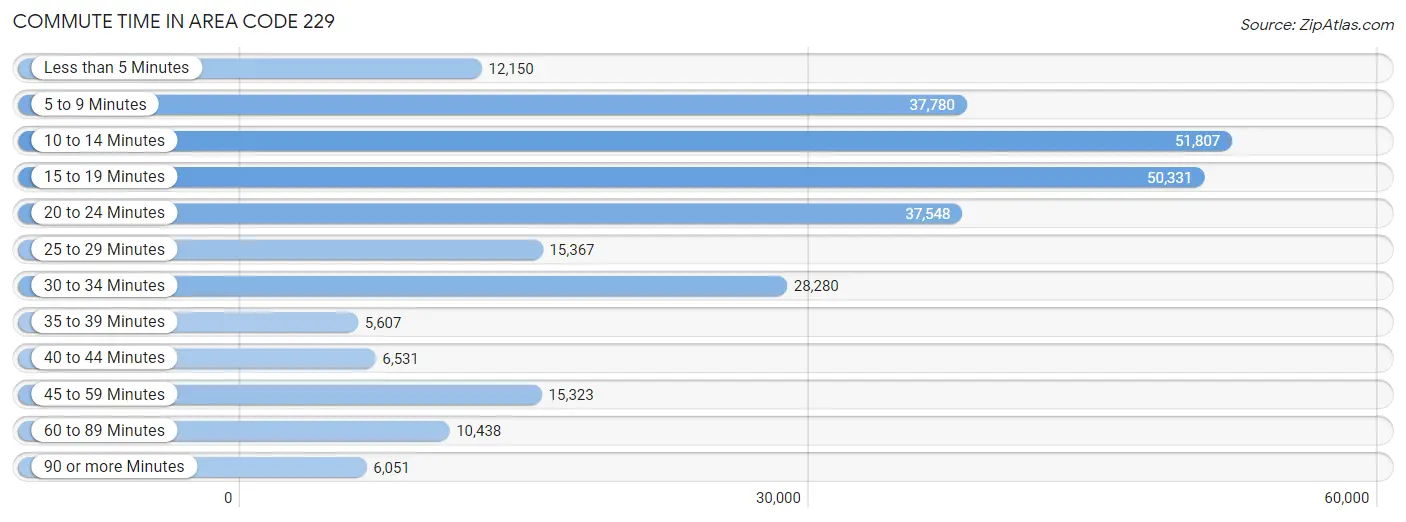
| Commute Time | # Commuters | % Commuters |
| Less than 5 Minutes | 12,150 | 4.4% |
| 5 to 9 Minutes | 37,780 | 13.6% |
| 10 to 14 Minutes | 51,807 | 18.7% |
| 15 to 19 Minutes | 50,331 | 18.2% |
| 20 to 24 Minutes | 37,548 | 13.5% |
| 25 to 29 Minutes | 15,367 | 5.5% |
| 30 to 34 Minutes | 28,280 | 10.2% |
| 35 to 39 Minutes | 5,607 | 2.0% |
| 40 to 44 Minutes | 6,531 | 2.4% |
| 45 to 59 Minutes | 15,323 | 5.5% |
| 60 to 89 Minutes | 10,438 | 3.8% |
| 90 or more Minutes | 6,051 | 2.2% |
Commute Time by Sex in Area Code 229
The most common commute times in Area Code 229 are 10 to 14 minutes (25,836 commuters, 18.0%) for males and 10 to 14 minutes (25,971 commuters, 19.5%) for females.
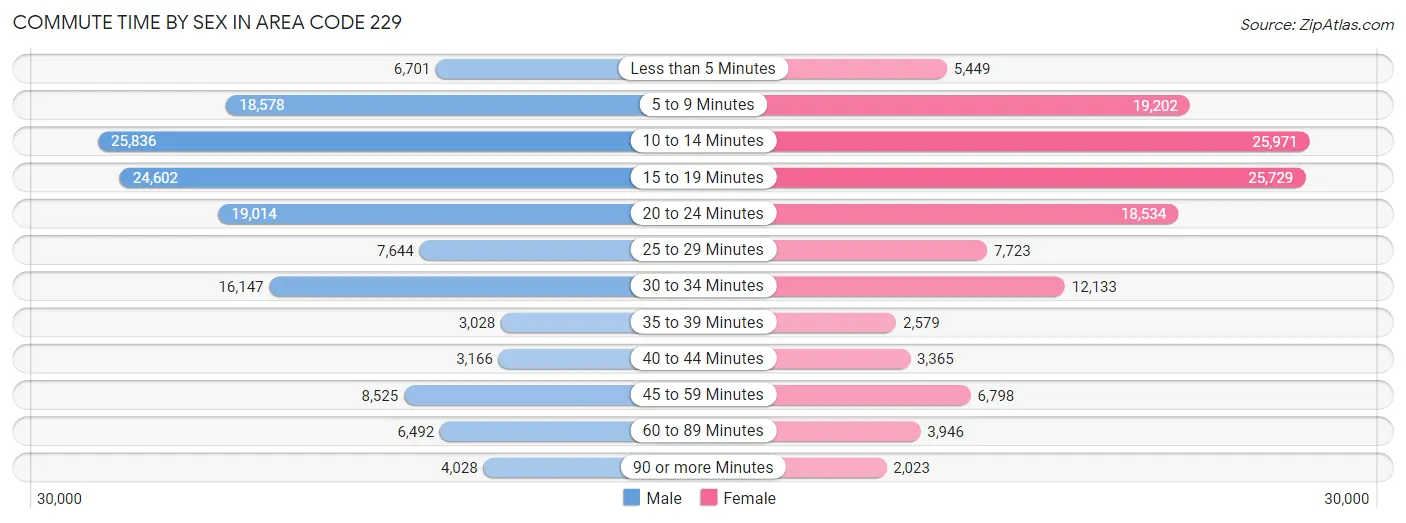
| Commute Time | Male | Female |
| Less than 5 Minutes | 6,701 (4.7%) | 5,449 (4.1%) |
| 5 to 9 Minutes | 18,578 (12.9%) | 19,202 (14.4%) |
| 10 to 14 Minutes | 25,836 (18.0%) | 25,971 (19.5%) |
| 15 to 19 Minutes | 24,602 (17.1%) | 25,729 (19.3%) |
| 20 to 24 Minutes | 19,014 (13.2%) | 18,534 (13.9%) |
| 25 to 29 Minutes | 7,644 (5.3%) | 7,723 (5.8%) |
| 30 to 34 Minutes | 16,147 (11.2%) | 12,133 (9.1%) |
| 35 to 39 Minutes | 3,028 (2.1%) | 2,579 (1.9%) |
| 40 to 44 Minutes | 3,166 (2.2%) | 3,365 (2.5%) |
| 45 to 59 Minutes | 8,525 (5.9%) | 6,798 (5.1%) |
| 60 to 89 Minutes | 6,492 (4.5%) | 3,946 (3.0%) |
| 90 or more Minutes | 4,028 (2.8%) | 2,023 (1.5%) |
Time of Departure to Work by Sex in Area Code 229
The most frequent times of departure to work in Area Code 229 are 7:00 AM to 7:29 AM (25,679, 17.9%) for males and 7:30 AM to 7:59 AM (23,731, 17.8%) for females.
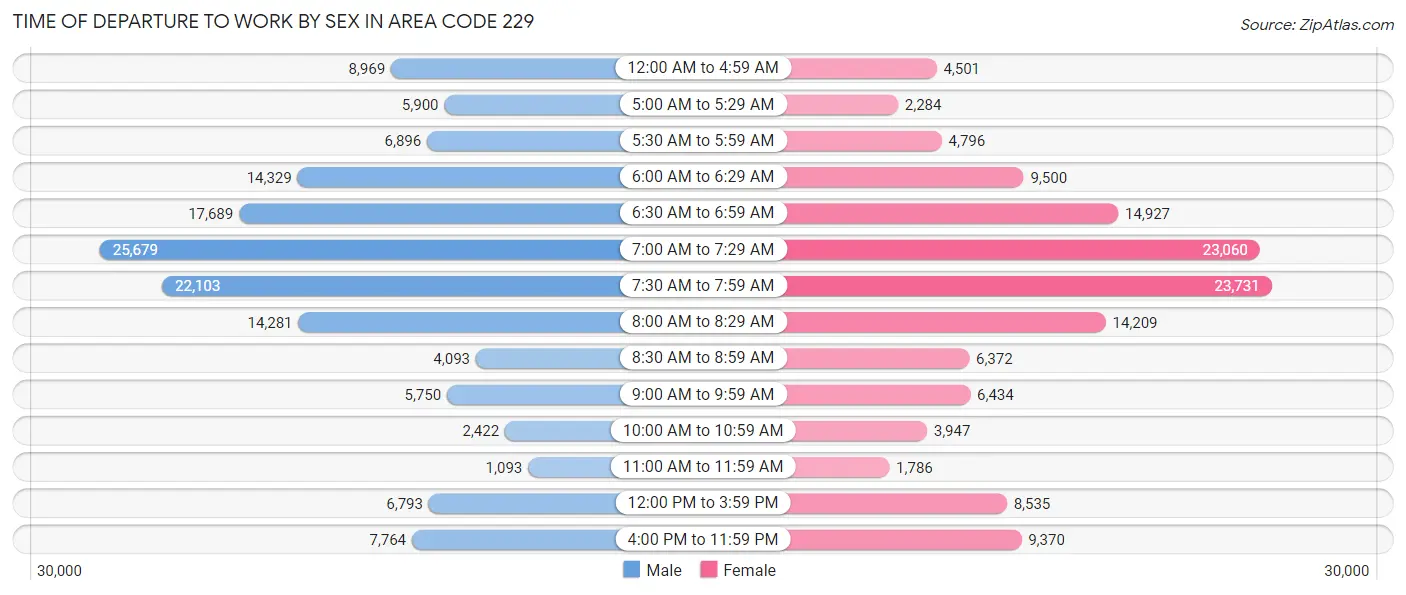
| Time of Departure | Male | Female |
| 12:00 AM to 4:59 AM | 8,969 (6.2%) | 4,501 (3.4%) |
| 5:00 AM to 5:29 AM | 5,900 (4.1%) | 2,284 (1.7%) |
| 5:30 AM to 5:59 AM | 6,896 (4.8%) | 4,796 (3.6%) |
| 6:00 AM to 6:29 AM | 14,329 (10.0%) | 9,500 (7.1%) |
| 6:30 AM to 6:59 AM | 17,689 (12.3%) | 14,927 (11.2%) |
| 7:00 AM to 7:29 AM | 25,679 (17.9%) | 23,060 (17.3%) |
| 7:30 AM to 7:59 AM | 22,103 (15.4%) | 23,731 (17.8%) |
| 8:00 AM to 8:29 AM | 14,281 (9.9%) | 14,209 (10.6%) |
| 8:30 AM to 8:59 AM | 4,093 (2.9%) | 6,372 (4.8%) |
| 9:00 AM to 9:59 AM | 5,750 (4.0%) | 6,434 (4.8%) |
| 10:00 AM to 10:59 AM | 2,422 (1.7%) | 3,947 (3.0%) |
| 11:00 AM to 11:59 AM | 1,093 (0.8%) | 1,786 (1.3%) |
| 12:00 PM to 3:59 PM | 6,793 (4.7%) | 8,535 (6.4%) |
| 4:00 PM to 11:59 PM | 7,764 (5.4%) | 9,370 (7.0%) |
| Total | 143,761 (100.0%) | 133,452 (100.0%) |
Housing Occupancy in Area Code 229
Occupancy by Ownership in Area Code 229
Of the total 264,263 dwellings in Area Code 229, owner-occupied units account for 160,463 (60.7%), while renter-occupied units make up 103,800 (39.3%).
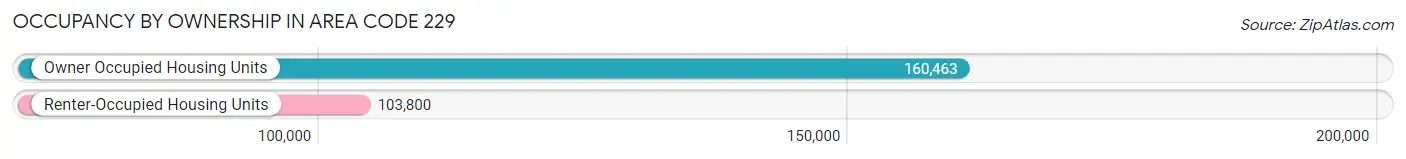
| Occupancy | # Housing Units | % Housing Units |
| Owner Occupied Housing Units | 160,463 | 60.7% |
| Renter-Occupied Housing Units | 103,800 | 39.3% |
| Total Occupied Housing Units | 264,263 | 100.0% |
Occupancy by Household Size in Area Code 229
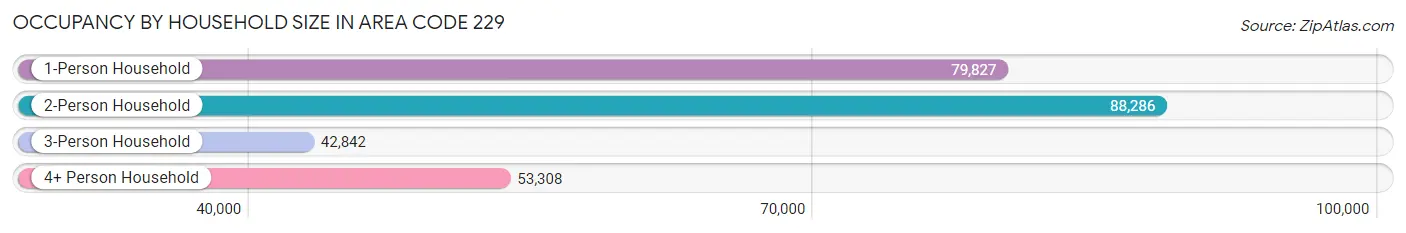
| Household Size | # Housing Units | % Housing Units |
| 1-Person Household | 79,827 | 30.2% |
| 2-Person Household | 88,286 | 33.4% |
| 3-Person Household | 42,842 | 16.2% |
| 4+ Person Household | 53,308 | 20.2% |
| Total Housing Units | 264,263 | 100.0% |
Occupancy by Ownership by Household Size in Area Code 229
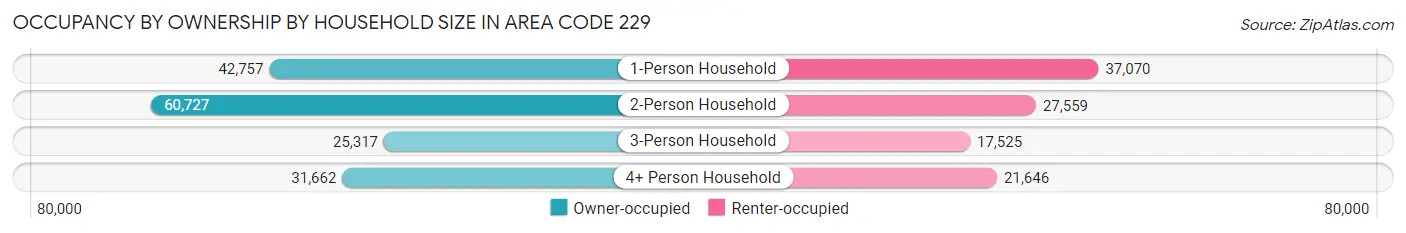
| Household Size | Owner-occupied | Renter-occupied |
| 1-Person Household | 42,757 (53.6%) | 37,070 (46.4%) |
| 2-Person Household | 60,727 (68.8%) | 27,559 (31.2%) |
| 3-Person Household | 25,317 (59.1%) | 17,525 (40.9%) |
| 4+ Person Household | 31,662 (59.4%) | 21,646 (40.6%) |
| Total Housing Units | 160,463 (60.7%) | 103,800 (39.3%) |
Occupancy by Educational Attainment in Area Code 229
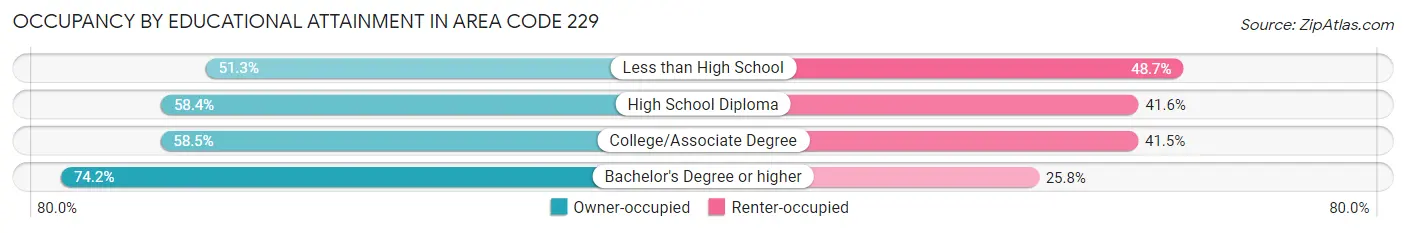
| Household Size | Owner-occupied | Renter-occupied |
| Less than High School | 18,848 (51.3%) | 17,901 (48.7%) |
| High School Diploma | 50,254 (58.4%) | 35,843 (41.6%) |
| College/Associate Degree | 50,467 (58.5%) | 35,855 (41.5%) |
| Bachelor's Degree or higher | 40,894 (74.2%) | 14,201 (25.8%) |
Occupancy by Age of Householder in Area Code 229
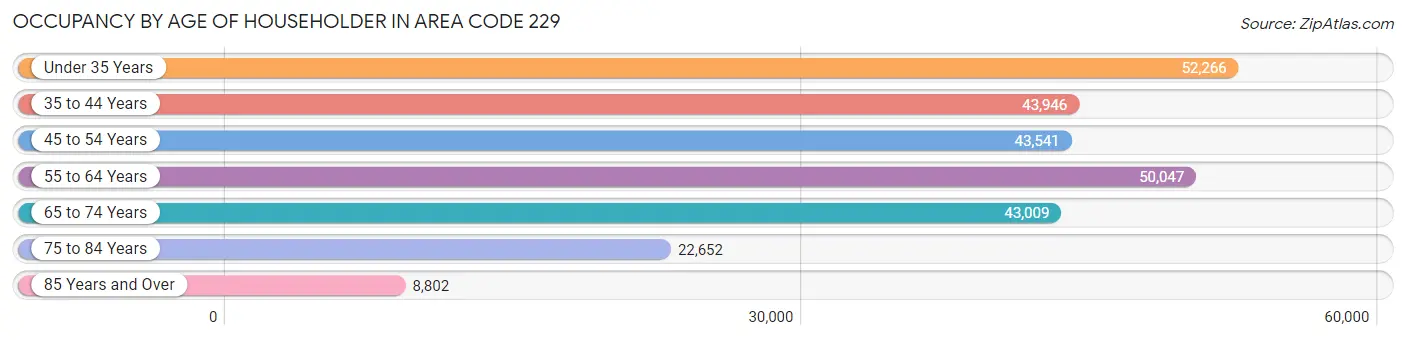
| Age Bracket | # Households | % Households |
| Under 35 Years | 52,266 | 19.8% |
| 35 to 44 Years | 43,946 | 16.6% |
| 45 to 54 Years | 43,541 | 16.5% |
| 55 to 64 Years | 50,047 | 18.9% |
| 65 to 74 Years | 43,009 | 16.3% |
| 75 to 84 Years | 22,652 | 8.6% |
| 85 Years and Over | 8,802 | 3.3% |
| Total | 264,263 | 100.0% |
Housing Finances in Area Code 229
Median Income by Occupancy in Area Code 229
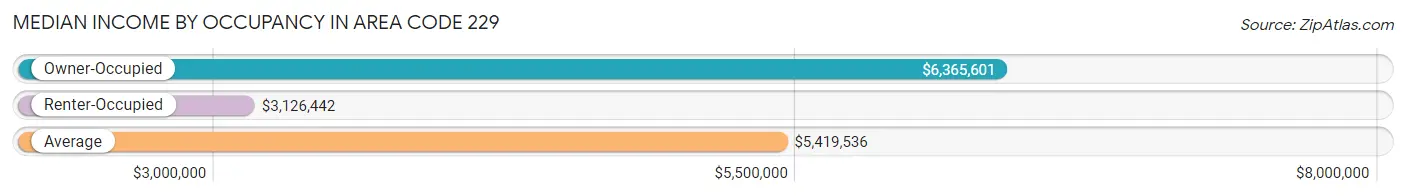
| Occupancy Type | # Households | Median Income |
| Owner-Occupied | 160,463 (60.7%) | $6,365,601 |
| Renter-Occupied | 103,800 (39.3%) | $3,126,442 |
| Average | 264,263 (100.0%) | $5,419,536 |
Occupancy by Householder Income Bracket in Area Code 229
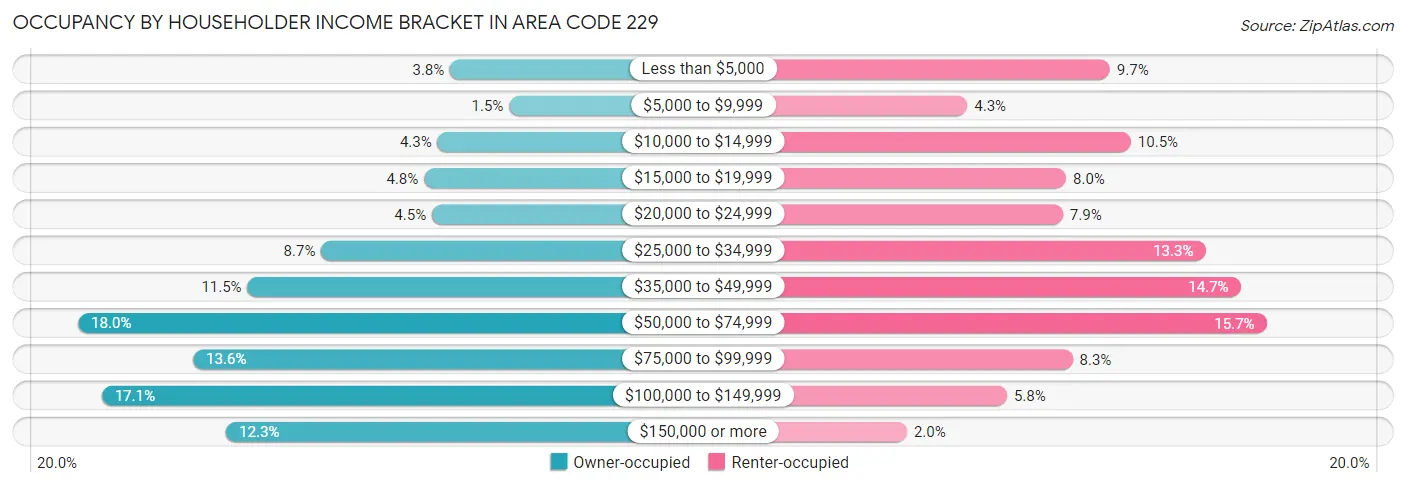
| Income Bracket | Owner-occupied | Renter-occupied |
| Less than $5,000 | 6,084 (3.8%) | 10,057 (9.7%) |
| $5,000 to $9,999 | 2,468 (1.5%) | 4,417 (4.3%) |
| $10,000 to $14,999 | 6,847 (4.3%) | 10,891 (10.5%) |
| $15,000 to $19,999 | 7,666 (4.8%) | 8,326 (8.0%) |
| $20,000 to $24,999 | 7,193 (4.5%) | 8,200 (7.9%) |
| $25,000 to $34,999 | 13,967 (8.7%) | 13,829 (13.3%) |
| $35,000 to $49,999 | 18,470 (11.5%) | 15,221 (14.7%) |
| $50,000 to $74,999 | 28,820 (18.0%) | 16,245 (15.7%) |
| $75,000 to $99,999 | 21,791 (13.6%) | 8,586 (8.3%) |
| $100,000 to $149,999 | 27,381 (17.1%) | 5,991 (5.8%) |
| $150,000 or more | 19,776 (12.3%) | 2,037 (2.0%) |
| Total | 160,463 (100.0%) | 103,800 (100.0%) |
Monthly Housing Cost Tiers in Area Code 229
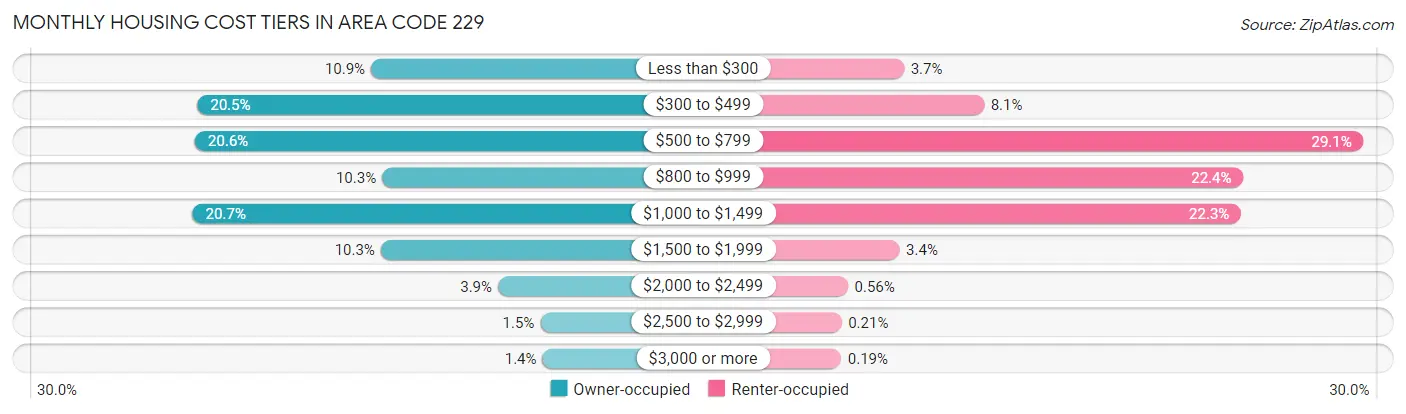
| Monthly Cost | Owner-occupied | Renter-occupied |
| Less than $300 | 17,438 (10.9%) | 3,795 (3.7%) |
| $300 to $499 | 32,830 (20.5%) | 8,383 (8.1%) |
| $500 to $799 | 33,040 (20.6%) | 30,166 (29.1%) |
| $800 to $999 | 16,457 (10.3%) | 23,268 (22.4%) |
| $1,000 to $1,499 | 33,249 (20.7%) | 23,149 (22.3%) |
| $1,500 to $1,999 | 16,576 (10.3%) | 3,540 (3.4%) |
| $2,000 to $2,499 | 6,189 (3.9%) | 585 (0.6%) |
| $2,500 to $2,999 | 2,443 (1.5%) | 223 (0.2%) |
| $3,000 or more | 2,241 (1.4%) | 194 (0.2%) |
| Total | 160,463 (100.0%) | 103,800 (100.0%) |
Physical Housing Characteristics in Area Code 229
Housing Structures in Area Code 229
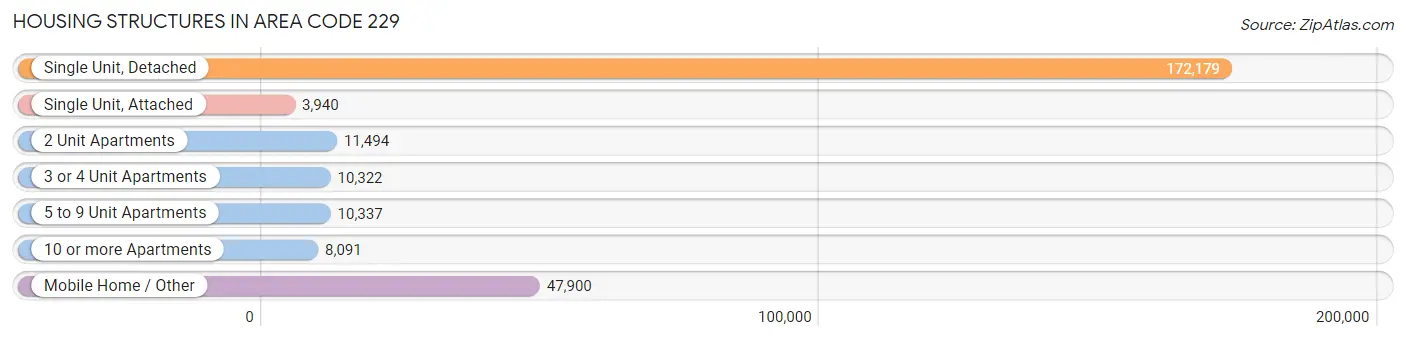
| Structure Type | # Housing Units | % Housing Units |
| Single Unit, Detached | 172,179 | 65.1% |
| Single Unit, Attached | 3,940 | 1.5% |
| 2 Unit Apartments | 11,494 | 4.3% |
| 3 or 4 Unit Apartments | 10,322 | 3.9% |
| 5 to 9 Unit Apartments | 10,337 | 3.9% |
| 10 or more Apartments | 8,091 | 3.1% |
| Mobile Home / Other | 47,900 | 18.1% |
| Total | 264,263 | 100.0% |
Housing Structures by Occupancy in Area Code 229
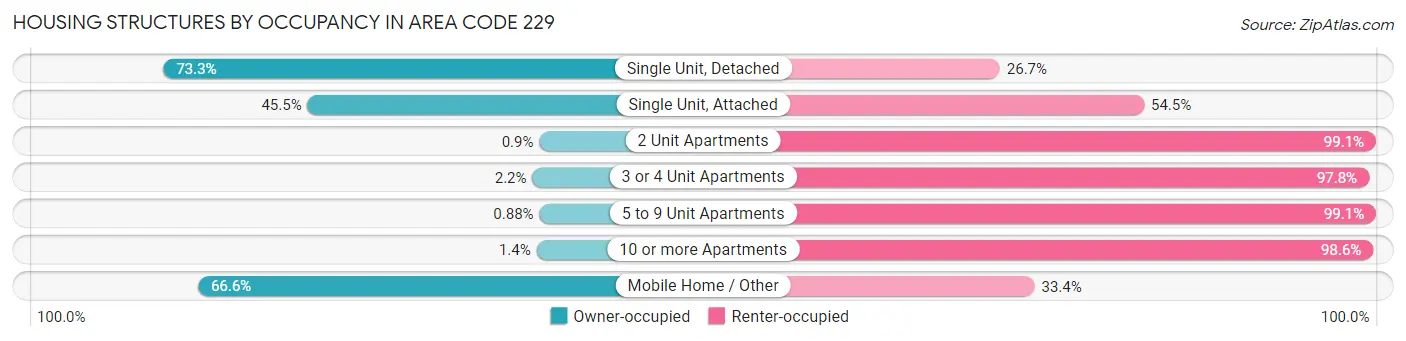
| Structure Type | Owner-occupied | Renter-occupied |
| Single Unit, Detached | 126,214 (73.3%) | 45,965 (26.7%) |
| Single Unit, Attached | 1,794 (45.5%) | 2,146 (54.5%) |
| 2 Unit Apartments | 104 (0.9%) | 11,390 (99.1%) |
| 3 or 4 Unit Apartments | 231 (2.2%) | 10,091 (97.8%) |
| 5 to 9 Unit Apartments | 91 (0.9%) | 10,246 (99.1%) |
| 10 or more Apartments | 116 (1.4%) | 7,975 (98.6%) |
| Mobile Home / Other | 31,913 (66.6%) | 15,987 (33.4%) |
| Total | 160,463 (60.7%) | 103,800 (39.3%) |
Housing Structures by Number of Rooms in Area Code 229
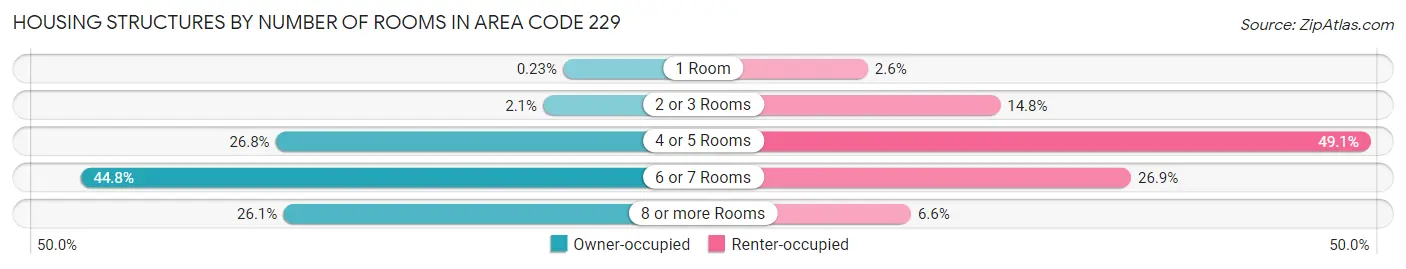
| Number of Rooms | Owner-occupied | Renter-occupied |
| 1 Room | 364 (0.2%) | 2,688 (2.6%) |
| 2 or 3 Rooms | 3,317 (2.1%) | 15,390 (14.8%) |
| 4 or 5 Rooms | 43,006 (26.8%) | 50,944 (49.1%) |
| 6 or 7 Rooms | 71,918 (44.8%) | 27,955 (26.9%) |
| 8 or more Rooms | 41,858 (26.1%) | 6,823 (6.6%) |
| Total | 160,463 (100.0%) | 103,800 (100.0%) |
Housing Structure by Heating Type in Area Code 229
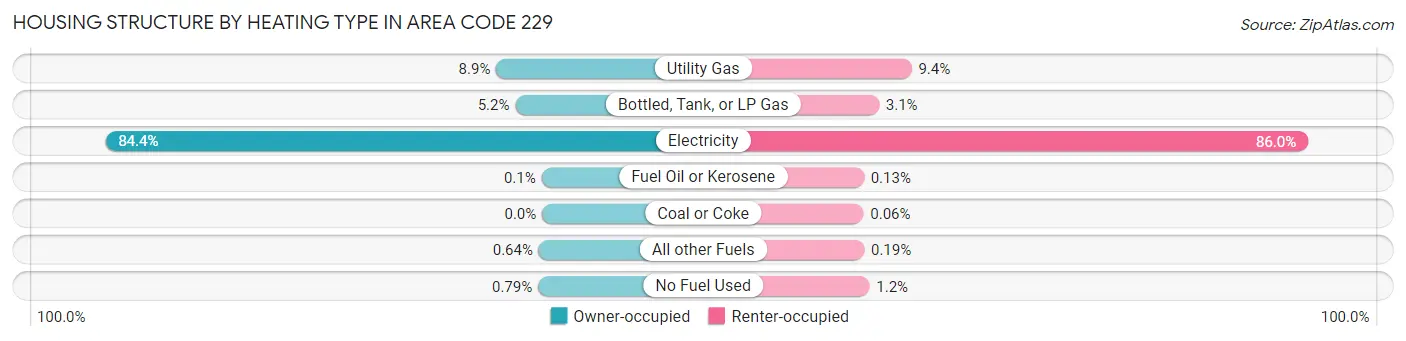
| Heating Type | Owner-occupied | Renter-occupied |
| Utility Gas | 14,225 (8.9%) | 9,720 (9.4%) |
| Bottled, Tank, or LP Gas | 8,316 (5.2%) | 3,169 (3.0%) |
| Electricity | 135,466 (84.4%) | 89,244 (86.0%) |
| Fuel Oil or Kerosene | 159 (0.1%) | 138 (0.1%) |
| Coal or Coke | 0 (0.0%) | 62 (0.1%) |
| All other Fuels | 1,030 (0.6%) | 197 (0.2%) |
| No Fuel Used | 1,267 (0.8%) | 1,270 (1.2%) |
| Total | 160,463 (100.0%) | 103,800 (100.0%) |
Household Vehicle Usage in Area Code 229
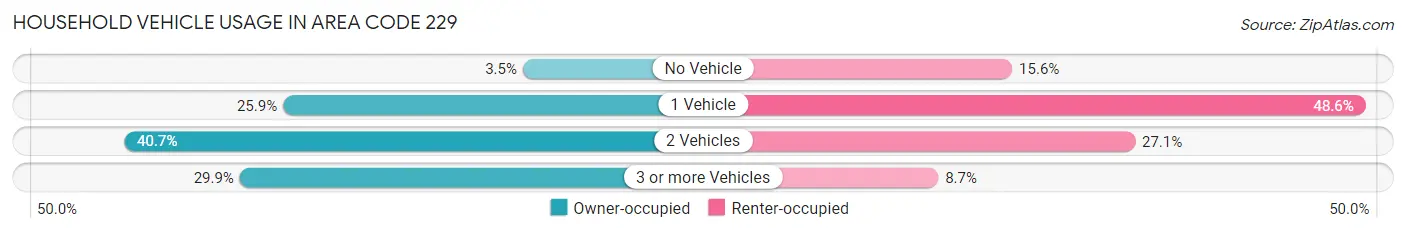
| Vehicles per Household | Owner-occupied | Renter-occupied |
| No Vehicle | 5,603 (3.5%) | 16,207 (15.6%) |
| 1 Vehicle | 41,523 (25.9%) | 50,444 (48.6%) |
| 2 Vehicles | 65,333 (40.7%) | 28,110 (27.1%) |
| 3 or more Vehicles | 48,004 (29.9%) | 9,039 (8.7%) |
| Total | 160,463 (100.0%) | 103,800 (100.0%) |
Real Estate & Mortgages in Area Code 229
Real Estate and Mortgage Overview in Area Code 229
| Characteristic | Without Mortgage | With Mortgage |
| Housing Units | 79,160 | 81,303 |
| Median Property Value | $10,660,600 | $15,095,900 |
| Median Household Income | $5,128,360 | $13,141 |
| Monthly Housing Costs | $49,043 | $2,199 |
| Real Estate Taxes | $114,423 | $2,582 |
Property Value by Mortgage Status in Area Code 229
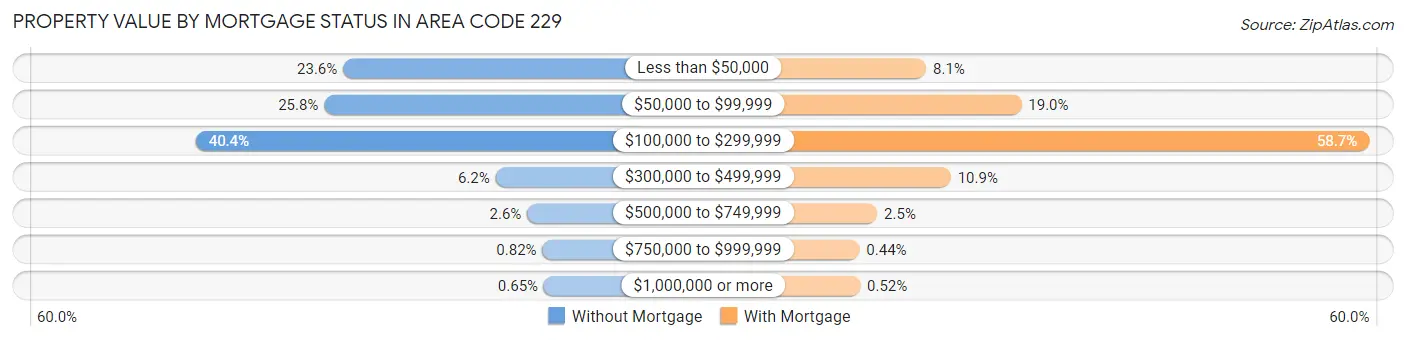
| Property Value | Without Mortgage | With Mortgage |
| Less than $50,000 | 18,681 (23.6%) | 6,551 (8.1%) |
| $50,000 to $99,999 | 20,389 (25.8%) | 15,405 (19.0%) |
| $100,000 to $299,999 | 32,006 (40.4%) | 47,716 (58.7%) |
| $300,000 to $499,999 | 4,894 (6.2%) | 8,849 (10.9%) |
| $500,000 to $749,999 | 2,028 (2.6%) | 2,005 (2.5%) |
| $750,000 to $999,999 | 648 (0.8%) | 356 (0.4%) |
| $1,000,000 or more | 514 (0.6%) | 421 (0.5%) |
| Total | 79,160 (100.0%) | 81,303 (100.0%) |
Household Income by Mortgage Status in Area Code 229
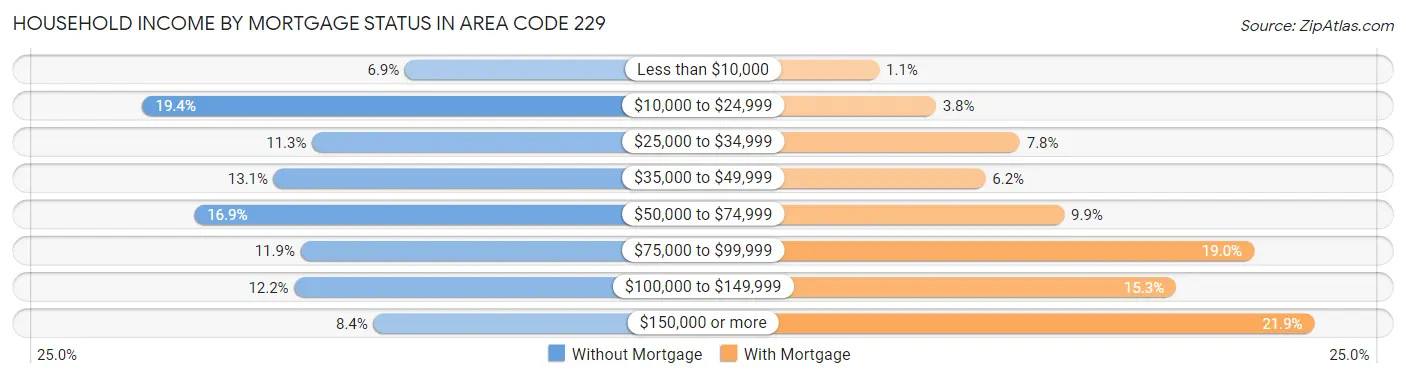
| Household Income | Without Mortgage | With Mortgage |
| Less than $10,000 | 5,447 (6.9%) | 911 (1.1%) |
| $10,000 to $24,999 | 15,345 (19.4%) | 3,105 (3.8%) |
| $25,000 to $34,999 | 8,945 (11.3%) | 6,361 (7.8%) |
| $35,000 to $49,999 | 10,395 (13.1%) | 5,022 (6.2%) |
| $50,000 to $74,999 | 13,395 (16.9%) | 8,075 (9.9%) |
| $75,000 to $99,999 | 9,382 (11.8%) | 15,425 (19.0%) |
| $100,000 to $149,999 | 9,616 (12.1%) | 12,409 (15.3%) |
| $150,000 or more | 6,635 (8.4%) | 17,765 (21.8%) |
| Total | 79,160 (100.0%) | 81,303 (100.0%) |
Property Value to Household Income Ratio in Area Code 229
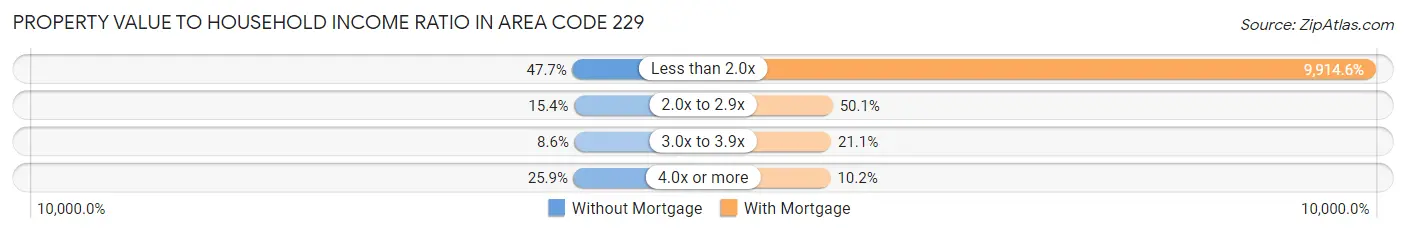
| Value-to-Income Ratio | Without Mortgage | With Mortgage |
| Less than 2.0x | 37,760 (47.7%) | 8,060,893 (9,914.6%) |
| 2.0x to 2.9x | 12,164 (15.4%) | 40,725 (50.1%) |
| 3.0x to 3.9x | 6,780 (8.6%) | 17,177 (21.1%) |
| 4.0x or more | 20,476 (25.9%) | 8,295 (10.2%) |
| Total | 79,160 (100.0%) | 81,303 (100.0%) |
Real Estate Taxes by Mortgage Status in Area Code 229
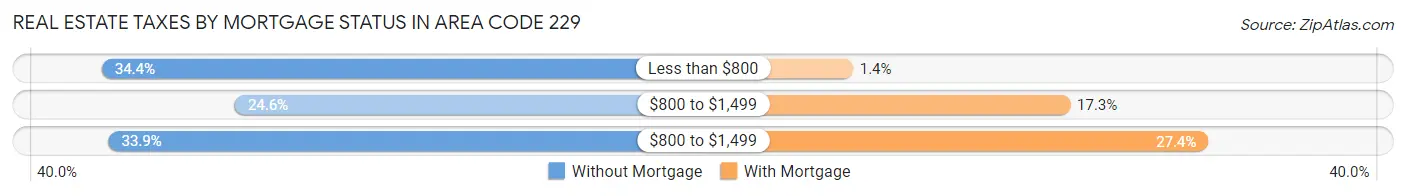
| Property Taxes | Without Mortgage | With Mortgage |
| Less than $800 | 27,201 (34.4%) | 1,167 (1.4%) |
| $800 to $1,499 | 19,494 (24.6%) | 14,081 (17.3%) |
| $800 to $1,499 | 26,808 (33.9%) | 22,295 (27.4%) |
| Total | 79,160 (100.0%) | 81,303 (100.0%) |
Health & Disability in Area Code 229
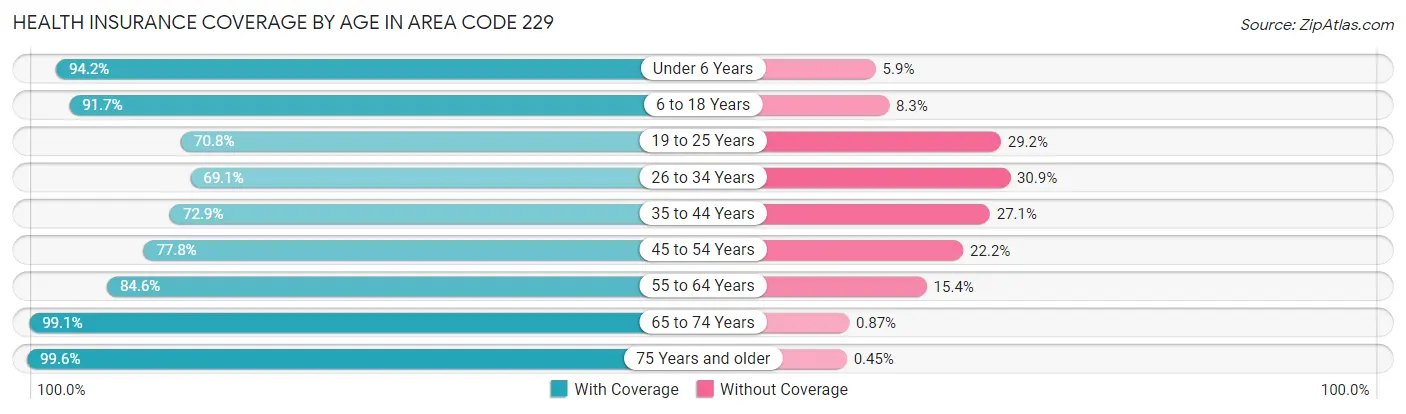
Health Insurance Coverage by Age in Area Code 229
| Age Bracket | With Coverage | Without Coverage |
| Under 6 Years | 49,039 (94.2%) | 3,049 (5.9%) |
| 6 to 18 Years | 116,484 (91.7%) | 10,585 (8.3%) |
| 19 to 25 Years | 49,480 (70.8%) | 20,391 (29.2%) |
| 26 to 34 Years | 50,541 (69.1%) | 22,601 (30.9%) |
| 35 to 44 Years | 60,525 (72.9%) | 22,530 (27.1%) |
| 45 to 54 Years | 62,199 (77.8%) | 17,722 (22.2%) |
| 55 to 64 Years | 72,547 (84.6%) | 13,162 (15.4%) |
| 65 to 74 Years | 68,279 (99.1%) | 596 (0.9%) |
| 75 Years and older | 44,703 (99.6%) | 203 (0.4%) |
| Total | 573,797 (83.8%) | 110,839 (16.2%) |
Health Insurance Coverage by Citizenship Status in Area Code 229
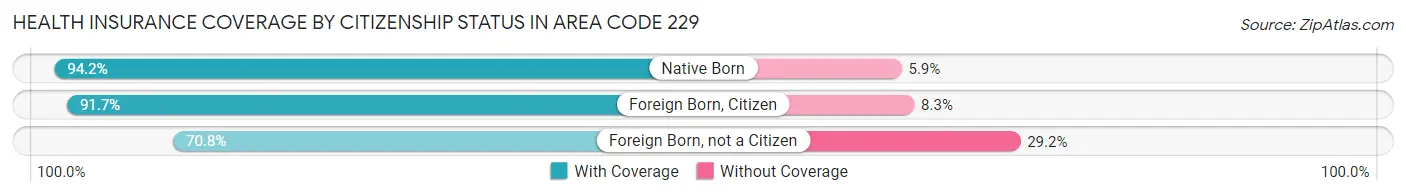
| Citizenship Status | With Coverage | Without Coverage |
| Native Born | 49,039 (94.2%) | 3,049 (5.9%) |
| Foreign Born, Citizen | 116,484 (91.7%) | 10,585 (8.3%) |
| Foreign Born, not a Citizen | 49,480 (70.8%) | 20,391 (29.2%) |
Health Insurance Coverage by Household Income in Area Code 229
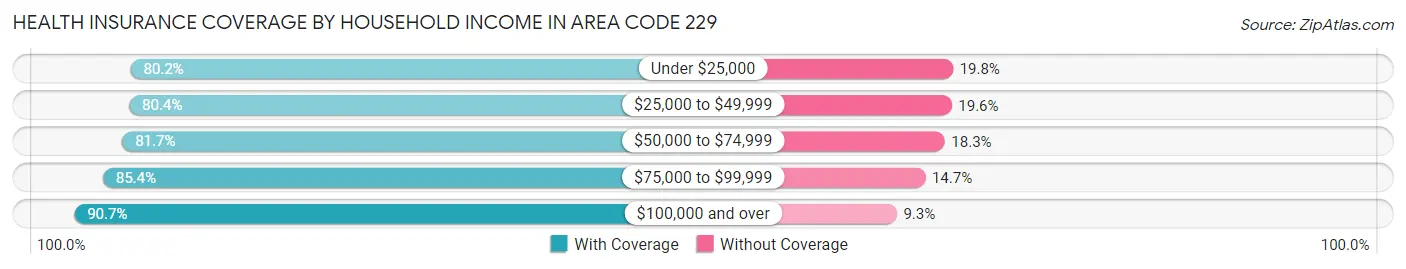
| Household Income | With Coverage | Without Coverage |
| Under $25,000 | 116,074 (80.2%) | 28,736 (19.8%) |
| $25,000 to $49,999 | 117,130 (80.4%) | 28,541 (19.6%) |
| $50,000 to $74,999 | 96,976 (81.7%) | 21,710 (18.3%) |
| $75,000 to $99,999 | 76,904 (85.4%) | 13,204 (14.6%) |
| $100,000 and over | 160,585 (90.7%) | 16,459 (9.3%) |
Public vs Private Health Insurance Coverage by Age in Area Code 229
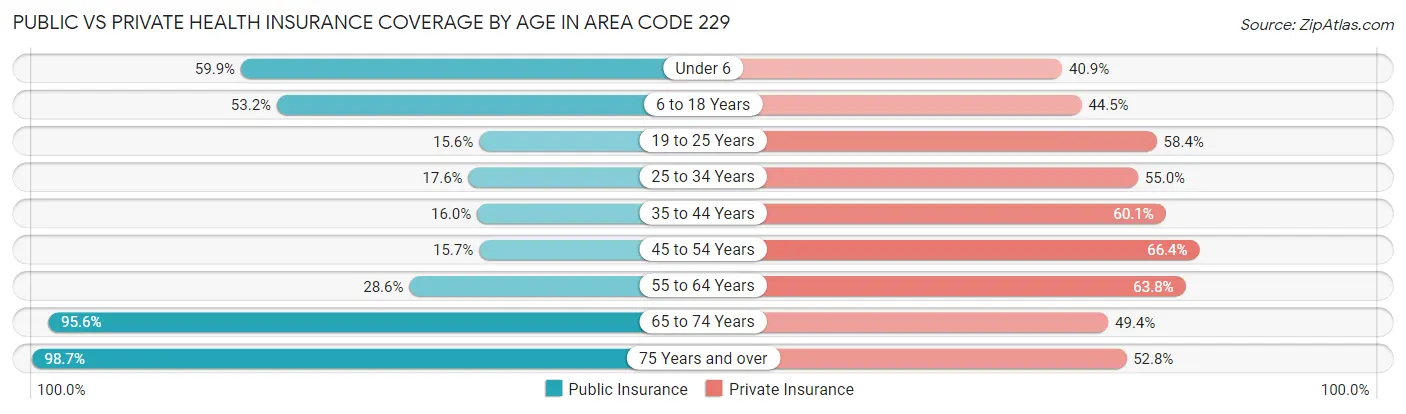
| Age Bracket | Public Insurance | Private Insurance |
| Under 6 | 31,174 (59.9%) | 21,298 (40.9%) |
| 6 to 18 Years | 67,564 (53.2%) | 56,525 (44.5%) |
| 19 to 25 Years | 10,930 (15.6%) | 40,832 (58.4%) |
| 25 to 34 Years | 12,885 (17.6%) | 40,196 (55.0%) |
| 35 to 44 Years | 13,303 (16.0%) | 49,927 (60.1%) |
| 45 to 54 Years | 12,505 (15.7%) | 53,039 (66.4%) |
| 55 to 64 Years | 24,505 (28.6%) | 54,659 (63.8%) |
| 65 to 74 Years | 65,858 (95.6%) | 34,047 (49.4%) |
| 75 Years and over | 44,322 (98.7%) | 23,704 (52.8%) |
| Total | 283,046 (41.3%) | 374,227 (54.7%) |
Disability Status by Sex by Age in Area Code 229
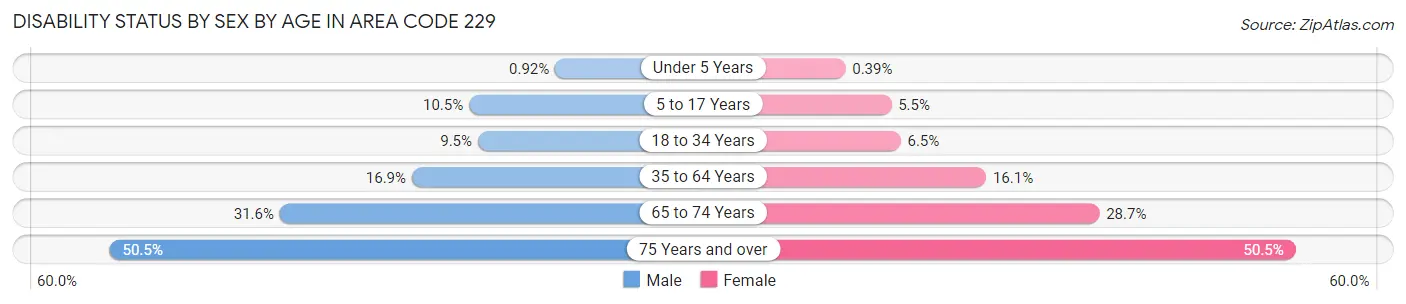
| Age Bracket | Male | Female |
| Under 5 Years | 208 (0.9%) | 81 (0.4%) |
| 5 to 17 Years | 6,746 (10.5%) | 3,325 (5.5%) |
| 18 to 34 Years | 7,008 (9.5%) | 5,266 (6.5%) |
| 35 to 64 Years | 19,829 (16.9%) | 21,061 (16.1%) |
| 65 to 74 Years | 9,992 (31.6%) | 10,673 (28.7%) |
| 75 Years and over | 9,020 (50.5%) | 13,675 (50.5%) |
Disability Class by Sex by Age in Area Code 229
Disability Class: Hearing Difficulty
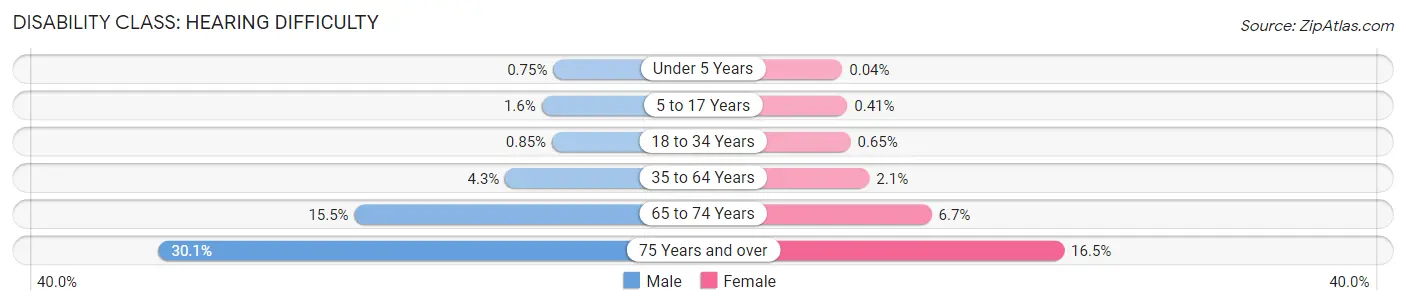
| Age Bracket | Male | Female |
| Under 5 Years | 168 (0.7%) | 9 (0.0%) |
| 5 to 17 Years | 1,041 (1.6%) | 249 (0.4%) |
| 18 to 34 Years | 624 (0.9%) | 524 (0.6%) |
| 35 to 64 Years | 5,071 (4.3%) | 2,690 (2.1%) |
| 65 to 74 Years | 4,908 (15.5%) | 2,484 (6.7%) |
| 75 Years and over | 5,363 (30.0%) | 4,467 (16.5%) |
Disability Class: Vision Difficulty
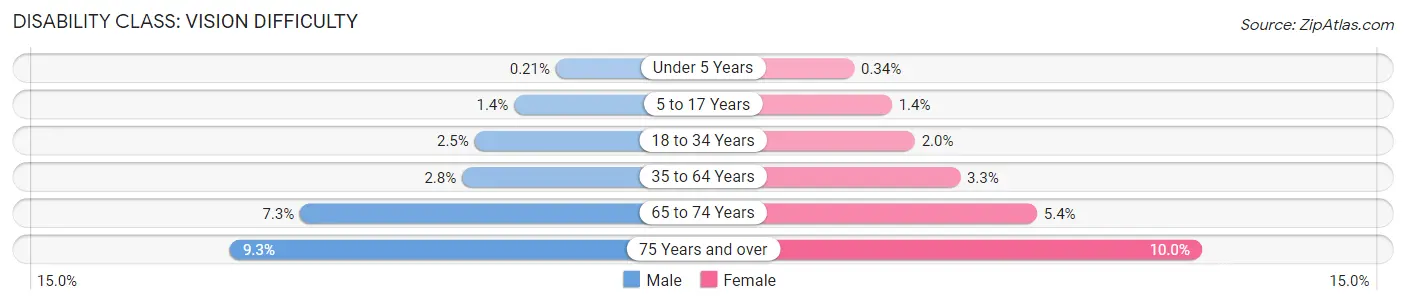
| Age Bracket | Male | Female |
| Under 5 Years | 48 (0.2%) | 72 (0.3%) |
| 5 to 17 Years | 879 (1.4%) | 841 (1.4%) |
| 18 to 34 Years | 1,815 (2.5%) | 1,637 (2.0%) |
| 35 to 64 Years | 3,311 (2.8%) | 4,321 (3.3%) |
| 65 to 74 Years | 2,321 (7.3%) | 2,022 (5.4%) |
| 75 Years and over | 1,657 (9.3%) | 2,711 (10.0%) |
Disability Class: Cognitive Difficulty
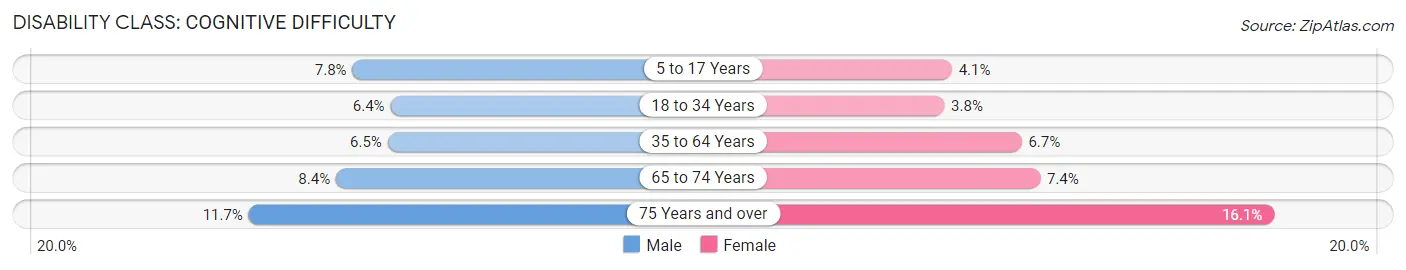
| Age Bracket | Male | Female |
| 5 to 17 Years | 5,029 (7.8%) | 2,465 (4.1%) |
| 18 to 34 Years | 4,725 (6.4%) | 3,056 (3.8%) |
| 35 to 64 Years | 7,666 (6.5%) | 8,748 (6.7%) |
| 65 to 74 Years | 2,670 (8.4%) | 2,740 (7.4%) |
| 75 Years and over | 2,085 (11.7%) | 4,342 (16.1%) |
Disability Class: Ambulatory Difficulty
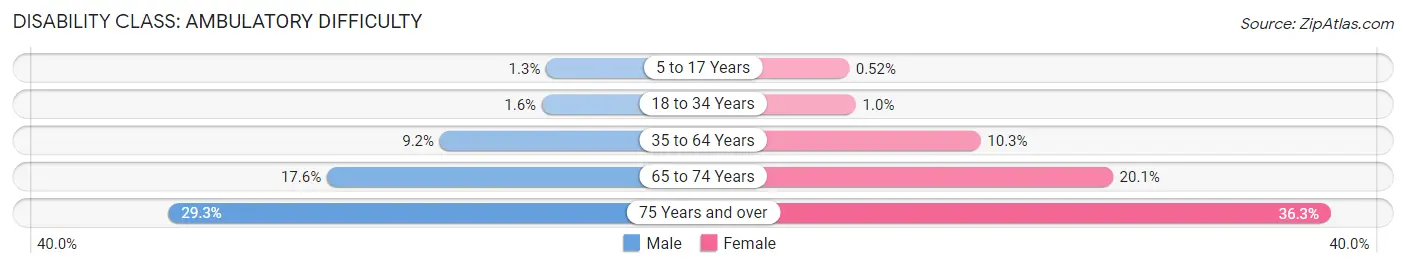
| Age Bracket | Male | Female |
| 5 to 17 Years | 818 (1.3%) | 313 (0.5%) |
| 18 to 34 Years | 1,170 (1.6%) | 829 (1.0%) |
| 35 to 64 Years | 10,777 (9.2%) | 13,497 (10.3%) |
| 65 to 74 Years | 5,554 (17.5%) | 7,488 (20.1%) |
| 75 Years and over | 5,233 (29.3%) | 9,826 (36.3%) |
Disability Class: Self-Care Difficulty
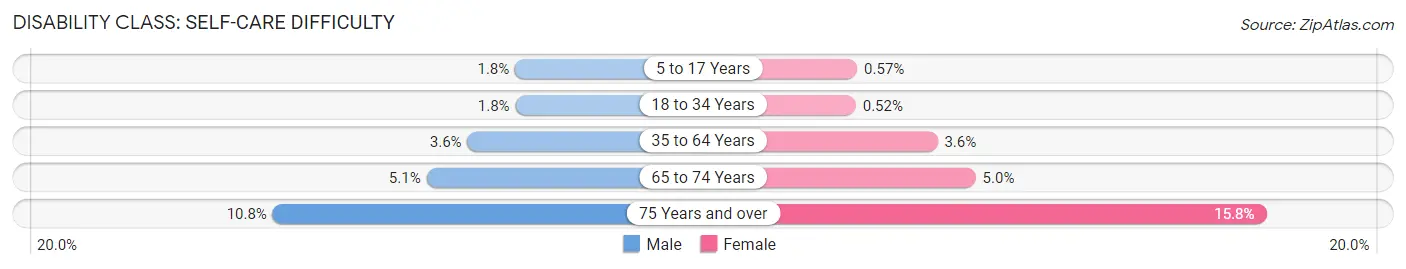
| Age Bracket | Male | Female |
| 5 to 17 Years | 1,151 (1.8%) | 342 (0.6%) |
| 18 to 34 Years | 1,312 (1.8%) | 416 (0.5%) |
| 35 to 64 Years | 4,181 (3.6%) | 4,660 (3.5%) |
| 65 to 74 Years | 1,607 (5.1%) | 1,852 (5.0%) |
| 75 Years and over | 1,926 (10.8%) | 4,263 (15.8%) |
Technology Access in Area Code 229
Computing Device Access in Area Code 229
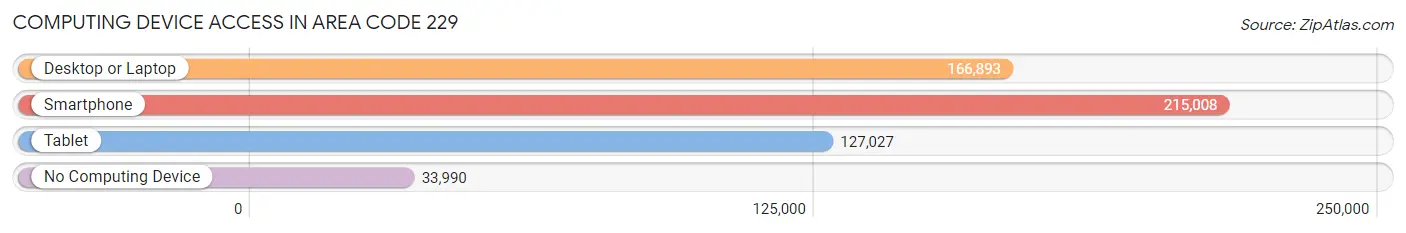
| Device Type | # Households | % Households |
| Desktop or Laptop | 166,893 | 63.1% |
| Smartphone | 215,008 | 81.4% |
| Tablet | 127,027 | 48.1% |
| No Computing Device | 33,990 | 12.9% |
| Total | 264,263 | 100.0% |
Internet Access in Area Code 229
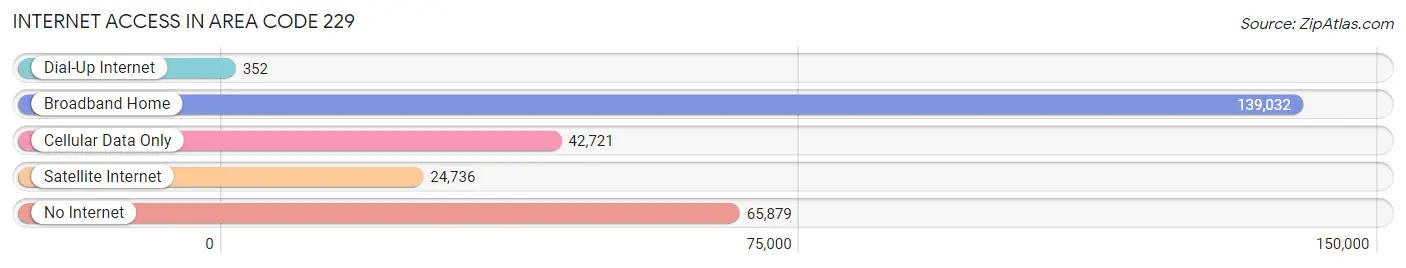
| Internet Type | # Households | % Households |
| Dial-Up Internet | 352 | 0.1% |
| Broadband Home | 139,032 | 52.6% |
| Cellular Data Only | 42,721 | 16.2% |
| Satellite Internet | 24,736 | 9.4% |
| No Internet | 65,879 | 24.9% |
| Total | 264,263 | 100.0% |
Area Code 229 Summary
Geography
Area code 229 is located in the southwestern region of Georgia, covering the cities of Albany, Valdosta, and Thomasville. It is bordered by area codes 478, 706, and 912.
Social
Area code 229 is home to a diverse population of people from all walks of life. The area is known for its vibrant music and art scene, as well as its strong sense of community.
Economics
Area code 229 is a major economic hub in the region, with a strong agricultural and manufacturing base. The area is also home to several universities and colleges, as well as a number of large businesses.
Demographics
Area code 229 is home to a diverse population, with a median age of 33. The population is predominantly African American, with a significant Hispanic population as well. The area has a median household income of $41,000.
Common Questions
What is Per Capita Income in Area Code 229?
Per Capita income in Area Code 229 is $26,273.
What is the Median Family Income in Area Code 229?
Median Family Income in Area Code 229 is $61,551.
What is the Median Household income in Area Code 229?
Median Household Income in Area Code 229 is $49,269.
What is Income or Wage Gap in Area Code 229?
Income or Wage Gap in Area Code 229 is 26.5%.
Women in Area Code 229 earn 73.5 cents for every dollar earned by a man.
What is Family Income Deficit in Area Code 229?
Family Income Deficit in Area Code 229 is $11,443.
Families that are below poverty line in Area Code 229 earn $11,443 less on average than the poverty threshold level.
What is Inequality or Gini Index in Area Code 229?
Inequality or Gini Index in Area Code 229 is 52.75.
What is the Total Population of Area Code 229?
Total Population of Area Code 229 is 709,242.
What is the Total Male Population of Area Code 229?
Total Male Population of Area Code 229 is 347,979.
What is the Total Female Population of Area Code 229?
Total Female Population of Area Code 229 is 361,263.
What is the Ratio of Males per 100 Females in Area Code 229?
There are 96.32 Males per 100 Females in Area Code 229.
What is the Ratio of Females per 100 Males in Area Code 229?
There are 103.82 Females per 100 Males in Area Code 229.
What is the Median Population Age in Area Code 229?
Median Population Age in Area Code 229 is 41.1 Years.
What is the Average Family Size in Area Code 229
Average Family Size in Area Code 229 is 3.2 People.
What is the Average Household Size in Area Code 229
Average Household Size in Area Code 229 is 2.6 People.
How Large is the Labor Force in Area Code 229?
There are 305,256 People in the Labor Forcein in Area Code 229.
What is the Percentage of People in the Labor Force in Area Code 229?
54.5% of People are in the Labor Force in Area Code 229.
What is the Unemployment Rate in Area Code 229?
Unemployment Rate in Area Code 229 is 6.2%.