Area Code 762 Map & Demographics
Area Code 762 Map
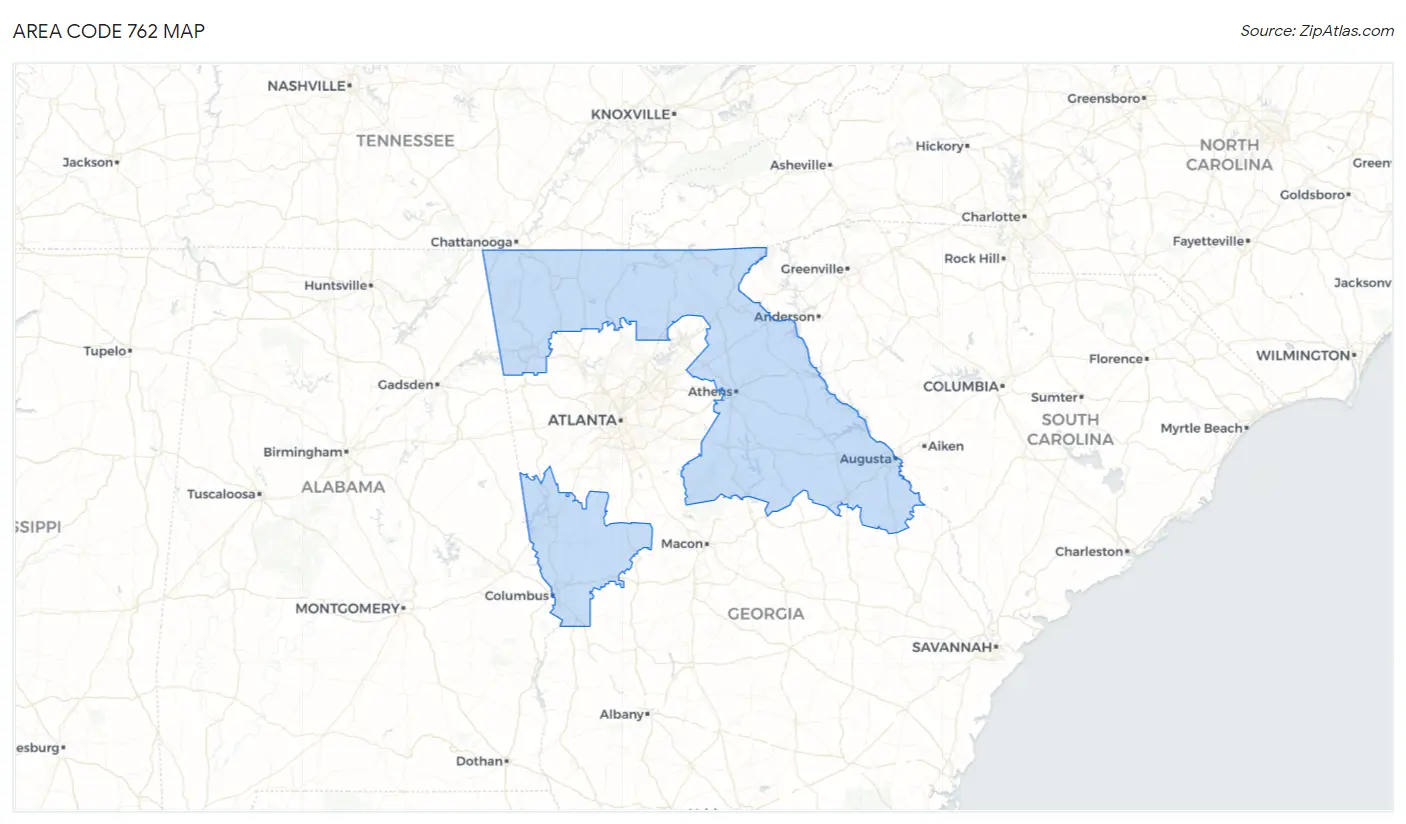
Area Code 762 Overview
$32,287
PER CAPITA INCOME
$70,463
AVG FAMILY INCOME
$57,397
AVG HOUSEHOLD INCOME
30.2%
WAGE / INCOME GAP [ % ]
69.8¢/ $1
WAGE / INCOME GAP [ $ ]
$10,514
FAMILY INCOME DEFICIT
17.70
INEQUALITY / GINI INDEX
670,727
TOTAL POPULATION
326,489
MALE POPULATION
344,238
FEMALE POPULATION
94.84
MALES / 100 FEMALES
105.44
FEMALES / 100 MALES
40.3
MEDIAN AGE
3.1
AVG FAMILY SIZE
2.5
AVG HOUSEHOLD SIZE
305,496
LABOR FORCE [ PEOPLE ]
56.7%
PERCENT IN LABOR FORCE
5.9%
UNEMPLOYMENT RATE
Nearby Area Codes
Income in Area Code 762
Income Overview in Area Code 762
Per Capita Income in Area Code 762 is $32,287, while median incomes of families and households are $70,463 and $57,397 respectively.
| Characteristic | Number | Measure |
| Per Capita Income | 670,727 | $32,287 |
| Median Family Income | 157,841 | $70,463 |
| Mean Family Income | 157,841 | $3,615,245 |
| Median Household Income | 260,762 | $57,397 |
| Mean Household Income | 260,762 | $3,046,043 |
| Income Deficit | 157,841 | $10,514 |
| Wage / Income Gap (%) | 670,727 | 30.25% |
| Wage / Income Gap ($) | 670,727 | 69.75¢ per $1 |
| Gini / Inequality Index | 670,727 | 17.70 |
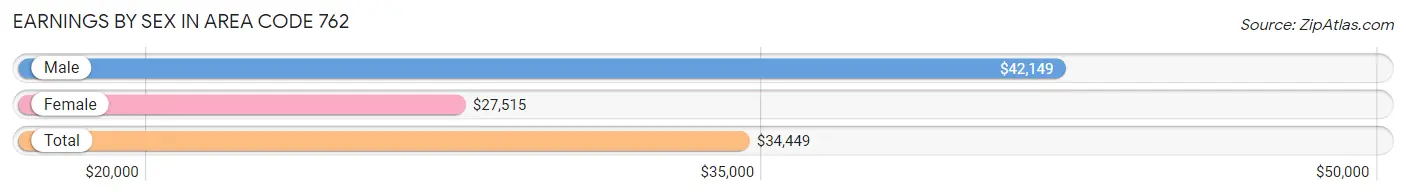
Earnings by Sex in Area Code 762
Average Earnings in Area Code 762 are $34,449, $42,149 for men and $27,515 for women, a difference of 34.7%.
| Sex | Number | Average Earnings |
| Male | 176,756 (51.7%) | $42,149 |
| Female | 165,037 (48.3%) | $27,515 |
| Total | 341,793 (100.0%) | $34,449 |
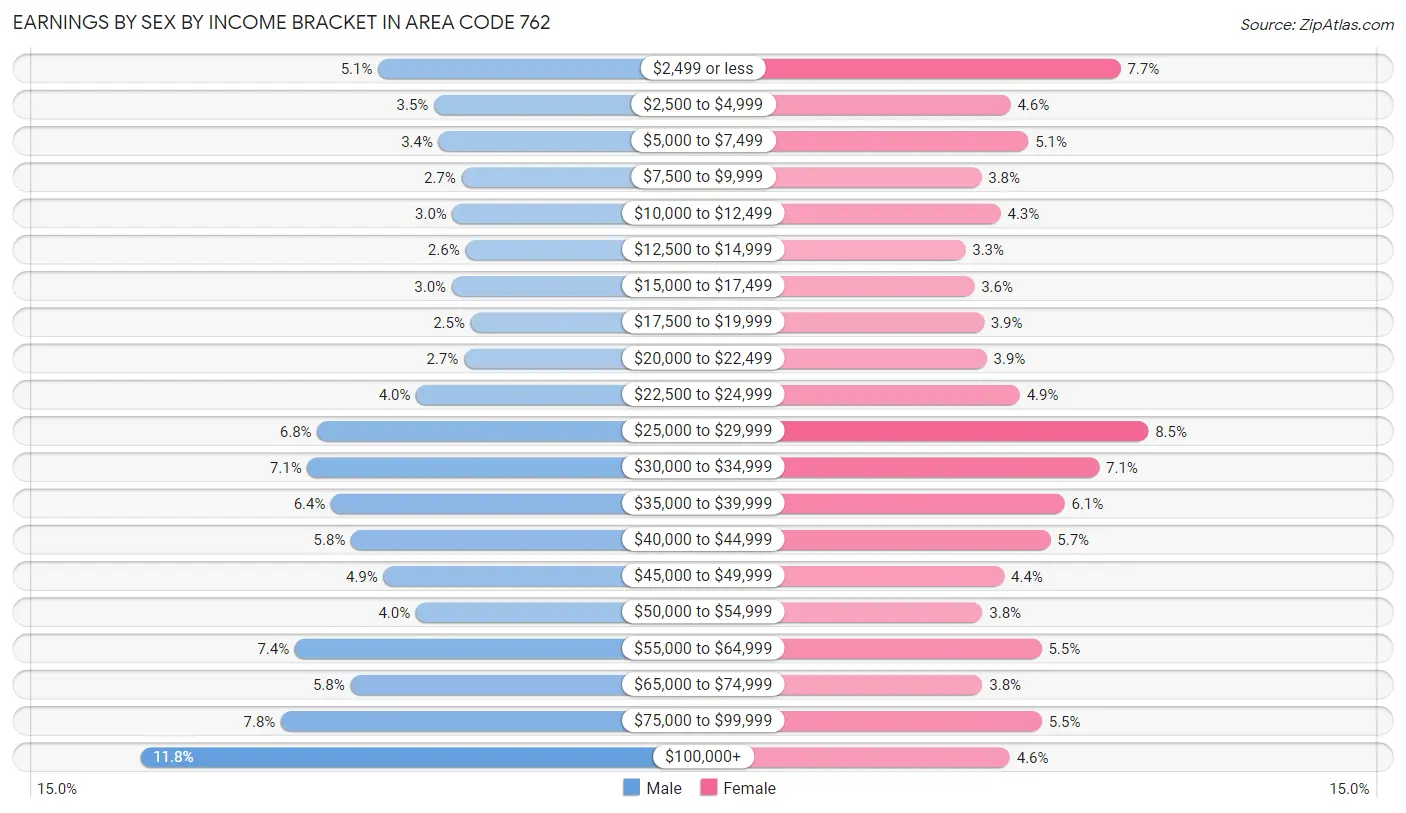
Earnings by Sex by Income Bracket in Area Code 762
The most common earnings brackets in Area Code 762 are $100,000+ for men (20,765 | 11.7%) and $25,000 to $29,999 for women (13,981 | 8.5%).
| Income | Male | Female |
| $2,499 or less | 8,946 (5.1%) | 12,685 (7.7%) |
| $2,500 to $4,999 | 6,161 (3.5%) | 7,596 (4.6%) |
| $5,000 to $7,499 | 5,937 (3.4%) | 8,413 (5.1%) |
| $7,500 to $9,999 | 4,802 (2.7%) | 6,241 (3.8%) |
| $10,000 to $12,499 | 5,241 (3.0%) | 7,122 (4.3%) |
| $12,500 to $14,999 | 4,608 (2.6%) | 5,499 (3.3%) |
| $15,000 to $17,499 | 5,277 (3.0%) | 5,902 (3.6%) |
| $17,500 to $19,999 | 4,354 (2.5%) | 6,347 (3.8%) |
| $20,000 to $22,499 | 4,682 (2.6%) | 6,490 (3.9%) |
| $22,500 to $24,999 | 7,049 (4.0%) | 8,017 (4.9%) |
| $25,000 to $29,999 | 11,972 (6.8%) | 13,981 (8.5%) |
| $30,000 to $34,999 | 12,467 (7.0%) | 11,701 (7.1%) |
| $35,000 to $39,999 | 11,281 (6.4%) | 10,106 (6.1%) |
| $40,000 to $44,999 | 10,289 (5.8%) | 9,437 (5.7%) |
| $45,000 to $49,999 | 8,687 (4.9%) | 7,290 (4.4%) |
| $50,000 to $54,999 | 7,064 (4.0%) | 6,292 (3.8%) |
| $55,000 to $64,999 | 13,079 (7.4%) | 9,031 (5.5%) |
| $65,000 to $74,999 | 10,327 (5.8%) | 6,283 (3.8%) |
| $75,000 to $99,999 | 13,768 (7.8%) | 9,040 (5.5%) |
| $100,000+ | 20,765 (11.7%) | 7,564 (4.6%) |
| Total | 176,756 (100.0%) | 165,037 (100.0%) |
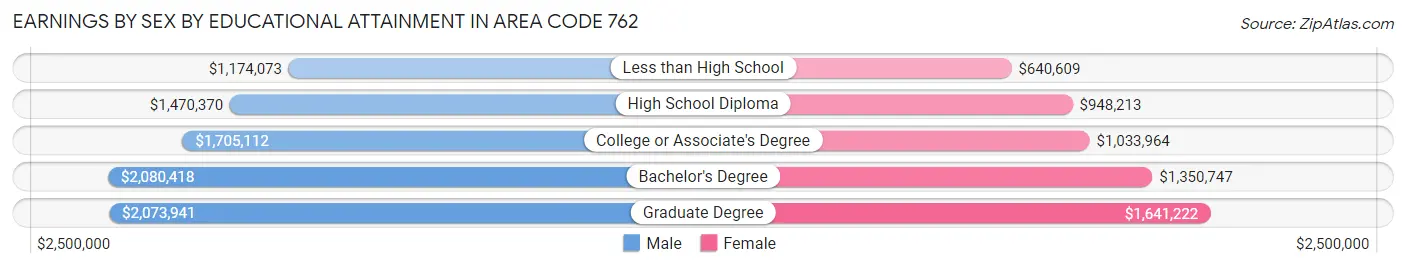
Earnings by Sex by Educational Attainment in Area Code 762
Average earnings in Area Code 762 are $1,828,284 for men and $1,199,260 for women, a difference of 34.4%. Men with an educational attainment of bachelor's degree enjoy the highest average annual earnings of $2,080,418, while those with less than high school education earn the least with $1,174,073. Women with an educational attainment of graduate degree earn the most with the average annual earnings of $1,641,222, while those with less than high school education have the smallest earnings of $640,609.
| Educational Attainment | Male Income | Female Income |
| Less than High School | $1,174,073 | $640,609 |
| High School Diploma | $1,470,370 | $948,213 |
| College or Associate's Degree | $1,705,112 | $1,033,964 |
| Bachelor's Degree | $2,080,418 | $1,350,747 |
| Graduate Degree | $2,073,941 | $1,641,222 |
| Total | $1,828,284 | $1,199,260 |
Family Income in Area Code 762
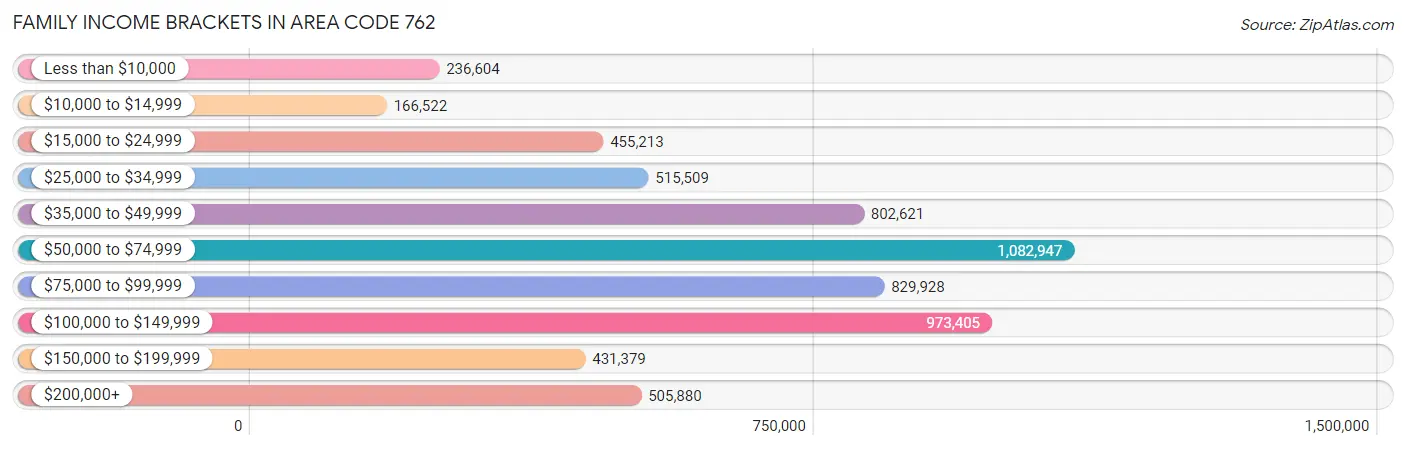
Family Income Brackets in Area Code 762
According to the Area Code 762 family income data, there are 1,082,947 families falling into the $50,000 to $74,999 income range, which is the most common income bracket and makes up 686.1% of all families. Conversely, the $10,000 to $14,999 income bracket is the least frequent group with only 166,522 families (105.5%) belonging to this category.
| Income Bracket | # Families | % Families |
| Less than $10,000 | 236,604 | 149.9% |
| $10,000 to $14,999 | 166,522 | 105.5% |
| $15,000 to $24,999 | 455,213 | 288.4% |
| $25,000 to $34,999 | 515,509 | 326.6% |
| $35,000 to $49,999 | 802,621 | 508.5% |
| $50,000 to $74,999 | 1,082,947 | 686.1% |
| $75,000 to $99,999 | 829,928 | 525.8% |
| $100,000 to $149,999 | 973,405 | 616.7% |
| $150,000 to $199,999 | 431,379 | 273.3% |
| $200,000+ | 505,880 | 320.5% |
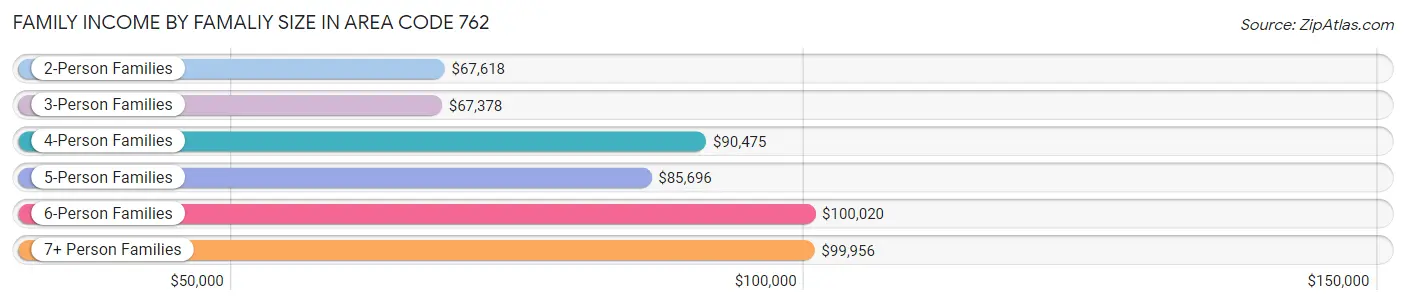
Family Income by Famaliy Size in Area Code 762
6-person families (3,829 | 2.4%) account for the highest median family income in Area Code 762 with $100,020 per family, while 2-person families (76,579 | 48.5%) have the highest median income of $33,809 per family member.
| Income Bracket | # Families | Median Income |
| 2-Person Families | 76,579 (48.5%) | $67,618 |
| 3-Person Families | 36,308 (23.0%) | $67,378 |
| 4-Person Families | 25,838 (16.4%) | $90,475 |
| 5-Person Families | 12,743 (8.1%) | $85,696 |
| 6-Person Families | 3,829 (2.4%) | $100,020 |
| 7+ Person Families | 2,544 (1.6%) | $99,956 |
| Total | 157,841 (100.0%) | $70,463 |
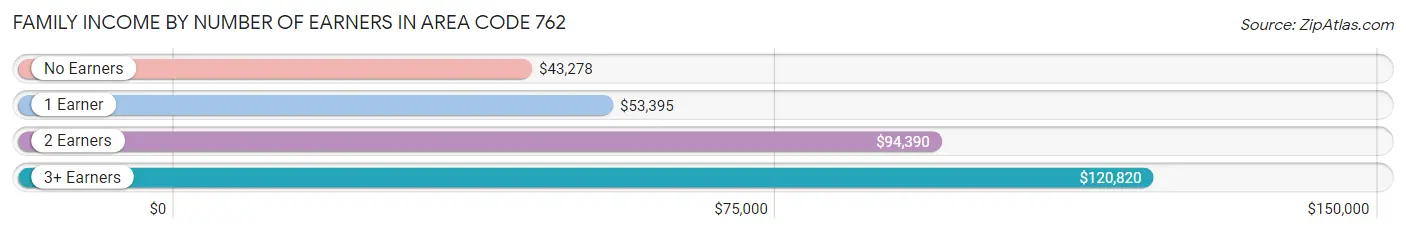
Family Income by Number of Earners in Area Code 762
The median family income in Area Code 762 is $70,463, with families comprising 3+ earners (15,904) having the highest median family income of $120,820, while families with no earners (25,087) have the lowest median family income of $43,278, accounting for 10.1% and 15.9% of families, respectively.
| Number of Earners | # Families | Median Income |
| No Earners | 25,087 (15.9%) | $43,278 |
| 1 Earner | 58,038 (36.8%) | $53,395 |
| 2 Earners | 58,812 (37.3%) | $94,390 |
| 3+ Earners | 15,904 (10.1%) | $120,820 |
| Total | 157,841 (100.0%) | $70,463 |
Household Income in Area Code 762
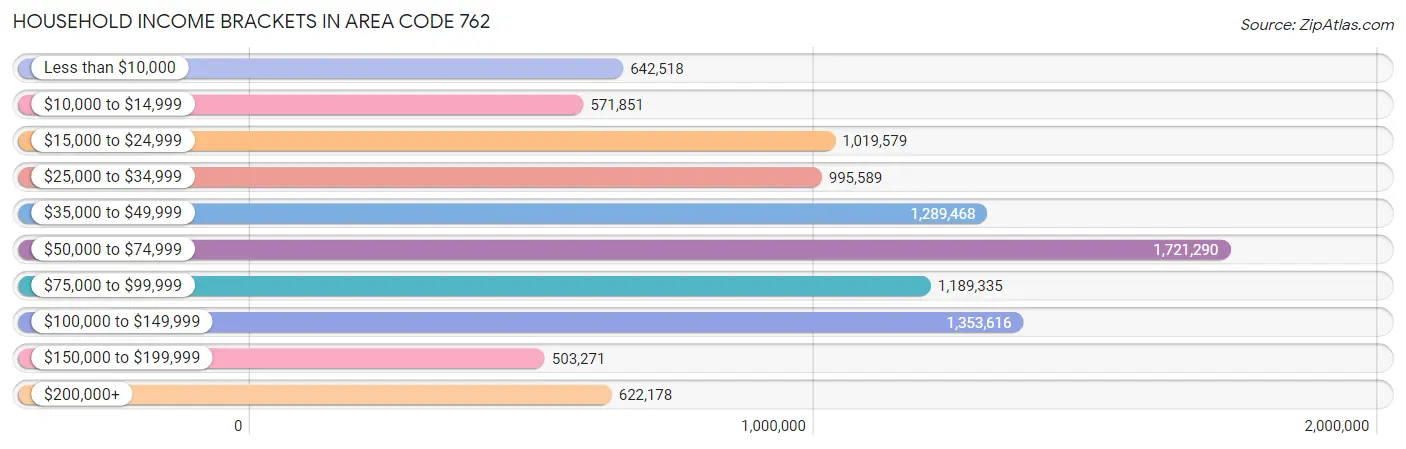
Household Income Brackets in Area Code 762
With 1,721,290 households falling in the category, the $50,000 to $74,999 income range is the most frequent in Area Code 762, accounting for 660.1% of all households. In contrast, only 503,271 households (193.0%) fall into the $150,000 to $199,999 income bracket, making it the least populous group.
| Income Bracket | # Households | % Households |
| Less than $10,000 | 642,518 | 246.4% |
| $10,000 to $14,999 | 571,851 | 219.3% |
| $15,000 to $24,999 | 1,019,579 | 391.0% |
| $25,000 to $34,999 | 995,589 | 381.8% |
| $35,000 to $49,999 | 1,289,468 | 494.5% |
| $50,000 to $74,999 | 1,721,290 | 660.1% |
| $75,000 to $99,999 | 1,189,335 | 456.1% |
| $100,000 to $149,999 | 1,353,616 | 519.1% |
| $150,000 to $199,999 | 503,271 | 193.0% |
| $200,000+ | 622,178 | 238.6% |
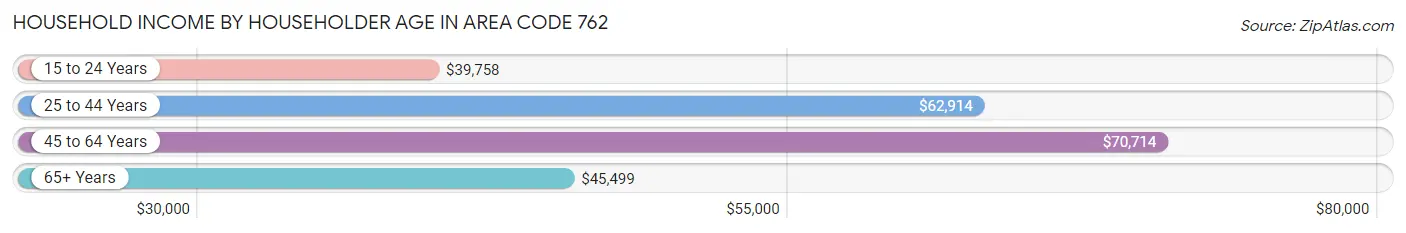
Household Income by Householder Age in Area Code 762
The median household income in Area Code 762 is $57,397, with the highest median household income of $70,714 found in the 45 to 64 years age bracket for the primary householder. A total of 90,723 households (34.8%) fall into this category. Meanwhile, the 15 to 24 years age bracket for the primary householder has the lowest median household income of $39,758, with 17,330 households (6.7%) in this group.
| Income Bracket | # Households | Median Income |
| 15 to 24 Years | 17,330 (6.7%) | $39,758 |
| 25 to 44 Years | 84,094 (32.3%) | $62,914 |
| 45 to 64 Years | 90,723 (34.8%) | $70,714 |
| 65+ Years | 68,615 (26.3%) | $45,499 |
| Total | 260,762 (100.0%) | $57,397 |
Poverty in Area Code 762
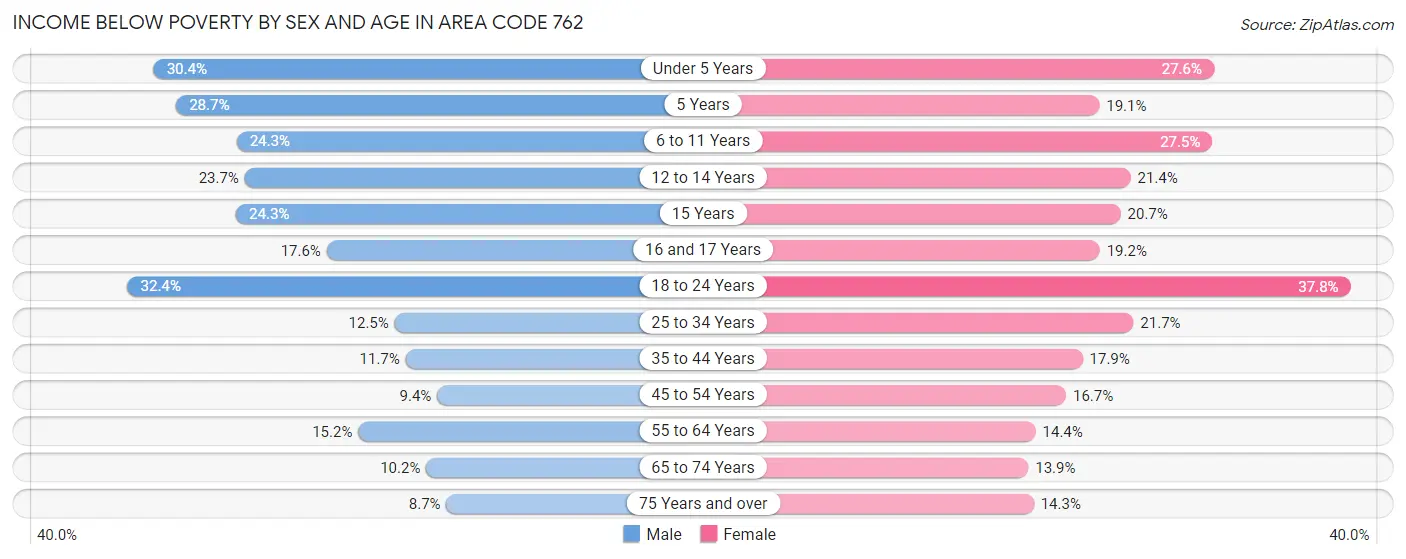
Income Below Poverty by Sex and Age in Area Code 762
With 17.3% poverty level for males and 20.7% for females among the residents of Area Code 762, 18 to 24 year old males and 18 to 24 year old females are the most vulnerable to poverty, with 12,025 males (32.4%) and 13,871 females (37.8%) in their respective age groups living below the poverty level.
| Age Bracket | Male | Female |
| Under 5 Years | 6,334 (30.4%) | 4,955 (27.6%) |
| 5 Years | 1,075 (28.7%) | 782 (19.1%) |
| 6 to 11 Years | 5,869 (24.2%) | 6,286 (27.5%) |
| 12 to 14 Years | 3,296 (23.7%) | 2,619 (21.4%) |
| 15 Years | 1,242 (24.3%) | 947 (20.7%) |
| 16 and 17 Years | 1,384 (17.6%) | 1,457 (19.2%) |
| 18 to 24 Years | 12,025 (32.4%) | 13,871 (37.8%) |
| 25 to 34 Years | 5,509 (12.5%) | 10,038 (21.6%) |
| 35 to 44 Years | 4,596 (11.7%) | 7,328 (17.9%) |
| 45 to 54 Years | 3,575 (9.4%) | 6,828 (16.7%) |
| 55 to 64 Years | 5,821 (15.2%) | 6,088 (14.4%) |
| 65 to 74 Years | 2,896 (10.2%) | 4,687 (13.9%) |
| 75 Years and over | 1,484 (8.7%) | 3,584 (14.2%) |
| Total | 55,106 (17.3%) | 69,470 (20.7%) |
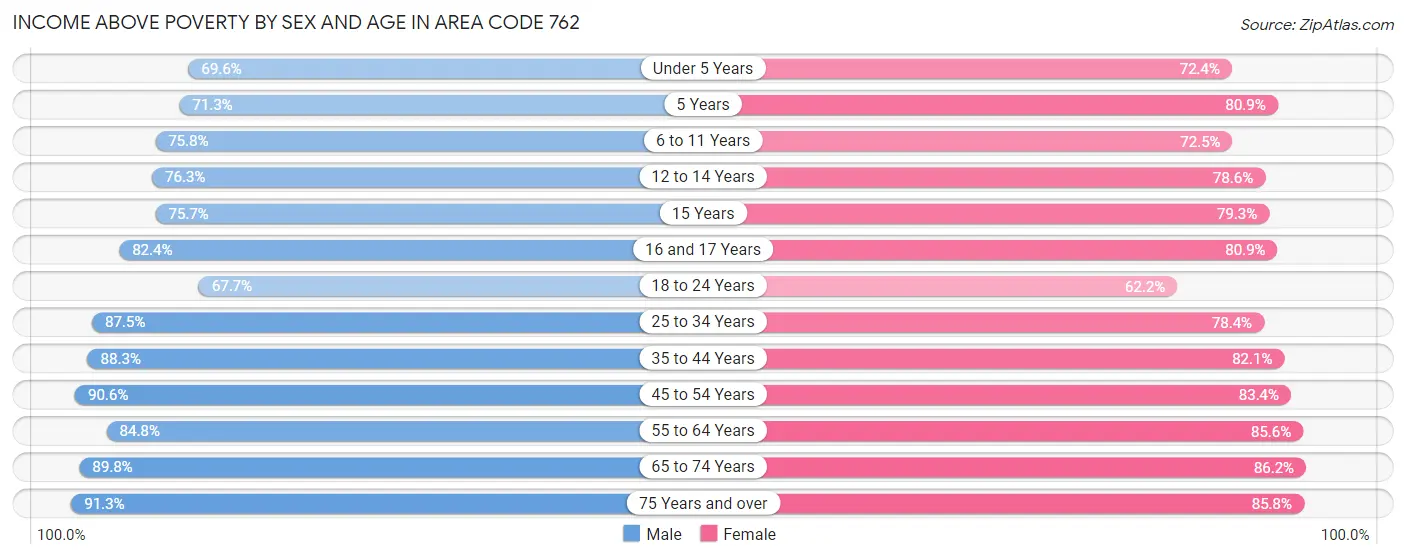
Income Above Poverty by Sex and Age in Area Code 762
According to the poverty statistics in Area Code 762, males aged 75 years and over and females aged 65 to 74 years are the age groups that are most secure financially, with 91.3% of males and 86.2% of females in these age groups living above the poverty line.
| Age Bracket | Male | Female |
| Under 5 Years | 14,495 (69.6%) | 12,984 (72.4%) |
| 5 Years | 2,666 (71.3%) | 3,309 (80.9%) |
| 6 to 11 Years | 18,336 (75.7%) | 16,573 (72.5%) |
| 12 to 14 Years | 10,633 (76.3%) | 9,595 (78.6%) |
| 15 Years | 3,871 (75.7%) | 3,628 (79.3%) |
| 16 and 17 Years | 6,495 (82.4%) | 6,153 (80.8%) |
| 18 to 24 Years | 25,142 (67.6%) | 22,861 (62.2%) |
| 25 to 34 Years | 38,454 (87.5%) | 36,337 (78.3%) |
| 35 to 44 Years | 34,637 (88.3%) | 33,647 (82.1%) |
| 45 to 54 Years | 34,565 (90.6%) | 34,175 (83.4%) |
| 55 to 64 Years | 32,392 (84.8%) | 36,232 (85.6%) |
| 65 to 74 Years | 25,546 (89.8%) | 29,145 (86.2%) |
| 75 Years and over | 15,618 (91.3%) | 21,575 (85.8%) |
| Total | 262,850 (82.7%) | 266,214 (79.3%) |
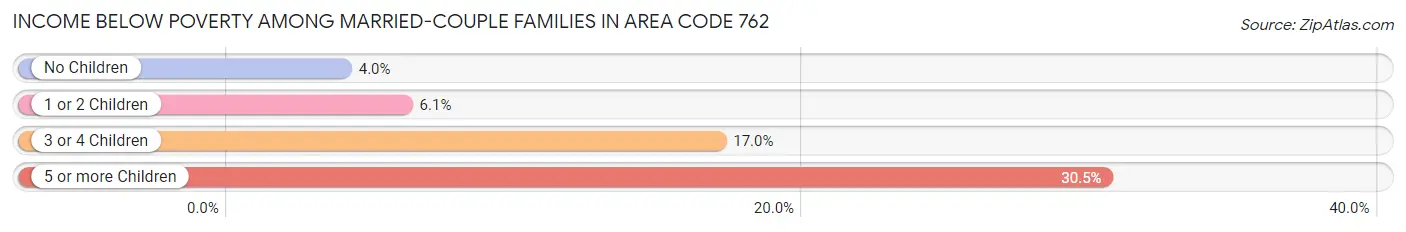
Income Below Poverty Among Married-Couple Families in Area Code 762
The poverty statistics for married-couple families in Area Code 762 show that 5.7% or 6,031 of the total 105,723 families live below the poverty line. Families with 5 or more children have the highest poverty rate of 30.5%, comprising of 239 families. On the other hand, families with no children have the lowest poverty rate of 4.0%, which includes 2,570 families.
| Children | Above Poverty | Below Poverty |
| No Children | 62,283 (96.0%) | 2,570 (4.0%) |
| 1 or 2 Children | 30,898 (93.9%) | 2,000 (6.1%) |
| 3 or 4 Children | 5,966 (83.0%) | 1,222 (17.0%) |
| 5 or more Children | 545 (69.5%) | 239 (30.5%) |
| Total | 99,692 (94.3%) | 6,031 (5.7%) |
Income Below Poverty Among Single-Parent Households in Area Code 762
According to the poverty data in Area Code 762, 15.8% or 2,057 single-father households and 30.8% or 12,057 single-mother households are living below the poverty line. Among single-father households, those with 5 or more children have the highest poverty rate, with 9 households (100.0%) experiencing poverty. Likewise, among single-mother households, those with 5 or more children have the highest poverty rate, with 402 households (86.3%) falling below the poverty line.
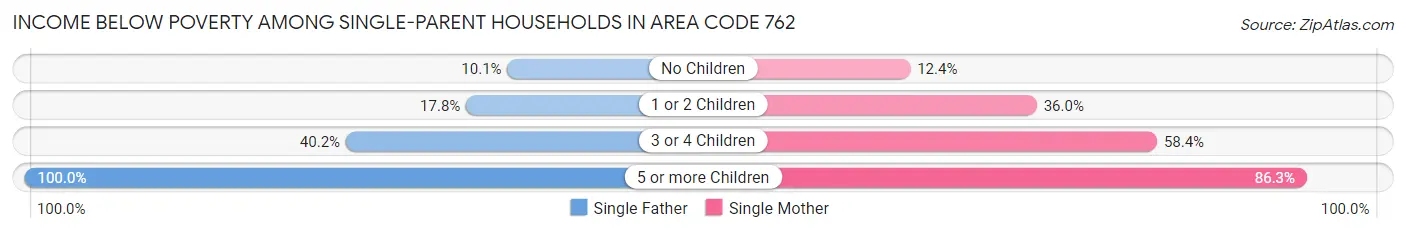
| Children | Single Father | Single Mother |
| No Children | 622 (10.1%) | 1,783 (12.4%) |
| 1 or 2 Children | 1,043 (17.7%) | 6,882 (36.0%) |
| 3 or 4 Children | 383 (40.2%) | 2,990 (58.4%) |
| 5 or more Children | 9 (100.0%) | 402 (86.3%) |
| Total | 2,057 (15.8%) | 12,057 (30.8%) |
Income Below Poverty Among Married-Couple vs Single-Parent Households in Area Code 762
The poverty data for Area Code 762 shows that 6,031 of the married-couple family households (5.7%) and 14,114 of the single-parent households (27.1%) are living below the poverty level. Within the married-couple family households, those with 5 or more children have the highest poverty rate, with 239 households (30.5%) falling below the poverty line. Among the single-parent households, those with 5 or more children have the highest poverty rate, with 411 household (86.5%) living below poverty.
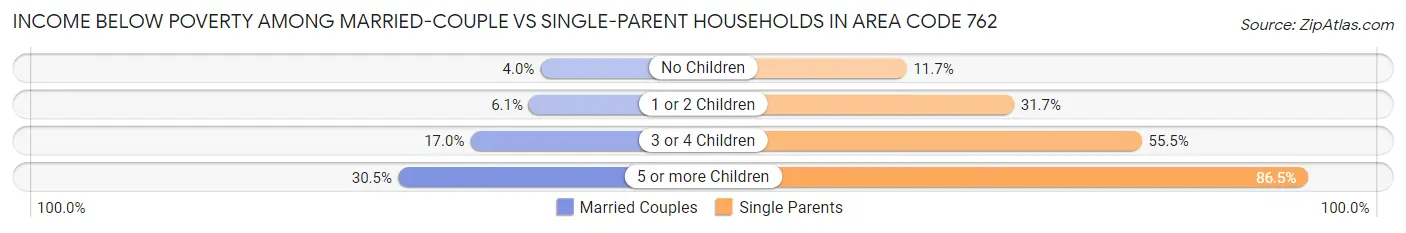
| Children | Married-Couple Families | Single-Parent Households |
| No Children | 2,570 (4.0%) | 2,405 (11.7%) |
| 1 or 2 Children | 2,000 (6.1%) | 7,925 (31.7%) |
| 3 or 4 Children | 1,222 (17.0%) | 3,373 (55.5%) |
| 5 or more Children | 239 (30.5%) | 411 (86.5%) |
| Total | 6,031 (5.7%) | 14,114 (27.1%) |
Race in Area Code 762
The most populous races in Area Code 762 are White / Caucasian (429,858 | 64.1%), Black / African American (161,842 | 24.1%), and Hispanic or Latino (82,942 | 12.4%).
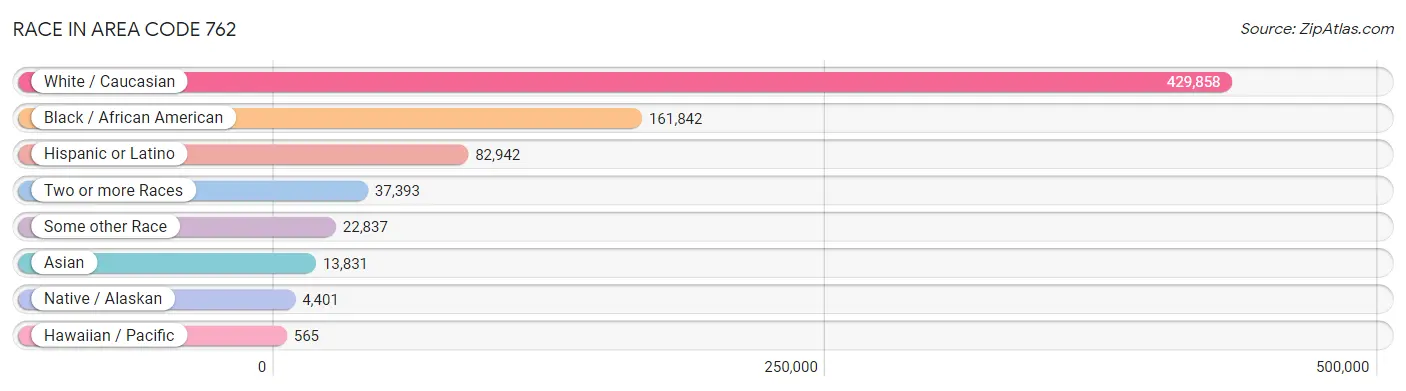
| Race | # Population | % Population |
| Asian | 13,831 | 2.1% |
| Black / African American | 161,842 | 24.1% |
| Hawaiian / Pacific | 565 | 0.1% |
| Hispanic or Latino | 82,942 | 12.4% |
| Native / Alaskan | 4,401 | 0.7% |
| White / Caucasian | 429,858 | 64.1% |
| Two or more Races | 37,393 | 5.6% |
| Some other Race | 22,837 | 3.4% |
| Total | 670,727 | 100.0% |
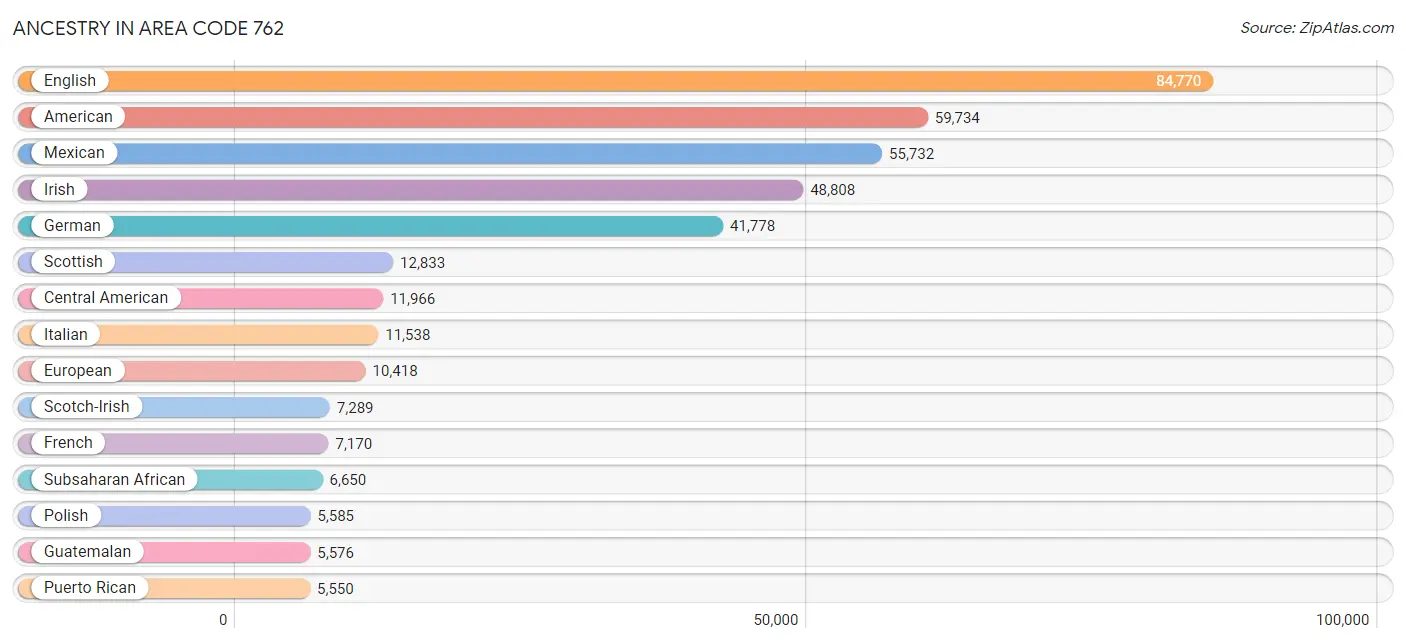
Ancestry in Area Code 762
The most populous ancestries reported in Area Code 762 are English (84,770 | 12.6%), American (59,734 | 8.9%), Mexican (55,732 | 8.3%), Irish (48,808 | 7.3%), and German (41,778 | 6.2%), together accounting for 43.4% of all Area Code 762 residents.
| Ancestry | # Population | % Population |
| Afghan | 135 | 0.0% |
| African | 4,961 | 0.7% |
| Albanian | 71 | 0.0% |
| Aleut | 7 | 0.0% |
| Alsatian | 22 | 0.0% |
| American | 59,734 | 8.9% |
| Apache | 82 | 0.0% |
| Arab | 1,121 | 0.2% |
| Argentinean | 402 | 0.1% |
| Armenian | 360 | 0.1% |
| Assyrian / Chaldean / Syriac | 173 | 0.0% |
| Australian | 32 | 0.0% |
| Austrian | 479 | 0.1% |
| Bahamian | 19 | 0.0% |
| Bangladeshi | 104 | 0.0% |
| Barbadian | 50 | 0.0% |
| Basque | 13 | 0.0% |
| Belgian | 354 | 0.1% |
| Belizean | 14 | 0.0% |
| Bermudan | 16 | 0.0% |
| Bhutanese | 693 | 0.1% |
| Blackfeet | 287 | 0.0% |
| Bolivian | 25 | 0.0% |
| Brazilian | 569 | 0.1% |
| British | 4,481 | 0.7% |
| British West Indian | 56 | 0.0% |
| Bulgarian | 62 | 0.0% |
| Burmese | 3,450 | 0.5% |
| Cajun | 111 | 0.0% |
| Canadian | 551 | 0.1% |
| Carpatho Rusyn | 6 | 0.0% |
| Celtic | 212 | 0.0% |
| Central American | 11,966 | 1.8% |
| Central American Indian | 2,479 | 0.4% |
| Cherokee | 2,935 | 0.4% |
| Chickasaw | 21 | 0.0% |
| Chilean | 98 | 0.0% |
| Chippewa | 3 | 0.0% |
| Choctaw | 13 | 0.0% |
| Colombian | 1,104 | 0.2% |
| Costa Rican | 196 | 0.0% |
| Creek | 84 | 0.0% |
| Croatian | 168 | 0.0% |
| Cuban | 2,964 | 0.4% |
| Czech | 718 | 0.1% |
| Czechoslovakian | 151 | 0.0% |
| Danish | 573 | 0.1% |
| Dominican | 1,335 | 0.2% |
| Dutch | 4,102 | 0.6% |
| Dutch West Indian | 165 | 0.0% |
| Eastern European | 1,325 | 0.2% |
| Ecuadorian | 147 | 0.0% |
| Egyptian | 242 | 0.0% |
| English | 84,770 | 12.6% |
| Estonian | 12 | 0.0% |
| Ethiopian | 30 | 0.0% |
| European | 10,418 | 1.5% |
| Filipino | 16 | 0.0% |
| Finnish | 198 | 0.0% |
| French | 7,170 | 1.1% |
| French Canadian | 770 | 0.1% |
| German | 41,778 | 6.2% |
| German Russian | 15 | 0.0% |
| Ghanaian | 105 | 0.0% |
| Greek | 856 | 0.1% |
| Guamanian / Chamorro | 387 | 0.1% |
| Guatemalan | 5,576 | 0.8% |
| Guyanese | 152 | 0.0% |
| Haitian | 743 | 0.1% |
| Honduran | 1,338 | 0.2% |
| Hungarian | 956 | 0.1% |
| Indian (Asian) | 3,097 | 0.5% |
| Indonesian | 296 | 0.0% |
| Iranian | 334 | 0.1% |
| Iraqi | 16 | 0.0% |
| Irish | 48,808 | 7.3% |
| Iroquois | 84 | 0.0% |
| Israeli | 191 | 0.0% |
| Italian | 11,538 | 1.7% |
| Jamaican | 883 | 0.1% |
| Japanese | 63 | 0.0% |
| Jordanian | 16 | 0.0% |
| Kenyan | 336 | 0.1% |
| Korean | 2,611 | 0.4% |
| Laotian | 18 | 0.0% |
| Latvian | 108 | 0.0% |
| Lebanese | 423 | 0.1% |
| Lithuanian | 386 | 0.1% |
| Luxembourger | 19 | 0.0% |
| Macedonian | 31 | 0.0% |
| Malaysian | 190 | 0.0% |
| Maltese | 85 | 0.0% |
| Mexican | 55,732 | 8.3% |
| Mexican American Indian | 843 | 0.1% |
| Mongolian | 28 | 0.0% |
| Moroccan | 41 | 0.0% |
| Native Hawaiian | 359 | 0.1% |
| Navajo | 19 | 0.0% |
| Nicaraguan | 382 | 0.1% |
| Nigerian | 783 | 0.1% |
| Northern European | 935 | 0.1% |
| Norwegian | 2,049 | 0.3% |
| Okinawan | 51 | 0.0% |
| Ottawa | 7 | 0.0% |
| Pakistani | 266 | 0.0% |
| Palestinian | 18 | 0.0% |
| Panamanian | 743 | 0.1% |
| Pennsylvania German | 62 | 0.0% |
| Peruvian | 804 | 0.1% |
| Pima | 4 | 0.0% |
| Polish | 5,585 | 0.8% |
| Portuguese | 611 | 0.1% |
| Potawatomi | 124 | 0.0% |
| Pueblo | 12 | 0.0% |
| Puerto Rican | 5,550 | 0.8% |
| Puget Sound Salish | 22 | 0.0% |
| Romanian | 205 | 0.0% |
| Russian | 1,289 | 0.2% |
| Salvadoran | 3,671 | 0.5% |
| Samoan | 301 | 0.0% |
| Scandinavian | 1,280 | 0.2% |
| Scotch-Irish | 7,289 | 1.1% |
| Scottish | 12,833 | 1.9% |
| Seminole | 198 | 0.0% |
| Senegalese | 66 | 0.0% |
| Serbian | 60 | 0.0% |
| Shoshone | 4 | 0.0% |
| Sierra Leonean | 30 | 0.0% |
| Sioux | 81 | 0.0% |
| Slavic | 92 | 0.0% |
| Slovak | 279 | 0.0% |
| Slovene | 16 | 0.0% |
| South African | 103 | 0.0% |
| South American | 2,889 | 0.4% |
| South American Indian | 23 | 0.0% |
| Spaniard | 739 | 0.1% |
| Spanish | 500 | 0.1% |
| Spanish American | 71 | 0.0% |
| Sri Lankan | 1,931 | 0.3% |
| Subsaharan African | 6,650 | 1.0% |
| Sudanese | 23 | 0.0% |
| Swedish | 2,615 | 0.4% |
| Swiss | 539 | 0.1% |
| Syrian | 262 | 0.0% |
| Thai | 4,455 | 0.7% |
| Trinidadian and Tobagonian | 182 | 0.0% |
| Tsimshian | 26 | 0.0% |
| Turkish | 227 | 0.0% |
| U.S. Virgin Islander | 31 | 0.0% |
| Ukrainian | 426 | 0.1% |
| Uruguayan | 42 | 0.0% |
| Venezuelan | 267 | 0.0% |
| Welsh | 2,509 | 0.4% |
| West Indian | 310 | 0.1% |
| Yakama | 24 | 0.0% |
| Yugoslavian | 141 | 0.0% |
| Zimbabwean | 86 | 0.0% | View All 157 Rows |
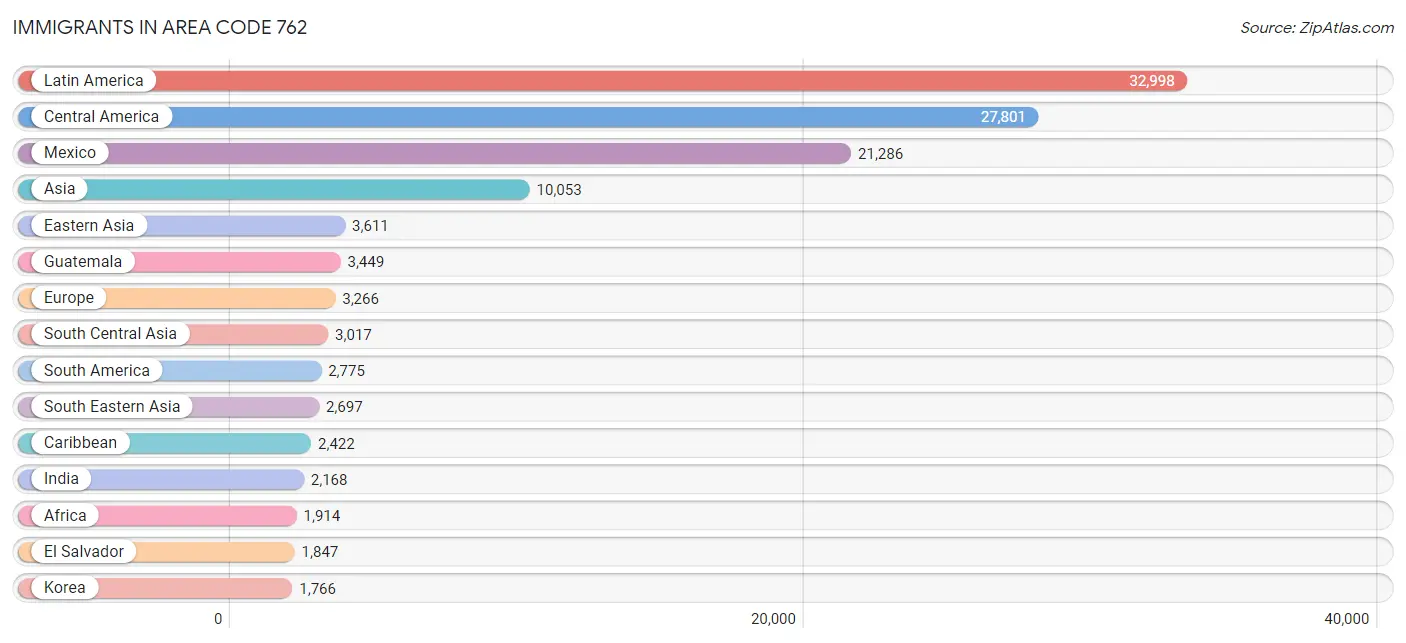
Immigrants in Area Code 762
The most numerous immigrant groups reported in Area Code 762 came from Latin America (32,998 | 4.9%), Central America (27,801 | 4.1%), Mexico (21,286 | 3.2%), Asia (10,053 | 1.5%), and Eastern Asia (3,611 | 0.5%), together accounting for 14.3% of all Area Code 762 residents.
| Immigration Origin | # Population | % Population |
| Afghanistan | 109 | 0.0% |
| Africa | 1,914 | 0.3% |
| Albania | 17 | 0.0% |
| Argentina | 125 | 0.0% |
| Asia | 10,053 | 1.5% |
| Australia | 34 | 0.0% |
| Austria | 66 | 0.0% |
| Bahamas | 13 | 0.0% |
| Bangladesh | 12 | 0.0% |
| Barbados | 91 | 0.0% |
| Belgium | 34 | 0.0% |
| Belize | 17 | 0.0% |
| Bolivia | 8 | 0.0% |
| Bosnia and Herzegovina | 84 | 0.0% |
| Brazil | 368 | 0.1% |
| Bulgaria | 38 | 0.0% |
| Cambodia | 13 | 0.0% |
| Cameroon | 3 | 0.0% |
| Canada | 749 | 0.1% |
| Caribbean | 2,422 | 0.4% |
| Central America | 27,801 | 4.1% |
| Chile | 154 | 0.0% |
| China | 1,621 | 0.2% |
| Colombia | 860 | 0.1% |
| Costa Rica | 5 | 0.0% |
| Cuba | 973 | 0.2% |
| Czechoslovakia | 48 | 0.0% |
| Denmark | 24 | 0.0% |
| Dominica | 92 | 0.0% |
| Dominican Republic | 518 | 0.1% |
| Eastern Africa | 426 | 0.1% |
| Eastern Asia | 3,611 | 0.5% |
| Eastern Europe | 727 | 0.1% |
| Ecuador | 127 | 0.0% |
| Egypt | 117 | 0.0% |
| El Salvador | 1,847 | 0.3% |
| England | 429 | 0.1% |
| Ethiopia | 31 | 0.0% |
| Europe | 3,266 | 0.5% |
| Fiji | 6 | 0.0% |
| France | 150 | 0.0% |
| Germany | 1,082 | 0.2% |
| Ghana | 206 | 0.0% |
| Greece | 29 | 0.0% |
| Grenada | 12 | 0.0% |
| Guatemala | 3,449 | 0.5% |
| Guyana | 159 | 0.0% |
| Haiti | 239 | 0.0% |
| Honduras | 843 | 0.1% |
| Hong Kong | 33 | 0.0% |
| Hungary | 11 | 0.0% |
| India | 2,168 | 0.3% |
| Iran | 221 | 0.0% |
| Iraq | 91 | 0.0% |
| Ireland | 111 | 0.0% |
| Israel | 80 | 0.0% |
| Italy | 92 | 0.0% |
| Jamaica | 356 | 0.1% |
| Japan | 224 | 0.0% |
| Jordan | 13 | 0.0% |
| Kazakhstan | 58 | 0.0% |
| Kenya | 241 | 0.0% |
| Korea | 1,766 | 0.3% |
| Kuwait | 9 | 0.0% |
| Laos | 39 | 0.0% |
| Latin America | 32,998 | 4.9% |
| Latvia | 21 | 0.0% |
| Lebanon | 80 | 0.0% |
| Liberia | 37 | 0.0% |
| Lithuania | 7 | 0.0% |
| Malaysia | 56 | 0.0% |
| Mexico | 21,286 | 3.2% |
| Middle Africa | 7 | 0.0% |
| Moldova | 4 | 0.0% |
| Nepal | 30 | 0.0% |
| Netherlands | 38 | 0.0% |
| Nicaragua | 103 | 0.0% |
| Nigeria | 317 | 0.1% |
| North Macedonia | 54 | 0.0% |
| Northern Africa | 243 | 0.0% |
| Northern Europe | 964 | 0.1% |
| Norway | 15 | 0.0% |
| Oceania | 142 | 0.0% |
| Pakistan | 203 | 0.0% |
| Panama | 251 | 0.0% |
| Peru | 739 | 0.1% |
| Philippines | 1,290 | 0.2% |
| Poland | 71 | 0.0% |
| Portugal | 9 | 0.0% |
| Romania | 37 | 0.0% |
| Russia | 209 | 0.0% |
| Saudi Arabia | 142 | 0.0% |
| Scotland | 18 | 0.0% |
| Sierra Leone | 30 | 0.0% |
| Singapore | 74 | 0.0% |
| South Africa | 238 | 0.0% |
| South America | 2,775 | 0.4% |
| South Central Asia | 3,017 | 0.4% |
| South Eastern Asia | 2,697 | 0.4% |
| Southern Europe | 205 | 0.0% |
| Spain | 75 | 0.0% |
| Sri Lanka | 177 | 0.0% |
| Sudan | 116 | 0.0% |
| Sweden | 10 | 0.0% |
| Syria | 23 | 0.0% |
| Taiwan | 166 | 0.0% |
| Thailand | 98 | 0.0% |
| Trinidad and Tobago | 69 | 0.0% |
| Turkey | 197 | 0.0% |
| Uganda | 29 | 0.0% |
| Ukraine | 74 | 0.0% |
| Uruguay | 13 | 0.0% |
| Venezuela | 222 | 0.0% |
| Vietnam | 891 | 0.1% |
| West Indies | 7 | 0.0% |
| Western Africa | 713 | 0.1% |
| Western Asia | 716 | 0.1% |
| Western Europe | 1,370 | 0.2% |
| Zaire | 4 | 0.0% |
| Zimbabwe | 90 | 0.0% | View All 120 Rows |
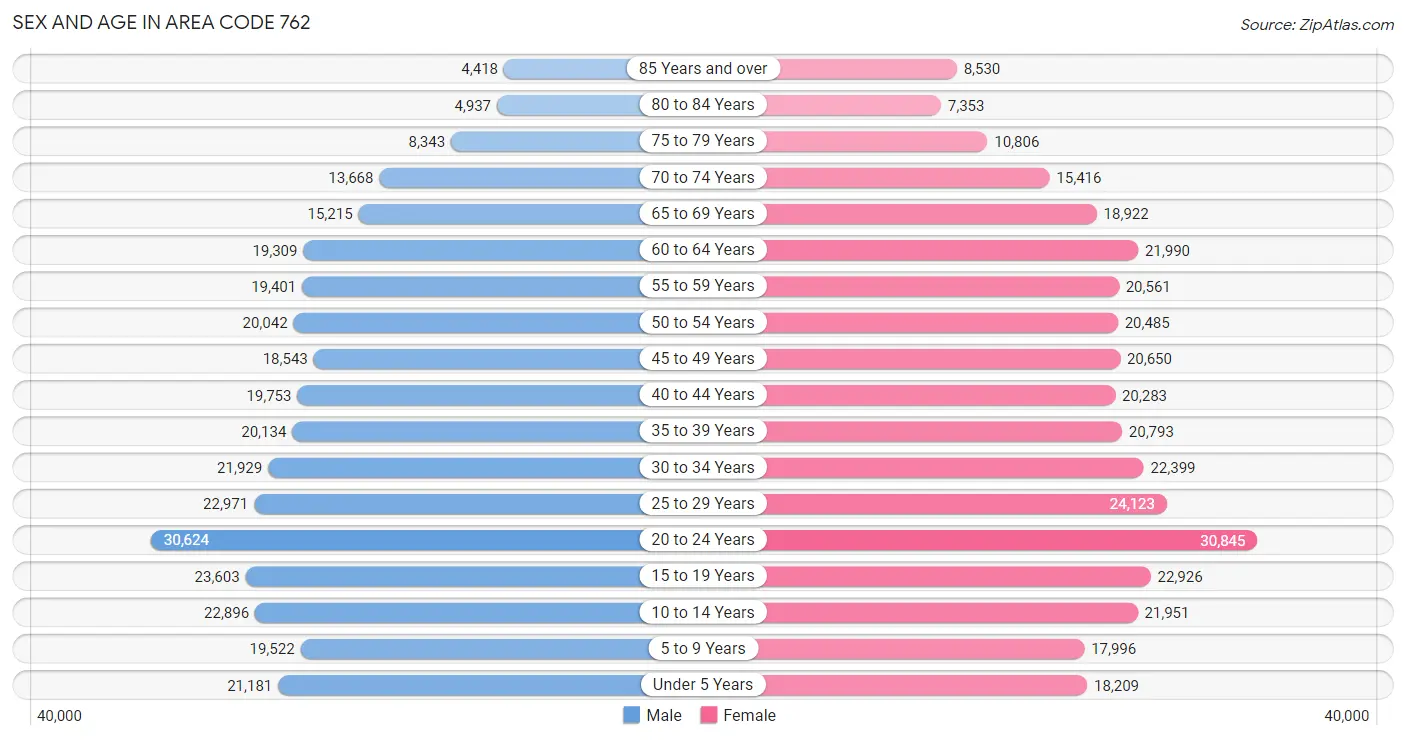
Sex and Age in Area Code 762
Sex and Age in Area Code 762
The most populous age groups in Area Code 762 are 20 to 24 Years (30,624 | 9.4%) for men and 20 to 24 Years (30,845 | 9.0%) for women.
| Age Bracket | Male | Female |
| Under 5 Years | 21,181 (6.5%) | 18,209 (5.3%) |
| 5 to 9 Years | 19,522 (6.0%) | 17,996 (5.2%) |
| 10 to 14 Years | 22,896 (7.0%) | 21,951 (6.4%) |
| 15 to 19 Years | 23,603 (7.2%) | 22,926 (6.7%) |
| 20 to 24 Years | 30,624 (9.4%) | 30,845 (9.0%) |
| 25 to 29 Years | 22,971 (7.0%) | 24,123 (7.0%) |
| 30 to 34 Years | 21,929 (6.7%) | 22,399 (6.5%) |
| 35 to 39 Years | 20,134 (6.2%) | 20,793 (6.0%) |
| 40 to 44 Years | 19,753 (6.0%) | 20,283 (5.9%) |
| 45 to 49 Years | 18,543 (5.7%) | 20,650 (6.0%) |
| 50 to 54 Years | 20,042 (6.1%) | 20,485 (5.9%) |
| 55 to 59 Years | 19,401 (5.9%) | 20,561 (6.0%) |
| 60 to 64 Years | 19,309 (5.9%) | 21,990 (6.4%) |
| 65 to 69 Years | 15,215 (4.7%) | 18,922 (5.5%) |
| 70 to 74 Years | 13,668 (4.2%) | 15,416 (4.5%) |
| 75 to 79 Years | 8,343 (2.6%) | 10,806 (3.1%) |
| 80 to 84 Years | 4,937 (1.5%) | 7,353 (2.1%) |
| 85 Years and over | 4,418 (1.3%) | 8,530 (2.5%) |
| Total | 326,489 (100.0%) | 344,238 (100.0%) |
Families and Households in Area Code 762
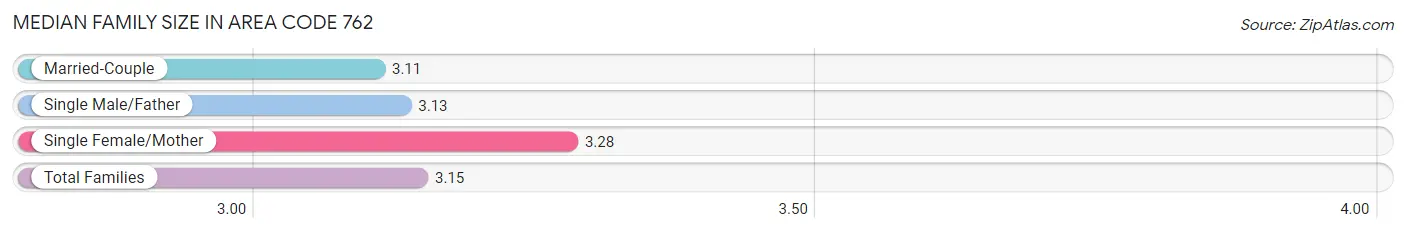
Median Family Size in Area Code 762
The median family size in Area Code 762 is 3.15 persons per family, with single female/mother families (39,104 | 24.8%) accounting for the largest median family size of 3.27864 persons per family. On the other hand, married-couple families (105,723 | 67.0%) represent the smallest median family size with 3.11 persons per family.
| Family Type | # Families | Family Size |
| Married-Couple | 105,723 (67.0%) | 3.11 |
| Single Male/Father | 13,014 (8.3%) | 3.13 |
| Single Female/Mother | 39,104 (24.8%) | 3.28 |
| Total Families | 157,841 (100.0%) | 3.15 |
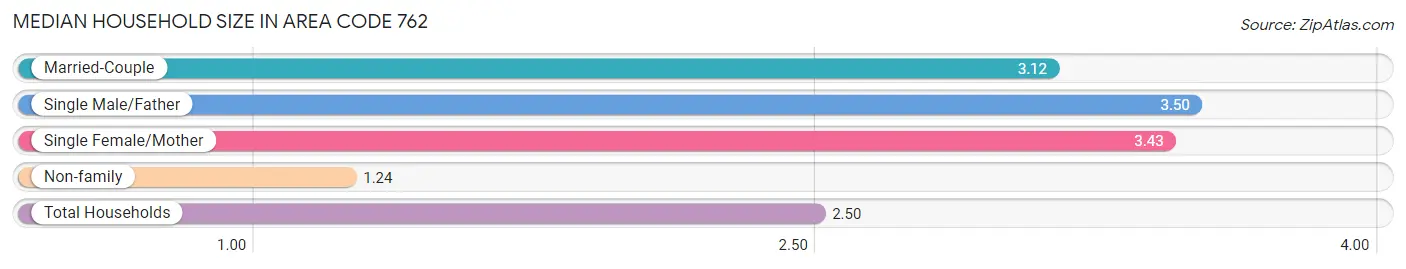
Median Household Size in Area Code 762
The median household size in Area Code 762 is 2.50 persons per household, with single male/father households (13,014 | 5.0%) accounting for the largest median household size of 3.504 persons per household. non-family households (102,921 | 39.5%) represent the smallest median household size with 1.24 persons per household.
| Household Type | # Households | Household Size |
| Married-Couple | 105,723 (40.5%) | 3.12 |
| Single Male/Father | 13,014 (5.0%) | 3.50 |
| Single Female/Mother | 39,104 (15.0%) | 3.43 |
| Non-family | 102,921 (39.5%) | 1.24 |
| Total Households | 260,762 (100.0%) | 2.50 |
Household Size by Marriage Status in Area Code 762
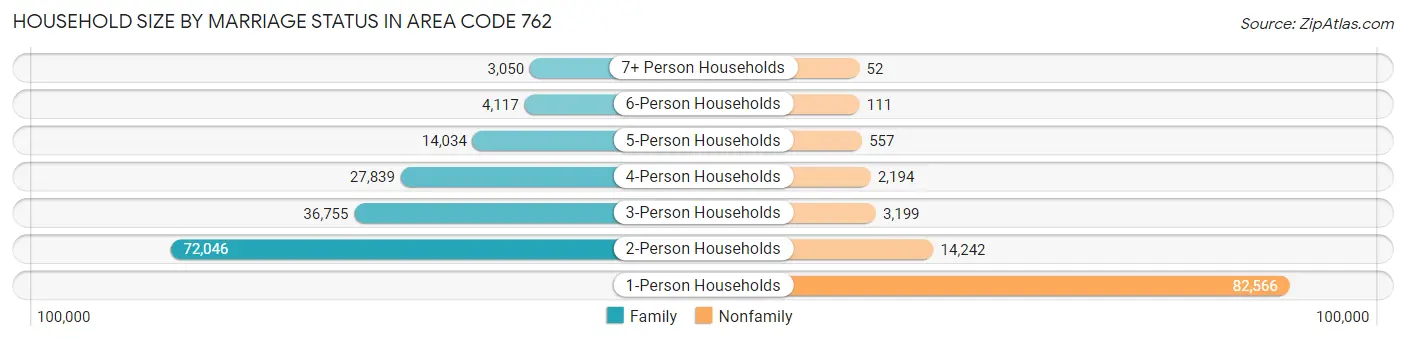
Out of a total of 260,762 households in Area Code 762, 157,841 (60.5%) are family households, while 102,921 (39.5%) are nonfamily households. The most numerous type of family households are 2-person households, comprising 72,046, and the most common type of nonfamily households are 1-person households, comprising 82,566.
| Household Size | Family Households | Nonfamily Households |
| 1-Person Households | - | 82,566 (31.7%) |
| 2-Person Households | 72,046 (27.6%) | 14,242 (5.5%) |
| 3-Person Households | 36,755 (14.1%) | 3,199 (1.2%) |
| 4-Person Households | 27,839 (10.7%) | 2,194 (0.8%) |
| 5-Person Households | 14,034 (5.4%) | 557 (0.2%) |
| 6-Person Households | 4,117 (1.6%) | 111 (0.0%) |
| 7+ Person Households | 3,050 (1.2%) | 52 (0.0%) |
| Total | 157,841 (60.5%) | 102,921 (39.5%) |
Female Fertility in Area Code 762
Fertility by Age in Area Code 762
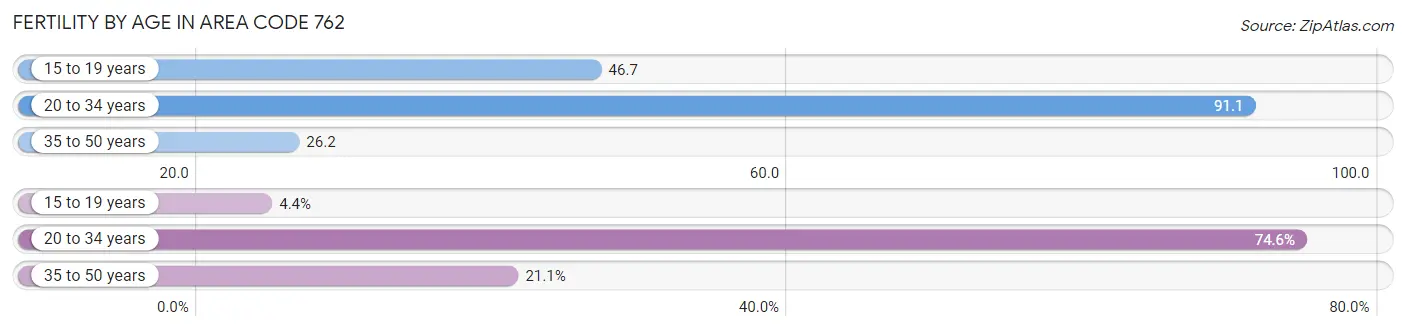
Average fertility rate in Area Code 762 is 48.3 births per 1,000 women. Women in the age bracket of 20 to 34 years have the highest fertility rate with 91.1 births per 1,000 women. Women in the age bracket of 20 to 34 years acount for 74.6% of all women with births.
| Age Bracket | Women with Births | Births / 1,000 Women |
| 15 to 19 years | 321 (4.4%) | 46.7 |
| 20 to 34 years | 5,490 (74.6%) | 91.1 |
| 35 to 50 years | 1,551 (21.1%) | 26.2 |
| Total | 7,362 (100.0%) | 48.3 |
Fertility by Age by Marriage Status in Area Code 762
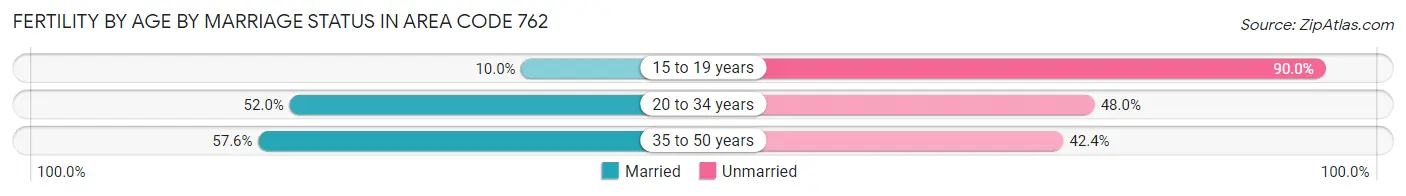
53.9% of women with births (7,362) in Area Code 762 are married. The highest percentage of unmarried women with births falls into 15 to 19 years age bracket with 90.0% of them unmarried at the time of birth, while the lowest percentage of unmarried women with births belong to 35 to 50 years age bracket with 42.4% of them unmarried.
| Age Bracket | Married | Unmarried |
| 15 to 19 years | 32 (10.0%) | 289 (90.0%) |
| 20 to 34 years | 2,853 (52.0%) | 2,637 (48.0%) |
| 35 to 50 years | 894 (57.6%) | 657 (42.4%) |
| Total | 3,970 (53.9%) | 3,392 (46.1%) |
Fertility by Education in Area Code 762
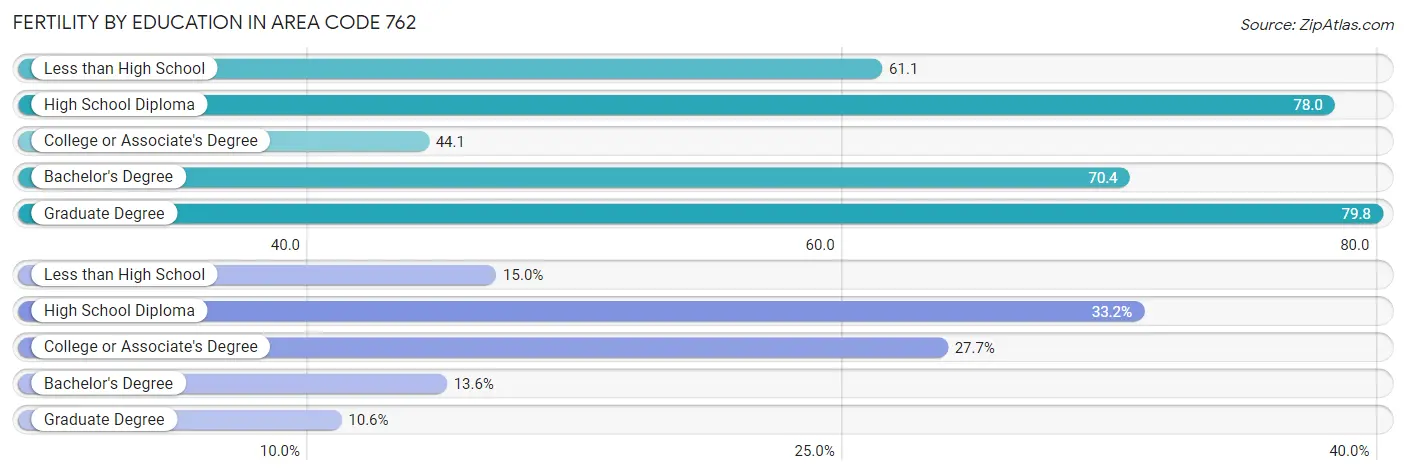
Average fertility rate in Area Code 762 is 48.3 births per 1,000 women. Women with the education attainment of graduate degree have the highest fertility rate of 79.8 births per 1,000 women, while women with the education attainment of college or associate's degree have the lowest fertility at 44.1 births per 1,000 women. Women with the education attainment of high school diploma represent 33.2% of all women with births.
| Educational Attainment | Women with Births | Births / 1,000 Women |
| Less than High School | 1,102 (15.0%) | 61.1 |
| High School Diploma | 2,442 (33.2%) | 78.0 |
| College or Associate's Degree | 2,036 (27.7%) | 44.1 |
| Bachelor's Degree | 1,000 (13.6%) | 70.4 |
| Graduate Degree | 782 (10.6%) | 79.8 |
| Total | 7,362 (100.0%) | 48.3 |
Fertility by Education by Marriage Status in Area Code 762
46.1% of women with births in Area Code 762 are unmarried. Women with the educational attainment of graduate degree are most likely to be married with 52.4% of them married at childbirth, while women with the educational attainment of less than high school are least likely to be married with 67.1% of them unmarried at childbirth.
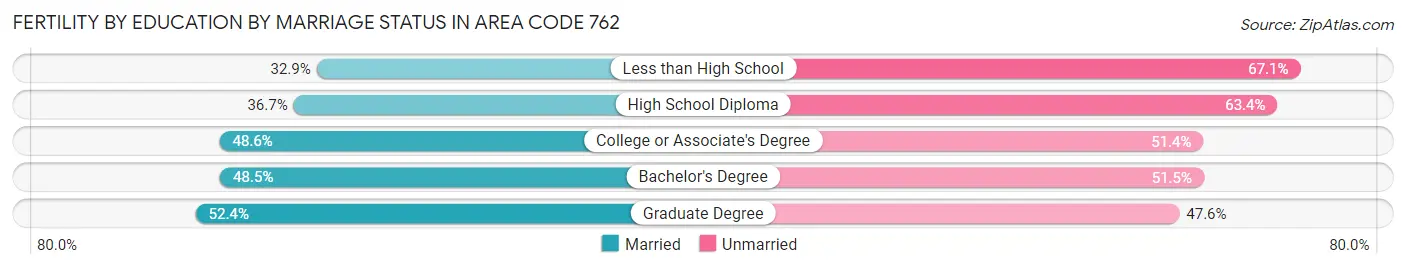
| Educational Attainment | Married | Unmarried |
| Less than High School | 363 (32.9%) | 739 (67.1%) |
| High School Diploma | 895 (36.6%) | 1,547 (63.3%) |
| College or Associate's Degree | 989 (48.6%) | 1,047 (51.4%) |
| Bachelor's Degree | 485 (48.5%) | 515 (51.5%) |
| Graduate Degree | 410 (52.4%) | 372 (47.6%) |
| Total | 3,970 (53.9%) | 3,392 (46.1%) |
Employment Characteristics in Area Code 762
Employment by Class of Employer in Area Code 762
Among the 300,153 employed individuals in Area Code 762, private company employees (208,790 | 69.6%), state government employees (20,263 | 6.8%), and local government employees (19,915 | 6.6%) make up the most common classes of employment.
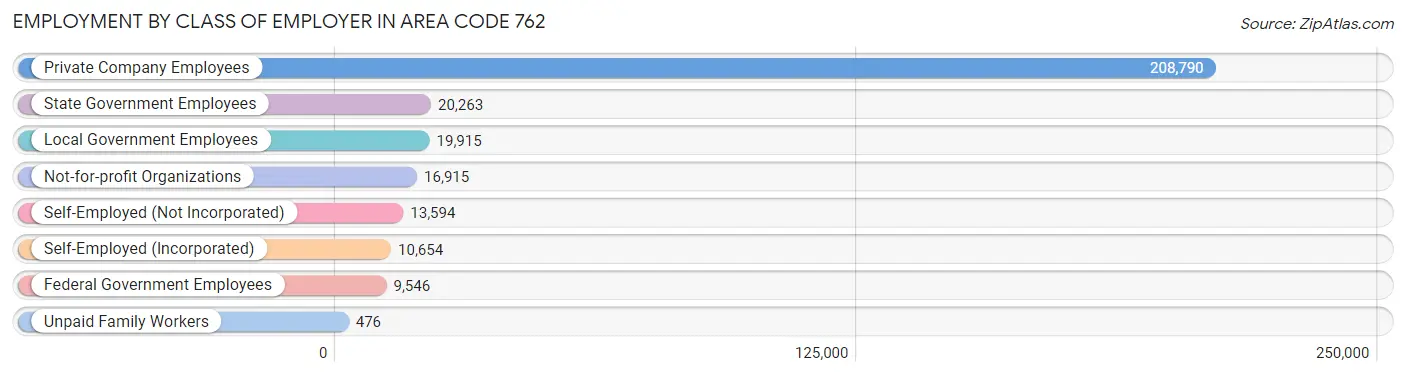
| Employer Class | # Employees | % Employees |
| Private Company Employees | 208,790 | 69.6% |
| Self-Employed (Incorporated) | 10,654 | 3.5% |
| Self-Employed (Not Incorporated) | 13,594 | 4.5% |
| Not-for-profit Organizations | 16,915 | 5.6% |
| Local Government Employees | 19,915 | 6.6% |
| State Government Employees | 20,263 | 6.8% |
| Federal Government Employees | 9,546 | 3.2% |
| Unpaid Family Workers | 476 | 0.2% |
| Total | 300,153 | 100.0% |
Employment Status by Age in Area Code 762
According to the labor force statistics for Area Code 762, out of the total population over 16 years of age (539,269), 56.7% or 305,496 individuals are in the labor force, with 5.9% or 17,963 of them unemployed. The age group with the highest labor force participation rate is 25 to 29 years, with 81.0% or 38,146 individuals in the labor force. Within the labor force, the 16 to 19 years age range has the highest percentage of unemployed individuals, with 463.9% or 65,925 of them being unemployed.
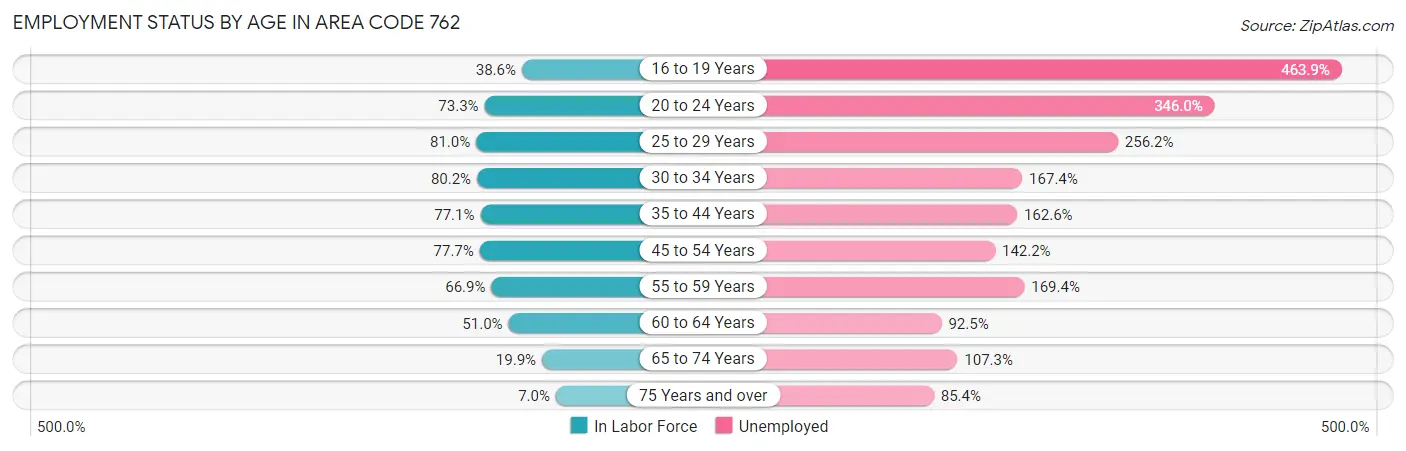
| Age Bracket | In Labor Force | Unemployed |
| 16 to 19 Years | 14,211 (38.6%) | 65,925 (463.9%) |
| 20 to 24 Years | 45,045 (73.3%) | 155,852 (346.0%) |
| 25 to 29 Years | 38,145 (81.0%) | 97,730 (256.2%) |
| 30 to 34 Years | 35,541 (80.2%) | 59,497 (167.4%) |
| 35 to 44 Years | 62,383 (77.0%) | 101,433 (162.6%) |
| 45 to 54 Years | 61,936 (77.7%) | 88,070 (142.2%) |
| 55 to 59 Years | 26,717 (66.9%) | 45,262 (169.4%) |
| 60 to 64 Years | 21,052 (51.0%) | 19,475 (92.5%) |
| 65 to 74 Years | 12,586 (19.9%) | 13,506 (107.3%) |
| 75 Years and over | 3,120 (7.0%) | 2,664 (85.4%) |
| Total | 305,496 (56.7%) | 17,952 (5.9%) |
Employment Status by Educational Attainment in Area Code 762
According to labor force statistics for Area Code 762, 72.9% of individuals (243,024) out of the total population between 25 and 64 years of age (333,366) are in the labor force, with 171.4% or 416,543 of them being unemployed. The group with the highest labor force participation rate are those with the educational attainment of bachelor's degree or higher, with 80.9% or 72,969 individuals in the labor force. Within the labor force, individuals with less than high school education have the highest percentage of unemployment, with 313.3% or 90,929 of them being unemployed.
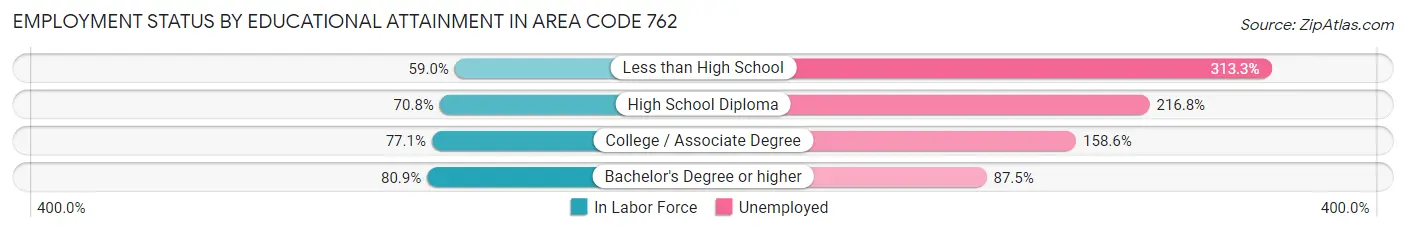
| Educational Attainment | In Labor Force | Unemployed |
| Less than High School | 29,022 (59.0%) | 154,247 (313.3%) |
| High School Diploma | 71,302 (70.8%) | 218,233 (216.8%) |
| College / Associate Degree | 71,904 (77.1%) | 147,882 (158.6%) |
| Bachelor's Degree or higher | 72,969 (80.9%) | 78,951 (87.5%) |
| Total | 243,015 (72.9%) | 571,389 (171.4%) |
Employment Occupations by Sex in Area Code 762
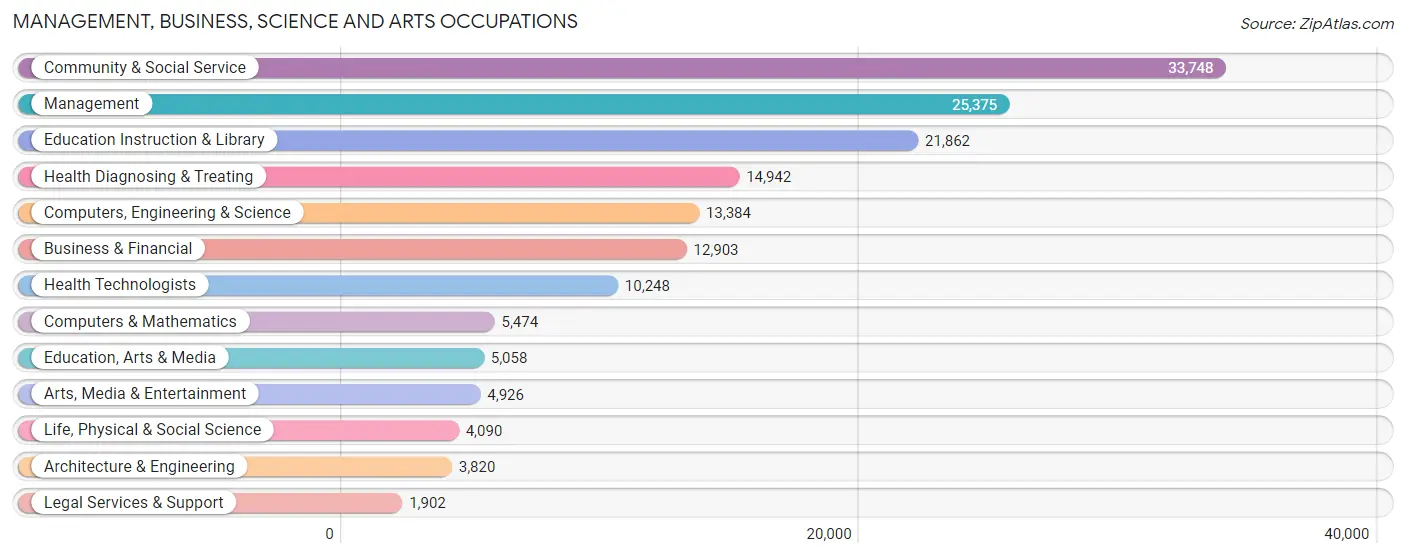
Management, Business, Science and Arts Occupations
The most common Management, Business, Science and Arts occupations in Area Code 762 are Community & Social Service (33,748 | 11.2%), Management (25,375 | 8.4%), Education Instruction & Library (21,862 | 7.2%), Health Diagnosing & Treating (14,942 | 4.9%), and Computers, Engineering & Science (13,384 | 4.4%).
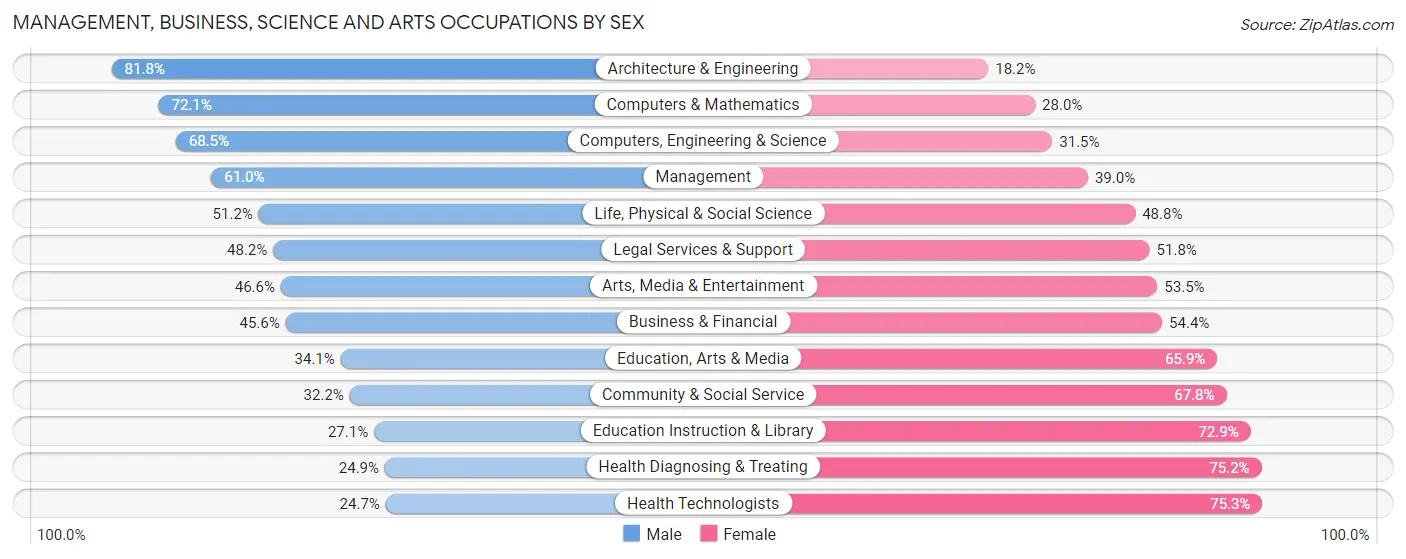
Management, Business, Science and Arts Occupations by Sex
Within the Management, Business, Science and Arts occupations in Area Code 762, the most male-oriented occupations are Architecture & Engineering (81.8%), Computers & Mathematics (72.1%), and Computers, Engineering & Science (68.5%), while the most female-oriented occupations are Health Technologists (75.3%), Health Diagnosing & Treating (75.1%), and Education Instruction & Library (72.9%).
| Occupation | Male | Female |
| Management | 15,486 (61.0%) | 9,889 (39.0%) |
| Business & Financial | 5,879 (45.6%) | 7,024 (54.4%) |
| Computers, Engineering & Science | 9,163 (68.5%) | 4,221 (31.5%) |
| Computers & Mathematics | 3,944 (72.1%) | 1,530 (28.0%) |
| Architecture & Engineering | 3,126 (81.8%) | 694 (18.2%) |
| Life, Physical & Social Science | 2,093 (51.2%) | 1,997 (48.8%) |
| Community & Social Service | 10,862 (32.2%) | 22,886 (67.8%) |
| Education, Arts & Media | 1,724 (34.1%) | 3,334 (65.9%) |
| Legal Services & Support | 916 (48.2%) | 986 (51.8%) |
| Education Instruction & Library | 5,929 (27.1%) | 15,933 (72.9%) |
| Arts, Media & Entertainment | 2,293 (46.6%) | 2,633 (53.4%) |
| Health Diagnosing & Treating | 3,713 (24.8%) | 11,229 (75.1%) |
| Health Technologists | 2,529 (24.7%) | 7,719 (75.3%) |
| Total (Category) | 45,103 (44.9%) | 55,249 (55.1%) |
| Total (Overall) | 155,987 (51.6%) | 146,200 (48.4%) |
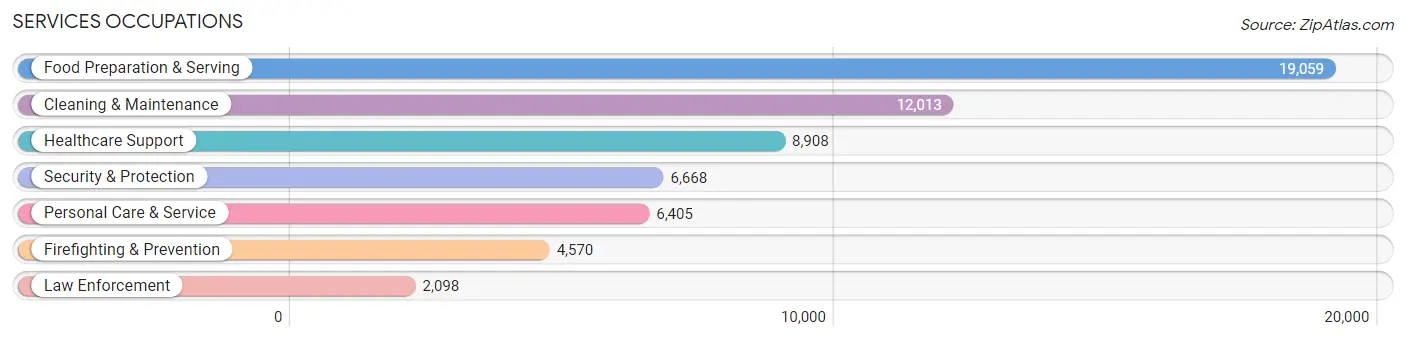
Services Occupations
The most common Services occupations in Area Code 762 are Food Preparation & Serving (19,059 | 6.3%), Cleaning & Maintenance (12,013 | 4.0%), Healthcare Support (8,908 | 2.9%), Security & Protection (6,668 | 2.2%), and Personal Care & Service (6,405 | 2.1%).
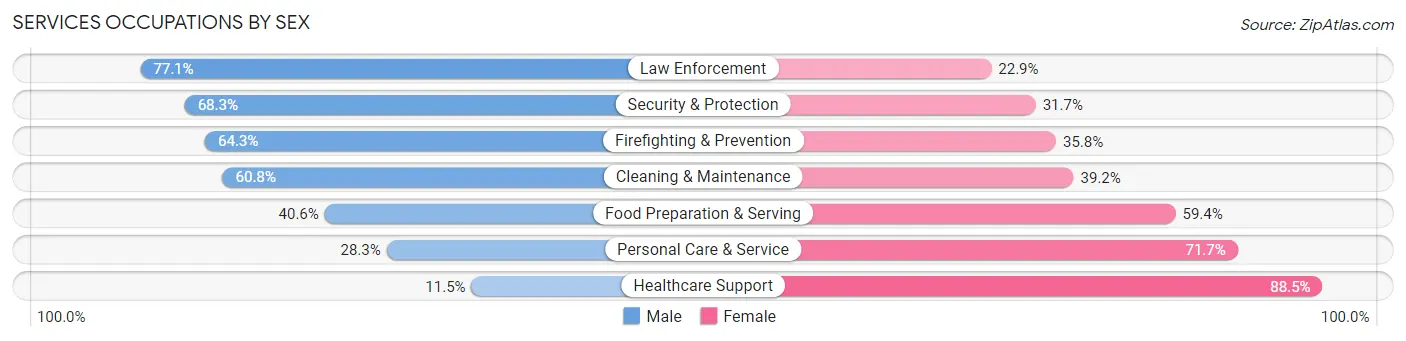
Services Occupations by Sex
Within the Services occupations in Area Code 762, the most male-oriented occupations are Law Enforcement (77.1%), Security & Protection (68.3%), and Firefighting & Prevention (64.2%), while the most female-oriented occupations are Healthcare Support (88.5%), Personal Care & Service (71.7%), and Food Preparation & Serving (59.4%).
| Occupation | Male | Female |
| Healthcare Support | 1,026 (11.5%) | 7,882 (88.5%) |
| Security & Protection | 4,553 (68.3%) | 2,115 (31.7%) |
| Firefighting & Prevention | 2,936 (64.2%) | 1,634 (35.7%) |
| Law Enforcement | 1,617 (77.1%) | 481 (22.9%) |
| Food Preparation & Serving | 7,737 (40.6%) | 11,322 (59.4%) |
| Cleaning & Maintenance | 7,301 (60.8%) | 4,712 (39.2%) |
| Personal Care & Service | 1,814 (28.3%) | 4,591 (71.7%) |
| Total (Category) | 22,431 (42.3%) | 30,622 (57.7%) |
| Total (Overall) | 155,987 (51.6%) | 146,200 (48.4%) |
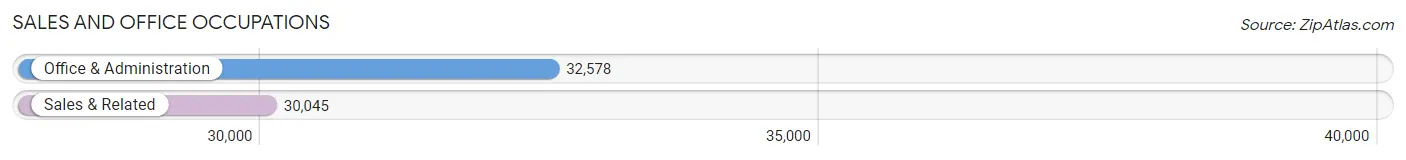
Sales and Office Occupations
The most common Sales and Office occupations in Area Code 762 are Office & Administration (32,578 | 10.8%), and Sales & Related (30,045 | 9.9%).
Sales and Office Occupations by Sex
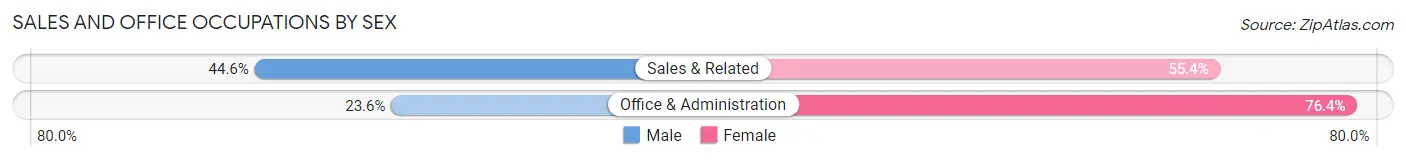
| Occupation | Male | Female |
| Sales & Related | 13,402 (44.6%) | 16,643 (55.4%) |
| Office & Administration | 7,681 (23.6%) | 24,897 (76.4%) |
| Total (Category) | 21,083 (33.7%) | 41,540 (66.3%) |
| Total (Overall) | 155,987 (51.6%) | 146,200 (48.4%) |
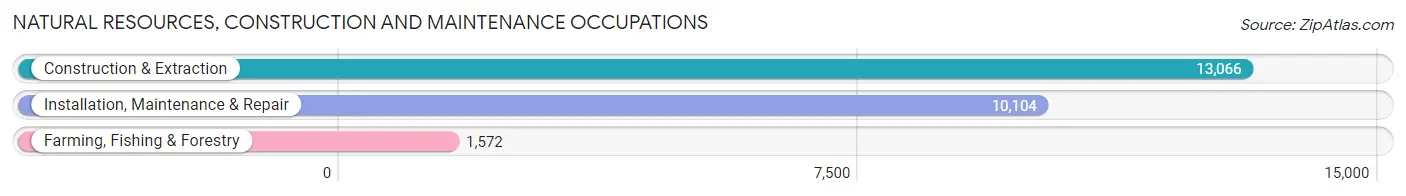
Natural Resources, Construction and Maintenance Occupations
The most common Natural Resources, Construction and Maintenance occupations in Area Code 762 are Construction & Extraction (13,066 | 4.3%), Installation, Maintenance & Repair (10,104 | 3.3%), and Farming, Fishing & Forestry (1,572 | 0.5%).
Natural Resources, Construction and Maintenance Occupations by Sex
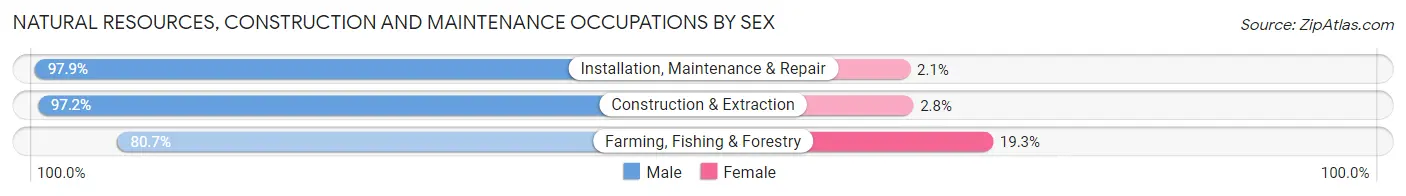
| Occupation | Male | Female |
| Farming, Fishing & Forestry | 1,268 (80.7%) | 304 (19.3%) |
| Construction & Extraction | 12,706 (97.2%) | 360 (2.8%) |
| Installation, Maintenance & Repair | 9,891 (97.9%) | 213 (2.1%) |
| Total (Category) | 23,865 (96.5%) | 877 (3.5%) |
| Total (Overall) | 155,987 (51.6%) | 146,200 (48.4%) |
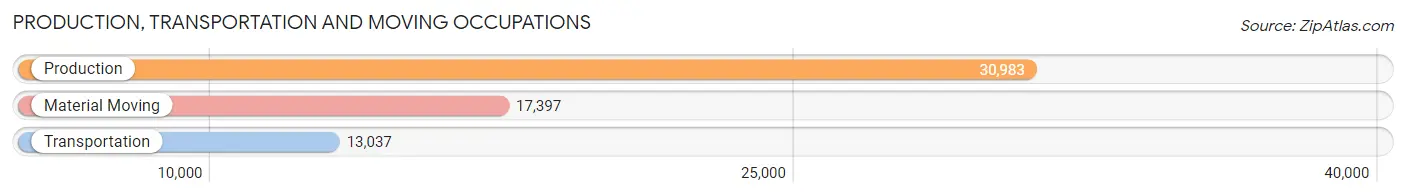
Production, Transportation and Moving Occupations
The most common Production, Transportation and Moving occupations in Area Code 762 are Production (30,983 | 10.2%), Material Moving (17,397 | 5.8%), and Transportation (13,037 | 4.3%).
Production, Transportation and Moving Occupations by Sex
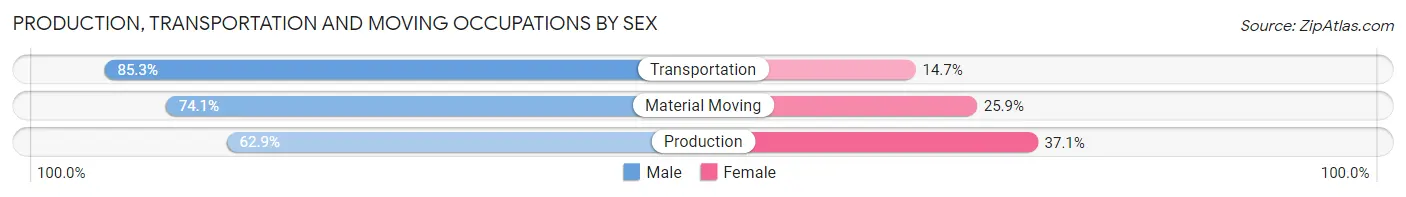
| Occupation | Male | Female |
| Production | 19,495 (62.9%) | 11,488 (37.1%) |
| Transportation | 11,123 (85.3%) | 1,914 (14.7%) |
| Material Moving | 12,887 (74.1%) | 4,510 (25.9%) |
| Total (Category) | 43,505 (70.8%) | 17,912 (29.2%) |
| Total (Overall) | 155,987 (51.6%) | 146,200 (48.4%) |
Employment Industries by Sex in Area Code 762
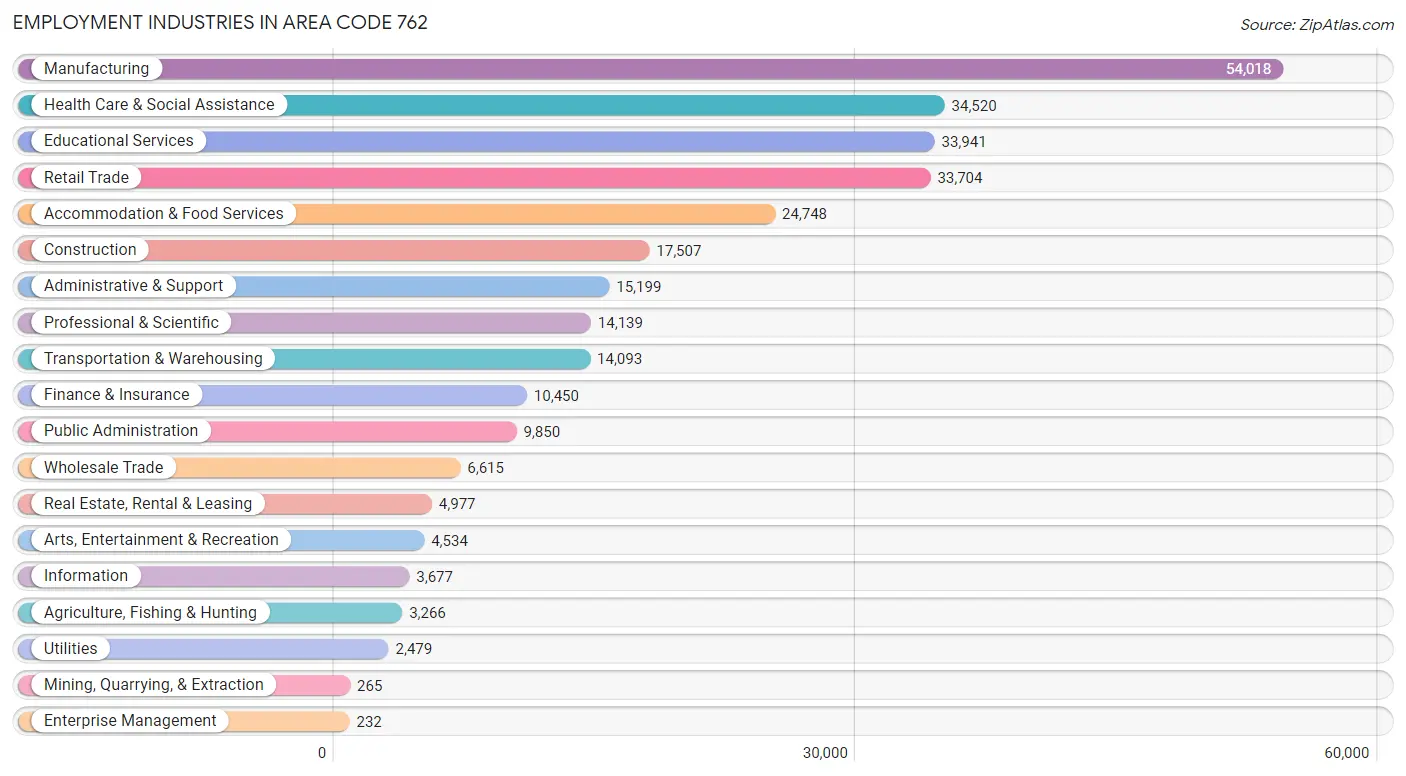
Employment Industries in Area Code 762
The major employment industries in Area Code 762 include Manufacturing (54,018 | 17.9%), Health Care & Social Assistance (34,520 | 11.4%), Educational Services (33,941 | 11.2%), Retail Trade (33,704 | 11.2%), and Accommodation & Food Services (24,748 | 8.2%).
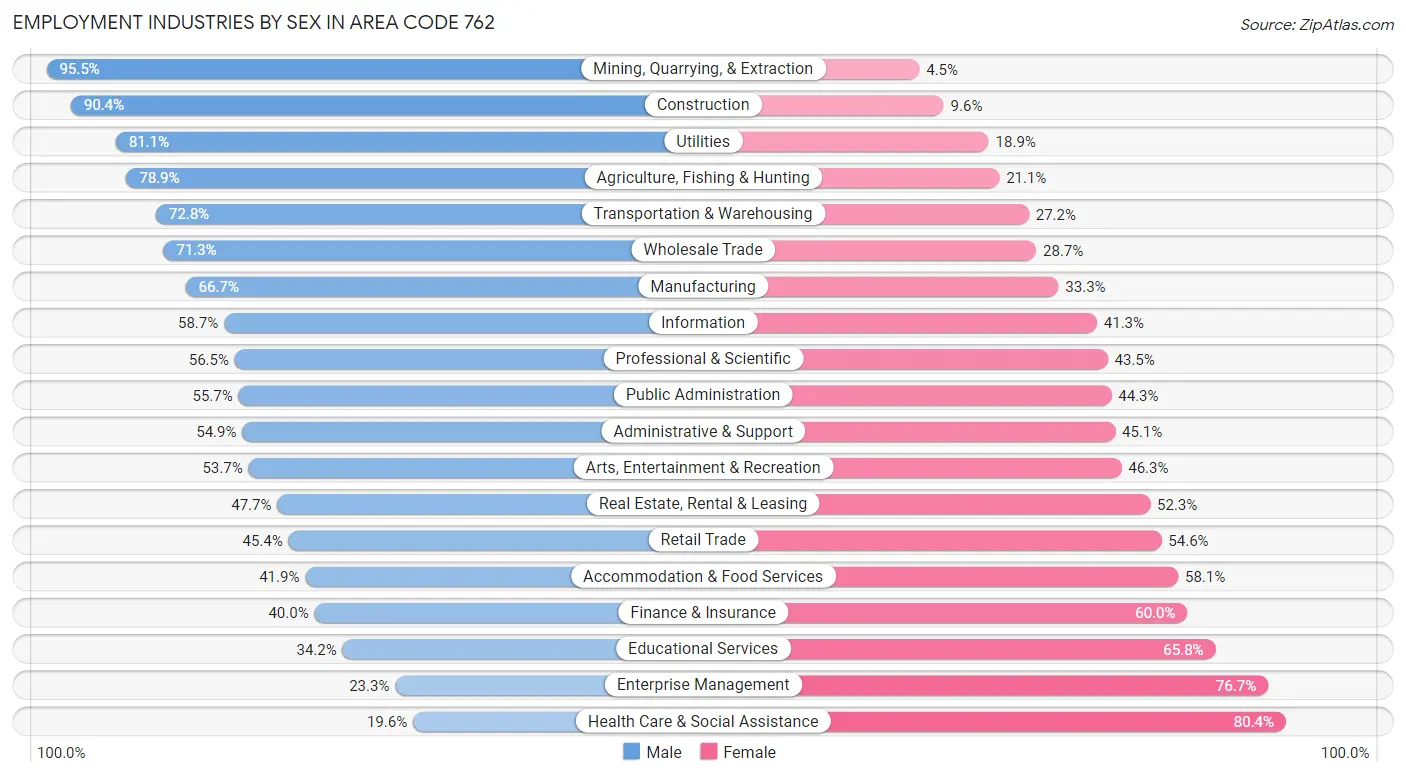
Employment Industries by Sex in Area Code 762
The Area Code 762 industries that see more men than women are Mining, Quarrying, & Extraction (95.5%), Construction (90.4%), and Utilities (81.1%), whereas the industries that tend to have a higher number of women are Health Care & Social Assistance (80.4%), Enterprise Management (76.7%), and Educational Services (65.8%).
| Industry | Male | Female |
| Agriculture, Fishing & Hunting | 2,578 (78.9%) | 688 (21.1%) |
| Mining, Quarrying, & Extraction | 253 (95.5%) | 12 (4.5%) |
| Construction | 15,832 (90.4%) | 1,675 (9.6%) |
| Manufacturing | 36,017 (66.7%) | 18,001 (33.3%) |
| Wholesale Trade | 4,716 (71.3%) | 1,899 (28.7%) |
| Retail Trade | 15,288 (45.4%) | 18,416 (54.6%) |
| Transportation & Warehousing | 10,261 (72.8%) | 3,832 (27.2%) |
| Utilities | 2,011 (81.1%) | 468 (18.9%) |
| Information | 2,159 (58.7%) | 1,518 (41.3%) |
| Finance & Insurance | 4,180 (40.0%) | 6,270 (60.0%) |
| Real Estate, Rental & Leasing | 2,374 (47.7%) | 2,603 (52.3%) |
| Professional & Scientific | 7,989 (56.5%) | 6,150 (43.5%) |
| Enterprise Management | 54 (23.3%) | 178 (76.7%) |
| Administrative & Support | 8,351 (54.9%) | 6,848 (45.1%) |
| Educational Services | 11,606 (34.2%) | 22,335 (65.8%) |
| Health Care & Social Assistance | 6,769 (19.6%) | 27,751 (80.4%) |
| Arts, Entertainment & Recreation | 2,433 (53.7%) | 2,101 (46.3%) |
| Accommodation & Food Services | 10,371 (41.9%) | 14,377 (58.1%) |
| Public Administration | 5,488 (55.7%) | 4,362 (44.3%) |
| Total | 155,987 (51.6%) | 146,200 (48.4%) |
Education in Area Code 762
School Enrollment in Area Code 762
The most common levels of schooling among the 177,273 students in Area Code 762 are college / undergraduate (47,652 | 26.9%), middle school (35,689 | 20.1%), and high school (33,458 | 18.9%).
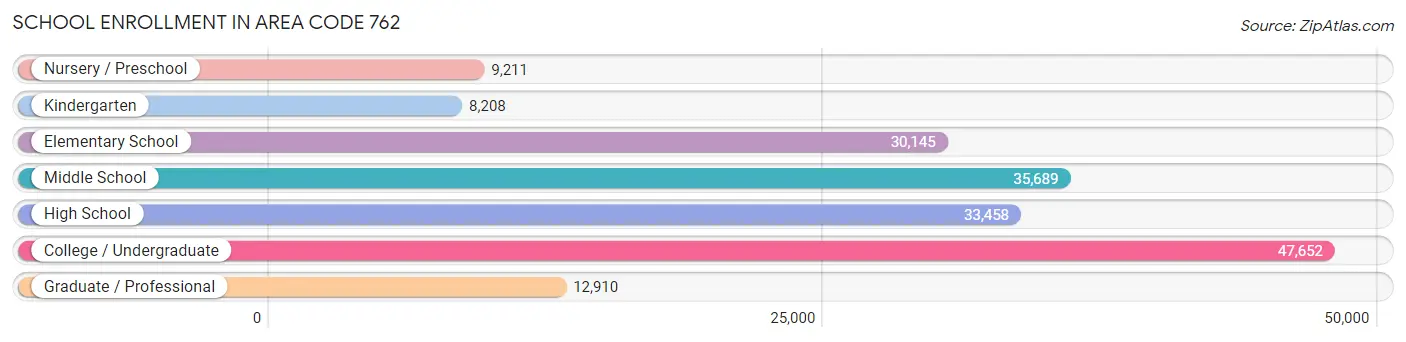
| School Level | # Students | % Students |
| Nursery / Preschool | 9,211 | 5.2% |
| Kindergarten | 8,208 | 4.6% |
| Elementary School | 30,145 | 17.0% |
| Middle School | 35,689 | 20.1% |
| High School | 33,458 | 18.9% |
| College / Undergraduate | 47,652 | 26.9% |
| Graduate / Professional | 12,910 | 7.3% |
| Total | 177,273 | 100.0% |
School Enrollment by Age by Funding Source in Area Code 762
Out of a total of 177,273 students who are enrolled in schools in Area Code 762, 22,277 (12.6%) attend a private institution, while the remaining 154,996 (87.4%) are enrolled in public schools. The age group of 3 to 4 year olds has the highest likelihood of being enrolled in private schools, with 2,028 (28.4% in the age bracket) enrolled. Conversely, the age group of 15 to 17 year olds has the lowest likelihood of being enrolled in a private school, with 22,136 (91.2% in the age bracket) attending a public institution.
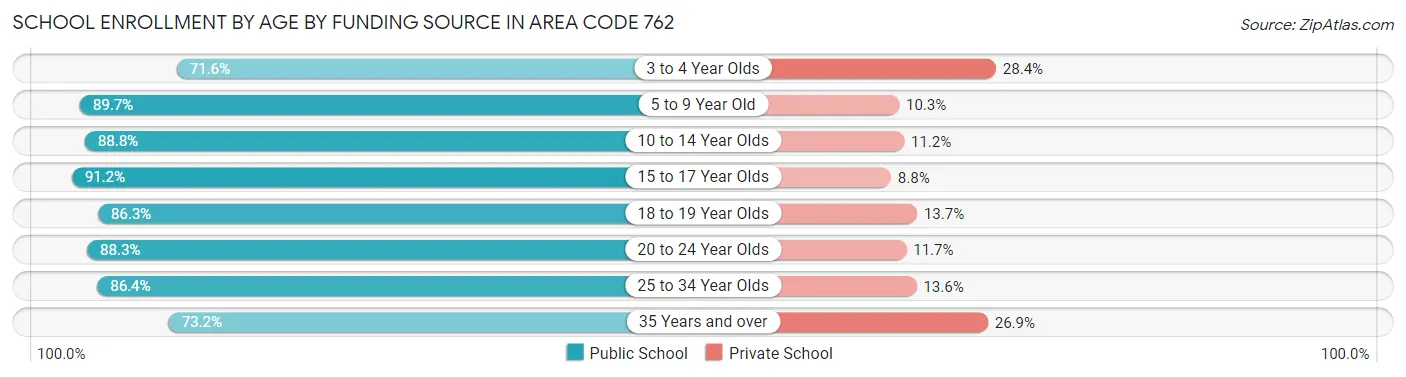
| Age Bracket | Public School | Private School |
| 3 to 4 Year Olds | 5,122 (71.6%) | 2,028 (28.4%) |
| 5 to 9 Year Old | 31,522 (89.7%) | 3,625 (10.3%) |
| 10 to 14 Year Olds | 39,080 (88.8%) | 4,951 (11.2%) |
| 15 to 17 Year Olds | 22,136 (91.2%) | 2,136 (8.8%) |
| 18 to 19 Year Olds | 13,433 (86.3%) | 2,125 (13.7%) |
| 20 to 24 Year Olds | 27,203 (88.3%) | 3,592 (11.7%) |
| 25 to 34 Year Olds | 10,584 (86.4%) | 1,661 (13.6%) |
| 35 Years and over | 5,907 (73.2%) | 2,168 (26.9%) |
| Total | 154,996 (87.4%) | 22,277 (12.6%) |
Educational Attainment by Field of Study in Area Code 762
Business (23,375 | 18.2%), education (19,315 | 15.1%), science & technology (11,735 | 9.2%), bio, nature & agricultural (10,788 | 8.4%), and social sciences (9,421 | 7.3%) are the most common fields of study among 128,103 individuals in Area Code 762 who have obtained a bachelor's degree or higher.
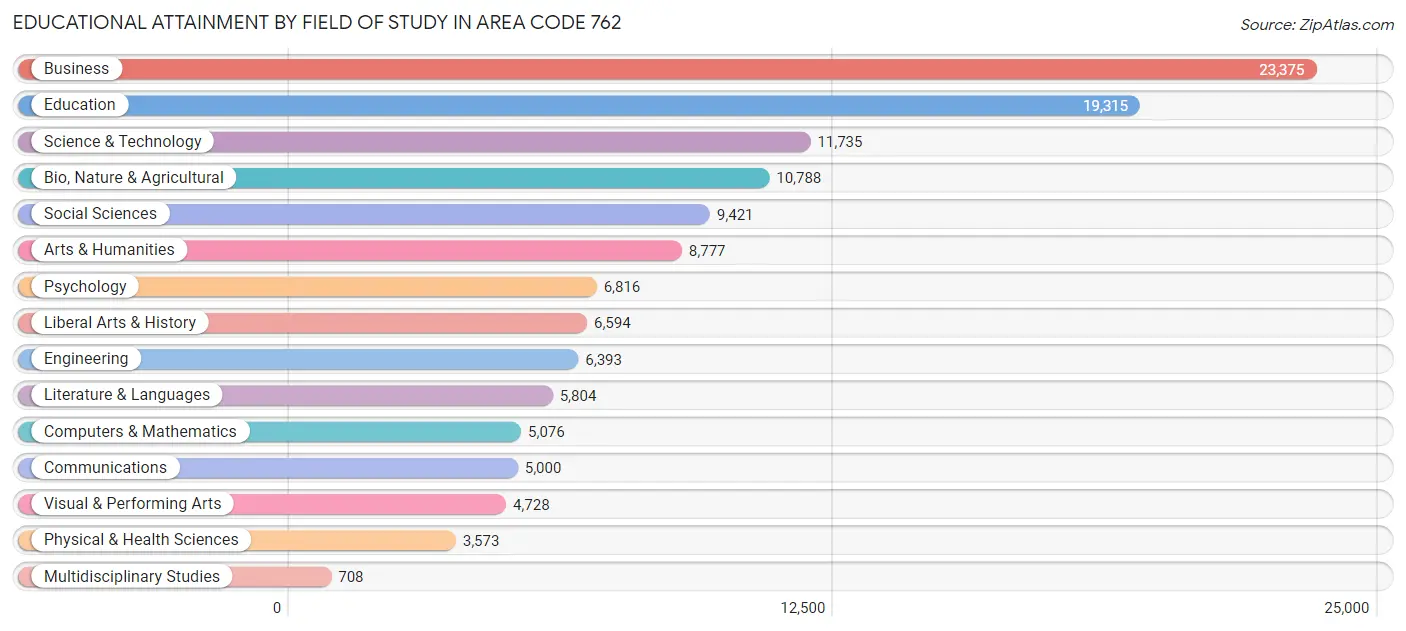
| Field of Study | # Graduates | % Graduates |
| Computers & Mathematics | 5,076 | 4.0% |
| Bio, Nature & Agricultural | 10,788 | 8.4% |
| Physical & Health Sciences | 3,573 | 2.8% |
| Psychology | 6,816 | 5.3% |
| Social Sciences | 9,421 | 7.3% |
| Engineering | 6,393 | 5.0% |
| Multidisciplinary Studies | 708 | 0.5% |
| Science & Technology | 11,735 | 9.2% |
| Business | 23,375 | 18.2% |
| Education | 19,315 | 15.1% |
| Literature & Languages | 5,804 | 4.5% |
| Liberal Arts & History | 6,594 | 5.1% |
| Visual & Performing Arts | 4,728 | 3.7% |
| Communications | 5,000 | 3.9% |
| Arts & Humanities | 8,777 | 6.9% |
| Total | 128,103 | 100.0% |
Transportation & Commute in Area Code 762
Vehicle Availability by Sex in Area Code 762
The most prevalent vehicle ownership categories in Area Code 762 are males with 2 vehicles (58,880, accounting for 38.1%) and females with 2 vehicles (52,562, making up 41.4%).
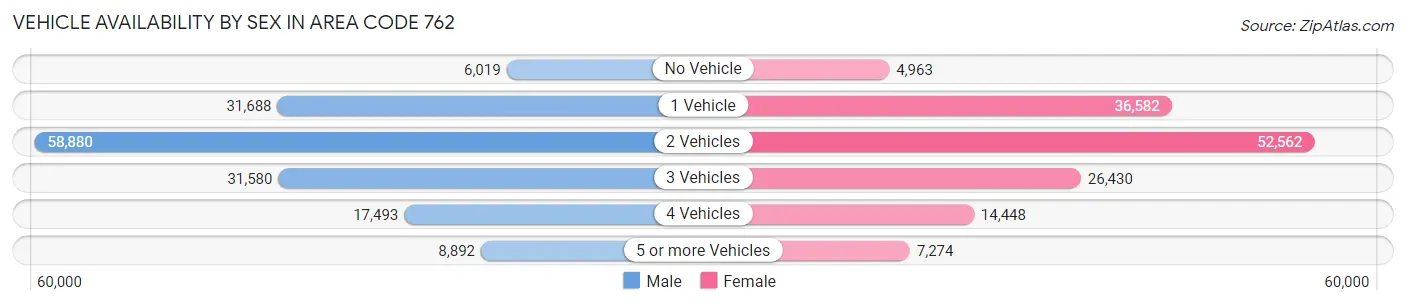
| Vehicles Available | Male | Female |
| No Vehicle | 6,019 (3.9%) | 4,963 (3.5%) |
| 1 Vehicle | 31,688 (20.5%) | 36,582 (25.7%) |
| 2 Vehicles | 58,880 (38.1%) | 52,562 (36.9%) |
| 3 Vehicles | 31,580 (20.4%) | 26,430 (18.6%) |
| 4 Vehicles | 17,493 (11.3%) | 14,448 (10.2%) |
| 5 or more Vehicles | 8,892 (5.8%) | 7,274 (5.1%) |
| Total | 154,552 (100.0%) | 142,259 (100.0%) |
Commute Time in Area Code 762
The most frequently occuring commute durations in Area Code 762 are 15 to 19 minutes (58,033 commuters, 20.8%), 10 to 14 minutes (47,058 commuters, 16.8%), and 20 to 24 minutes (43,375 commuters, 15.5%).
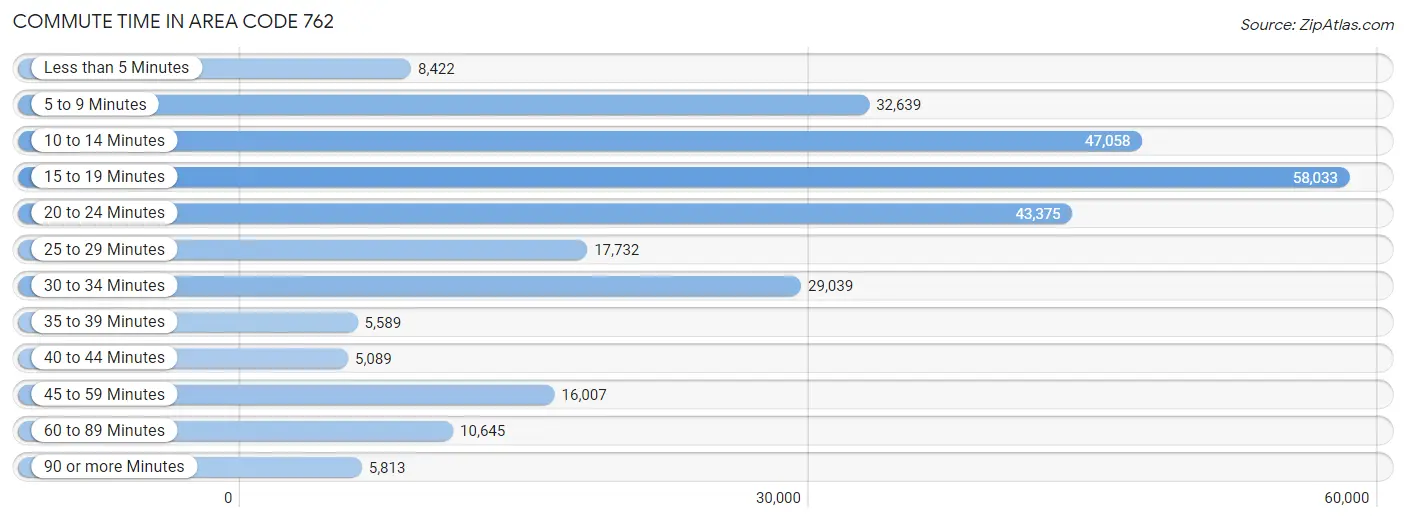
| Commute Time | # Commuters | % Commuters |
| Less than 5 Minutes | 8,422 | 3.0% |
| 5 to 9 Minutes | 32,639 | 11.7% |
| 10 to 14 Minutes | 47,058 | 16.8% |
| 15 to 19 Minutes | 58,033 | 20.8% |
| 20 to 24 Minutes | 43,375 | 15.5% |
| 25 to 29 Minutes | 17,732 | 6.4% |
| 30 to 34 Minutes | 29,039 | 10.4% |
| 35 to 39 Minutes | 5,589 | 2.0% |
| 40 to 44 Minutes | 5,089 | 1.8% |
| 45 to 59 Minutes | 16,007 | 5.7% |
| 60 to 89 Minutes | 10,645 | 3.8% |
| 90 or more Minutes | 5,813 | 2.1% |
Commute Time by Sex in Area Code 762
The most common commute times in Area Code 762 are 15 to 19 minutes (30,730 commuters, 20.9%) for males and 15 to 19 minutes (27,303 commuters, 20.6%) for females.
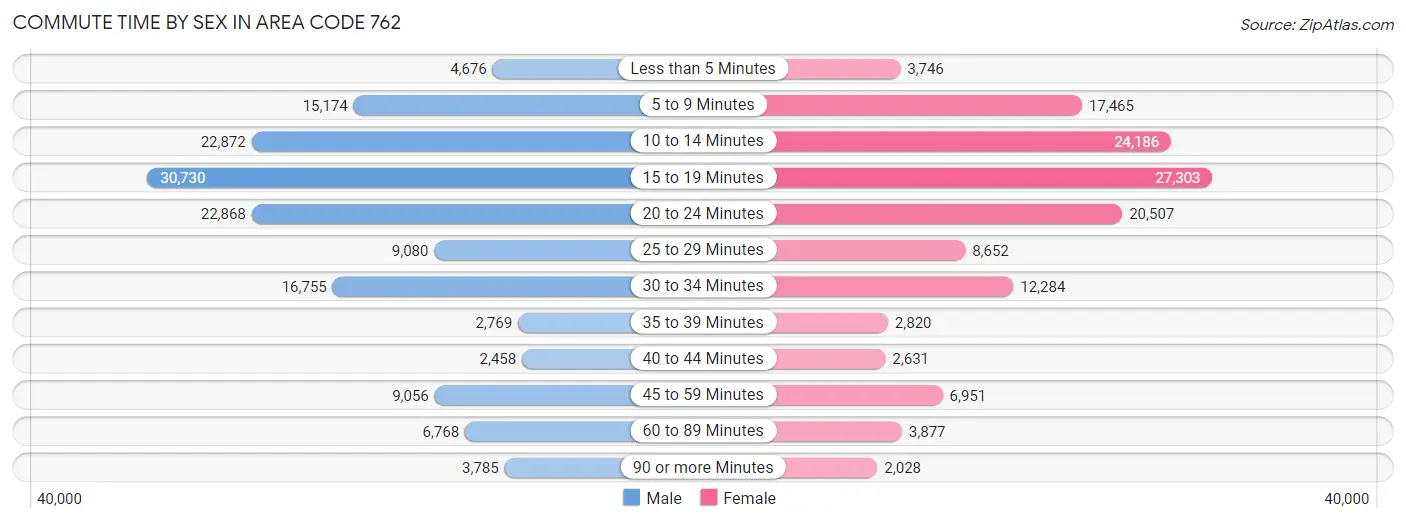
| Commute Time | Male | Female |
| Less than 5 Minutes | 4,676 (3.2%) | 3,746 (2.8%) |
| 5 to 9 Minutes | 15,174 (10.3%) | 17,465 (13.2%) |
| 10 to 14 Minutes | 22,872 (15.6%) | 24,186 (18.3%) |
| 15 to 19 Minutes | 30,730 (20.9%) | 27,303 (20.6%) |
| 20 to 24 Minutes | 22,868 (15.6%) | 20,507 (15.5%) |
| 25 to 29 Minutes | 9,080 (6.2%) | 8,652 (6.5%) |
| 30 to 34 Minutes | 16,755 (11.4%) | 12,284 (9.3%) |
| 35 to 39 Minutes | 2,769 (1.9%) | 2,820 (2.1%) |
| 40 to 44 Minutes | 2,458 (1.7%) | 2,631 (2.0%) |
| 45 to 59 Minutes | 9,056 (6.2%) | 6,951 (5.2%) |
| 60 to 89 Minutes | 6,768 (4.6%) | 3,877 (2.9%) |
| 90 or more Minutes | 3,785 (2.6%) | 2,028 (1.5%) |
Time of Departure to Work by Sex in Area Code 762
The most frequent times of departure to work in Area Code 762 are 7:00 AM to 7:29 AM (20,042, 13.6%) for males and 7:00 AM to 7:29 AM (20,364, 15.4%) for females.
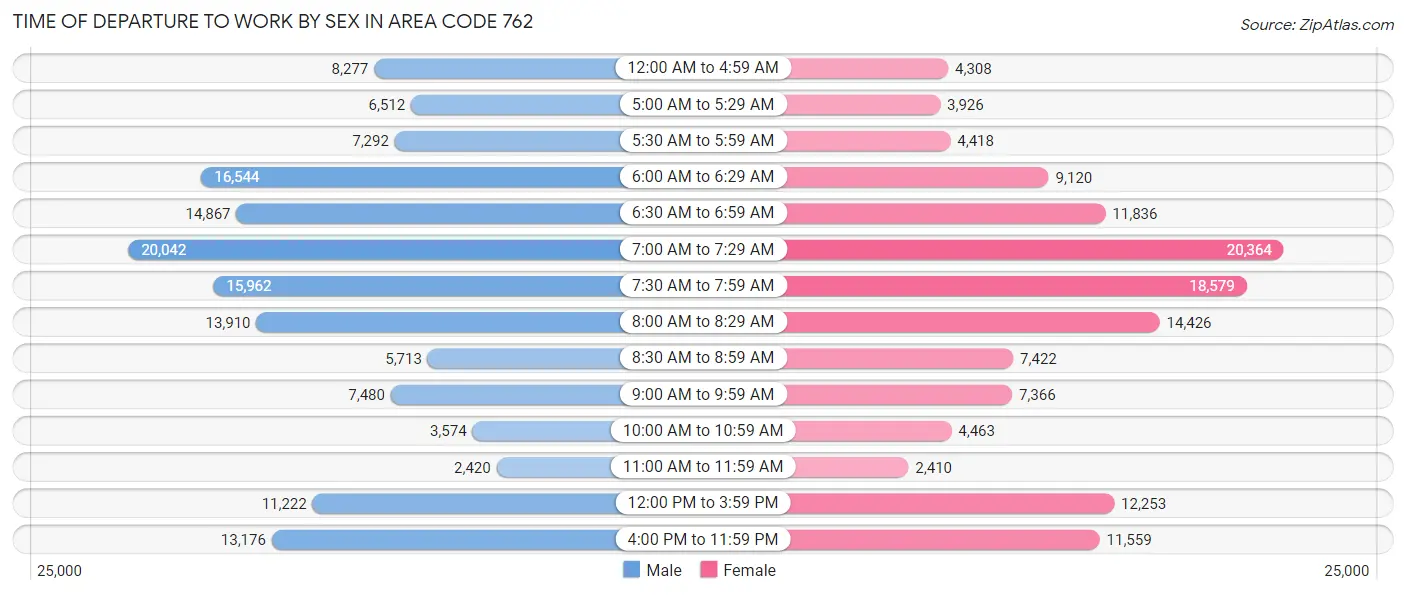
| Time of Departure | Male | Female |
| 12:00 AM to 4:59 AM | 8,277 (5.6%) | 4,308 (3.3%) |
| 5:00 AM to 5:29 AM | 6,512 (4.4%) | 3,926 (3.0%) |
| 5:30 AM to 5:59 AM | 7,292 (5.0%) | 4,418 (3.3%) |
| 6:00 AM to 6:29 AM | 16,544 (11.3%) | 9,120 (6.9%) |
| 6:30 AM to 6:59 AM | 14,867 (10.1%) | 11,836 (8.9%) |
| 7:00 AM to 7:29 AM | 20,042 (13.6%) | 20,364 (15.4%) |
| 7:30 AM to 7:59 AM | 15,962 (10.9%) | 18,579 (14.0%) |
| 8:00 AM to 8:29 AM | 13,910 (9.5%) | 14,426 (10.9%) |
| 8:30 AM to 8:59 AM | 5,713 (3.9%) | 7,422 (5.6%) |
| 9:00 AM to 9:59 AM | 7,480 (5.1%) | 7,366 (5.6%) |
| 10:00 AM to 10:59 AM | 3,574 (2.4%) | 4,463 (3.4%) |
| 11:00 AM to 11:59 AM | 2,420 (1.7%) | 2,410 (1.8%) |
| 12:00 PM to 3:59 PM | 11,222 (7.6%) | 12,253 (9.2%) |
| 4:00 PM to 11:59 PM | 13,176 (9.0%) | 11,559 (8.7%) |
| Total | 146,991 (100.0%) | 132,450 (100.0%) |
Housing Occupancy in Area Code 762
Occupancy by Ownership in Area Code 762
Of the total 260,762 dwellings in Area Code 762, owner-occupied units account for 146,129 (56.0%), while renter-occupied units make up 114,633 (44.0%).
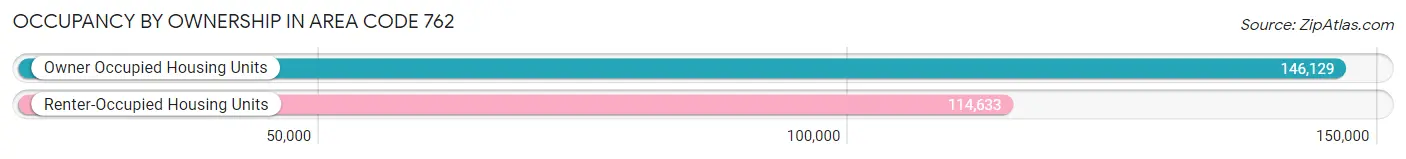
| Occupancy | # Housing Units | % Housing Units |
| Owner Occupied Housing Units | 146,129 | 56.0% |
| Renter-Occupied Housing Units | 114,633 | 44.0% |
| Total Occupied Housing Units | 260,762 | 100.0% |
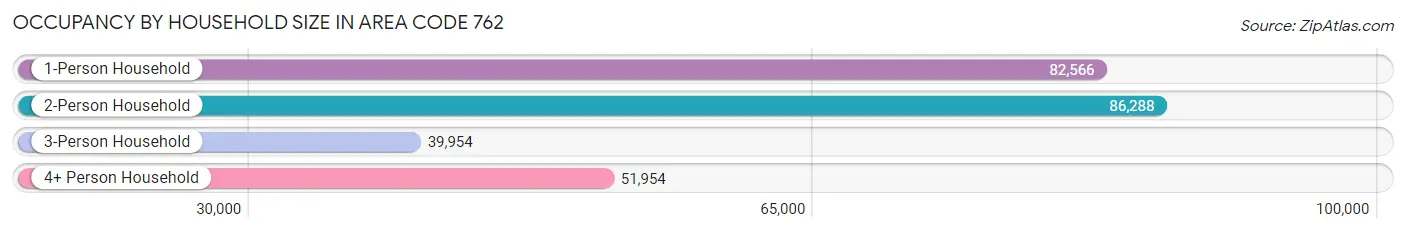
Occupancy by Household Size in Area Code 762
| Household Size | # Housing Units | % Housing Units |
| 1-Person Household | 82,566 | 31.7% |
| 2-Person Household | 86,288 | 33.1% |
| 3-Person Household | 39,954 | 15.3% |
| 4+ Person Household | 51,954 | 19.9% |
| Total Housing Units | 260,762 | 100.0% |
Occupancy by Ownership by Household Size in Area Code 762
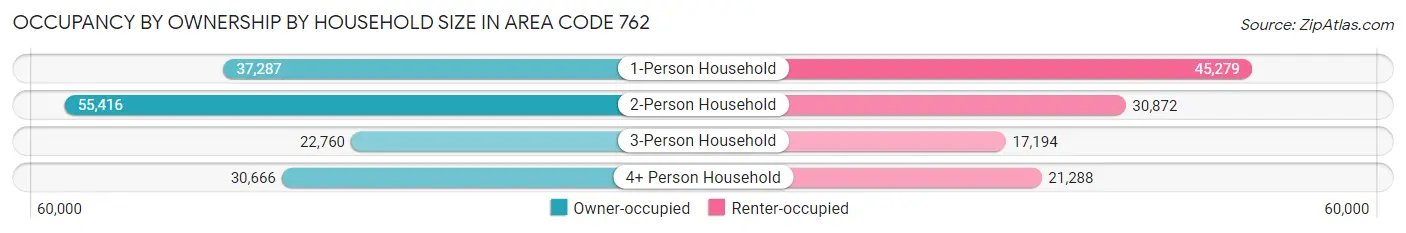
| Household Size | Owner-occupied | Renter-occupied |
| 1-Person Household | 37,287 (45.2%) | 45,279 (54.8%) |
| 2-Person Household | 55,416 (64.2%) | 30,872 (35.8%) |
| 3-Person Household | 22,760 (57.0%) | 17,194 (43.0%) |
| 4+ Person Household | 30,666 (59.0%) | 21,288 (41.0%) |
| Total Housing Units | 146,129 (56.0%) | 114,633 (44.0%) |
Occupancy by Educational Attainment in Area Code 762
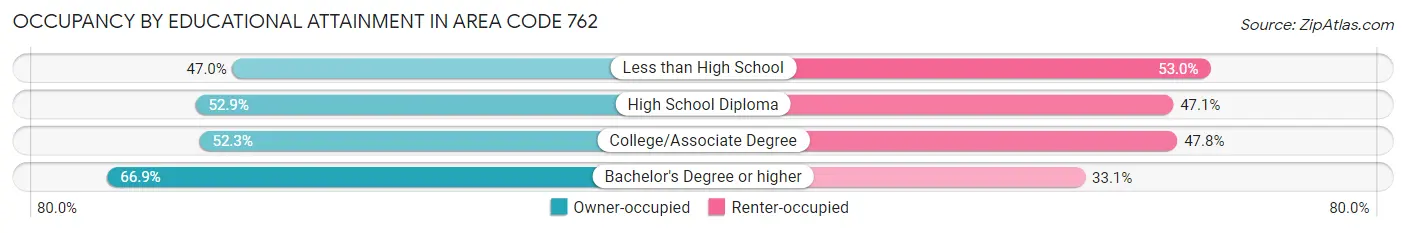
| Household Size | Owner-occupied | Renter-occupied |
| Less than High School | 16,627 (47.0%) | 18,742 (53.0%) |
| High School Diploma | 37,146 (52.9%) | 33,087 (47.1%) |
| College/Associate Degree | 40,709 (52.2%) | 37,208 (47.7%) |
| Bachelor's Degree or higher | 51,647 (66.9%) | 25,596 (33.1%) |
Occupancy by Age of Householder in Area Code 762
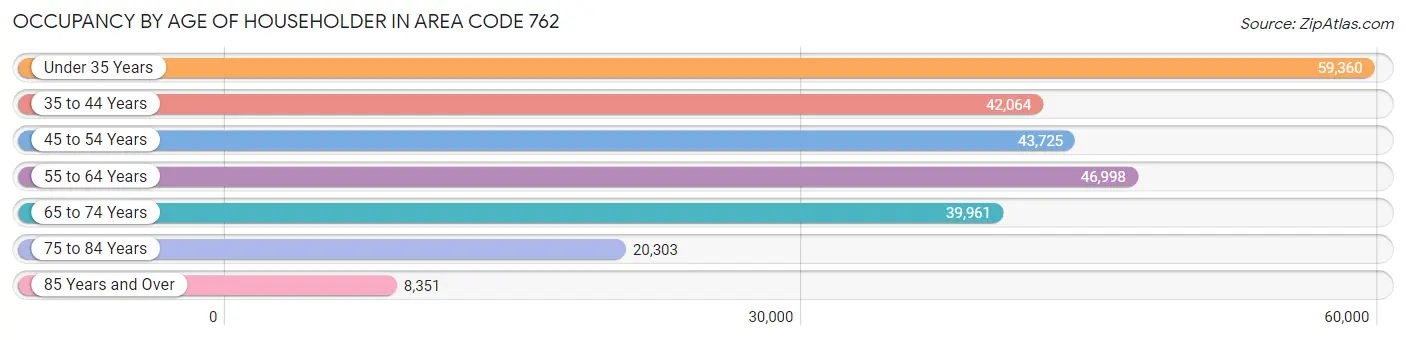
| Age Bracket | # Households | % Households |
| Under 35 Years | 59,360 | 22.8% |
| 35 to 44 Years | 42,064 | 16.1% |
| 45 to 54 Years | 43,725 | 16.8% |
| 55 to 64 Years | 46,998 | 18.0% |
| 65 to 74 Years | 39,961 | 15.3% |
| 75 to 84 Years | 20,303 | 7.8% |
| 85 Years and Over | 8,351 | 3.2% |
| Total | 260,762 | 100.0% |
Housing Finances in Area Code 762
Median Income by Occupancy in Area Code 762
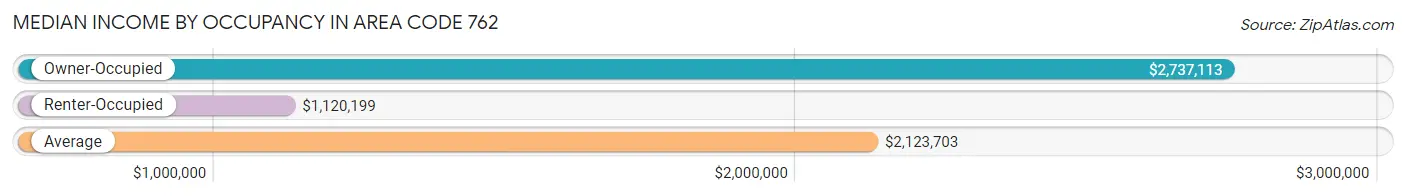
| Occupancy Type | # Households | Median Income |
| Owner-Occupied | 146,129 (56.0%) | $2,737,113 |
| Renter-Occupied | 114,633 (44.0%) | $1,120,199 |
| Average | 260,762 (100.0%) | $2,123,703 |
Occupancy by Householder Income Bracket in Area Code 762
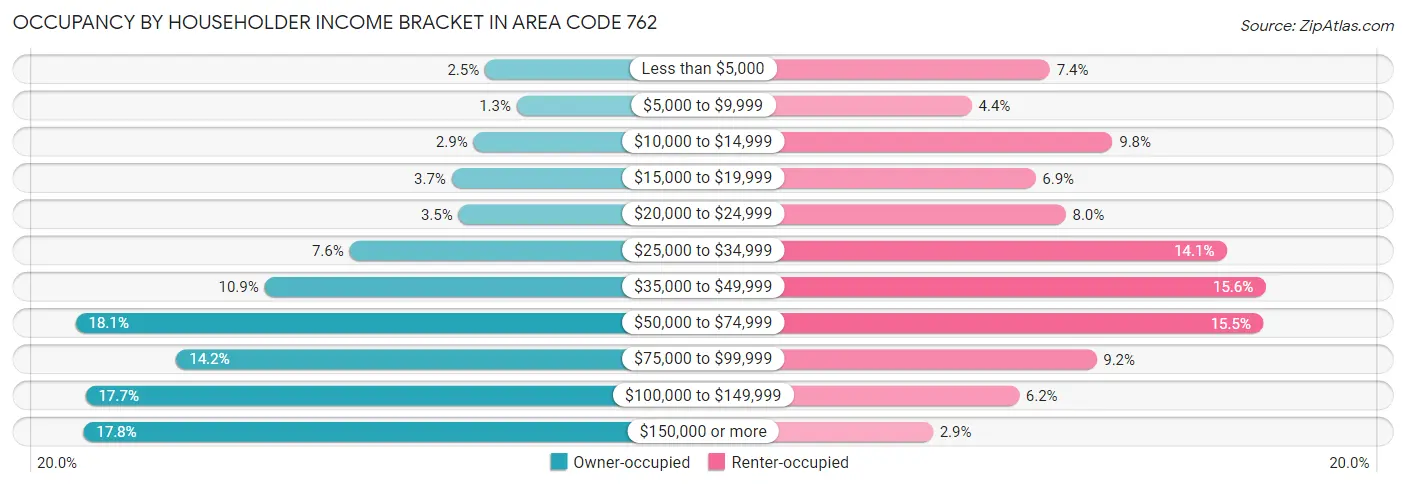
| Income Bracket | Owner-occupied | Renter-occupied |
| Less than $5,000 | 3,595 (2.5%) | 8,484 (7.4%) |
| $5,000 to $9,999 | 1,827 (1.3%) | 5,062 (4.4%) |
| $10,000 to $14,999 | 4,236 (2.9%) | 11,209 (9.8%) |
| $15,000 to $19,999 | 5,446 (3.7%) | 7,848 (6.9%) |
| $20,000 to $24,999 | 5,069 (3.5%) | 9,171 (8.0%) |
| $25,000 to $34,999 | 11,135 (7.6%) | 16,191 (14.1%) |
| $35,000 to $49,999 | 15,868 (10.9%) | 17,884 (15.6%) |
| $50,000 to $74,999 | 26,395 (18.1%) | 17,777 (15.5%) |
| $75,000 to $99,999 | 20,778 (14.2%) | 10,510 (9.2%) |
| $100,000 to $149,999 | 25,829 (17.7%) | 7,132 (6.2%) |
| $150,000 or more | 25,951 (17.8%) | 3,365 (2.9%) |
| Total | 146,129 (100.0%) | 114,633 (100.0%) |
Monthly Housing Cost Tiers in Area Code 762
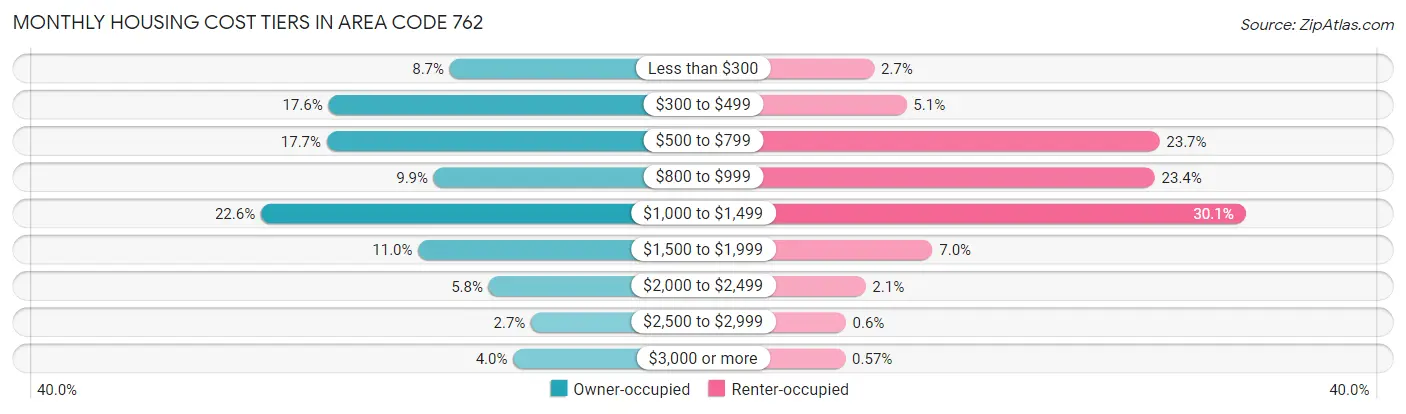
| Monthly Cost | Owner-occupied | Renter-occupied |
| Less than $300 | 12,685 (8.7%) | 3,086 (2.7%) |
| $300 to $499 | 25,750 (17.6%) | 5,820 (5.1%) |
| $500 to $799 | 25,916 (17.7%) | 27,176 (23.7%) |
| $800 to $999 | 14,403 (9.9%) | 26,777 (23.4%) |
| $1,000 to $1,499 | 33,017 (22.6%) | 34,448 (30.0%) |
| $1,500 to $1,999 | 16,073 (11.0%) | 8,018 (7.0%) |
| $2,000 to $2,499 | 8,490 (5.8%) | 2,363 (2.1%) |
| $2,500 to $2,999 | 3,931 (2.7%) | 688 (0.6%) |
| $3,000 or more | 5,864 (4.0%) | 659 (0.6%) |
| Total | 146,129 (100.0%) | 114,633 (100.0%) |
Physical Housing Characteristics in Area Code 762
Housing Structures in Area Code 762
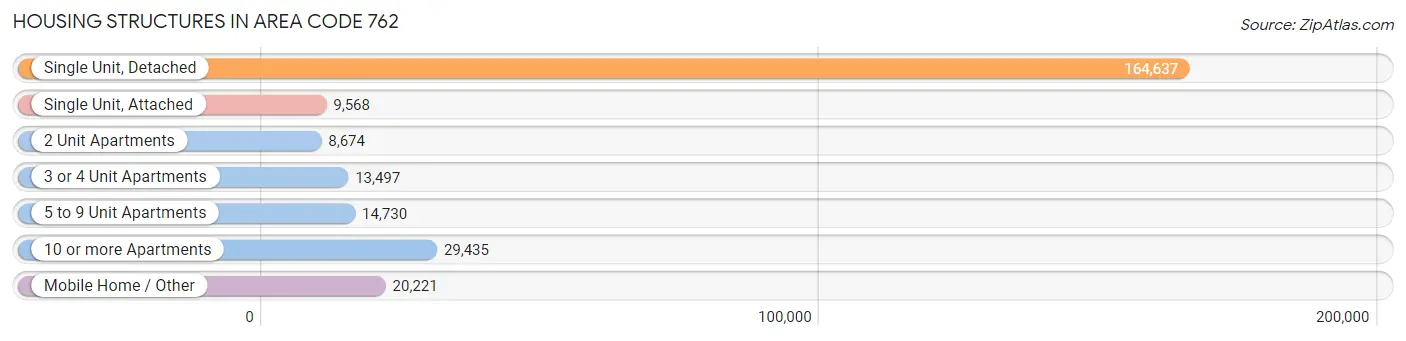
| Structure Type | # Housing Units | % Housing Units |
| Single Unit, Detached | 164,637 | 63.1% |
| Single Unit, Attached | 9,568 | 3.7% |
| 2 Unit Apartments | 8,674 | 3.3% |
| 3 or 4 Unit Apartments | 13,497 | 5.2% |
| 5 to 9 Unit Apartments | 14,730 | 5.7% |
| 10 or more Apartments | 29,435 | 11.3% |
| Mobile Home / Other | 20,221 | 7.7% |
| Total | 260,762 | 100.0% |
Housing Structures by Occupancy in Area Code 762
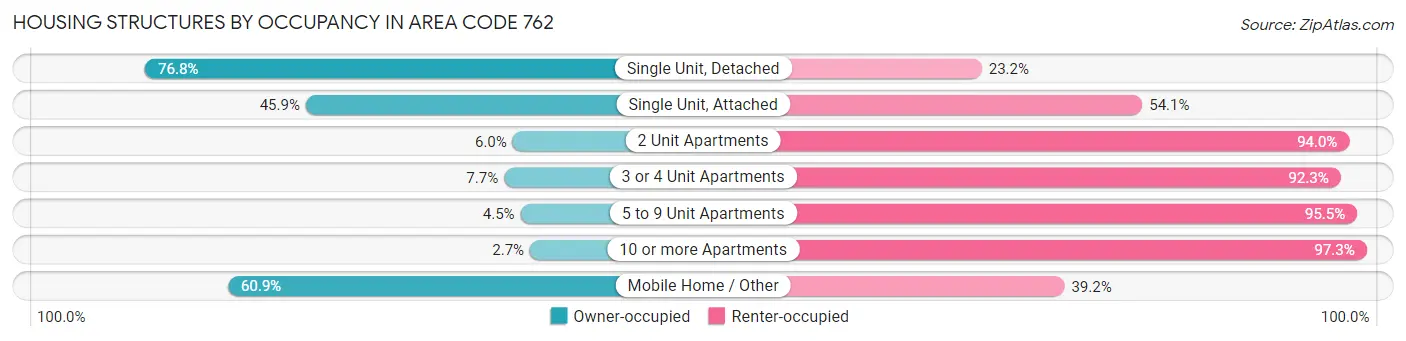
| Structure Type | Owner-occupied | Renter-occupied |
| Single Unit, Detached | 126,406 (76.8%) | 38,231 (23.2%) |
| Single Unit, Attached | 4,389 (45.9%) | 5,179 (54.1%) |
| 2 Unit Apartments | 524 (6.0%) | 8,150 (94.0%) |
| 3 or 4 Unit Apartments | 1,039 (7.7%) | 12,458 (92.3%) |
| 5 to 9 Unit Apartments | 668 (4.5%) | 14,062 (95.5%) |
| 10 or more Apartments | 798 (2.7%) | 28,637 (97.3%) |
| Mobile Home / Other | 12,305 (60.9%) | 7,916 (39.2%) |
| Total | 146,129 (56.0%) | 114,633 (44.0%) |
Housing Structures by Number of Rooms in Area Code 762
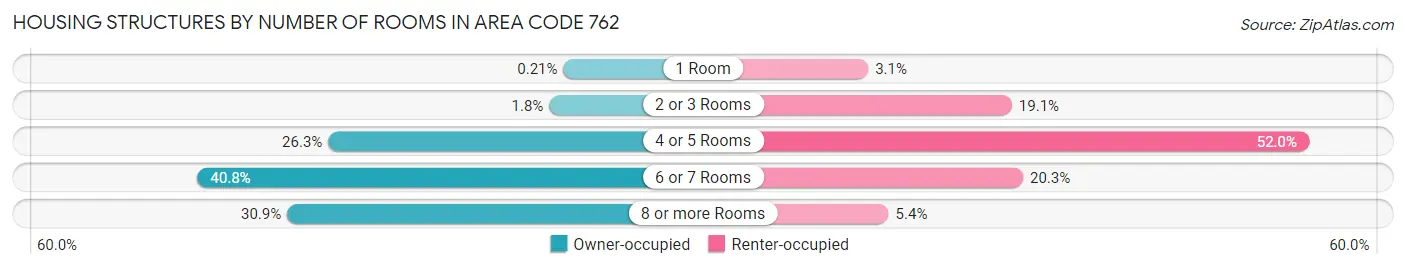
| Number of Rooms | Owner-occupied | Renter-occupied |
| 1 Room | 310 (0.2%) | 3,603 (3.1%) |
| 2 or 3 Rooms | 2,605 (1.8%) | 21,888 (19.1%) |
| 4 or 5 Rooms | 38,445 (26.3%) | 59,646 (52.0%) |
| 6 or 7 Rooms | 59,655 (40.8%) | 23,293 (20.3%) |
| 8 or more Rooms | 45,114 (30.9%) | 6,203 (5.4%) |
| Total | 146,129 (100.0%) | 114,633 (100.0%) |
Housing Structure by Heating Type in Area Code 762
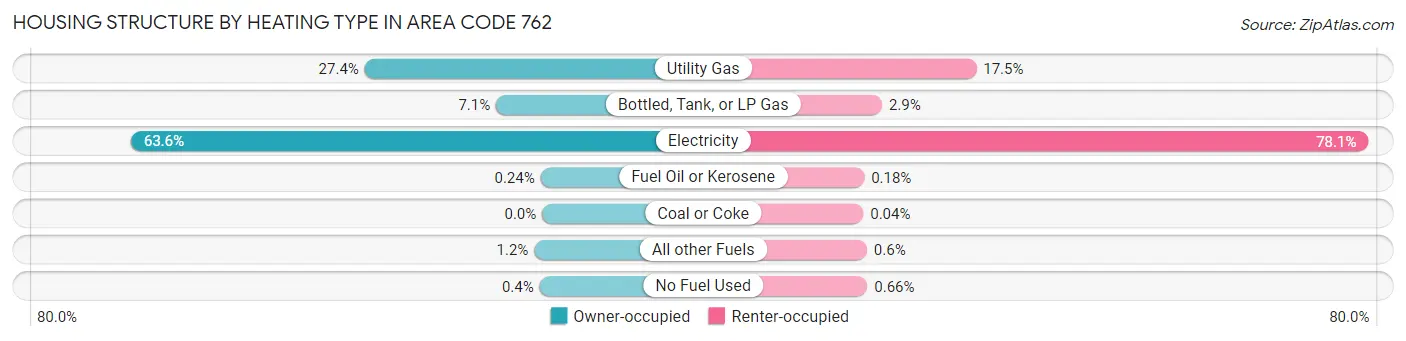
| Heating Type | Owner-occupied | Renter-occupied |
| Utility Gas | 40,078 (27.4%) | 20,071 (17.5%) |
| Bottled, Tank, or LP Gas | 10,411 (7.1%) | 3,352 (2.9%) |
| Electricity | 92,916 (63.6%) | 89,512 (78.1%) |
| Fuel Oil or Kerosene | 350 (0.2%) | 204 (0.2%) |
| Coal or Coke | 7 (0.0%) | 48 (0.0%) |
| All other Fuels | 1,785 (1.2%) | 690 (0.6%) |
| No Fuel Used | 582 (0.4%) | 756 (0.7%) |
| Total | 146,129 (100.0%) | 114,633 (100.0%) |
Household Vehicle Usage in Area Code 762
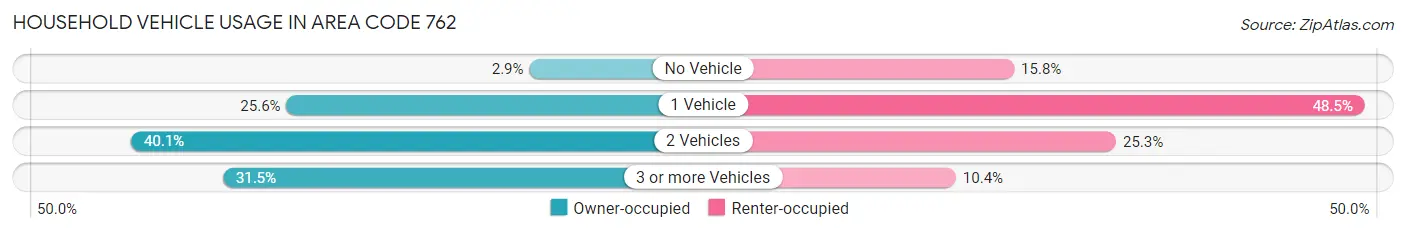
| Vehicles per Household | Owner-occupied | Renter-occupied |
| No Vehicle | 4,213 (2.9%) | 18,117 (15.8%) |
| 1 Vehicle | 37,351 (25.6%) | 55,620 (48.5%) |
| 2 Vehicles | 58,552 (40.1%) | 29,019 (25.3%) |
| 3 or more Vehicles | 46,013 (31.5%) | 11,877 (10.4%) |
| Total | 146,129 (100.0%) | 114,633 (100.0%) |
Real Estate & Mortgages in Area Code 762
Real Estate and Mortgage Overview in Area Code 762
| Characteristic | Without Mortgage | With Mortgage |
| Housing Units | 64,550 | 81,579 |
| Median Property Value | $6,513,800 | $7,696,600 |
| Median Household Income | $1,836,657 | $18,005 |
| Monthly Housing Costs | $17,449 | $5,600 |
| Real Estate Taxes | $46,611 | $2,359 |
Property Value by Mortgage Status in Area Code 762
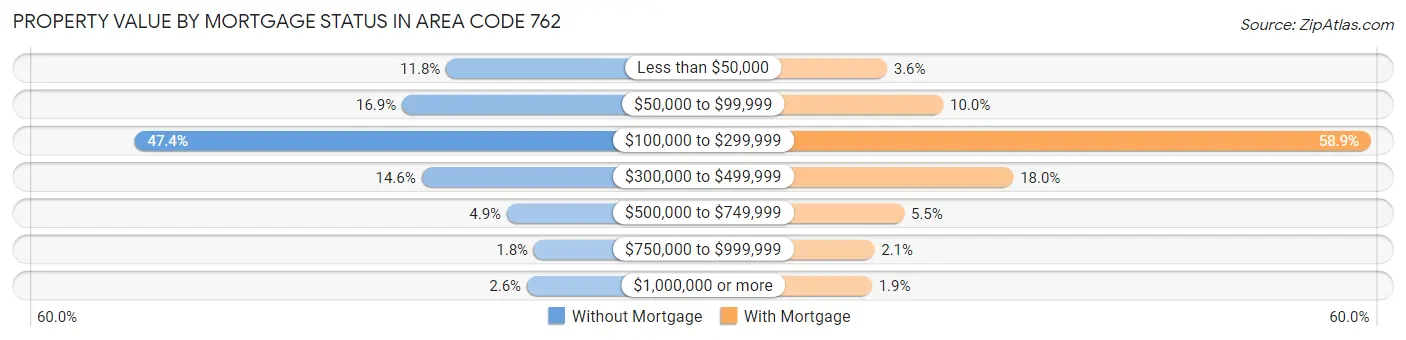
| Property Value | Without Mortgage | With Mortgage |
| Less than $50,000 | 7,630 (11.8%) | 2,914 (3.6%) |
| $50,000 to $99,999 | 10,880 (16.9%) | 8,155 (10.0%) |
| $100,000 to $299,999 | 30,616 (47.4%) | 48,049 (58.9%) |
| $300,000 to $499,999 | 9,444 (14.6%) | 14,699 (18.0%) |
| $500,000 to $749,999 | 3,152 (4.9%) | 4,519 (5.5%) |
| $750,000 to $999,999 | 1,153 (1.8%) | 1,734 (2.1%) |
| $1,000,000 or more | 1,675 (2.6%) | 1,509 (1.8%) |
| Total | 64,550 (100.0%) | 81,579 (100.0%) |
Household Income by Mortgage Status in Area Code 762
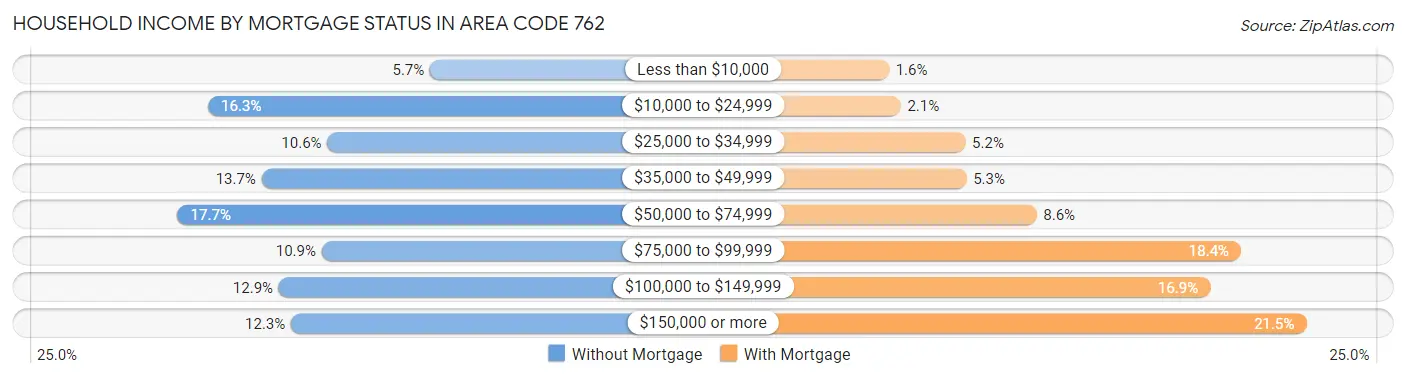
| Household Income | Without Mortgage | With Mortgage |
| Less than $10,000 | 3,674 (5.7%) | 1,286 (1.6%) |
| $10,000 to $24,999 | 10,496 (16.3%) | 1,748 (2.1%) |
| $25,000 to $34,999 | 6,832 (10.6%) | 4,255 (5.2%) |
| $35,000 to $49,999 | 8,848 (13.7%) | 4,303 (5.3%) |
| $50,000 to $74,999 | 11,429 (17.7%) | 7,020 (8.6%) |
| $75,000 to $99,999 | 7,004 (10.8%) | 14,966 (18.3%) |
| $100,000 to $149,999 | 8,321 (12.9%) | 13,774 (16.9%) |
| $150,000 or more | 7,946 (12.3%) | 17,508 (21.5%) |
| Total | 64,550 (100.0%) | 81,579 (100.0%) |
Property Value to Household Income Ratio in Area Code 762
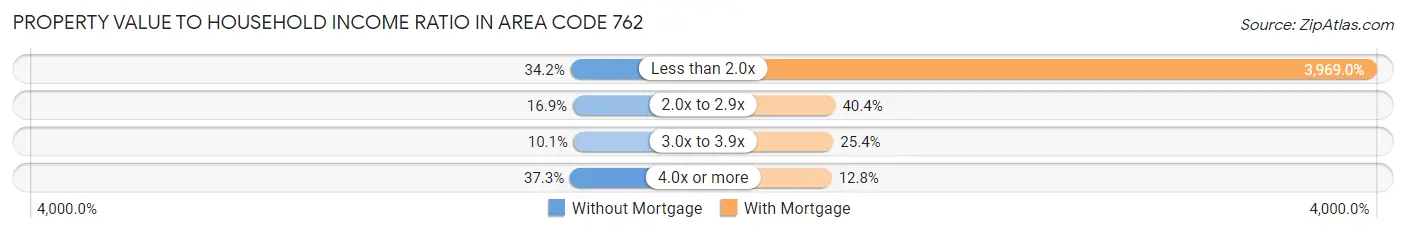
| Value-to-Income Ratio | Without Mortgage | With Mortgage |
| Less than 2.0x | 22,052 (34.2%) | 3,237,903 (3,969.0%) |
| 2.0x to 2.9x | 10,876 (16.9%) | 32,958 (40.4%) |
| 3.0x to 3.9x | 6,543 (10.1%) | 20,701 (25.4%) |
| 4.0x or more | 24,102 (37.3%) | 10,441 (12.8%) |
| Total | 64,550 (100.0%) | 81,579 (100.0%) |
Real Estate Taxes by Mortgage Status in Area Code 762
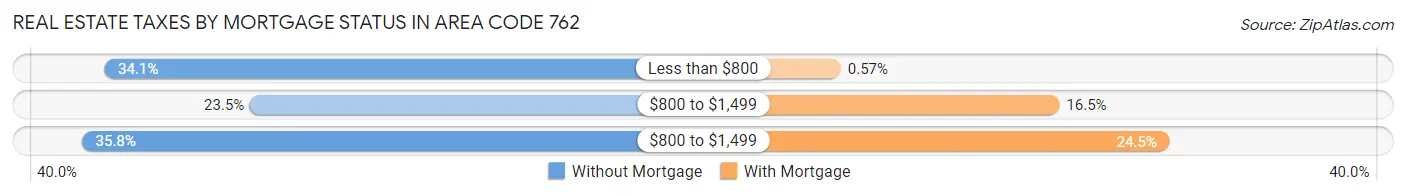
| Property Taxes | Without Mortgage | With Mortgage |
| Less than $800 | 22,023 (34.1%) | 468 (0.6%) |
| $800 to $1,499 | 15,183 (23.5%) | 13,492 (16.5%) |
| $800 to $1,499 | 23,083 (35.8%) | 20,012 (24.5%) |
| Total | 64,550 (100.0%) | 81,579 (100.0%) |
Health & Disability in Area Code 762
Health Insurance Coverage by Age in Area Code 762
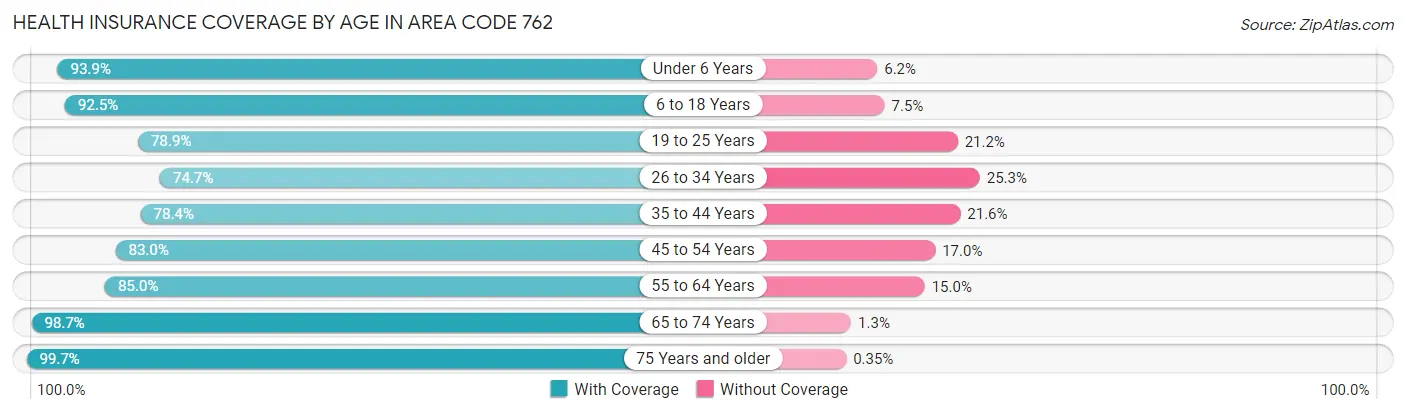
| Age Bracket | With Coverage | Without Coverage |
| Under 6 Years | 44,487 (93.9%) | 2,914 (6.1%) |
| 6 to 18 Years | 101,958 (92.5%) | 8,287 (7.5%) |
| 19 to 25 Years | 64,316 (78.8%) | 17,247 (21.1%) |
| 26 to 34 Years | 58,357 (74.7%) | 19,733 (25.3%) |
| 35 to 44 Years | 62,293 (78.4%) | 17,198 (21.6%) |
| 45 to 54 Years | 65,445 (83.0%) | 13,370 (17.0%) |
| 55 to 64 Years | 68,450 (85.0%) | 12,084 (15.0%) |
| 65 to 74 Years | 61,477 (98.7%) | 797 (1.3%) |
| 75 Years and older | 42,114 (99.7%) | 147 (0.4%) |
| Total | 568,897 (86.1%) | 91,777 (13.9%) |
Health Insurance Coverage by Citizenship Status in Area Code 762
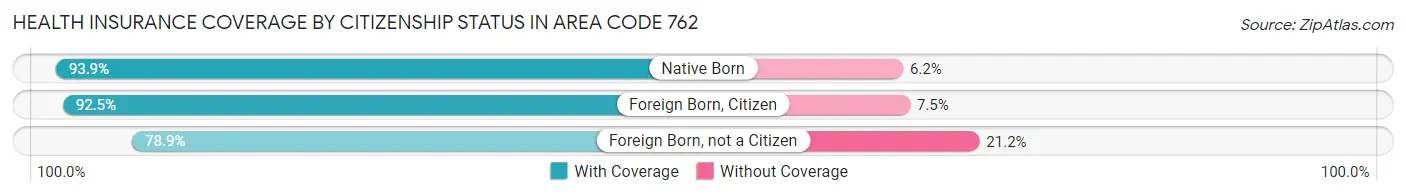
| Citizenship Status | With Coverage | Without Coverage |
| Native Born | 44,487 (93.9%) | 2,914 (6.1%) |
| Foreign Born, Citizen | 101,958 (92.5%) | 8,287 (7.5%) |
| Foreign Born, not a Citizen | 64,316 (78.8%) | 17,247 (21.1%) |
Health Insurance Coverage by Household Income in Area Code 762
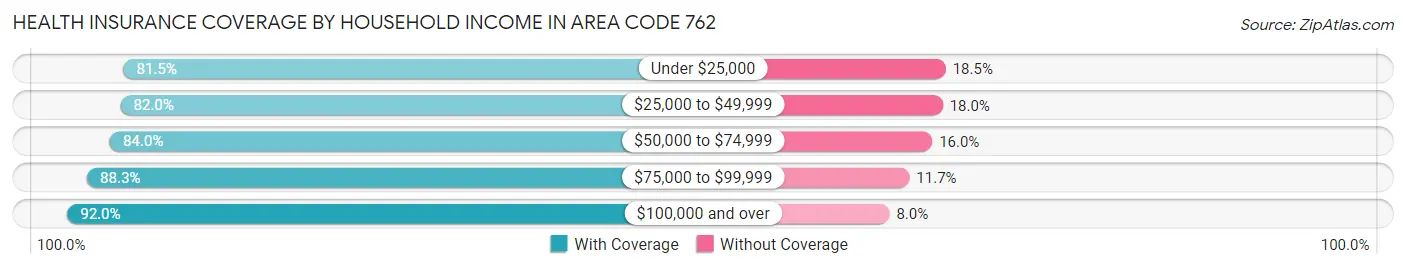
| Household Income | With Coverage | Without Coverage |
| Under $25,000 | 93,727 (81.5%) | 21,329 (18.5%) |
| $25,000 to $49,999 | 113,046 (82.0%) | 24,762 (18.0%) |
| $50,000 to $74,999 | 94,493 (84.0%) | 17,993 (16.0%) |
| $75,000 to $99,999 | 79,005 (88.3%) | 10,497 (11.7%) |
| $100,000 and over | 179,590 (92.0%) | 15,621 (8.0%) |
Public vs Private Health Insurance Coverage by Age in Area Code 762
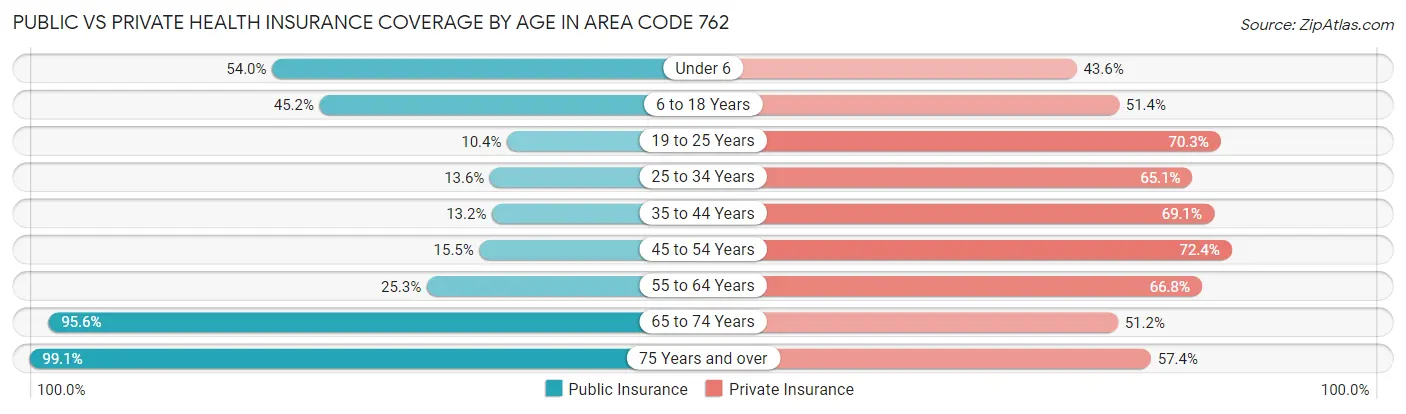
| Age Bracket | Public Insurance | Private Insurance |
| Under 6 | 25,603 (54.0%) | 20,650 (43.6%) |
| 6 to 18 Years | 49,843 (45.2%) | 56,680 (51.4%) |
| 19 to 25 Years | 8,481 (10.4%) | 57,341 (70.3%) |
| 25 to 34 Years | 10,607 (13.6%) | 50,822 (65.1%) |
| 35 to 44 Years | 10,495 (13.2%) | 54,892 (69.1%) |
| 45 to 54 Years | 12,251 (15.5%) | 57,027 (72.4%) |
| 55 to 64 Years | 20,376 (25.3%) | 53,814 (66.8%) |
| 65 to 74 Years | 59,541 (95.6%) | 31,895 (51.2%) |
| 75 Years and over | 41,887 (99.1%) | 24,242 (57.4%) |
| Total | 239,084 (36.2%) | 407,363 (61.7%) |
Disability Status by Sex by Age in Area Code 762
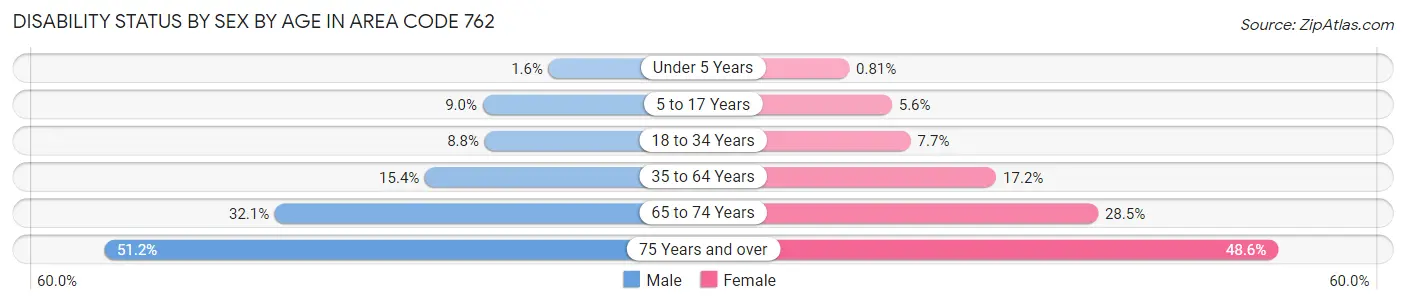
| Age Bracket | Male | Female |
| Under 5 Years | 343 (1.6%) | 148 (0.8%) |
| 5 to 17 Years | 4,970 (9.0%) | 2,902 (5.6%) |
| 18 to 34 Years | 7,258 (8.7%) | 6,711 (7.7%) |
| 35 to 64 Years | 17,636 (15.4%) | 21,358 (17.2%) |
| 65 to 74 Years | 9,133 (32.1%) | 9,652 (28.5%) |
| 75 Years and over | 8,750 (51.2%) | 12,224 (48.6%) |
Disability Class by Sex by Age in Area Code 762
Disability Class: Hearing Difficulty
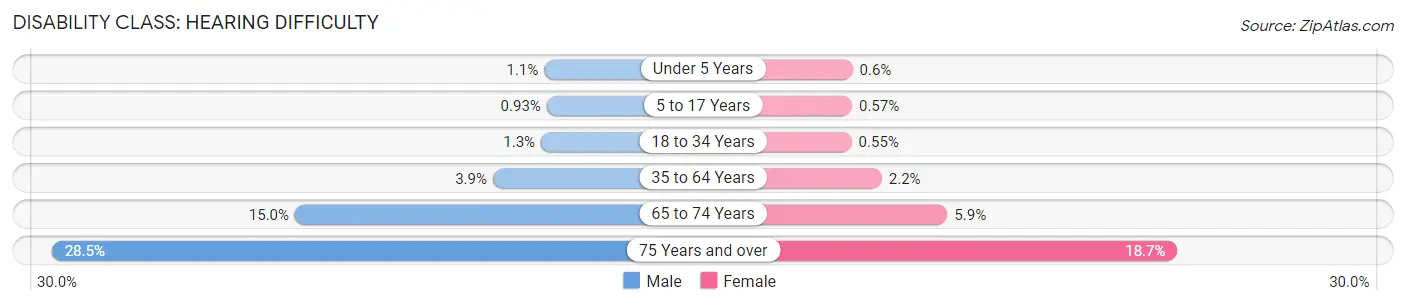
| Age Bracket | Male | Female |
| Under 5 Years | 226 (1.1%) | 109 (0.6%) |
| 5 to 17 Years | 516 (0.9%) | 298 (0.6%) |
| 18 to 34 Years | 1,036 (1.3%) | 485 (0.5%) |
| 35 to 64 Years | 4,509 (3.9%) | 2,772 (2.2%) |
| 65 to 74 Years | 4,251 (14.9%) | 1,989 (5.9%) |
| 75 Years and over | 4,873 (28.5%) | 4,700 (18.7%) |
Disability Class: Vision Difficulty
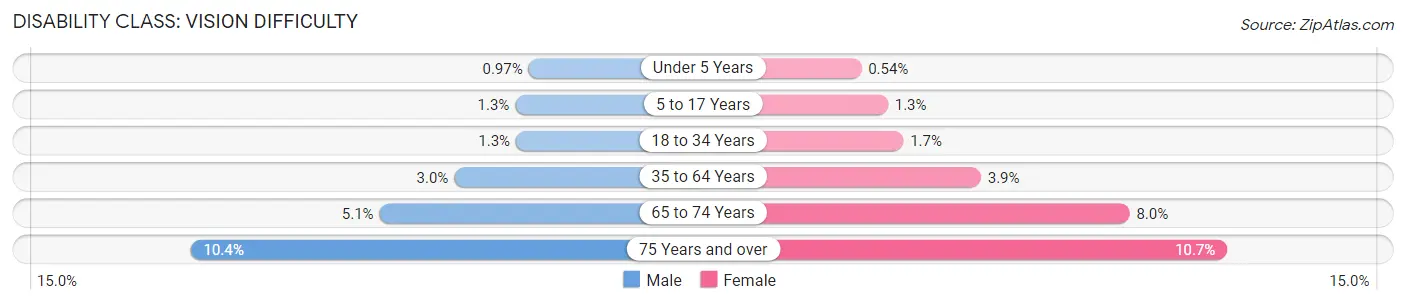
| Age Bracket | Male | Female |
| Under 5 Years | 205 (1.0%) | 99 (0.5%) |
| 5 to 17 Years | 745 (1.3%) | 668 (1.3%) |
| 18 to 34 Years | 1,097 (1.3%) | 1,498 (1.7%) |
| 35 to 64 Years | 3,485 (3.0%) | 4,810 (3.9%) |
| 65 to 74 Years | 1,456 (5.1%) | 2,709 (8.0%) |
| 75 Years and over | 1,775 (10.4%) | 2,700 (10.7%) |
Disability Class: Cognitive Difficulty
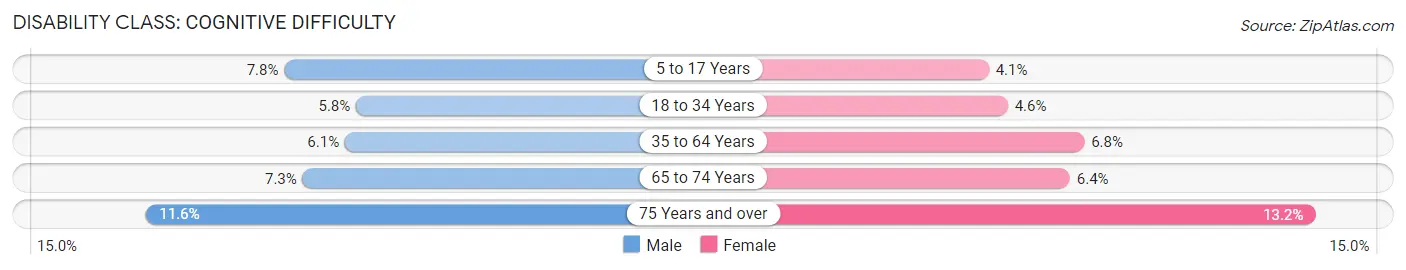
| Age Bracket | Male | Female |
| 5 to 17 Years | 4,302 (7.8%) | 2,131 (4.1%) |
| 18 to 34 Years | 4,784 (5.8%) | 4,039 (4.6%) |
| 35 to 64 Years | 6,967 (6.1%) | 8,390 (6.8%) |
| 65 to 74 Years | 2,064 (7.3%) | 2,147 (6.4%) |
| 75 Years and over | 1,986 (11.6%) | 3,315 (13.2%) |
Disability Class: Ambulatory Difficulty
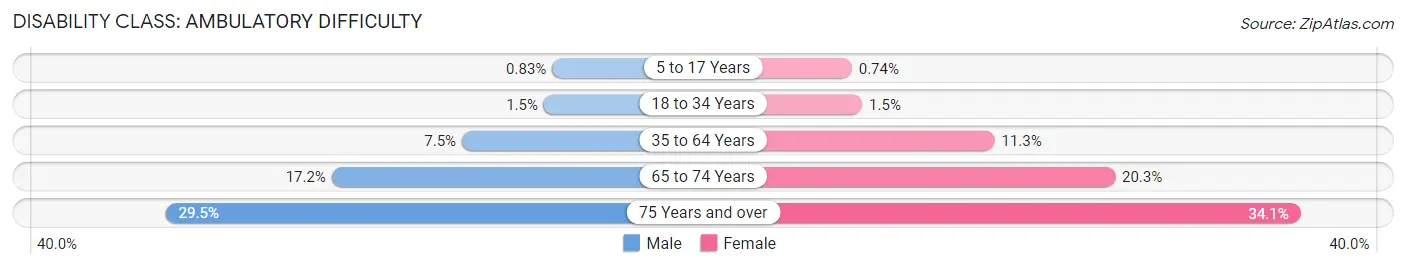
| Age Bracket | Male | Female |
| 5 to 17 Years | 460 (0.8%) | 387 (0.7%) |
| 18 to 34 Years | 1,205 (1.5%) | 1,318 (1.5%) |
| 35 to 64 Years | 8,634 (7.5%) | 14,083 (11.3%) |
| 65 to 74 Years | 4,892 (17.2%) | 6,864 (20.3%) |
| 75 Years and over | 5,050 (29.5%) | 8,568 (34.1%) |
Disability Class: Self-Care Difficulty
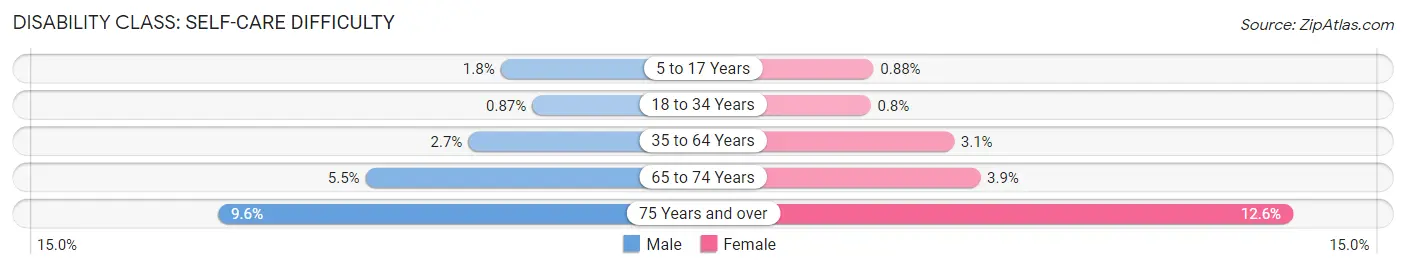
| Age Bracket | Male | Female |
| 5 to 17 Years | 971 (1.8%) | 461 (0.9%) |
| 18 to 34 Years | 719 (0.9%) | 703 (0.8%) |
| 35 to 64 Years | 3,036 (2.6%) | 3,875 (3.1%) |
| 65 to 74 Years | 1,566 (5.5%) | 1,301 (3.8%) |
| 75 Years and over | 1,643 (9.6%) | 3,160 (12.6%) |
Technology Access in Area Code 762
Computing Device Access in Area Code 762
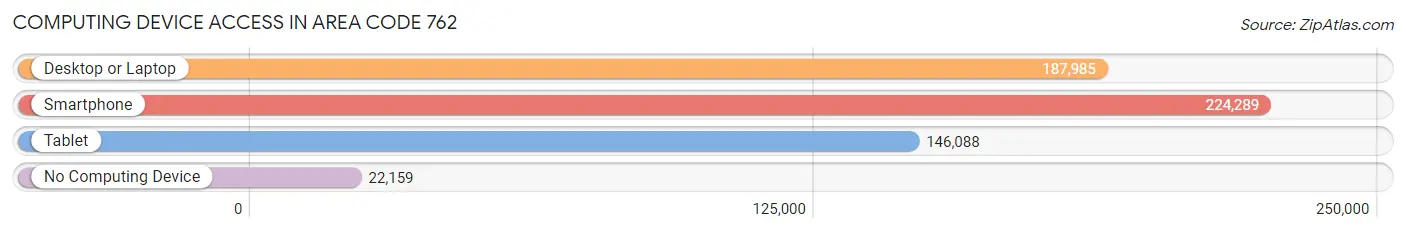
| Device Type | # Households | % Households |
| Desktop or Laptop | 187,985 | 72.1% |
| Smartphone | 224,289 | 86.0% |
| Tablet | 146,088 | 56.0% |
| No Computing Device | 22,159 | 8.5% |
| Total | 260,762 | 100.0% |
Internet Access in Area Code 762
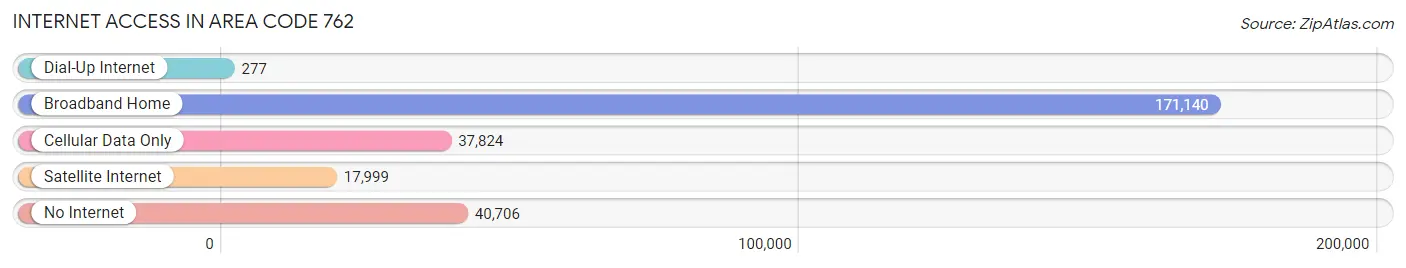
| Internet Type | # Households | % Households |
| Dial-Up Internet | 277 | 0.1% |
| Broadband Home | 171,140 | 65.6% |
| Cellular Data Only | 37,824 | 14.5% |
| Satellite Internet | 17,999 | 6.9% |
| No Internet | 40,706 | 15.6% |
| Total | 260,762 | 100.0% |
Area Code 762 Summary
Geography
Area code 762 is located in the state of Georgia. It covers the northwestern part of the state, including the cities of Rome, Dalton, and Gainesville. It also covers parts of the Appalachian Mountains, including the Chattahoochee National Forest.
Social
Area code 762 is home to a diverse population of people from all walks of life. The area is known for its strong sense of community and its friendly atmosphere. Residents enjoy a variety of outdoor activities, including hiking, camping, and fishing.
Economics
Area code 762 is home to a variety of businesses, including manufacturing, retail, and healthcare. The area is also home to several universities and colleges, including the University of North Georgia and Dalton State College.
Demographics
Area code 762 is home to a population of over 500,000 people. The population is largely white, with a small percentage of African Americans and Hispanics. The median household income is around $45,000, and the median age is around 35 years old.
Common Questions
What is Per Capita Income in Area Code 762?
Per Capita income in Area Code 762 is $32,287.
What is the Median Family Income in Area Code 762?
Median Family Income in Area Code 762 is $70,463.
What is the Median Household income in Area Code 762?
Median Household Income in Area Code 762 is $57,397.
What is Income or Wage Gap in Area Code 762?
Income or Wage Gap in Area Code 762 is 30.2%.
Women in Area Code 762 earn 69.8 cents for every dollar earned by a man.
What is Family Income Deficit in Area Code 762?
Family Income Deficit in Area Code 762 is $10,514.
Families that are below poverty line in Area Code 762 earn $10,514 less on average than the poverty threshold level.
What is Inequality or Gini Index in Area Code 762?
Inequality or Gini Index in Area Code 762 is 17.70.
What is the Total Population of Area Code 762?
Total Population of Area Code 762 is 670,727.
What is the Total Male Population of Area Code 762?
Total Male Population of Area Code 762 is 326,489.
What is the Total Female Population of Area Code 762?
Total Female Population of Area Code 762 is 344,238.
What is the Ratio of Males per 100 Females in Area Code 762?
There are 94.84 Males per 100 Females in Area Code 762.
What is the Ratio of Females per 100 Males in Area Code 762?
There are 105.44 Females per 100 Males in Area Code 762.
What is the Median Population Age in Area Code 762?
Median Population Age in Area Code 762 is 40.3 Years.
What is the Average Family Size in Area Code 762
Average Family Size in Area Code 762 is 3.1 People.
What is the Average Household Size in Area Code 762
Average Household Size in Area Code 762 is 2.5 People.
How Large is the Labor Force in Area Code 762?
There are 305,496 People in the Labor Forcein in Area Code 762.
What is the Percentage of People in the Labor Force in Area Code 762?
56.7% of People are in the Labor Force in Area Code 762.
What is the Unemployment Rate in Area Code 762?
Unemployment Rate in Area Code 762 is 5.9%.