Webster County, GA Map & Demographics
Webster County Map
Webster County Overview
$22,246
PER CAPITA INCOME
$54,420
AVG FAMILY INCOME
$35,000
AVG HOUSEHOLD INCOME
24.3%
WAGE / INCOME GAP [ % ]
75.7¢/ $1
WAGE / INCOME GAP [ $ ]
0.47
INEQUALITY / GINI INDEX
2,354
TOTAL POPULATION
1,208
MALE POPULATION
1,146
FEMALE POPULATION
105.41
MALES / 100 FEMALES
94.87
FEMALES / 100 MALES
42.6
MEDIAN AGE
3.6
AVG FAMILY SIZE
2.7
AVG HOUSEHOLD SIZE
1,091
LABOR FORCE [ PEOPLE ]
55.5%
PERCENT IN LABOR FORCE
8.9%
UNEMPLOYMENT RATE
Webster County Area Codes
Income in Webster County
Income Overview in Webster County
Per Capita Income in Webster County is $22,246, while median incomes of families and households are $54,420 and $35,000 respectively.
| Characteristic | Number | Measure |
| Per Capita Income | 2,354 | $22,246 |
| Median Family Income | 535 | $54,420 |
| Mean Family Income | 535 | $68,149 |
| Median Household Income | 876 | $35,000 |
| Mean Household Income | 876 | $51,092 |
| Income Deficit | 535 | $0 |
| Wage / Income Gap (%) | 2,354 | 24.34% |
| Wage / Income Gap ($) | 2,354 | 75.66¢ per $1 |
| Gini / Inequality Index | 2,354 | 0.47 |
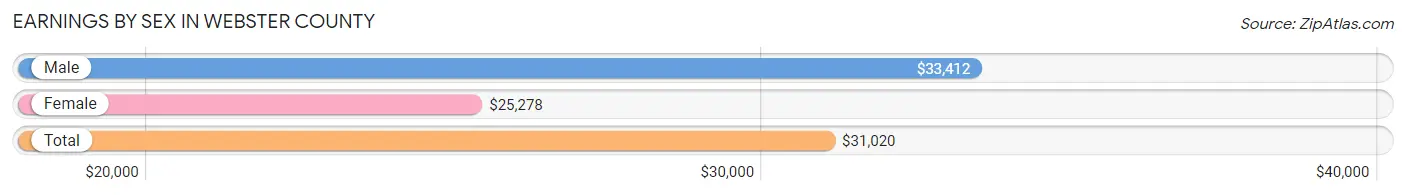
Earnings by Sex in Webster County
Average Earnings in Webster County are $31,020, $33,412 for men and $25,278 for women, a difference of 24.3%.
| Sex | Number | Average Earnings |
| Male | 721 (65.4%) | $33,412 |
| Female | 382 (34.6%) | $25,278 |
| Total | 1,103 (100.0%) | $31,020 |
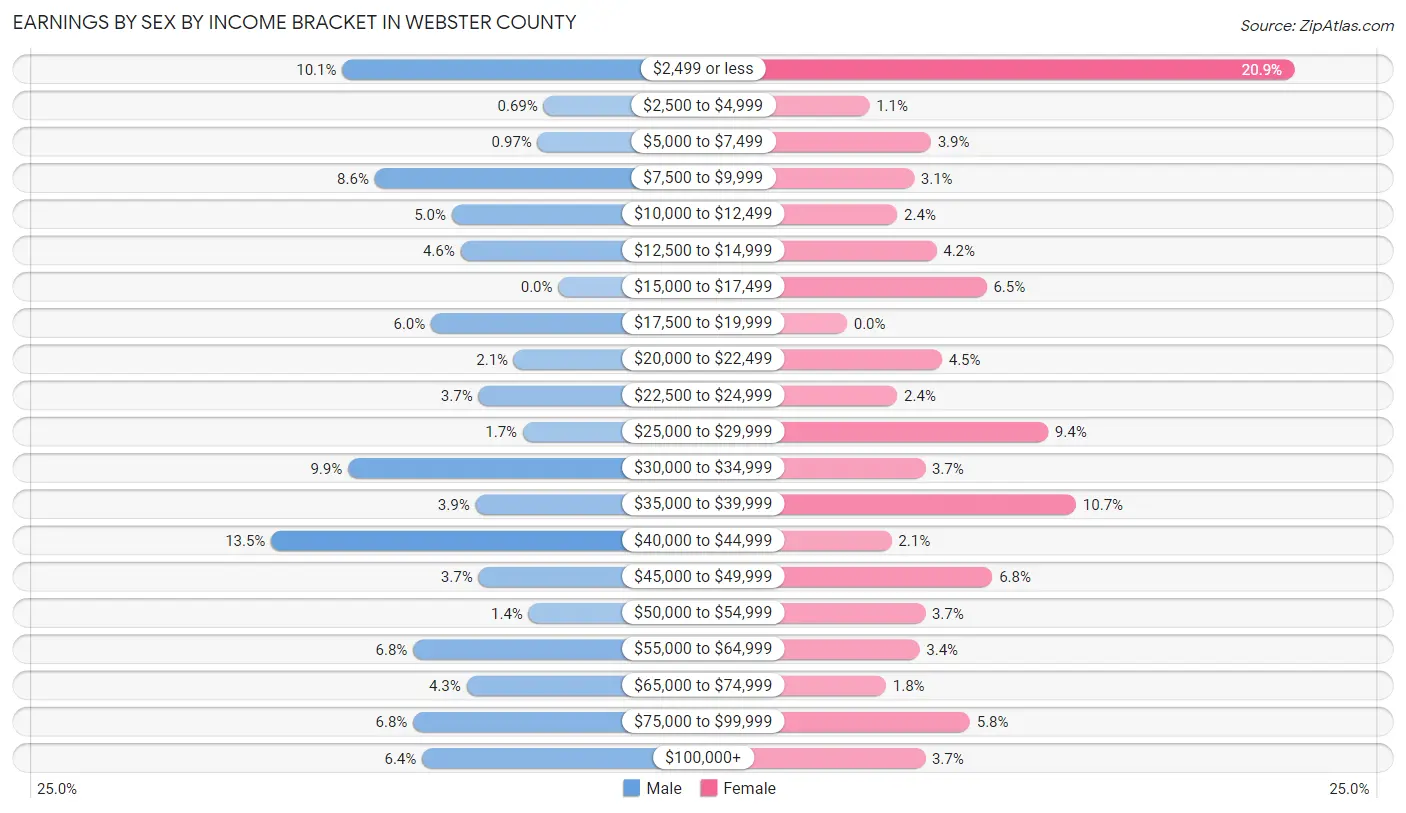
Earnings by Sex by Income Bracket in Webster County
The most common earnings brackets in Webster County are $40,000 to $44,999 for men (97 | 13.5%) and $2,499 or less for women (80 | 20.9%).
| Income | Male | Female |
| $2,499 or less | 73 (10.1%) | 80 (20.9%) |
| $2,500 to $4,999 | 5 (0.7%) | 4 (1.1%) |
| $5,000 to $7,499 | 7 (1.0%) | 15 (3.9%) |
| $7,500 to $9,999 | 62 (8.6%) | 12 (3.1%) |
| $10,000 to $12,499 | 36 (5.0%) | 9 (2.4%) |
| $12,500 to $14,999 | 33 (4.6%) | 16 (4.2%) |
| $15,000 to $17,499 | 0 (0.0%) | 25 (6.5%) |
| $17,500 to $19,999 | 43 (6.0%) | 0 (0.0%) |
| $20,000 to $22,499 | 15 (2.1%) | 17 (4.4%) |
| $22,500 to $24,999 | 27 (3.7%) | 9 (2.4%) |
| $25,000 to $29,999 | 12 (1.7%) | 36 (9.4%) |
| $30,000 to $34,999 | 71 (9.9%) | 14 (3.7%) |
| $35,000 to $39,999 | 28 (3.9%) | 41 (10.7%) |
| $40,000 to $44,999 | 97 (13.5%) | 8 (2.1%) |
| $45,000 to $49,999 | 27 (3.7%) | 26 (6.8%) |
| $50,000 to $54,999 | 10 (1.4%) | 14 (3.7%) |
| $55,000 to $64,999 | 49 (6.8%) | 13 (3.4%) |
| $65,000 to $74,999 | 31 (4.3%) | 7 (1.8%) |
| $75,000 to $99,999 | 49 (6.8%) | 22 (5.8%) |
| $100,000+ | 46 (6.4%) | 14 (3.7%) |
| Total | 721 (100.0%) | 382 (100.0%) |
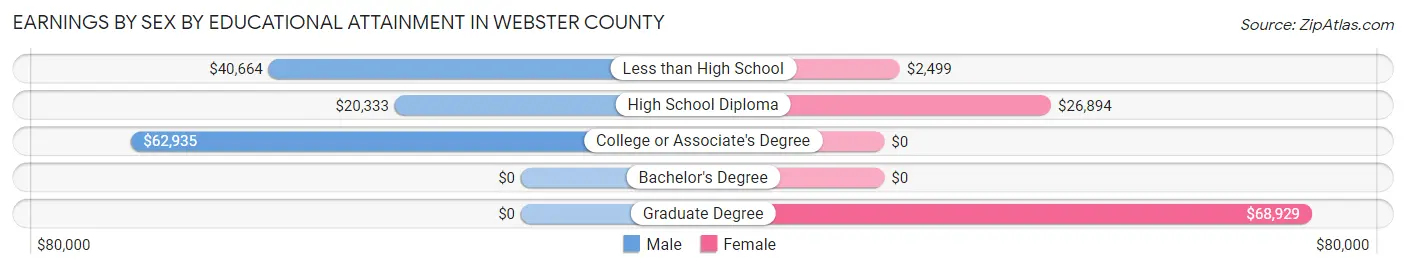
Earnings by Sex by Educational Attainment in Webster County
Average earnings in Webster County are $38,884 for men and $26,424 for women, a difference of 32.0%. Men with an educational attainment of college or associate's degree enjoy the highest average annual earnings of $62,935, while those with high school diploma education earn the least with $20,333. Women with an educational attainment of graduate degree earn the most with the average annual earnings of $68,929, while those with less than high school education have the smallest earnings of $2,499.
| Educational Attainment | Male Income | Female Income |
| Less than High School | $40,664 | $2,499 |
| High School Diploma | $20,333 | $26,894 |
| College or Associate's Degree | $62,935 | $0 |
| Bachelor's Degree | - | - |
| Graduate Degree | - | - |
| Total | $38,884 | $26,424 |
Family Income in Webster County
Family Income Brackets in Webster County
According to the Webster County family income data, there are 110 families falling into the $75,000 to $99,999 income range, which is the most common income bracket and makes up 20.6% of all families.
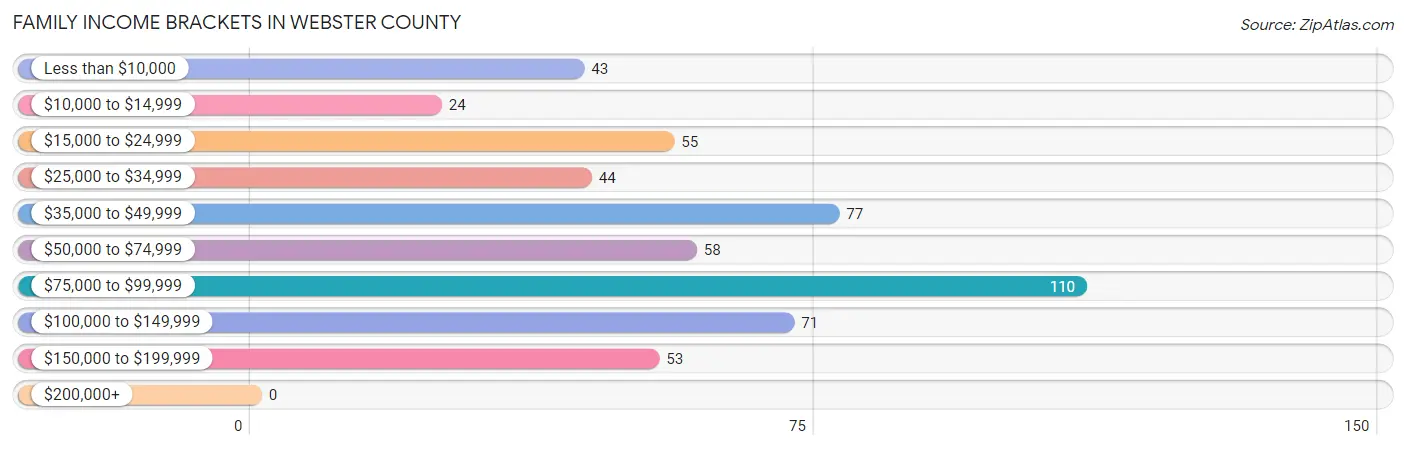
| Income Bracket | # Families | % Families |
| Less than $10,000 | 43 | 8.0% |
| $10,000 to $14,999 | 24 | 4.5% |
| $15,000 to $24,999 | 55 | 10.3% |
| $25,000 to $34,999 | 44 | 8.2% |
| $35,000 to $49,999 | 77 | 14.4% |
| $50,000 to $74,999 | 58 | 10.8% |
| $75,000 to $99,999 | 110 | 20.6% |
| $100,000 to $149,999 | 71 | 13.3% |
| $150,000 to $199,999 | 53 | 9.9% |
| $200,000+ | 0 | 0.0% |
Family Income by Famaliy Size in Webster County
3-person families (146 | 27.3%) account for the highest median family income in Webster County with $93,409 per family, while 3-person families (146 | 27.3%) have the highest median income of $31,136 per family member.
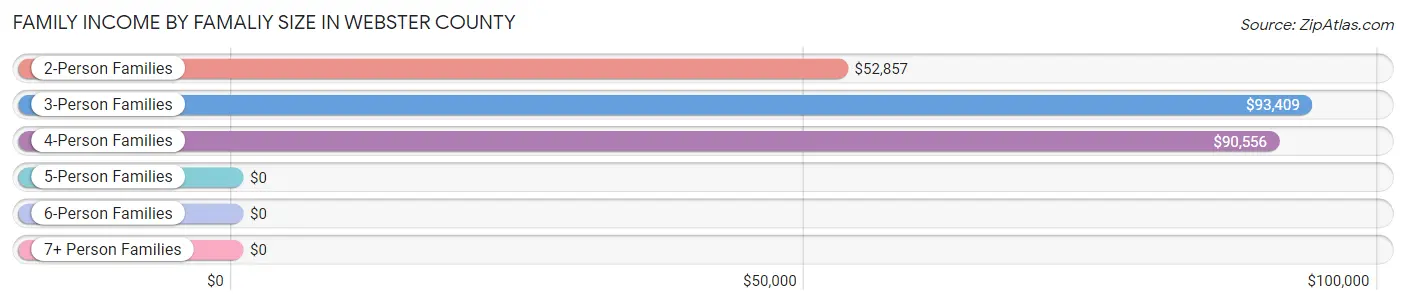
| Income Bracket | # Families | Median Income |
| 2-Person Families | 292 (54.6%) | $52,857 |
| 3-Person Families | 146 (27.3%) | $93,409 |
| 4-Person Families | 28 (5.2%) | $90,556 |
| 5-Person Families | 53 (9.9%) | $0 |
| 6-Person Families | 16 (3.0%) | $0 |
| 7+ Person Families | 0 (0.0%) | $0 |
| Total | 535 (100.0%) | $54,420 |
Family Income by Number of Earners in Webster County
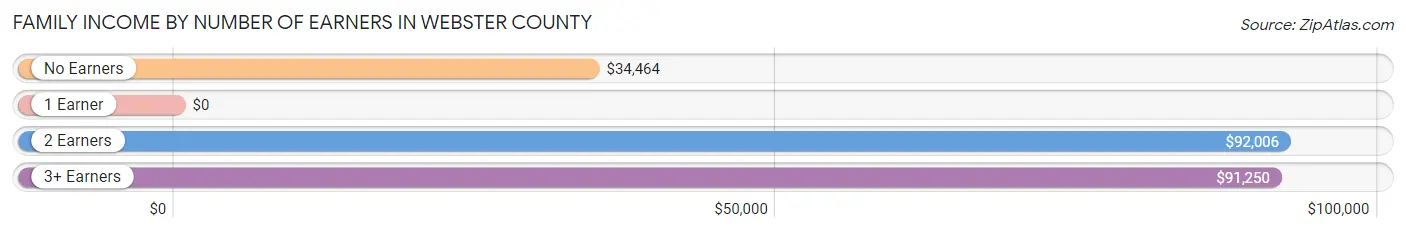
| Number of Earners | # Families | Median Income |
| No Earners | 111 (20.7%) | $34,464 |
| 1 Earner | 195 (36.4%) | $0 |
| 2 Earners | 185 (34.6%) | $92,006 |
| 3+ Earners | 44 (8.2%) | $91,250 |
| Total | 535 (100.0%) | $54,420 |
Household Income in Webster County
Household Income Brackets in Webster County
With 141 households falling in the category, the $15,000 to $24,999 income range is the most frequent in Webster County, accounting for 16.1% of all households.
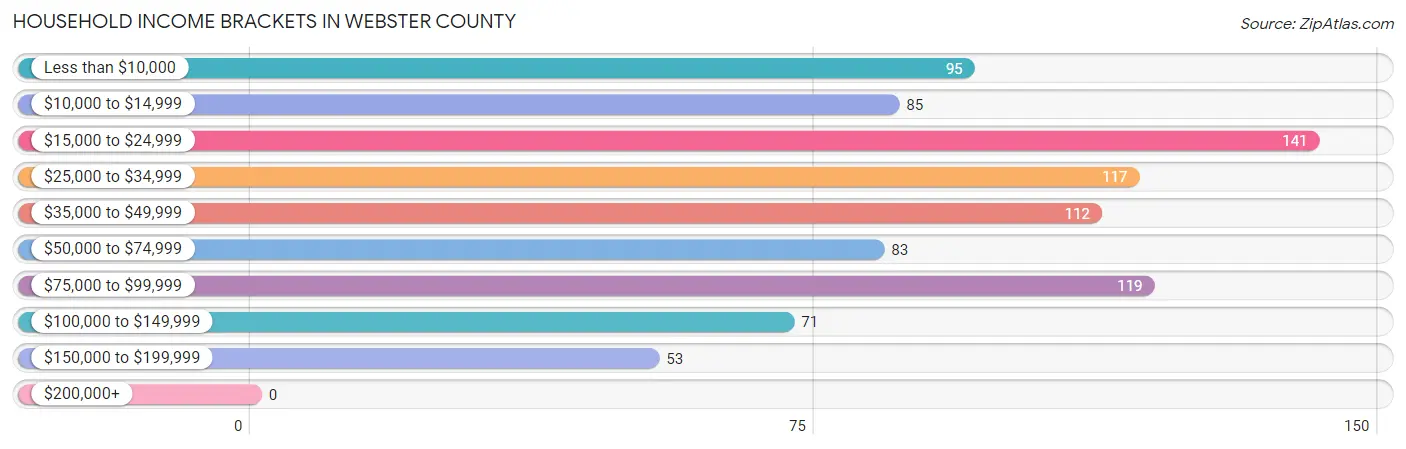
| Income Bracket | # Households | % Households |
| Less than $10,000 | 95 | 10.8% |
| $10,000 to $14,999 | 85 | 9.7% |
| $15,000 to $24,999 | 141 | 16.1% |
| $25,000 to $34,999 | 117 | 13.4% |
| $35,000 to $49,999 | 112 | 12.8% |
| $50,000 to $74,999 | 83 | 9.5% |
| $75,000 to $99,999 | 119 | 13.6% |
| $100,000 to $149,999 | 71 | 8.1% |
| $150,000 to $199,999 | 53 | 6.1% |
| $200,000+ | 0 | 0.0% |
Household Income by Householder Age in Webster County
The median household income in Webster County is $35,000, with the highest median household income of $50,000 found in the 45 to 64 years age bracket for the primary householder. A total of 280 households (32.0%) fall into this category. Meanwhile, the 15 to 24 years age bracket for the primary householder has the lowest median household income of $0, with 10 households (1.1%) in this group.
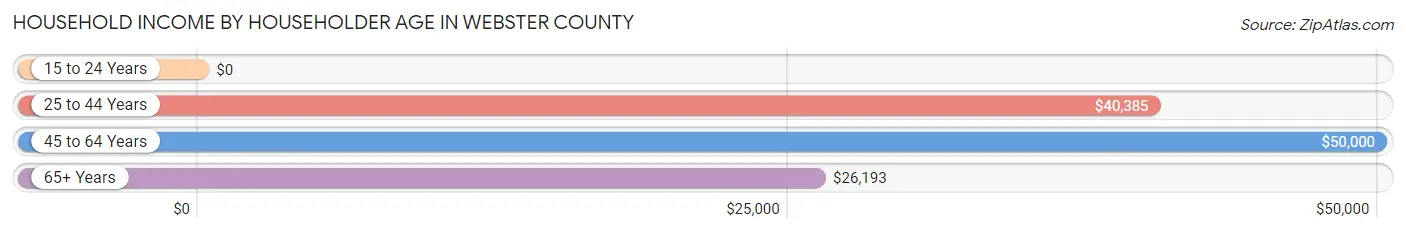
| Income Bracket | # Households | Median Income |
| 15 to 24 Years | 10 (1.1%) | $0 |
| 25 to 44 Years | 282 (32.2%) | $40,385 |
| 45 to 64 Years | 280 (32.0%) | $50,000 |
| 65+ Years | 304 (34.7%) | $26,193 |
| Total | 876 (100.0%) | $35,000 |
Poverty in Webster County
Income Below Poverty by Sex and Age in Webster County
With 30.9% poverty level for males and 24.7% for females among the residents of Webster County, 16 and 17 year old males and 12 to 14 year old females are the most vulnerable to poverty, with 30 males (100.0%) and 17 females (100.0%) in their respective age groups living below the poverty level.
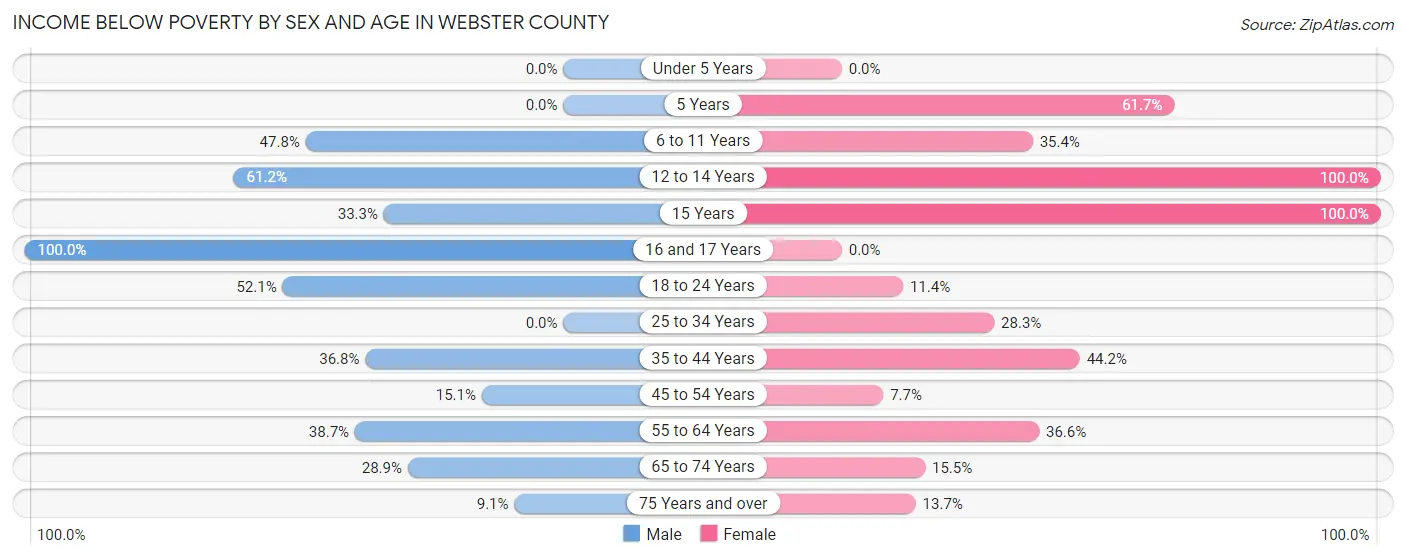
| Age Bracket | Male | Female |
| Under 5 Years | 0 (0.0%) | 0 (0.0%) |
| 5 Years | 0 (0.0%) | 29 (61.7%) |
| 6 to 11 Years | 11 (47.8%) | 45 (35.4%) |
| 12 to 14 Years | 41 (61.2%) | 17 (100.0%) |
| 15 Years | 15 (33.3%) | 6 (100.0%) |
| 16 and 17 Years | 30 (100.0%) | 0 (0.0%) |
| 18 to 24 Years | 49 (52.1%) | 15 (11.4%) |
| 25 to 34 Years | 0 (0.0%) | 28 (28.3%) |
| 35 to 44 Years | 100 (36.8%) | 53 (44.2%) |
| 45 to 54 Years | 28 (15.1%) | 15 (7.7%) |
| 55 to 64 Years | 53 (38.7%) | 41 (36.6%) |
| 65 to 74 Years | 41 (28.9%) | 17 (15.4%) |
| 75 Years and over | 4 (9.1%) | 17 (13.7%) |
| Total | 372 (30.9%) | 283 (24.7%) |
Income Above Poverty by Sex and Age in Webster County
According to the poverty statistics in Webster County, males aged 25 to 34 years and females aged under 5 years are the age groups that are most secure financially, with 100.0% of males and 100.0% of females in these age groups living above the poverty line.
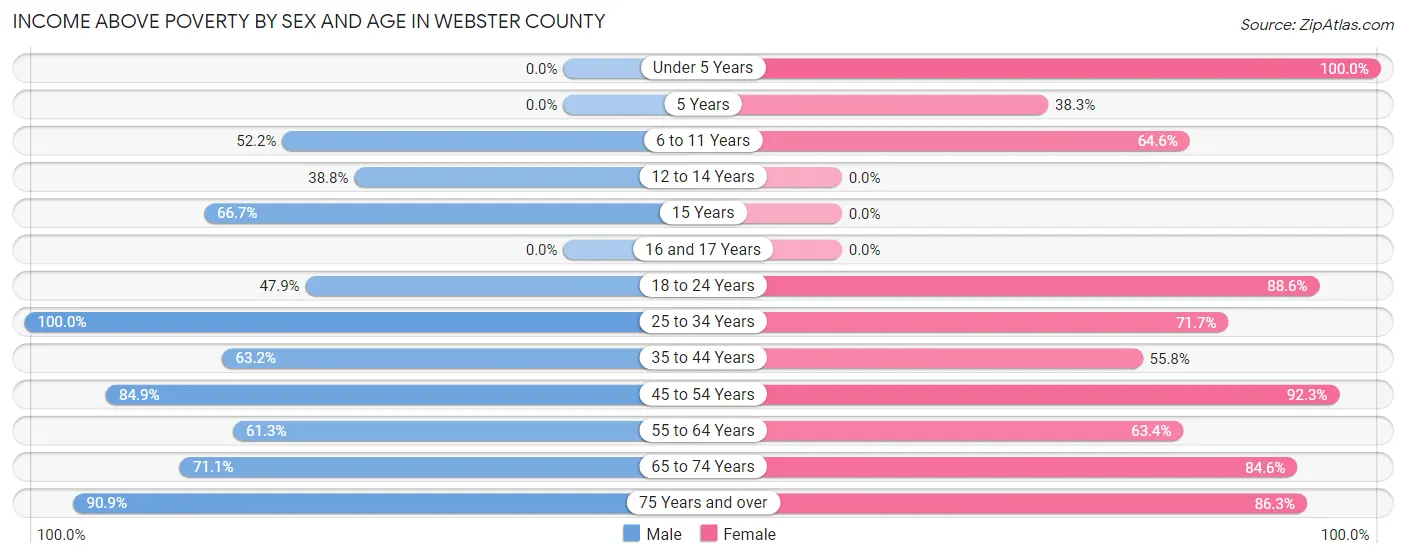
| Age Bracket | Male | Female |
| Under 5 Years | 0 (0.0%) | 57 (100.0%) |
| 5 Years | 0 (0.0%) | 18 (38.3%) |
| 6 to 11 Years | 12 (52.2%) | 82 (64.6%) |
| 12 to 14 Years | 26 (38.8%) | 0 (0.0%) |
| 15 Years | 30 (66.7%) | 0 (0.0%) |
| 16 and 17 Years | 0 (0.0%) | 0 (0.0%) |
| 18 to 24 Years | 45 (47.9%) | 117 (88.6%) |
| 25 to 34 Years | 165 (100.0%) | 71 (71.7%) |
| 35 to 44 Years | 172 (63.2%) | 67 (55.8%) |
| 45 to 54 Years | 157 (84.9%) | 180 (92.3%) |
| 55 to 64 Years | 84 (61.3%) | 71 (63.4%) |
| 65 to 74 Years | 101 (71.1%) | 93 (84.6%) |
| 75 Years and over | 40 (90.9%) | 107 (86.3%) |
| Total | 832 (69.1%) | 863 (75.3%) |
Income Below Poverty Among Married-Couple Families in Webster County
The poverty statistics for married-couple families in Webster County show that 16.5% or 62 of the total 377 families live below the poverty line. Families with 3 or 4 children have the highest poverty rate of 23.9%, comprising of 11 families. On the other hand, families with no children have the lowest poverty rate of 14.9%, which includes 41 families.
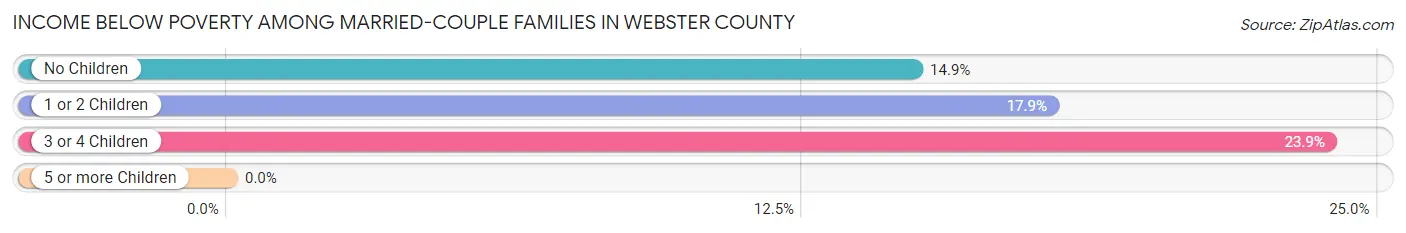
| Children | Above Poverty | Below Poverty |
| No Children | 234 (85.1%) | 41 (14.9%) |
| 1 or 2 Children | 46 (82.1%) | 10 (17.9%) |
| 3 or 4 Children | 35 (76.1%) | 11 (23.9%) |
| 5 or more Children | 0 (0.0%) | 0 (0.0%) |
| Total | 315 (83.6%) | 62 (16.5%) |
Income Below Poverty Among Single-Parent Households in Webster County
According to the poverty data in Webster County, 9.6% or 5 single-father households and 52.8% or 56 single-mother households are living below the poverty line. Among single-father households, those with no children have the highest poverty rate, with 5 households (9.6%) experiencing poverty. Likewise, among single-mother households, those with 3 or 4 children have the highest poverty rate, with 23 households (100.0%) falling below the poverty line.
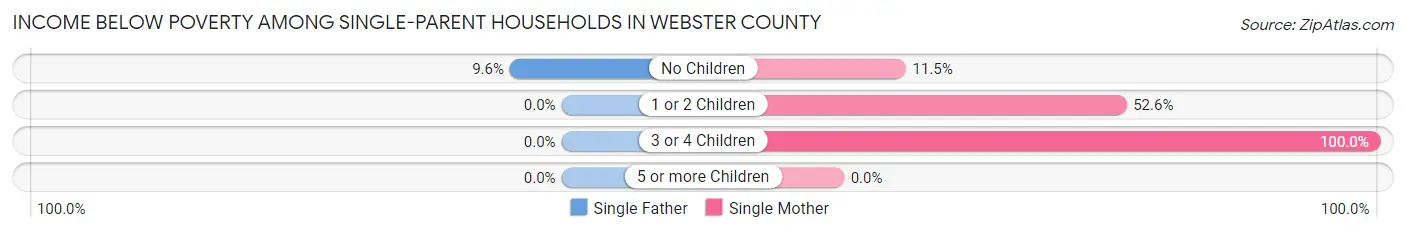
| Children | Single Father | Single Mother |
| No Children | 5 (9.6%) | 3 (11.5%) |
| 1 or 2 Children | 0 (0.0%) | 30 (52.6%) |
| 3 or 4 Children | 0 (0.0%) | 23 (100.0%) |
| 5 or more Children | 0 (0.0%) | 0 (0.0%) |
| Total | 5 (9.6%) | 56 (52.8%) |
Income Below Poverty Among Married-Couple vs Single-Parent Households in Webster County
The poverty data for Webster County shows that 62 of the married-couple family households (16.5%) and 61 of the single-parent households (38.6%) are living below the poverty level. Within the married-couple family households, those with 3 or 4 children have the highest poverty rate, with 11 households (23.9%) falling below the poverty line. Among the single-parent households, those with 3 or 4 children have the highest poverty rate, with 23 household (100.0%) living below poverty.
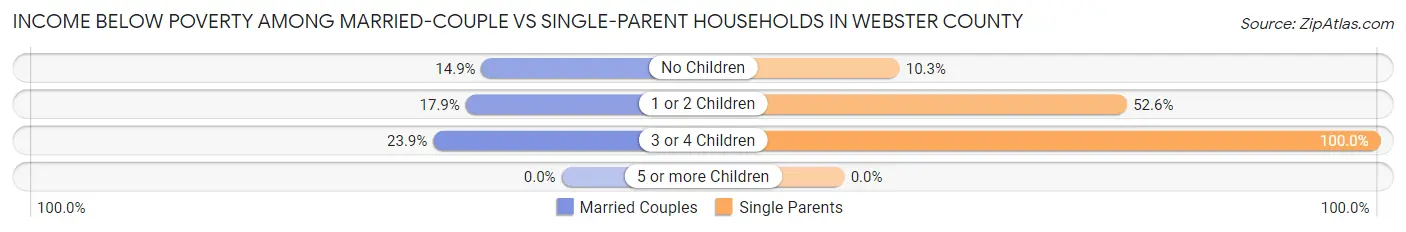
| Children | Married-Couple Families | Single-Parent Households |
| No Children | 41 (14.9%) | 8 (10.3%) |
| 1 or 2 Children | 10 (17.9%) | 30 (52.6%) |
| 3 or 4 Children | 11 (23.9%) | 23 (100.0%) |
| 5 or more Children | 0 (0.0%) | 0 (0.0%) |
| Total | 62 (16.5%) | 61 (38.6%) |
Race in Webster County
The most populous races in Webster County are Black / African American (1,048 | 44.5%), White / Caucasian (977 | 41.5%), and Hispanic or Latino (345 | 14.7%).
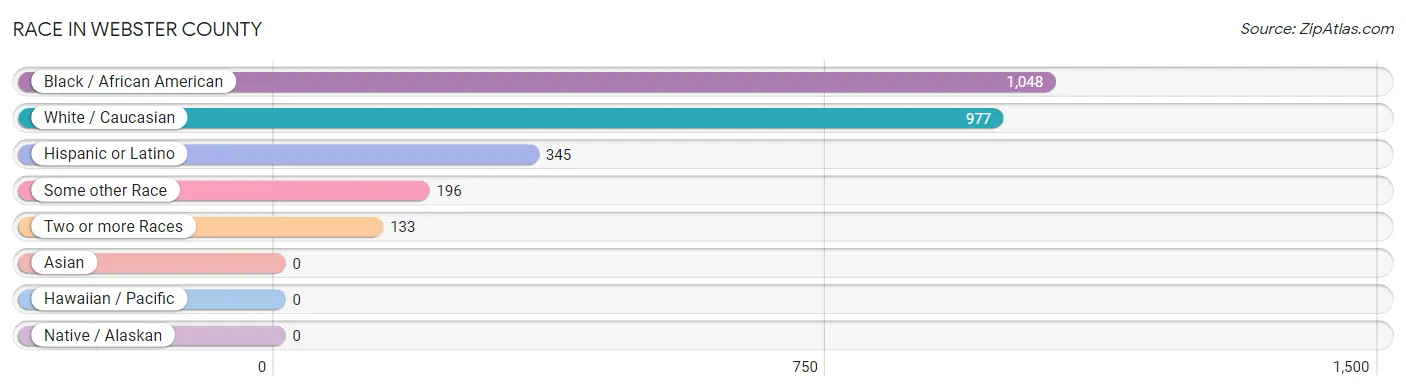
| Race | # Population | % Population |
| Asian | 0 | 0.0% |
| Black / African American | 1,048 | 44.5% |
| Hawaiian / Pacific | 0 | 0.0% |
| Hispanic or Latino | 345 | 14.7% |
| Native / Alaskan | 0 | 0.0% |
| White / Caucasian | 977 | 41.5% |
| Two or more Races | 133 | 5.7% |
| Some other Race | 196 | 8.3% |
| Total | 2,354 | 100.0% |
Ancestry in Webster County
The most populous ancestries reported in Webster County are American (306 | 13.0%), Mexican (232 | 9.9%), English (107 | 4.5%), Central American (58 | 2.5%), and Guatemalan (58 | 2.5%), together accounting for 32.3% of all Webster County residents.
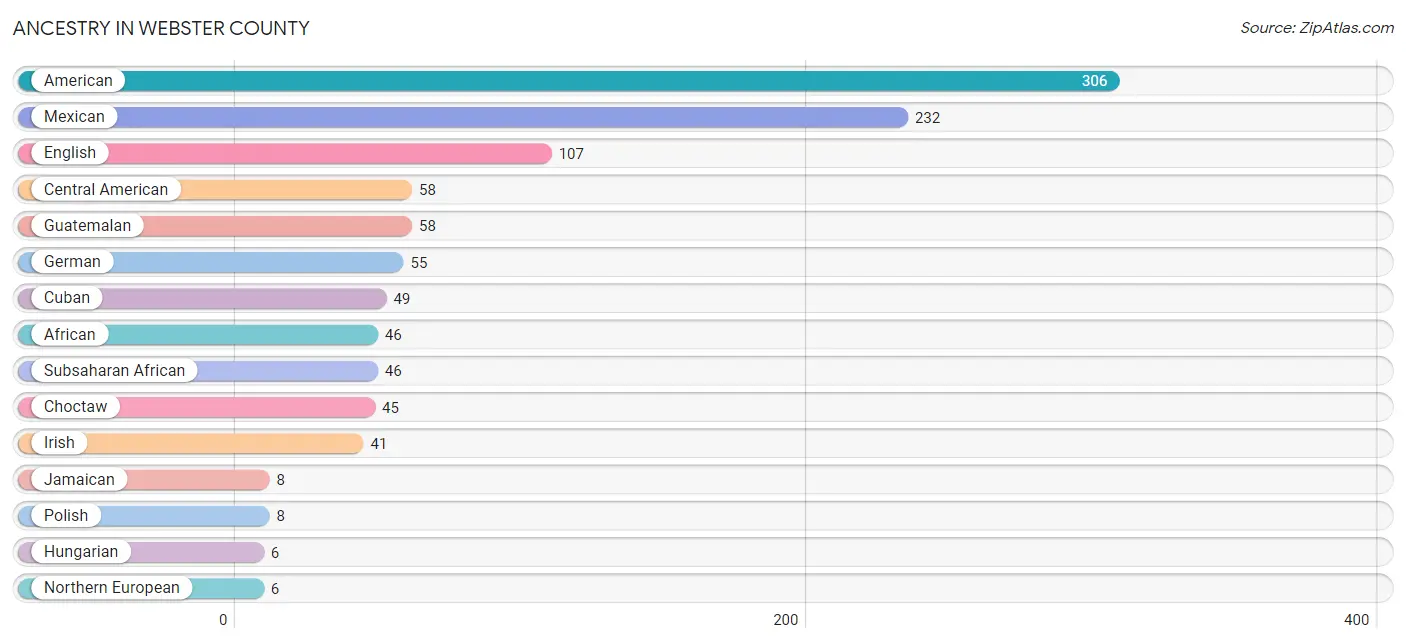
| Ancestry | # Population | % Population |
| African | 46 | 1.9% |
| American | 306 | 13.0% |
| Central American | 58 | 2.5% |
| Choctaw | 45 | 1.9% |
| Cuban | 49 | 2.1% |
| Dutch | 4 | 0.2% |
| English | 107 | 4.5% |
| French | 4 | 0.2% |
| German | 55 | 2.3% |
| Guatemalan | 58 | 2.5% |
| Hungarian | 6 | 0.3% |
| Irish | 41 | 1.7% |
| Jamaican | 8 | 0.3% |
| Mexican | 232 | 9.9% |
| Mexican American Indian | 3 | 0.1% |
| Northern European | 6 | 0.3% |
| Norwegian | 4 | 0.2% |
| Polish | 8 | 0.3% |
| Scotch-Irish | 3 | 0.1% |
| Spaniard | 6 | 0.3% |
| Subsaharan African | 46 | 1.9% | View All 21 Rows |
Immigrants in Webster County
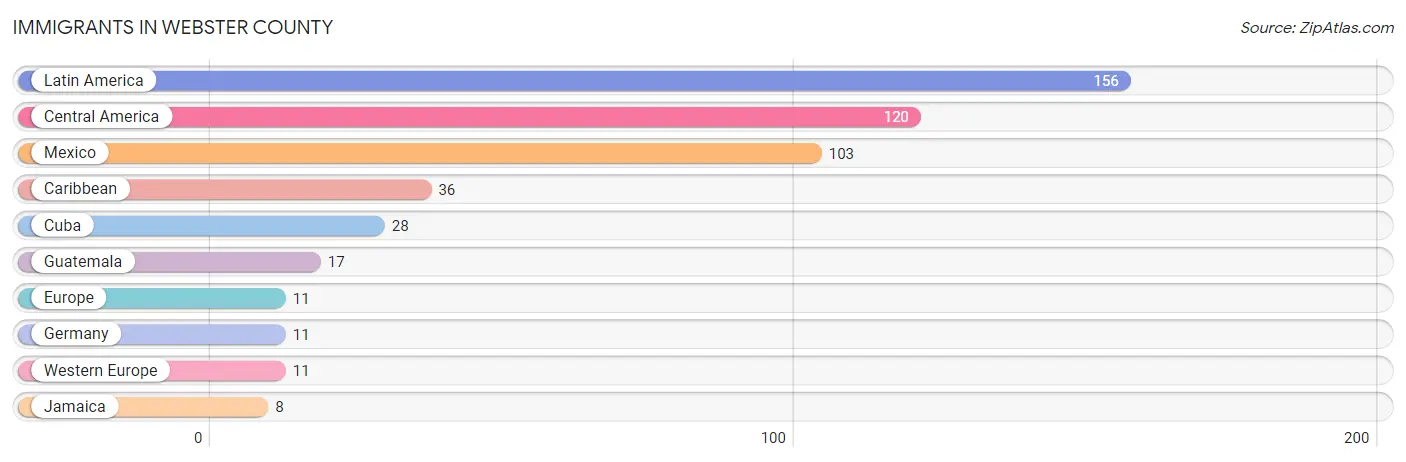
The most numerous immigrant groups reported in Webster County came from Latin America (156 | 6.6%), Central America (120 | 5.1%), Mexico (103 | 4.4%), Caribbean (36 | 1.5%), and Cuba (28 | 1.2%), together accounting for 18.8% of all Webster County residents.
| Immigration Origin | # Population | % Population |
| Caribbean | 36 | 1.5% |
| Central America | 120 | 5.1% |
| Cuba | 28 | 1.2% |
| Europe | 11 | 0.5% |
| Germany | 11 | 0.5% |
| Guatemala | 17 | 0.7% |
| Jamaica | 8 | 0.3% |
| Latin America | 156 | 6.6% |
| Mexico | 103 | 4.4% |
| Western Europe | 11 | 0.5% | View All 10 Rows |
Sex and Age in Webster County
Sex and Age in Webster County
The most populous age groups in Webster County are 25 to 29 Years (154 | 12.8%) for men and 45 to 49 Years (151 | 13.2%) for women.
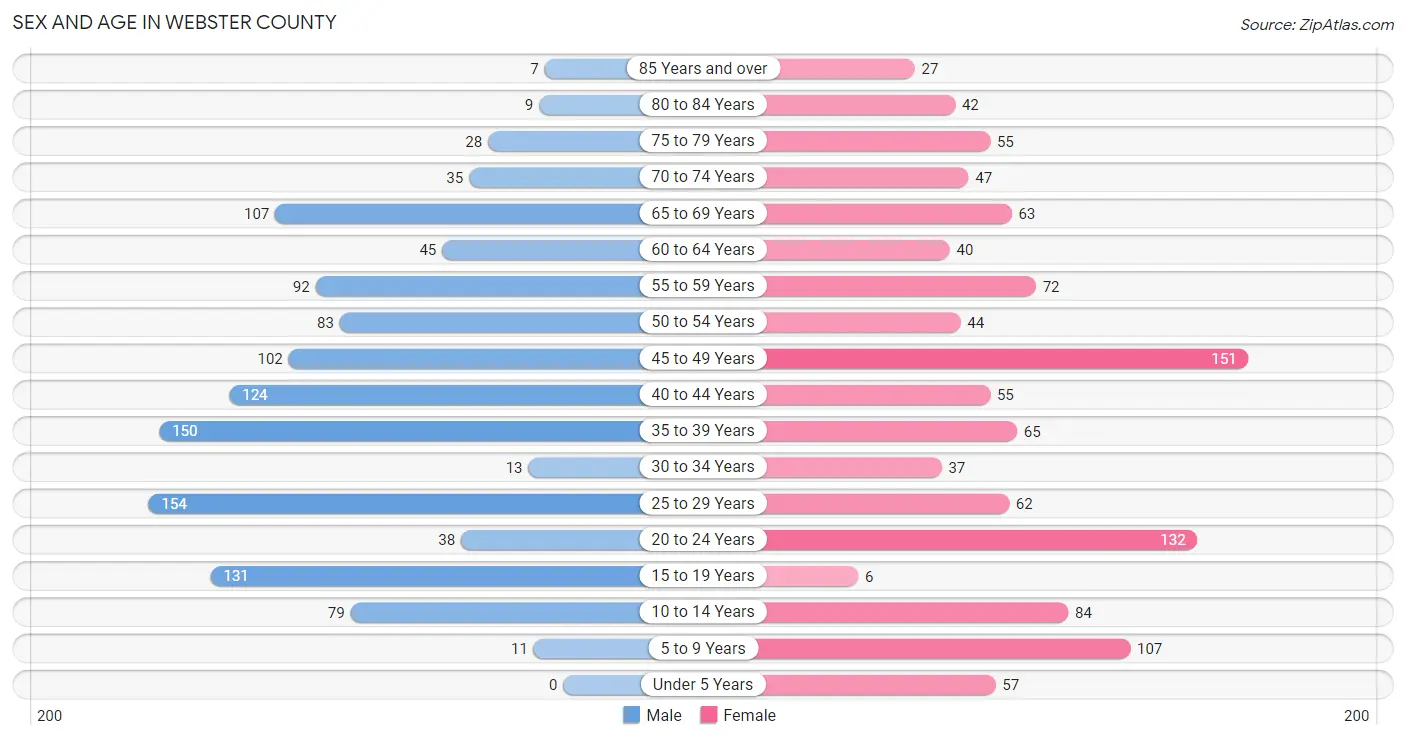
| Age Bracket | Male | Female |
| Under 5 Years | 0 (0.0%) | 57 (5.0%) |
| 5 to 9 Years | 11 (0.9%) | 107 (9.3%) |
| 10 to 14 Years | 79 (6.5%) | 84 (7.3%) |
| 15 to 19 Years | 131 (10.8%) | 6 (0.5%) |
| 20 to 24 Years | 38 (3.2%) | 132 (11.5%) |
| 25 to 29 Years | 154 (12.8%) | 62 (5.4%) |
| 30 to 34 Years | 13 (1.1%) | 37 (3.2%) |
| 35 to 39 Years | 150 (12.4%) | 65 (5.7%) |
| 40 to 44 Years | 124 (10.3%) | 55 (4.8%) |
| 45 to 49 Years | 102 (8.4%) | 151 (13.2%) |
| 50 to 54 Years | 83 (6.9%) | 44 (3.8%) |
| 55 to 59 Years | 92 (7.6%) | 72 (6.3%) |
| 60 to 64 Years | 45 (3.7%) | 40 (3.5%) |
| 65 to 69 Years | 107 (8.9%) | 63 (5.5%) |
| 70 to 74 Years | 35 (2.9%) | 47 (4.1%) |
| 75 to 79 Years | 28 (2.3%) | 55 (4.8%) |
| 80 to 84 Years | 9 (0.7%) | 42 (3.7%) |
| 85 Years and over | 7 (0.6%) | 27 (2.4%) |
| Total | 1,208 (100.0%) | 1,146 (100.0%) |
Families and Households in Webster County
Median Family Size in Webster County
The median family size in Webster County is 3.58 persons per family, with single female/mother families (106 | 19.8%) accounting for the largest median family size of 4.32 persons per family. On the other hand, single male/father families (52 | 9.7%) represent the smallest median family size with 2.75 persons per family.
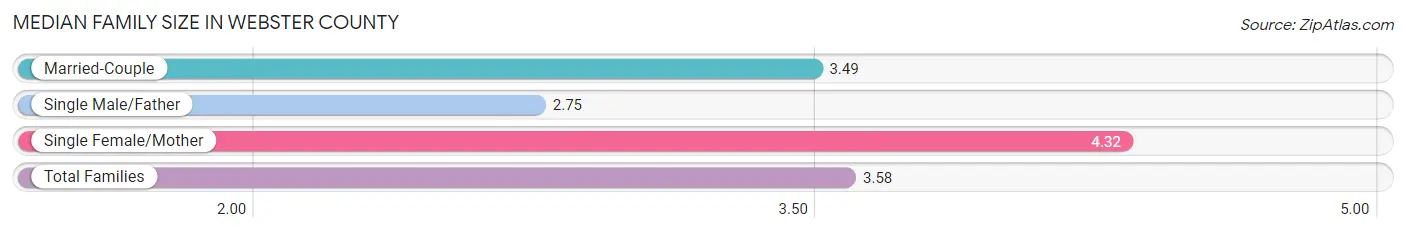
| Family Type | # Families | Family Size |
| Married-Couple | 377 (70.5%) | 3.49 |
| Single Male/Father | 52 (9.7%) | 2.75 |
| Single Female/Mother | 106 (19.8%) | 4.32 |
| Total Families | 535 (100.0%) | 3.58 |
Median Household Size in Webster County
The median household size in Webster County is 2.68 persons per household, with single female/mother households (106 | 12.1%) accounting for the largest median household size of 4.58 persons per household. non-family households (341 | 38.9%) represent the smallest median household size with 1.19 persons per household.
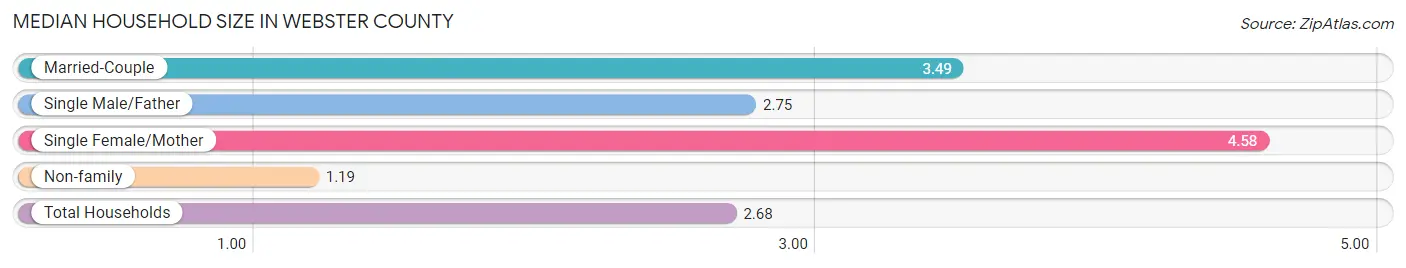
| Household Type | # Households | Household Size |
| Married-Couple | 377 (43.0%) | 3.49 |
| Single Male/Father | 52 (5.9%) | 2.75 |
| Single Female/Mother | 106 (12.1%) | 4.58 |
| Non-family | 341 (38.9%) | 1.19 |
| Total Households | 876 (100.0%) | 2.68 |
Household Size by Marriage Status in Webster County
Out of a total of 876 households in Webster County, 535 (61.1%) are family households, while 341 (38.9%) are nonfamily households. The most numerous type of family households are 2-person households, comprising 272, and the most common type of nonfamily households are 1-person households, comprising 307.
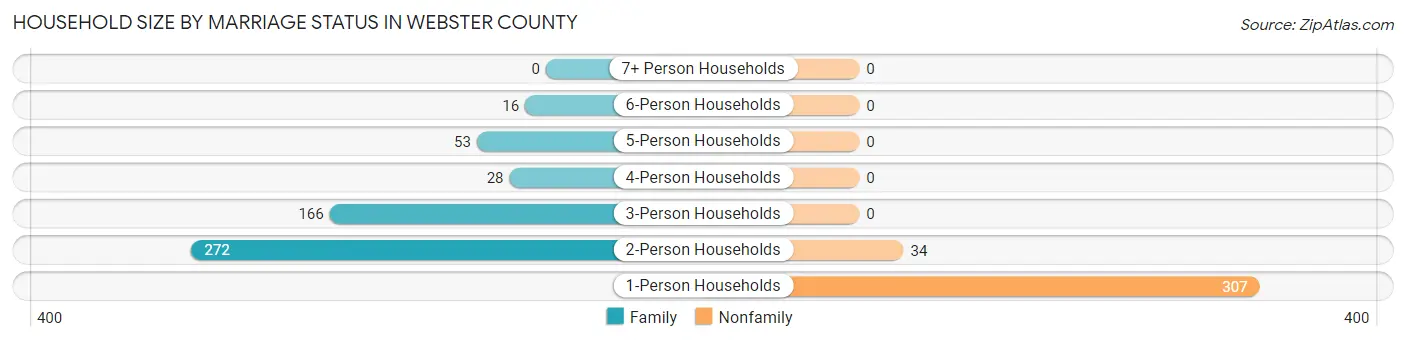
| Household Size | Family Households | Nonfamily Households |
| 1-Person Households | - | 307 (35.0%) |
| 2-Person Households | 272 (31.0%) | 34 (3.9%) |
| 3-Person Households | 166 (19.0%) | 0 (0.0%) |
| 4-Person Households | 28 (3.2%) | 0 (0.0%) |
| 5-Person Households | 53 (6.0%) | 0 (0.0%) |
| 6-Person Households | 16 (1.8%) | 0 (0.0%) |
| 7+ Person Households | 0 (0.0%) | 0 (0.0%) |
| Total | 535 (61.1%) | 341 (38.9%) |
Female Fertility in Webster County
Fertility by Age in Webster County
Average fertility rate in Webster County is 28.0 births per 1,000 women. Women in the age bracket of 20 to 34 years have the highest fertility rate with 61.0 births per 1,000 women. Women in the age bracket of 20 to 34 years acount for 100.0% of all women with births.
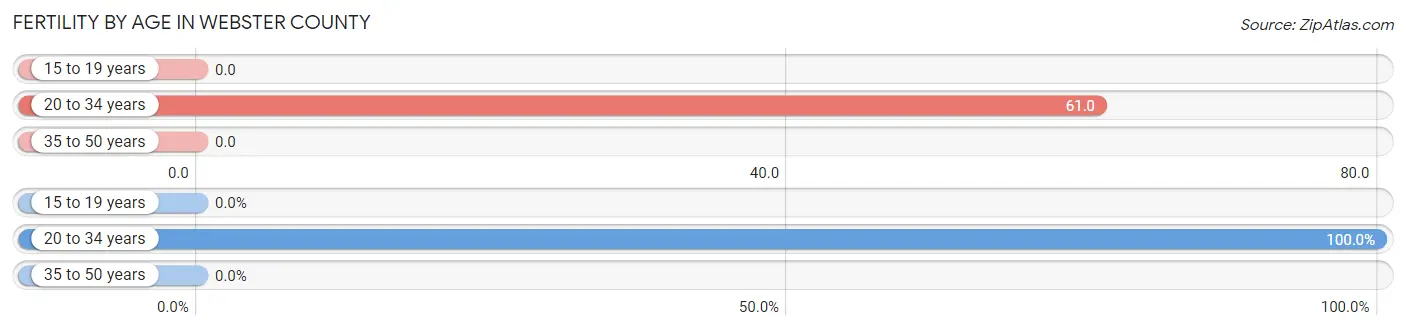
| Age Bracket | Women with Births | Births / 1,000 Women |
| 15 to 19 years | 0 (0.0%) | 0.0 |
| 20 to 34 years | 14 (100.0%) | 61.0 |
| 35 to 50 years | 0 (0.0%) | 0.0 |
| Total | 14 (100.0%) | 28.0 |
Fertility by Age by Marriage Status in Webster County
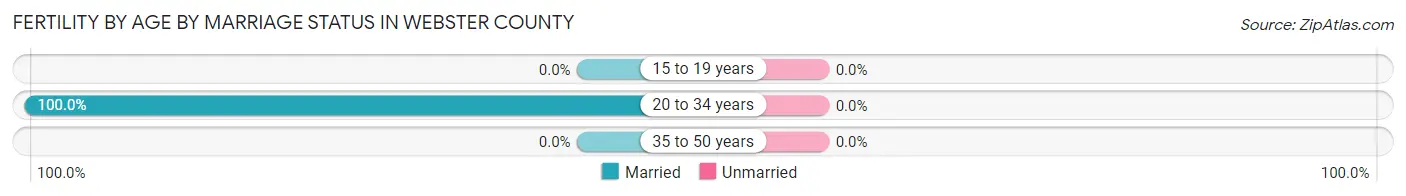
| Age Bracket | Married | Unmarried |
| 15 to 19 years | 0 (0.0%) | 0 (0.0%) |
| 20 to 34 years | 14 (100.0%) | 0 (0.0%) |
| 35 to 50 years | 0 (0.0%) | 0 (0.0%) |
| Total | 14 (100.0%) | 0 (0.0%) |
Fertility by Education in Webster County
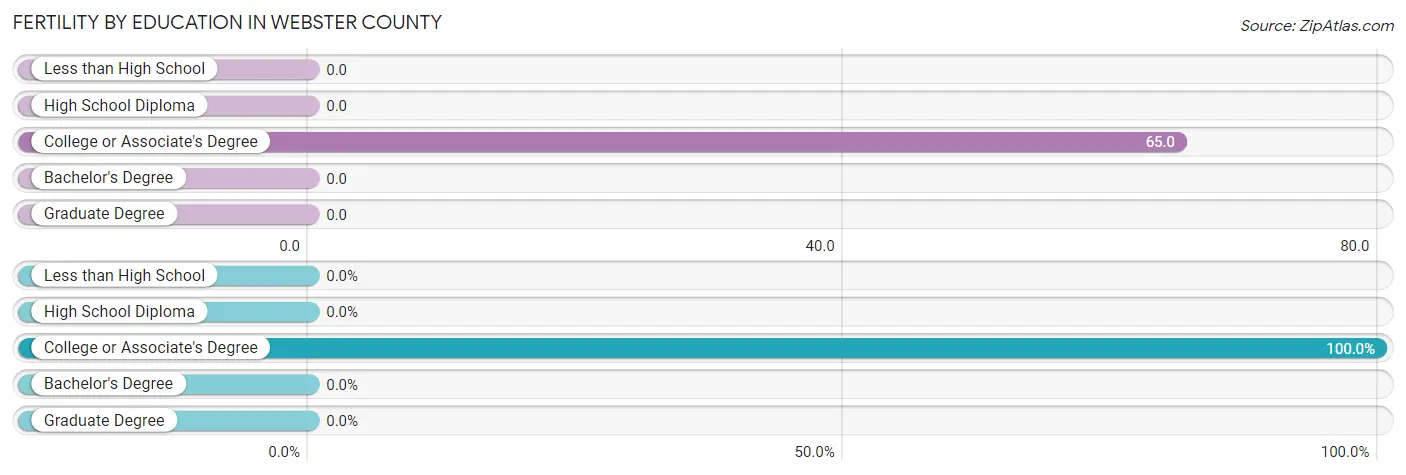
| Educational Attainment | Women with Births | Births / 1,000 Women |
| Less than High School | 0 (0.0%) | 0.0 |
| High School Diploma | 0 (0.0%) | 0.0 |
| College or Associate's Degree | 14 (100.0%) | 65.0 |
| Bachelor's Degree | 0 (0.0%) | 0.0 |
| Graduate Degree | 0 (0.0%) | 0.0 |
| Total | 14 (100.0%) | 28.0 |
Fertility by Education by Marriage Status in Webster County
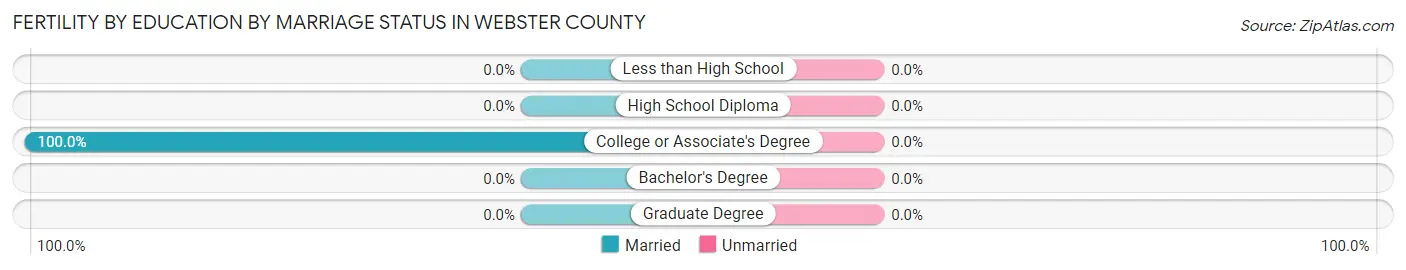
| Educational Attainment | Married | Unmarried |
| Less than High School | 0 (0.0%) | 0 (0.0%) |
| High School Diploma | 0 (0.0%) | 0 (0.0%) |
| College or Associate's Degree | 14 (100.0%) | 0 (0.0%) |
| Bachelor's Degree | 0 (0.0%) | 0 (0.0%) |
| Graduate Degree | 0 (0.0%) | 0 (0.0%) |
| Total | 14 (100.0%) | 0 (0.0%) |
Employment Characteristics in Webster County
Employment by Class of Employer in Webster County
Among the 958 employed individuals in Webster County, private company employees (607 | 63.4%), local government employees (115 | 12.0%), and state government employees (78 | 8.1%) make up the most common classes of employment.
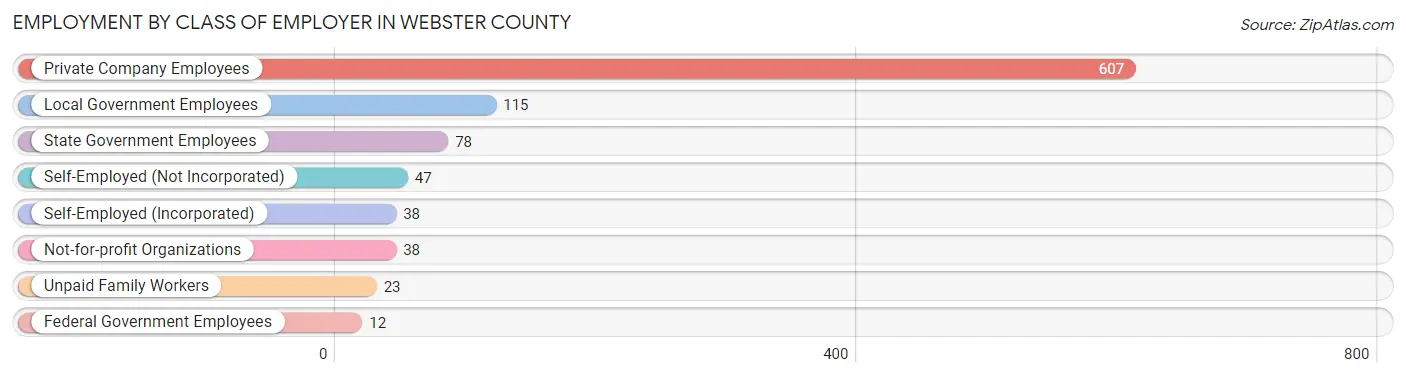
| Employer Class | # Employees | % Employees |
| Private Company Employees | 607 | 63.4% |
| Self-Employed (Incorporated) | 38 | 4.0% |
| Self-Employed (Not Incorporated) | 47 | 4.9% |
| Not-for-profit Organizations | 38 | 4.0% |
| Local Government Employees | 115 | 12.0% |
| State Government Employees | 78 | 8.1% |
| Federal Government Employees | 12 | 1.3% |
| Unpaid Family Workers | 23 | 2.4% |
| Total | 958 | 100.0% |
Employment Status by Age in Webster County
According to the labor force statistics for Webster County, out of the total population over 16 years of age (1,965), 55.5% or 1,091 individuals are in the labor force, with 8.9% or 97 of them unemployed. The age group with the highest labor force participation rate is 25 to 29 years, with 94.0% or 203 individuals in the labor force. Within the labor force, the 16 to 19 years age range has the highest percentage of unemployed individuals, with 100.0% or 40 of them being unemployed.
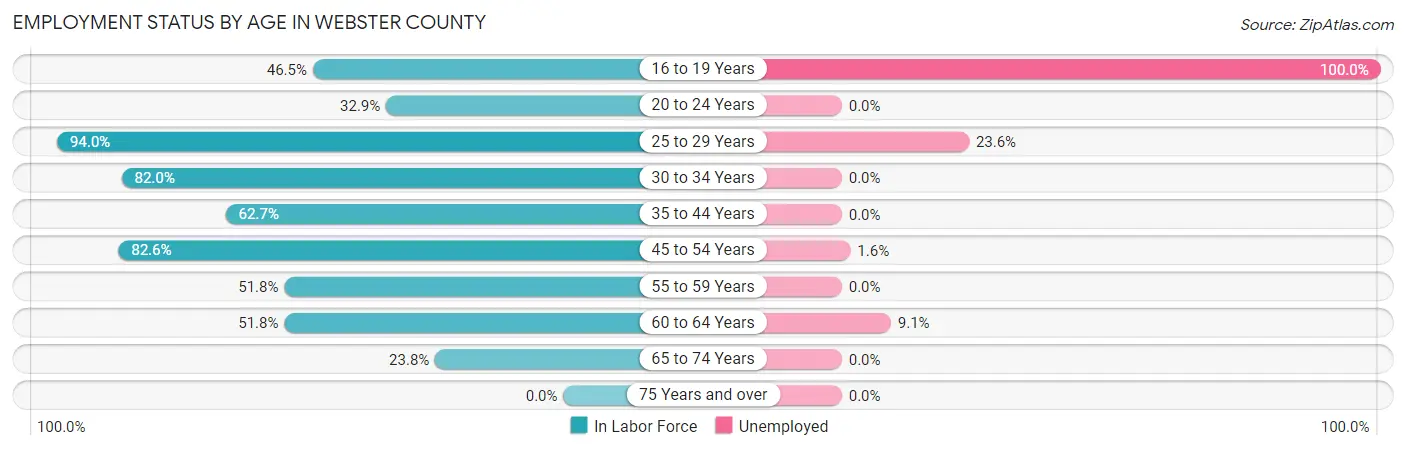
| Age Bracket | In Labor Force | Unemployed |
| 16 to 19 Years | 40 (46.5%) | 40 (100.0%) |
| 20 to 24 Years | 56 (32.9%) | 0 (0.0%) |
| 25 to 29 Years | 203 (94.0%) | 48 (23.6%) |
| 30 to 34 Years | 41 (82.0%) | 0 (0.0%) |
| 35 to 44 Years | 247 (62.7%) | 0 (0.0%) |
| 45 to 54 Years | 314 (82.6%) | 5 (1.6%) |
| 55 to 59 Years | 85 (51.8%) | 0 (0.0%) |
| 60 to 64 Years | 44 (51.8%) | 4 (9.1%) |
| 65 to 74 Years | 60 (23.8%) | 0 (0.0%) |
| 75 Years and over | 0 (0.0%) | 0 (0.0%) |
| Total | 1,091 (55.5%) | 97 (8.9%) |
Employment Status by Educational Attainment in Webster County
According to labor force statistics for Webster County, 72.5% of individuals (935) out of the total population between 25 and 64 years of age (1,289) are in the labor force, with 6.1% or 57 of them being unemployed. The group with the highest labor force participation rate are those with the educational attainment of high school diploma, with 88.3% or 393 individuals in the labor force. Within the labor force, individuals with college / associate degree education have the highest percentage of unemployment, with 17.1% or 53 of them being unemployed.
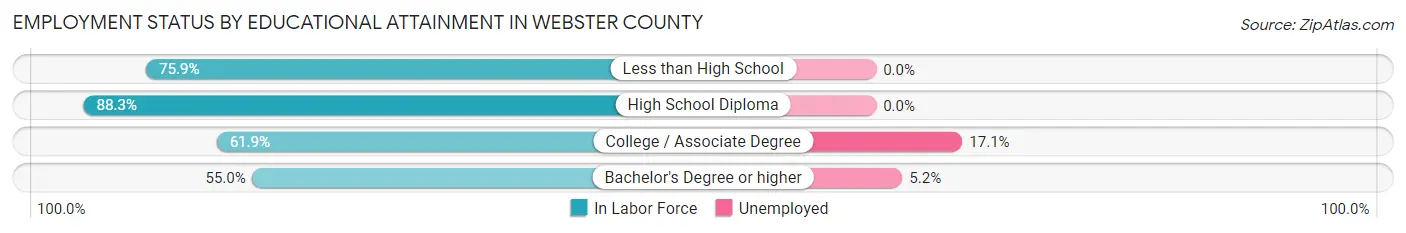
| Educational Attainment | In Labor Force | Unemployed |
| Less than High School | 154 (75.9%) | 0 (0.0%) |
| High School Diploma | 393 (88.3%) | 0 (0.0%) |
| College / Associate Degree | 310 (61.9%) | 86 (17.1%) |
| Bachelor's Degree or higher | 77 (55.0%) | 7 (5.2%) |
| Total | 935 (72.5%) | 79 (6.1%) |
Employment Occupations by Sex in Webster County
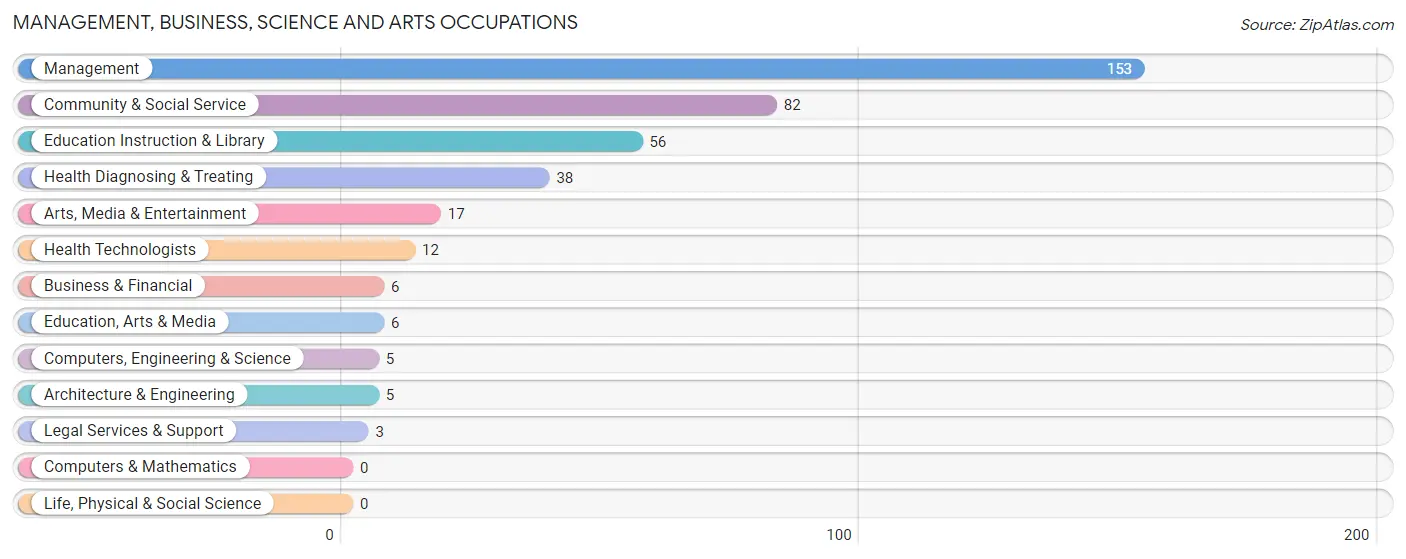
Management, Business, Science and Arts Occupations
The most common Management, Business, Science and Arts occupations in Webster County are Management (153 | 15.4%), Community & Social Service (82 | 8.3%), Education Instruction & Library (56 | 5.6%), Health Diagnosing & Treating (38 | 3.8%), and Arts, Media & Entertainment (17 | 1.7%).
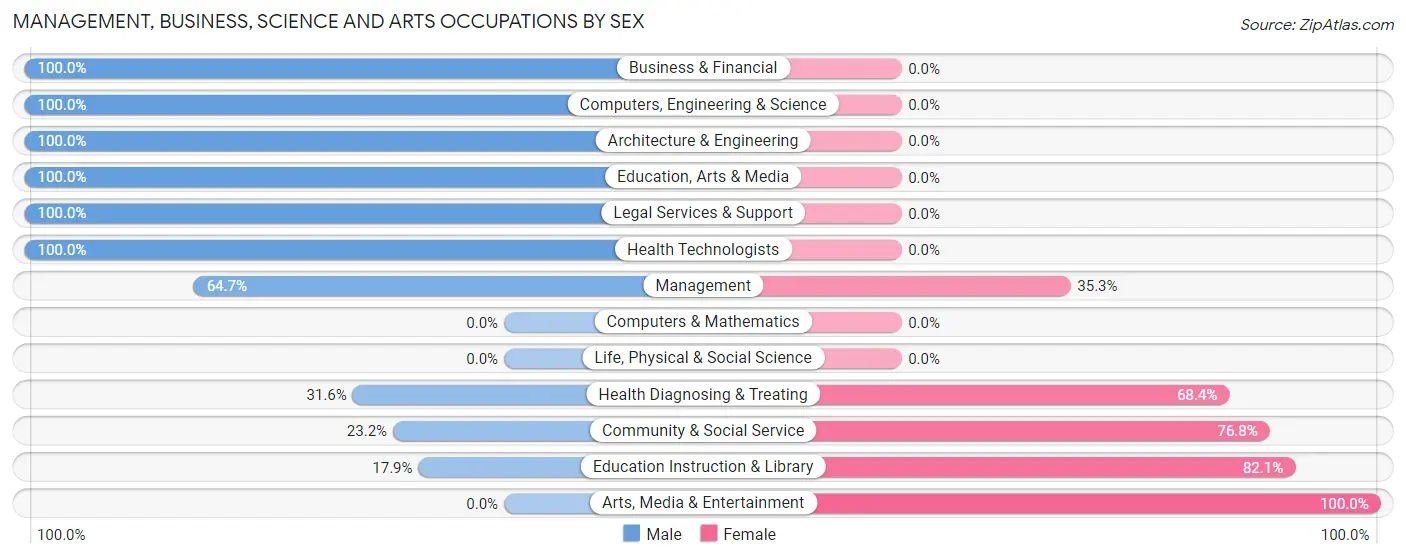
Management, Business, Science and Arts Occupations by Sex
Within the Management, Business, Science and Arts occupations in Webster County, the most male-oriented occupations are Business & Financial (100.0%), Computers, Engineering & Science (100.0%), and Architecture & Engineering (100.0%), while the most female-oriented occupations are Arts, Media & Entertainment (100.0%), Education Instruction & Library (82.1%), and Community & Social Service (76.8%).
| Occupation | Male | Female |
| Management | 99 (64.7%) | 54 (35.3%) |
| Business & Financial | 6 (100.0%) | 0 (0.0%) |
| Computers, Engineering & Science | 5 (100.0%) | 0 (0.0%) |
| Computers & Mathematics | 0 (0.0%) | 0 (0.0%) |
| Architecture & Engineering | 5 (100.0%) | 0 (0.0%) |
| Life, Physical & Social Science | 0 (0.0%) | 0 (0.0%) |
| Community & Social Service | 19 (23.2%) | 63 (76.8%) |
| Education, Arts & Media | 6 (100.0%) | 0 (0.0%) |
| Legal Services & Support | 3 (100.0%) | 0 (0.0%) |
| Education Instruction & Library | 10 (17.9%) | 46 (82.1%) |
| Arts, Media & Entertainment | 0 (0.0%) | 17 (100.0%) |
| Health Diagnosing & Treating | 12 (31.6%) | 26 (68.4%) |
| Health Technologists | 12 (100.0%) | 0 (0.0%) |
| Total (Category) | 141 (49.6%) | 143 (50.3%) |
| Total (Overall) | 693 (69.8%) | 300 (30.2%) |
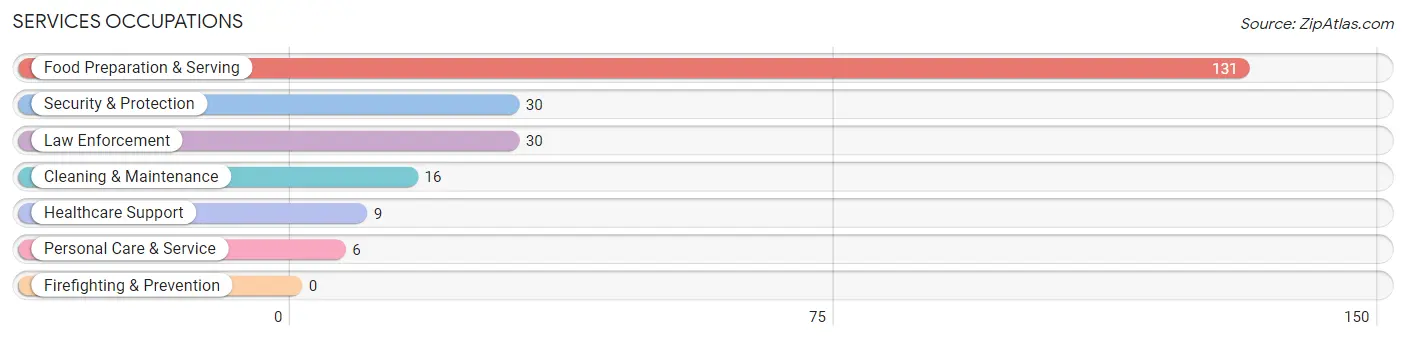
Services Occupations
The most common Services occupations in Webster County are Food Preparation & Serving (131 | 13.2%), Security & Protection (30 | 3.0%), Law Enforcement (30 | 3.0%), Cleaning & Maintenance (16 | 1.6%), and Healthcare Support (9 | 0.9%).
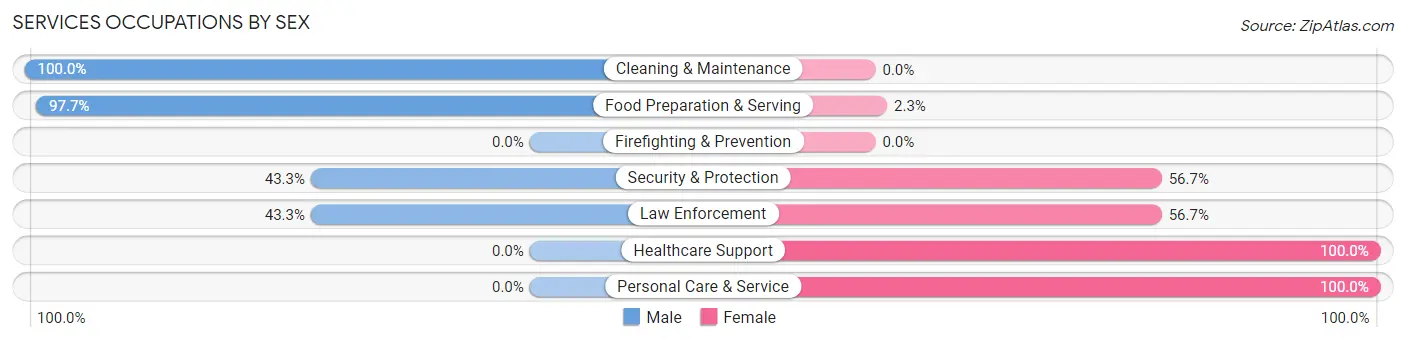
Services Occupations by Sex
Within the Services occupations in Webster County, the most male-oriented occupations are Cleaning & Maintenance (100.0%), Food Preparation & Serving (97.7%), and Security & Protection (43.3%), while the most female-oriented occupations are Healthcare Support (100.0%), Personal Care & Service (100.0%), and Security & Protection (56.7%).
| Occupation | Male | Female |
| Healthcare Support | 0 (0.0%) | 9 (100.0%) |
| Security & Protection | 13 (43.3%) | 17 (56.7%) |
| Firefighting & Prevention | 0 (0.0%) | 0 (0.0%) |
| Law Enforcement | 13 (43.3%) | 17 (56.7%) |
| Food Preparation & Serving | 128 (97.7%) | 3 (2.3%) |
| Cleaning & Maintenance | 16 (100.0%) | 0 (0.0%) |
| Personal Care & Service | 0 (0.0%) | 6 (100.0%) |
| Total (Category) | 157 (81.8%) | 35 (18.2%) |
| Total (Overall) | 693 (69.8%) | 300 (30.2%) |
Sales and Office Occupations
The most common Sales and Office occupations in Webster County are Office & Administration (121 | 12.2%), and Sales & Related (5 | 0.5%).

Sales and Office Occupations by Sex

| Occupation | Male | Female |
| Sales & Related | 5 (100.0%) | 0 (0.0%) |
| Office & Administration | 44 (36.4%) | 77 (63.6%) |
| Total (Category) | 49 (38.9%) | 77 (61.1%) |
| Total (Overall) | 693 (69.8%) | 300 (30.2%) |
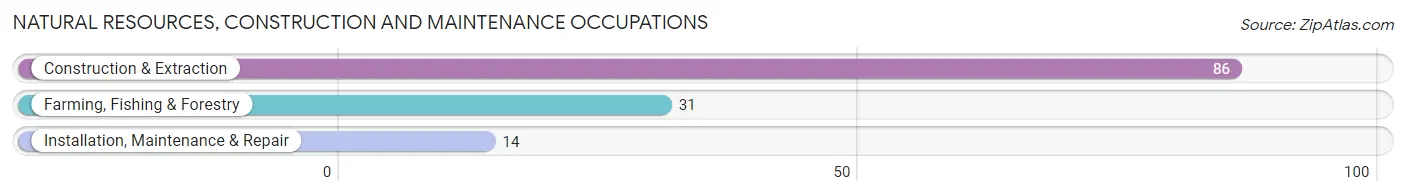
Natural Resources, Construction and Maintenance Occupations
The most common Natural Resources, Construction and Maintenance occupations in Webster County are Construction & Extraction (86 | 8.7%), Farming, Fishing & Forestry (31 | 3.1%), and Installation, Maintenance & Repair (14 | 1.4%).
Natural Resources, Construction and Maintenance Occupations by Sex
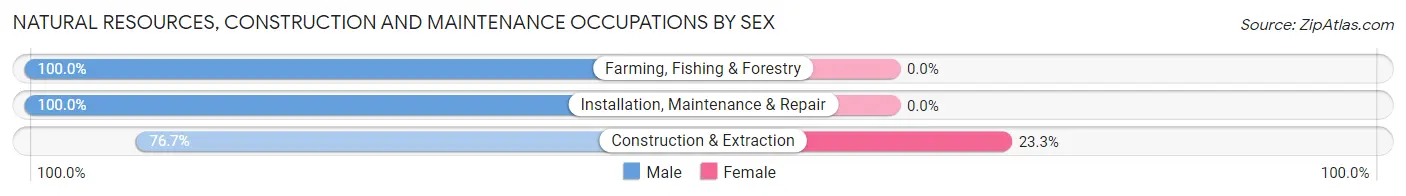
| Occupation | Male | Female |
| Farming, Fishing & Forestry | 31 (100.0%) | 0 (0.0%) |
| Construction & Extraction | 66 (76.7%) | 20 (23.3%) |
| Installation, Maintenance & Repair | 14 (100.0%) | 0 (0.0%) |
| Total (Category) | 111 (84.7%) | 20 (15.3%) |
| Total (Overall) | 693 (69.8%) | 300 (30.2%) |
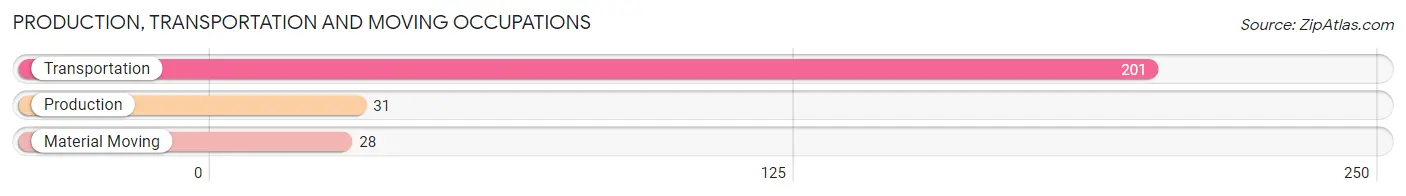
Production, Transportation and Moving Occupations
The most common Production, Transportation and Moving occupations in Webster County are Transportation (201 | 20.2%), Production (31 | 3.1%), and Material Moving (28 | 2.8%).
Production, Transportation and Moving Occupations by Sex
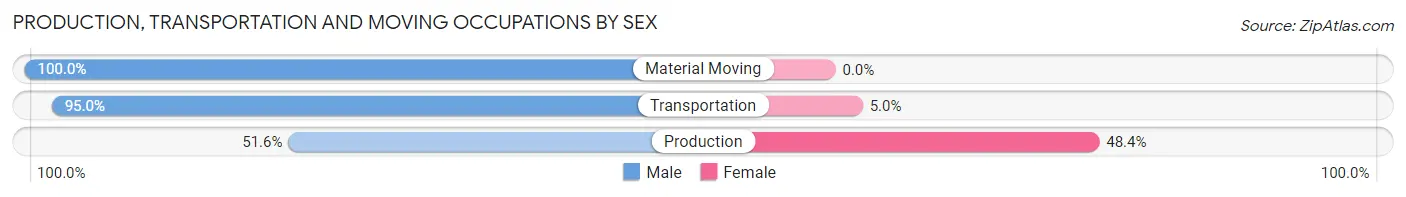
| Occupation | Male | Female |
| Production | 16 (51.6%) | 15 (48.4%) |
| Transportation | 191 (95.0%) | 10 (5.0%) |
| Material Moving | 28 (100.0%) | 0 (0.0%) |
| Total (Category) | 235 (90.4%) | 25 (9.6%) |
| Total (Overall) | 693 (69.8%) | 300 (30.2%) |
Employment Industries by Sex in Webster County
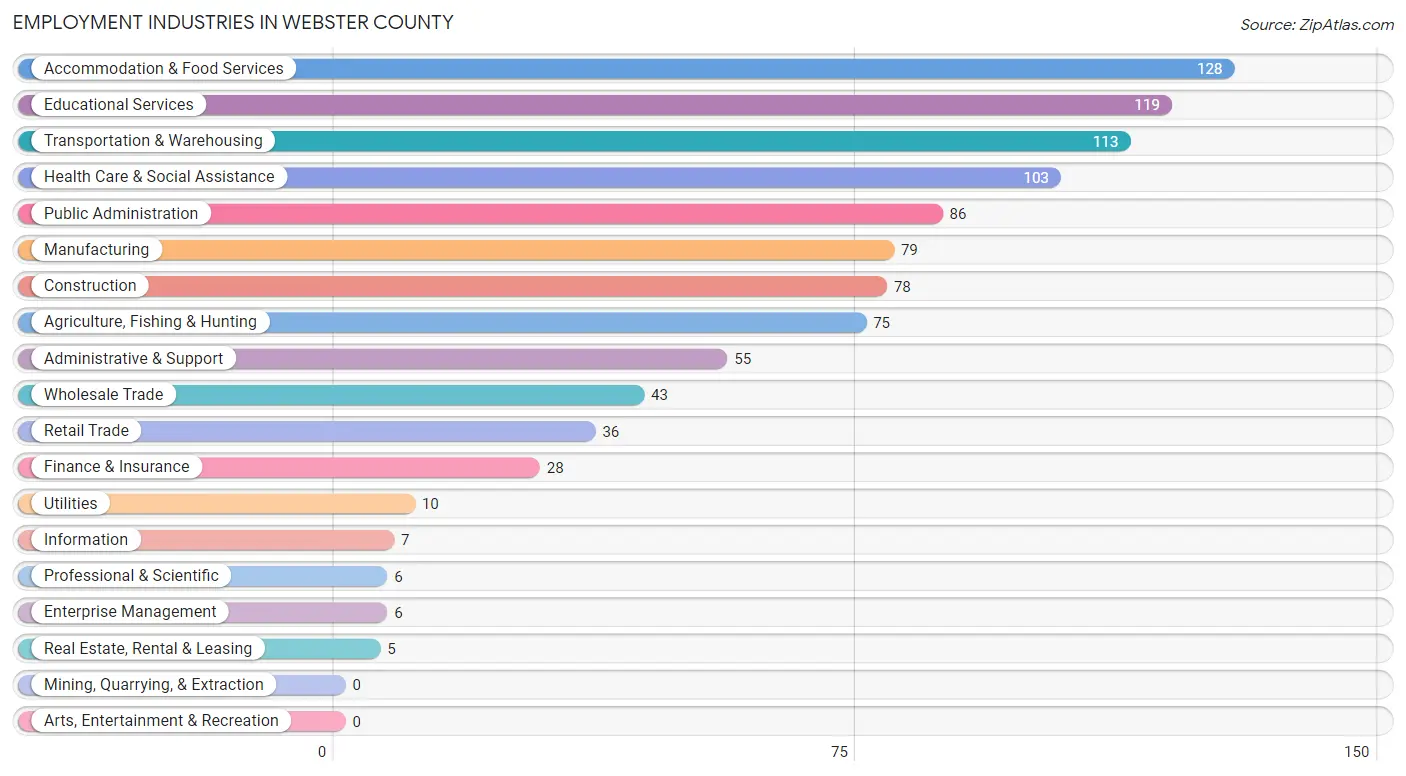
Employment Industries in Webster County
The major employment industries in Webster County include Accommodation & Food Services (128 | 12.9%), Educational Services (119 | 12.0%), Transportation & Warehousing (113 | 11.4%), Health Care & Social Assistance (103 | 10.4%), and Public Administration (86 | 8.7%).
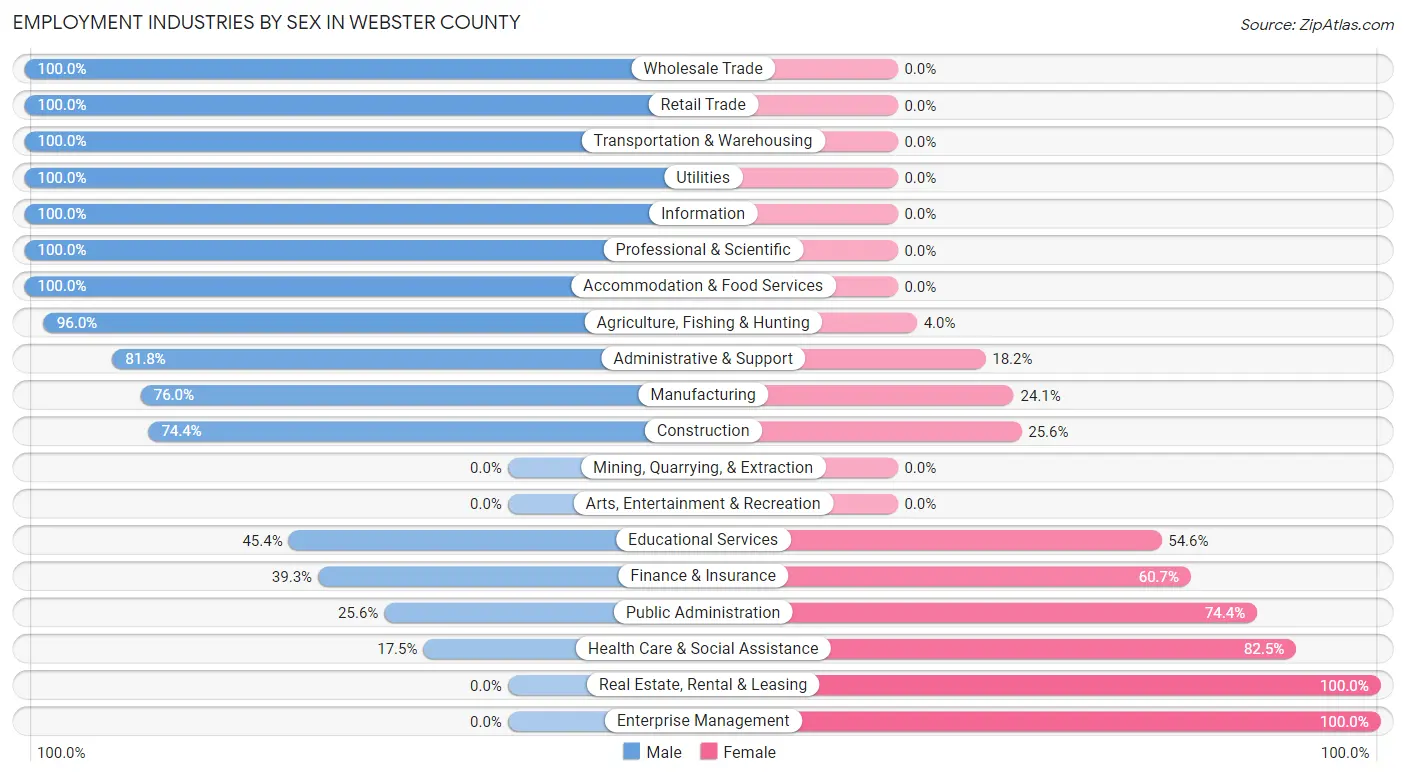
Employment Industries by Sex in Webster County
The Webster County industries that see more men than women are Wholesale Trade (100.0%), Retail Trade (100.0%), and Transportation & Warehousing (100.0%), whereas the industries that tend to have a higher number of women are Real Estate, Rental & Leasing (100.0%), Enterprise Management (100.0%), and Health Care & Social Assistance (82.5%).
| Industry | Male | Female |
| Agriculture, Fishing & Hunting | 72 (96.0%) | 3 (4.0%) |
| Mining, Quarrying, & Extraction | 0 (0.0%) | 0 (0.0%) |
| Construction | 58 (74.4%) | 20 (25.6%) |
| Manufacturing | 60 (75.9%) | 19 (24.0%) |
| Wholesale Trade | 43 (100.0%) | 0 (0.0%) |
| Retail Trade | 36 (100.0%) | 0 (0.0%) |
| Transportation & Warehousing | 113 (100.0%) | 0 (0.0%) |
| Utilities | 10 (100.0%) | 0 (0.0%) |
| Information | 7 (100.0%) | 0 (0.0%) |
| Finance & Insurance | 11 (39.3%) | 17 (60.7%) |
| Real Estate, Rental & Leasing | 0 (0.0%) | 5 (100.0%) |
| Professional & Scientific | 6 (100.0%) | 0 (0.0%) |
| Enterprise Management | 0 (0.0%) | 6 (100.0%) |
| Administrative & Support | 45 (81.8%) | 10 (18.2%) |
| Educational Services | 54 (45.4%) | 65 (54.6%) |
| Health Care & Social Assistance | 18 (17.5%) | 85 (82.5%) |
| Arts, Entertainment & Recreation | 0 (0.0%) | 0 (0.0%) |
| Accommodation & Food Services | 128 (100.0%) | 0 (0.0%) |
| Public Administration | 22 (25.6%) | 64 (74.4%) |
| Total | 693 (69.8%) | 300 (30.2%) |
Education in Webster County
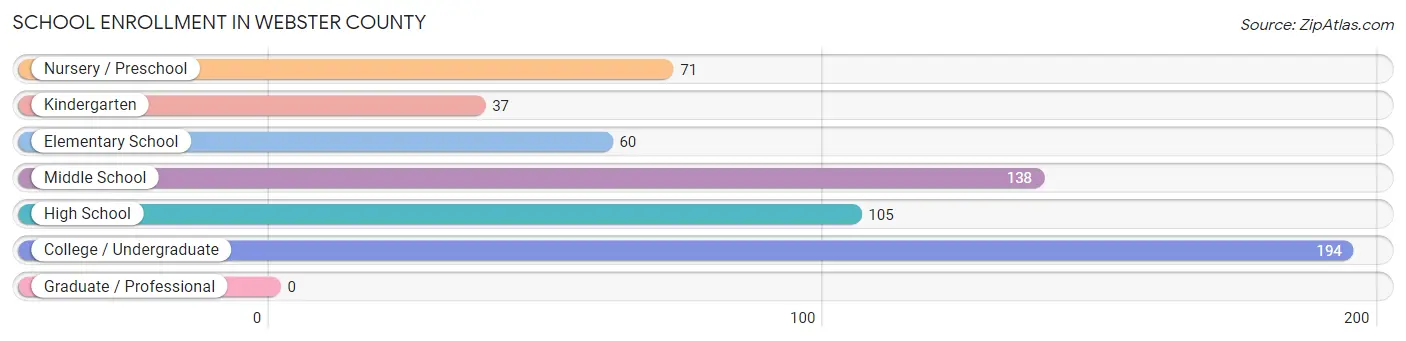
School Enrollment in Webster County
The most common levels of schooling among the 605 students in Webster County are college / undergraduate (194 | 32.1%), middle school (138 | 22.8%), and high school (105 | 17.4%).
| School Level | # Students | % Students |
| Nursery / Preschool | 71 | 11.7% |
| Kindergarten | 37 | 6.1% |
| Elementary School | 60 | 9.9% |
| Middle School | 138 | 22.8% |
| High School | 105 | 17.4% |
| College / Undergraduate | 194 | 32.1% |
| Graduate / Professional | 0 | 0.0% |
| Total | 605 | 100.0% |
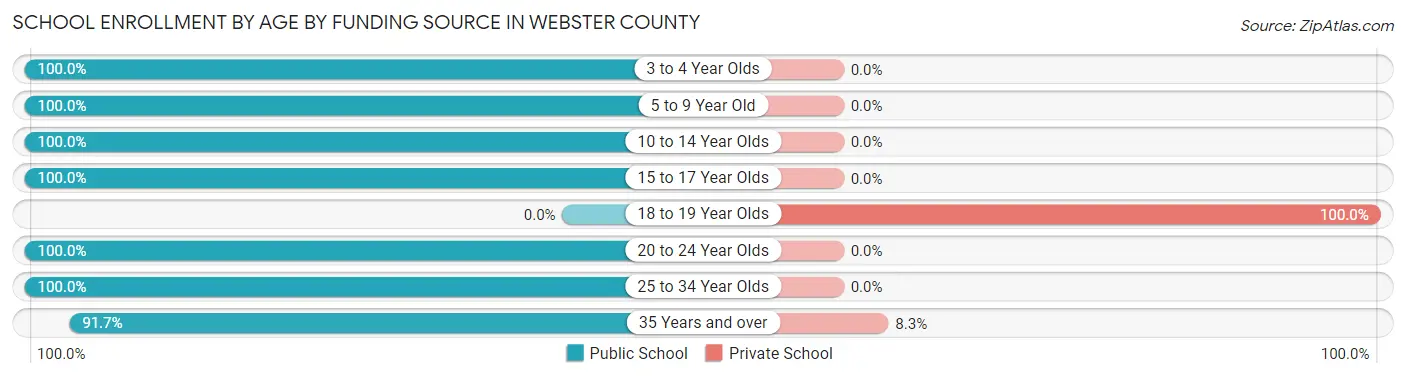
School Enrollment by Age by Funding Source in Webster County
Out of a total of 605 students who are enrolled in schools in Webster County, 19 (3.1%) attend a private institution, while the remaining 586 (96.9%) are enrolled in public schools. The age group of 18 to 19 year olds has the highest likelihood of being enrolled in private schools, with 9 (100.0% in the age bracket) enrolled. Conversely, the age group of 3 to 4 year olds has the lowest likelihood of being enrolled in a private school, with 42 (100.0% in the age bracket) attending a public institution.
| Age Bracket | Public School | Private School |
| 3 to 4 Year Olds | 42 (100.0%) | 0 (0.0%) |
| 5 to 9 Year Old | 118 (100.0%) | 0 (0.0%) |
| 10 to 14 Year Olds | 163 (100.0%) | 0 (0.0%) |
| 15 to 17 Year Olds | 75 (100.0%) | 0 (0.0%) |
| 18 to 19 Year Olds | 0 (0.0%) | 9 (100.0%) |
| 20 to 24 Year Olds | 69 (100.0%) | 0 (0.0%) |
| 25 to 34 Year Olds | 9 (100.0%) | 0 (0.0%) |
| 35 Years and over | 110 (91.7%) | 10 (8.3%) |
| Total | 586 (96.9%) | 19 (3.1%) |
Educational Attainment by Field of Study in Webster County
Business (50 | 31.5%), education (47 | 29.6%), arts & humanities (43 | 27.0%), bio, nature & agricultural (13 | 8.2%), and engineering (4 | 2.5%) are the most common fields of study among 159 individuals in Webster County who have obtained a bachelor's degree or higher.
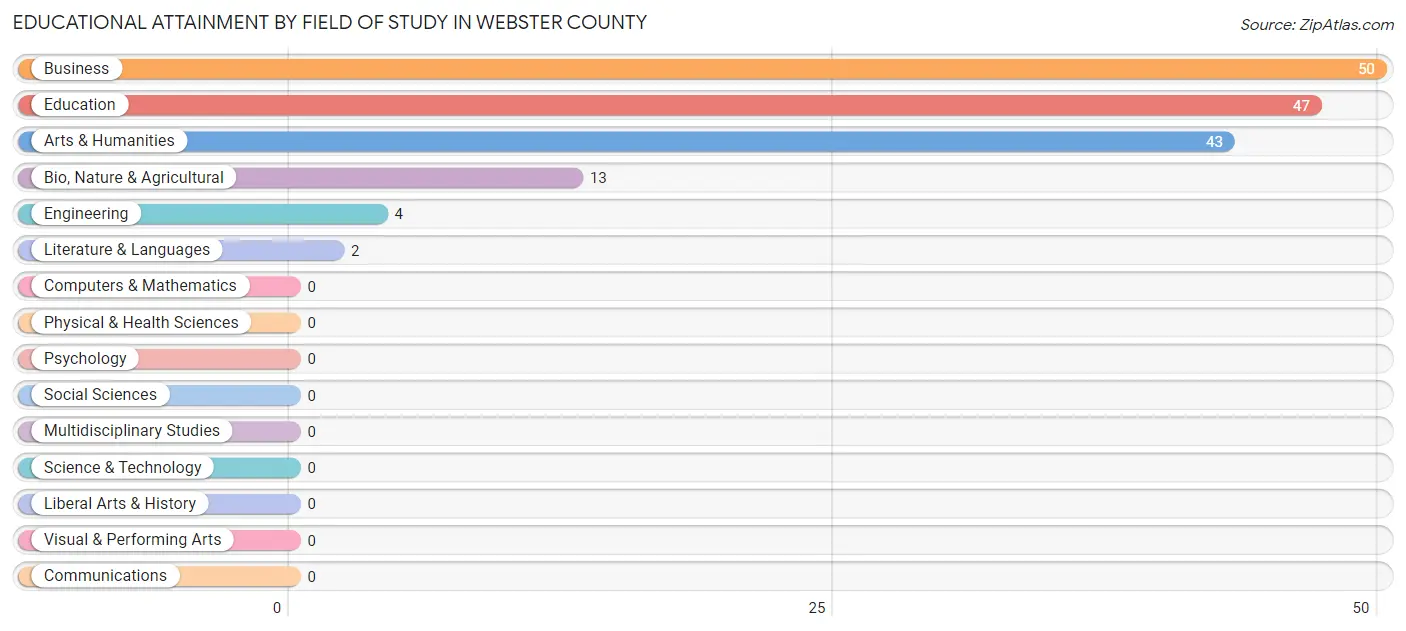
| Field of Study | # Graduates | % Graduates |
| Computers & Mathematics | 0 | 0.0% |
| Bio, Nature & Agricultural | 13 | 8.2% |
| Physical & Health Sciences | 0 | 0.0% |
| Psychology | 0 | 0.0% |
| Social Sciences | 0 | 0.0% |
| Engineering | 4 | 2.5% |
| Multidisciplinary Studies | 0 | 0.0% |
| Science & Technology | 0 | 0.0% |
| Business | 50 | 31.5% |
| Education | 47 | 29.6% |
| Literature & Languages | 2 | 1.3% |
| Liberal Arts & History | 0 | 0.0% |
| Visual & Performing Arts | 0 | 0.0% |
| Communications | 0 | 0.0% |
| Arts & Humanities | 43 | 27.0% |
| Total | 159 | 100.0% |
Transportation & Commute in Webster County
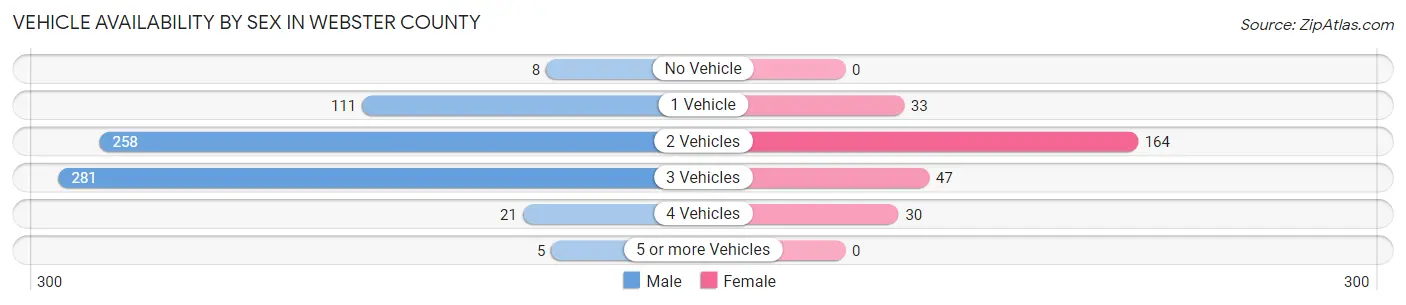
Vehicle Availability by Sex in Webster County
The most prevalent vehicle ownership categories in Webster County are males with 3 vehicles (281, accounting for 41.1%) and females with 3 vehicles (47, making up 102.6%).
| Vehicles Available | Male | Female |
| No Vehicle | 8 (1.2%) | 0 (0.0%) |
| 1 Vehicle | 111 (16.2%) | 33 (12.0%) |
| 2 Vehicles | 258 (37.7%) | 164 (59.9%) |
| 3 Vehicles | 281 (41.1%) | 47 (17.2%) |
| 4 Vehicles | 21 (3.1%) | 30 (11.0%) |
| 5 or more Vehicles | 5 (0.7%) | 0 (0.0%) |
| Total | 684 (100.0%) | 274 (100.0%) |
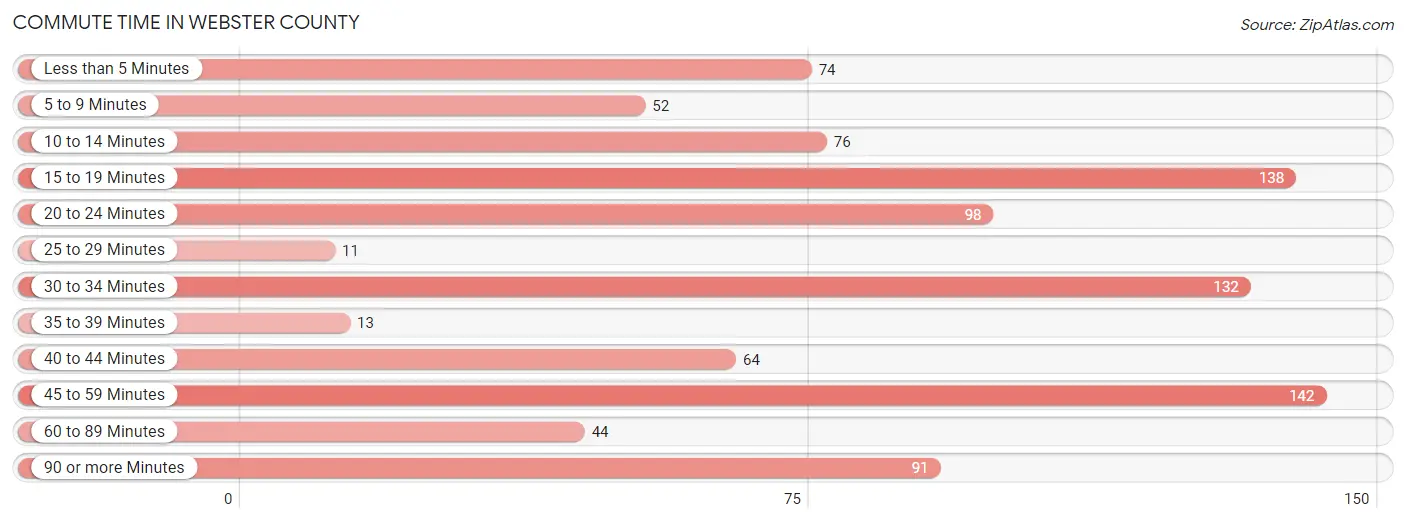
Commute Time in Webster County
The most frequently occuring commute durations in Webster County are 45 to 59 minutes (142 commuters, 15.2%), 15 to 19 minutes (138 commuters, 14.8%), and 30 to 34 minutes (132 commuters, 14.1%).
| Commute Time | # Commuters | % Commuters |
| Less than 5 Minutes | 74 | 7.9% |
| 5 to 9 Minutes | 52 | 5.6% |
| 10 to 14 Minutes | 76 | 8.1% |
| 15 to 19 Minutes | 138 | 14.8% |
| 20 to 24 Minutes | 98 | 10.5% |
| 25 to 29 Minutes | 11 | 1.2% |
| 30 to 34 Minutes | 132 | 14.1% |
| 35 to 39 Minutes | 13 | 1.4% |
| 40 to 44 Minutes | 64 | 6.8% |
| 45 to 59 Minutes | 142 | 15.2% |
| 60 to 89 Minutes | 44 | 4.7% |
| 90 or more Minutes | 91 | 9.7% |
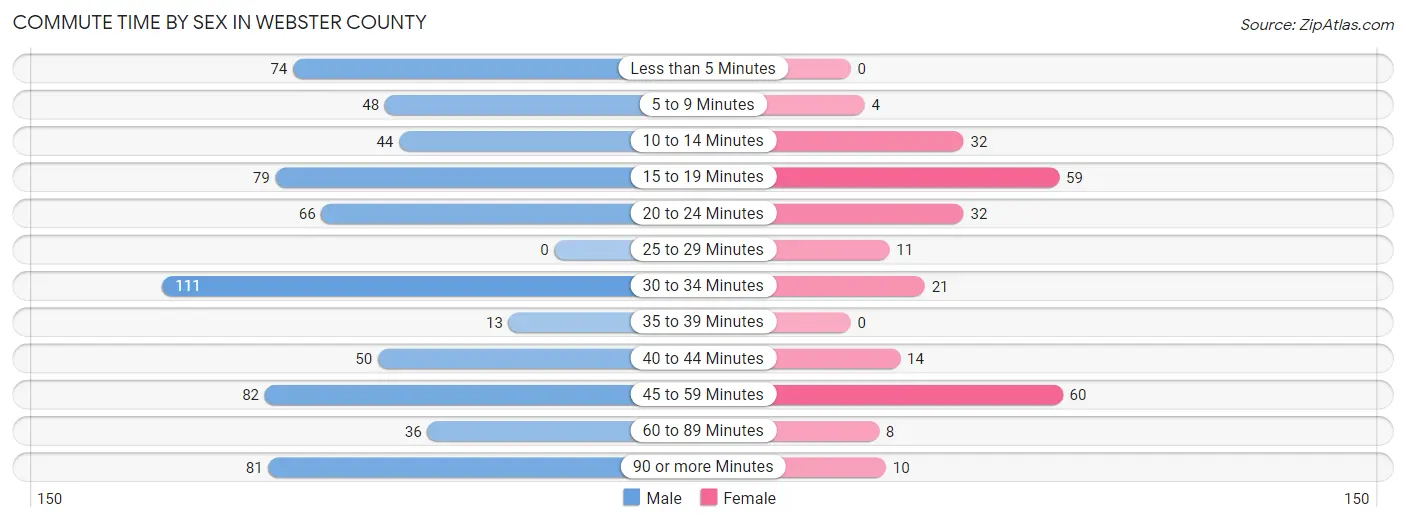
Commute Time by Sex in Webster County
The most common commute times in Webster County are 30 to 34 minutes (111 commuters, 16.2%) for males and 45 to 59 minutes (60 commuters, 23.9%) for females.
| Commute Time | Male | Female |
| Less than 5 Minutes | 74 (10.8%) | 0 (0.0%) |
| 5 to 9 Minutes | 48 (7.0%) | 4 (1.6%) |
| 10 to 14 Minutes | 44 (6.4%) | 32 (12.8%) |
| 15 to 19 Minutes | 79 (11.6%) | 59 (23.5%) |
| 20 to 24 Minutes | 66 (9.7%) | 32 (12.8%) |
| 25 to 29 Minutes | 0 (0.0%) | 11 (4.4%) |
| 30 to 34 Minutes | 111 (16.2%) | 21 (8.4%) |
| 35 to 39 Minutes | 13 (1.9%) | 0 (0.0%) |
| 40 to 44 Minutes | 50 (7.3%) | 14 (5.6%) |
| 45 to 59 Minutes | 82 (12.0%) | 60 (23.9%) |
| 60 to 89 Minutes | 36 (5.3%) | 8 (3.2%) |
| 90 or more Minutes | 81 (11.8%) | 10 (4.0%) |
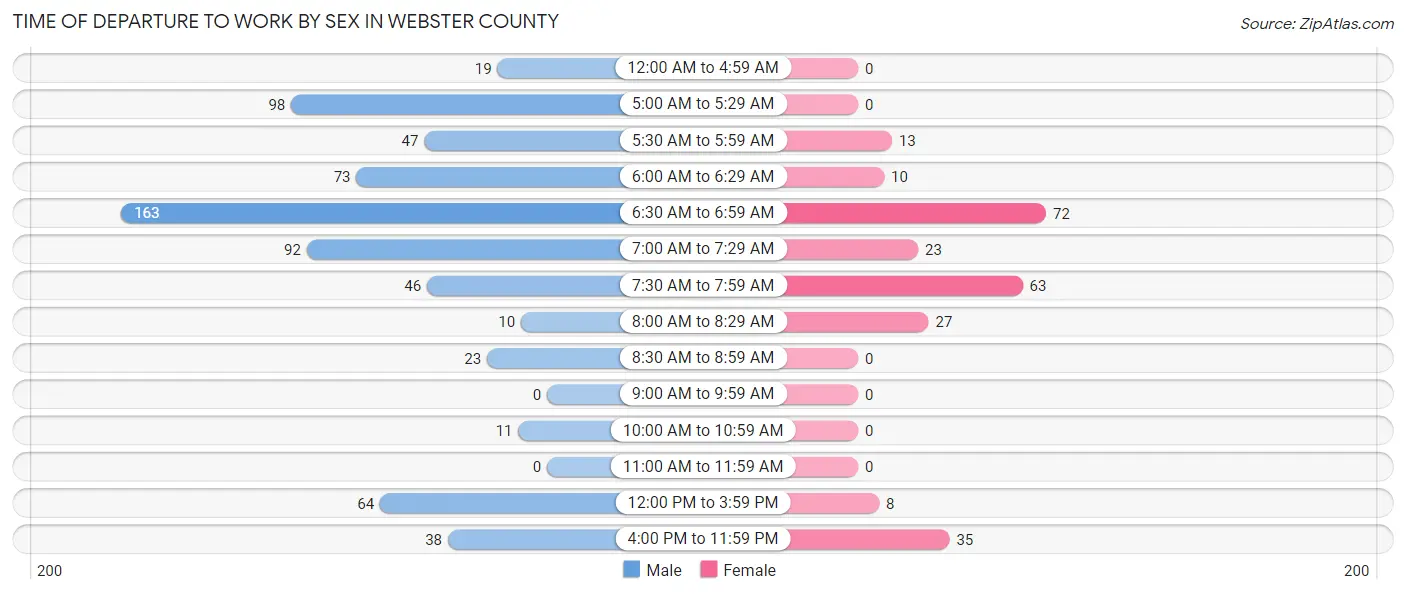
Time of Departure to Work by Sex in Webster County
The most frequent times of departure to work in Webster County are 6:30 AM to 6:59 AM (163, 23.8%) for males and 6:30 AM to 6:59 AM (72, 28.7%) for females.
| Time of Departure | Male | Female |
| 12:00 AM to 4:59 AM | 19 (2.8%) | 0 (0.0%) |
| 5:00 AM to 5:29 AM | 98 (14.3%) | 0 (0.0%) |
| 5:30 AM to 5:59 AM | 47 (6.9%) | 13 (5.2%) |
| 6:00 AM to 6:29 AM | 73 (10.7%) | 10 (4.0%) |
| 6:30 AM to 6:59 AM | 163 (23.8%) | 72 (28.7%) |
| 7:00 AM to 7:29 AM | 92 (13.5%) | 23 (9.2%) |
| 7:30 AM to 7:59 AM | 46 (6.7%) | 63 (25.1%) |
| 8:00 AM to 8:29 AM | 10 (1.5%) | 27 (10.8%) |
| 8:30 AM to 8:59 AM | 23 (3.4%) | 0 (0.0%) |
| 9:00 AM to 9:59 AM | 0 (0.0%) | 0 (0.0%) |
| 10:00 AM to 10:59 AM | 11 (1.6%) | 0 (0.0%) |
| 11:00 AM to 11:59 AM | 0 (0.0%) | 0 (0.0%) |
| 12:00 PM to 3:59 PM | 64 (9.4%) | 8 (3.2%) |
| 4:00 PM to 11:59 PM | 38 (5.6%) | 35 (13.9%) |
| Total | 684 (100.0%) | 251 (100.0%) |
Housing Occupancy in Webster County
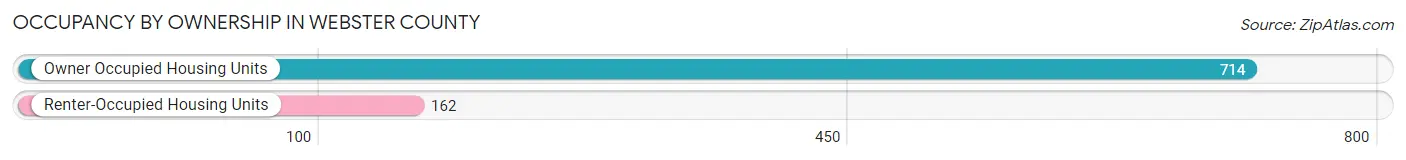
Occupancy by Ownership in Webster County
Of the total 876 dwellings in Webster County, owner-occupied units account for 714 (81.5%), while renter-occupied units make up 162 (18.5%).
| Occupancy | # Housing Units | % Housing Units |
| Owner Occupied Housing Units | 714 | 81.5% |
| Renter-Occupied Housing Units | 162 | 18.5% |
| Total Occupied Housing Units | 876 | 100.0% |
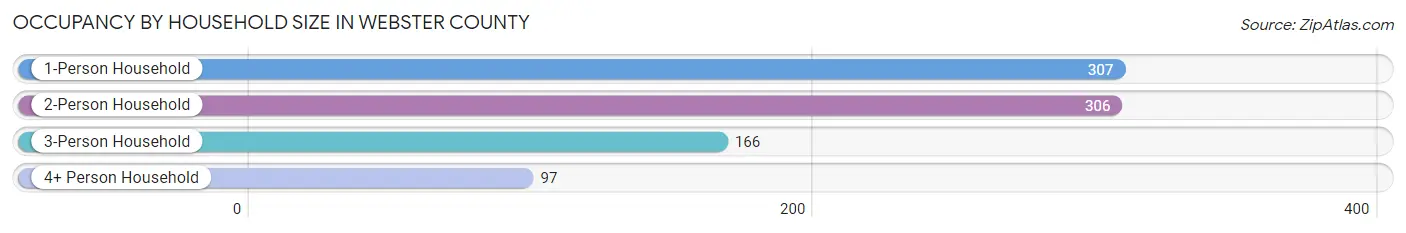
Occupancy by Household Size in Webster County
| Household Size | # Housing Units | % Housing Units |
| 1-Person Household | 307 | 35.0% |
| 2-Person Household | 306 | 34.9% |
| 3-Person Household | 166 | 19.0% |
| 4+ Person Household | 97 | 11.1% |
| Total Housing Units | 876 | 100.0% |
Occupancy by Ownership by Household Size in Webster County
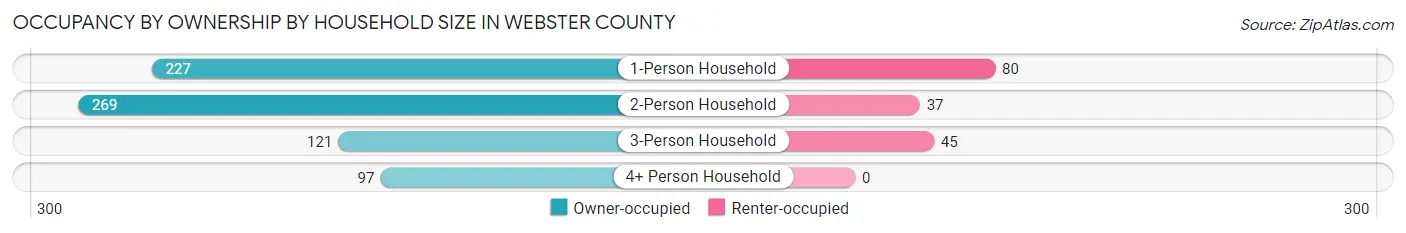
| Household Size | Owner-occupied | Renter-occupied |
| 1-Person Household | 227 (73.9%) | 80 (26.1%) |
| 2-Person Household | 269 (87.9%) | 37 (12.1%) |
| 3-Person Household | 121 (72.9%) | 45 (27.1%) |
| 4+ Person Household | 97 (100.0%) | 0 (0.0%) |
| Total Housing Units | 714 (81.5%) | 162 (18.5%) |
Occupancy by Educational Attainment in Webster County
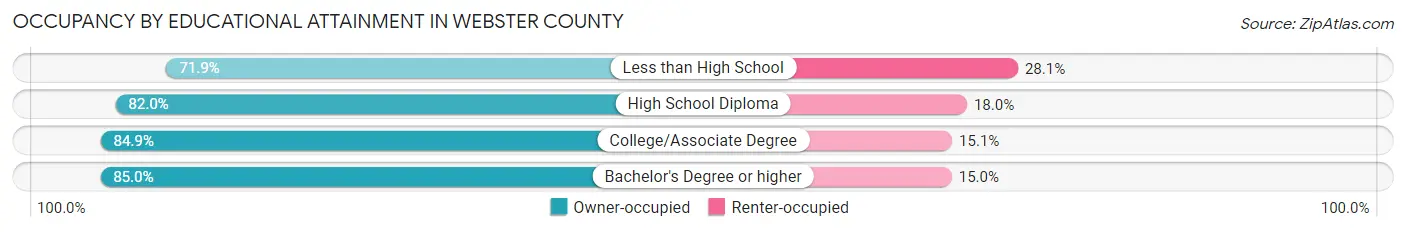
| Household Size | Owner-occupied | Renter-occupied |
| Less than High School | 115 (71.9%) | 45 (28.1%) |
| High School Diploma | 255 (82.0%) | 56 (18.0%) |
| College/Associate Degree | 310 (84.9%) | 55 (15.1%) |
| Bachelor's Degree or higher | 34 (85.0%) | 6 (15.0%) |
Occupancy by Age of Householder in Webster County
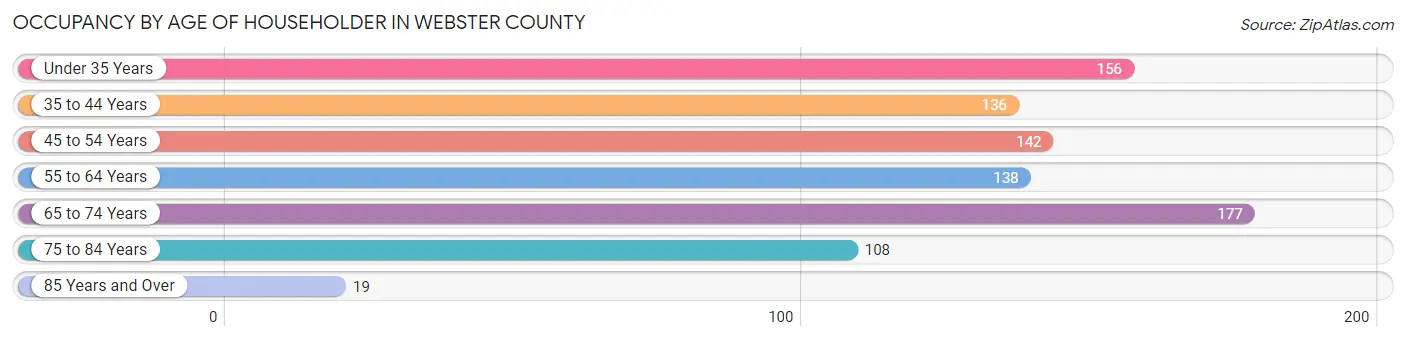
| Age Bracket | # Households | % Households |
| Under 35 Years | 156 | 17.8% |
| 35 to 44 Years | 136 | 15.5% |
| 45 to 54 Years | 142 | 16.2% |
| 55 to 64 Years | 138 | 15.8% |
| 65 to 74 Years | 177 | 20.2% |
| 75 to 84 Years | 108 | 12.3% |
| 85 Years and Over | 19 | 2.2% |
| Total | 876 | 100.0% |
Housing Finances in Webster County
Median Income by Occupancy in Webster County
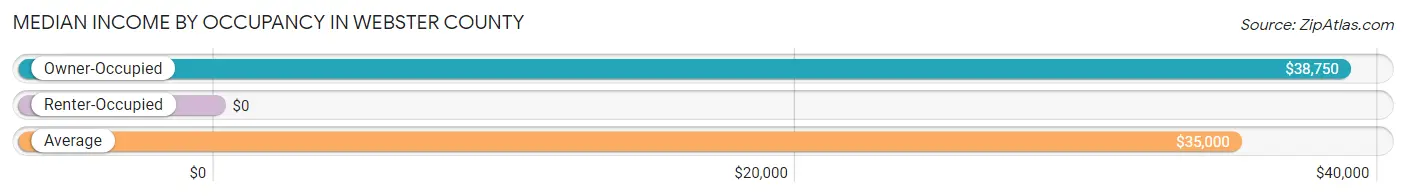
| Occupancy Type | # Households | Median Income |
| Owner-Occupied | 714 (81.5%) | $38,750 |
| Renter-Occupied | 162 (18.5%) | $0 |
| Average | 876 (100.0%) | $35,000 |
Occupancy by Householder Income Bracket in Webster County
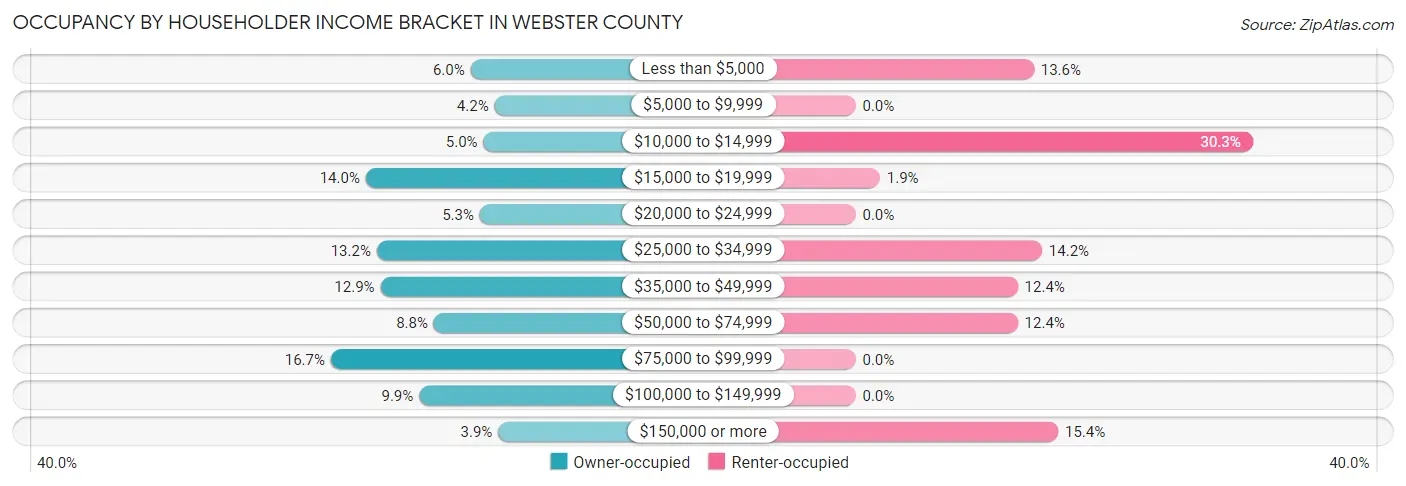
| Income Bracket | Owner-occupied | Renter-occupied |
| Less than $5,000 | 43 (6.0%) | 22 (13.6%) |
| $5,000 to $9,999 | 30 (4.2%) | 0 (0.0%) |
| $10,000 to $14,999 | 36 (5.0%) | 49 (30.2%) |
| $15,000 to $19,999 | 100 (14.0%) | 3 (1.8%) |
| $20,000 to $24,999 | 38 (5.3%) | 0 (0.0%) |
| $25,000 to $34,999 | 94 (13.2%) | 23 (14.2%) |
| $35,000 to $49,999 | 92 (12.9%) | 20 (12.3%) |
| $50,000 to $74,999 | 63 (8.8%) | 20 (12.3%) |
| $75,000 to $99,999 | 119 (16.7%) | 0 (0.0%) |
| $100,000 to $149,999 | 71 (9.9%) | 0 (0.0%) |
| $150,000 or more | 28 (3.9%) | 25 (15.4%) |
| Total | 714 (100.0%) | 162 (100.0%) |
Monthly Housing Cost Tiers in Webster County
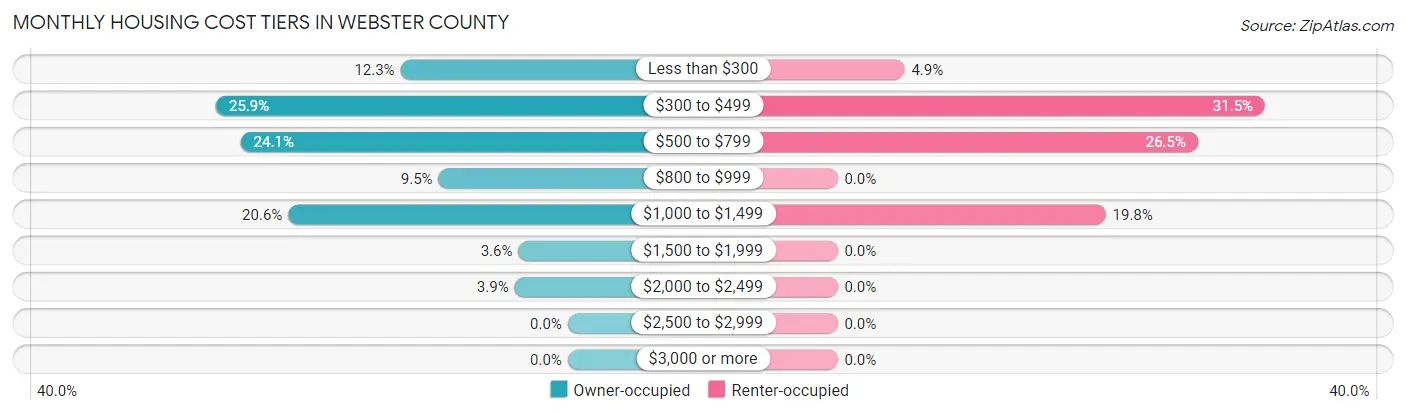
| Monthly Cost | Owner-occupied | Renter-occupied |
| Less than $300 | 88 (12.3%) | 8 (4.9%) |
| $300 to $499 | 185 (25.9%) | 51 (31.5%) |
| $500 to $799 | 172 (24.1%) | 43 (26.5%) |
| $800 to $999 | 68 (9.5%) | 0 (0.0%) |
| $1,000 to $1,499 | 147 (20.6%) | 32 (19.8%) |
| $1,500 to $1,999 | 26 (3.6%) | 0 (0.0%) |
| $2,000 to $2,499 | 28 (3.9%) | 0 (0.0%) |
| $2,500 to $2,999 | 0 (0.0%) | 0 (0.0%) |
| $3,000 or more | 0 (0.0%) | 0 (0.0%) |
| Total | 714 (100.0%) | 162 (100.0%) |
Physical Housing Characteristics in Webster County
Housing Structures in Webster County
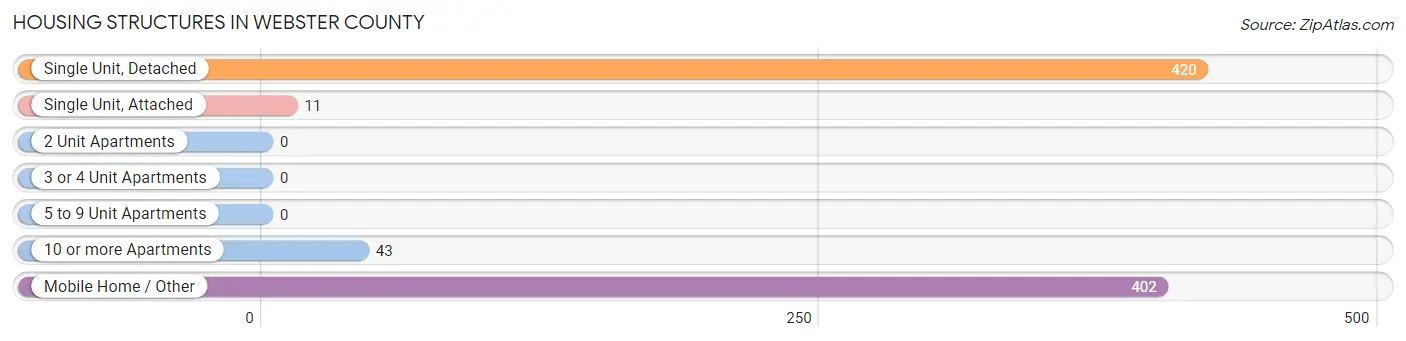
| Structure Type | # Housing Units | % Housing Units |
| Single Unit, Detached | 420 | 47.9% |
| Single Unit, Attached | 11 | 1.3% |
| 2 Unit Apartments | 0 | 0.0% |
| 3 or 4 Unit Apartments | 0 | 0.0% |
| 5 to 9 Unit Apartments | 0 | 0.0% |
| 10 or more Apartments | 43 | 4.9% |
| Mobile Home / Other | 402 | 45.9% |
| Total | 876 | 100.0% |
Housing Structures by Occupancy in Webster County
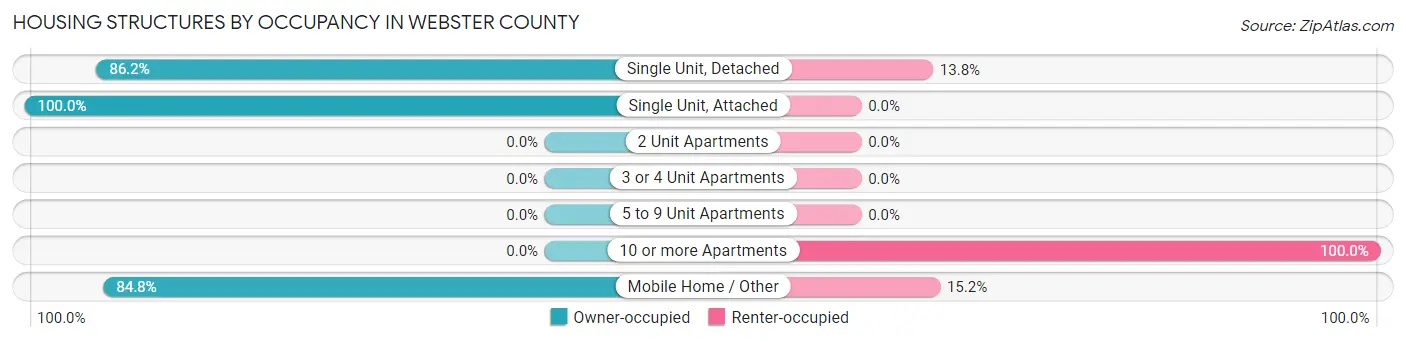
| Structure Type | Owner-occupied | Renter-occupied |
| Single Unit, Detached | 362 (86.2%) | 58 (13.8%) |
| Single Unit, Attached | 11 (100.0%) | 0 (0.0%) |
| 2 Unit Apartments | 0 (0.0%) | 0 (0.0%) |
| 3 or 4 Unit Apartments | 0 (0.0%) | 0 (0.0%) |
| 5 to 9 Unit Apartments | 0 (0.0%) | 0 (0.0%) |
| 10 or more Apartments | 0 (0.0%) | 43 (100.0%) |
| Mobile Home / Other | 341 (84.8%) | 61 (15.2%) |
| Total | 714 (81.5%) | 162 (18.5%) |
Housing Structures by Number of Rooms in Webster County
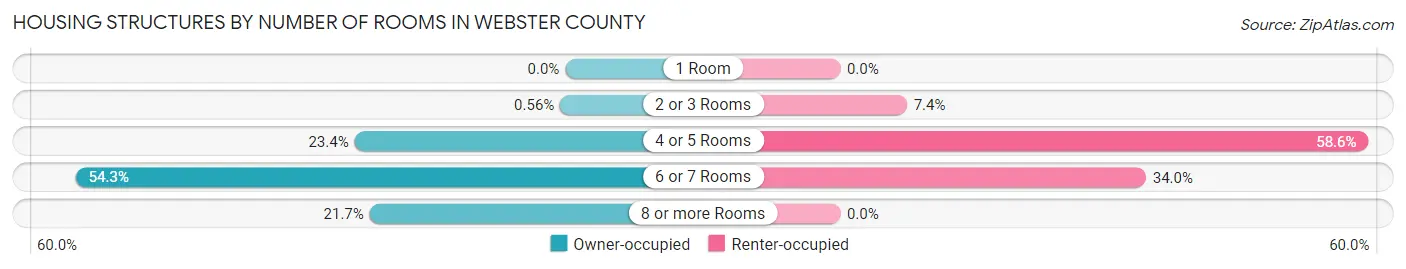
| Number of Rooms | Owner-occupied | Renter-occupied |
| 1 Room | 0 (0.0%) | 0 (0.0%) |
| 2 or 3 Rooms | 4 (0.6%) | 12 (7.4%) |
| 4 or 5 Rooms | 167 (23.4%) | 95 (58.6%) |
| 6 or 7 Rooms | 388 (54.3%) | 55 (34.0%) |
| 8 or more Rooms | 155 (21.7%) | 0 (0.0%) |
| Total | 714 (100.0%) | 162 (100.0%) |
Housing Structure by Heating Type in Webster County
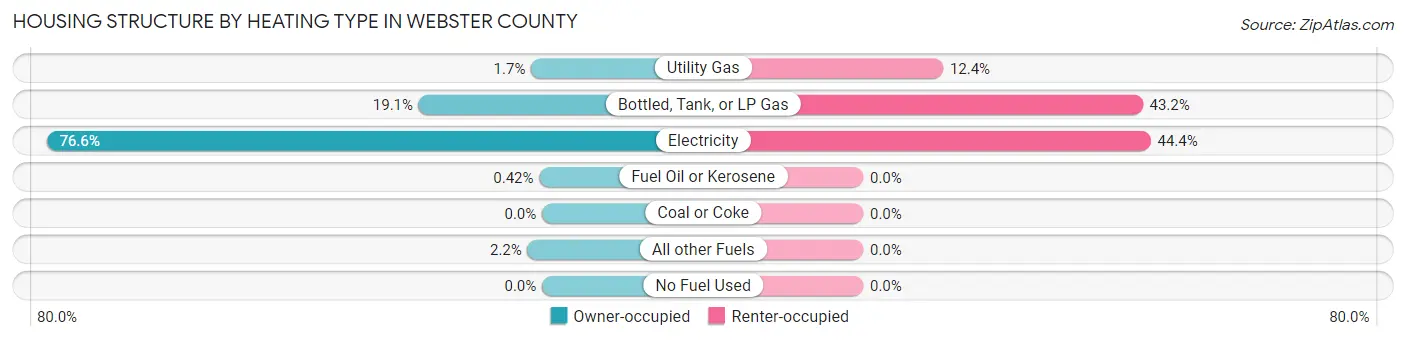
| Heating Type | Owner-occupied | Renter-occupied |
| Utility Gas | 12 (1.7%) | 20 (12.3%) |
| Bottled, Tank, or LP Gas | 136 (19.1%) | 70 (43.2%) |
| Electricity | 547 (76.6%) | 72 (44.4%) |
| Fuel Oil or Kerosene | 3 (0.4%) | 0 (0.0%) |
| Coal or Coke | 0 (0.0%) | 0 (0.0%) |
| All other Fuels | 16 (2.2%) | 0 (0.0%) |
| No Fuel Used | 0 (0.0%) | 0 (0.0%) |
| Total | 714 (100.0%) | 162 (100.0%) |
Household Vehicle Usage in Webster County
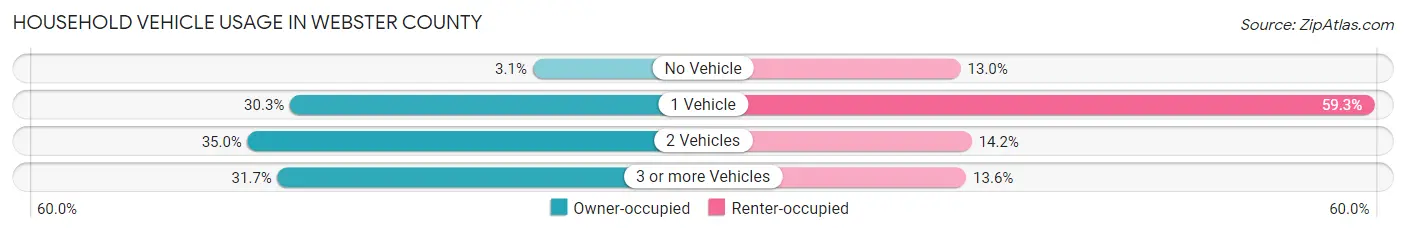
| Vehicles per Household | Owner-occupied | Renter-occupied |
| No Vehicle | 22 (3.1%) | 21 (13.0%) |
| 1 Vehicle | 216 (30.2%) | 96 (59.3%) |
| 2 Vehicles | 250 (35.0%) | 23 (14.2%) |
| 3 or more Vehicles | 226 (31.7%) | 22 (13.6%) |
| Total | 714 (100.0%) | 162 (100.0%) |
Real Estate & Mortgages in Webster County
Real Estate and Mortgage Overview in Webster County
| Characteristic | Without Mortgage | With Mortgage |
| Housing Units | 389 | 325 |
| Median Property Value | $64,700 | $92,500 |
| Median Household Income | $41,438 | $6 |
| Monthly Housing Costs | $413 | $0 |
| Real Estate Taxes | $818 | $30 |
Property Value by Mortgage Status in Webster County
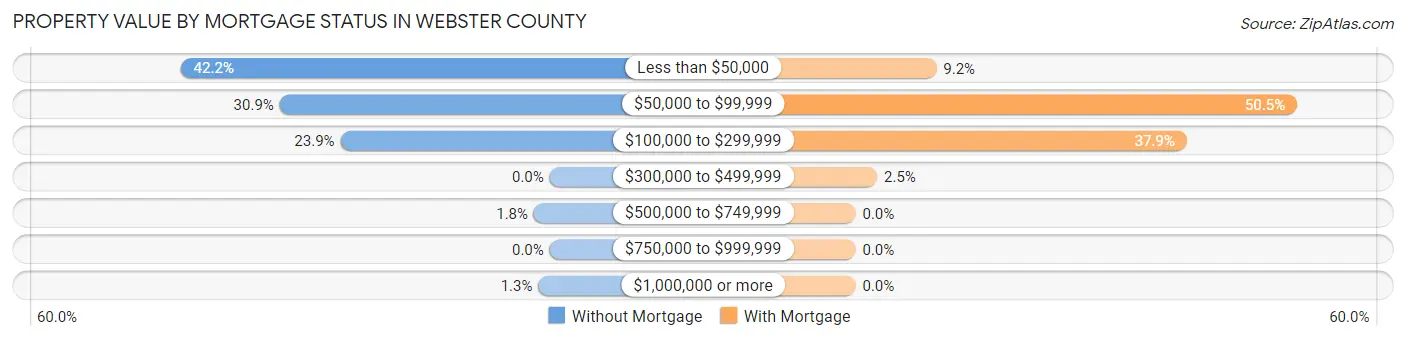
| Property Value | Without Mortgage | With Mortgage |
| Less than $50,000 | 164 (42.2%) | 30 (9.2%) |
| $50,000 to $99,999 | 120 (30.8%) | 164 (50.5%) |
| $100,000 to $299,999 | 93 (23.9%) | 123 (37.9%) |
| $300,000 to $499,999 | 0 (0.0%) | 8 (2.5%) |
| $500,000 to $749,999 | 7 (1.8%) | 0 (0.0%) |
| $750,000 to $999,999 | 0 (0.0%) | 0 (0.0%) |
| $1,000,000 or more | 5 (1.3%) | 0 (0.0%) |
| Total | 389 (100.0%) | 325 (100.0%) |
Household Income by Mortgage Status in Webster County
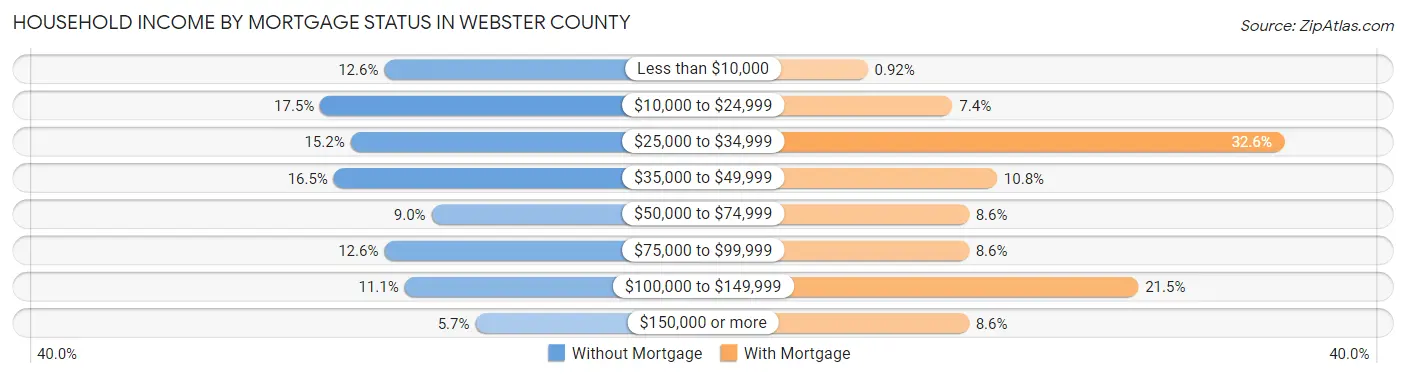
| Household Income | Without Mortgage | With Mortgage |
| Less than $10,000 | 49 (12.6%) | 3 (0.9%) |
| $10,000 to $24,999 | 68 (17.5%) | 24 (7.4%) |
| $25,000 to $34,999 | 59 (15.2%) | 106 (32.6%) |
| $35,000 to $49,999 | 64 (16.5%) | 35 (10.8%) |
| $50,000 to $74,999 | 35 (9.0%) | 28 (8.6%) |
| $75,000 to $99,999 | 49 (12.6%) | 28 (8.6%) |
| $100,000 to $149,999 | 43 (11.1%) | 70 (21.5%) |
| $150,000 or more | 22 (5.7%) | 28 (8.6%) |
| Total | 389 (100.0%) | 325 (100.0%) |
Property Value to Household Income Ratio in Webster County
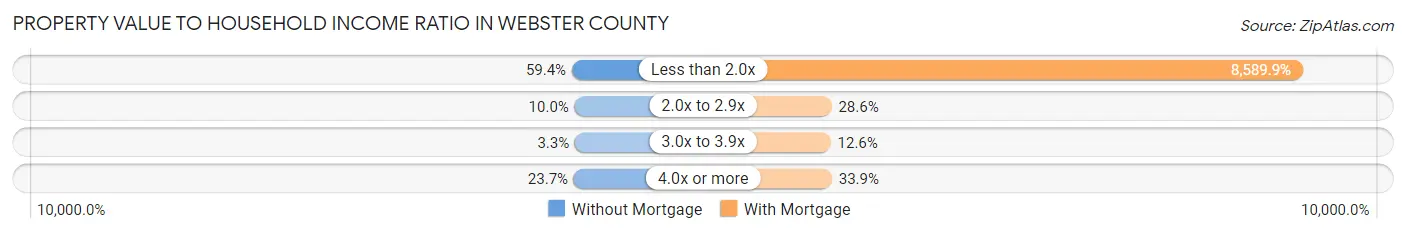
| Value-to-Income Ratio | Without Mortgage | With Mortgage |
| Less than 2.0x | 231 (59.4%) | 27,917 (8,589.8%) |
| 2.0x to 2.9x | 39 (10.0%) | 93 (28.6%) |
| 3.0x to 3.9x | 13 (3.3%) | 41 (12.6%) |
| 4.0x or more | 92 (23.6%) | 110 (33.9%) |
| Total | 389 (100.0%) | 325 (100.0%) |
Real Estate Taxes by Mortgage Status in Webster County
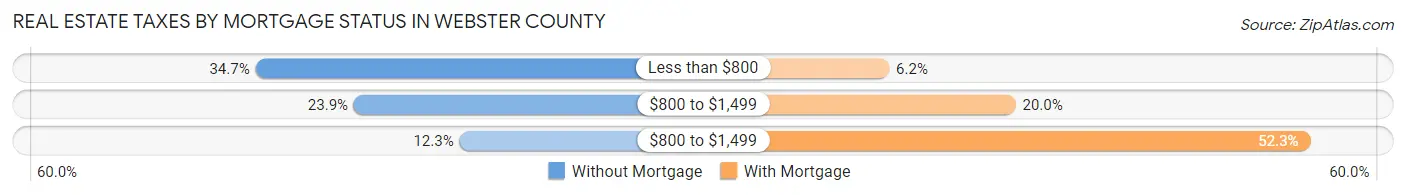
| Property Taxes | Without Mortgage | With Mortgage |
| Less than $800 | 135 (34.7%) | 20 (6.1%) |
| $800 to $1,499 | 93 (23.9%) | 65 (20.0%) |
| $800 to $1,499 | 48 (12.3%) | 170 (52.3%) |
| Total | 389 (100.0%) | 325 (100.0%) |
Health & Disability in Webster County
Health Insurance Coverage by Age in Webster County
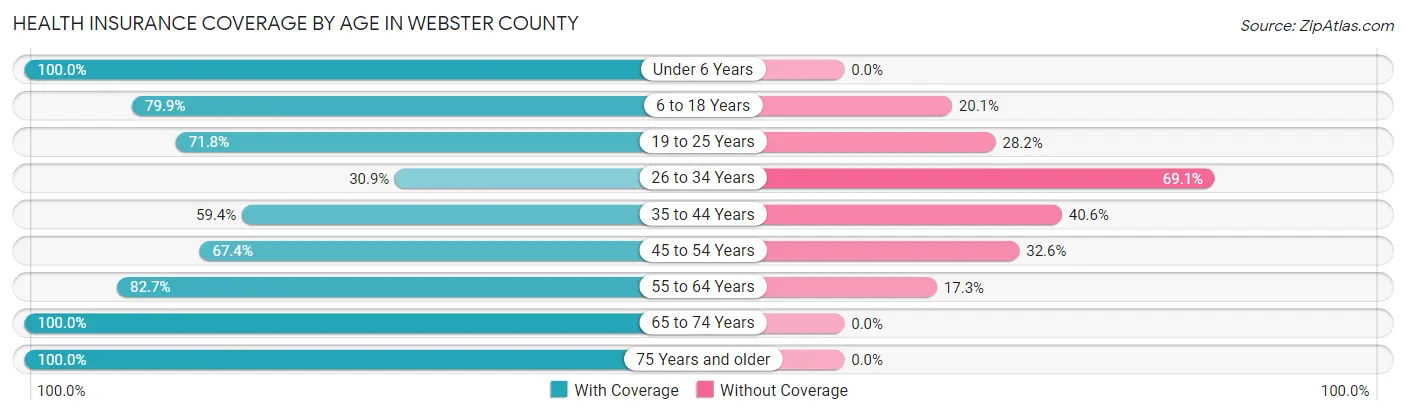
| Age Bracket | With Coverage | Without Coverage |
| Under 6 Years | 104 (100.0%) | 0 (0.0%) |
| 6 to 18 Years | 259 (79.9%) | 65 (20.1%) |
| 19 to 25 Years | 257 (71.8%) | 101 (28.2%) |
| 26 to 34 Years | 38 (30.9%) | 85 (69.1%) |
| 35 to 44 Years | 233 (59.4%) | 159 (40.6%) |
| 45 to 54 Years | 256 (67.4%) | 124 (32.6%) |
| 55 to 64 Years | 206 (82.7%) | 43 (17.3%) |
| 65 to 74 Years | 252 (100.0%) | 0 (0.0%) |
| 75 Years and older | 168 (100.0%) | 0 (0.0%) |
| Total | 1,773 (75.4%) | 577 (24.5%) |
Health Insurance Coverage by Citizenship Status in Webster County
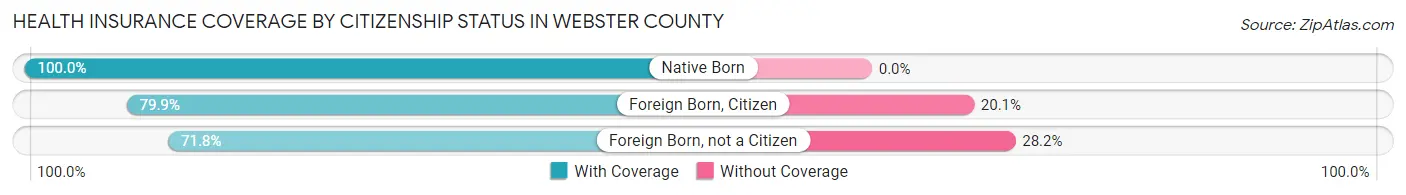
| Citizenship Status | With Coverage | Without Coverage |
| Native Born | 104 (100.0%) | 0 (0.0%) |
| Foreign Born, Citizen | 259 (79.9%) | 65 (20.1%) |
| Foreign Born, not a Citizen | 257 (71.8%) | 101 (28.2%) |
Health Insurance Coverage by Household Income in Webster County
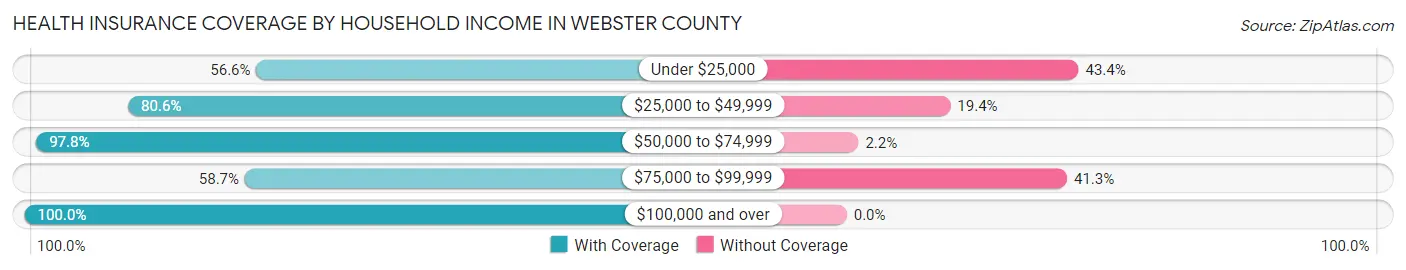
| Household Income | With Coverage | Without Coverage |
| Under $25,000 | 331 (56.6%) | 254 (43.4%) |
| $25,000 to $49,999 | 573 (80.6%) | 138 (19.4%) |
| $50,000 to $74,999 | 134 (97.8%) | 3 (2.2%) |
| $75,000 to $99,999 | 259 (58.7%) | 182 (41.3%) |
| $100,000 and over | 476 (100.0%) | 0 (0.0%) |
Public vs Private Health Insurance Coverage by Age in Webster County
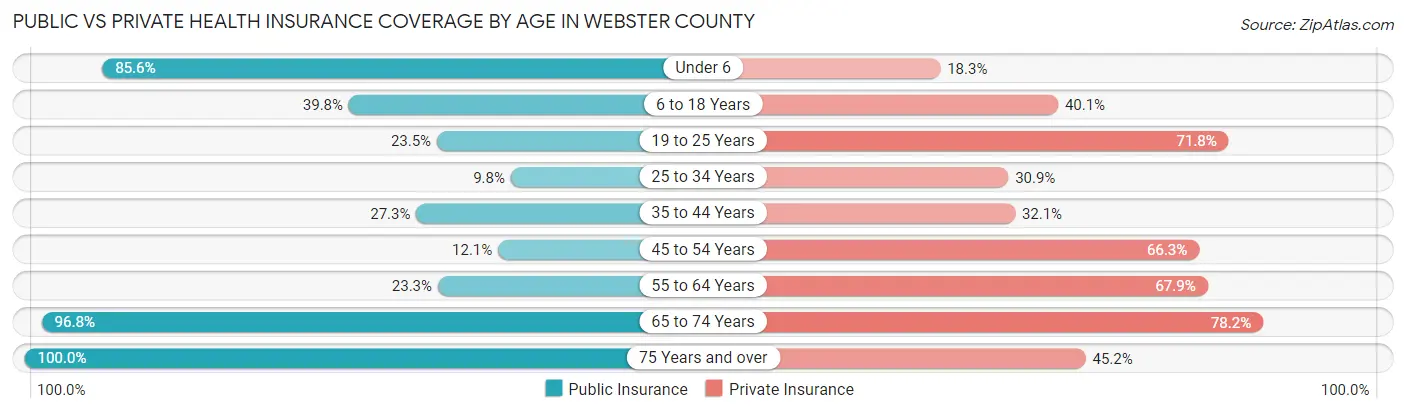
| Age Bracket | Public Insurance | Private Insurance |
| Under 6 | 89 (85.6%) | 19 (18.3%) |
| 6 to 18 Years | 129 (39.8%) | 130 (40.1%) |
| 19 to 25 Years | 84 (23.5%) | 257 (71.8%) |
| 25 to 34 Years | 12 (9.8%) | 38 (30.9%) |
| 35 to 44 Years | 107 (27.3%) | 126 (32.1%) |
| 45 to 54 Years | 46 (12.1%) | 252 (66.3%) |
| 55 to 64 Years | 58 (23.3%) | 169 (67.9%) |
| 65 to 74 Years | 244 (96.8%) | 197 (78.2%) |
| 75 Years and over | 168 (100.0%) | 76 (45.2%) |
| Total | 937 (39.9%) | 1,264 (53.8%) |
Disability Status by Sex by Age in Webster County
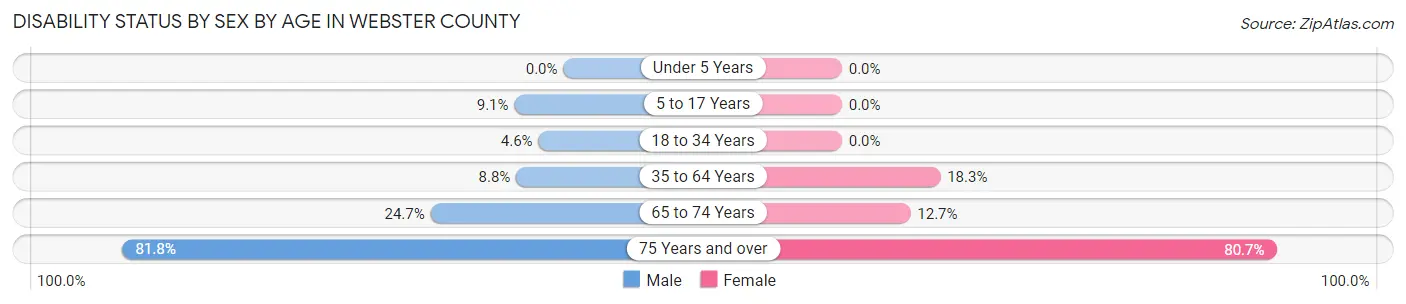
| Age Bracket | Male | Female |
| Under 5 Years | 0 (0.0%) | 0 (0.0%) |
| 5 to 17 Years | 15 (9.1%) | 0 (0.0%) |
| 18 to 34 Years | 12 (4.6%) | 0 (0.0%) |
| 35 to 64 Years | 52 (8.7%) | 78 (18.3%) |
| 65 to 74 Years | 35 (24.6%) | 14 (12.7%) |
| 75 Years and over | 36 (81.8%) | 100 (80.6%) |
Disability Class by Sex by Age in Webster County
Disability Class: Hearing Difficulty
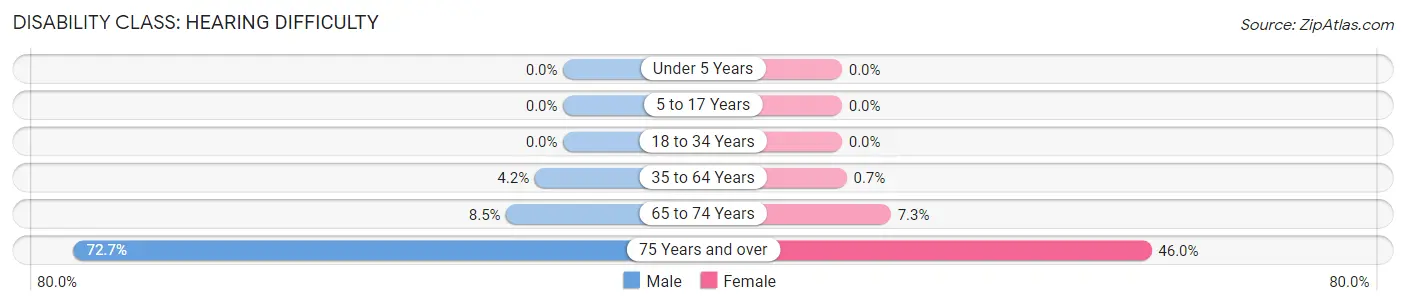
| Age Bracket | Male | Female |
| Under 5 Years | 0 (0.0%) | 0 (0.0%) |
| 5 to 17 Years | 0 (0.0%) | 0 (0.0%) |
| 18 to 34 Years | 0 (0.0%) | 0 (0.0%) |
| 35 to 64 Years | 25 (4.2%) | 3 (0.7%) |
| 65 to 74 Years | 12 (8.5%) | 8 (7.3%) |
| 75 Years and over | 32 (72.7%) | 57 (46.0%) |
Disability Class: Vision Difficulty
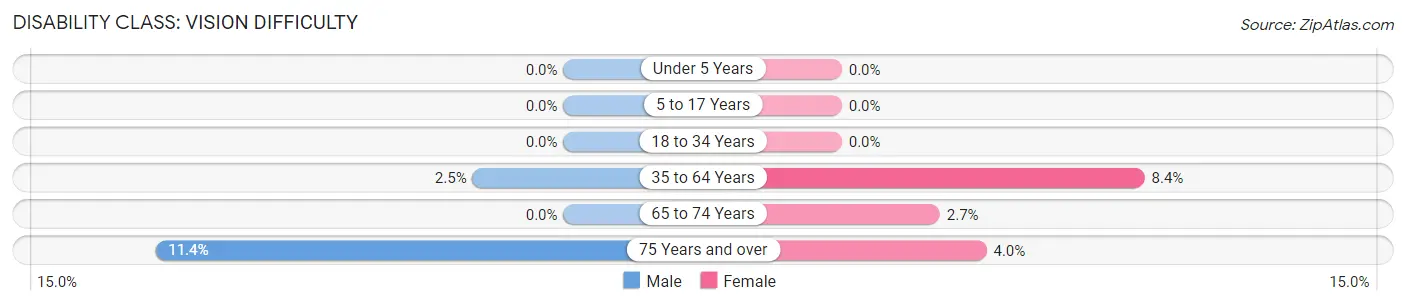
| Age Bracket | Male | Female |
| Under 5 Years | 0 (0.0%) | 0 (0.0%) |
| 5 to 17 Years | 0 (0.0%) | 0 (0.0%) |
| 18 to 34 Years | 0 (0.0%) | 0 (0.0%) |
| 35 to 64 Years | 15 (2.5%) | 36 (8.4%) |
| 65 to 74 Years | 0 (0.0%) | 3 (2.7%) |
| 75 Years and over | 5 (11.4%) | 5 (4.0%) |
Disability Class: Cognitive Difficulty
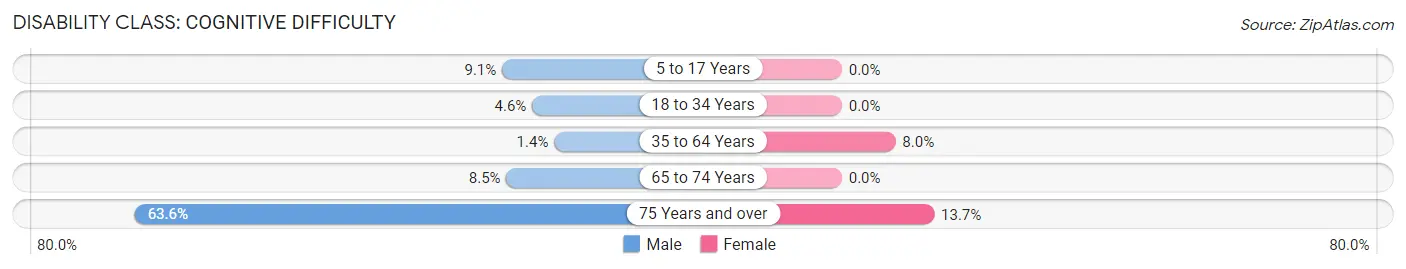
| Age Bracket | Male | Female |
| 5 to 17 Years | 15 (9.1%) | 0 (0.0%) |
| 18 to 34 Years | 12 (4.6%) | 0 (0.0%) |
| 35 to 64 Years | 8 (1.3%) | 34 (8.0%) |
| 65 to 74 Years | 12 (8.5%) | 0 (0.0%) |
| 75 Years and over | 28 (63.6%) | 17 (13.7%) |
Disability Class: Ambulatory Difficulty
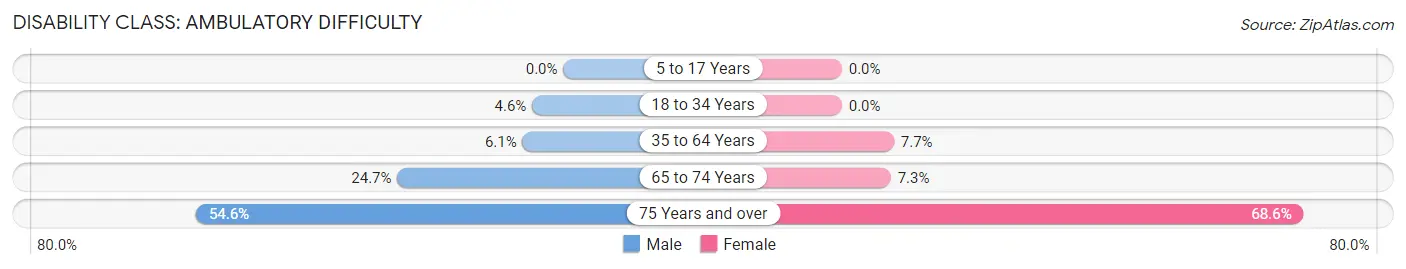
| Age Bracket | Male | Female |
| 5 to 17 Years | 0 (0.0%) | 0 (0.0%) |
| 18 to 34 Years | 12 (4.6%) | 0 (0.0%) |
| 35 to 64 Years | 36 (6.1%) | 33 (7.7%) |
| 65 to 74 Years | 35 (24.6%) | 8 (7.3%) |
| 75 Years and over | 24 (54.5%) | 85 (68.5%) |
Disability Class: Self-Care Difficulty
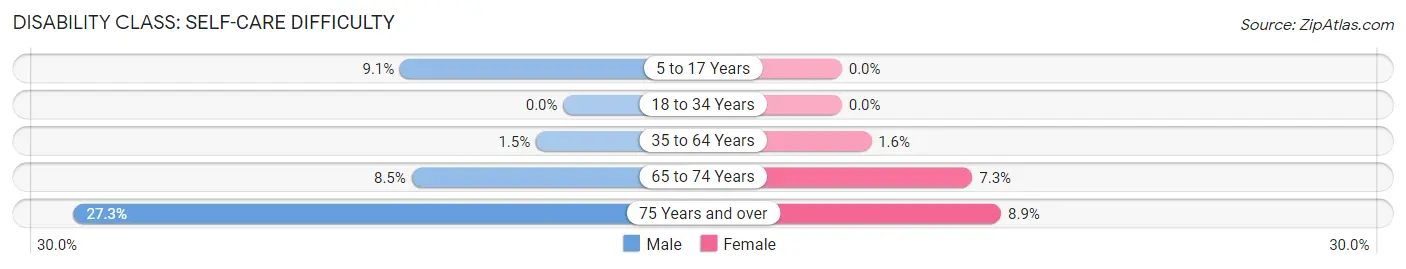
| Age Bracket | Male | Female |
| 5 to 17 Years | 15 (9.1%) | 0 (0.0%) |
| 18 to 34 Years | 0 (0.0%) | 0 (0.0%) |
| 35 to 64 Years | 9 (1.5%) | 7 (1.6%) |
| 65 to 74 Years | 12 (8.5%) | 8 (7.3%) |
| 75 Years and over | 12 (27.3%) | 11 (8.9%) |
Technology Access in Webster County
Computing Device Access in Webster County
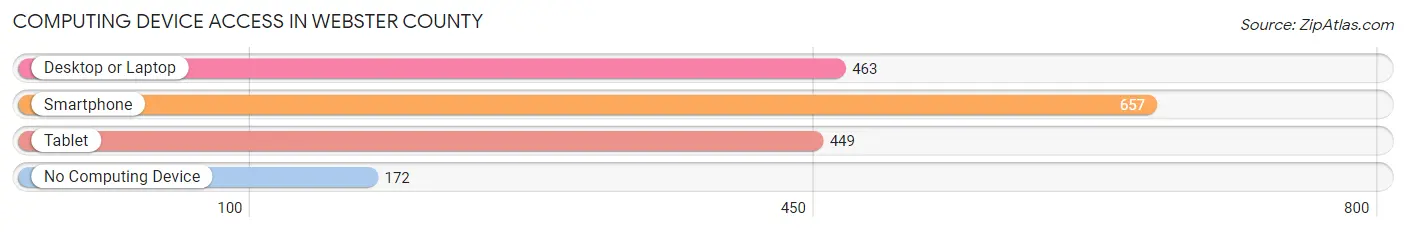
| Device Type | # Households | % Households |
| Desktop or Laptop | 463 | 52.8% |
| Smartphone | 657 | 75.0% |
| Tablet | 449 | 51.3% |
| No Computing Device | 172 | 19.6% |
| Total | 876 | 100.0% |
Internet Access in Webster County

| Internet Type | # Households | % Households |
| Dial-Up Internet | 3 | 0.3% |
| Broadband Home | 290 | 33.1% |
| Cellular Data Only | 209 | 23.9% |
| Satellite Internet | 200 | 22.8% |
| No Internet | 259 | 29.6% |
| Total | 876 | 100.0% |
Webster County Summary
Webster County is a county located in the state of Georgia, United States. As of the 2010 census, the population was 2,799. The county seat is Preston. The county was created on December 16, 1853 and named for Daniel Webster, an American statesman and senator from Massachusetts.
Geography
Webster County is located in the southeastern corner of Georgia, and is bordered by the states of Alabama and Florida. It is part of the Albany, Georgia Metropolitan Statistical Area. The county has a total area of 441 square miles, of which 439 square miles is land and 2.2 square miles (0.5%) is water.
The county is located in the flatwoods region of the state, and is mostly covered in pine and hardwood forests. The Flint River runs through the county, and is a major source of recreation and fishing. The county is also home to several small lakes, including Lake Blackshear, which is a popular destination for boating and fishing.
Demographics
As of the 2010 census, there were 2,799 people, 1,093 households, and 790 families residing in the county. The population density was 6.4 people per square mile. There were 1,269 housing units at an average density of 2.9 per square mile. The racial makeup of the county was 68.3% White, 28.3% Black or African American, 0.3% Native American, 0.3% Asian, 0.1% Pacific Islander, 0.7% from other races, and 1.4% from two or more races. 2.3% of the population were Hispanic or Latino of any race.
There were 1,093 households, out of which 28.2% had children under the age of 18 living with them, 54.2% were married couples living together, 13.2% had a female householder with no husband present, and 28.2% were non-families. 24.2% of all households were made up of individuals, and 11.2% had someone living alone who was 65 years of age or older. The average household size was 2.56 and the average family size was 3.02.
In the county, the population was spread out, with 24.2% under the age of 18, 8.2% from 18 to 24, 25.2% from 25 to 44, 26.2% from 45 to 64, and 16.2% who were 65 years of age or older. The median age was 39 years. For every 100 females there were 95.2 males. For every 100 females age 18 and over, there were 92.2 males.
The median income for a household in the county was $30,938, and the median income for a family was $36,250. Males had a median income of $30,000 versus $20,000 for females. The per capita income for the county was $14,945. About 16.2% of families and 19.2% of the population were below the poverty line, including 25.2% of those under age 18 and 16.2% of those age 65 or over.
Economy
The economy of Webster County is largely based on agriculture and forestry. The county is home to several large timber companies, and the timber industry is the largest employer in the county. Other major industries include poultry farming, cattle ranching, and vegetable farming.
The county is also home to several small businesses, including restaurants, retail stores, and service providers. The county is served by several state and federal highways, and is located near the cities of Albany and Valdosta.
Conclusion
Webster County is a rural county located in the southeastern corner of Georgia. The county is home to a diverse population, and the economy is largely based on agriculture and forestry. The county is served by several state and federal highways, and is located near the cities of Albany and Valdosta. The county is home to several small businesses, and is a popular destination for outdoor recreation and fishing.
Common Questions
What is Per Capita Income in Webster County?
Per Capita income in Webster County is $22,246.
What is the Median Family Income in Webster County?
Median Family Income in Webster County is $54,420.
What is the Median Household income in Webster County?
Median Household Income in Webster County is $35,000.
What is Income or Wage Gap in Webster County?
Income or Wage Gap in Webster County is 24.3%.
Women in Webster County earn 75.7 cents for every dollar earned by a man.
What is Inequality or Gini Index in Webster County?
Inequality or Gini Index in Webster County is 0.47.
What is the Total Population of Webster County?
Total Population of Webster County is 2,354.
What is the Total Male Population of Webster County?
Total Male Population of Webster County is 1,208.
What is the Total Female Population of Webster County?
Total Female Population of Webster County is 1,146.
What is the Ratio of Males per 100 Females in Webster County?
There are 105.41 Males per 100 Females in Webster County.
What is the Ratio of Females per 100 Males in Webster County?
There are 94.87 Females per 100 Males in Webster County.
What is the Median Population Age in Webster County?
Median Population Age in Webster County is 42.6 Years.
What is the Average Family Size in Webster County
Average Family Size in Webster County is 3.6 People.
What is the Average Household Size in Webster County
Average Household Size in Webster County is 2.7 People.
How Large is the Labor Force in Webster County?
There are 1,091 People in the Labor Forcein in Webster County.
What is the Percentage of People in the Labor Force in Webster County?
55.5% of People are in the Labor Force in Webster County.
What is the Unemployment Rate in Webster County?
Unemployment Rate in Webster County is 8.9%.