Troup County, GA Map & Demographics
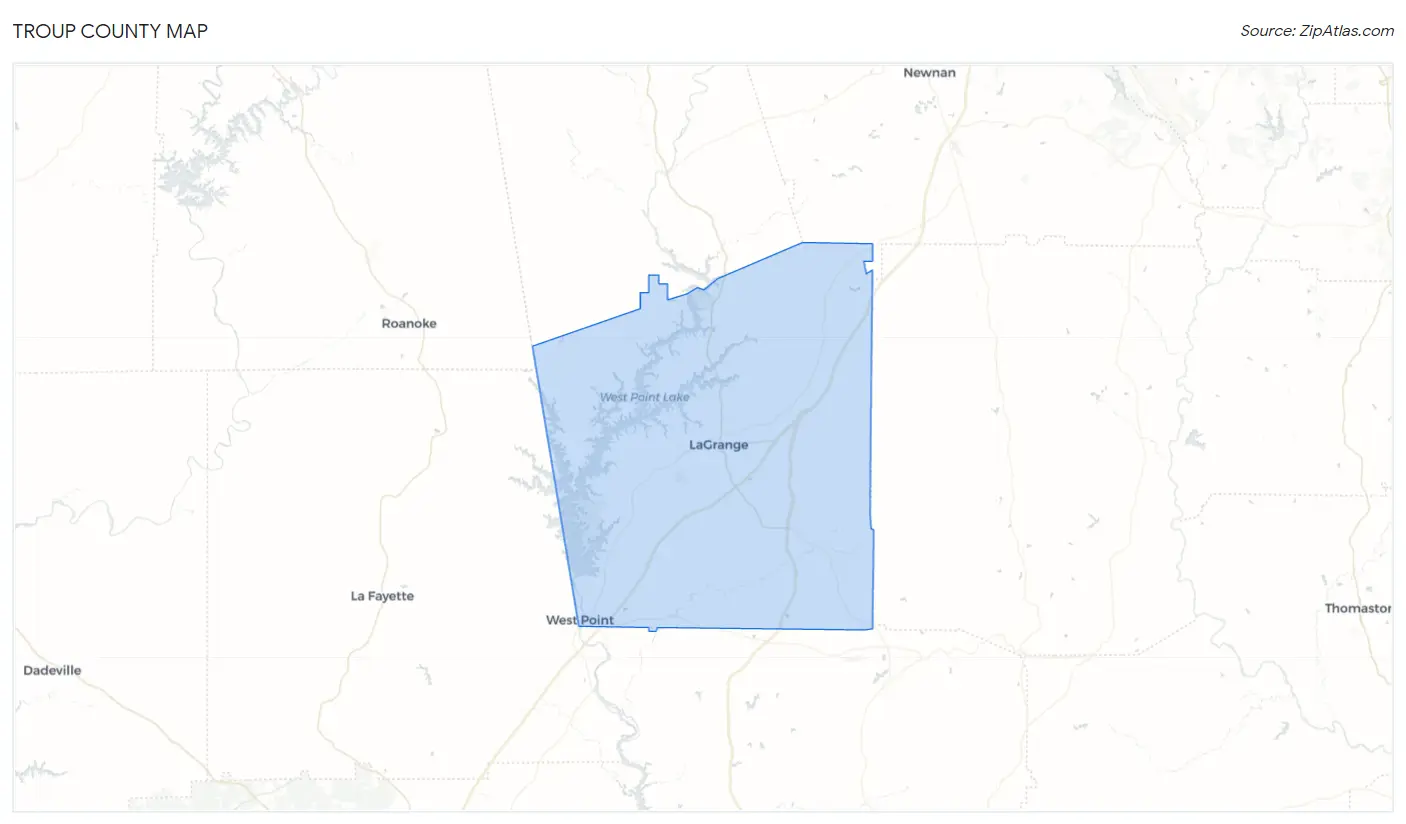
Troup County Map
Troup County Overview
$29,562
PER CAPITA INCOME
$69,126
AVG FAMILY INCOME
$53,599
AVG HOUSEHOLD INCOME
28.8%
WAGE / INCOME GAP [ % ]
71.2¢/ $1
WAGE / INCOME GAP [ $ ]
$11,451
FAMILY INCOME DEFICIT
0.49
INEQUALITY / GINI INDEX
69,527
TOTAL POPULATION
33,108
MALE POPULATION
36,419
FEMALE POPULATION
90.91
MALES / 100 FEMALES
110.00
FEMALES / 100 MALES
37.2
MEDIAN AGE
3.3
AVG FAMILY SIZE
2.7
AVG HOUSEHOLD SIZE
32,692
LABOR FORCE [ PEOPLE ]
60.2%
PERCENT IN LABOR FORCE
4.8%
UNEMPLOYMENT RATE
Income in Troup County
Income Overview in Troup County
Per Capita Income in Troup County is $29,562, while median incomes of families and households are $69,126 and $53,599 respectively.
| Characteristic | Number | Measure |
| Per Capita Income | 69,527 | $29,562 |
| Median Family Income | 17,238 | $69,126 |
| Mean Family Income | 17,238 | $91,850 |
| Median Household Income | 25,587 | $53,599 |
| Mean Household Income | 25,587 | $76,163 |
| Income Deficit | 17,238 | $11,451 |
| Wage / Income Gap (%) | 69,527 | 28.80% |
| Wage / Income Gap ($) | 69,527 | 71.20¢ per $1 |
| Gini / Inequality Index | 69,527 | 0.49 |
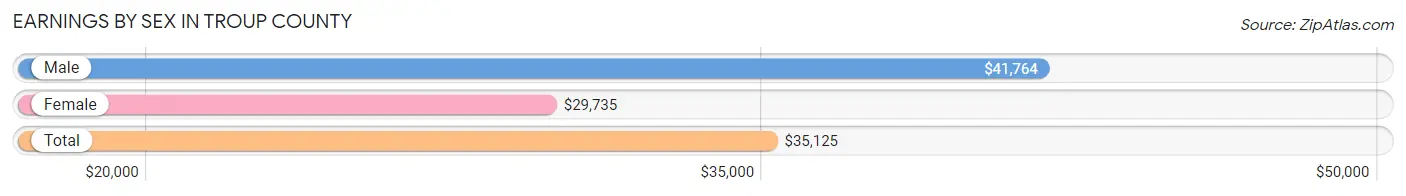
Earnings by Sex in Troup County
Average Earnings in Troup County are $35,125, $41,764 for men and $29,735 for women, a difference of 28.8%.
| Sex | Number | Average Earnings |
| Male | 16,831 (49.5%) | $41,764 |
| Female | 17,171 (50.5%) | $29,735 |
| Total | 34,002 (100.0%) | $35,125 |
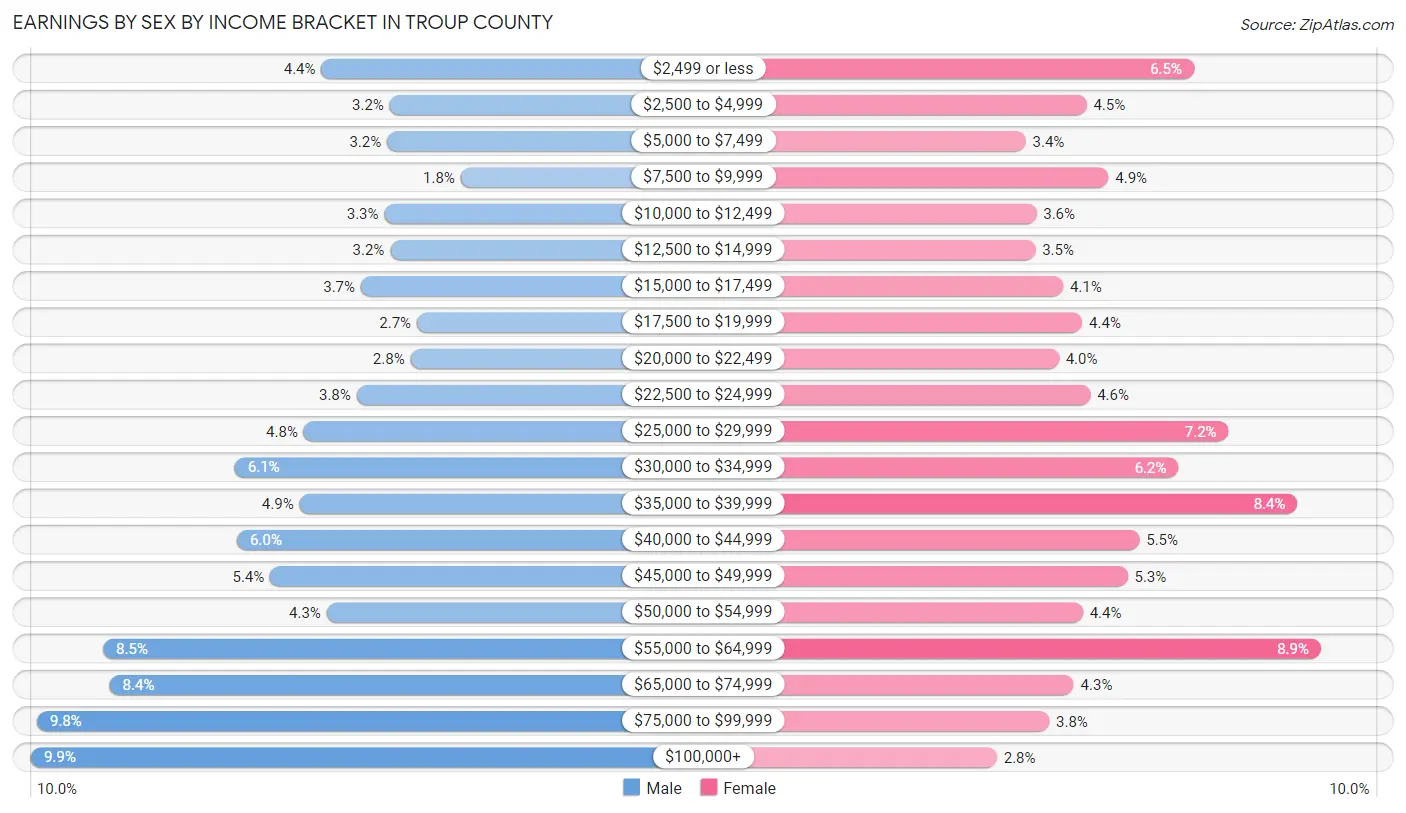
Earnings by Sex by Income Bracket in Troup County
The most common earnings brackets in Troup County are $100,000+ for men (1,663 | 9.9%) and $55,000 to $64,999 for women (1,525 | 8.9%).
| Income | Male | Female |
| $2,499 or less | 748 (4.4%) | 1,116 (6.5%) |
| $2,500 to $4,999 | 532 (3.2%) | 771 (4.5%) |
| $5,000 to $7,499 | 541 (3.2%) | 575 (3.4%) |
| $7,500 to $9,999 | 308 (1.8%) | 841 (4.9%) |
| $10,000 to $12,499 | 548 (3.3%) | 610 (3.5%) |
| $12,500 to $14,999 | 530 (3.2%) | 606 (3.5%) |
| $15,000 to $17,499 | 623 (3.7%) | 695 (4.1%) |
| $17,500 to $19,999 | 446 (2.6%) | 757 (4.4%) |
| $20,000 to $22,499 | 467 (2.8%) | 681 (4.0%) |
| $22,500 to $24,999 | 636 (3.8%) | 783 (4.6%) |
| $25,000 to $29,999 | 803 (4.8%) | 1,227 (7.1%) |
| $30,000 to $34,999 | 1,020 (6.1%) | 1,067 (6.2%) |
| $35,000 to $39,999 | 817 (4.9%) | 1,450 (8.4%) |
| $40,000 to $44,999 | 1,013 (6.0%) | 941 (5.5%) |
| $45,000 to $49,999 | 909 (5.4%) | 904 (5.3%) |
| $50,000 to $54,999 | 731 (4.3%) | 759 (4.4%) |
| $55,000 to $64,999 | 1,436 (8.5%) | 1,525 (8.9%) |
| $65,000 to $74,999 | 1,416 (8.4%) | 730 (4.3%) |
| $75,000 to $99,999 | 1,644 (9.8%) | 651 (3.8%) |
| $100,000+ | 1,663 (9.9%) | 482 (2.8%) |
| Total | 16,831 (100.0%) | 17,171 (100.0%) |
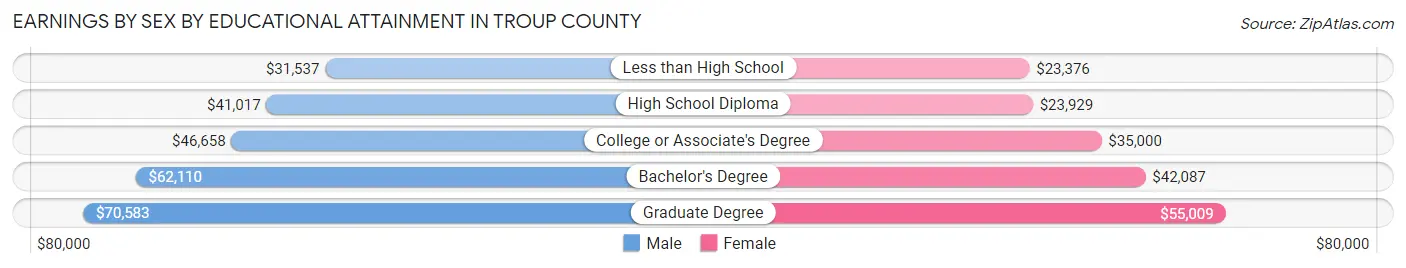
Earnings by Sex by Educational Attainment in Troup County
Average earnings in Troup County are $46,360 for men and $34,091 for women, a difference of 26.5%. Men with an educational attainment of graduate degree enjoy the highest average annual earnings of $70,583, while those with less than high school education earn the least with $31,537. Women with an educational attainment of graduate degree earn the most with the average annual earnings of $55,009, while those with less than high school education have the smallest earnings of $23,376.
| Educational Attainment | Male Income | Female Income |
| Less than High School | $31,537 | $23,376 |
| High School Diploma | $41,017 | $23,929 |
| College or Associate's Degree | $46,658 | $35,000 |
| Bachelor's Degree | $62,110 | $42,087 |
| Graduate Degree | $70,583 | $55,009 |
| Total | $46,360 | $34,091 |
Family Income in Troup County
Family Income Brackets in Troup County
According to the Troup County family income data, there are 3,465 families falling into the $100,000 to $149,999 income range, which is the most common income bracket and makes up 20.1% of all families. Conversely, the $10,000 to $14,999 income bracket is the least frequent group with only 465 families (2.7%) belonging to this category.
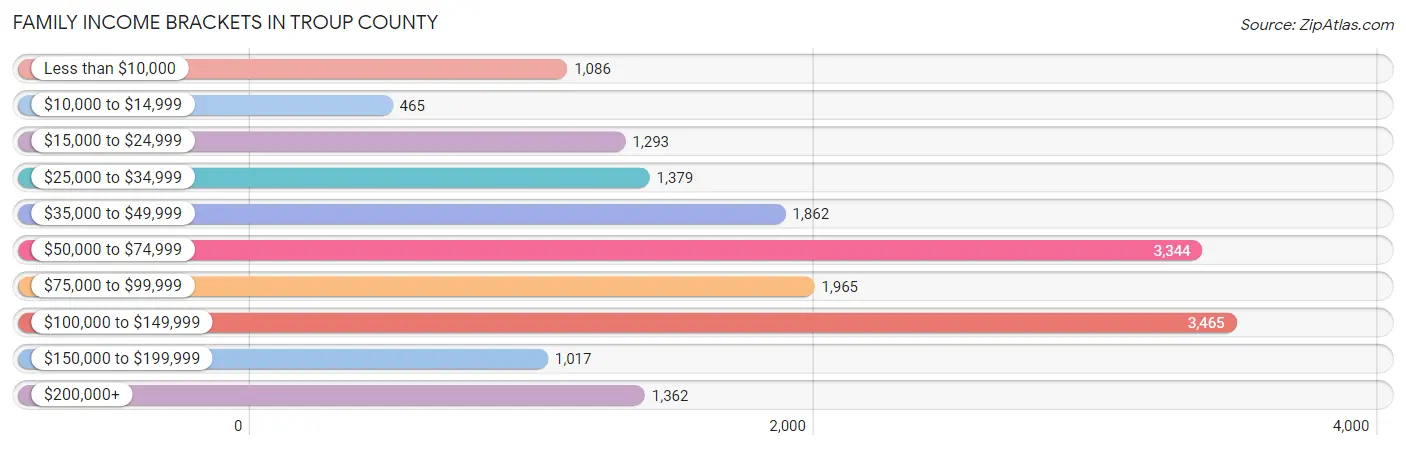
| Income Bracket | # Families | % Families |
| Less than $10,000 | 1,086 | 6.3% |
| $10,000 to $14,999 | 465 | 2.7% |
| $15,000 to $24,999 | 1,293 | 7.5% |
| $25,000 to $34,999 | 1,379 | 8.0% |
| $35,000 to $49,999 | 1,862 | 10.8% |
| $50,000 to $74,999 | 3,344 | 19.4% |
| $75,000 to $99,999 | 1,965 | 11.4% |
| $100,000 to $149,999 | 3,465 | 20.1% |
| $150,000 to $199,999 | 1,017 | 5.9% |
| $200,000+ | 1,362 | 7.9% |
Family Income by Famaliy Size in Troup County
7+ person families (357 | 2.1%) account for the highest median family income in Troup County with $100,827 per family, while 2-person families (8,040 | 46.6%) have the highest median income of $33,082 per family member.
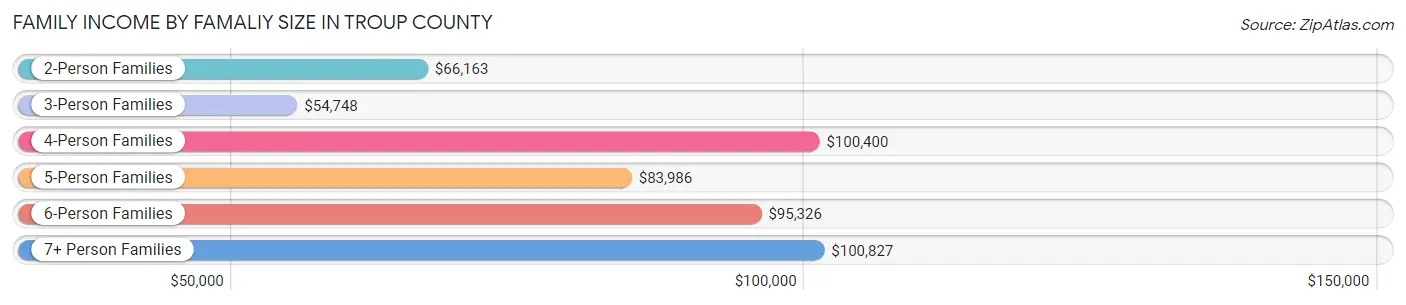
| Income Bracket | # Families | Median Income |
| 2-Person Families | 8,040 (46.6%) | $66,163 |
| 3-Person Families | 3,969 (23.0%) | $54,748 |
| 4-Person Families | 2,966 (17.2%) | $100,400 |
| 5-Person Families | 1,344 (7.8%) | $83,986 |
| 6-Person Families | 562 (3.3%) | $95,326 |
| 7+ Person Families | 357 (2.1%) | $100,827 |
| Total | 17,238 (100.0%) | $69,126 |
Family Income by Number of Earners in Troup County
The median family income in Troup County is $69,126, with families comprising 3+ earners (1,563) having the highest median family income of $127,306, while families with no earners (2,751) have the lowest median family income of $37,438, accounting for 9.1% and 16.0% of families, respectively.
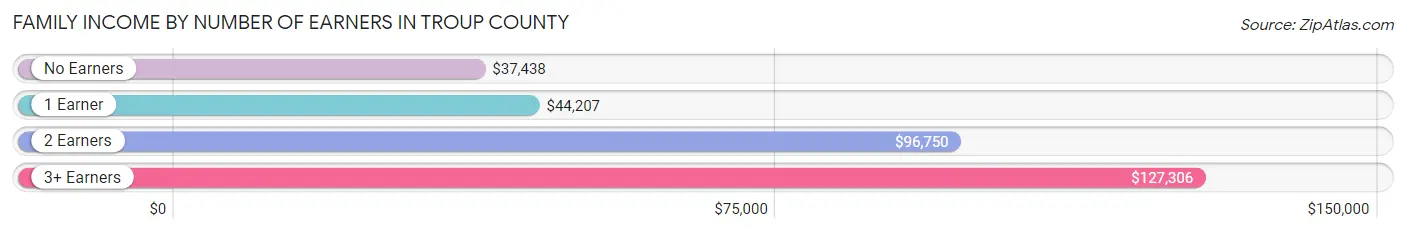
| Number of Earners | # Families | Median Income |
| No Earners | 2,751 (16.0%) | $37,438 |
| 1 Earner | 6,588 (38.2%) | $44,207 |
| 2 Earners | 6,336 (36.8%) | $96,750 |
| 3+ Earners | 1,563 (9.1%) | $127,306 |
| Total | 17,238 (100.0%) | $69,126 |
Household Income in Troup County
Household Income Brackets in Troup County
With 4,913 households falling in the category, the $50,000 to $74,999 income range is the most frequent in Troup County, accounting for 19.2% of all households. In contrast, only 1,177 households (4.6%) fall into the $150,000 to $199,999 income bracket, making it the least populous group.
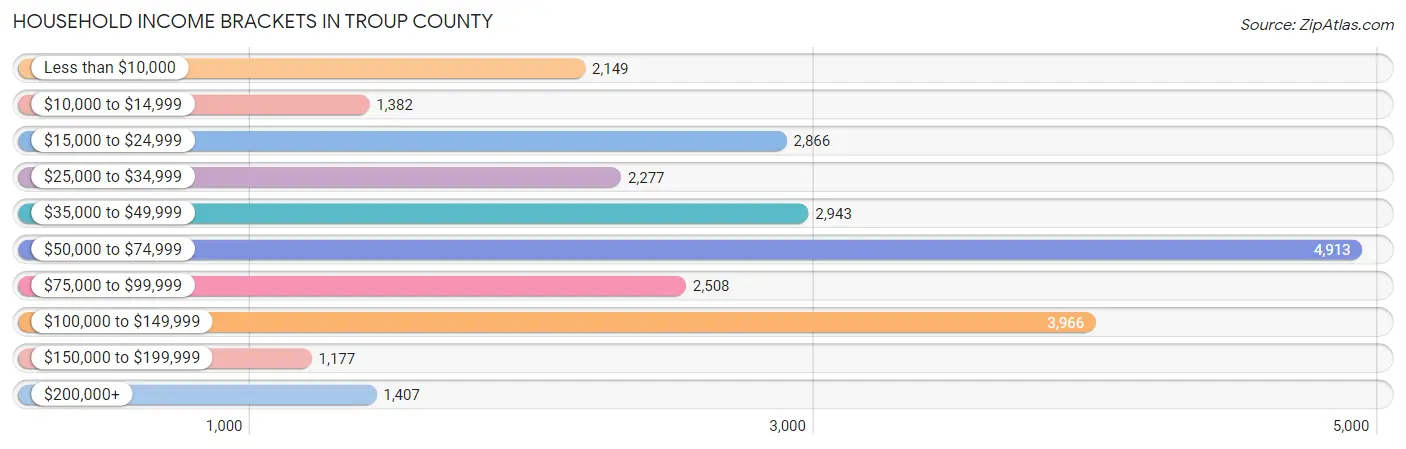
| Income Bracket | # Households | % Households |
| Less than $10,000 | 2,149 | 8.4% |
| $10,000 to $14,999 | 1,382 | 5.4% |
| $15,000 to $24,999 | 2,866 | 11.2% |
| $25,000 to $34,999 | 2,277 | 8.9% |
| $35,000 to $49,999 | 2,943 | 11.5% |
| $50,000 to $74,999 | 4,913 | 19.2% |
| $75,000 to $99,999 | 2,508 | 9.8% |
| $100,000 to $149,999 | 3,966 | 15.5% |
| $150,000 to $199,999 | 1,177 | 4.6% |
| $200,000+ | 1,407 | 5.5% |
Household Income by Householder Age in Troup County
The median household income in Troup County is $53,599, with the highest median household income of $58,614 found in the 45 to 64 years age bracket for the primary householder. A total of 9,948 households (38.9%) fall into this category. Meanwhile, the 15 to 24 years age bracket for the primary householder has the lowest median household income of $0, with 951 households (3.7%) in this group.
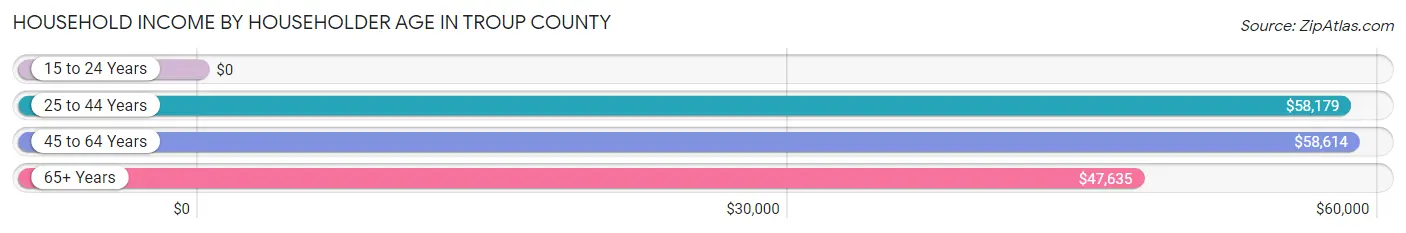
| Income Bracket | # Households | Median Income |
| 15 to 24 Years | 951 (3.7%) | $0 |
| 25 to 44 Years | 8,036 (31.4%) | $58,179 |
| 45 to 64 Years | 9,948 (38.9%) | $58,614 |
| 65+ Years | 6,652 (26.0%) | $47,635 |
| Total | 25,587 (100.0%) | $53,599 |
Poverty in Troup County
Income Below Poverty by Sex and Age in Troup County
With 18.1% poverty level for males and 20.1% for females among the residents of Troup County, 15 year old males and 5 year old females are the most vulnerable to poverty, with 241 males (42.8%) and 255 females (36.6%) in their respective age groups living below the poverty level.
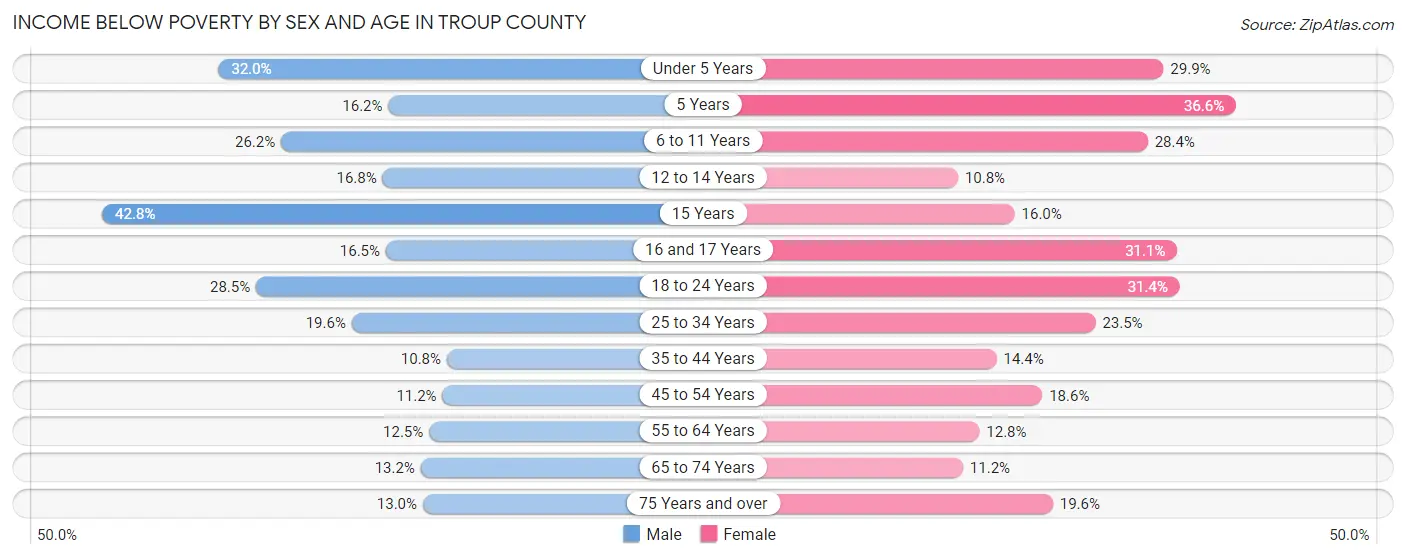
| Age Bracket | Male | Female |
| Under 5 Years | 692 (32.0%) | 625 (29.8%) |
| 5 Years | 64 (16.2%) | 255 (36.6%) |
| 6 to 11 Years | 708 (26.2%) | 728 (28.4%) |
| 12 to 14 Years | 287 (16.8%) | 143 (10.8%) |
| 15 Years | 241 (42.8%) | 106 (16.0%) |
| 16 and 17 Years | 142 (16.5%) | 249 (31.1%) |
| 18 to 24 Years | 876 (28.5%) | 967 (31.4%) |
| 25 to 34 Years | 841 (19.6%) | 1,182 (23.5%) |
| 35 to 44 Years | 413 (10.8%) | 648 (14.4%) |
| 45 to 54 Years | 440 (11.2%) | 842 (18.6%) |
| 55 to 64 Years | 511 (12.5%) | 587 (12.8%) |
| 65 to 74 Years | 381 (13.2%) | 385 (11.2%) |
| 75 Years and over | 198 (13.0%) | 497 (19.6%) |
| Total | 5,794 (18.1%) | 7,214 (20.1%) |
Income Above Poverty by Sex and Age in Troup County
According to the poverty statistics in Troup County, males aged 35 to 44 years and females aged 12 to 14 years are the age groups that are most secure financially, with 89.2% of males and 89.2% of females in these age groups living above the poverty line.
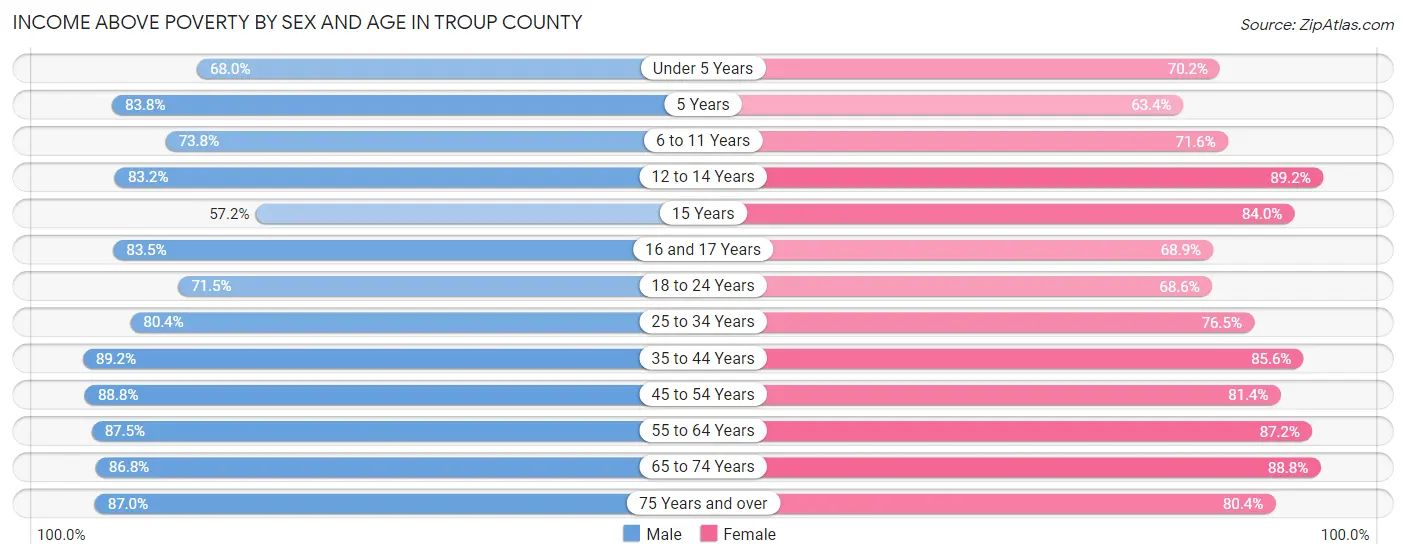
| Age Bracket | Male | Female |
| Under 5 Years | 1,469 (68.0%) | 1,469 (70.2%) |
| 5 Years | 330 (83.8%) | 442 (63.4%) |
| 6 to 11 Years | 1,994 (73.8%) | 1,836 (71.6%) |
| 12 to 14 Years | 1,423 (83.2%) | 1,184 (89.2%) |
| 15 Years | 322 (57.2%) | 555 (84.0%) |
| 16 and 17 Years | 720 (83.5%) | 551 (68.9%) |
| 18 to 24 Years | 2,195 (71.5%) | 2,117 (68.6%) |
| 25 to 34 Years | 3,442 (80.4%) | 3,839 (76.5%) |
| 35 to 44 Years | 3,407 (89.2%) | 3,864 (85.6%) |
| 45 to 54 Years | 3,483 (88.8%) | 3,685 (81.4%) |
| 55 to 64 Years | 3,590 (87.5%) | 4,010 (87.2%) |
| 65 to 74 Years | 2,497 (86.8%) | 3,041 (88.8%) |
| 75 Years and over | 1,320 (87.0%) | 2,041 (80.4%) |
| Total | 26,192 (81.9%) | 28,634 (79.9%) |
Income Below Poverty Among Married-Couple Families in Troup County
The poverty statistics for married-couple families in Troup County show that 6.0% or 686 of the total 11,423 families live below the poverty line. Families with 5 or more children have the highest poverty rate of 91.1%, comprising of 103 families. On the other hand, families with 1 or 2 children have the lowest poverty rate of 3.9%, which includes 137 families.
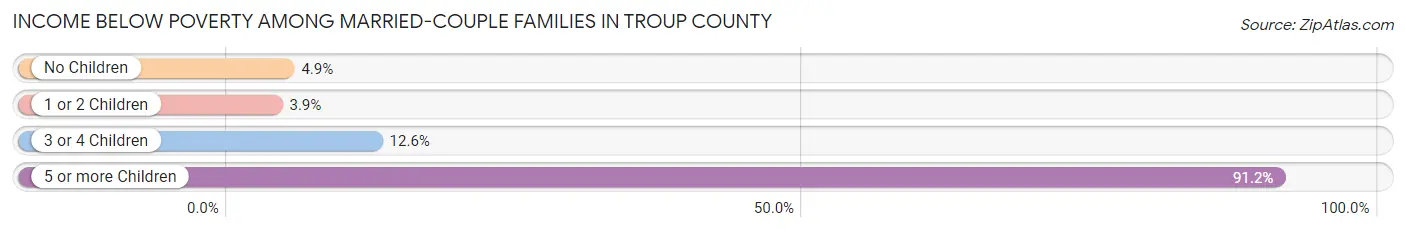
| Children | Above Poverty | Below Poverty |
| No Children | 6,585 (95.1%) | 340 (4.9%) |
| 1 or 2 Children | 3,406 (96.1%) | 137 (3.9%) |
| 3 or 4 Children | 736 (87.4%) | 106 (12.6%) |
| 5 or more Children | 10 (8.8%) | 103 (91.1%) |
| Total | 10,737 (94.0%) | 686 (6.0%) |
Income Below Poverty Among Single-Parent Households in Troup County
According to the poverty data in Troup County, 36.4% or 417 single-father households and 33.8% or 1,579 single-mother households are living below the poverty line. Among single-father households, those with 1 or 2 children have the highest poverty rate, with 348 households (46.0%) experiencing poverty. Likewise, among single-mother households, those with 5 or more children have the highest poverty rate, with 29 households (74.4%) falling below the poverty line.
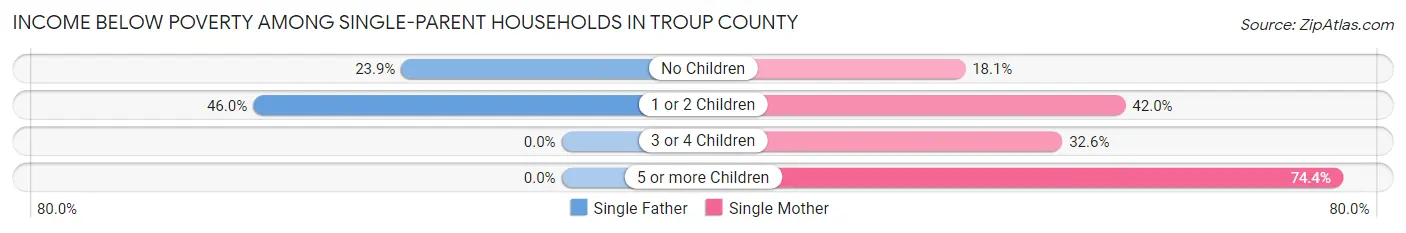
| Children | Single Father | Single Mother |
| No Children | 69 (23.9%) | 262 (18.1%) |
| 1 or 2 Children | 348 (46.0%) | 1,118 (42.0%) |
| 3 or 4 Children | 0 (0.0%) | 170 (32.6%) |
| 5 or more Children | 0 (0.0%) | 29 (74.4%) |
| Total | 417 (36.4%) | 1,579 (33.8%) |
Income Below Poverty Among Married-Couple vs Single-Parent Households in Troup County
The poverty data for Troup County shows that 686 of the married-couple family households (6.0%) and 1,996 of the single-parent households (34.3%) are living below the poverty level. Within the married-couple family households, those with 5 or more children have the highest poverty rate, with 103 households (91.1%) falling below the poverty line. Among the single-parent households, those with 5 or more children have the highest poverty rate, with 29 household (74.4%) living below poverty.
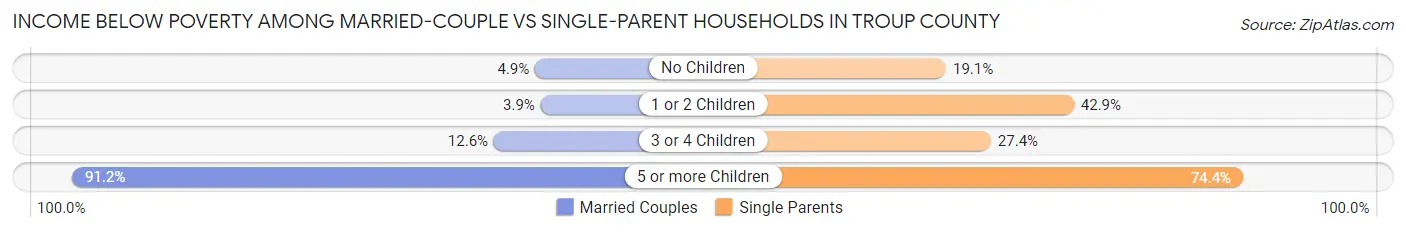
| Children | Married-Couple Families | Single-Parent Households |
| No Children | 340 (4.9%) | 331 (19.1%) |
| 1 or 2 Children | 137 (3.9%) | 1,466 (42.9%) |
| 3 or 4 Children | 106 (12.6%) | 170 (27.4%) |
| 5 or more Children | 103 (91.1%) | 29 (74.4%) |
| Total | 686 (6.0%) | 1,996 (34.3%) |
Race in Troup County
The most populous races in Troup County are White / Caucasian (39,707 | 57.1%), Black / African American (25,176 | 36.2%), and Hispanic or Latino (2,712 | 3.9%).
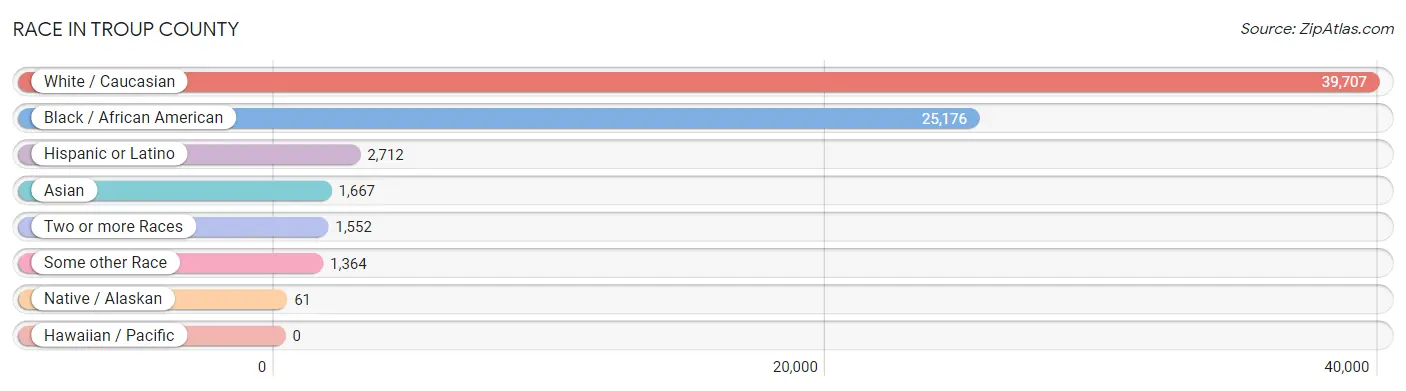
| Race | # Population | % Population |
| Asian | 1,667 | 2.4% |
| Black / African American | 25,176 | 36.2% |
| Hawaiian / Pacific | 0 | 0.0% |
| Hispanic or Latino | 2,712 | 3.9% |
| Native / Alaskan | 61 | 0.1% |
| White / Caucasian | 39,707 | 57.1% |
| Two or more Races | 1,552 | 2.2% |
| Some other Race | 1,364 | 2.0% |
| Total | 69,527 | 100.0% |
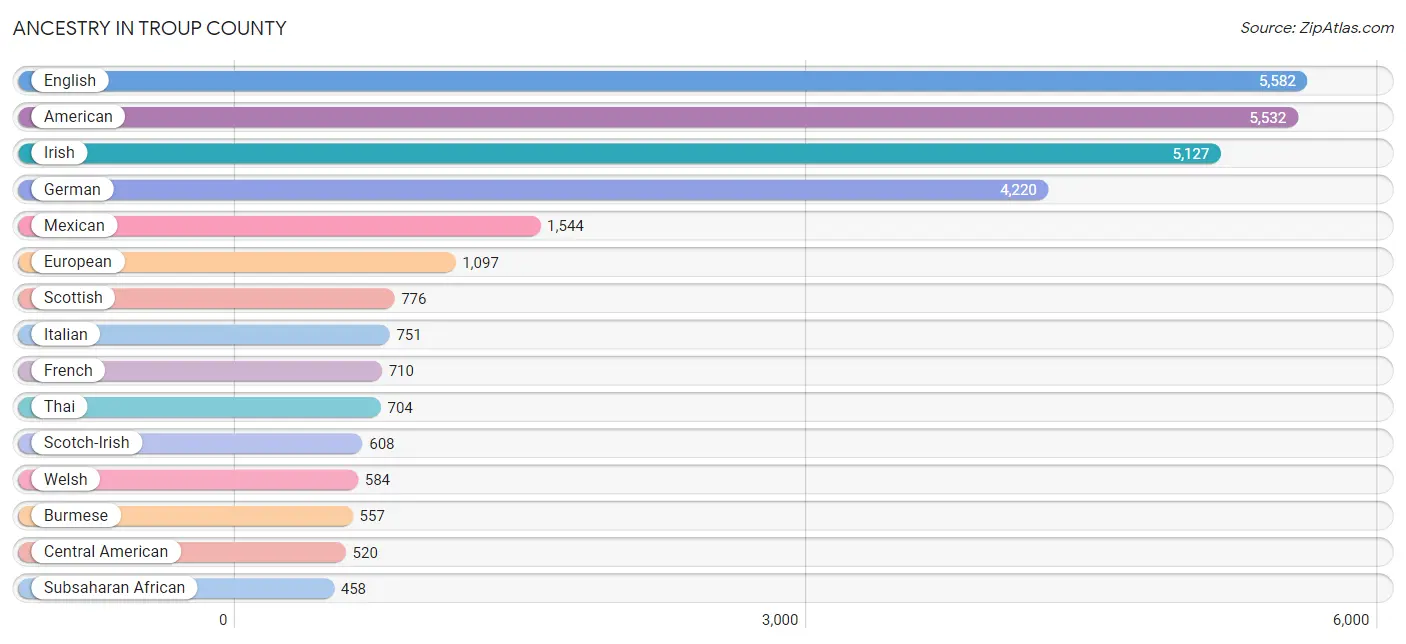
Ancestry in Troup County
The most populous ancestries reported in Troup County are English (5,582 | 8.0%), American (5,532 | 8.0%), Irish (5,127 | 7.4%), German (4,220 | 6.1%), and Mexican (1,544 | 2.2%), together accounting for 31.6% of all Troup County residents.
| Ancestry | # Population | % Population |
| African | 430 | 0.6% |
| American | 5,532 | 8.0% |
| Arab | 11 | 0.0% |
| Austrian | 26 | 0.0% |
| Basque | 8 | 0.0% |
| Belgian | 45 | 0.1% |
| Bhutanese | 32 | 0.1% |
| Brazilian | 56 | 0.1% |
| British | 363 | 0.5% |
| Bulgarian | 12 | 0.0% |
| Burmese | 557 | 0.8% |
| Canadian | 99 | 0.1% |
| Celtic | 40 | 0.1% |
| Central American | 520 | 0.7% |
| Cherokee | 186 | 0.3% |
| Colombian | 15 | 0.0% |
| Creek | 23 | 0.0% |
| Croatian | 118 | 0.2% |
| Cuban | 105 | 0.2% |
| Czech | 16 | 0.0% |
| Czechoslovakian | 59 | 0.1% |
| Danish | 8 | 0.0% |
| Dutch | 304 | 0.4% |
| Eastern European | 63 | 0.1% |
| English | 5,582 | 8.0% |
| European | 1,097 | 1.6% |
| French | 710 | 1.0% |
| French Canadian | 45 | 0.1% |
| German | 4,220 | 6.1% |
| Greek | 25 | 0.0% |
| Guatemalan | 287 | 0.4% |
| Haitian | 184 | 0.3% |
| Hungarian | 43 | 0.1% |
| Indian (Asian) | 102 | 0.2% |
| Iranian | 26 | 0.0% |
| Irish | 5,127 | 7.4% |
| Israeli | 4 | 0.0% |
| Italian | 751 | 1.1% |
| Jamaican | 203 | 0.3% |
| Korean | 154 | 0.2% |
| Maltese | 56 | 0.1% |
| Mexican | 1,544 | 2.2% |
| Native Hawaiian | 21 | 0.0% |
| Nigerian | 16 | 0.0% |
| Northern European | 33 | 0.1% |
| Norwegian | 109 | 0.2% |
| Peruvian | 78 | 0.1% |
| Polish | 231 | 0.3% |
| Portuguese | 49 | 0.1% |
| Puerto Rican | 239 | 0.3% |
| Russian | 41 | 0.1% |
| Salvadoran | 233 | 0.3% |
| Scandinavian | 221 | 0.3% |
| Scotch-Irish | 608 | 0.9% |
| Scottish | 776 | 1.1% |
| Serbian | 6 | 0.0% |
| Slovene | 10 | 0.0% |
| South American | 93 | 0.1% |
| Spaniard | 53 | 0.1% |
| Sri Lankan | 63 | 0.1% |
| Subsaharan African | 458 | 0.7% |
| Swedish | 161 | 0.2% |
| Swiss | 12 | 0.0% |
| Thai | 704 | 1.0% |
| Trinidadian and Tobagonian | 5 | 0.0% |
| Ukrainian | 30 | 0.0% |
| Welsh | 584 | 0.8% | View All 67 Rows |
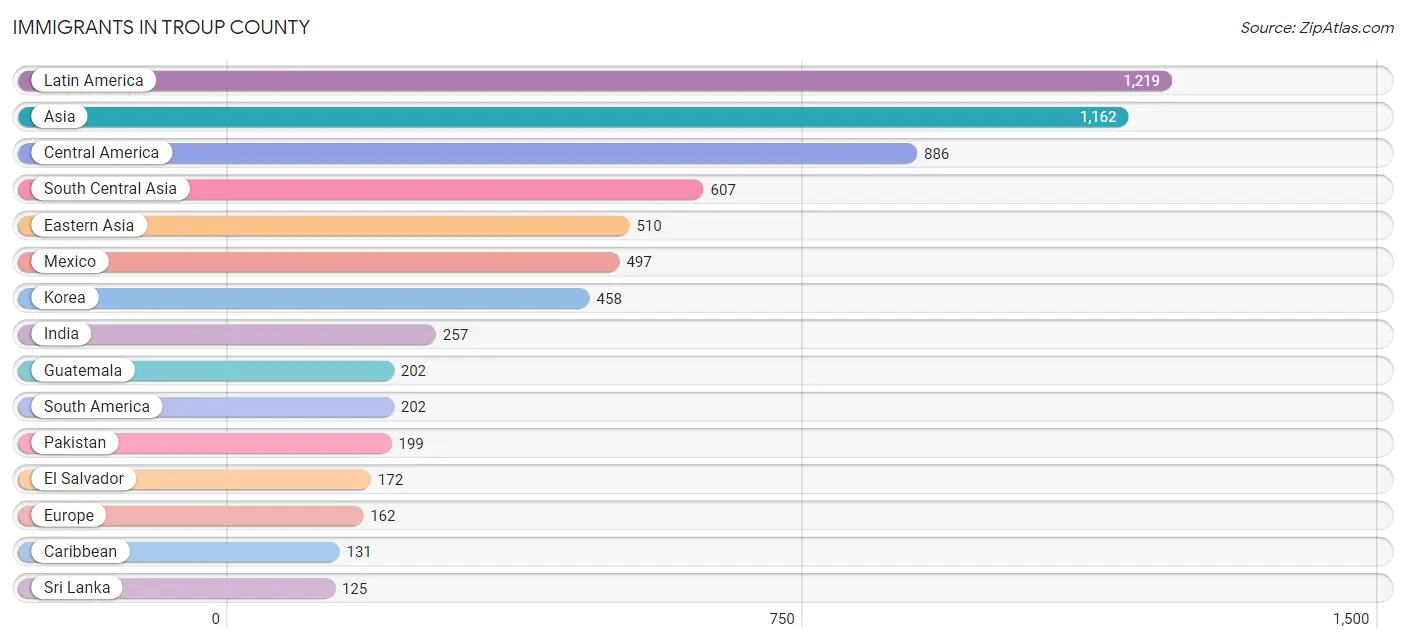
Immigrants in Troup County
The most numerous immigrant groups reported in Troup County came from Latin America (1,219 | 1.8%), Asia (1,162 | 1.7%), Central America (886 | 1.3%), South Central Asia (607 | 0.9%), and Eastern Asia (510 | 0.7%), together accounting for 6.3% of all Troup County residents.
| Immigration Origin | # Population | % Population |
| Africa | 41 | 0.1% |
| Asia | 1,162 | 1.7% |
| Barbados | 64 | 0.1% |
| Brazil | 36 | 0.1% |
| Canada | 74 | 0.1% |
| Caribbean | 131 | 0.2% |
| Central America | 886 | 1.3% |
| China | 39 | 0.1% |
| Colombia | 44 | 0.1% |
| Cuba | 16 | 0.0% |
| Eastern Africa | 41 | 0.1% |
| Eastern Asia | 510 | 0.7% |
| Eastern Europe | 20 | 0.0% |
| El Salvador | 172 | 0.3% |
| England | 31 | 0.0% |
| Europe | 162 | 0.2% |
| France | 6 | 0.0% |
| Germany | 85 | 0.1% |
| Greece | 8 | 0.0% |
| Guatemala | 202 | 0.3% |
| Guyana | 89 | 0.1% |
| Haiti | 19 | 0.0% |
| Honduras | 15 | 0.0% |
| India | 257 | 0.4% |
| Iran | 26 | 0.0% |
| Israel | 11 | 0.0% |
| Italy | 12 | 0.0% |
| Jamaica | 32 | 0.1% |
| Japan | 13 | 0.0% |
| Korea | 458 | 0.7% |
| Latin America | 1,219 | 1.8% |
| Mexico | 497 | 0.7% |
| Northern Europe | 31 | 0.0% |
| Pakistan | 199 | 0.3% |
| Peru | 33 | 0.1% |
| Philippines | 22 | 0.0% |
| Russia | 18 | 0.0% |
| South America | 202 | 0.3% |
| South Central Asia | 607 | 0.9% |
| South Eastern Asia | 34 | 0.1% |
| Southern Europe | 20 | 0.0% |
| Sri Lanka | 125 | 0.2% |
| Uganda | 29 | 0.0% |
| Ukraine | 2 | 0.0% |
| Vietnam | 12 | 0.0% |
| Western Asia | 11 | 0.0% |
| Western Europe | 91 | 0.1% | View All 47 Rows |
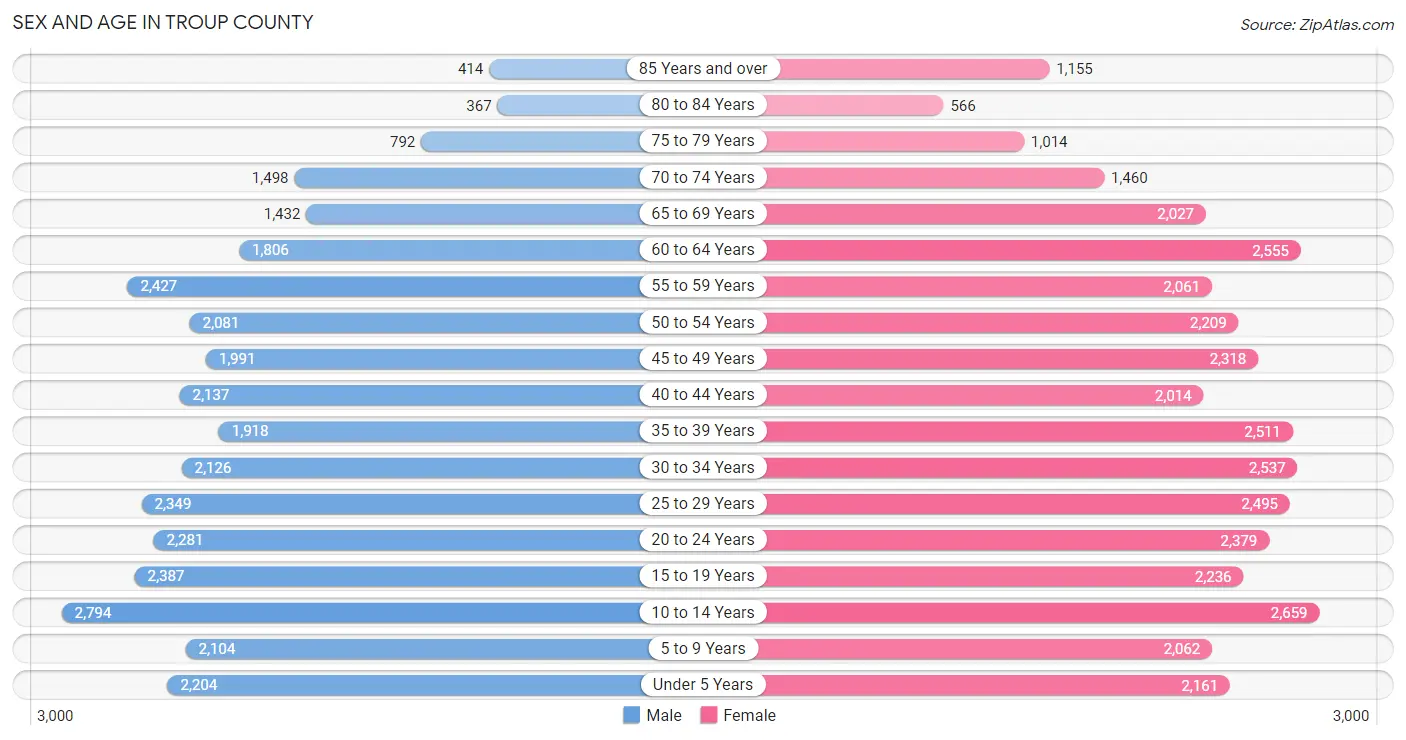
Sex and Age in Troup County
Sex and Age in Troup County
The most populous age groups in Troup County are 10 to 14 Years (2,794 | 8.4%) for men and 10 to 14 Years (2,659 | 7.3%) for women.
| Age Bracket | Male | Female |
| Under 5 Years | 2,204 (6.7%) | 2,161 (5.9%) |
| 5 to 9 Years | 2,104 (6.4%) | 2,062 (5.7%) |
| 10 to 14 Years | 2,794 (8.4%) | 2,659 (7.3%) |
| 15 to 19 Years | 2,387 (7.2%) | 2,236 (6.1%) |
| 20 to 24 Years | 2,281 (6.9%) | 2,379 (6.5%) |
| 25 to 29 Years | 2,349 (7.1%) | 2,495 (6.9%) |
| 30 to 34 Years | 2,126 (6.4%) | 2,537 (7.0%) |
| 35 to 39 Years | 1,918 (5.8%) | 2,511 (6.9%) |
| 40 to 44 Years | 2,137 (6.5%) | 2,014 (5.5%) |
| 45 to 49 Years | 1,991 (6.0%) | 2,318 (6.4%) |
| 50 to 54 Years | 2,081 (6.3%) | 2,209 (6.1%) |
| 55 to 59 Years | 2,427 (7.3%) | 2,061 (5.7%) |
| 60 to 64 Years | 1,806 (5.4%) | 2,555 (7.0%) |
| 65 to 69 Years | 1,432 (4.3%) | 2,027 (5.6%) |
| 70 to 74 Years | 1,498 (4.5%) | 1,460 (4.0%) |
| 75 to 79 Years | 792 (2.4%) | 1,014 (2.8%) |
| 80 to 84 Years | 367 (1.1%) | 566 (1.5%) |
| 85 Years and over | 414 (1.3%) | 1,155 (3.2%) |
| Total | 33,108 (100.0%) | 36,419 (100.0%) |
Families and Households in Troup County
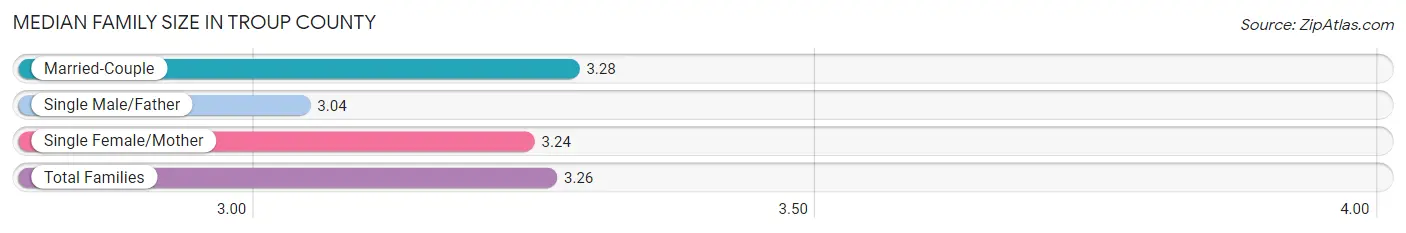
Median Family Size in Troup County
The median family size in Troup County is 3.26 persons per family, with married-couple families (11,423 | 66.3%) accounting for the largest median family size of 3.28 persons per family. On the other hand, single male/father families (1,144 | 6.6%) represent the smallest median family size with 3.04 persons per family.
| Family Type | # Families | Family Size |
| Married-Couple | 11,423 (66.3%) | 3.28 |
| Single Male/Father | 1,144 (6.6%) | 3.04 |
| Single Female/Mother | 4,671 (27.1%) | 3.24 |
| Total Families | 17,238 (100.0%) | 3.26 |
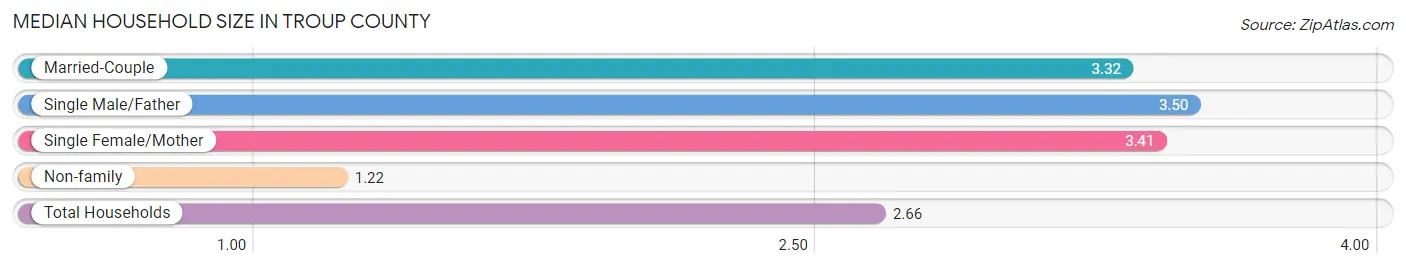
Median Household Size in Troup County
The median household size in Troup County is 2.66 persons per household, with single male/father households (1,144 | 4.5%) accounting for the largest median household size of 3.5 persons per household. non-family households (8,349 | 32.6%) represent the smallest median household size with 1.22 persons per household.
| Household Type | # Households | Household Size |
| Married-Couple | 11,423 (44.6%) | 3.32 |
| Single Male/Father | 1,144 (4.5%) | 3.50 |
| Single Female/Mother | 4,671 (18.3%) | 3.41 |
| Non-family | 8,349 (32.6%) | 1.22 |
| Total Households | 25,587 (100.0%) | 2.66 |
Household Size by Marriage Status in Troup County
Out of a total of 25,587 households in Troup County, 17,238 (67.4%) are family households, while 8,349 (32.6%) are nonfamily households. The most numerous type of family households are 2-person households, comprising 7,603, and the most common type of nonfamily households are 1-person households, comprising 7,324.
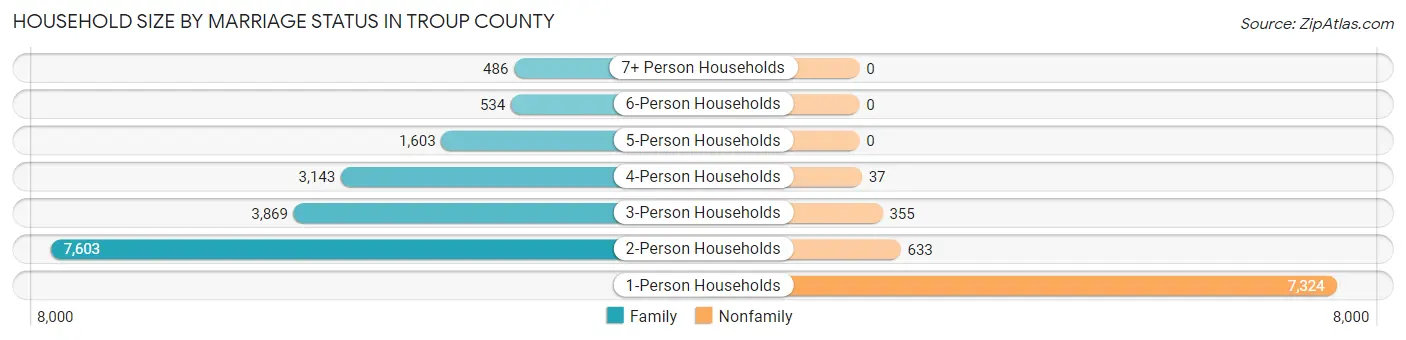
| Household Size | Family Households | Nonfamily Households |
| 1-Person Households | - | 7,324 (28.6%) |
| 2-Person Households | 7,603 (29.7%) | 633 (2.5%) |
| 3-Person Households | 3,869 (15.1%) | 355 (1.4%) |
| 4-Person Households | 3,143 (12.3%) | 37 (0.1%) |
| 5-Person Households | 1,603 (6.3%) | 0 (0.0%) |
| 6-Person Households | 534 (2.1%) | 0 (0.0%) |
| 7+ Person Households | 486 (1.9%) | 0 (0.0%) |
| Total | 17,238 (67.4%) | 8,349 (32.6%) |
Female Fertility in Troup County
Fertility by Age in Troup County
Average fertility rate in Troup County is 42.0 births per 1,000 women. Women in the age bracket of 20 to 34 years have the highest fertility rate with 75.0 births per 1,000 women. Women in the age bracket of 20 to 34 years acount for 77.7% of all women with births.
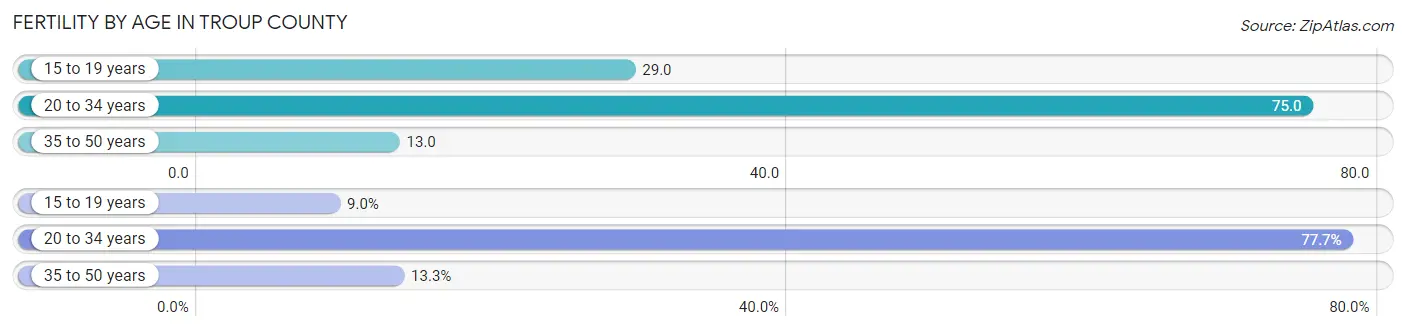
| Age Bracket | Women with Births | Births / 1,000 Women |
| 15 to 19 years | 64 (9.0%) | 29.0 |
| 20 to 34 years | 555 (77.7%) | 75.0 |
| 35 to 50 years | 95 (13.3%) | 13.0 |
| Total | 714 (100.0%) | 42.0 |
Fertility by Age by Marriage Status in Troup County
42.7% of women with births (714) in Troup County are married. The highest percentage of unmarried women with births falls into 15 to 19 years age bracket with 100.0% of them unmarried at the time of birth, while the lowest percentage of unmarried women with births belong to 35 to 50 years age bracket with 46.3% of them unmarried.
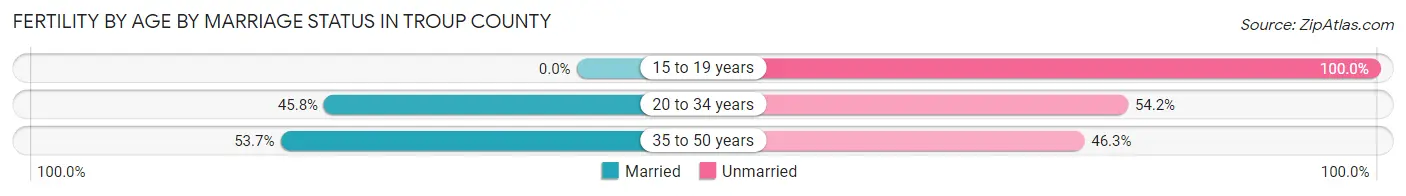
| Age Bracket | Married | Unmarried |
| 15 to 19 years | 0 (0.0%) | 64 (100.0%) |
| 20 to 34 years | 254 (45.8%) | 301 (54.2%) |
| 35 to 50 years | 51 (53.7%) | 44 (46.3%) |
| Total | 305 (42.7%) | 409 (57.3%) |
Fertility by Education in Troup County
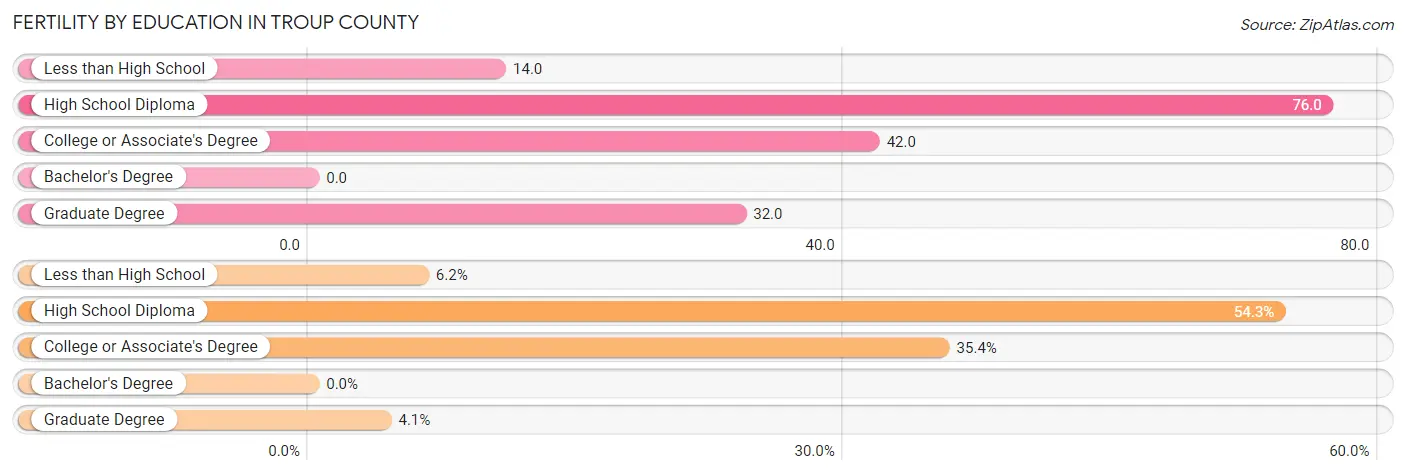
| Educational Attainment | Women with Births | Births / 1,000 Women |
| Less than High School | 44 (6.2%) | 14.0 |
| High School Diploma | 388 (54.3%) | 76.0 |
| College or Associate's Degree | 253 (35.4%) | 42.0 |
| Bachelor's Degree | 0 (0.0%) | 0.0 |
| Graduate Degree | 29 (4.1%) | 32.0 |
| Total | 714 (100.0%) | 42.0 |
Fertility by Education by Marriage Status in Troup County
57.3% of women with births in Troup County are unmarried. Women with the educational attainment of graduate degree are most likely to be married with 100.0% of them married at childbirth, while women with the educational attainment of high school diploma are least likely to be married with 71.9% of them unmarried at childbirth.
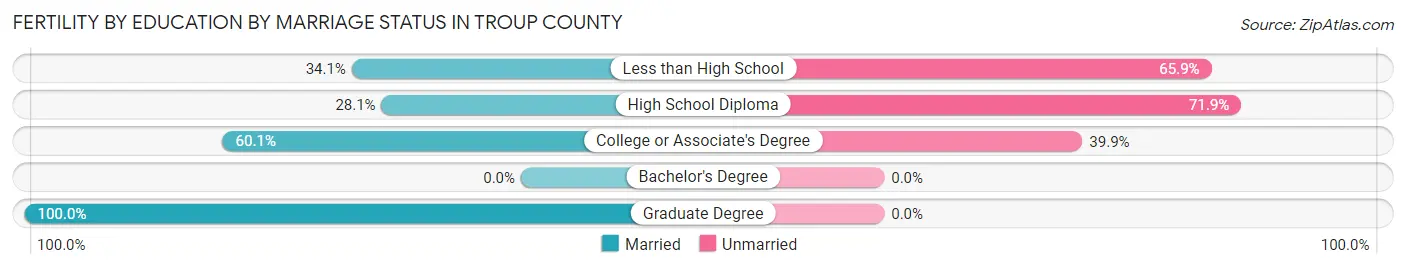
| Educational Attainment | Married | Unmarried |
| Less than High School | 15 (34.1%) | 29 (65.9%) |
| High School Diploma | 109 (28.1%) | 279 (71.9%) |
| College or Associate's Degree | 152 (60.1%) | 101 (39.9%) |
| Bachelor's Degree | 0 (0.0%) | 0 (0.0%) |
| Graduate Degree | 29 (100.0%) | 0 (0.0%) |
| Total | 305 (42.7%) | 409 (57.3%) |
Employment Characteristics in Troup County
Employment by Class of Employer in Troup County
Among the 30,516 employed individuals in Troup County, private company employees (22,462 | 73.6%), local government employees (2,228 | 7.3%), and not-for-profit organizations (1,664 | 5.4%) make up the most common classes of employment.
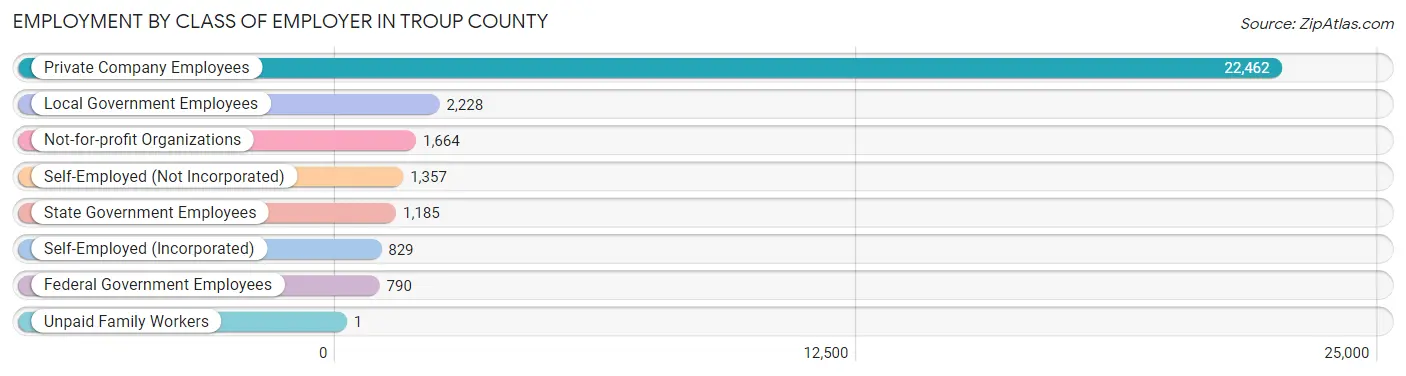
| Employer Class | # Employees | % Employees |
| Private Company Employees | 22,462 | 73.6% |
| Self-Employed (Incorporated) | 829 | 2.7% |
| Self-Employed (Not Incorporated) | 1,357 | 4.4% |
| Not-for-profit Organizations | 1,664 | 5.4% |
| Local Government Employees | 2,228 | 7.3% |
| State Government Employees | 1,185 | 3.9% |
| Federal Government Employees | 790 | 2.6% |
| Unpaid Family Workers | 1 | 0.0% |
| Total | 30,516 | 100.0% |
Employment Status by Age in Troup County
According to the labor force statistics for Troup County, out of the total population over 16 years of age (54,306), 60.2% or 32,692 individuals are in the labor force, with 4.8% or 1,569 of them unemployed. The age group with the highest labor force participation rate is 35 to 44 years, with 82.6% or 7,087 individuals in the labor force. Within the labor force, the 16 to 19 years age range has the highest percentage of unemployed individuals, with 29.7% or 294 of them being unemployed.
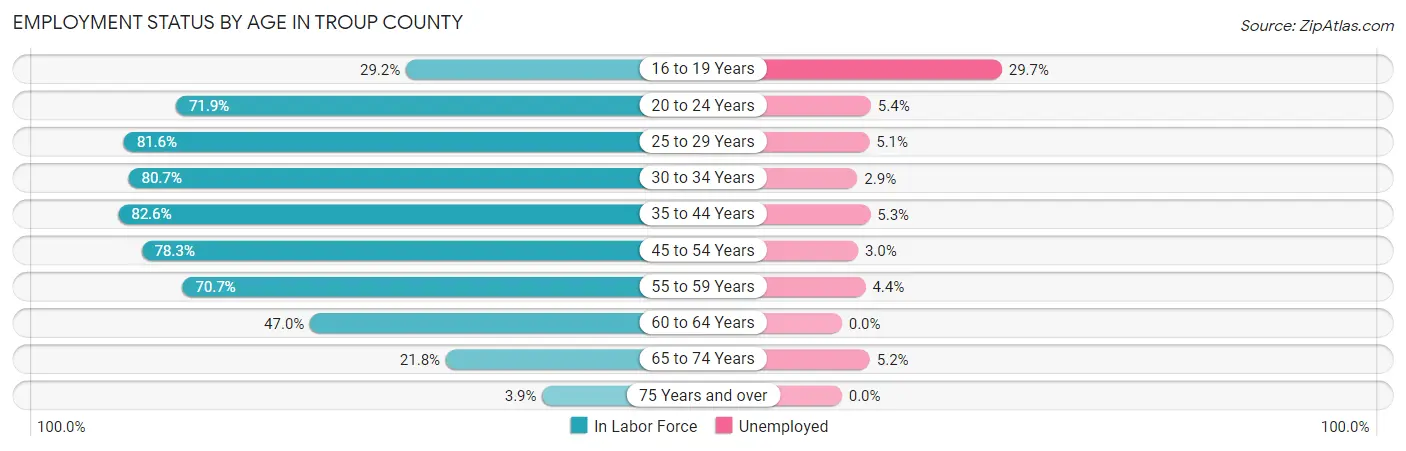
| Age Bracket | In Labor Force | Unemployed |
| 16 to 19 Years | 989 (29.2%) | 294 (29.7%) |
| 20 to 24 Years | 3,351 (71.9%) | 181 (5.4%) |
| 25 to 29 Years | 3,953 (81.6%) | 202 (5.1%) |
| 30 to 34 Years | 3,763 (80.7%) | 109 (2.9%) |
| 35 to 44 Years | 7,087 (82.6%) | 376 (5.3%) |
| 45 to 54 Years | 6,733 (78.3%) | 202 (3.0%) |
| 55 to 59 Years | 3,173 (70.7%) | 140 (4.4%) |
| 60 to 64 Years | 2,050 (47.0%) | 0 (0.0%) |
| 65 to 74 Years | 1,399 (21.8%) | 73 (5.2%) |
| 75 Years and over | 168 (3.9%) | 0 (0.0%) |
| Total | 32,692 (60.2%) | 1,569 (4.8%) |
Employment Status by Educational Attainment in Troup County
According to labor force statistics for Troup County, 75.3% of individuals (26,758) out of the total population between 25 and 64 years of age (35,535) are in the labor force, with 3.8% or 1,017 of them being unemployed. The group with the highest labor force participation rate are those with the educational attainment of bachelor's degree or higher, with 86.3% or 6,013 individuals in the labor force. Within the labor force, individuals with less than high school education have the highest percentage of unemployment, with 14.1% or 335 of them being unemployed.
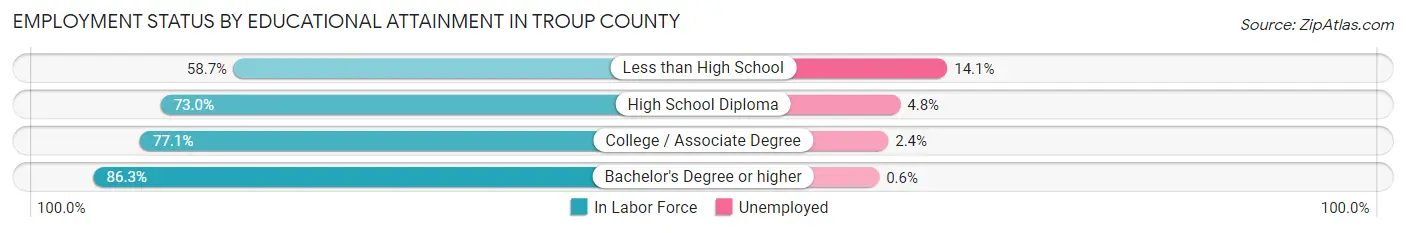
| Educational Attainment | In Labor Force | Unemployed |
| Less than High School | 2,373 (58.7%) | 570 (14.1%) |
| High School Diploma | 9,384 (73.0%) | 617 (4.8%) |
| College / Associate Degree | 8,998 (77.1%) | 280 (2.4%) |
| Bachelor's Degree or higher | 6,013 (86.3%) | 42 (0.6%) |
| Total | 26,758 (75.3%) | 1,350 (3.8%) |
Employment Occupations by Sex in Troup County
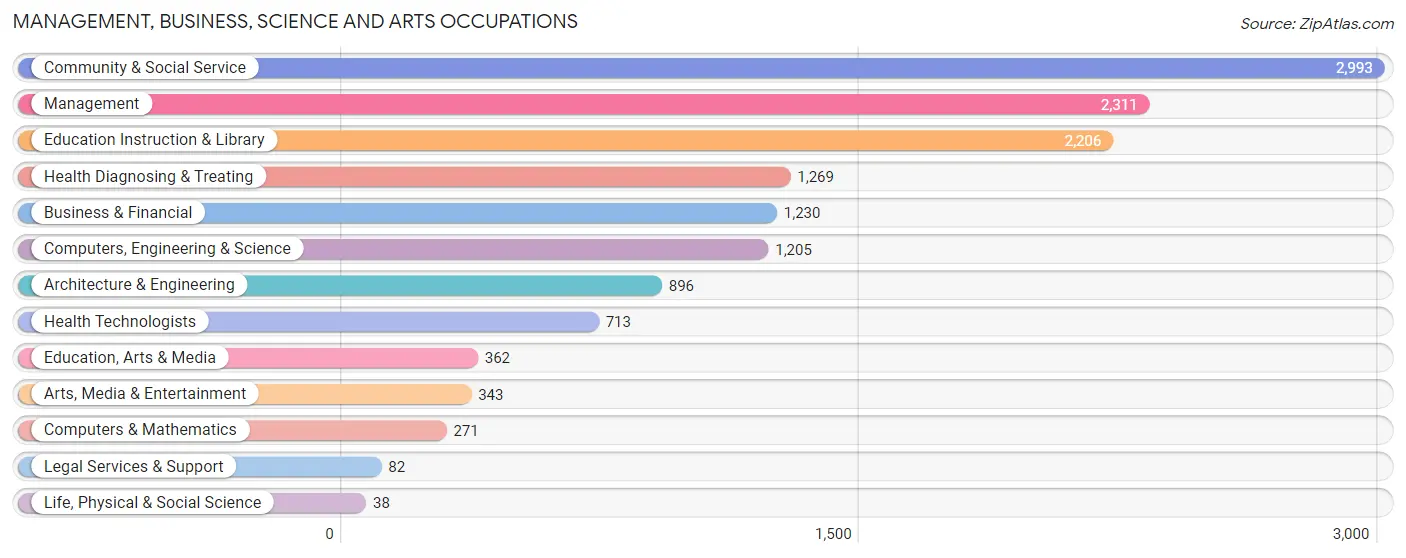
Management, Business, Science and Arts Occupations
The most common Management, Business, Science and Arts occupations in Troup County are Community & Social Service (2,993 | 9.7%), Management (2,311 | 7.4%), Education Instruction & Library (2,206 | 7.1%), Health Diagnosing & Treating (1,269 | 4.1%), and Business & Financial (1,230 | 4.0%).
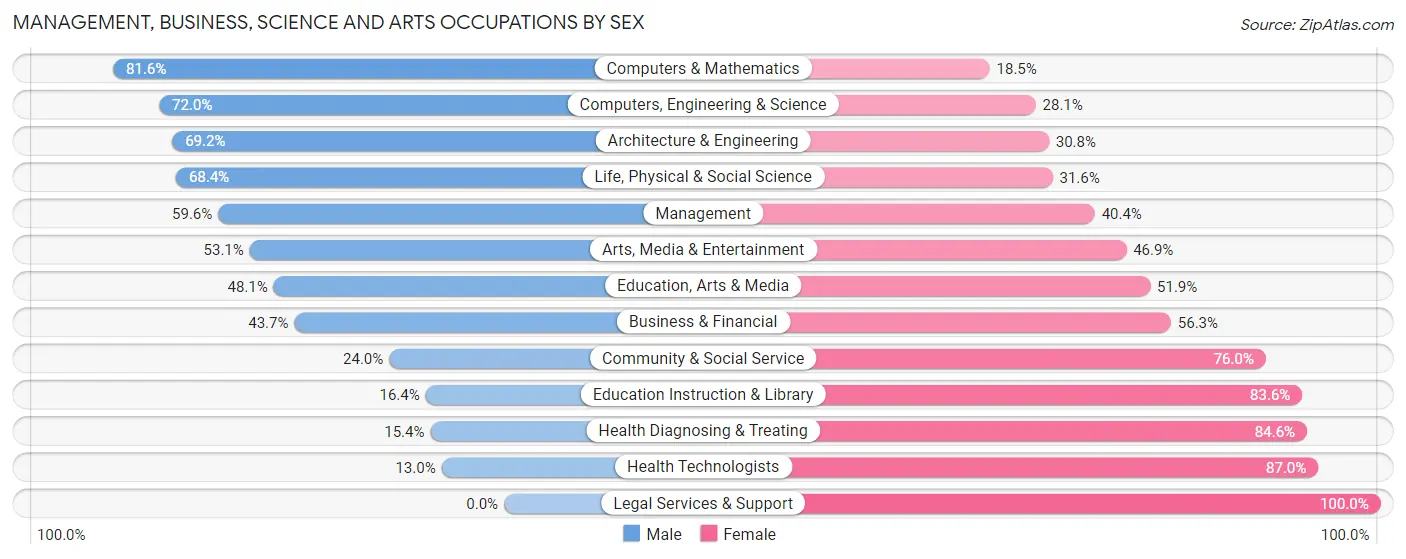
Management, Business, Science and Arts Occupations by Sex
Within the Management, Business, Science and Arts occupations in Troup County, the most male-oriented occupations are Computers & Mathematics (81.6%), Computers, Engineering & Science (72.0%), and Architecture & Engineering (69.2%), while the most female-oriented occupations are Legal Services & Support (100.0%), Health Technologists (87.0%), and Health Diagnosing & Treating (84.6%).
| Occupation | Male | Female |
| Management | 1,378 (59.6%) | 933 (40.4%) |
| Business & Financial | 538 (43.7%) | 692 (56.3%) |
| Computers, Engineering & Science | 867 (72.0%) | 338 (28.1%) |
| Computers & Mathematics | 221 (81.6%) | 50 (18.4%) |
| Architecture & Engineering | 620 (69.2%) | 276 (30.8%) |
| Life, Physical & Social Science | 26 (68.4%) | 12 (31.6%) |
| Community & Social Service | 717 (24.0%) | 2,276 (76.0%) |
| Education, Arts & Media | 174 (48.1%) | 188 (51.9%) |
| Legal Services & Support | 0 (0.0%) | 82 (100.0%) |
| Education Instruction & Library | 361 (16.4%) | 1,845 (83.6%) |
| Arts, Media & Entertainment | 182 (53.1%) | 161 (46.9%) |
| Health Diagnosing & Treating | 195 (15.4%) | 1,074 (84.6%) |
| Health Technologists | 93 (13.0%) | 620 (87.0%) |
| Total (Category) | 3,695 (41.0%) | 5,313 (59.0%) |
| Total (Overall) | 15,283 (49.3%) | 15,717 (50.7%) |
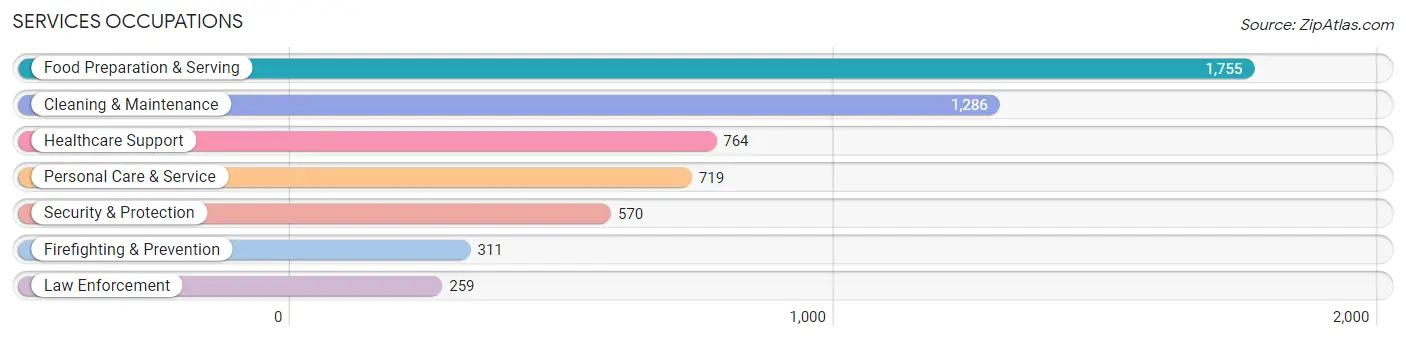
Services Occupations
The most common Services occupations in Troup County are Food Preparation & Serving (1,755 | 5.7%), Cleaning & Maintenance (1,286 | 4.2%), Healthcare Support (764 | 2.5%), Personal Care & Service (719 | 2.3%), and Security & Protection (570 | 1.8%).
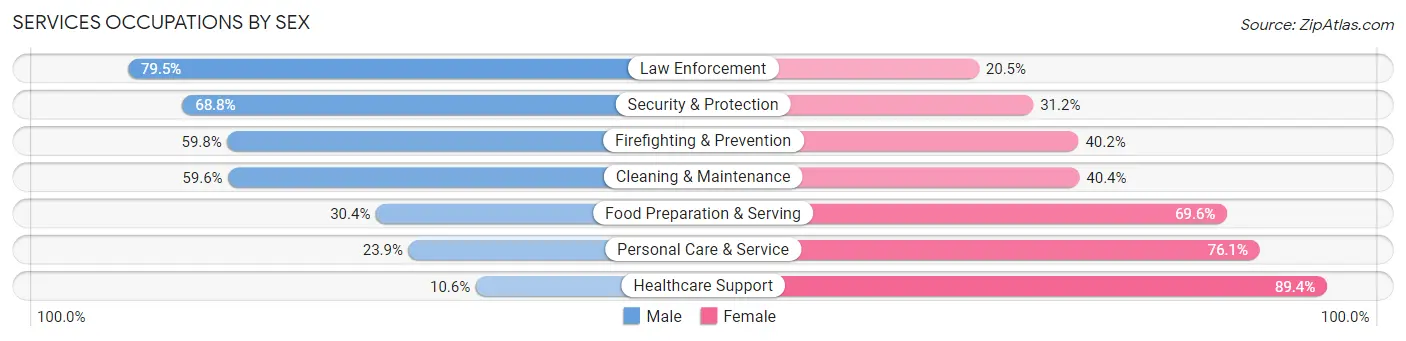
Services Occupations by Sex
Within the Services occupations in Troup County, the most male-oriented occupations are Law Enforcement (79.5%), Security & Protection (68.8%), and Firefighting & Prevention (59.8%), while the most female-oriented occupations are Healthcare Support (89.4%), Personal Care & Service (76.1%), and Food Preparation & Serving (69.6%).
| Occupation | Male | Female |
| Healthcare Support | 81 (10.6%) | 683 (89.4%) |
| Security & Protection | 392 (68.8%) | 178 (31.2%) |
| Firefighting & Prevention | 186 (59.8%) | 125 (40.2%) |
| Law Enforcement | 206 (79.5%) | 53 (20.5%) |
| Food Preparation & Serving | 533 (30.4%) | 1,222 (69.6%) |
| Cleaning & Maintenance | 767 (59.6%) | 519 (40.4%) |
| Personal Care & Service | 172 (23.9%) | 547 (76.1%) |
| Total (Category) | 1,945 (38.2%) | 3,149 (61.8%) |
| Total (Overall) | 15,283 (49.3%) | 15,717 (50.7%) |
Sales and Office Occupations
The most common Sales and Office occupations in Troup County are Office & Administration (3,485 | 11.2%), and Sales & Related (2,983 | 9.6%).

Sales and Office Occupations by Sex

| Occupation | Male | Female |
| Sales & Related | 1,419 (47.6%) | 1,564 (52.4%) |
| Office & Administration | 544 (15.6%) | 2,941 (84.4%) |
| Total (Category) | 1,963 (30.3%) | 4,505 (69.7%) |
| Total (Overall) | 15,283 (49.3%) | 15,717 (50.7%) |
Natural Resources, Construction and Maintenance Occupations
The most common Natural Resources, Construction and Maintenance occupations in Troup County are Installation, Maintenance & Repair (1,317 | 4.3%), Construction & Extraction (963 | 3.1%), and Farming, Fishing & Forestry (28 | 0.1%).

Natural Resources, Construction and Maintenance Occupations by Sex
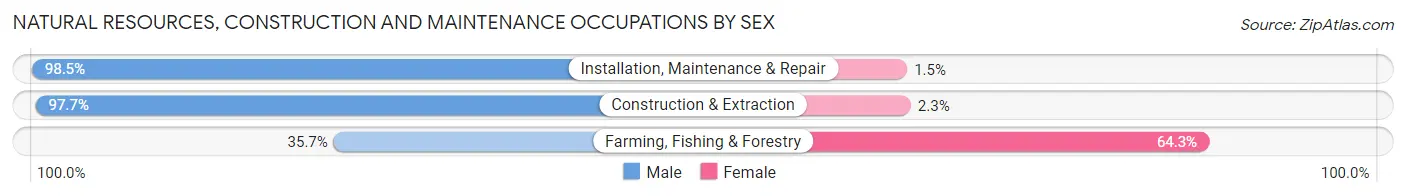
| Occupation | Male | Female |
| Farming, Fishing & Forestry | 10 (35.7%) | 18 (64.3%) |
| Construction & Extraction | 941 (97.7%) | 22 (2.3%) |
| Installation, Maintenance & Repair | 1,297 (98.5%) | 20 (1.5%) |
| Total (Category) | 2,248 (97.4%) | 60 (2.6%) |
| Total (Overall) | 15,283 (49.3%) | 15,717 (50.7%) |
Production, Transportation and Moving Occupations
The most common Production, Transportation and Moving occupations in Troup County are Production (4,358 | 14.1%), Material Moving (2,101 | 6.8%), and Transportation (1,663 | 5.4%).
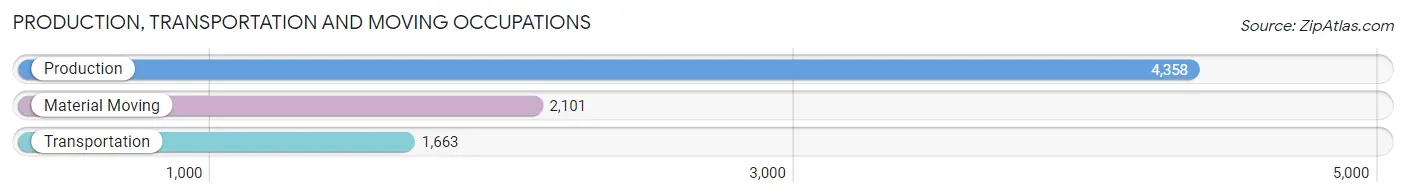
Production, Transportation and Moving Occupations by Sex
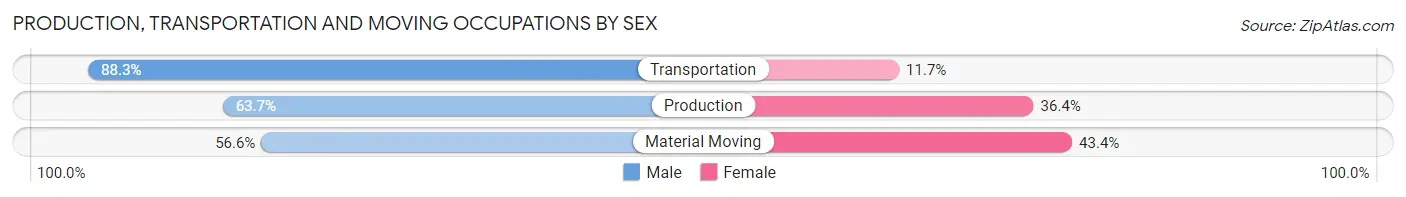
| Occupation | Male | Female |
| Production | 2,774 (63.6%) | 1,584 (36.3%) |
| Transportation | 1,469 (88.3%) | 194 (11.7%) |
| Material Moving | 1,189 (56.6%) | 912 (43.4%) |
| Total (Category) | 5,432 (66.9%) | 2,690 (33.1%) |
| Total (Overall) | 15,283 (49.3%) | 15,717 (50.7%) |
Employment Industries by Sex in Troup County
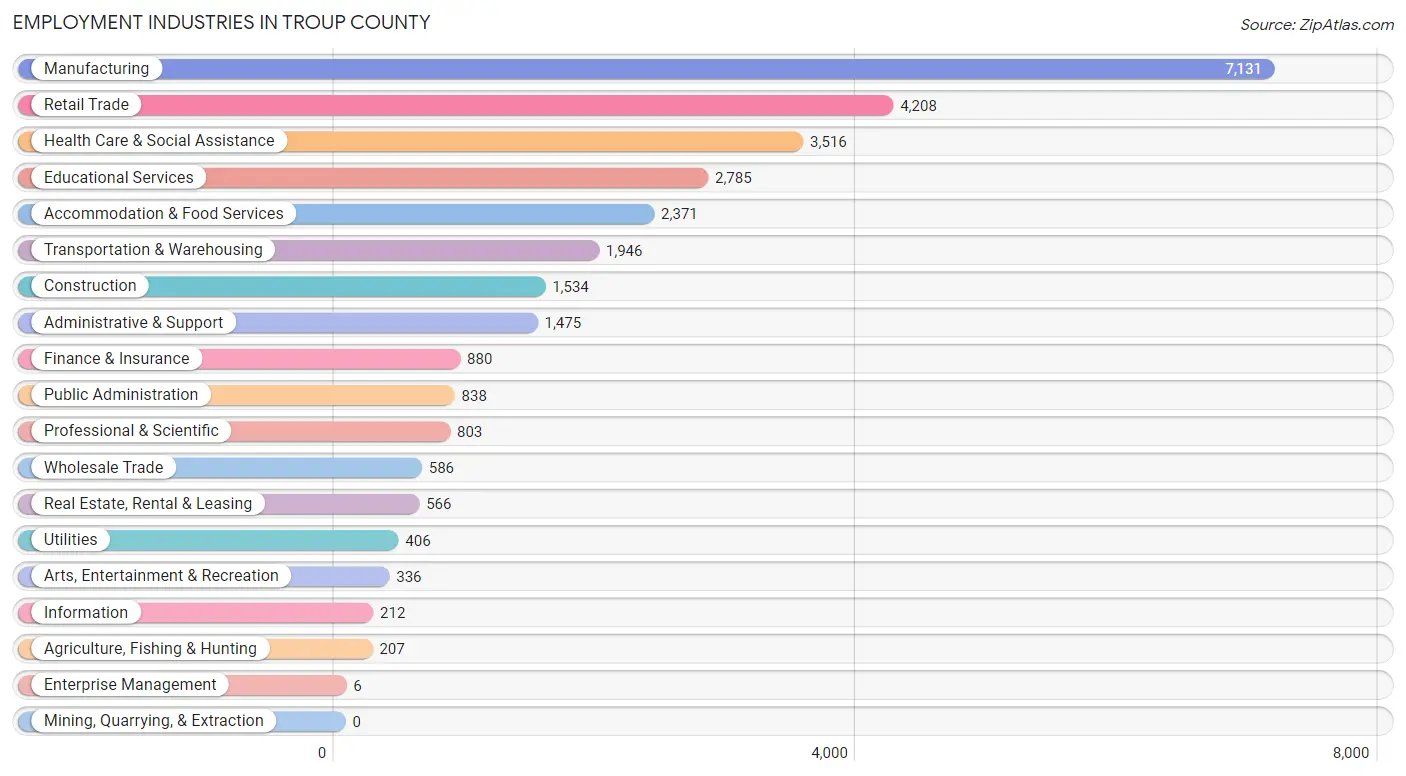
Employment Industries in Troup County
The major employment industries in Troup County include Manufacturing (7,131 | 23.0%), Retail Trade (4,208 | 13.6%), Health Care & Social Assistance (3,516 | 11.3%), Educational Services (2,785 | 9.0%), and Accommodation & Food Services (2,371 | 7.6%).
Employment Industries by Sex in Troup County
The Troup County industries that see more men than women are Enterprise Management (83.3%), Utilities (81.3%), and Construction (78.2%), whereas the industries that tend to have a higher number of women are Health Care & Social Assistance (87.9%), Educational Services (75.9%), and Accommodation & Food Services (59.6%).
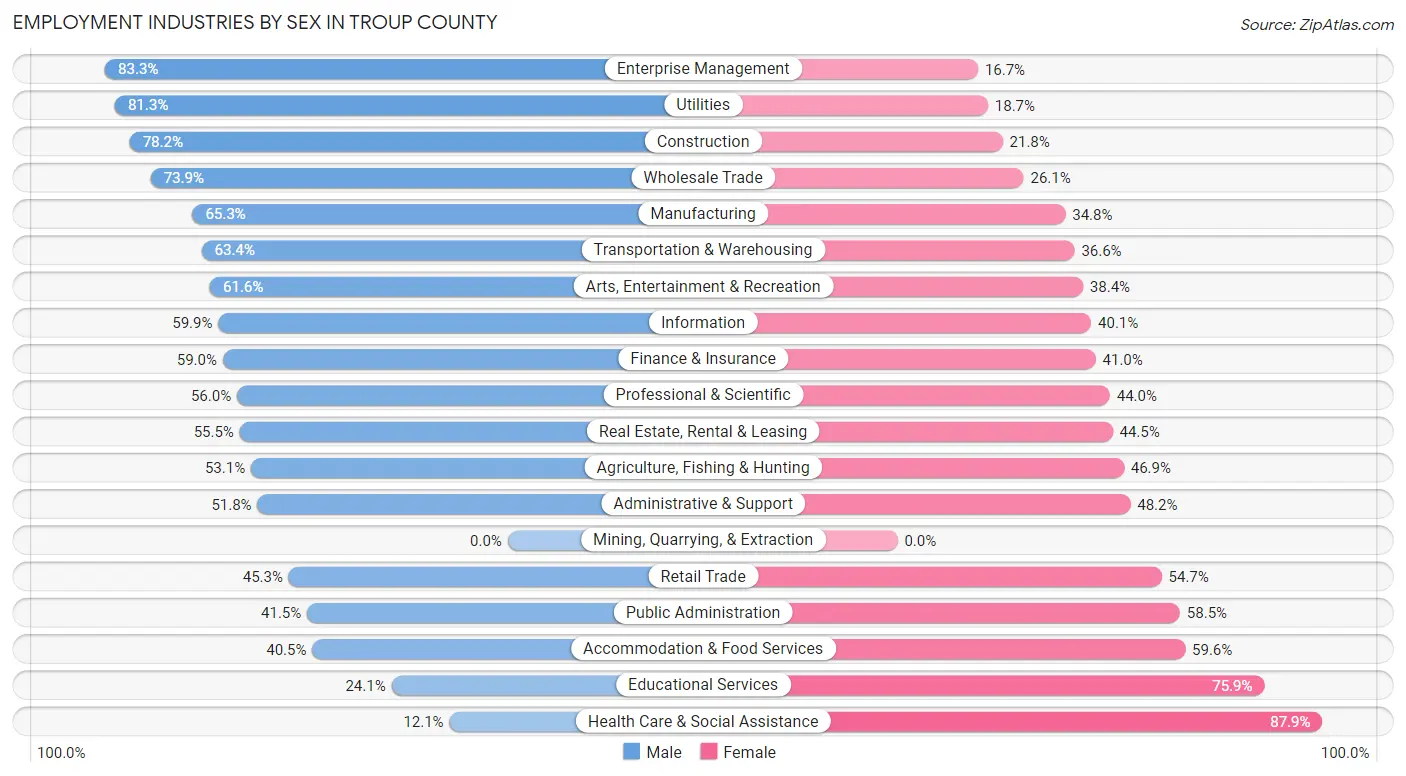
| Industry | Male | Female |
| Agriculture, Fishing & Hunting | 110 (53.1%) | 97 (46.9%) |
| Mining, Quarrying, & Extraction | 0 (0.0%) | 0 (0.0%) |
| Construction | 1,200 (78.2%) | 334 (21.8%) |
| Manufacturing | 4,653 (65.2%) | 2,478 (34.7%) |
| Wholesale Trade | 433 (73.9%) | 153 (26.1%) |
| Retail Trade | 1,907 (45.3%) | 2,301 (54.7%) |
| Transportation & Warehousing | 1,233 (63.4%) | 713 (36.6%) |
| Utilities | 330 (81.3%) | 76 (18.7%) |
| Information | 127 (59.9%) | 85 (40.1%) |
| Finance & Insurance | 519 (59.0%) | 361 (41.0%) |
| Real Estate, Rental & Leasing | 314 (55.5%) | 252 (44.5%) |
| Professional & Scientific | 450 (56.0%) | 353 (44.0%) |
| Enterprise Management | 5 (83.3%) | 1 (16.7%) |
| Administrative & Support | 764 (51.8%) | 711 (48.2%) |
| Educational Services | 670 (24.1%) | 2,115 (75.9%) |
| Health Care & Social Assistance | 424 (12.1%) | 3,092 (87.9%) |
| Arts, Entertainment & Recreation | 207 (61.6%) | 129 (38.4%) |
| Accommodation & Food Services | 959 (40.5%) | 1,412 (59.6%) |
| Public Administration | 348 (41.5%) | 490 (58.5%) |
| Total | 15,283 (49.3%) | 15,717 (50.7%) |
Education in Troup County
School Enrollment in Troup County
The most common levels of schooling among the 17,224 students in Troup County are middle school (4,318 | 25.1%), elementary school (3,501 | 20.3%), and high school (3,412 | 19.8%).
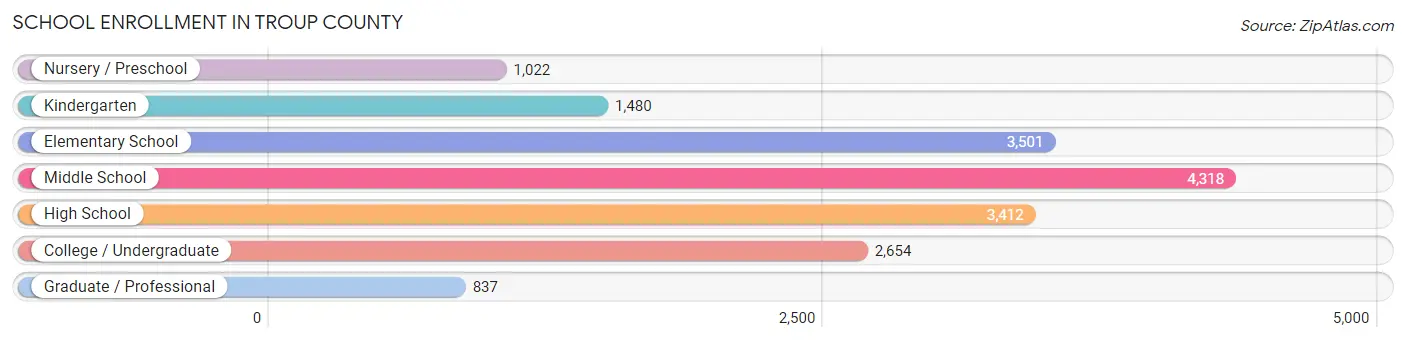
| School Level | # Students | % Students |
| Nursery / Preschool | 1,022 | 5.9% |
| Kindergarten | 1,480 | 8.6% |
| Elementary School | 3,501 | 20.3% |
| Middle School | 4,318 | 25.1% |
| High School | 3,412 | 19.8% |
| College / Undergraduate | 2,654 | 15.4% |
| Graduate / Professional | 837 | 4.9% |
| Total | 17,224 | 100.0% |
School Enrollment by Age by Funding Source in Troup County
Out of a total of 17,224 students who are enrolled in schools in Troup County, 2,256 (13.1%) attend a private institution, while the remaining 14,968 (86.9%) are enrolled in public schools. The age group of 35 years and over has the highest likelihood of being enrolled in private schools, with 244 (22.0% in the age bracket) enrolled. Conversely, the age group of 3 to 4 year olds has the lowest likelihood of being enrolled in a private school, with 797 (96.0% in the age bracket) attending a public institution.
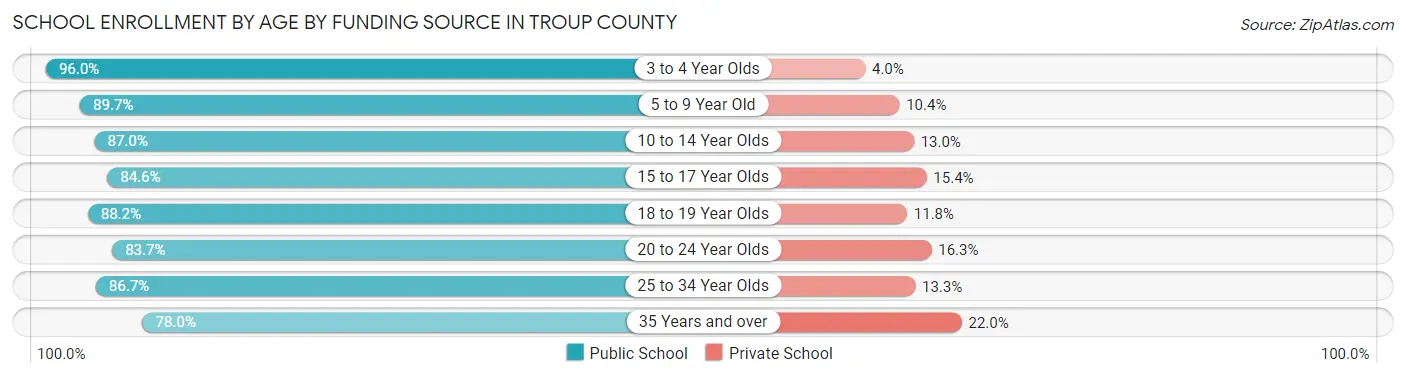
| Age Bracket | Public School | Private School |
| 3 to 4 Year Olds | 797 (96.0%) | 33 (4.0%) |
| 5 to 9 Year Old | 3,662 (89.6%) | 423 (10.3%) |
| 10 to 14 Year Olds | 4,589 (87.0%) | 688 (13.0%) |
| 15 to 17 Year Olds | 2,371 (84.6%) | 432 (15.4%) |
| 18 to 19 Year Olds | 997 (88.2%) | 133 (11.8%) |
| 20 to 24 Year Olds | 851 (83.7%) | 166 (16.3%) |
| 25 to 34 Year Olds | 842 (86.7%) | 129 (13.3%) |
| 35 Years and over | 867 (78.0%) | 244 (22.0%) |
| Total | 14,968 (86.9%) | 2,256 (13.1%) |
Educational Attainment by Field of Study in Troup County
Education (2,304 | 22.9%), business (1,575 | 15.7%), arts & humanities (925 | 9.2%), engineering (871 | 8.7%), and social sciences (762 | 7.6%) are the most common fields of study among 10,049 individuals in Troup County who have obtained a bachelor's degree or higher.
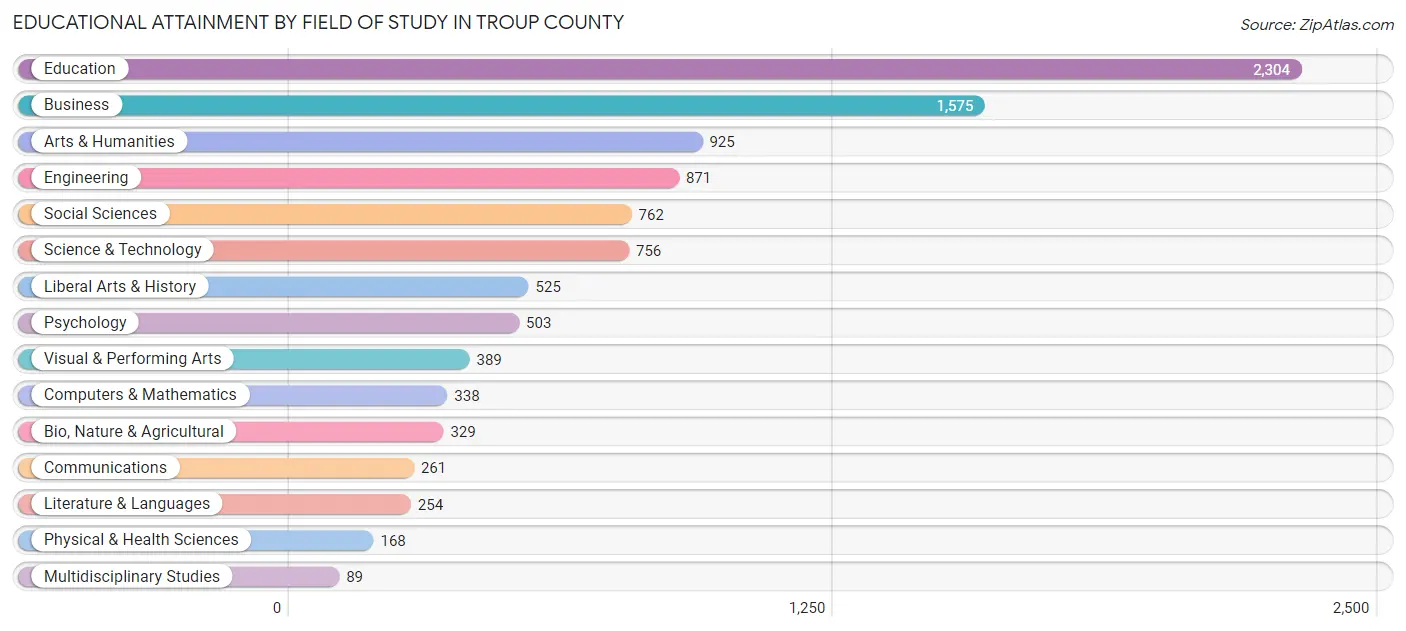
| Field of Study | # Graduates | % Graduates |
| Computers & Mathematics | 338 | 3.4% |
| Bio, Nature & Agricultural | 329 | 3.3% |
| Physical & Health Sciences | 168 | 1.7% |
| Psychology | 503 | 5.0% |
| Social Sciences | 762 | 7.6% |
| Engineering | 871 | 8.7% |
| Multidisciplinary Studies | 89 | 0.9% |
| Science & Technology | 756 | 7.5% |
| Business | 1,575 | 15.7% |
| Education | 2,304 | 22.9% |
| Literature & Languages | 254 | 2.5% |
| Liberal Arts & History | 525 | 5.2% |
| Visual & Performing Arts | 389 | 3.9% |
| Communications | 261 | 2.6% |
| Arts & Humanities | 925 | 9.2% |
| Total | 10,049 | 100.0% |
Transportation & Commute in Troup County
Vehicle Availability by Sex in Troup County
The most prevalent vehicle ownership categories in Troup County are males with 2 vehicles (5,762, accounting for 38.2%) and females with 2 vehicles (5,020, making up 37.5%).
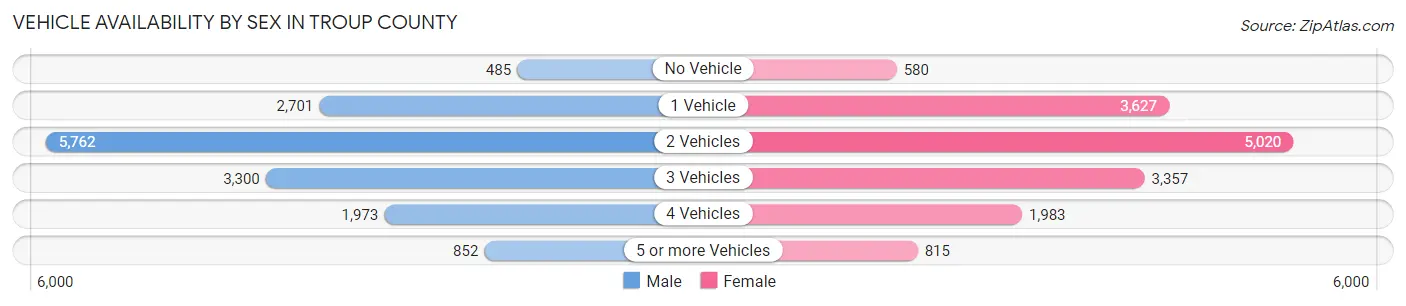
| Vehicles Available | Male | Female |
| No Vehicle | 485 (3.2%) | 580 (3.8%) |
| 1 Vehicle | 2,701 (17.9%) | 3,627 (23.6%) |
| 2 Vehicles | 5,762 (38.2%) | 5,020 (32.6%) |
| 3 Vehicles | 3,300 (21.9%) | 3,357 (21.8%) |
| 4 Vehicles | 1,973 (13.1%) | 1,983 (12.9%) |
| 5 or more Vehicles | 852 (5.7%) | 815 (5.3%) |
| Total | 15,073 (100.0%) | 15,382 (100.0%) |
Commute Time in Troup County
The most frequently occuring commute durations in Troup County are 15 to 19 minutes (6,502 commuters, 22.5%), 10 to 14 minutes (4,839 commuters, 16.7%), and 20 to 24 minutes (4,239 commuters, 14.6%).
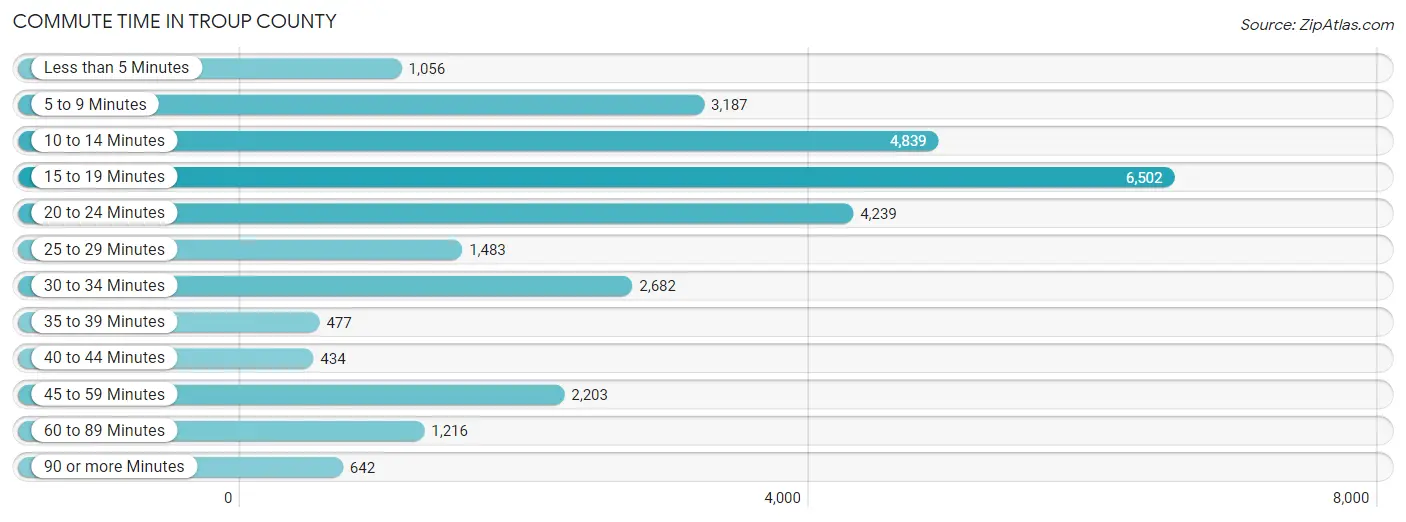
| Commute Time | # Commuters | % Commuters |
| Less than 5 Minutes | 1,056 | 3.6% |
| 5 to 9 Minutes | 3,187 | 11.0% |
| 10 to 14 Minutes | 4,839 | 16.7% |
| 15 to 19 Minutes | 6,502 | 22.5% |
| 20 to 24 Minutes | 4,239 | 14.6% |
| 25 to 29 Minutes | 1,483 | 5.1% |
| 30 to 34 Minutes | 2,682 | 9.3% |
| 35 to 39 Minutes | 477 | 1.7% |
| 40 to 44 Minutes | 434 | 1.5% |
| 45 to 59 Minutes | 2,203 | 7.6% |
| 60 to 89 Minutes | 1,216 | 4.2% |
| 90 or more Minutes | 642 | 2.2% |
Commute Time by Sex in Troup County
The most common commute times in Troup County are 15 to 19 minutes (3,281 commuters, 22.6%) for males and 15 to 19 minutes (3,221 commuters, 22.3%) for females.
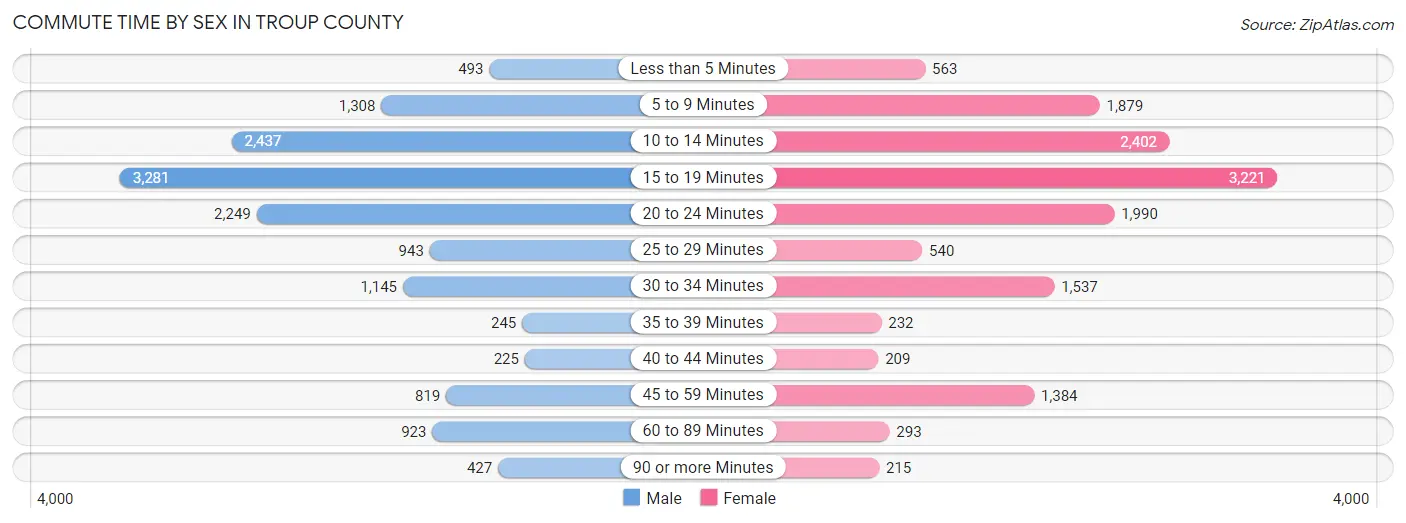
| Commute Time | Male | Female |
| Less than 5 Minutes | 493 (3.4%) | 563 (3.9%) |
| 5 to 9 Minutes | 1,308 (9.0%) | 1,879 (13.0%) |
| 10 to 14 Minutes | 2,437 (16.8%) | 2,402 (16.6%) |
| 15 to 19 Minutes | 3,281 (22.6%) | 3,221 (22.3%) |
| 20 to 24 Minutes | 2,249 (15.5%) | 1,990 (13.8%) |
| 25 to 29 Minutes | 943 (6.5%) | 540 (3.7%) |
| 30 to 34 Minutes | 1,145 (7.9%) | 1,537 (10.6%) |
| 35 to 39 Minutes | 245 (1.7%) | 232 (1.6%) |
| 40 to 44 Minutes | 225 (1.5%) | 209 (1.4%) |
| 45 to 59 Minutes | 819 (5.7%) | 1,384 (9.6%) |
| 60 to 89 Minutes | 923 (6.4%) | 293 (2.0%) |
| 90 or more Minutes | 427 (2.9%) | 215 (1.5%) |
Time of Departure to Work by Sex in Troup County
The most frequent times of departure to work in Troup County are 6:00 AM to 6:29 AM (1,845, 12.7%) for males and 7:00 AM to 7:29 AM (2,068, 14.3%) for females.
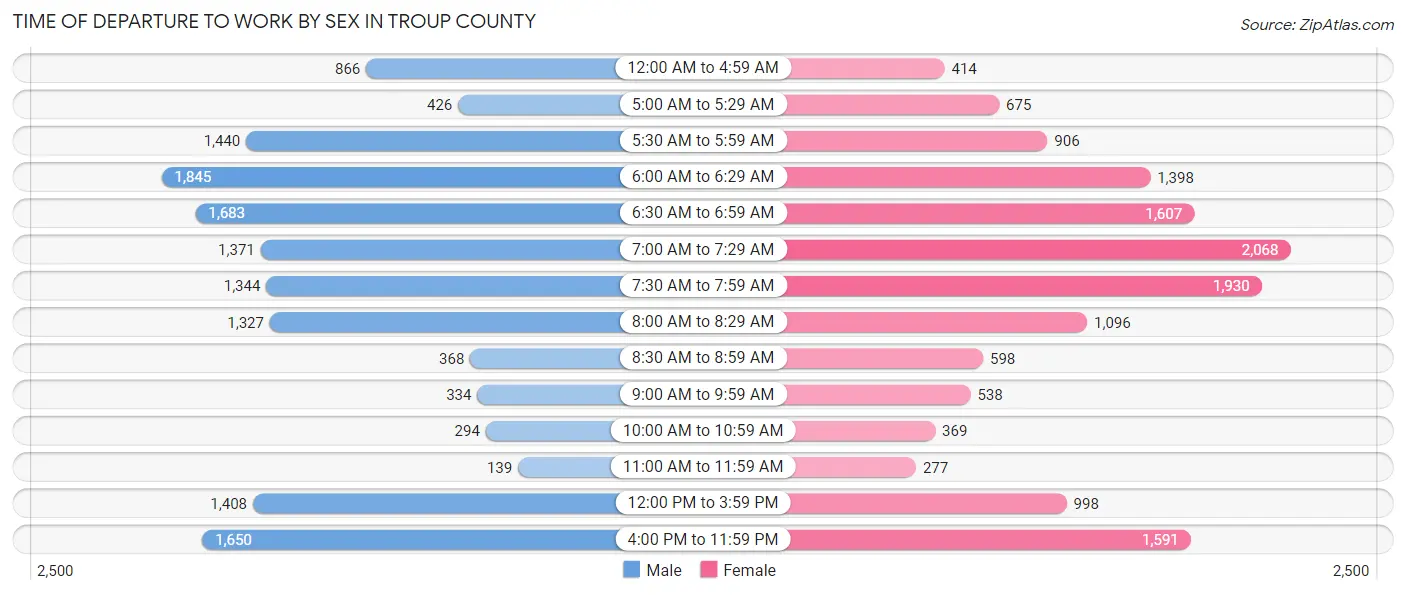
| Time of Departure | Male | Female |
| 12:00 AM to 4:59 AM | 866 (6.0%) | 414 (2.9%) |
| 5:00 AM to 5:29 AM | 426 (2.9%) | 675 (4.7%) |
| 5:30 AM to 5:59 AM | 1,440 (9.9%) | 906 (6.3%) |
| 6:00 AM to 6:29 AM | 1,845 (12.7%) | 1,398 (9.7%) |
| 6:30 AM to 6:59 AM | 1,683 (11.6%) | 1,607 (11.1%) |
| 7:00 AM to 7:29 AM | 1,371 (9.5%) | 2,068 (14.3%) |
| 7:30 AM to 7:59 AM | 1,344 (9.3%) | 1,930 (13.3%) |
| 8:00 AM to 8:29 AM | 1,327 (9.1%) | 1,096 (7.6%) |
| 8:30 AM to 8:59 AM | 368 (2.5%) | 598 (4.1%) |
| 9:00 AM to 9:59 AM | 334 (2.3%) | 538 (3.7%) |
| 10:00 AM to 10:59 AM | 294 (2.0%) | 369 (2.5%) |
| 11:00 AM to 11:59 AM | 139 (1.0%) | 277 (1.9%) |
| 12:00 PM to 3:59 PM | 1,408 (9.7%) | 998 (6.9%) |
| 4:00 PM to 11:59 PM | 1,650 (11.4%) | 1,591 (11.0%) |
| Total | 14,495 (100.0%) | 14,465 (100.0%) |
Housing Occupancy in Troup County
Occupancy by Ownership in Troup County
Of the total 25,587 dwellings in Troup County, owner-occupied units account for 15,218 (59.5%), while renter-occupied units make up 10,369 (40.5%).
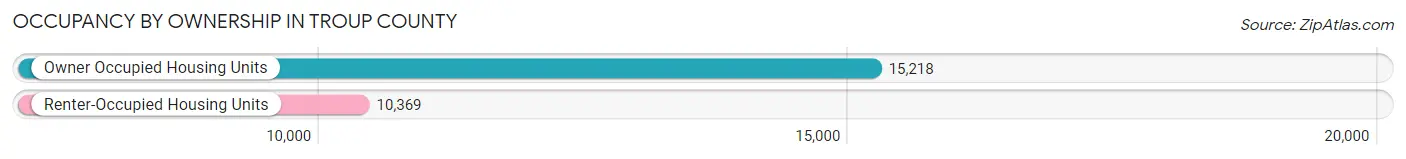
| Occupancy | # Housing Units | % Housing Units |
| Owner Occupied Housing Units | 15,218 | 59.5% |
| Renter-Occupied Housing Units | 10,369 | 40.5% |
| Total Occupied Housing Units | 25,587 | 100.0% |
Occupancy by Household Size in Troup County
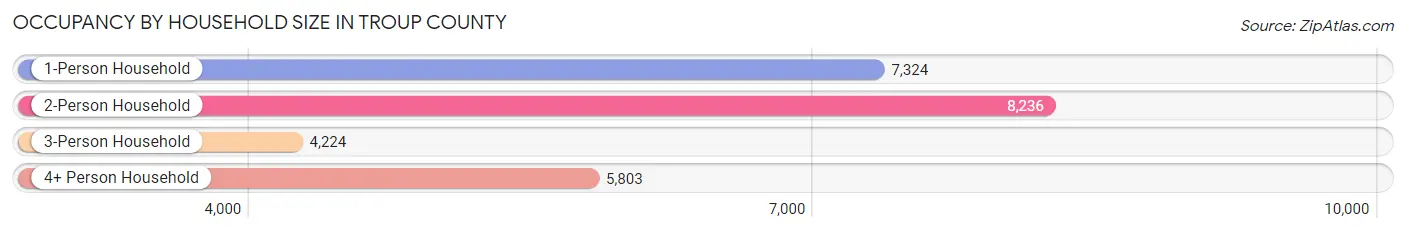
| Household Size | # Housing Units | % Housing Units |
| 1-Person Household | 7,324 | 28.6% |
| 2-Person Household | 8,236 | 32.2% |
| 3-Person Household | 4,224 | 16.5% |
| 4+ Person Household | 5,803 | 22.7% |
| Total Housing Units | 25,587 | 100.0% |
Occupancy by Ownership by Household Size in Troup County
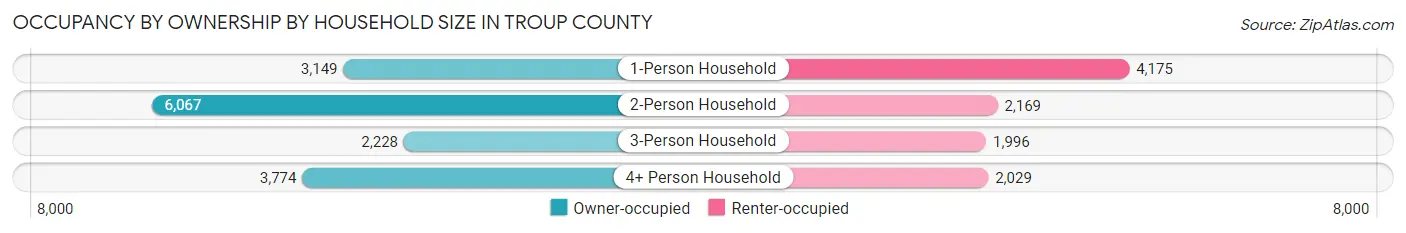
| Household Size | Owner-occupied | Renter-occupied |
| 1-Person Household | 3,149 (43.0%) | 4,175 (57.0%) |
| 2-Person Household | 6,067 (73.7%) | 2,169 (26.3%) |
| 3-Person Household | 2,228 (52.7%) | 1,996 (47.2%) |
| 4+ Person Household | 3,774 (65.0%) | 2,029 (35.0%) |
| Total Housing Units | 15,218 (59.5%) | 10,369 (40.5%) |
Occupancy by Educational Attainment in Troup County
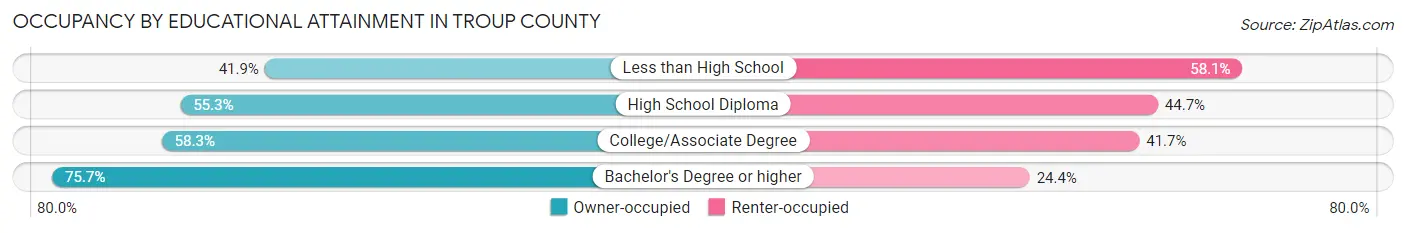
| Household Size | Owner-occupied | Renter-occupied |
| Less than High School | 1,120 (41.9%) | 1,552 (58.1%) |
| High School Diploma | 4,846 (55.3%) | 3,916 (44.7%) |
| College/Associate Degree | 4,872 (58.3%) | 3,491 (41.7%) |
| Bachelor's Degree or higher | 4,380 (75.6%) | 1,410 (24.3%) |
Occupancy by Age of Householder in Troup County
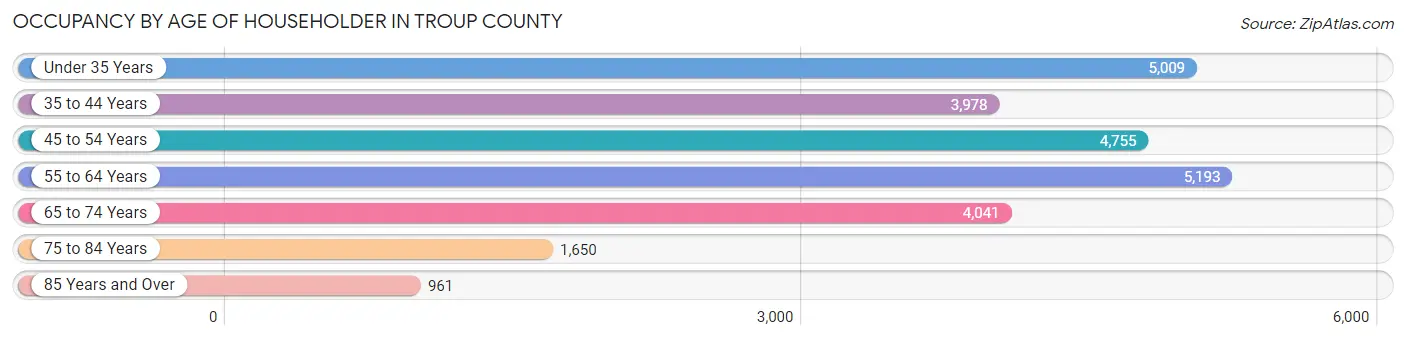
| Age Bracket | # Households | % Households |
| Under 35 Years | 5,009 | 19.6% |
| 35 to 44 Years | 3,978 | 15.5% |
| 45 to 54 Years | 4,755 | 18.6% |
| 55 to 64 Years | 5,193 | 20.3% |
| 65 to 74 Years | 4,041 | 15.8% |
| 75 to 84 Years | 1,650 | 6.5% |
| 85 Years and Over | 961 | 3.8% |
| Total | 25,587 | 100.0% |
Housing Finances in Troup County
Median Income by Occupancy in Troup County
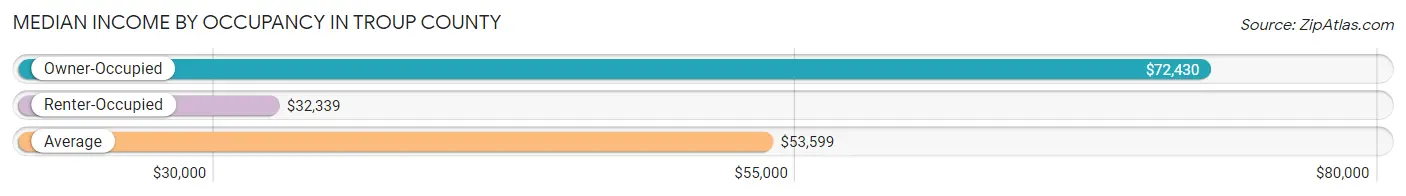
| Occupancy Type | # Households | Median Income |
| Owner-Occupied | 15,218 (59.5%) | $72,430 |
| Renter-Occupied | 10,369 (40.5%) | $32,339 |
| Average | 25,587 (100.0%) | $53,599 |
Occupancy by Householder Income Bracket in Troup County
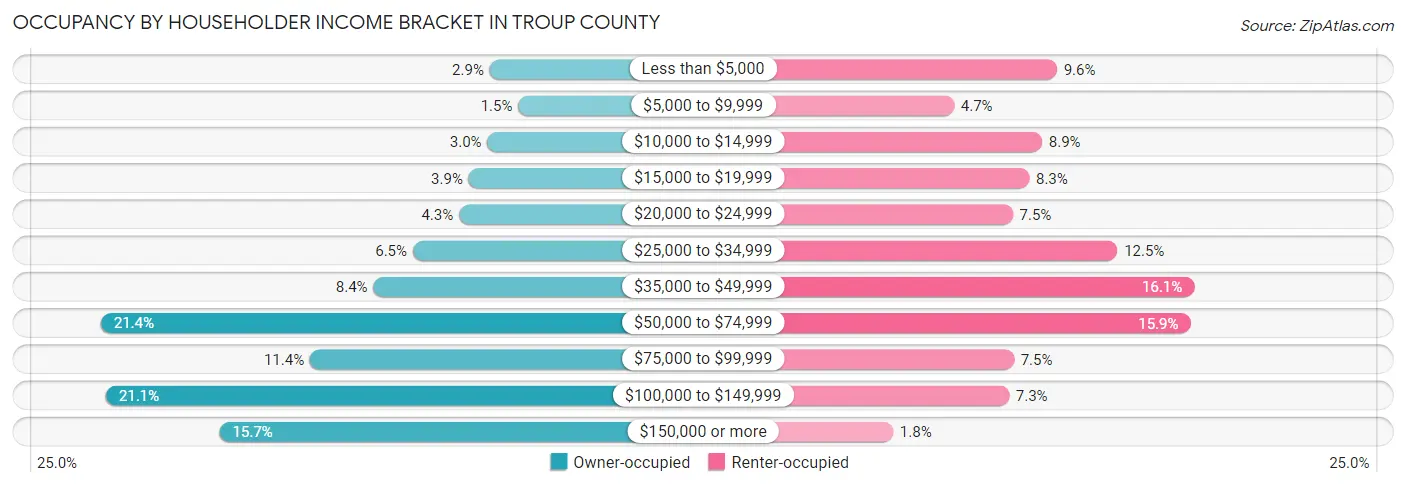
| Income Bracket | Owner-occupied | Renter-occupied |
| Less than $5,000 | 434 (2.9%) | 993 (9.6%) |
| $5,000 to $9,999 | 227 (1.5%) | 485 (4.7%) |
| $10,000 to $14,999 | 450 (3.0%) | 920 (8.9%) |
| $15,000 to $19,999 | 586 (3.8%) | 856 (8.3%) |
| $20,000 to $24,999 | 656 (4.3%) | 776 (7.5%) |
| $25,000 to $34,999 | 990 (6.5%) | 1,292 (12.5%) |
| $35,000 to $49,999 | 1,277 (8.4%) | 1,671 (16.1%) |
| $50,000 to $74,999 | 3,252 (21.4%) | 1,653 (15.9%) |
| $75,000 to $99,999 | 1,737 (11.4%) | 781 (7.5%) |
| $100,000 to $149,999 | 3,216 (21.1%) | 757 (7.3%) |
| $150,000 or more | 2,393 (15.7%) | 185 (1.8%) |
| Total | 15,218 (100.0%) | 10,369 (100.0%) |
Monthly Housing Cost Tiers in Troup County
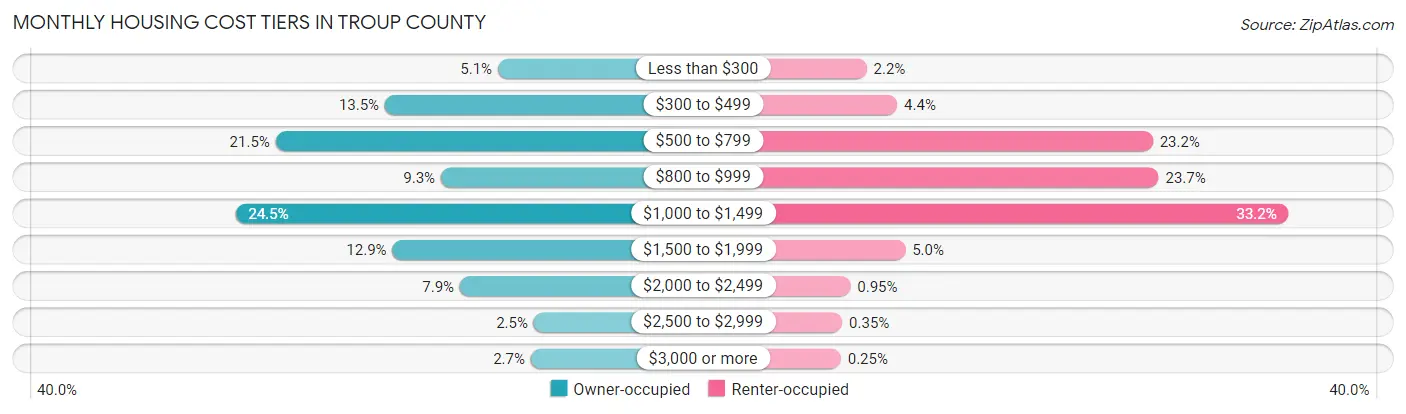
| Monthly Cost | Owner-occupied | Renter-occupied |
| Less than $300 | 782 (5.1%) | 223 (2.1%) |
| $300 to $499 | 2,049 (13.5%) | 456 (4.4%) |
| $500 to $799 | 3,273 (21.5%) | 2,408 (23.2%) |
| $800 to $999 | 1,422 (9.3%) | 2,452 (23.6%) |
| $1,000 to $1,499 | 3,725 (24.5%) | 3,445 (33.2%) |
| $1,500 to $1,999 | 1,964 (12.9%) | 517 (5.0%) |
| $2,000 to $2,499 | 1,208 (7.9%) | 99 (0.9%) |
| $2,500 to $2,999 | 381 (2.5%) | 36 (0.4%) |
| $3,000 or more | 414 (2.7%) | 26 (0.3%) |
| Total | 15,218 (100.0%) | 10,369 (100.0%) |
Physical Housing Characteristics in Troup County
Housing Structures in Troup County
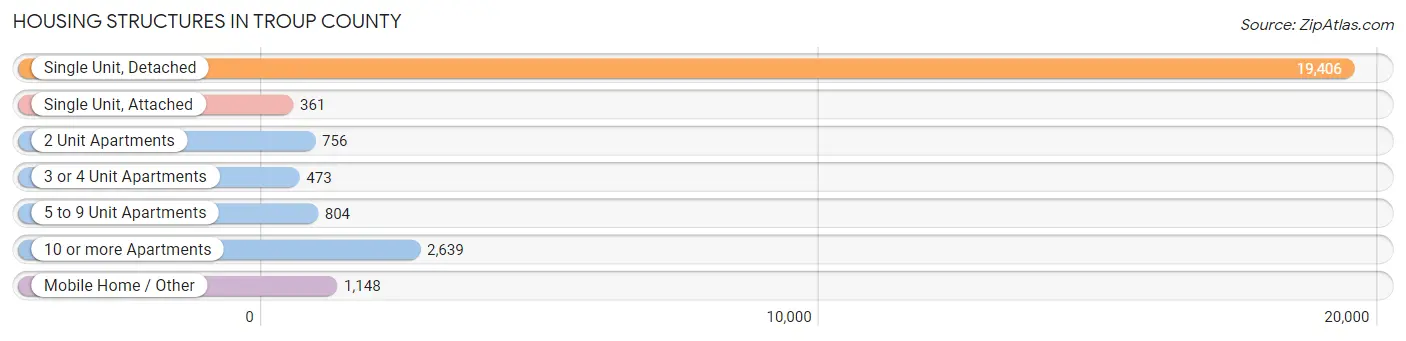
| Structure Type | # Housing Units | % Housing Units |
| Single Unit, Detached | 19,406 | 75.8% |
| Single Unit, Attached | 361 | 1.4% |
| 2 Unit Apartments | 756 | 2.9% |
| 3 or 4 Unit Apartments | 473 | 1.8% |
| 5 to 9 Unit Apartments | 804 | 3.1% |
| 10 or more Apartments | 2,639 | 10.3% |
| Mobile Home / Other | 1,148 | 4.5% |
| Total | 25,587 | 100.0% |
Housing Structures by Occupancy in Troup County
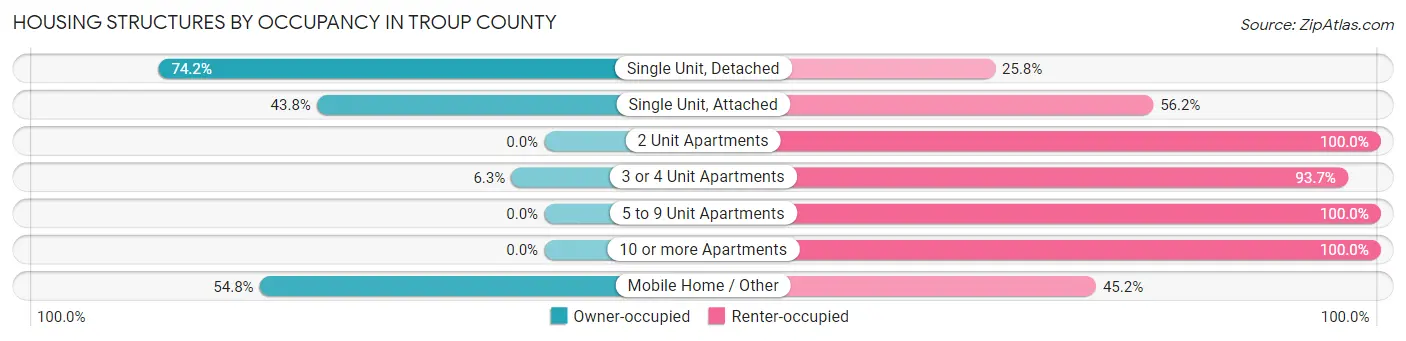
| Structure Type | Owner-occupied | Renter-occupied |
| Single Unit, Detached | 14,401 (74.2%) | 5,005 (25.8%) |
| Single Unit, Attached | 158 (43.8%) | 203 (56.2%) |
| 2 Unit Apartments | 0 (0.0%) | 756 (100.0%) |
| 3 or 4 Unit Apartments | 30 (6.3%) | 443 (93.7%) |
| 5 to 9 Unit Apartments | 0 (0.0%) | 804 (100.0%) |
| 10 or more Apartments | 0 (0.0%) | 2,639 (100.0%) |
| Mobile Home / Other | 629 (54.8%) | 519 (45.2%) |
| Total | 15,218 (59.5%) | 10,369 (40.5%) |
Housing Structures by Number of Rooms in Troup County
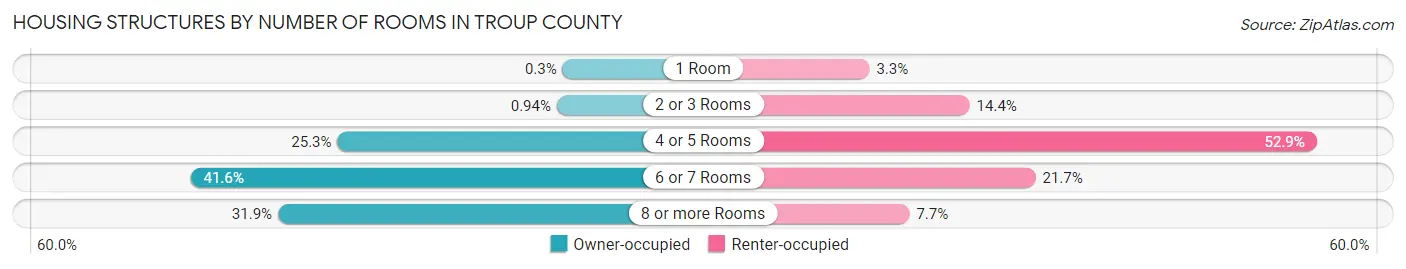
| Number of Rooms | Owner-occupied | Renter-occupied |
| 1 Room | 45 (0.3%) | 340 (3.3%) |
| 2 or 3 Rooms | 143 (0.9%) | 1,493 (14.4%) |
| 4 or 5 Rooms | 3,849 (25.3%) | 5,485 (52.9%) |
| 6 or 7 Rooms | 6,328 (41.6%) | 2,251 (21.7%) |
| 8 or more Rooms | 4,853 (31.9%) | 800 (7.7%) |
| Total | 15,218 (100.0%) | 10,369 (100.0%) |
Housing Structure by Heating Type in Troup County
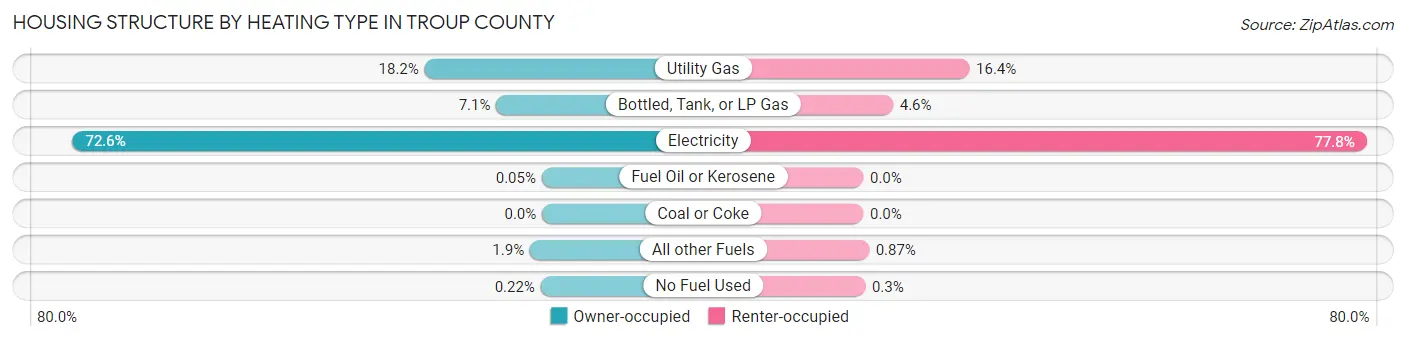
| Heating Type | Owner-occupied | Renter-occupied |
| Utility Gas | 2,763 (18.2%) | 1,701 (16.4%) |
| Bottled, Tank, or LP Gas | 1,078 (7.1%) | 477 (4.6%) |
| Electricity | 11,052 (72.6%) | 8,070 (77.8%) |
| Fuel Oil or Kerosene | 7 (0.1%) | 0 (0.0%) |
| Coal or Coke | 0 (0.0%) | 0 (0.0%) |
| All other Fuels | 285 (1.9%) | 90 (0.9%) |
| No Fuel Used | 33 (0.2%) | 31 (0.3%) |
| Total | 15,218 (100.0%) | 10,369 (100.0%) |
Household Vehicle Usage in Troup County
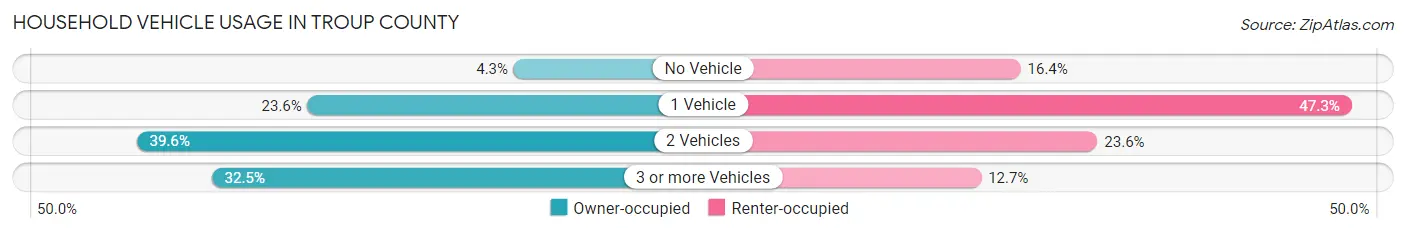
| Vehicles per Household | Owner-occupied | Renter-occupied |
| No Vehicle | 659 (4.3%) | 1,701 (16.4%) |
| 1 Vehicle | 3,588 (23.6%) | 4,905 (47.3%) |
| 2 Vehicles | 6,019 (39.6%) | 2,444 (23.6%) |
| 3 or more Vehicles | 4,952 (32.5%) | 1,319 (12.7%) |
| Total | 15,218 (100.0%) | 10,369 (100.0%) |
Real Estate & Mortgages in Troup County
Real Estate and Mortgage Overview in Troup County
| Characteristic | Without Mortgage | With Mortgage |
| Housing Units | 5,861 | 9,357 |
| Median Property Value | $126,600 | $190,400 |
| Median Household Income | $52,746 | $1,786 |
| Monthly Housing Costs | $517 | $414 |
| Real Estate Taxes | $1,144 | $297 |
Property Value by Mortgage Status in Troup County
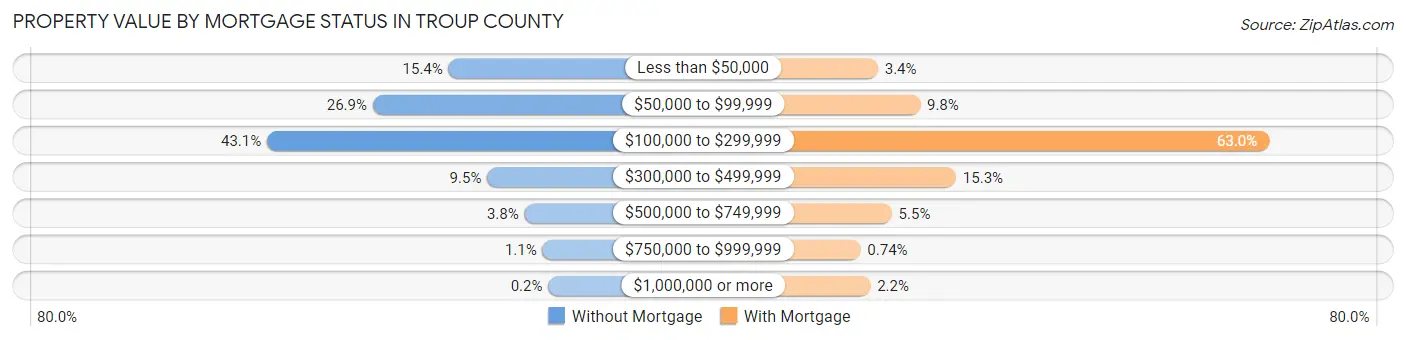
| Property Value | Without Mortgage | With Mortgage |
| Less than $50,000 | 902 (15.4%) | 317 (3.4%) |
| $50,000 to $99,999 | 1,579 (26.9%) | 920 (9.8%) |
| $100,000 to $299,999 | 2,524 (43.1%) | 5,896 (63.0%) |
| $300,000 to $499,999 | 557 (9.5%) | 1,431 (15.3%) |
| $500,000 to $749,999 | 224 (3.8%) | 515 (5.5%) |
| $750,000 to $999,999 | 63 (1.1%) | 69 (0.7%) |
| $1,000,000 or more | 12 (0.2%) | 209 (2.2%) |
| Total | 5,861 (100.0%) | 9,357 (100.0%) |
Household Income by Mortgage Status in Troup County
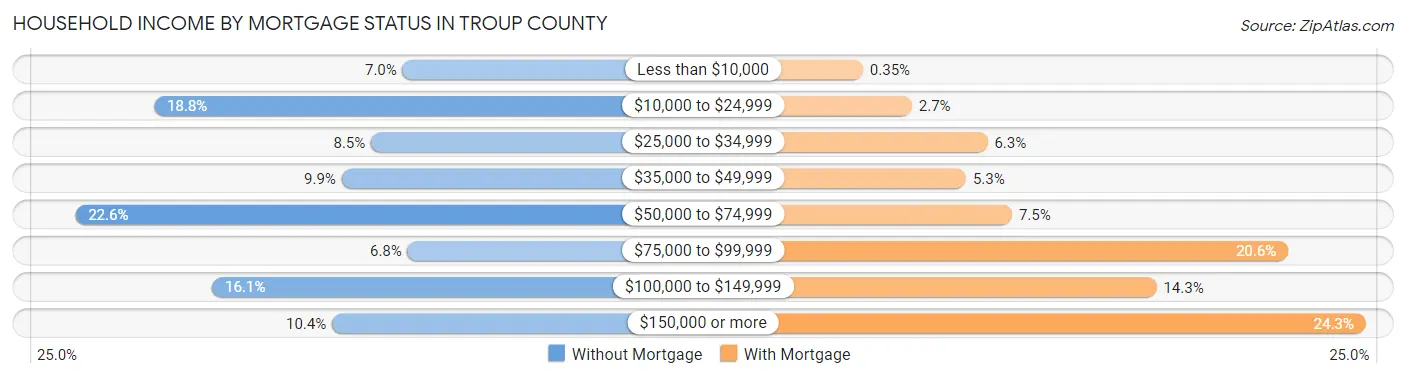
| Household Income | Without Mortgage | With Mortgage |
| Less than $10,000 | 410 (7.0%) | 33 (0.4%) |
| $10,000 to $24,999 | 1,104 (18.8%) | 251 (2.7%) |
| $25,000 to $34,999 | 498 (8.5%) | 588 (6.3%) |
| $35,000 to $49,999 | 580 (9.9%) | 492 (5.3%) |
| $50,000 to $74,999 | 1,324 (22.6%) | 697 (7.4%) |
| $75,000 to $99,999 | 396 (6.8%) | 1,928 (20.6%) |
| $100,000 to $149,999 | 942 (16.1%) | 1,341 (14.3%) |
| $150,000 or more | 607 (10.4%) | 2,274 (24.3%) |
| Total | 5,861 (100.0%) | 9,357 (100.0%) |
Property Value to Household Income Ratio in Troup County
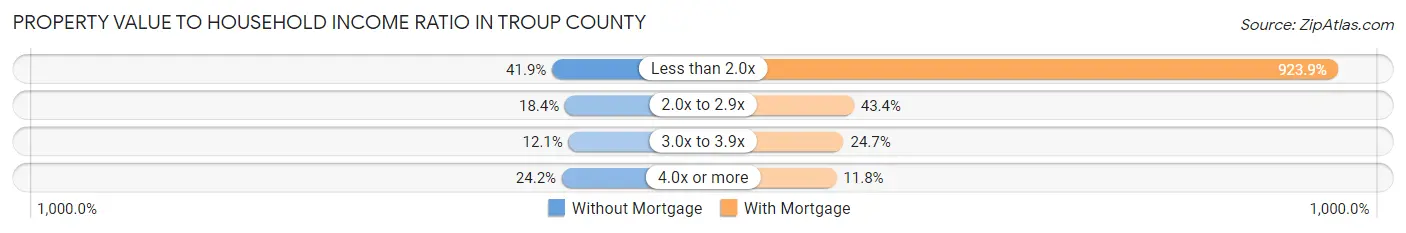
| Value-to-Income Ratio | Without Mortgage | With Mortgage |
| Less than 2.0x | 2,457 (41.9%) | 86,445 (923.9%) |
| 2.0x to 2.9x | 1,080 (18.4%) | 4,061 (43.4%) |
| 3.0x to 3.9x | 707 (12.1%) | 2,311 (24.7%) |
| 4.0x or more | 1,417 (24.2%) | 1,102 (11.8%) |
| Total | 5,861 (100.0%) | 9,357 (100.0%) |
Real Estate Taxes by Mortgage Status in Troup County
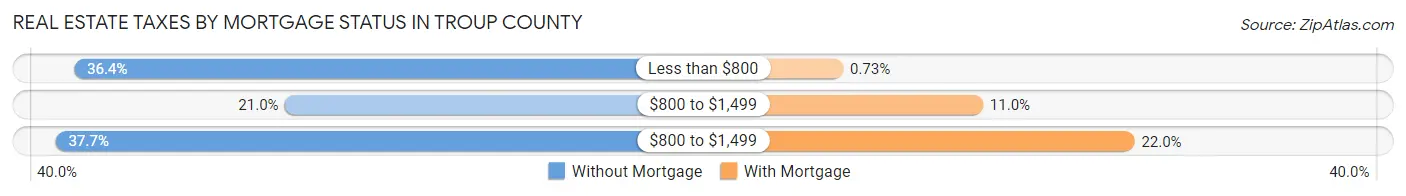
| Property Taxes | Without Mortgage | With Mortgage |
| Less than $800 | 2,132 (36.4%) | 68 (0.7%) |
| $800 to $1,499 | 1,232 (21.0%) | 1,025 (11.0%) |
| $800 to $1,499 | 2,212 (37.7%) | 2,060 (22.0%) |
| Total | 5,861 (100.0%) | 9,357 (100.0%) |
Health & Disability in Troup County
Health Insurance Coverage by Age in Troup County
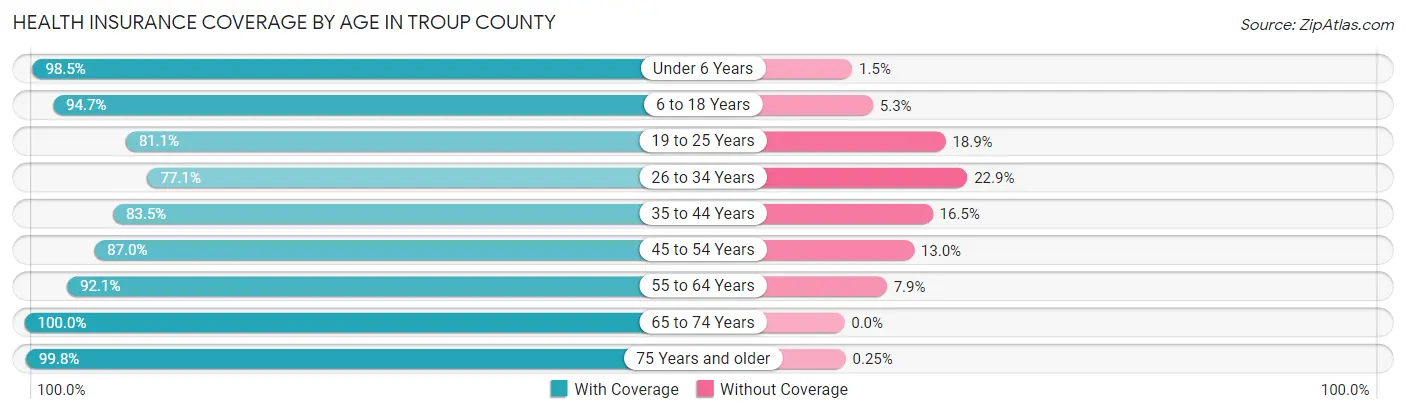
| Age Bracket | With Coverage | Without Coverage |
| Under 6 Years | 5,423 (98.5%) | 81 (1.5%) |
| 6 to 18 Years | 11,574 (94.7%) | 652 (5.3%) |
| 19 to 25 Years | 5,329 (81.1%) | 1,239 (18.9%) |
| 26 to 34 Years | 6,249 (77.1%) | 1,859 (22.9%) |
| 35 to 44 Years | 6,891 (83.5%) | 1,360 (16.5%) |
| 45 to 54 Years | 7,353 (87.0%) | 1,097 (13.0%) |
| 55 to 64 Years | 8,010 (92.1%) | 688 (7.9%) |
| 65 to 74 Years | 6,304 (100.0%) | 0 (0.0%) |
| 75 Years and older | 4,046 (99.8%) | 10 (0.3%) |
| Total | 61,179 (89.7%) | 6,986 (10.2%) |
Health Insurance Coverage by Citizenship Status in Troup County
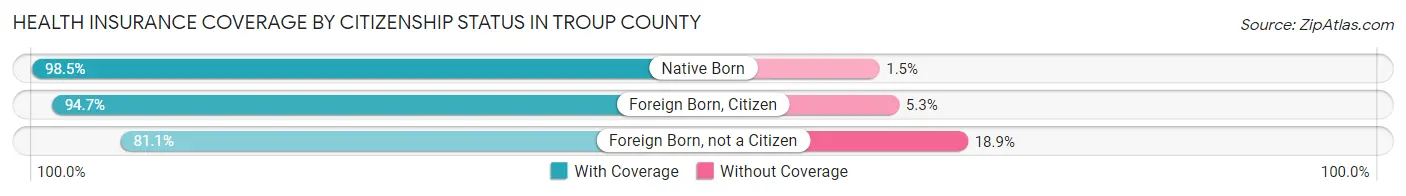
| Citizenship Status | With Coverage | Without Coverage |
| Native Born | 5,423 (98.5%) | 81 (1.5%) |
| Foreign Born, Citizen | 11,574 (94.7%) | 652 (5.3%) |
| Foreign Born, not a Citizen | 5,329 (81.1%) | 1,239 (18.9%) |
Health Insurance Coverage by Household Income in Troup County
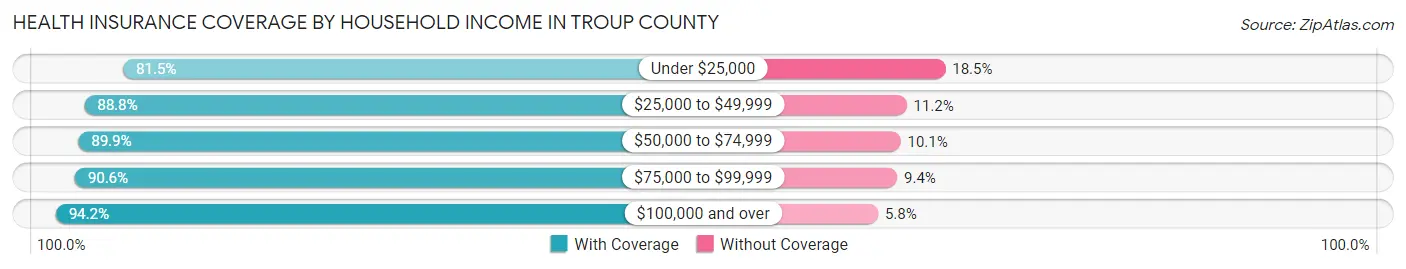
| Household Income | With Coverage | Without Coverage |
| Under $25,000 | 9,476 (81.5%) | 2,146 (18.5%) |
| $25,000 to $49,999 | 11,101 (88.8%) | 1,399 (11.2%) |
| $50,000 to $74,999 | 11,764 (89.9%) | 1,318 (10.1%) |
| $75,000 to $99,999 | 7,323 (90.6%) | 762 (9.4%) |
| $100,000 and over | 21,349 (94.2%) | 1,324 (5.8%) |
Public vs Private Health Insurance Coverage by Age in Troup County
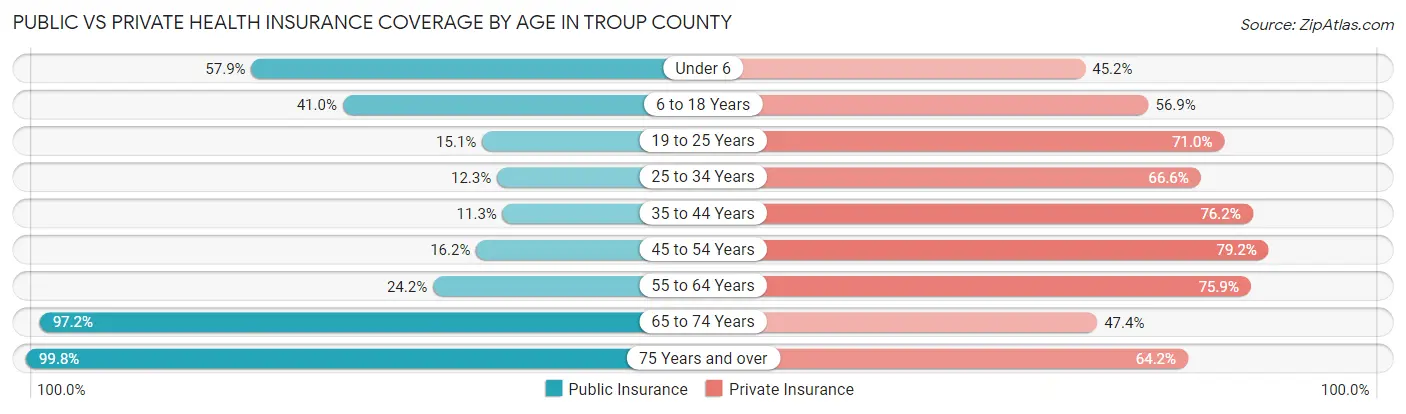
| Age Bracket | Public Insurance | Private Insurance |
| Under 6 | 3,187 (57.9%) | 2,487 (45.2%) |
| 6 to 18 Years | 5,007 (40.9%) | 6,961 (56.9%) |
| 19 to 25 Years | 990 (15.1%) | 4,662 (71.0%) |
| 25 to 34 Years | 998 (12.3%) | 5,399 (66.6%) |
| 35 to 44 Years | 930 (11.3%) | 6,289 (76.2%) |
| 45 to 54 Years | 1,366 (16.2%) | 6,695 (79.2%) |
| 55 to 64 Years | 2,105 (24.2%) | 6,602 (75.9%) |
| 65 to 74 Years | 6,127 (97.2%) | 2,989 (47.4%) |
| 75 Years and over | 4,046 (99.8%) | 2,605 (64.2%) |
| Total | 24,756 (36.3%) | 44,689 (65.6%) |
Disability Status by Sex by Age in Troup County
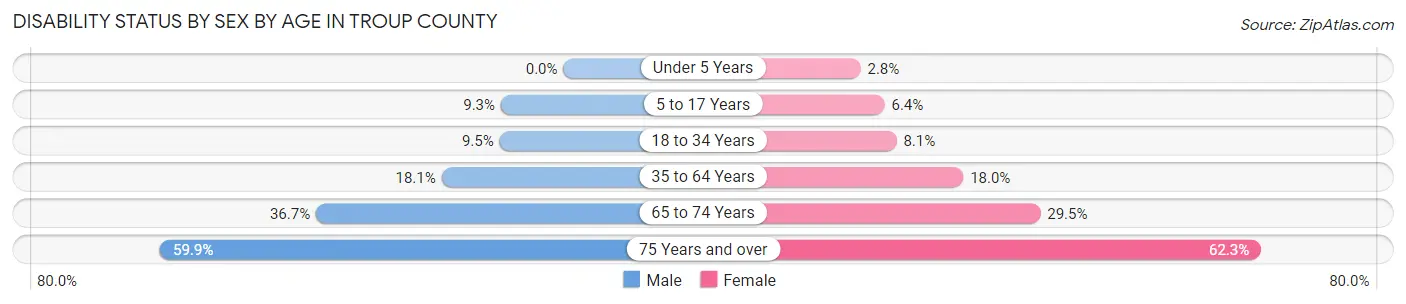
| Age Bracket | Male | Female |
| Under 5 Years | 0 (0.0%) | 60 (2.8%) |
| 5 to 17 Years | 585 (9.3%) | 392 (6.4%) |
| 18 to 34 Years | 701 (9.5%) | 663 (8.1%) |
| 35 to 64 Years | 2,128 (18.1%) | 2,458 (18.0%) |
| 65 to 74 Years | 1,057 (36.7%) | 1,010 (29.5%) |
| 75 Years and over | 909 (59.9%) | 1,580 (62.3%) |
Disability Class by Sex by Age in Troup County
Disability Class: Hearing Difficulty
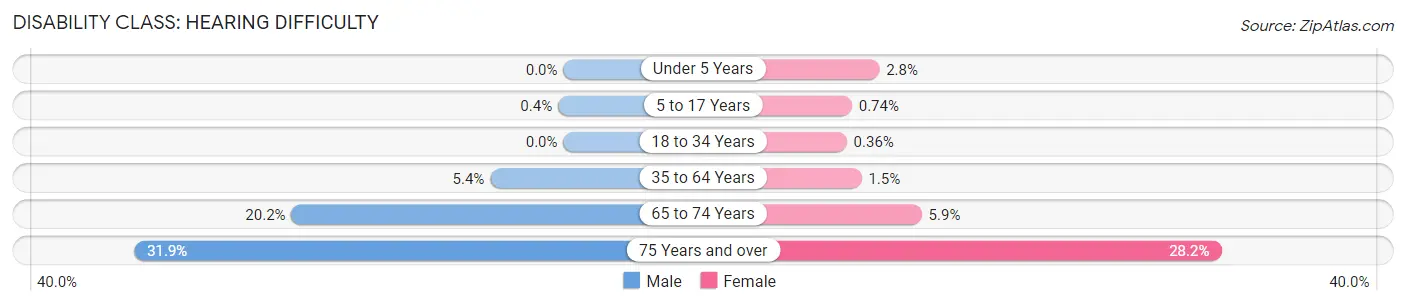
| Age Bracket | Male | Female |
| Under 5 Years | 0 (0.0%) | 60 (2.8%) |
| 5 to 17 Years | 25 (0.4%) | 46 (0.7%) |
| 18 to 34 Years | 0 (0.0%) | 29 (0.4%) |
| 35 to 64 Years | 639 (5.4%) | 199 (1.5%) |
| 65 to 74 Years | 581 (20.2%) | 203 (5.9%) |
| 75 Years and over | 484 (31.9%) | 715 (28.2%) |
Disability Class: Vision Difficulty
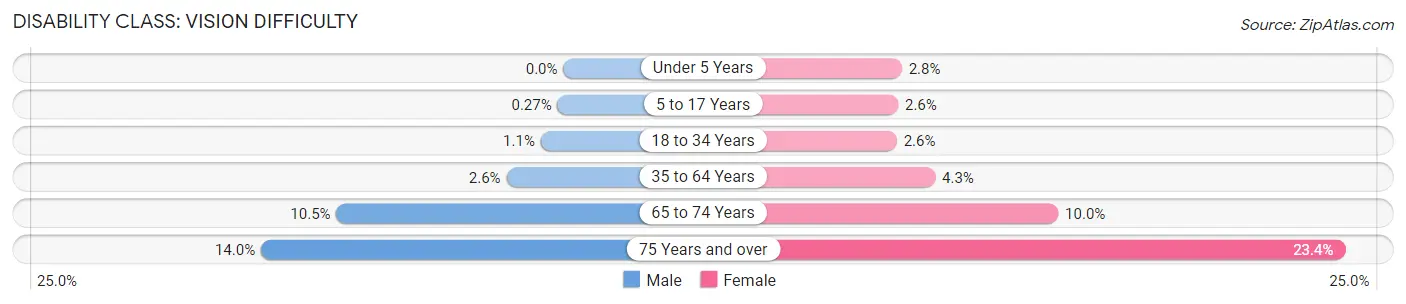
| Age Bracket | Male | Female |
| Under 5 Years | 0 (0.0%) | 60 (2.8%) |
| 5 to 17 Years | 17 (0.3%) | 161 (2.6%) |
| 18 to 34 Years | 78 (1.1%) | 208 (2.5%) |
| 35 to 64 Years | 310 (2.6%) | 591 (4.3%) |
| 65 to 74 Years | 303 (10.5%) | 344 (10.0%) |
| 75 Years and over | 213 (14.0%) | 593 (23.4%) |
Disability Class: Cognitive Difficulty
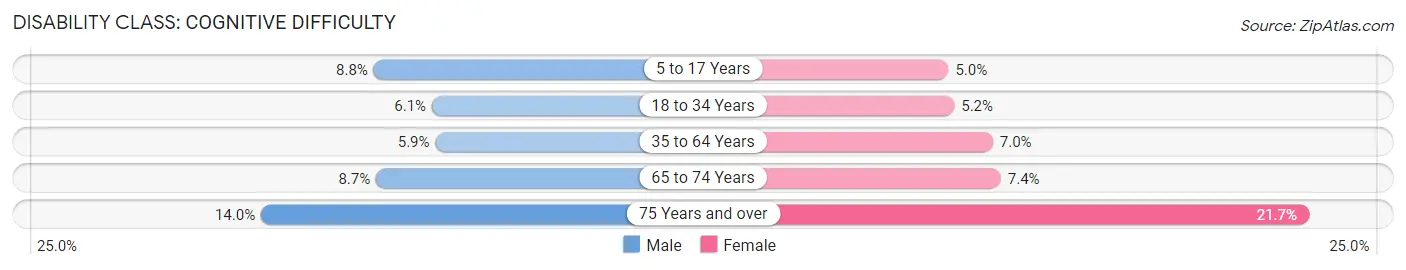
| Age Bracket | Male | Female |
| 5 to 17 Years | 555 (8.8%) | 306 (5.0%) |
| 18 to 34 Years | 451 (6.1%) | 426 (5.2%) |
| 35 to 64 Years | 699 (5.9%) | 956 (7.0%) |
| 65 to 74 Years | 250 (8.7%) | 253 (7.4%) |
| 75 Years and over | 213 (14.0%) | 550 (21.7%) |
Disability Class: Ambulatory Difficulty
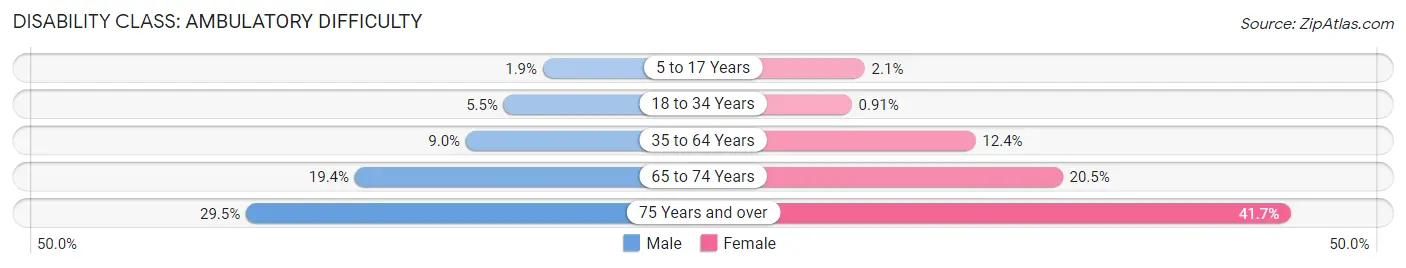
| Age Bracket | Male | Female |
| 5 to 17 Years | 120 (1.9%) | 131 (2.1%) |
| 18 to 34 Years | 409 (5.5%) | 74 (0.9%) |
| 35 to 64 Years | 1,063 (9.0%) | 1,691 (12.4%) |
| 65 to 74 Years | 557 (19.4%) | 702 (20.5%) |
| 75 Years and over | 447 (29.4%) | 1,058 (41.7%) |
Disability Class: Self-Care Difficulty
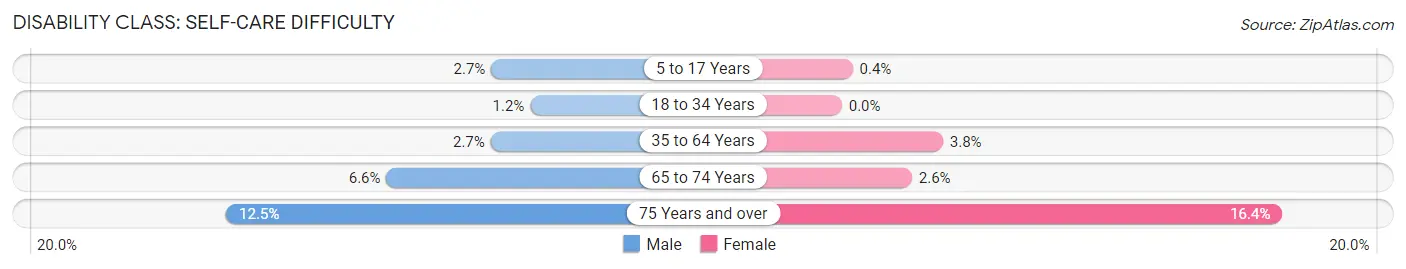
| Age Bracket | Male | Female |
| 5 to 17 Years | 169 (2.7%) | 25 (0.4%) |
| 18 to 34 Years | 91 (1.2%) | 0 (0.0%) |
| 35 to 64 Years | 318 (2.7%) | 512 (3.7%) |
| 65 to 74 Years | 189 (6.6%) | 89 (2.6%) |
| 75 Years and over | 190 (12.5%) | 415 (16.4%) |
Technology Access in Troup County
Computing Device Access in Troup County
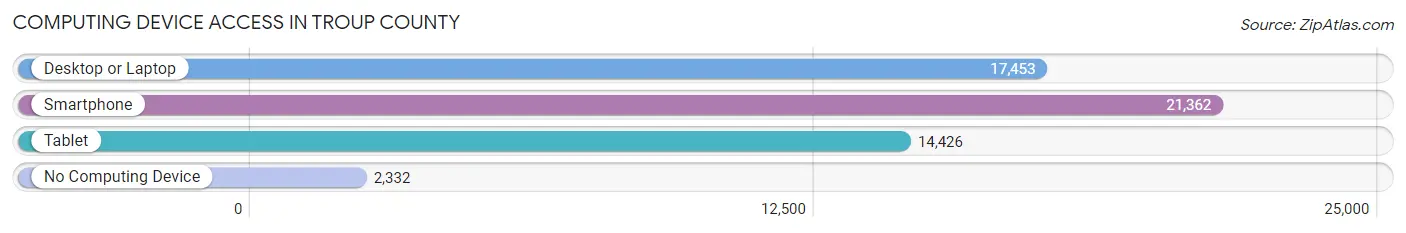
| Device Type | # Households | % Households |
| Desktop or Laptop | 17,453 | 68.2% |
| Smartphone | 21,362 | 83.5% |
| Tablet | 14,426 | 56.4% |
| No Computing Device | 2,332 | 9.1% |
| Total | 25,587 | 100.0% |
Internet Access in Troup County
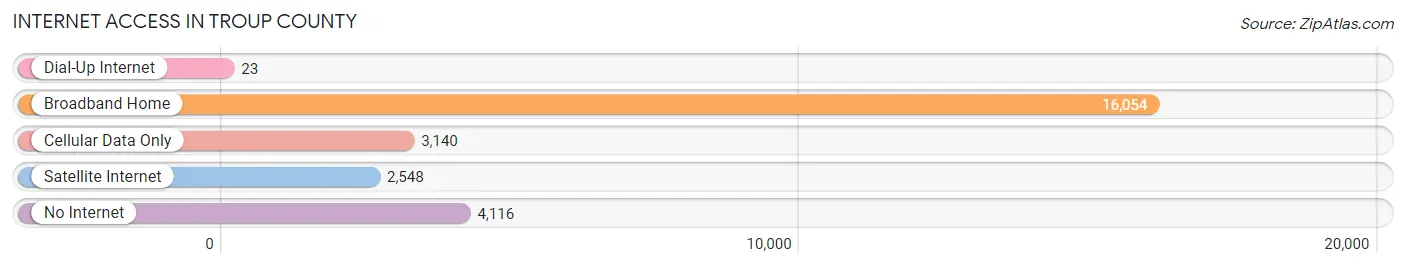
| Internet Type | # Households | % Households |
| Dial-Up Internet | 23 | 0.1% |
| Broadband Home | 16,054 | 62.7% |
| Cellular Data Only | 3,140 | 12.3% |
| Satellite Internet | 2,548 | 10.0% |
| No Internet | 4,116 | 16.1% |
| Total | 25,587 | 100.0% |
Troup County Summary
Troup County is located in the west-central part of the state of Georgia, in the foothills of the Appalachian Mountains. It is bordered by Meriwether County to the north, Heard County to the east, Coweta County to the south, and Harris County to the west. The county seat is LaGrange, which is also the largest city in the county.
History
Troup County was created in 1826 from parts of Carroll, Coweta, and Muscogee counties. It was named for George Troup, a former governor of Georgia. The county was originally part of the Creek Nation, and the area was home to the Creek Indians until the Indian Removal Act of 1830.
The county was developed in the early 19th century by settlers from the Carolinas, Virginia, and Georgia. The county was home to several prominent families, including the Troup, Heard, and Hardaway families. The county was also home to several prominent plantations, including the Troup Plantation, which was owned by Governor Troup.
The county was the site of several Civil War battles, including the Battle of West Point and the Battle of LaGrange. After the war, the county was home to several freedmen's settlements, including the West Point Settlement and the LaGrange Settlement.
Geography
Troup County covers an area of 441 square miles, making it the 33rd largest county in Georgia. The county is located in the foothills of the Appalachian Mountains, and is mostly hilly and forested. The county is drained by the Chattahoochee River, which forms the western border of the county.
The county is home to several state parks, including West Point Lake State Park, Franklin D. Roosevelt State Park, and F.D. Roosevelt State Park. The county is also home to several historic sites, including the Troup County Courthouse, the LaGrange College Historic District, and the West Point Historic District.
Economy
Troup County has a diverse economy, with a mix of manufacturing, agriculture, and services. The county is home to several major employers, including Kia Motors Manufacturing Georgia, LaGrange College, and West Point-Pepperell.
The county is also home to several agricultural operations, including poultry farms, cattle farms, and vegetable farms. The county is also home to several wineries, including the Troup County Winery and the LaGrange Winery.
Demographics
As of the 2010 census, Troup County had a population of 67,044. The racial makeup of the county was 63.3% White, 32.2% African American, 0.5% Native American, 1.2% Asian, 0.1% Pacific Islander, 1.7% from other races, and 1.2% from two or more races. Hispanic or Latino of any race were 3.7% of the population.
The median income for a household in the county was $41,945, and the median income for a family was $50,945. The per capita income for the county was $20,945. About 15.3% of the population was below the poverty line.
Common Questions
What is Per Capita Income in Troup County?
Per Capita income in Troup County is $29,562.
What is the Median Family Income in Troup County?
Median Family Income in Troup County is $69,126.
What is the Median Household income in Troup County?
Median Household Income in Troup County is $53,599.
What is Income or Wage Gap in Troup County?
Income or Wage Gap in Troup County is 28.8%.
Women in Troup County earn 71.2 cents for every dollar earned by a man.
What is Family Income Deficit in Troup County?
Family Income Deficit in Troup County is $11,451.
Families that are below poverty line in Troup County earn $11,451 less on average than the poverty threshold level.
What is Inequality or Gini Index in Troup County?
Inequality or Gini Index in Troup County is 0.49.
What is the Total Population of Troup County?
Total Population of Troup County is 69,527.
What is the Total Male Population of Troup County?
Total Male Population of Troup County is 33,108.
What is the Total Female Population of Troup County?
Total Female Population of Troup County is 36,419.
What is the Ratio of Males per 100 Females in Troup County?
There are 90.91 Males per 100 Females in Troup County.
What is the Ratio of Females per 100 Males in Troup County?
There are 110.00 Females per 100 Males in Troup County.
What is the Median Population Age in Troup County?
Median Population Age in Troup County is 37.2 Years.
What is the Average Family Size in Troup County
Average Family Size in Troup County is 3.3 People.
What is the Average Household Size in Troup County
Average Household Size in Troup County is 2.7 People.
How Large is the Labor Force in Troup County?
There are 32,692 People in the Labor Forcein in Troup County.
What is the Percentage of People in the Labor Force in Troup County?
60.2% of People are in the Labor Force in Troup County.
What is the Unemployment Rate in Troup County?
Unemployment Rate in Troup County is 4.8%.