Towns County, GA Map & Demographics
Towns County Map
Towns County Overview
$33,443
PER CAPITA INCOME
$69,016
AVG FAMILY INCOME
$55,574
AVG HOUSEHOLD INCOME
31.5%
WAGE / INCOME GAP [ % ]
68.5¢/ $1
WAGE / INCOME GAP [ $ ]
0.48
INEQUALITY / GINI INDEX
12,546
TOTAL POPULATION
6,034
MALE POPULATION
6,512
FEMALE POPULATION
92.66
MALES / 100 FEMALES
107.92
FEMALES / 100 MALES
56.3
MEDIAN AGE
2.6
AVG FAMILY SIZE
2.1
AVG HOUSEHOLD SIZE
4,897
LABOR FORCE [ PEOPLE ]
43.8%
PERCENT IN LABOR FORCE
5.5%
UNEMPLOYMENT RATE
Income in Towns County
Income Overview in Towns County
Per Capita Income in Towns County is $33,443, while median incomes of families and households are $69,016 and $55,574 respectively.
| Characteristic | Number | Measure |
| Per Capita Income | 12,546 | $33,443 |
| Median Family Income | 3,601 | $69,016 |
| Mean Family Income | 3,601 | $92,484 |
| Median Household Income | 5,464 | $55,574 |
| Mean Household Income | 5,464 | $75,397 |
| Income Deficit | 3,601 | $0 |
| Wage / Income Gap (%) | 12,546 | 31.47% |
| Wage / Income Gap ($) | 12,546 | 68.53¢ per $1 |
| Gini / Inequality Index | 12,546 | 0.48 |
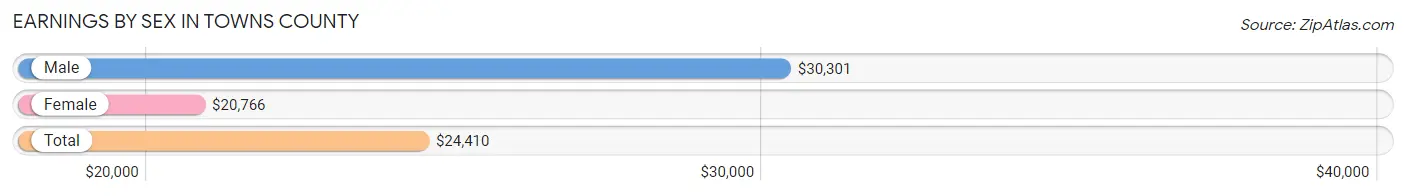
Earnings by Sex in Towns County
Average Earnings in Towns County are $24,410, $30,301 for men and $20,766 for women, a difference of 31.5%.
| Sex | Number | Average Earnings |
| Male | 3,062 (55.9%) | $30,301 |
| Female | 2,419 (44.1%) | $20,766 |
| Total | 5,481 (100.0%) | $24,410 |
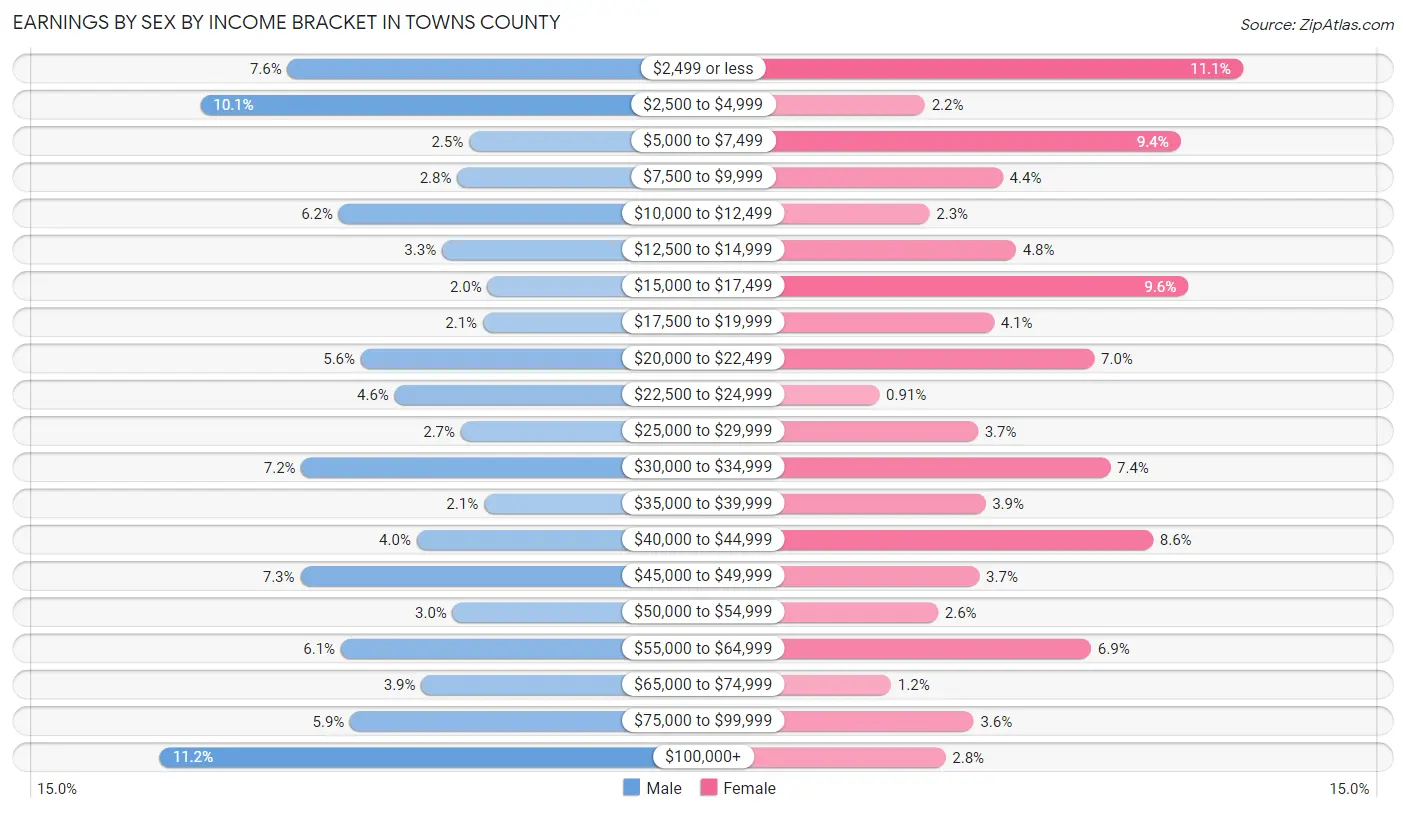
Earnings by Sex by Income Bracket in Towns County
The most common earnings brackets in Towns County are $100,000+ for men (343 | 11.2%) and $2,499 or less for women (269 | 11.1%).
| Income | Male | Female |
| $2,499 or less | 233 (7.6%) | 269 (11.1%) |
| $2,500 to $4,999 | 308 (10.1%) | 53 (2.2%) |
| $5,000 to $7,499 | 77 (2.5%) | 227 (9.4%) |
| $7,500 to $9,999 | 87 (2.8%) | 106 (4.4%) |
| $10,000 to $12,499 | 189 (6.2%) | 56 (2.3%) |
| $12,500 to $14,999 | 100 (3.3%) | 115 (4.8%) |
| $15,000 to $17,499 | 61 (2.0%) | 232 (9.6%) |
| $17,500 to $19,999 | 65 (2.1%) | 100 (4.1%) |
| $20,000 to $22,499 | 170 (5.6%) | 168 (7.0%) |
| $22,500 to $24,999 | 141 (4.6%) | 22 (0.9%) |
| $25,000 to $29,999 | 84 (2.7%) | 89 (3.7%) |
| $30,000 to $34,999 | 221 (7.2%) | 179 (7.4%) |
| $35,000 to $39,999 | 64 (2.1%) | 94 (3.9%) |
| $40,000 to $44,999 | 122 (4.0%) | 208 (8.6%) |
| $45,000 to $49,999 | 222 (7.2%) | 90 (3.7%) |
| $50,000 to $54,999 | 91 (3.0%) | 62 (2.6%) |
| $55,000 to $64,999 | 187 (6.1%) | 166 (6.9%) |
| $65,000 to $74,999 | 118 (3.8%) | 30 (1.2%) |
| $75,000 to $99,999 | 179 (5.9%) | 86 (3.6%) |
| $100,000+ | 343 (11.2%) | 67 (2.8%) |
| Total | 3,062 (100.0%) | 2,419 (100.0%) |
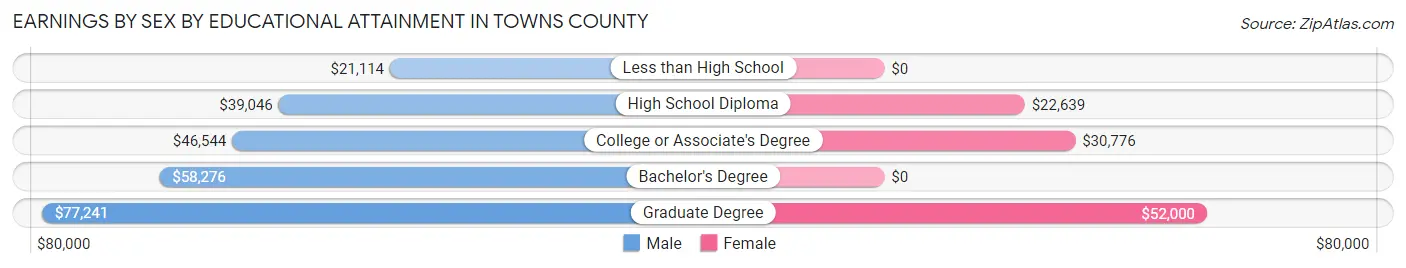
Earnings by Sex by Educational Attainment in Towns County
Average earnings in Towns County are $40,241 for men and $30,878 for women, a difference of 23.3%. Men with an educational attainment of graduate degree enjoy the highest average annual earnings of $77,241, while those with less than high school education earn the least with $21,114. Women with an educational attainment of graduate degree earn the most with the average annual earnings of $52,000, while those with high school diploma education have the smallest earnings of $22,639.
| Educational Attainment | Male Income | Female Income |
| Less than High School | $21,114 | $0 |
| High School Diploma | $39,046 | $22,639 |
| College or Associate's Degree | $46,544 | $30,776 |
| Bachelor's Degree | $58,276 | $0 |
| Graduate Degree | $77,241 | $52,000 |
| Total | $40,241 | $30,878 |
Family Income in Towns County
Family Income Brackets in Towns County
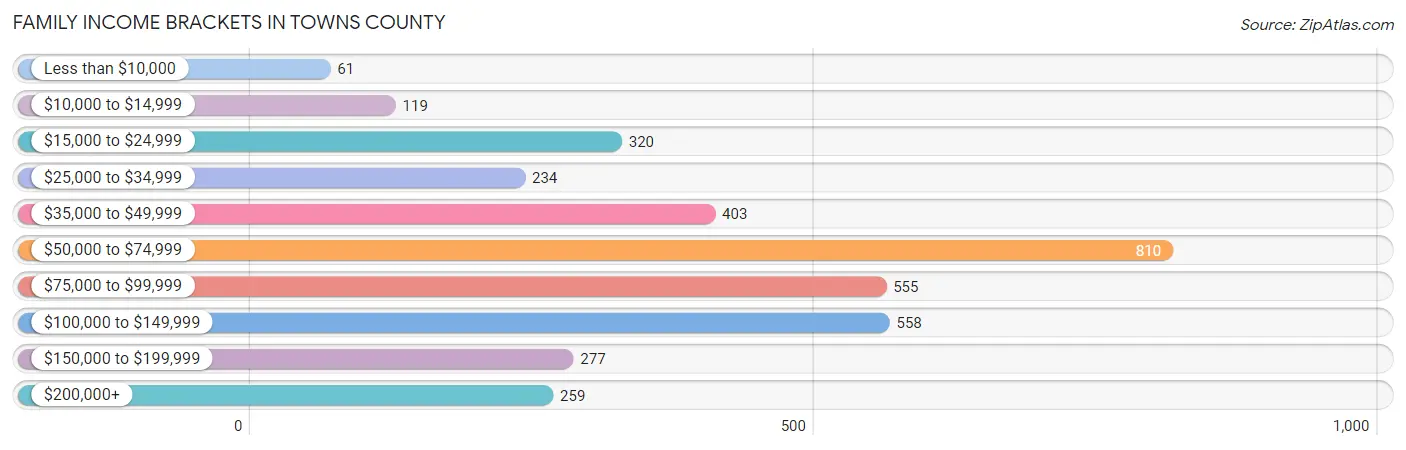
According to the Towns County family income data, there are 810 families falling into the $50,000 to $74,999 income range, which is the most common income bracket and makes up 22.5% of all families. Conversely, the less than $10,000 income bracket is the least frequent group with only 61 families (1.7%) belonging to this category.
| Income Bracket | # Families | % Families |
| Less than $10,000 | 61 | 1.7% |
| $10,000 to $14,999 | 119 | 3.3% |
| $15,000 to $24,999 | 320 | 8.9% |
| $25,000 to $34,999 | 234 | 6.5% |
| $35,000 to $49,999 | 403 | 11.2% |
| $50,000 to $74,999 | 810 | 22.5% |
| $75,000 to $99,999 | 555 | 15.4% |
| $100,000 to $149,999 | 558 | 15.5% |
| $150,000 to $199,999 | 277 | 7.7% |
| $200,000+ | 259 | 7.2% |
Family Income by Famaliy Size in Towns County
6-person families (61 | 1.7%) account for the highest median family income in Towns County with $163,884 per family, while 2-person families (2,511 | 69.7%) have the highest median income of $34,523 per family member.

| Income Bracket | # Families | Median Income |
| 2-Person Families | 2,511 (69.7%) | $69,046 |
| 3-Person Families | 543 (15.1%) | $60,288 |
| 4-Person Families | 366 (10.2%) | $75,833 |
| 5-Person Families | 111 (3.1%) | $76,094 |
| 6-Person Families | 61 (1.7%) | $163,884 |
| 7+ Person Families | 9 (0.3%) | $0 |
| Total | 3,601 (100.0%) | $69,016 |
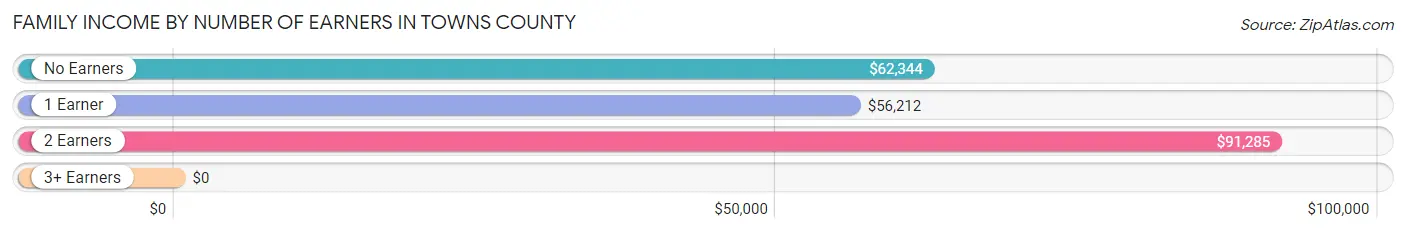
Family Income by Number of Earners in Towns County
| Number of Earners | # Families | Median Income |
| No Earners | 1,388 (38.5%) | $62,344 |
| 1 Earner | 1,048 (29.1%) | $56,212 |
| 2 Earners | 1,009 (28.0%) | $91,285 |
| 3+ Earners | 156 (4.3%) | $0 |
| Total | 3,601 (100.0%) | $69,016 |
Household Income in Towns County
Household Income Brackets in Towns County
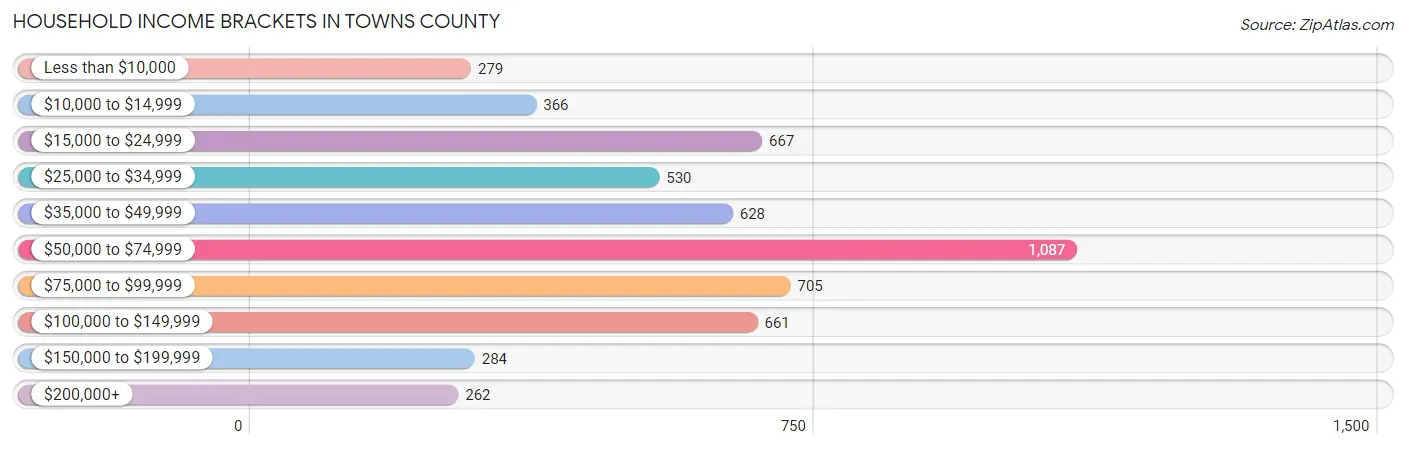
With 1,087 households falling in the category, the $50,000 to $74,999 income range is the most frequent in Towns County, accounting for 19.9% of all households. In contrast, only 262 households (4.8%) fall into the $200,000+ income bracket, making it the least populous group.
| Income Bracket | # Households | % Households |
| Less than $10,000 | 279 | 5.1% |
| $10,000 to $14,999 | 366 | 6.7% |
| $15,000 to $24,999 | 667 | 12.2% |
| $25,000 to $34,999 | 530 | 9.7% |
| $35,000 to $49,999 | 628 | 11.5% |
| $50,000 to $74,999 | 1,087 | 19.9% |
| $75,000 to $99,999 | 705 | 12.9% |
| $100,000 to $149,999 | 661 | 12.1% |
| $150,000 to $199,999 | 284 | 5.2% |
| $200,000+ | 262 | 4.8% |
Household Income by Householder Age in Towns County
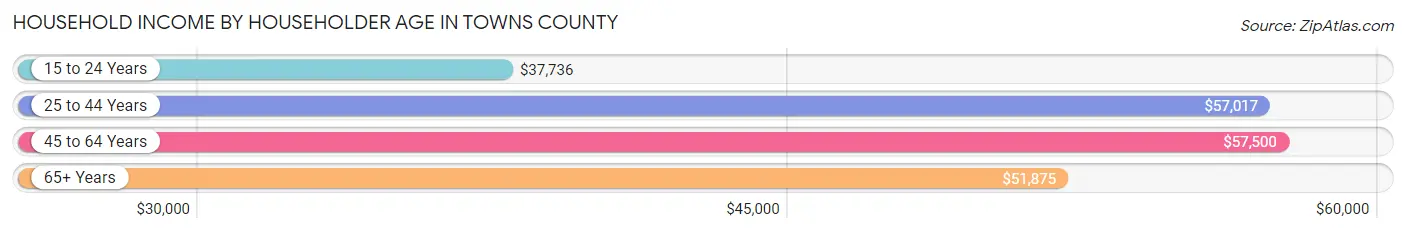
The median household income in Towns County is $55,574, with the highest median household income of $57,500 found in the 45 to 64 years age bracket for the primary householder. A total of 1,858 households (34.0%) fall into this category. Meanwhile, the 15 to 24 years age bracket for the primary householder has the lowest median household income of $37,736, with 171 households (3.1%) in this group.
| Income Bracket | # Households | Median Income |
| 15 to 24 Years | 171 (3.1%) | $37,736 |
| 25 to 44 Years | 907 (16.6%) | $57,017 |
| 45 to 64 Years | 1,858 (34.0%) | $57,500 |
| 65+ Years | 2,528 (46.3%) | $51,875 |
| Total | 5,464 (100.0%) | $55,574 |
Poverty in Towns County
Income Below Poverty by Sex and Age in Towns County
With 16.0% poverty level for males and 14.7% for females among the residents of Towns County, 15 year old males and 5 year old females are the most vulnerable to poverty, with 31 males (77.5%) and 17 females (26.6%) in their respective age groups living below the poverty level.
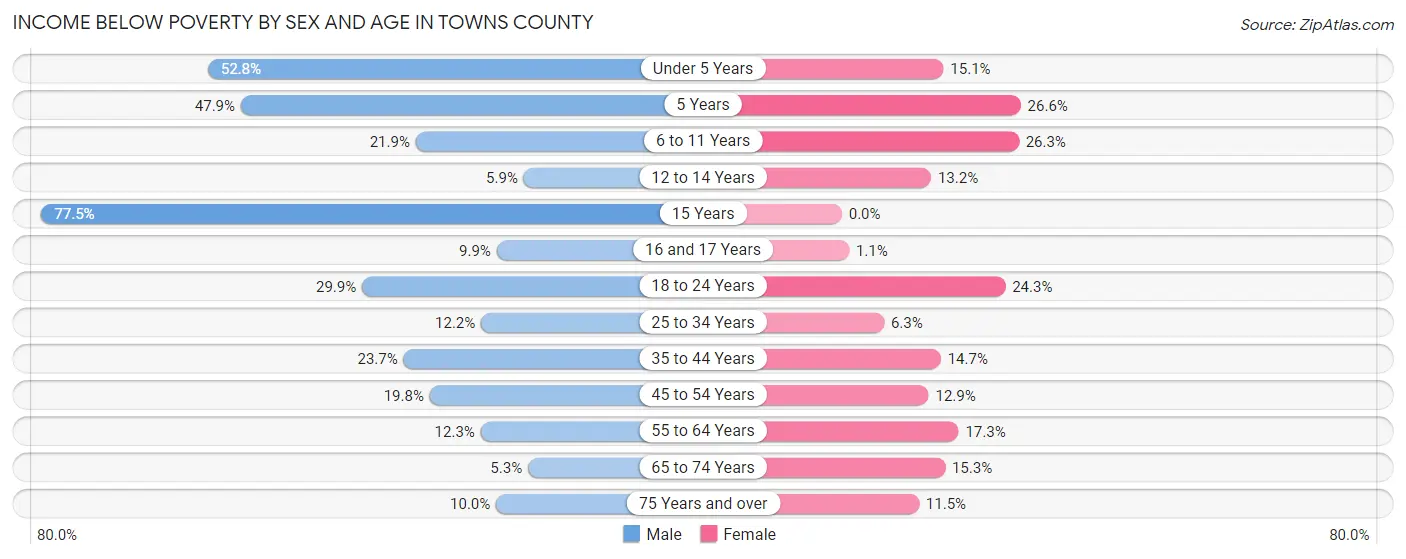
| Age Bracket | Male | Female |
| Under 5 Years | 104 (52.8%) | 32 (15.1%) |
| 5 Years | 34 (47.9%) | 17 (26.6%) |
| 6 to 11 Years | 57 (21.9%) | 67 (26.3%) |
| 12 to 14 Years | 6 (5.9%) | 9 (13.2%) |
| 15 Years | 31 (77.5%) | 0 (0.0%) |
| 16 and 17 Years | 10 (9.9%) | 1 (1.1%) |
| 18 to 24 Years | 110 (29.9%) | 92 (24.3%) |
| 25 to 34 Years | 57 (12.2%) | 34 (6.3%) |
| 35 to 44 Years | 103 (23.7%) | 62 (14.7%) |
| 45 to 54 Years | 124 (19.8%) | 77 (12.9%) |
| 55 to 64 Years | 113 (12.3%) | 183 (17.3%) |
| 65 to 74 Years | 61 (5.2%) | 201 (15.3%) |
| 75 Years and over | 87 (10.0%) | 114 (11.5%) |
| Total | 897 (16.0%) | 889 (14.7%) |
Income Above Poverty by Sex and Age in Towns County
According to the poverty statistics in Towns County, males aged 65 to 74 years and females aged 15 years are the age groups that are most secure financially, with 94.8% of males and 100.0% of females in these age groups living above the poverty line.
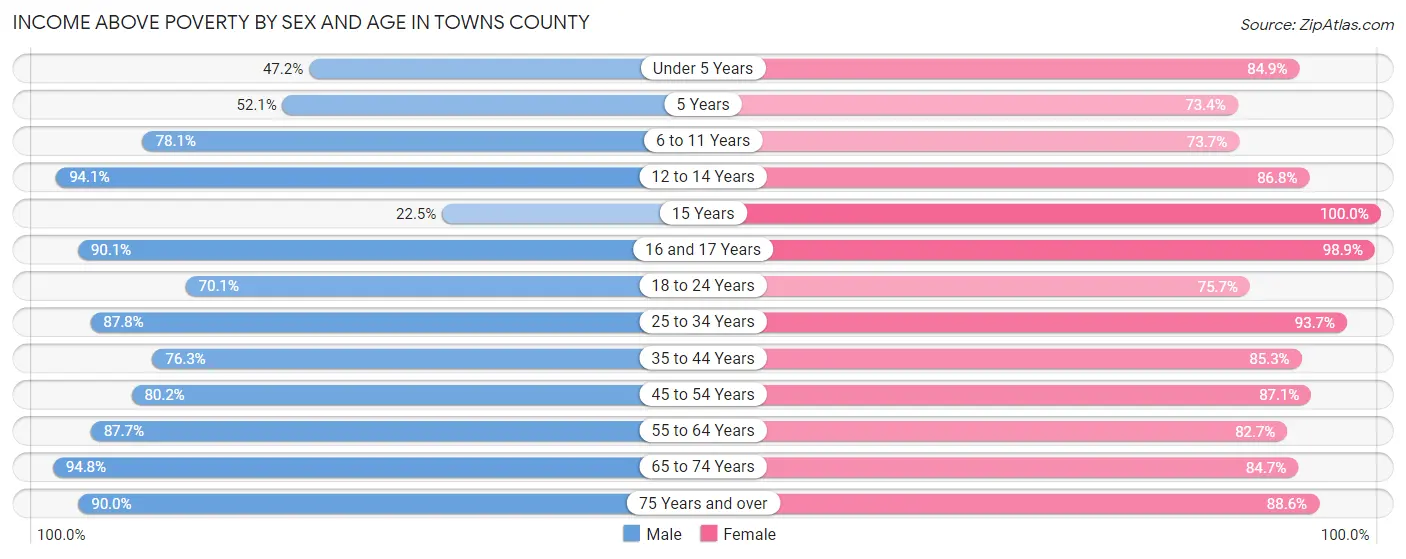
| Age Bracket | Male | Female |
| Under 5 Years | 93 (47.2%) | 180 (84.9%) |
| 5 Years | 37 (52.1%) | 47 (73.4%) |
| 6 to 11 Years | 203 (78.1%) | 188 (73.7%) |
| 12 to 14 Years | 96 (94.1%) | 59 (86.8%) |
| 15 Years | 9 (22.5%) | 52 (100.0%) |
| 16 and 17 Years | 91 (90.1%) | 93 (98.9%) |
| 18 to 24 Years | 258 (70.1%) | 287 (75.7%) |
| 25 to 34 Years | 410 (87.8%) | 509 (93.7%) |
| 35 to 44 Years | 331 (76.3%) | 360 (85.3%) |
| 45 to 54 Years | 501 (80.2%) | 521 (87.1%) |
| 55 to 64 Years | 807 (87.7%) | 873 (82.7%) |
| 65 to 74 Years | 1,102 (94.8%) | 1,111 (84.7%) |
| 75 Years and over | 785 (90.0%) | 882 (88.5%) |
| Total | 4,723 (84.0%) | 5,162 (85.3%) |
Income Below Poverty Among Married-Couple Families in Towns County
The poverty statistics for married-couple families in Towns County show that 5.8% or 176 of the total 3,029 families live below the poverty line. Families with 3 or 4 children have the highest poverty rate of 12.9%, comprising of 9 families. On the other hand, families with 5 or more children have the lowest poverty rate of 0.0%, which includes 0 families.
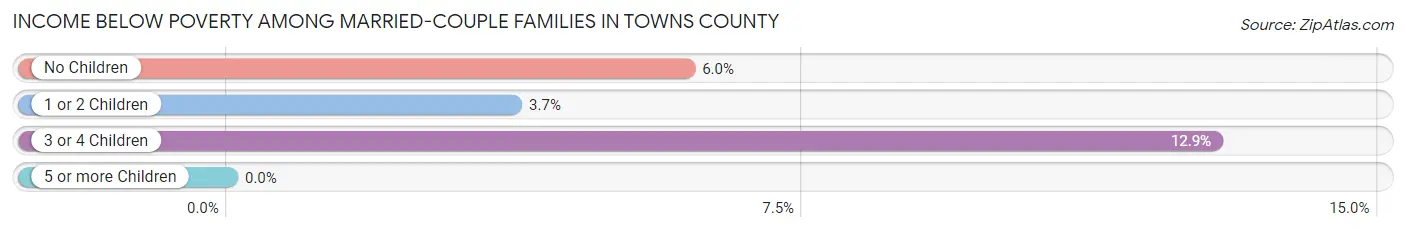
| Children | Above Poverty | Below Poverty |
| No Children | 2,394 (94.0%) | 152 (6.0%) |
| 1 or 2 Children | 389 (96.3%) | 15 (3.7%) |
| 3 or 4 Children | 61 (87.1%) | 9 (12.9%) |
| 5 or more Children | 9 (100.0%) | 0 (0.0%) |
| Total | 2,853 (94.2%) | 176 (5.8%) |
Income Below Poverty Among Single-Parent Households in Towns County
According to the poverty data in Towns County, 11.5% or 11 single-father households and 38.5% or 183 single-mother households are living below the poverty line. Among single-father households, those with 3 or 4 children have the highest poverty rate, with 11 households (50.0%) experiencing poverty. Likewise, among single-mother households, those with 1 or 2 children have the highest poverty rate, with 170 households (73.3%) falling below the poverty line.
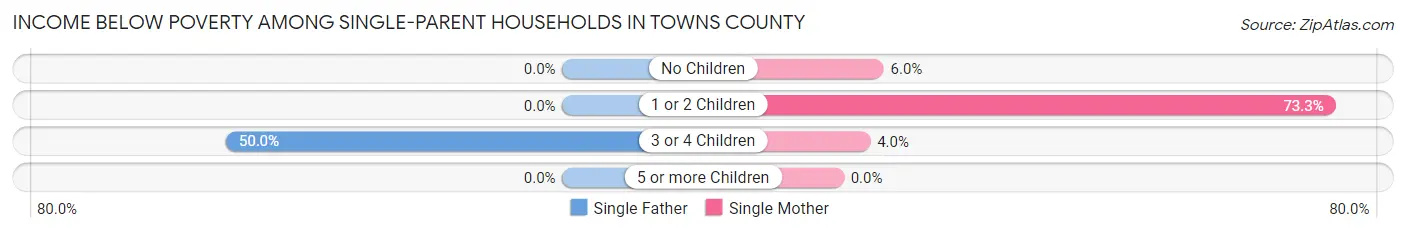
| Children | Single Father | Single Mother |
| No Children | 0 (0.0%) | 10 (5.9%) |
| 1 or 2 Children | 0 (0.0%) | 170 (73.3%) |
| 3 or 4 Children | 11 (50.0%) | 3 (4.0%) |
| 5 or more Children | 0 (0.0%) | 0 (0.0%) |
| Total | 11 (11.5%) | 183 (38.5%) |
Income Below Poverty Among Married-Couple vs Single-Parent Households in Towns County
The poverty data for Towns County shows that 176 of the married-couple family households (5.8%) and 194 of the single-parent households (33.9%) are living below the poverty level. Within the married-couple family households, those with 3 or 4 children have the highest poverty rate, with 9 households (12.9%) falling below the poverty line. Among the single-parent households, those with 1 or 2 children have the highest poverty rate, with 170 household (60.9%) living below poverty.
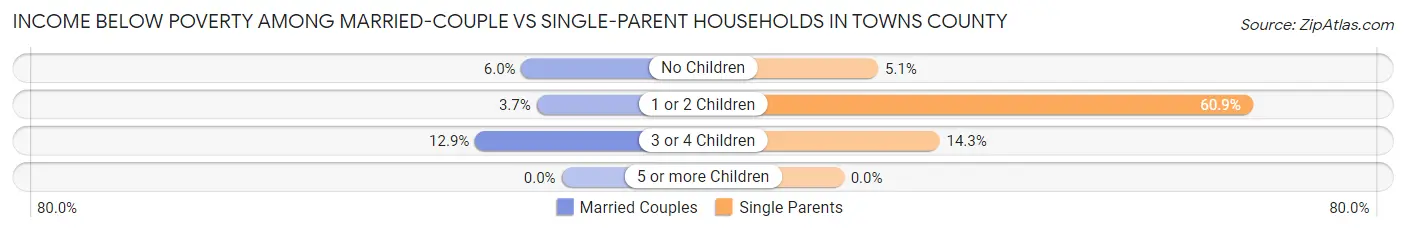
| Children | Married-Couple Families | Single-Parent Households |
| No Children | 152 (6.0%) | 10 (5.1%) |
| 1 or 2 Children | 15 (3.7%) | 170 (60.9%) |
| 3 or 4 Children | 9 (12.9%) | 14 (14.3%) |
| 5 or more Children | 0 (0.0%) | 0 (0.0%) |
| Total | 176 (5.8%) | 194 (33.9%) |
Race in Towns County
The most populous races in Towns County are White / Caucasian (11,799 | 94.1%), Two or more Races (404 | 3.2%), and Hispanic or Latino (362 | 2.9%).
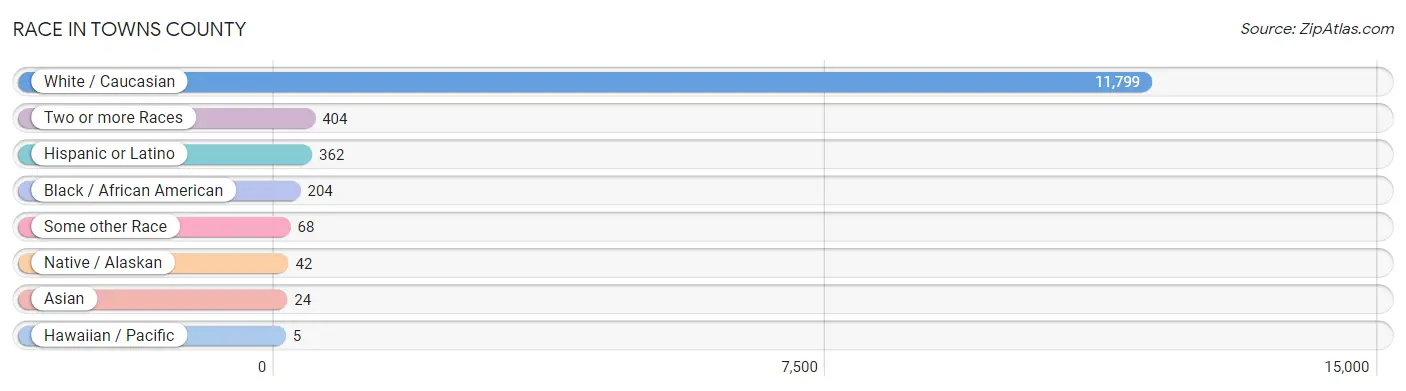
| Race | # Population | % Population |
| Asian | 24 | 0.2% |
| Black / African American | 204 | 1.6% |
| Hawaiian / Pacific | 5 | 0.0% |
| Hispanic or Latino | 362 | 2.9% |
| Native / Alaskan | 42 | 0.3% |
| White / Caucasian | 11,799 | 94.1% |
| Two or more Races | 404 | 3.2% |
| Some other Race | 68 | 0.5% |
| Total | 12,546 | 100.0% |
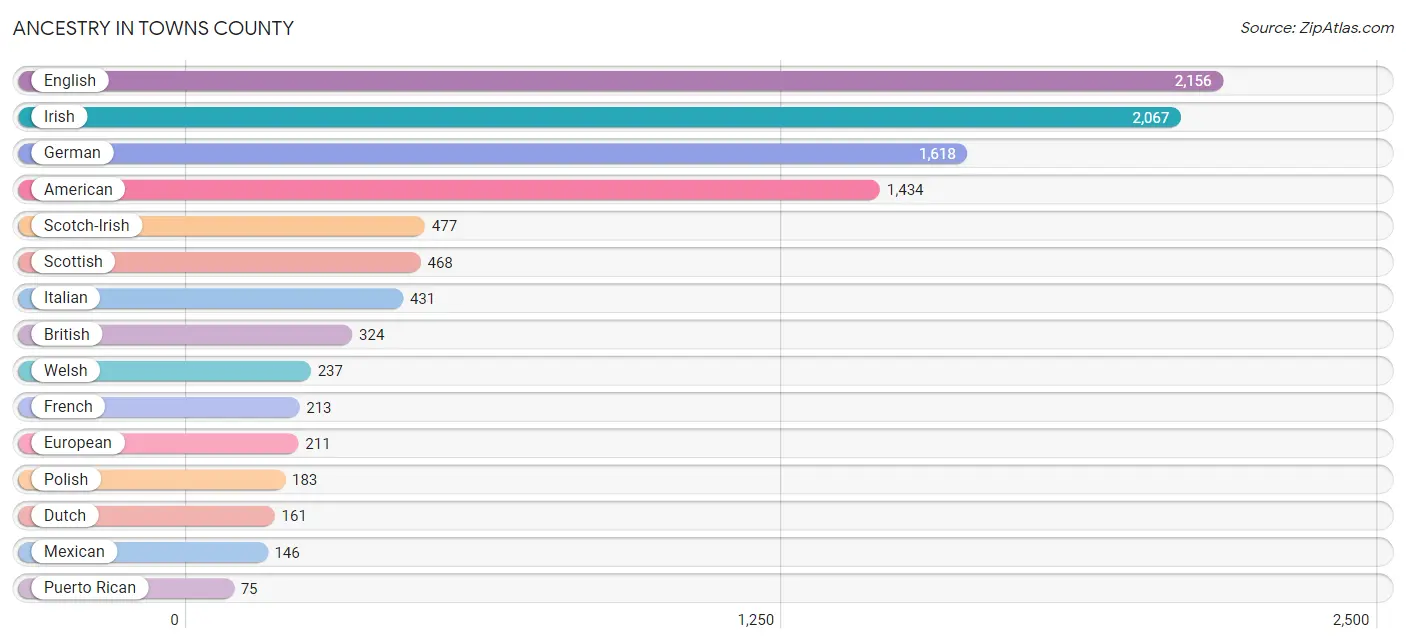
Ancestry in Towns County
The most populous ancestries reported in Towns County are English (2,156 | 17.2%), Irish (2,067 | 16.5%), German (1,618 | 12.9%), American (1,434 | 11.4%), and Scotch-Irish (477 | 3.8%), together accounting for 61.8% of all Towns County residents.
| Ancestry | # Population | % Population |
| American | 1,434 | 11.4% |
| Arab | 21 | 0.2% |
| Austrian | 68 | 0.5% |
| Bahamian | 6 | 0.1% |
| Belizean | 10 | 0.1% |
| British | 324 | 2.6% |
| British West Indian | 2 | 0.0% |
| Burmese | 14 | 0.1% |
| Canadian | 10 | 0.1% |
| Central American | 34 | 0.3% |
| Central American Indian | 11 | 0.1% |
| Cherokee | 69 | 0.5% |
| Colombian | 49 | 0.4% |
| Creek | 5 | 0.0% |
| Croatian | 8 | 0.1% |
| Cuban | 4 | 0.0% |
| Czech | 37 | 0.3% |
| Czechoslovakian | 9 | 0.1% |
| Danish | 34 | 0.3% |
| Dutch | 161 | 1.3% |
| English | 2,156 | 17.2% |
| European | 211 | 1.7% |
| Finnish | 14 | 0.1% |
| French | 213 | 1.7% |
| French Canadian | 31 | 0.3% |
| German | 1,618 | 12.9% |
| Greek | 44 | 0.4% |
| Guatemalan | 27 | 0.2% |
| Haitian | 1 | 0.0% |
| Hungarian | 63 | 0.5% |
| Indian (Asian) | 22 | 0.2% |
| Irish | 2,067 | 16.5% |
| Italian | 431 | 3.4% |
| Jamaican | 21 | 0.2% |
| Korean | 23 | 0.2% |
| Lebanese | 21 | 0.2% |
| Lithuanian | 16 | 0.1% |
| Mexican | 146 | 1.2% |
| Mexican American Indian | 17 | 0.1% |
| Native Hawaiian | 23 | 0.2% |
| Navajo | 19 | 0.2% |
| Northern European | 7 | 0.1% |
| Norwegian | 37 | 0.3% |
| Pakistani | 3 | 0.0% |
| Panamanian | 7 | 0.1% |
| Polish | 183 | 1.5% |
| Portuguese | 1 | 0.0% |
| Puerto Rican | 75 | 0.6% |
| Romanian | 33 | 0.3% |
| Russian | 64 | 0.5% |
| Scandinavian | 19 | 0.2% |
| Scotch-Irish | 477 | 3.8% |
| Scottish | 468 | 3.7% |
| Slavic | 4 | 0.0% |
| Slovak | 13 | 0.1% |
| South American | 49 | 0.4% |
| Spaniard | 25 | 0.2% |
| Spanish | 22 | 0.2% |
| Swedish | 64 | 0.5% |
| Swiss | 23 | 0.2% |
| Thai | 9 | 0.1% |
| Ukrainian | 51 | 0.4% |
| Welsh | 237 | 1.9% | View All 63 Rows |
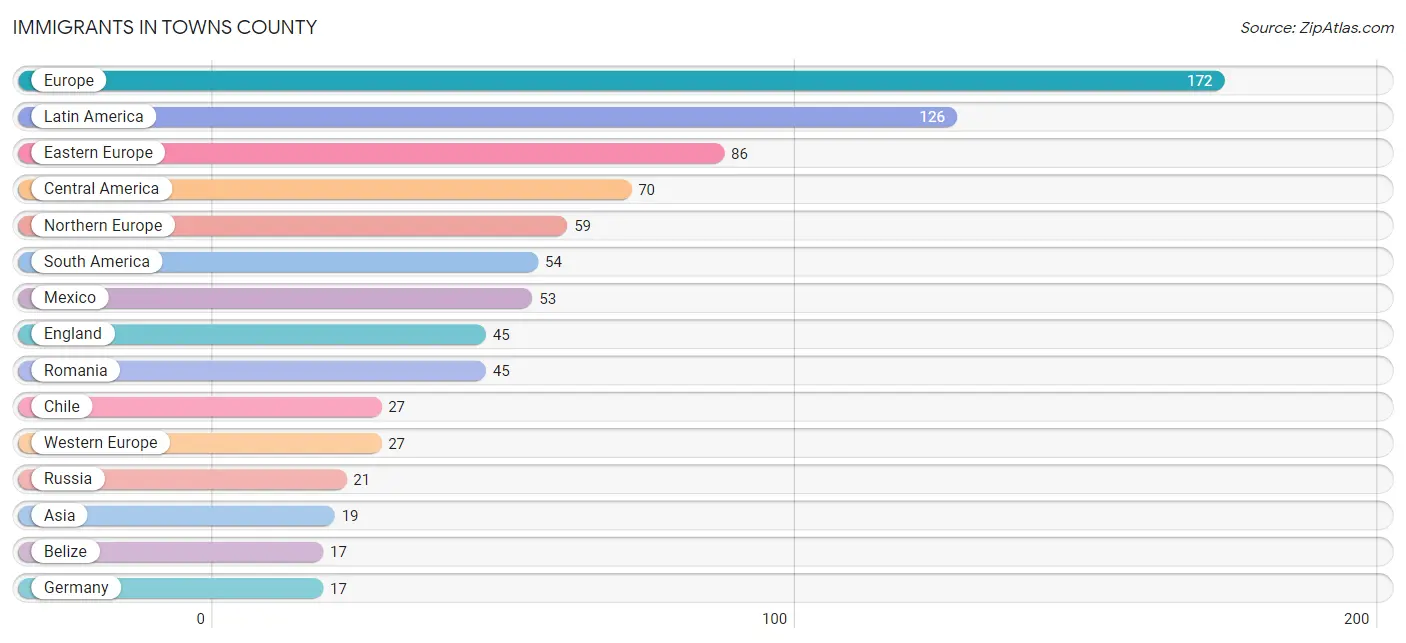
Immigrants in Towns County
The most numerous immigrant groups reported in Towns County came from Europe (172 | 1.4%), Latin America (126 | 1.0%), Eastern Europe (86 | 0.7%), Central America (70 | 0.6%), and Northern Europe (59 | 0.5%), together accounting for 4.1% of all Towns County residents.
| Immigration Origin | # Population | % Population |
| Asia | 19 | 0.2% |
| Belize | 17 | 0.1% |
| Brazil | 8 | 0.1% |
| Canada | 15 | 0.1% |
| Caribbean | 2 | 0.0% |
| Central America | 70 | 0.6% |
| Chile | 27 | 0.2% |
| China | 2 | 0.0% |
| Colombia | 11 | 0.1% |
| Cuba | 2 | 0.0% |
| Eastern Asia | 16 | 0.1% |
| Eastern Europe | 86 | 0.7% |
| England | 45 | 0.4% |
| Europe | 172 | 1.4% |
| Germany | 17 | 0.1% |
| Guyana | 8 | 0.1% |
| Hungary | 13 | 0.1% |
| Korea | 14 | 0.1% |
| Latin America | 126 | 1.0% |
| Mexico | 53 | 0.4% |
| Moldova | 7 | 0.1% |
| Northern Europe | 59 | 0.5% |
| Romania | 45 | 0.4% |
| Russia | 21 | 0.2% |
| South America | 54 | 0.4% |
| South Eastern Asia | 3 | 0.0% |
| Switzerland | 10 | 0.1% |
| Thailand | 3 | 0.0% |
| Western Europe | 27 | 0.2% | View All 29 Rows |
Sex and Age in Towns County
Sex and Age in Towns County
The most populous age groups in Towns County are 70 to 74 Years (615 | 10.2%) for men and 60 to 64 Years (736 | 11.3%) for women.
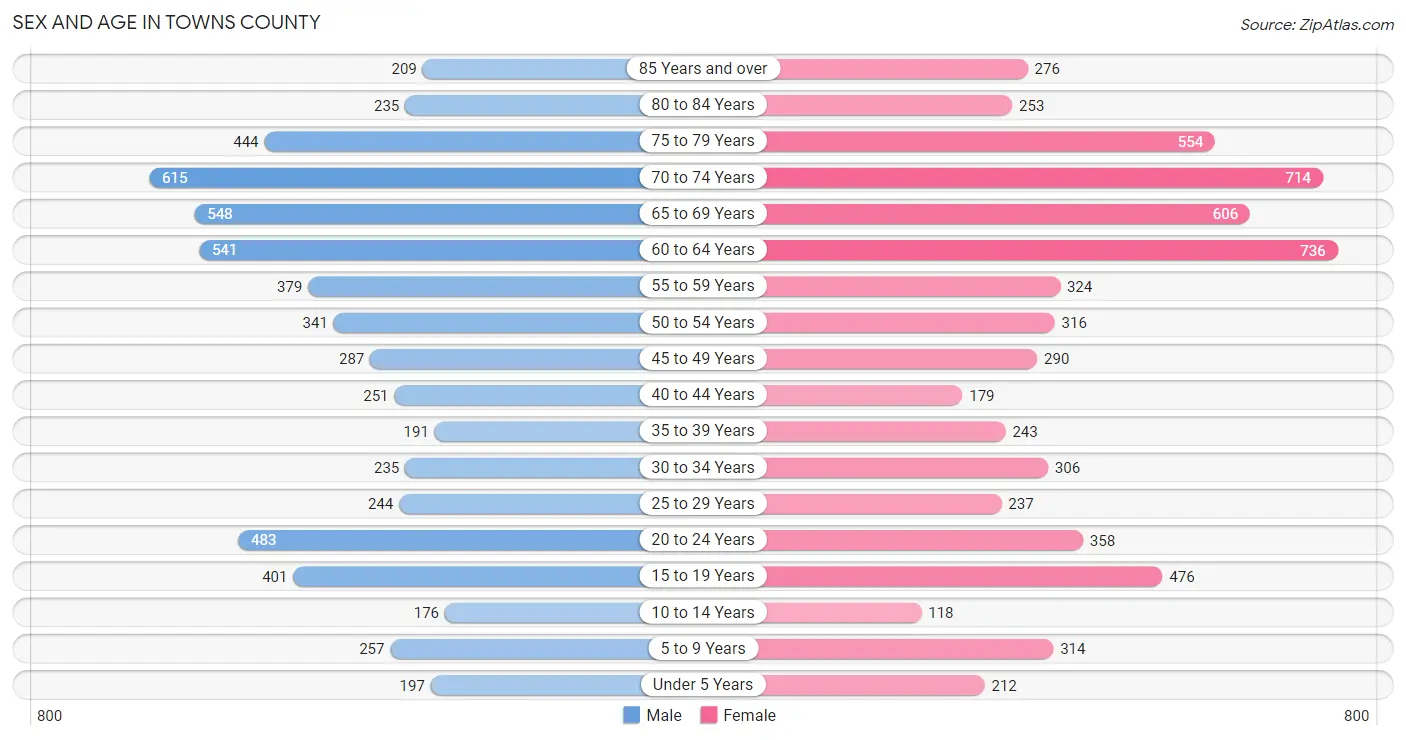
| Age Bracket | Male | Female |
| Under 5 Years | 197 (3.3%) | 212 (3.3%) |
| 5 to 9 Years | 257 (4.3%) | 314 (4.8%) |
| 10 to 14 Years | 176 (2.9%) | 118 (1.8%) |
| 15 to 19 Years | 401 (6.7%) | 476 (7.3%) |
| 20 to 24 Years | 483 (8.0%) | 358 (5.5%) |
| 25 to 29 Years | 244 (4.0%) | 237 (3.6%) |
| 30 to 34 Years | 235 (3.9%) | 306 (4.7%) |
| 35 to 39 Years | 191 (3.2%) | 243 (3.7%) |
| 40 to 44 Years | 251 (4.2%) | 179 (2.8%) |
| 45 to 49 Years | 287 (4.8%) | 290 (4.4%) |
| 50 to 54 Years | 341 (5.7%) | 316 (4.9%) |
| 55 to 59 Years | 379 (6.3%) | 324 (5.0%) |
| 60 to 64 Years | 541 (9.0%) | 736 (11.3%) |
| 65 to 69 Years | 548 (9.1%) | 606 (9.3%) |
| 70 to 74 Years | 615 (10.2%) | 714 (11.0%) |
| 75 to 79 Years | 444 (7.4%) | 554 (8.5%) |
| 80 to 84 Years | 235 (3.9%) | 253 (3.9%) |
| 85 Years and over | 209 (3.5%) | 276 (4.2%) |
| Total | 6,034 (100.0%) | 6,512 (100.0%) |
Families and Households in Towns County
Median Family Size in Towns County
The median family size in Towns County is 2.60 persons per family, with single female/mother families (476 | 13.2%) accounting for the largest median family size of 3.2 persons per family. On the other hand, married-couple families (3,029 | 84.1%) represent the smallest median family size with 2.50 persons per family.
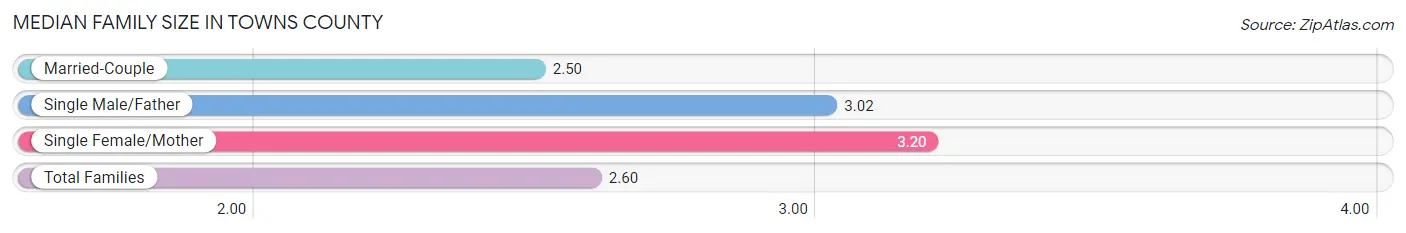
| Family Type | # Families | Family Size |
| Married-Couple | 3,029 (84.1%) | 2.50 |
| Single Male/Father | 96 (2.7%) | 3.02 |
| Single Female/Mother | 476 (13.2%) | 3.20 |
| Total Families | 3,601 (100.0%) | 2.60 |
Median Household Size in Towns County
The median household size in Towns County is 2.14 persons per household, with single male/father households (96 | 1.8%) accounting for the largest median household size of 3.54 persons per household. non-family households (1,863 | 34.1%) represent the smallest median household size with 1.13 persons per household.

| Household Type | # Households | Household Size |
| Married-Couple | 3,029 (55.4%) | 2.53 |
| Single Male/Father | 96 (1.8%) | 3.54 |
| Single Female/Mother | 476 (8.7%) | 3.30 |
| Non-family | 1,863 (34.1%) | 1.13 |
| Total Households | 5,464 (100.0%) | 2.14 |
Household Size by Marriage Status in Towns County
Out of a total of 5,464 households in Towns County, 3,601 (65.9%) are family households, while 1,863 (34.1%) are nonfamily households. The most numerous type of family households are 2-person households, comprising 2,440, and the most common type of nonfamily households are 1-person households, comprising 1,636.
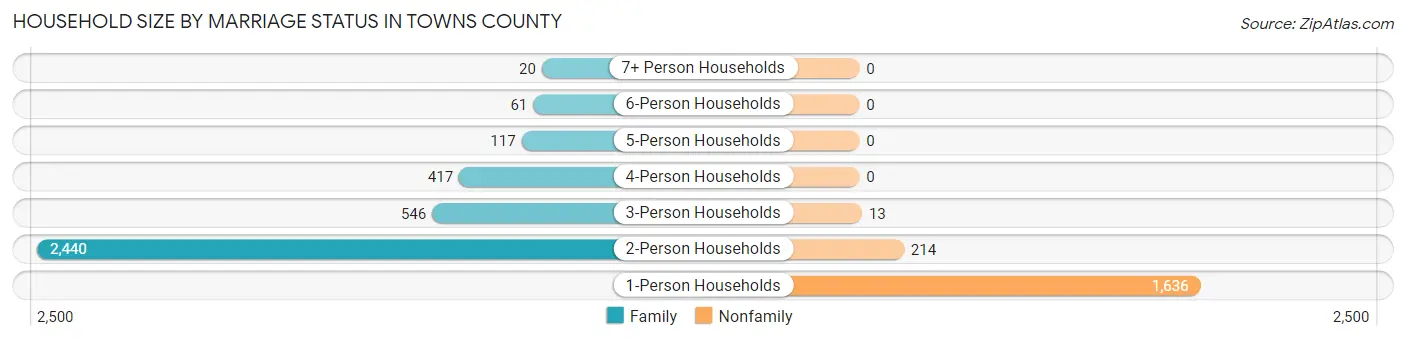
| Household Size | Family Households | Nonfamily Households |
| 1-Person Households | - | 1,636 (29.9%) |
| 2-Person Households | 2,440 (44.7%) | 214 (3.9%) |
| 3-Person Households | 546 (10.0%) | 13 (0.2%) |
| 4-Person Households | 417 (7.6%) | 0 (0.0%) |
| 5-Person Households | 117 (2.1%) | 0 (0.0%) |
| 6-Person Households | 61 (1.1%) | 0 (0.0%) |
| 7+ Person Households | 20 (0.4%) | 0 (0.0%) |
| Total | 3,601 (65.9%) | 1,863 (34.1%) |
Female Fertility in Towns County
Fertility by Age in Towns County
Average fertility rate in Towns County is 46.0 births per 1,000 women. Women in the age bracket of 20 to 34 years have the highest fertility rate with 65.0 births per 1,000 women. Women in the age bracket of 20 to 34 years acount for 60.2% of all women with births.
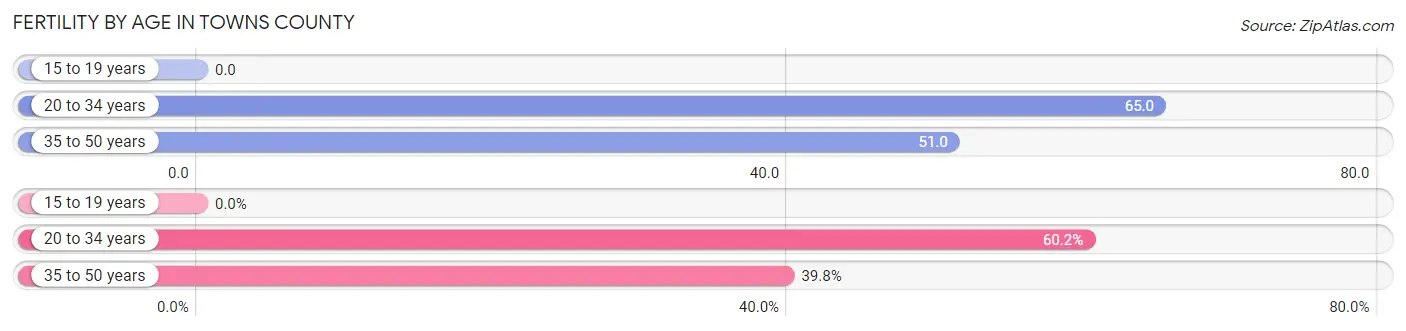
| Age Bracket | Women with Births | Births / 1,000 Women |
| 15 to 19 years | 0 (0.0%) | 0.0 |
| 20 to 34 years | 59 (60.2%) | 65.0 |
| 35 to 50 years | 39 (39.8%) | 51.0 |
| Total | 98 (100.0%) | 46.0 |
Fertility by Age by Marriage Status in Towns County
56.1% of women with births (98) in Towns County are married. The highest percentage of unmarried women with births falls into 20 to 34 years age bracket with 52.5% of them unmarried at the time of birth, while the lowest percentage of unmarried women with births belong to 35 to 50 years age bracket with 30.8% of them unmarried.
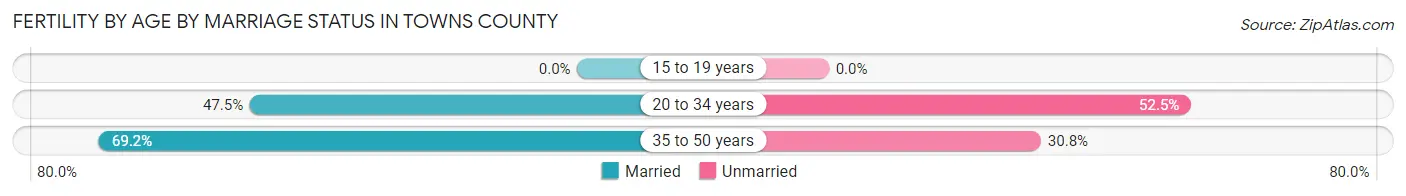
| Age Bracket | Married | Unmarried |
| 15 to 19 years | 0 (0.0%) | 0 (0.0%) |
| 20 to 34 years | 28 (47.5%) | 31 (52.5%) |
| 35 to 50 years | 27 (69.2%) | 12 (30.8%) |
| Total | 55 (56.1%) | 43 (43.9%) |
Fertility by Education in Towns County
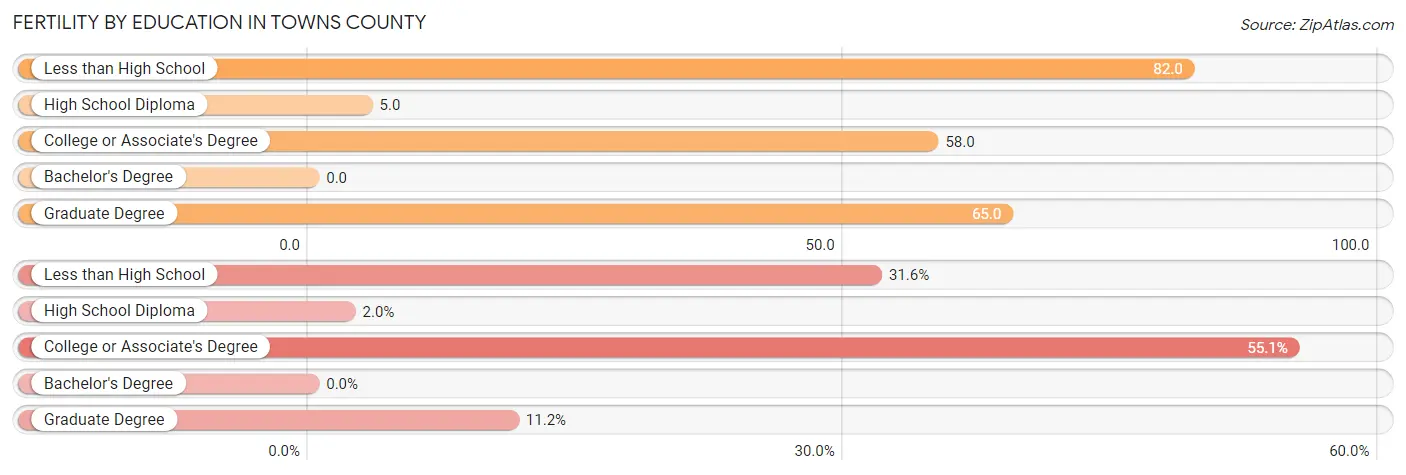
| Educational Attainment | Women with Births | Births / 1,000 Women |
| Less than High School | 31 (31.6%) | 82.0 |
| High School Diploma | 2 (2.0%) | 5.0 |
| College or Associate's Degree | 54 (55.1%) | 58.0 |
| Bachelor's Degree | 0 (0.0%) | 0.0 |
| Graduate Degree | 11 (11.2%) | 65.0 |
| Total | 98 (100.0%) | 46.0 |
Fertility by Education by Marriage Status in Towns County
43.9% of women with births in Towns County are unmarried. Women with the educational attainment of high school diploma are most likely to be married with 100.0% of them married at childbirth, while women with the educational attainment of less than high school are least likely to be married with 100.0% of them unmarried at childbirth.
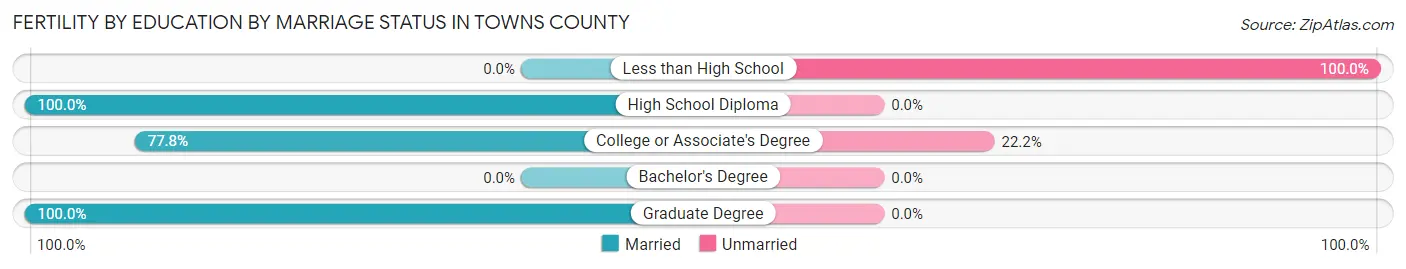
| Educational Attainment | Married | Unmarried |
| Less than High School | 0 (0.0%) | 31 (100.0%) |
| High School Diploma | 2 (100.0%) | 0 (0.0%) |
| College or Associate's Degree | 42 (77.8%) | 12 (22.2%) |
| Bachelor's Degree | 0 (0.0%) | 0 (0.0%) |
| Graduate Degree | 11 (100.0%) | 0 (0.0%) |
| Total | 55 (56.1%) | 43 (43.9%) |
Employment Characteristics in Towns County
Employment by Class of Employer in Towns County
Among the 4,510 employed individuals in Towns County, private company employees (2,785 | 61.8%), self-employed (not incorporated) (551 | 12.2%), and local government employees (291 | 6.5%) make up the most common classes of employment.
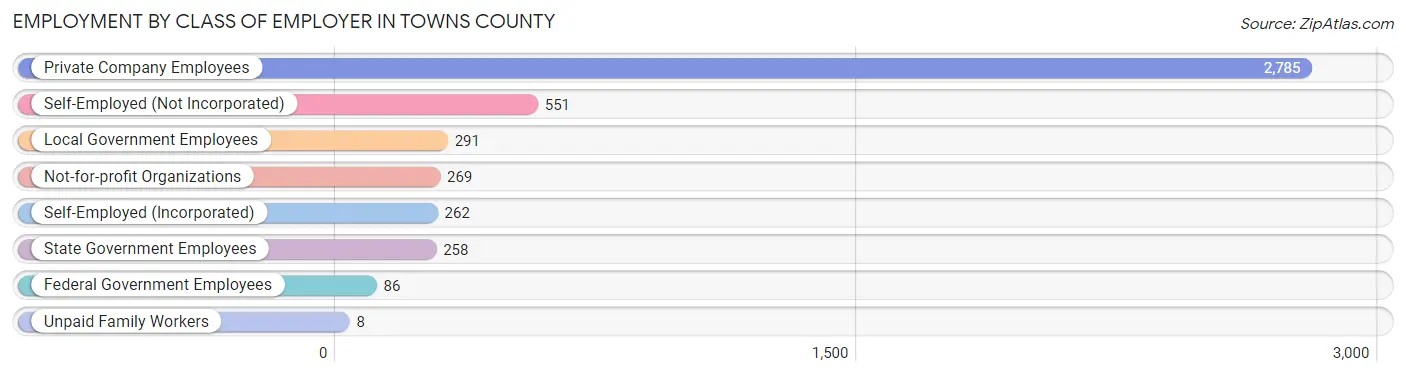
| Employer Class | # Employees | % Employees |
| Private Company Employees | 2,785 | 61.8% |
| Self-Employed (Incorporated) | 262 | 5.8% |
| Self-Employed (Not Incorporated) | 551 | 12.2% |
| Not-for-profit Organizations | 269 | 6.0% |
| Local Government Employees | 291 | 6.5% |
| State Government Employees | 258 | 5.7% |
| Federal Government Employees | 86 | 1.9% |
| Unpaid Family Workers | 8 | 0.2% |
| Total | 4,510 | 100.0% |
Employment Status by Age in Towns County
According to the labor force statistics for Towns County, out of the total population over 16 years of age (11,180), 43.8% or 4,897 individuals are in the labor force, with 5.5% or 269 of them unemployed. The age group with the highest labor force participation rate is 30 to 34 years, with 83.5% or 452 individuals in the labor force. Within the labor force, the 45 to 54 years age range has the highest percentage of unemployed individuals, with 7.9% or 74 of them being unemployed.
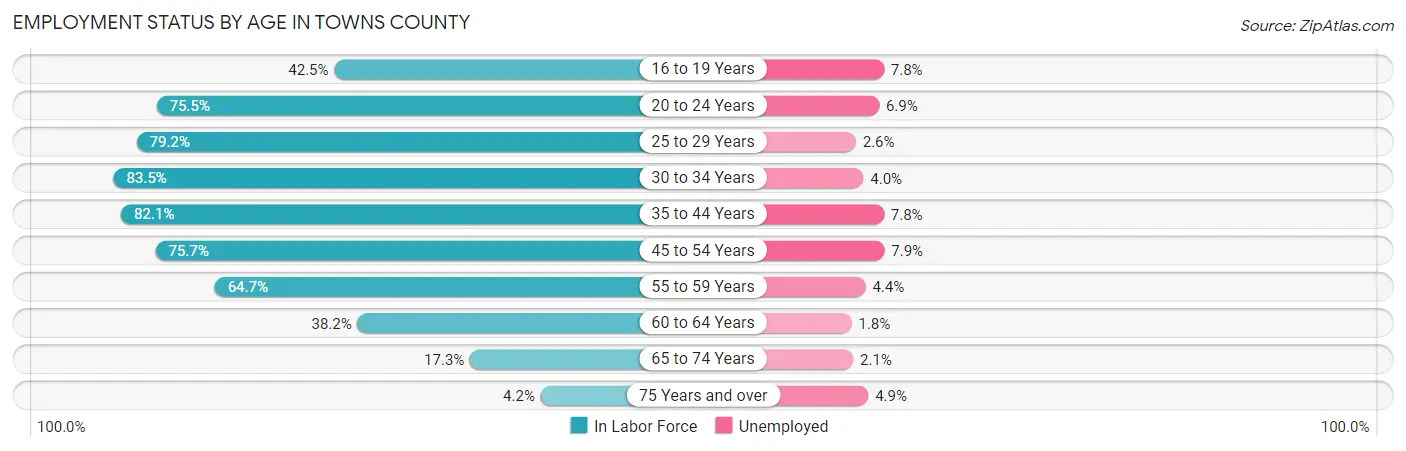
| Age Bracket | In Labor Force | Unemployed |
| 16 to 19 Years | 334 (42.5%) | 26 (7.8%) |
| 20 to 24 Years | 635 (75.5%) | 44 (6.9%) |
| 25 to 29 Years | 381 (79.2%) | 10 (2.6%) |
| 30 to 34 Years | 452 (83.5%) | 18 (4.0%) |
| 35 to 44 Years | 709 (82.1%) | 55 (7.8%) |
| 45 to 54 Years | 934 (75.7%) | 74 (7.9%) |
| 55 to 59 Years | 455 (64.7%) | 20 (4.4%) |
| 60 to 64 Years | 488 (38.2%) | 9 (1.8%) |
| 65 to 74 Years | 430 (17.3%) | 9 (2.1%) |
| 75 Years and over | 83 (4.2%) | 4 (4.9%) |
| Total | 4,897 (43.8%) | 269 (5.5%) |
Employment Status by Educational Attainment in Towns County
According to labor force statistics for Towns County, 67.0% of individuals (3,417) out of the total population between 25 and 64 years of age (5,100) are in the labor force, with 5.4% or 185 of them being unemployed. The group with the highest labor force participation rate are those with the educational attainment of high school diploma, with 75.1% or 1,099 individuals in the labor force. Within the labor force, individuals with less than high school education have the highest percentage of unemployment, with 20.3% or 67 of them being unemployed.
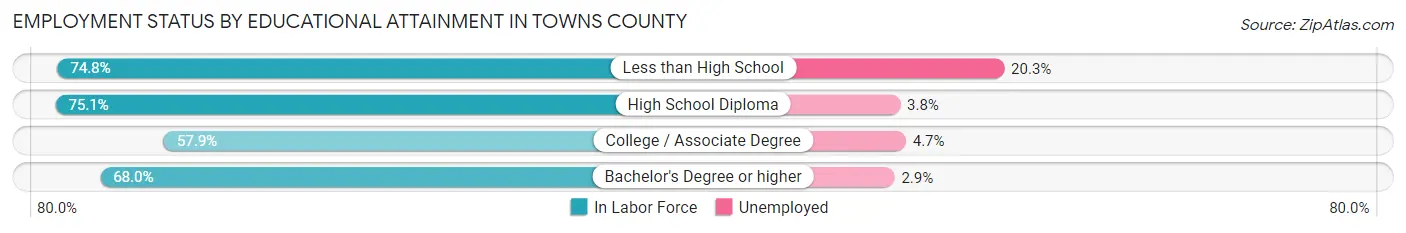
| Educational Attainment | In Labor Force | Unemployed |
| Less than High School | 330 (74.8%) | 90 (20.3%) |
| High School Diploma | 1,099 (75.1%) | 56 (3.8%) |
| College / Associate Degree | 1,054 (57.9%) | 86 (4.7%) |
| Bachelor's Degree or higher | 935 (68.0%) | 40 (2.9%) |
| Total | 3,417 (67.0%) | 275 (5.4%) |
Employment Occupations by Sex in Towns County
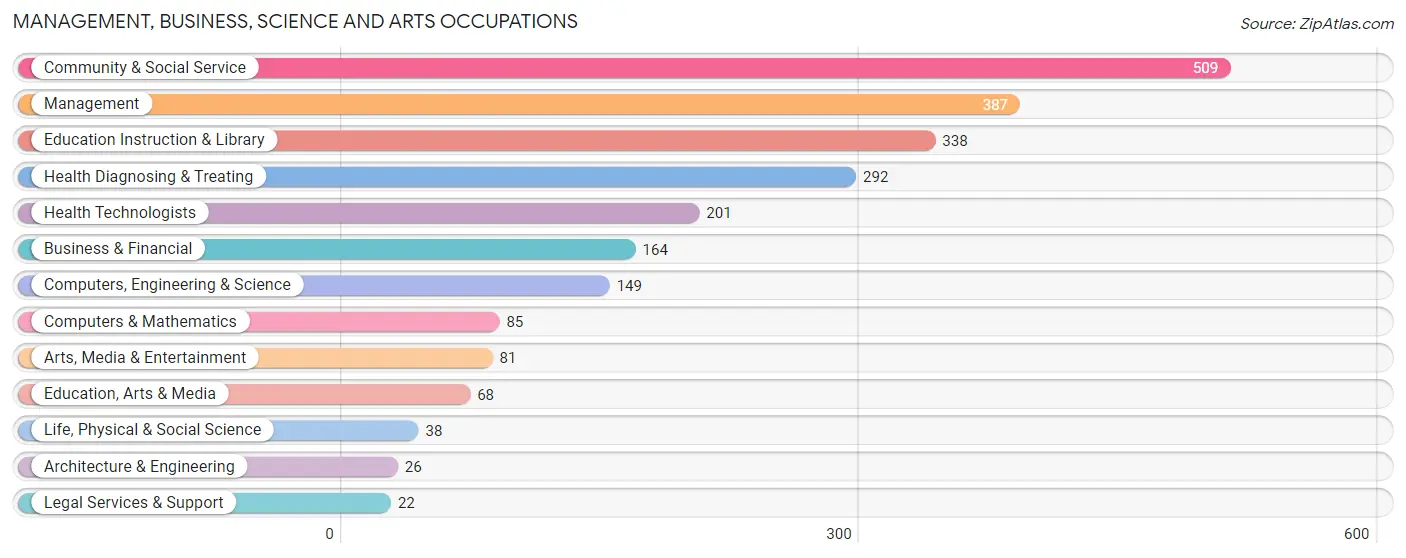
Management, Business, Science and Arts Occupations
The most common Management, Business, Science and Arts occupations in Towns County are Community & Social Service (509 | 11.0%), Management (387 | 8.4%), Education Instruction & Library (338 | 7.3%), Health Diagnosing & Treating (292 | 6.3%), and Health Technologists (201 | 4.3%).
Management, Business, Science and Arts Occupations by Sex
Within the Management, Business, Science and Arts occupations in Towns County, the most male-oriented occupations are Computers & Mathematics (100.0%), Architecture & Engineering (100.0%), and Computers, Engineering & Science (86.6%), while the most female-oriented occupations are Health Diagnosing & Treating (70.6%), Health Technologists (60.2%), and Business & Financial (55.5%).
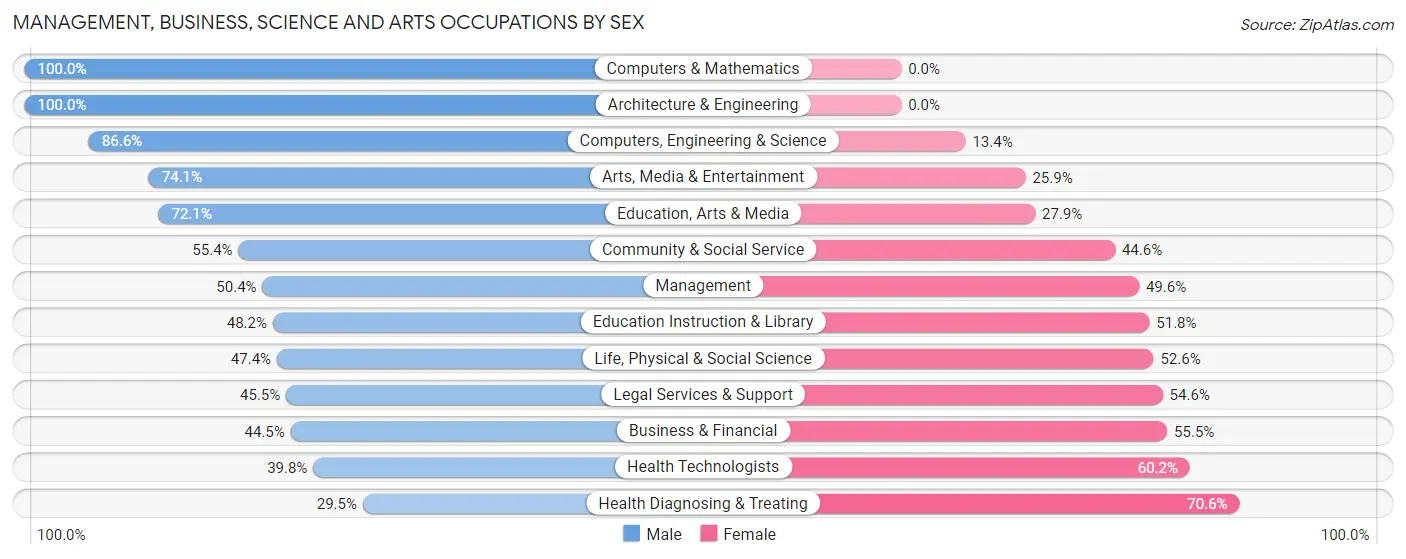
| Occupation | Male | Female |
| Management | 195 (50.4%) | 192 (49.6%) |
| Business & Financial | 73 (44.5%) | 91 (55.5%) |
| Computers, Engineering & Science | 129 (86.6%) | 20 (13.4%) |
| Computers & Mathematics | 85 (100.0%) | 0 (0.0%) |
| Architecture & Engineering | 26 (100.0%) | 0 (0.0%) |
| Life, Physical & Social Science | 18 (47.4%) | 20 (52.6%) |
| Community & Social Service | 282 (55.4%) | 227 (44.6%) |
| Education, Arts & Media | 49 (72.1%) | 19 (27.9%) |
| Legal Services & Support | 10 (45.5%) | 12 (54.5%) |
| Education Instruction & Library | 163 (48.2%) | 175 (51.8%) |
| Arts, Media & Entertainment | 60 (74.1%) | 21 (25.9%) |
| Health Diagnosing & Treating | 86 (29.4%) | 206 (70.6%) |
| Health Technologists | 80 (39.8%) | 121 (60.2%) |
| Total (Category) | 765 (51.0%) | 736 (49.0%) |
| Total (Overall) | 2,624 (56.7%) | 2,007 (43.3%) |
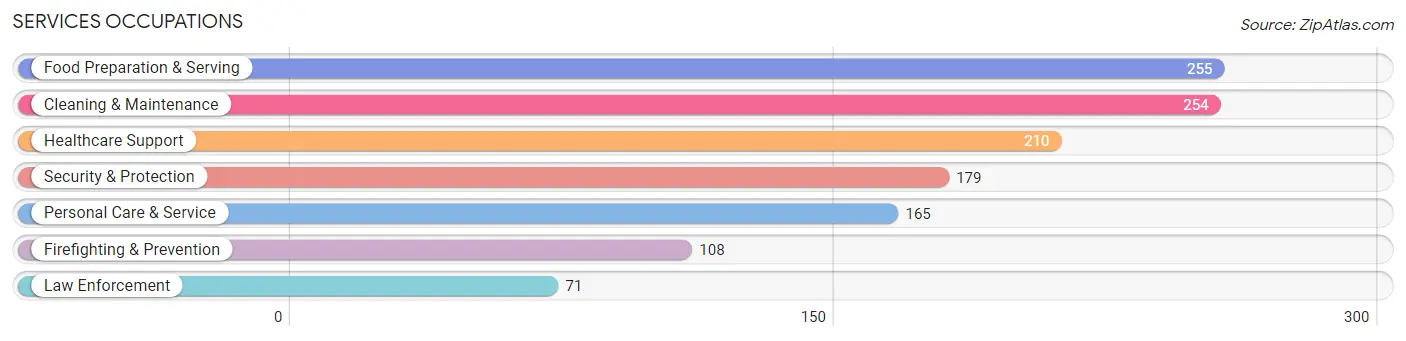
Services Occupations
The most common Services occupations in Towns County are Food Preparation & Serving (255 | 5.5%), Cleaning & Maintenance (254 | 5.5%), Healthcare Support (210 | 4.5%), Security & Protection (179 | 3.9%), and Personal Care & Service (165 | 3.6%).
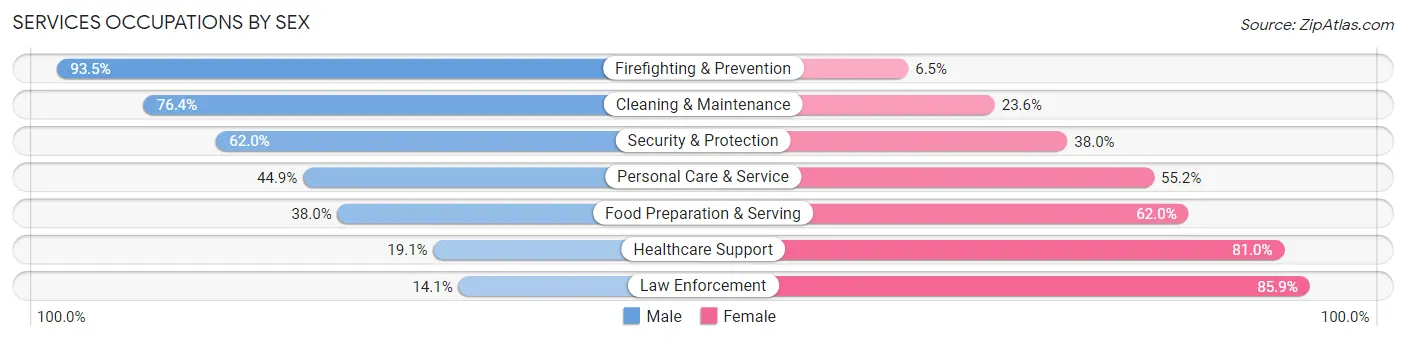
Services Occupations by Sex
Within the Services occupations in Towns County, the most male-oriented occupations are Firefighting & Prevention (93.5%), Cleaning & Maintenance (76.4%), and Security & Protection (62.0%), while the most female-oriented occupations are Law Enforcement (85.9%), Healthcare Support (80.9%), and Food Preparation & Serving (62.0%).
| Occupation | Male | Female |
| Healthcare Support | 40 (19.1%) | 170 (80.9%) |
| Security & Protection | 111 (62.0%) | 68 (38.0%) |
| Firefighting & Prevention | 101 (93.5%) | 7 (6.5%) |
| Law Enforcement | 10 (14.1%) | 61 (85.9%) |
| Food Preparation & Serving | 97 (38.0%) | 158 (62.0%) |
| Cleaning & Maintenance | 194 (76.4%) | 60 (23.6%) |
| Personal Care & Service | 74 (44.9%) | 91 (55.1%) |
| Total (Category) | 516 (48.5%) | 547 (51.5%) |
| Total (Overall) | 2,624 (56.7%) | 2,007 (43.3%) |
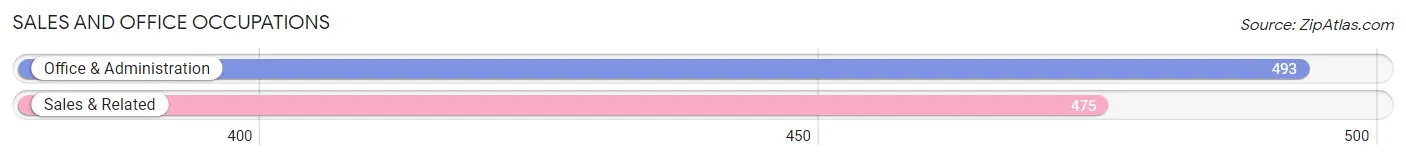
Sales and Office Occupations
The most common Sales and Office occupations in Towns County are Office & Administration (493 | 10.6%), and Sales & Related (475 | 10.3%).
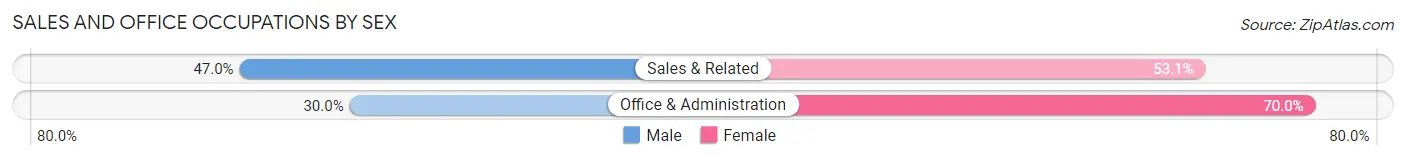
Sales and Office Occupations by Sex
| Occupation | Male | Female |
| Sales & Related | 223 (46.9%) | 252 (53.0%) |
| Office & Administration | 148 (30.0%) | 345 (70.0%) |
| Total (Category) | 371 (38.3%) | 597 (61.7%) |
| Total (Overall) | 2,624 (56.7%) | 2,007 (43.3%) |
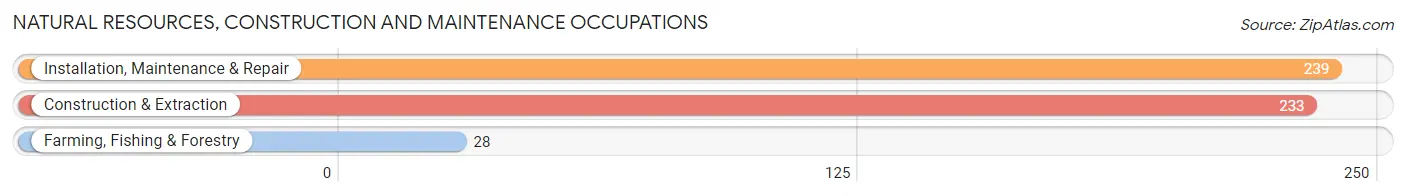
Natural Resources, Construction and Maintenance Occupations
The most common Natural Resources, Construction and Maintenance occupations in Towns County are Installation, Maintenance & Repair (239 | 5.2%), Construction & Extraction (233 | 5.0%), and Farming, Fishing & Forestry (28 | 0.6%).
Natural Resources, Construction and Maintenance Occupations by Sex
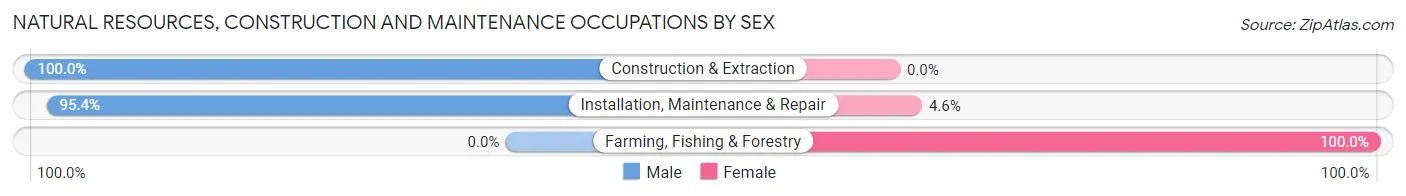
| Occupation | Male | Female |
| Farming, Fishing & Forestry | 0 (0.0%) | 28 (100.0%) |
| Construction & Extraction | 233 (100.0%) | 0 (0.0%) |
| Installation, Maintenance & Repair | 228 (95.4%) | 11 (4.6%) |
| Total (Category) | 461 (92.2%) | 39 (7.8%) |
| Total (Overall) | 2,624 (56.7%) | 2,007 (43.3%) |
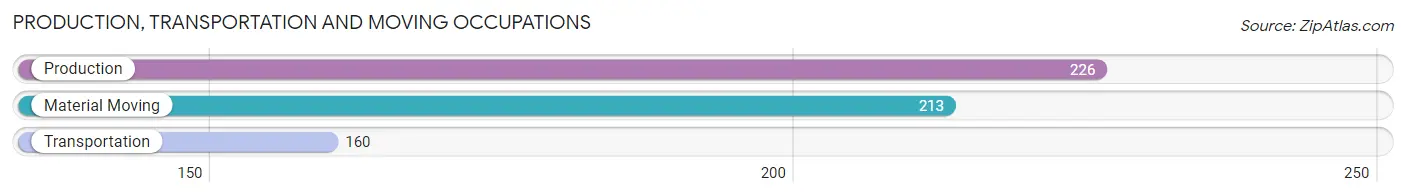
Production, Transportation and Moving Occupations
The most common Production, Transportation and Moving occupations in Towns County are Production (226 | 4.9%), Material Moving (213 | 4.6%), and Transportation (160 | 3.5%).
Production, Transportation and Moving Occupations by Sex
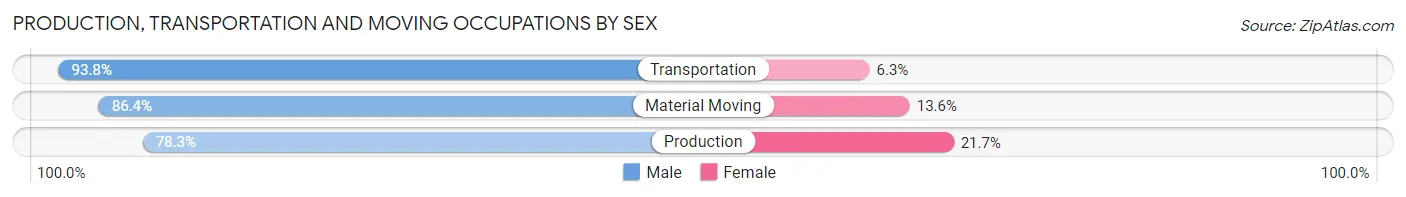
| Occupation | Male | Female |
| Production | 177 (78.3%) | 49 (21.7%) |
| Transportation | 150 (93.8%) | 10 (6.2%) |
| Material Moving | 184 (86.4%) | 29 (13.6%) |
| Total (Category) | 511 (85.3%) | 88 (14.7%) |
| Total (Overall) | 2,624 (56.7%) | 2,007 (43.3%) |
Employment Industries by Sex in Towns County
Employment Industries in Towns County
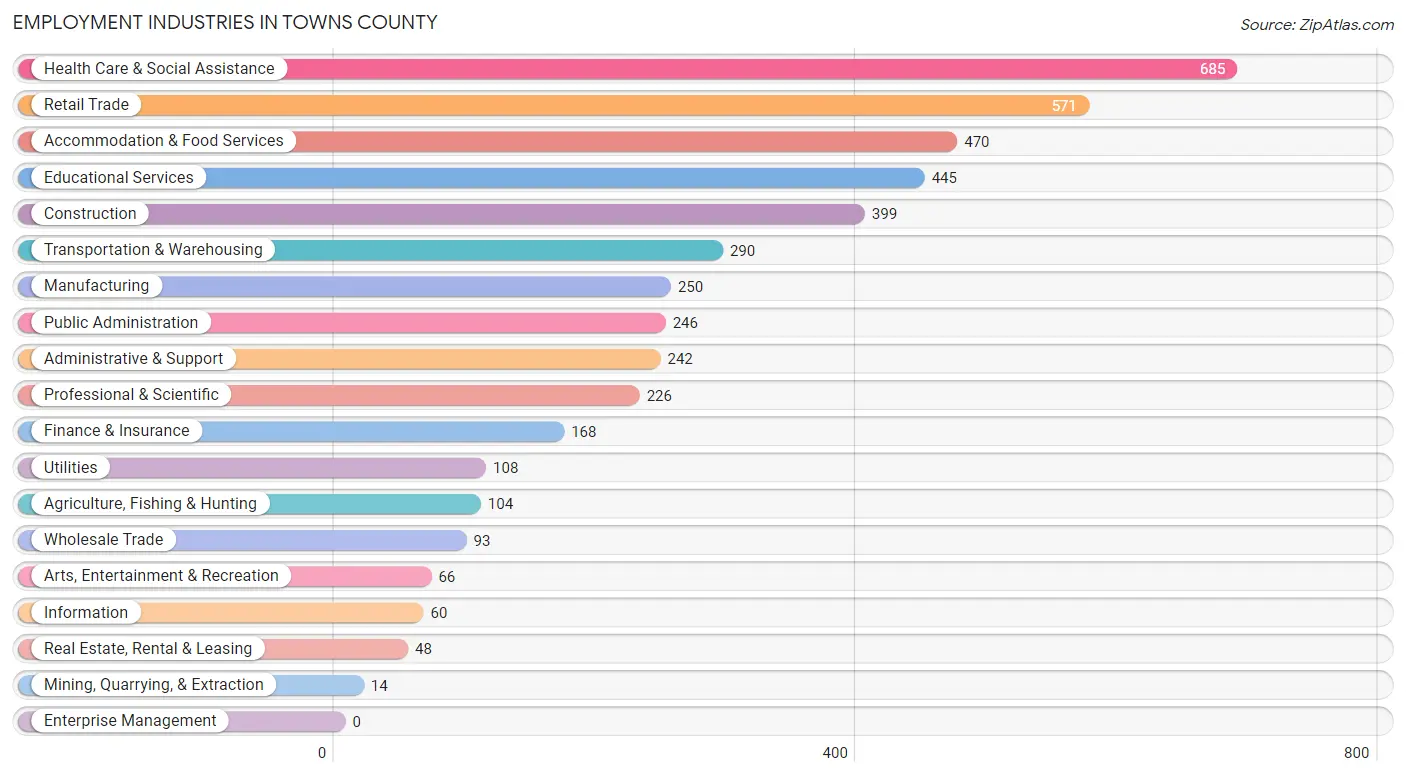
The major employment industries in Towns County include Health Care & Social Assistance (685 | 14.8%), Retail Trade (571 | 12.3%), Accommodation & Food Services (470 | 10.2%), Educational Services (445 | 9.6%), and Construction (399 | 8.6%).
Employment Industries by Sex in Towns County
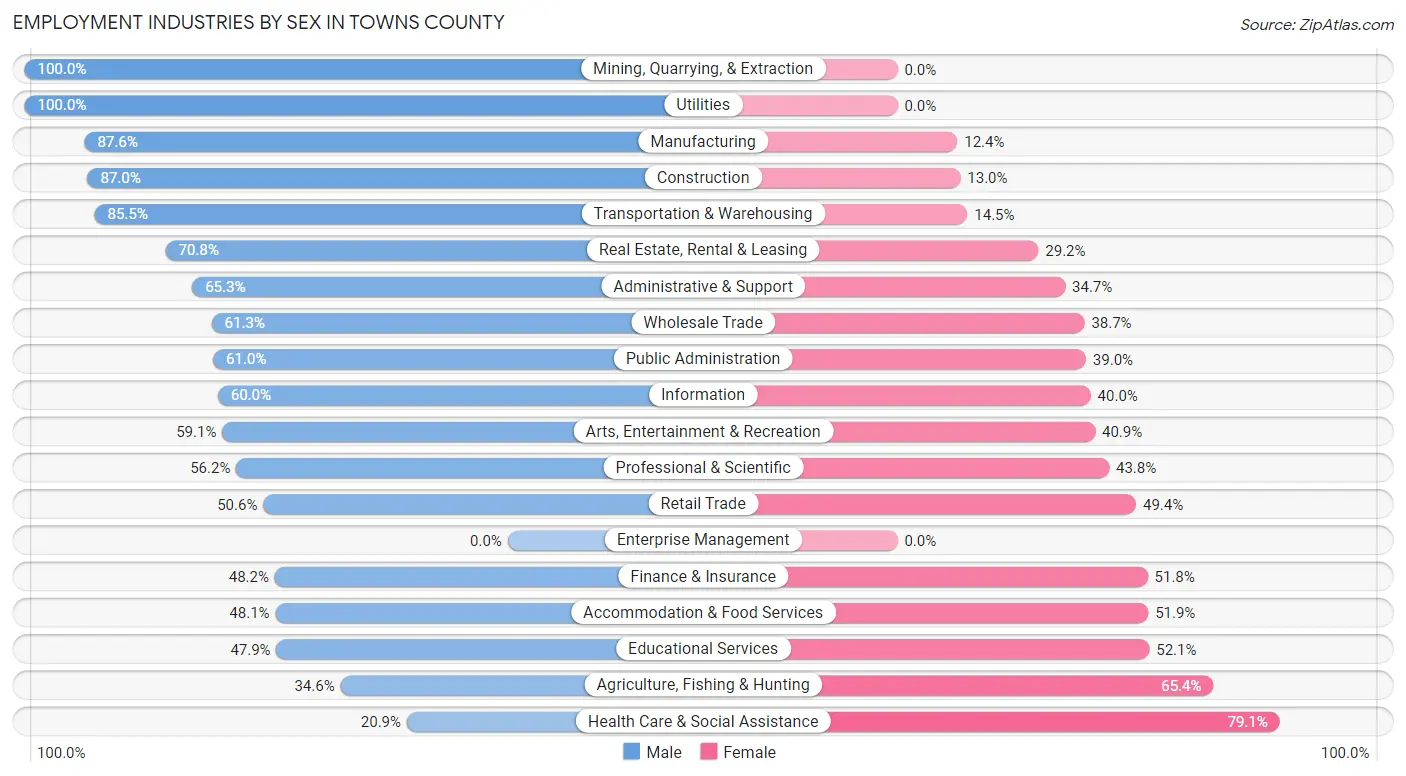
The Towns County industries that see more men than women are Mining, Quarrying, & Extraction (100.0%), Utilities (100.0%), and Manufacturing (87.6%), whereas the industries that tend to have a higher number of women are Health Care & Social Assistance (79.1%), Agriculture, Fishing & Hunting (65.4%), and Educational Services (52.1%).
| Industry | Male | Female |
| Agriculture, Fishing & Hunting | 36 (34.6%) | 68 (65.4%) |
| Mining, Quarrying, & Extraction | 14 (100.0%) | 0 (0.0%) |
| Construction | 347 (87.0%) | 52 (13.0%) |
| Manufacturing | 219 (87.6%) | 31 (12.4%) |
| Wholesale Trade | 57 (61.3%) | 36 (38.7%) |
| Retail Trade | 289 (50.6%) | 282 (49.4%) |
| Transportation & Warehousing | 248 (85.5%) | 42 (14.5%) |
| Utilities | 108 (100.0%) | 0 (0.0%) |
| Information | 36 (60.0%) | 24 (40.0%) |
| Finance & Insurance | 81 (48.2%) | 87 (51.8%) |
| Real Estate, Rental & Leasing | 34 (70.8%) | 14 (29.2%) |
| Professional & Scientific | 127 (56.2%) | 99 (43.8%) |
| Enterprise Management | 0 (0.0%) | 0 (0.0%) |
| Administrative & Support | 158 (65.3%) | 84 (34.7%) |
| Educational Services | 213 (47.9%) | 232 (52.1%) |
| Health Care & Social Assistance | 143 (20.9%) | 542 (79.1%) |
| Arts, Entertainment & Recreation | 39 (59.1%) | 27 (40.9%) |
| Accommodation & Food Services | 226 (48.1%) | 244 (51.9%) |
| Public Administration | 150 (61.0%) | 96 (39.0%) |
| Total | 2,624 (56.7%) | 2,007 (43.3%) |
Education in Towns County
School Enrollment in Towns County
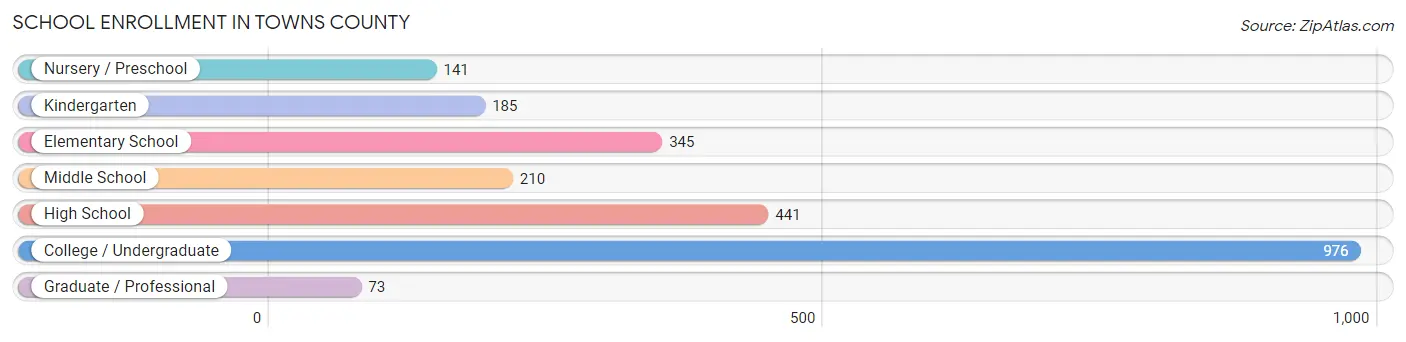
The most common levels of schooling among the 2,371 students in Towns County are college / undergraduate (976 | 41.2%), high school (441 | 18.6%), and elementary school (345 | 14.5%).
| School Level | # Students | % Students |
| Nursery / Preschool | 141 | 5.9% |
| Kindergarten | 185 | 7.8% |
| Elementary School | 345 | 14.5% |
| Middle School | 210 | 8.9% |
| High School | 441 | 18.6% |
| College / Undergraduate | 976 | 41.2% |
| Graduate / Professional | 73 | 3.1% |
| Total | 2,371 | 100.0% |
School Enrollment by Age by Funding Source in Towns County
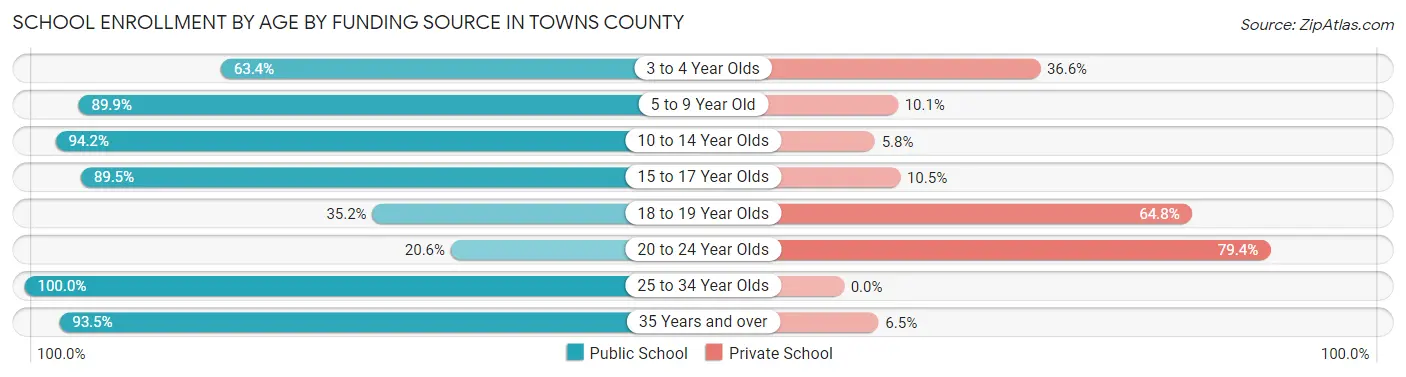
Out of a total of 2,371 students who are enrolled in schools in Towns County, 811 (34.2%) attend a private institution, while the remaining 1,560 (65.8%) are enrolled in public schools. The age group of 20 to 24 year olds has the highest likelihood of being enrolled in private schools, with 316 (79.4% in the age bracket) enrolled. Conversely, the age group of 25 to 34 year olds has the lowest likelihood of being enrolled in a private school, with 16 (100.0% in the age bracket) attending a public institution.
| Age Bracket | Public School | Private School |
| 3 to 4 Year Olds | 59 (63.4%) | 34 (36.6%) |
| 5 to 9 Year Old | 483 (89.9%) | 54 (10.1%) |
| 10 to 14 Year Olds | 277 (94.2%) | 17 (5.8%) |
| 15 to 17 Year Olds | 239 (89.5%) | 28 (10.5%) |
| 18 to 19 Year Olds | 188 (35.2%) | 346 (64.8%) |
| 20 to 24 Year Olds | 82 (20.6%) | 316 (79.4%) |
| 25 to 34 Year Olds | 16 (100.0%) | 0 (0.0%) |
| 35 Years and over | 217 (93.5%) | 15 (6.5%) |
| Total | 1,560 (65.8%) | 811 (34.2%) |
Educational Attainment by Field of Study in Towns County
Education (655 | 20.0%), business (567 | 17.3%), science & technology (307 | 9.4%), social sciences (224 | 6.8%), and psychology (223 | 6.8%) are the most common fields of study among 3,274 individuals in Towns County who have obtained a bachelor's degree or higher.

| Field of Study | # Graduates | % Graduates |
| Computers & Mathematics | 73 | 2.2% |
| Bio, Nature & Agricultural | 176 | 5.4% |
| Physical & Health Sciences | 104 | 3.2% |
| Psychology | 223 | 6.8% |
| Social Sciences | 224 | 6.8% |
| Engineering | 208 | 6.4% |
| Multidisciplinary Studies | 47 | 1.4% |
| Science & Technology | 307 | 9.4% |
| Business | 567 | 17.3% |
| Education | 655 | 20.0% |
| Literature & Languages | 220 | 6.7% |
| Liberal Arts & History | 207 | 6.3% |
| Visual & Performing Arts | 74 | 2.3% |
| Communications | 13 | 0.4% |
| Arts & Humanities | 176 | 5.4% |
| Total | 3,274 | 100.0% |
Transportation & Commute in Towns County
Vehicle Availability by Sex in Towns County
The most prevalent vehicle ownership categories in Towns County are males with 2 vehicles (1,005, accounting for 43.0%) and females with 2 vehicles (743, making up 54.0%).
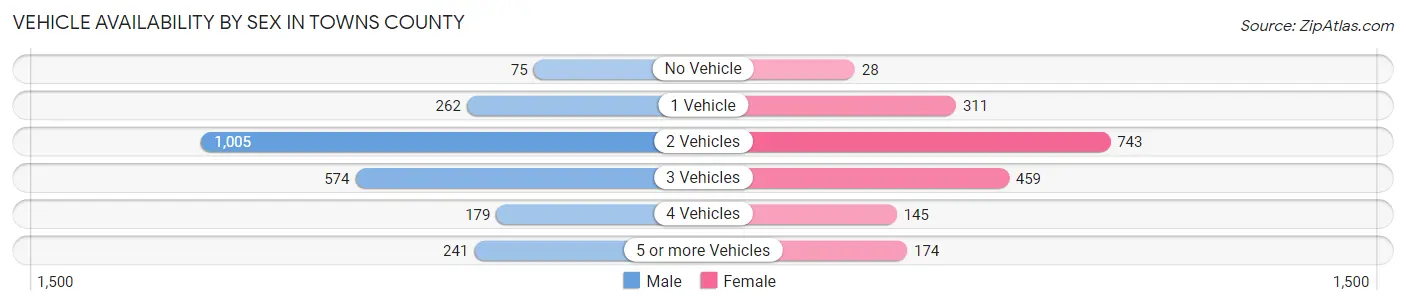
| Vehicles Available | Male | Female |
| No Vehicle | 75 (3.2%) | 28 (1.5%) |
| 1 Vehicle | 262 (11.2%) | 311 (16.7%) |
| 2 Vehicles | 1,005 (43.0%) | 743 (40.0%) |
| 3 Vehicles | 574 (24.6%) | 459 (24.7%) |
| 4 Vehicles | 179 (7.7%) | 145 (7.8%) |
| 5 or more Vehicles | 241 (10.3%) | 174 (9.3%) |
| Total | 2,336 (100.0%) | 1,860 (100.0%) |
Commute Time in Towns County
The most frequently occuring commute durations in Towns County are 15 to 19 minutes (795 commuters, 19.1%), 10 to 14 minutes (773 commuters, 18.6%), and 5 to 9 minutes (711 commuters, 17.1%).
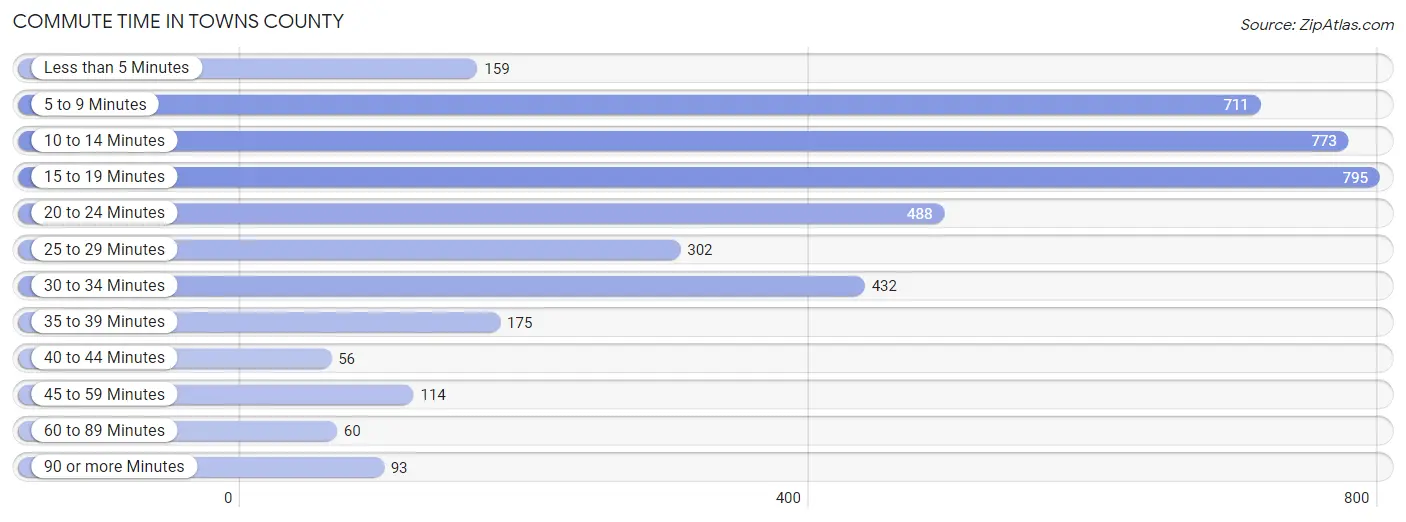
| Commute Time | # Commuters | % Commuters |
| Less than 5 Minutes | 159 | 3.8% |
| 5 to 9 Minutes | 711 | 17.1% |
| 10 to 14 Minutes | 773 | 18.6% |
| 15 to 19 Minutes | 795 | 19.1% |
| 20 to 24 Minutes | 488 | 11.7% |
| 25 to 29 Minutes | 302 | 7.3% |
| 30 to 34 Minutes | 432 | 10.4% |
| 35 to 39 Minutes | 175 | 4.2% |
| 40 to 44 Minutes | 56 | 1.3% |
| 45 to 59 Minutes | 114 | 2.7% |
| 60 to 89 Minutes | 60 | 1.4% |
| 90 or more Minutes | 93 | 2.2% |
Commute Time by Sex in Towns County
The most common commute times in Towns County are 15 to 19 minutes (481 commuters, 20.4%) for males and 5 to 9 minutes (399 commuters, 22.2%) for females.
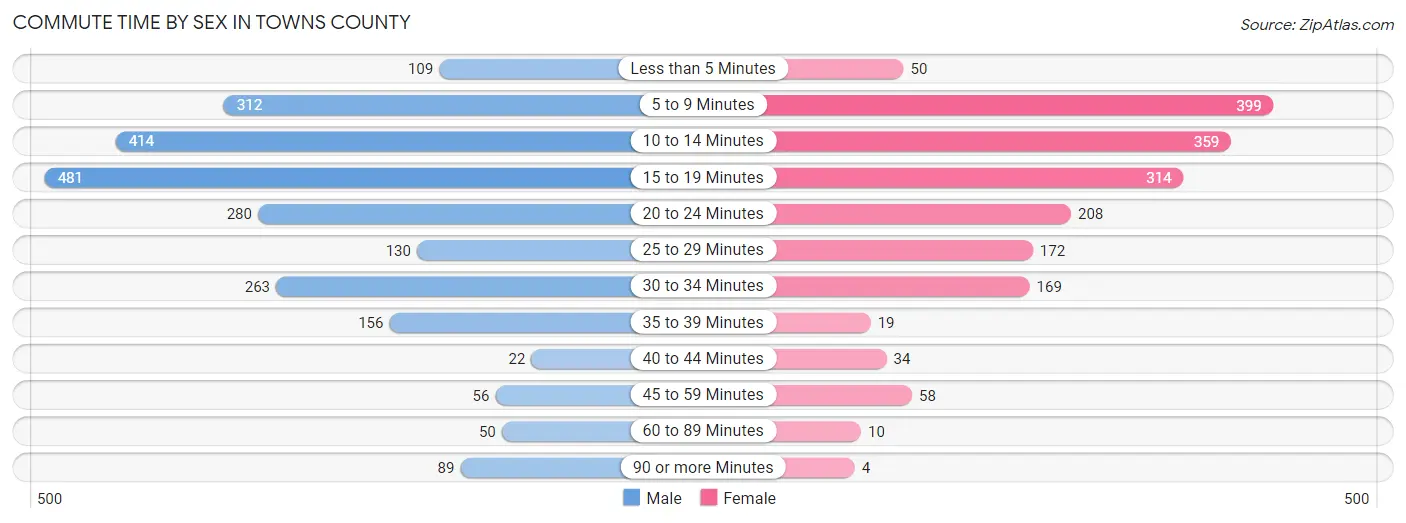
| Commute Time | Male | Female |
| Less than 5 Minutes | 109 (4.6%) | 50 (2.8%) |
| 5 to 9 Minutes | 312 (13.2%) | 399 (22.2%) |
| 10 to 14 Minutes | 414 (17.5%) | 359 (20.0%) |
| 15 to 19 Minutes | 481 (20.4%) | 314 (17.5%) |
| 20 to 24 Minutes | 280 (11.8%) | 208 (11.6%) |
| 25 to 29 Minutes | 130 (5.5%) | 172 (9.6%) |
| 30 to 34 Minutes | 263 (11.1%) | 169 (9.4%) |
| 35 to 39 Minutes | 156 (6.6%) | 19 (1.1%) |
| 40 to 44 Minutes | 22 (0.9%) | 34 (1.9%) |
| 45 to 59 Minutes | 56 (2.4%) | 58 (3.2%) |
| 60 to 89 Minutes | 50 (2.1%) | 10 (0.6%) |
| 90 or more Minutes | 89 (3.8%) | 4 (0.2%) |
Time of Departure to Work by Sex in Towns County
The most frequent times of departure to work in Towns County are 7:00 AM to 7:29 AM (354, 15.0%) for males and 7:30 AM to 7:59 AM (378, 21.0%) for females.
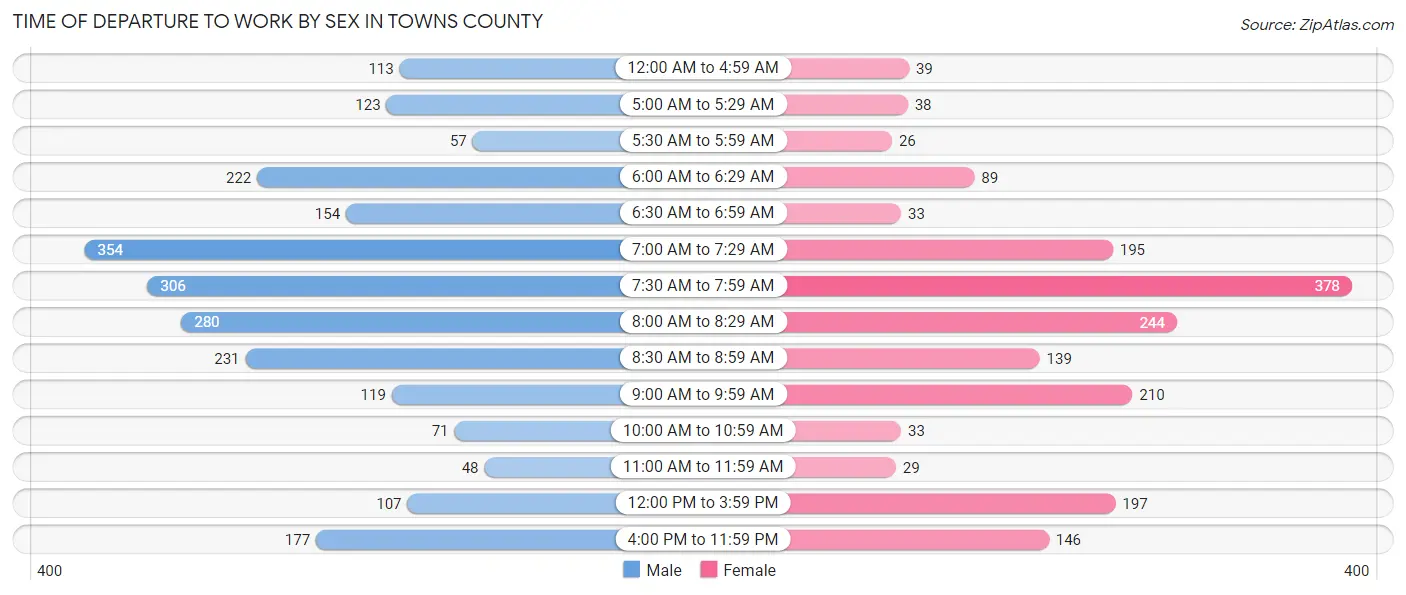
| Time of Departure | Male | Female |
| 12:00 AM to 4:59 AM | 113 (4.8%) | 39 (2.2%) |
| 5:00 AM to 5:29 AM | 123 (5.2%) | 38 (2.1%) |
| 5:30 AM to 5:59 AM | 57 (2.4%) | 26 (1.5%) |
| 6:00 AM to 6:29 AM | 222 (9.4%) | 89 (5.0%) |
| 6:30 AM to 6:59 AM | 154 (6.5%) | 33 (1.8%) |
| 7:00 AM to 7:29 AM | 354 (15.0%) | 195 (10.9%) |
| 7:30 AM to 7:59 AM | 306 (13.0%) | 378 (21.0%) |
| 8:00 AM to 8:29 AM | 280 (11.8%) | 244 (13.6%) |
| 8:30 AM to 8:59 AM | 231 (9.8%) | 139 (7.7%) |
| 9:00 AM to 9:59 AM | 119 (5.0%) | 210 (11.7%) |
| 10:00 AM to 10:59 AM | 71 (3.0%) | 33 (1.8%) |
| 11:00 AM to 11:59 AM | 48 (2.0%) | 29 (1.6%) |
| 12:00 PM to 3:59 PM | 107 (4.5%) | 197 (11.0%) |
| 4:00 PM to 11:59 PM | 177 (7.5%) | 146 (8.1%) |
| Total | 2,362 (100.0%) | 1,796 (100.0%) |
Housing Occupancy in Towns County
Occupancy by Ownership in Towns County
Of the total 5,464 dwellings in Towns County, owner-occupied units account for 4,320 (79.1%), while renter-occupied units make up 1,144 (20.9%).
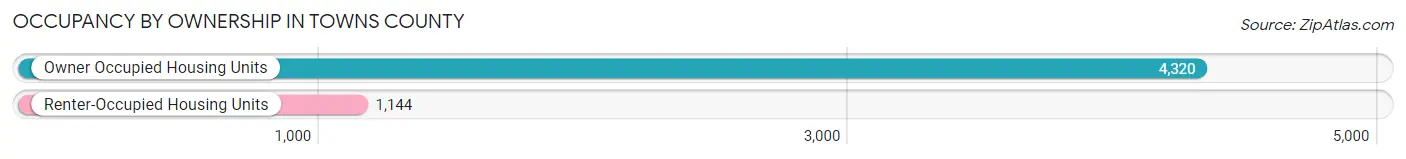
| Occupancy | # Housing Units | % Housing Units |
| Owner Occupied Housing Units | 4,320 | 79.1% |
| Renter-Occupied Housing Units | 1,144 | 20.9% |
| Total Occupied Housing Units | 5,464 | 100.0% |
Occupancy by Household Size in Towns County
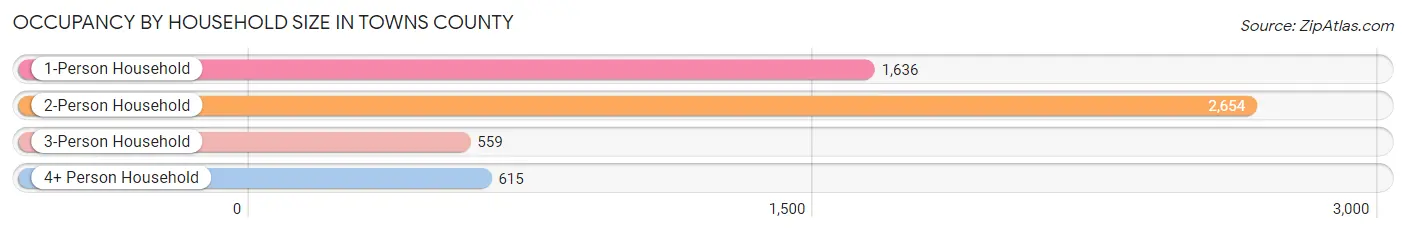
| Household Size | # Housing Units | % Housing Units |
| 1-Person Household | 1,636 | 29.9% |
| 2-Person Household | 2,654 | 48.6% |
| 3-Person Household | 559 | 10.2% |
| 4+ Person Household | 615 | 11.3% |
| Total Housing Units | 5,464 | 100.0% |
Occupancy by Ownership by Household Size in Towns County
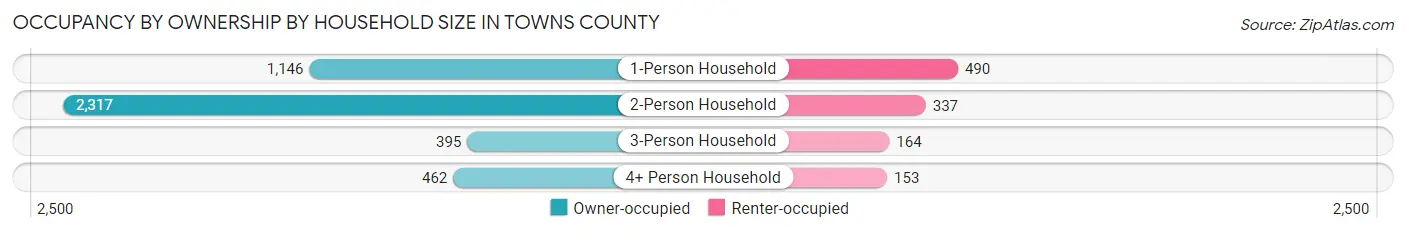
| Household Size | Owner-occupied | Renter-occupied |
| 1-Person Household | 1,146 (70.1%) | 490 (29.9%) |
| 2-Person Household | 2,317 (87.3%) | 337 (12.7%) |
| 3-Person Household | 395 (70.7%) | 164 (29.3%) |
| 4+ Person Household | 462 (75.1%) | 153 (24.9%) |
| Total Housing Units | 4,320 (79.1%) | 1,144 (20.9%) |
Occupancy by Educational Attainment in Towns County
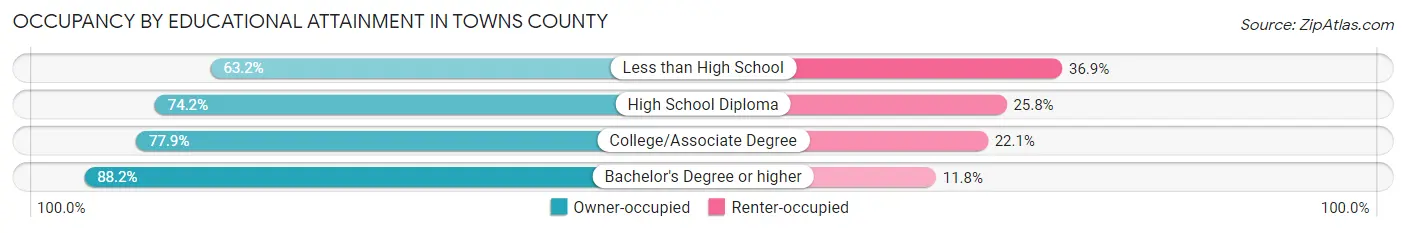
| Household Size | Owner-occupied | Renter-occupied |
| Less than High School | 305 (63.1%) | 178 (36.8%) |
| High School Diploma | 1,048 (74.2%) | 365 (25.8%) |
| College/Associate Degree | 1,356 (77.9%) | 385 (22.1%) |
| Bachelor's Degree or higher | 1,611 (88.2%) | 216 (11.8%) |
Occupancy by Age of Householder in Towns County
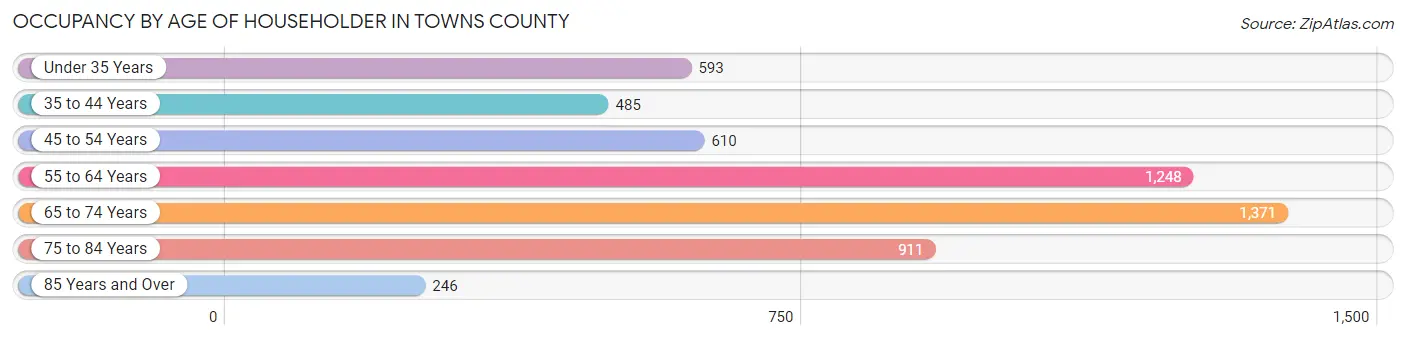
| Age Bracket | # Households | % Households |
| Under 35 Years | 593 | 10.8% |
| 35 to 44 Years | 485 | 8.9% |
| 45 to 54 Years | 610 | 11.2% |
| 55 to 64 Years | 1,248 | 22.8% |
| 65 to 74 Years | 1,371 | 25.1% |
| 75 to 84 Years | 911 | 16.7% |
| 85 Years and Over | 246 | 4.5% |
| Total | 5,464 | 100.0% |
Housing Finances in Towns County
Median Income by Occupancy in Towns County
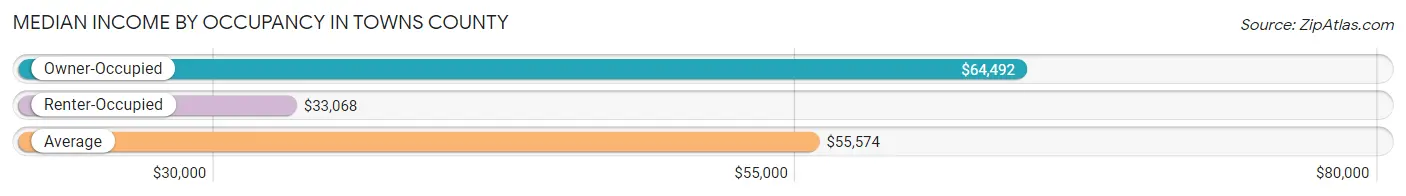
| Occupancy Type | # Households | Median Income |
| Owner-Occupied | 4,320 (79.1%) | $64,492 |
| Renter-Occupied | 1,144 (20.9%) | $33,068 |
| Average | 5,464 (100.0%) | $55,574 |
Occupancy by Householder Income Bracket in Towns County
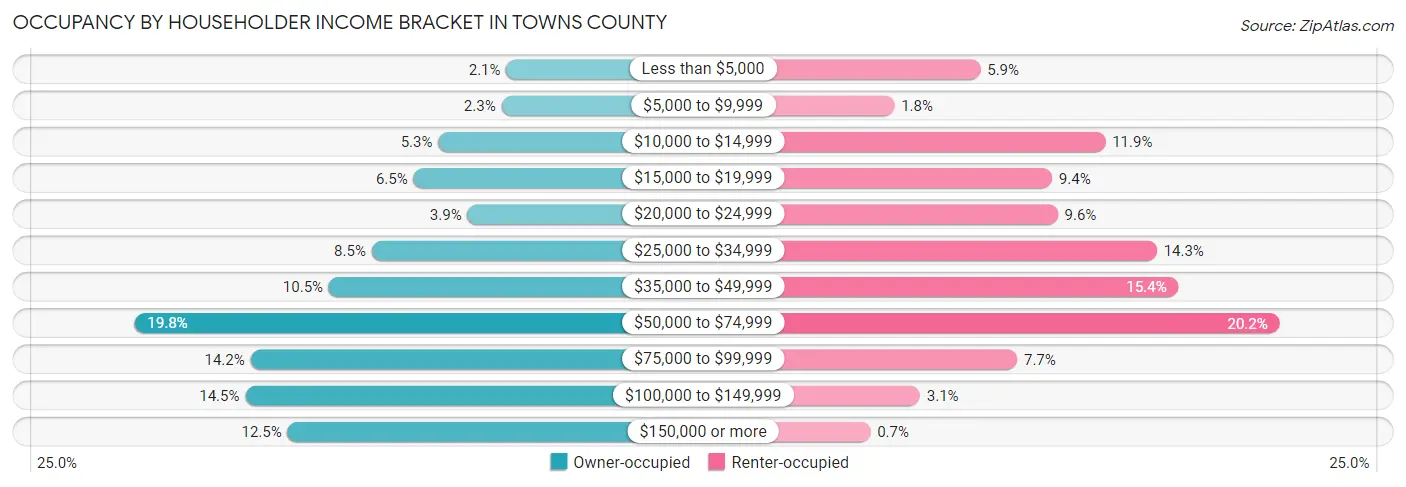
| Income Bracket | Owner-occupied | Renter-occupied |
| Less than $5,000 | 89 (2.1%) | 68 (5.9%) |
| $5,000 to $9,999 | 99 (2.3%) | 21 (1.8%) |
| $10,000 to $14,999 | 229 (5.3%) | 136 (11.9%) |
| $15,000 to $19,999 | 280 (6.5%) | 107 (9.3%) |
| $20,000 to $24,999 | 169 (3.9%) | 110 (9.6%) |
| $25,000 to $34,999 | 366 (8.5%) | 164 (14.3%) |
| $35,000 to $49,999 | 454 (10.5%) | 176 (15.4%) |
| $50,000 to $74,999 | 854 (19.8%) | 231 (20.2%) |
| $75,000 to $99,999 | 615 (14.2%) | 88 (7.7%) |
| $100,000 to $149,999 | 626 (14.5%) | 35 (3.1%) |
| $150,000 or more | 539 (12.5%) | 8 (0.7%) |
| Total | 4,320 (100.0%) | 1,144 (100.0%) |
Monthly Housing Cost Tiers in Towns County
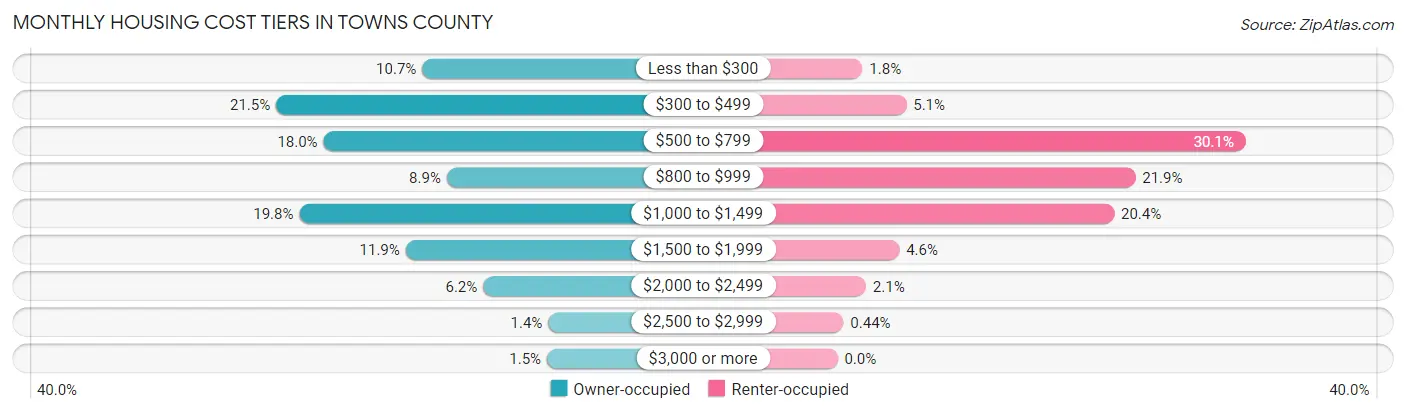
| Monthly Cost | Owner-occupied | Renter-occupied |
| Less than $300 | 463 (10.7%) | 21 (1.8%) |
| $300 to $499 | 928 (21.5%) | 58 (5.1%) |
| $500 to $799 | 777 (18.0%) | 344 (30.1%) |
| $800 to $999 | 385 (8.9%) | 251 (21.9%) |
| $1,000 to $1,499 | 854 (19.8%) | 233 (20.4%) |
| $1,500 to $1,999 | 516 (11.9%) | 52 (4.5%) |
| $2,000 to $2,499 | 269 (6.2%) | 24 (2.1%) |
| $2,500 to $2,999 | 62 (1.4%) | 5 (0.4%) |
| $3,000 or more | 66 (1.5%) | 0 (0.0%) |
| Total | 4,320 (100.0%) | 1,144 (100.0%) |
Physical Housing Characteristics in Towns County
Housing Structures in Towns County
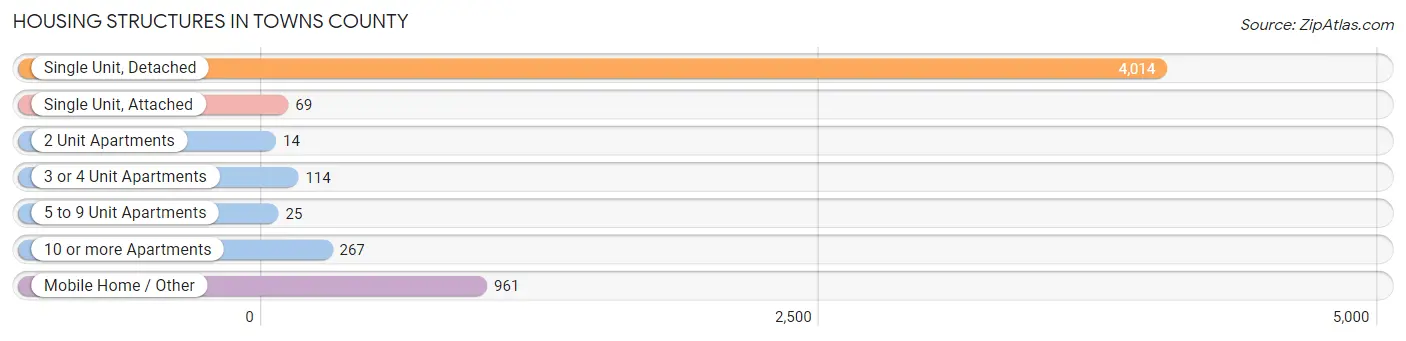
| Structure Type | # Housing Units | % Housing Units |
| Single Unit, Detached | 4,014 | 73.5% |
| Single Unit, Attached | 69 | 1.3% |
| 2 Unit Apartments | 14 | 0.3% |
| 3 or 4 Unit Apartments | 114 | 2.1% |
| 5 to 9 Unit Apartments | 25 | 0.5% |
| 10 or more Apartments | 267 | 4.9% |
| Mobile Home / Other | 961 | 17.6% |
| Total | 5,464 | 100.0% |
Housing Structures by Occupancy in Towns County
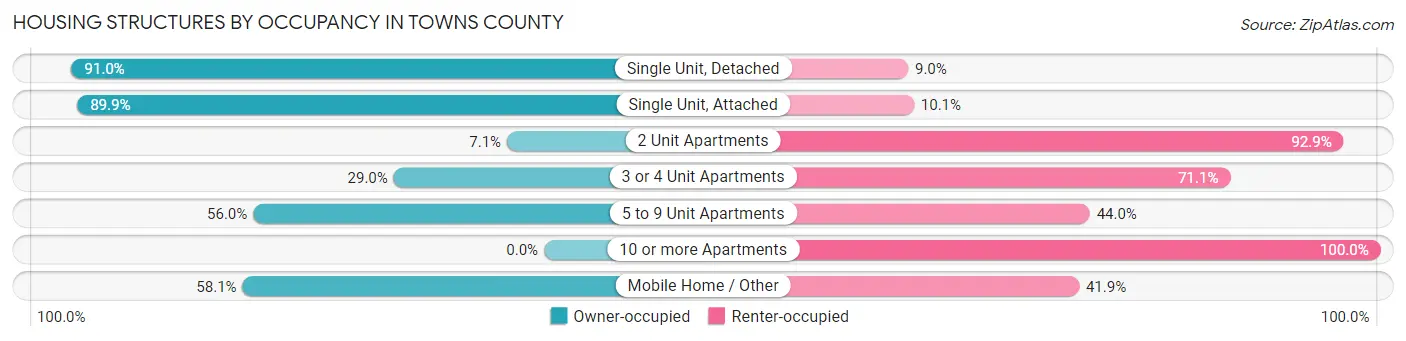
| Structure Type | Owner-occupied | Renter-occupied |
| Single Unit, Detached | 3,652 (91.0%) | 362 (9.0%) |
| Single Unit, Attached | 62 (89.9%) | 7 (10.1%) |
| 2 Unit Apartments | 1 (7.1%) | 13 (92.9%) |
| 3 or 4 Unit Apartments | 33 (28.9%) | 81 (71.1%) |
| 5 to 9 Unit Apartments | 14 (56.0%) | 11 (44.0%) |
| 10 or more Apartments | 0 (0.0%) | 267 (100.0%) |
| Mobile Home / Other | 558 (58.1%) | 403 (41.9%) |
| Total | 4,320 (79.1%) | 1,144 (20.9%) |
Housing Structures by Number of Rooms in Towns County
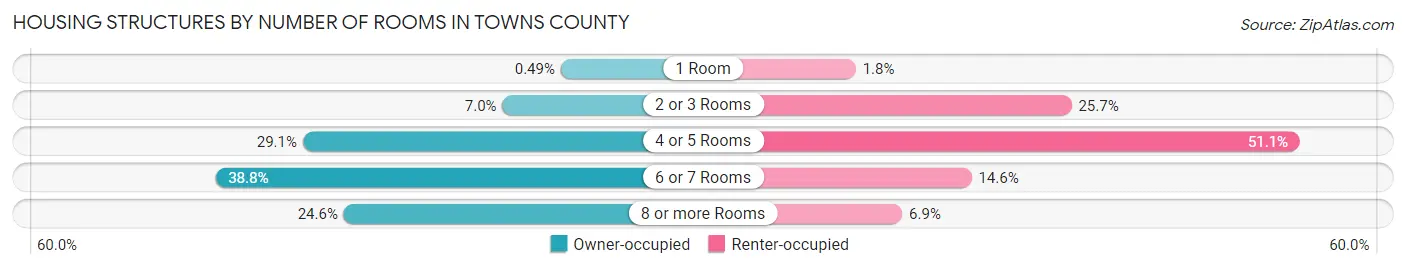
| Number of Rooms | Owner-occupied | Renter-occupied |
| 1 Room | 21 (0.5%) | 20 (1.8%) |
| 2 or 3 Rooms | 301 (7.0%) | 294 (25.7%) |
| 4 or 5 Rooms | 1,258 (29.1%) | 584 (51.0%) |
| 6 or 7 Rooms | 1,678 (38.8%) | 167 (14.6%) |
| 8 or more Rooms | 1,062 (24.6%) | 79 (6.9%) |
| Total | 4,320 (100.0%) | 1,144 (100.0%) |
Housing Structure by Heating Type in Towns County
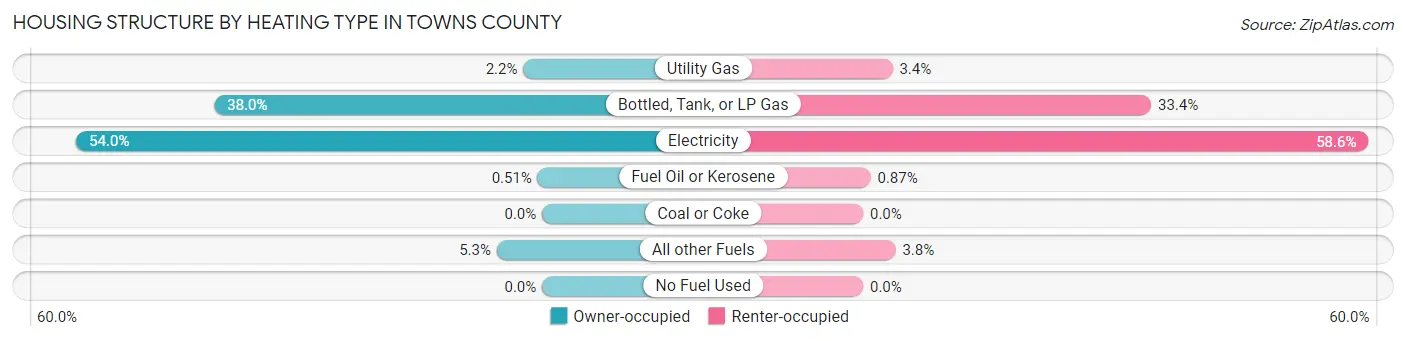
| Heating Type | Owner-occupied | Renter-occupied |
| Utility Gas | 94 (2.2%) | 39 (3.4%) |
| Bottled, Tank, or LP Gas | 1,643 (38.0%) | 382 (33.4%) |
| Electricity | 2,334 (54.0%) | 670 (58.6%) |
| Fuel Oil or Kerosene | 22 (0.5%) | 10 (0.9%) |
| Coal or Coke | 0 (0.0%) | 0 (0.0%) |
| All other Fuels | 227 (5.2%) | 43 (3.8%) |
| No Fuel Used | 0 (0.0%) | 0 (0.0%) |
| Total | 4,320 (100.0%) | 1,144 (100.0%) |
Household Vehicle Usage in Towns County
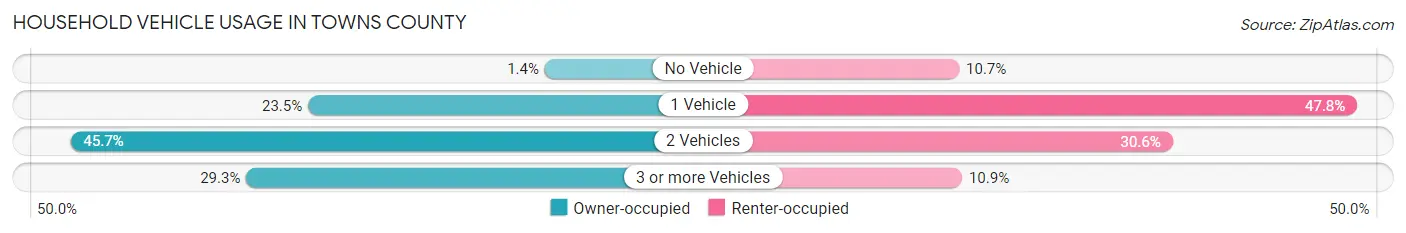
| Vehicles per Household | Owner-occupied | Renter-occupied |
| No Vehicle | 62 (1.4%) | 122 (10.7%) |
| 1 Vehicle | 1,017 (23.5%) | 547 (47.8%) |
| 2 Vehicles | 1,975 (45.7%) | 350 (30.6%) |
| 3 or more Vehicles | 1,266 (29.3%) | 125 (10.9%) |
| Total | 4,320 (100.0%) | 1,144 (100.0%) |
Real Estate & Mortgages in Towns County
Real Estate and Mortgage Overview in Towns County
| Characteristic | Without Mortgage | With Mortgage |
| Housing Units | 2,197 | 2,123 |
| Median Property Value | $233,200 | $316,800 |
| Median Household Income | $53,521 | $344 |
| Monthly Housing Costs | $446 | $66 |
| Real Estate Taxes | $999 | $9 |
Property Value by Mortgage Status in Towns County
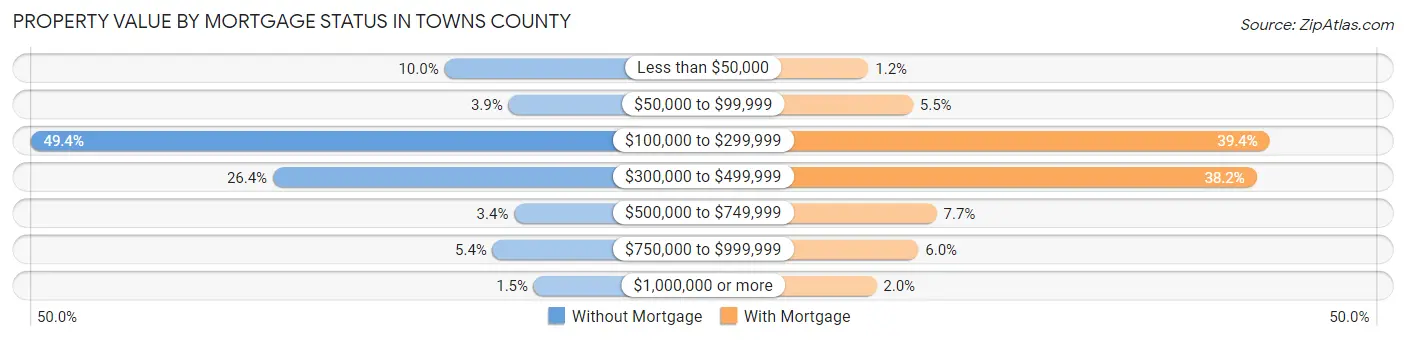
| Property Value | Without Mortgage | With Mortgage |
| Less than $50,000 | 220 (10.0%) | 26 (1.2%) |
| $50,000 to $99,999 | 86 (3.9%) | 116 (5.5%) |
| $100,000 to $299,999 | 1,086 (49.4%) | 837 (39.4%) |
| $300,000 to $499,999 | 579 (26.4%) | 811 (38.2%) |
| $500,000 to $749,999 | 74 (3.4%) | 164 (7.7%) |
| $750,000 to $999,999 | 119 (5.4%) | 127 (6.0%) |
| $1,000,000 or more | 33 (1.5%) | 42 (2.0%) |
| Total | 2,197 (100.0%) | 2,123 (100.0%) |
Household Income by Mortgage Status in Towns County
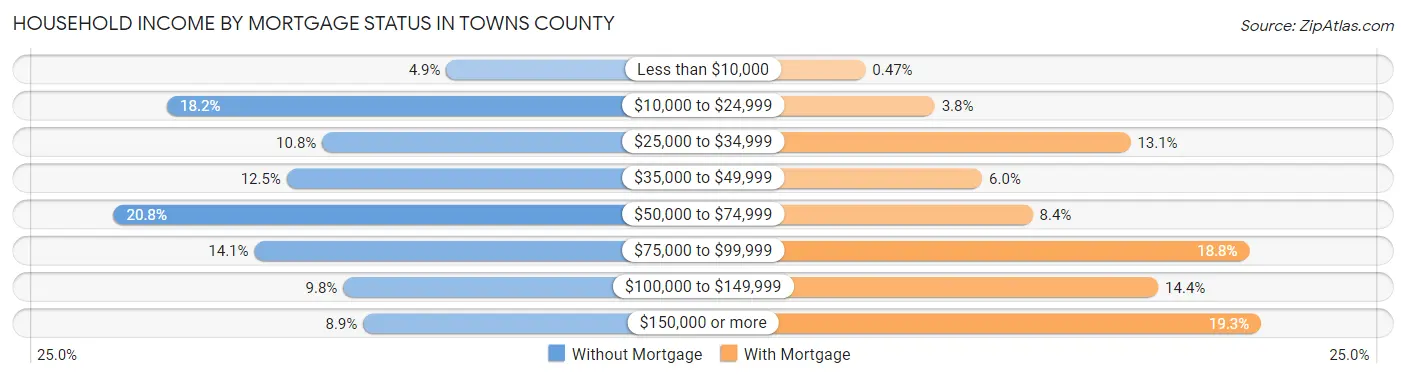
| Household Income | Without Mortgage | With Mortgage |
| Less than $10,000 | 108 (4.9%) | 10 (0.5%) |
| $10,000 to $24,999 | 400 (18.2%) | 80 (3.8%) |
| $25,000 to $34,999 | 238 (10.8%) | 278 (13.1%) |
| $35,000 to $49,999 | 275 (12.5%) | 128 (6.0%) |
| $50,000 to $74,999 | 456 (20.8%) | 179 (8.4%) |
| $75,000 to $99,999 | 309 (14.1%) | 398 (18.8%) |
| $100,000 to $149,999 | 216 (9.8%) | 306 (14.4%) |
| $150,000 or more | 195 (8.9%) | 410 (19.3%) |
| Total | 2,197 (100.0%) | 2,123 (100.0%) |
Property Value to Household Income Ratio in Towns County
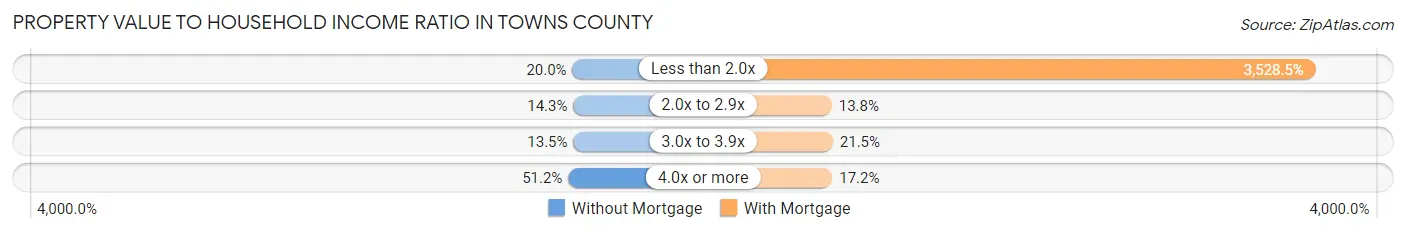
| Value-to-Income Ratio | Without Mortgage | With Mortgage |
| Less than 2.0x | 440 (20.0%) | 74,911 (3,528.5%) |
| 2.0x to 2.9x | 314 (14.3%) | 292 (13.8%) |
| 3.0x to 3.9x | 297 (13.5%) | 457 (21.5%) |
| 4.0x or more | 1,124 (51.2%) | 366 (17.2%) |
| Total | 2,197 (100.0%) | 2,123 (100.0%) |
Real Estate Taxes by Mortgage Status in Towns County
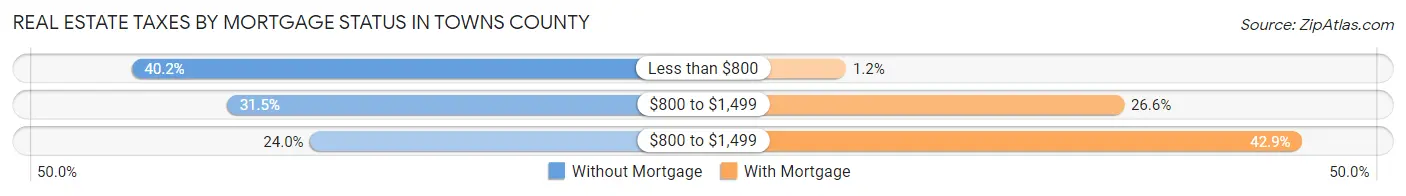
| Property Taxes | Without Mortgage | With Mortgage |
| Less than $800 | 884 (40.2%) | 25 (1.2%) |
| $800 to $1,499 | 693 (31.5%) | 564 (26.6%) |
| $800 to $1,499 | 527 (24.0%) | 910 (42.9%) |
| Total | 2,197 (100.0%) | 2,123 (100.0%) |
Health & Disability in Towns County
Health Insurance Coverage by Age in Towns County
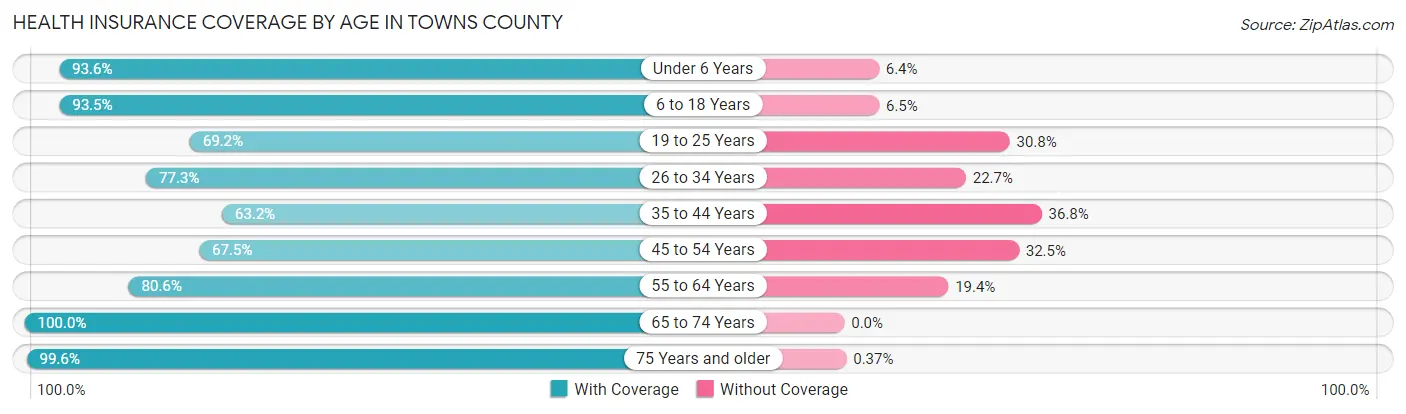
| Age Bracket | With Coverage | Without Coverage |
| Under 6 Years | 509 (93.6%) | 35 (6.4%) |
| 6 to 18 Years | 1,270 (93.5%) | 88 (6.5%) |
| 19 to 25 Years | 797 (69.2%) | 355 (30.8%) |
| 26 to 34 Years | 720 (77.3%) | 211 (22.7%) |
| 35 to 44 Years | 541 (63.2%) | 315 (36.8%) |
| 45 to 54 Years | 825 (67.5%) | 398 (32.5%) |
| 55 to 64 Years | 1,593 (80.6%) | 383 (19.4%) |
| 65 to 74 Years | 2,475 (100.0%) | 0 (0.0%) |
| 75 Years and older | 1,861 (99.6%) | 7 (0.4%) |
| Total | 10,591 (85.5%) | 1,792 (14.5%) |
Health Insurance Coverage by Citizenship Status in Towns County
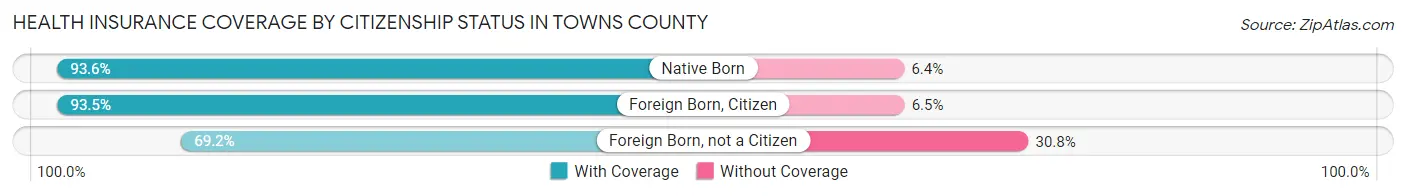
| Citizenship Status | With Coverage | Without Coverage |
| Native Born | 509 (93.6%) | 35 (6.4%) |
| Foreign Born, Citizen | 1,270 (93.5%) | 88 (6.5%) |
| Foreign Born, not a Citizen | 797 (69.2%) | 355 (30.8%) |
Health Insurance Coverage by Household Income in Towns County
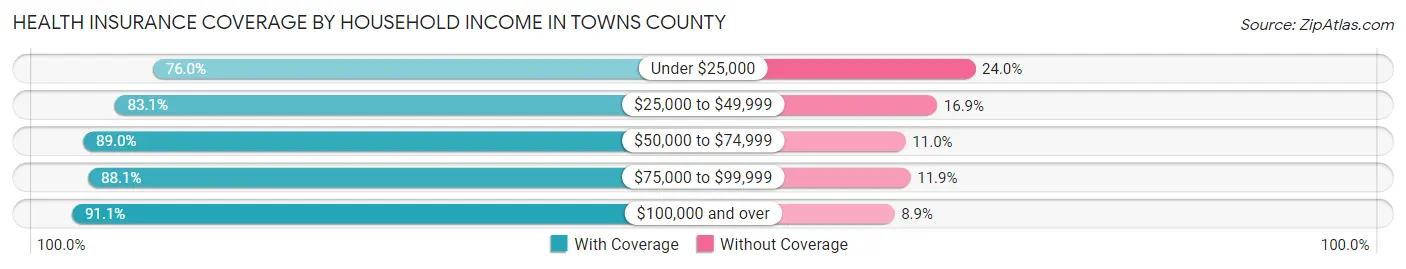
| Household Income | With Coverage | Without Coverage |
| Under $25,000 | 1,600 (76.0%) | 506 (24.0%) |
| $25,000 to $49,999 | 1,907 (83.1%) | 387 (16.9%) |
| $50,000 to $74,999 | 2,116 (89.0%) | 261 (11.0%) |
| $75,000 to $99,999 | 1,414 (88.1%) | 191 (11.9%) |
| $100,000 and over | 3,005 (91.1%) | 293 (8.9%) |
Public vs Private Health Insurance Coverage by Age in Towns County
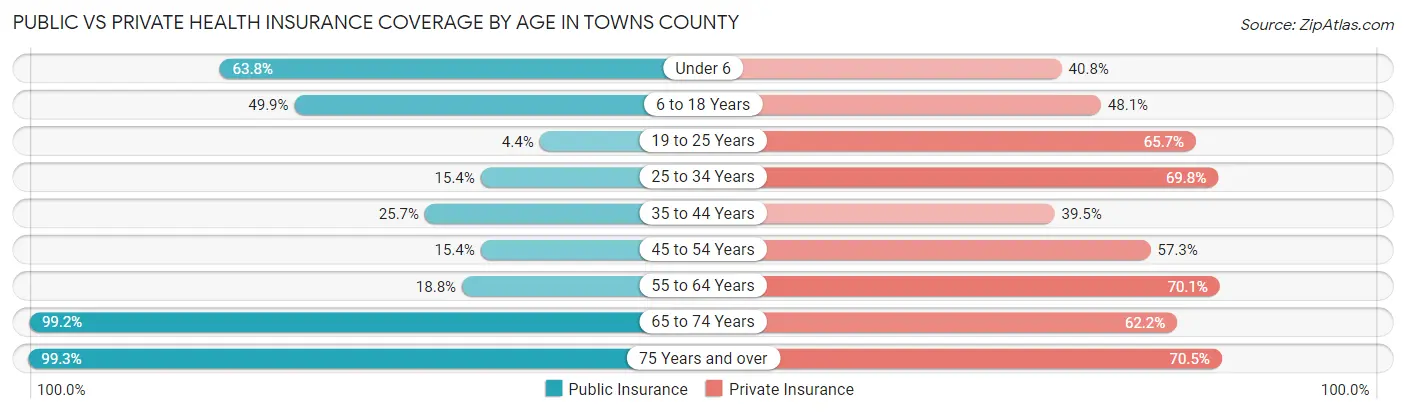
| Age Bracket | Public Insurance | Private Insurance |
| Under 6 | 347 (63.8%) | 222 (40.8%) |
| 6 to 18 Years | 678 (49.9%) | 653 (48.1%) |
| 19 to 25 Years | 51 (4.4%) | 757 (65.7%) |
| 25 to 34 Years | 143 (15.4%) | 650 (69.8%) |
| 35 to 44 Years | 220 (25.7%) | 338 (39.5%) |
| 45 to 54 Years | 188 (15.4%) | 701 (57.3%) |
| 55 to 64 Years | 372 (18.8%) | 1,386 (70.1%) |
| 65 to 74 Years | 2,455 (99.2%) | 1,540 (62.2%) |
| 75 Years and over | 1,855 (99.3%) | 1,317 (70.5%) |
| Total | 6,309 (50.9%) | 7,564 (61.1%) |
Disability Status by Sex by Age in Towns County
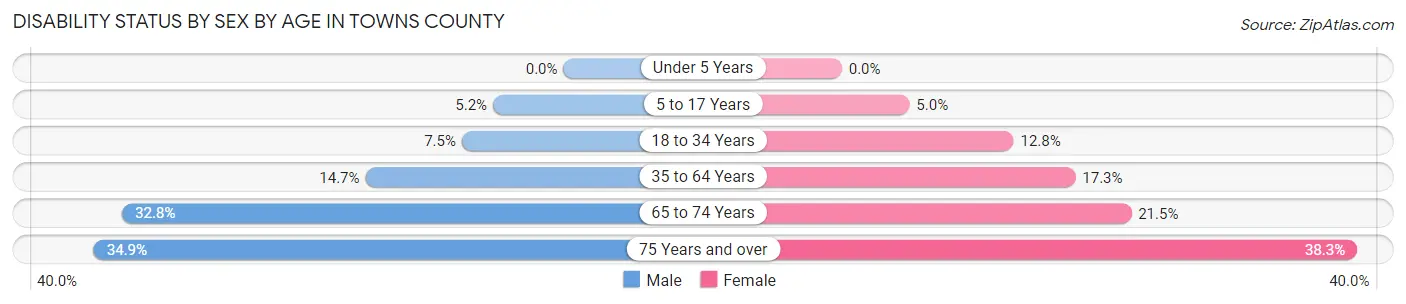
| Age Bracket | Male | Female |
| Under 5 Years | 0 (0.0%) | 0 (0.0%) |
| 5 to 17 Years | 30 (5.2%) | 29 (5.0%) |
| 18 to 34 Years | 90 (7.5%) | 157 (12.8%) |
| 35 to 64 Years | 291 (14.7%) | 360 (17.3%) |
| 65 to 74 Years | 381 (32.8%) | 282 (21.5%) |
| 75 Years and over | 304 (34.9%) | 381 (38.3%) |
Disability Class by Sex by Age in Towns County
Disability Class: Hearing Difficulty
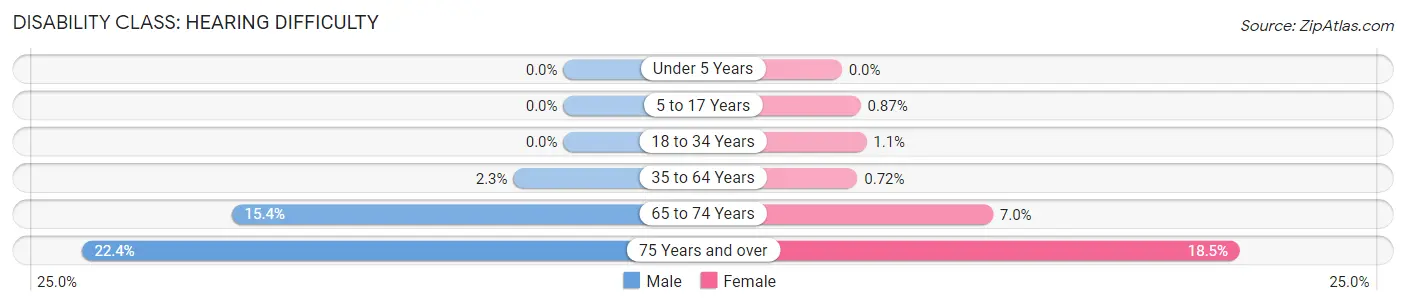
| Age Bracket | Male | Female |
| Under 5 Years | 0 (0.0%) | 0 (0.0%) |
| 5 to 17 Years | 0 (0.0%) | 5 (0.9%) |
| 18 to 34 Years | 0 (0.0%) | 14 (1.1%) |
| 35 to 64 Years | 46 (2.3%) | 15 (0.7%) |
| 65 to 74 Years | 179 (15.4%) | 92 (7.0%) |
| 75 Years and over | 195 (22.4%) | 184 (18.5%) |
Disability Class: Vision Difficulty
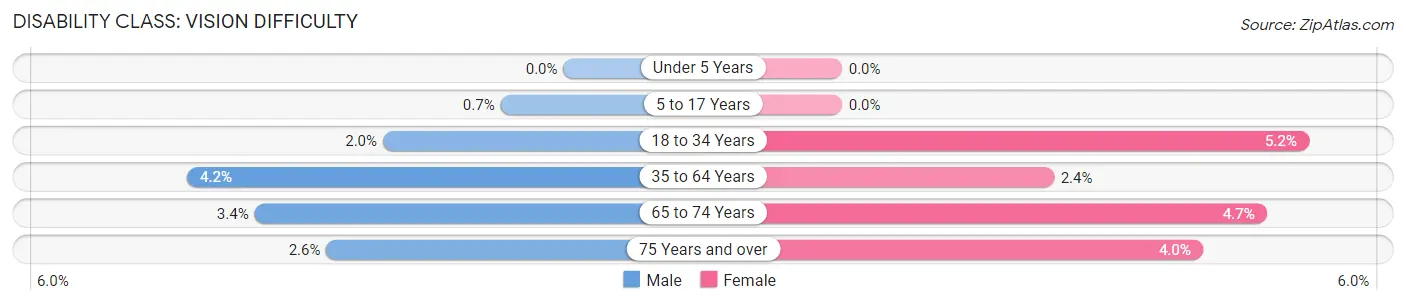
| Age Bracket | Male | Female |
| Under 5 Years | 0 (0.0%) | 0 (0.0%) |
| 5 to 17 Years | 4 (0.7%) | 0 (0.0%) |
| 18 to 34 Years | 24 (2.0%) | 64 (5.2%) |
| 35 to 64 Years | 83 (4.2%) | 49 (2.4%) |
| 65 to 74 Years | 40 (3.4%) | 62 (4.7%) |
| 75 Years and over | 23 (2.6%) | 40 (4.0%) |
Disability Class: Cognitive Difficulty
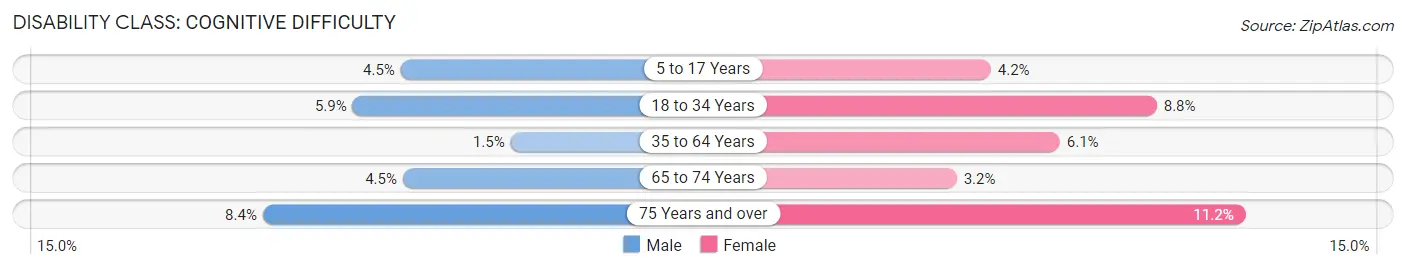
| Age Bracket | Male | Female |
| 5 to 17 Years | 26 (4.5%) | 24 (4.2%) |
| 18 to 34 Years | 70 (5.9%) | 108 (8.8%) |
| 35 to 64 Years | 29 (1.5%) | 126 (6.1%) |
| 65 to 74 Years | 52 (4.5%) | 42 (3.2%) |
| 75 Years and over | 73 (8.4%) | 112 (11.2%) |
Disability Class: Ambulatory Difficulty
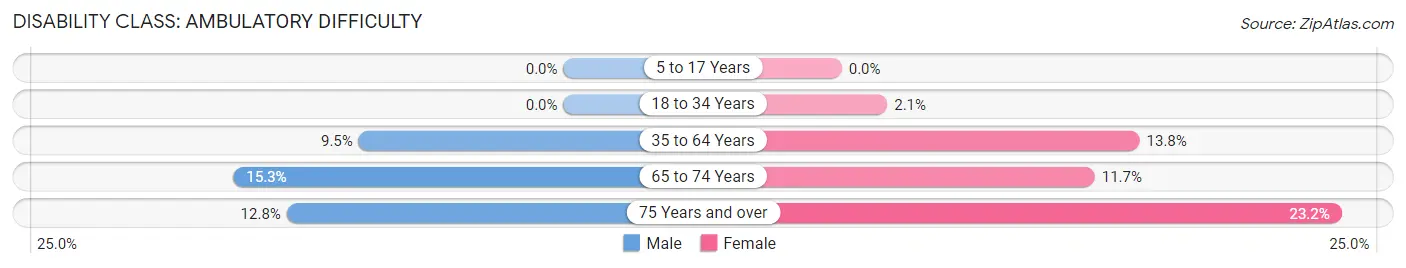
| Age Bracket | Male | Female |
| 5 to 17 Years | 0 (0.0%) | 0 (0.0%) |
| 18 to 34 Years | 0 (0.0%) | 26 (2.1%) |
| 35 to 64 Years | 188 (9.5%) | 287 (13.8%) |
| 65 to 74 Years | 178 (15.3%) | 154 (11.7%) |
| 75 Years and over | 112 (12.8%) | 231 (23.2%) |
Disability Class: Self-Care Difficulty
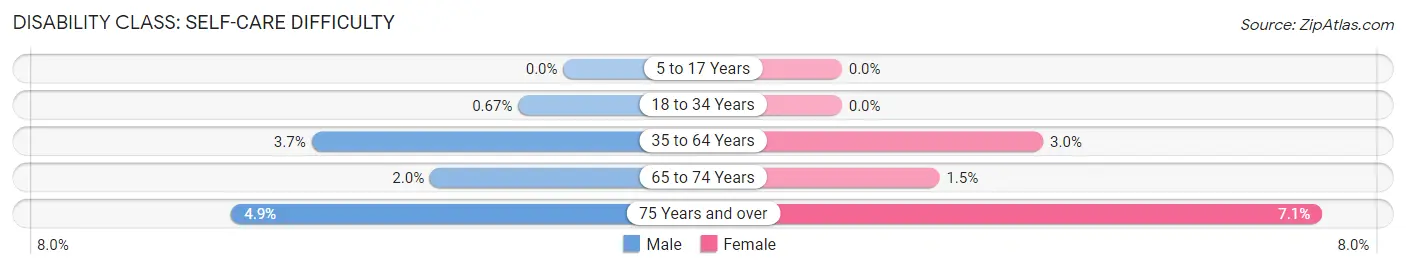
| Age Bracket | Male | Female |
| 5 to 17 Years | 0 (0.0%) | 0 (0.0%) |
| 18 to 34 Years | 8 (0.7%) | 0 (0.0%) |
| 35 to 64 Years | 74 (3.7%) | 62 (3.0%) |
| 65 to 74 Years | 23 (2.0%) | 19 (1.5%) |
| 75 Years and over | 43 (4.9%) | 71 (7.1%) |
Technology Access in Towns County
Computing Device Access in Towns County
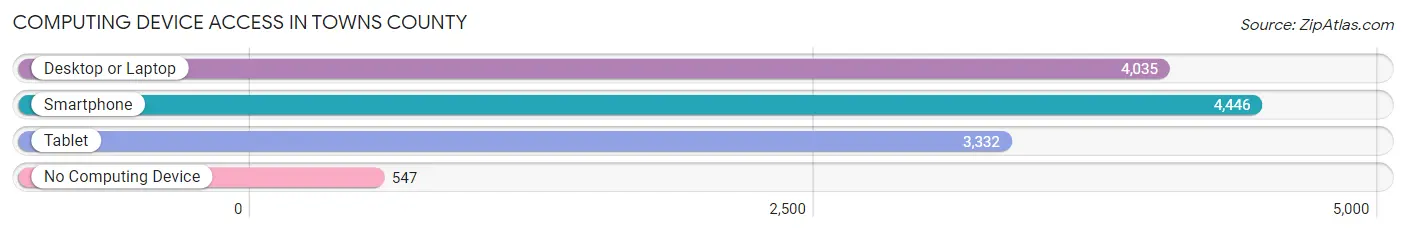
| Device Type | # Households | % Households |
| Desktop or Laptop | 4,035 | 73.9% |
| Smartphone | 4,446 | 81.4% |
| Tablet | 3,332 | 61.0% |
| No Computing Device | 547 | 10.0% |
| Total | 5,464 | 100.0% |
Internet Access in Towns County
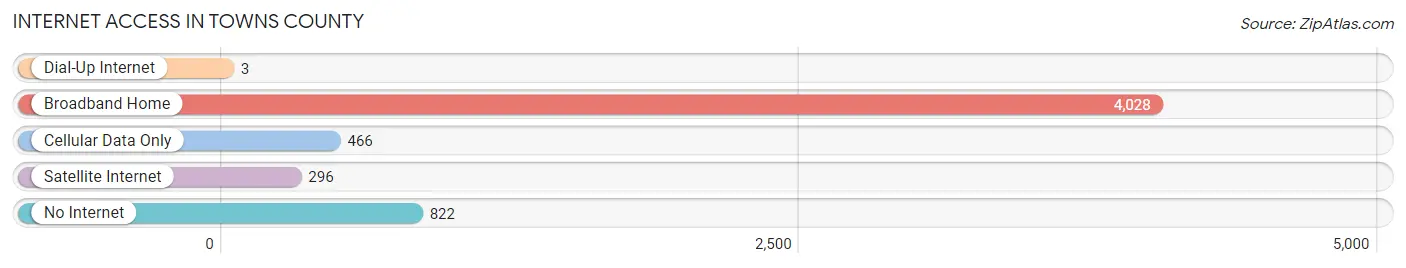
| Internet Type | # Households | % Households |
| Dial-Up Internet | 3 | 0.1% |
| Broadband Home | 4,028 | 73.7% |
| Cellular Data Only | 466 | 8.5% |
| Satellite Internet | 296 | 5.4% |
| No Internet | 822 | 15.0% |
| Total | 5,464 | 100.0% |
Towns County Summary
Towns County is a county located in the northern part of the state of Georgia, United States. It is part of the Blue Ridge Mountains region and is bordered by North Carolina to the north, Rabun County to the east, Union County to the south, and Clay and Fannin counties to the west. The county seat is Hiawassee. As of the 2010 census, the population was 10,471.
History
Towns County was created in 1856 from parts of Union and Rabun counties. It was named for George W. Towns, who served as governor of Georgia from 1847 to 1851. The county was originally part of the Cherokee Nation, and the area was home to many Cherokee settlements. The county was the site of the Trail of Tears, when the Cherokee were forcibly removed from their lands in the 1830s.
Geography
Towns County is located in the northern part of the state of Georgia, in the Blue Ridge Mountains region. It is bordered by North Carolina to the north, Rabun County to the east, Union County to the south, and Clay and Fannin counties to the west. The county has a total area of 199 square miles, of which 197 square miles is land and 2 square miles (1.1%) is water. The highest point in the county is Brasstown Bald, which has an elevation of 4,784 feet.
The county is located in the Chattahoochee National Forest and is home to several state parks, including Vogel State Park, Unicoi State Park, and Moccasin Creek State Park. The county is also home to the Chattahoochee River, which runs through the county and is a popular destination for fishing, boating, and other outdoor activities.
Economy
The economy of Towns County is largely based on tourism, with the county's natural beauty and outdoor recreation opportunities drawing visitors from around the region. The county is home to several state parks, as well as the Chattahoochee National Forest, which provides a variety of recreational activities. The county is also home to several wineries and vineyards, as well as a number of small businesses.
Demographics
As of the 2010 census, there were 10,471 people, 4,541 households, and 2,945 families living in the county. The population density was 53 people per square mile. There were 6,845 housing units at an average density of 35 per square mile. The racial makeup of the county was 96.2% White, 0.7% Black or African American, 0.4% Native American, 0.3% Asian, 0.1% Pacific Islander, 1.2% from other races, and 1.1% from two or more races. 2.7% of the population were Hispanic or Latino of any race.
The median income for a household in the county was $30,945, and the median income for a family was $37,917. The per capita income for the county was $17,945. About 14.2% of families and 18.2% of the population were below the poverty line, including 25.2% of those under age 18 and 11.7% of those age 65 or over.
Common Questions
What is Per Capita Income in Towns County?
Per Capita income in Towns County is $33,443.
What is the Median Family Income in Towns County?
Median Family Income in Towns County is $69,016.
What is the Median Household income in Towns County?
Median Household Income in Towns County is $55,574.
What is Income or Wage Gap in Towns County?
Income or Wage Gap in Towns County is 31.5%.
Women in Towns County earn 68.5 cents for every dollar earned by a man.
What is Inequality or Gini Index in Towns County?
Inequality or Gini Index in Towns County is 0.48.
What is the Total Population of Towns County?
Total Population of Towns County is 12,546.
What is the Total Male Population of Towns County?
Total Male Population of Towns County is 6,034.
What is the Total Female Population of Towns County?
Total Female Population of Towns County is 6,512.
What is the Ratio of Males per 100 Females in Towns County?
There are 92.66 Males per 100 Females in Towns County.
What is the Ratio of Females per 100 Males in Towns County?
There are 107.92 Females per 100 Males in Towns County.
What is the Median Population Age in Towns County?
Median Population Age in Towns County is 56.3 Years.
What is the Average Family Size in Towns County
Average Family Size in Towns County is 2.6 People.
What is the Average Household Size in Towns County
Average Household Size in Towns County is 2.1 People.
How Large is the Labor Force in Towns County?
There are 4,897 People in the Labor Forcein in Towns County.
What is the Percentage of People in the Labor Force in Towns County?
43.8% of People are in the Labor Force in Towns County.
What is the Unemployment Rate in Towns County?
Unemployment Rate in Towns County is 5.5%.