Tift County, GA Map & Demographics
Tift County Map
Tift County Overview
$27,987
PER CAPITA INCOME
$64,812
AVG FAMILY INCOME
$52,561
AVG HOUSEHOLD INCOME
27.3%
WAGE / INCOME GAP [ % ]
72.7¢/ $1
WAGE / INCOME GAP [ $ ]
$11,372
FAMILY INCOME DEFICIT
0.46
INEQUALITY / GINI INDEX
41,247
TOTAL POPULATION
20,002
MALE POPULATION
21,245
FEMALE POPULATION
94.15
MALES / 100 FEMALES
106.21
FEMALES / 100 MALES
36.5
MEDIAN AGE
3.2
AVG FAMILY SIZE
2.6
AVG HOUSEHOLD SIZE
18,413
LABOR FORCE [ PEOPLE ]
57.4%
PERCENT IN LABOR FORCE
2.9%
UNEMPLOYMENT RATE
Tift County Area Codes
Income in Tift County
Income Overview in Tift County
Per Capita Income in Tift County is $27,987, while median incomes of families and households are $64,812 and $52,561 respectively.
| Characteristic | Number | Measure |
| Per Capita Income | 41,247 | $27,987 |
| Median Family Income | 10,120 | $64,812 |
| Mean Family Income | 10,120 | $83,126 |
| Median Household Income | 15,328 | $52,561 |
| Mean Household Income | 15,328 | $71,609 |
| Income Deficit | 10,120 | $11,372 |
| Wage / Income Gap (%) | 41,247 | 27.30% |
| Wage / Income Gap ($) | 41,247 | 72.70¢ per $1 |
| Gini / Inequality Index | 41,247 | 0.46 |
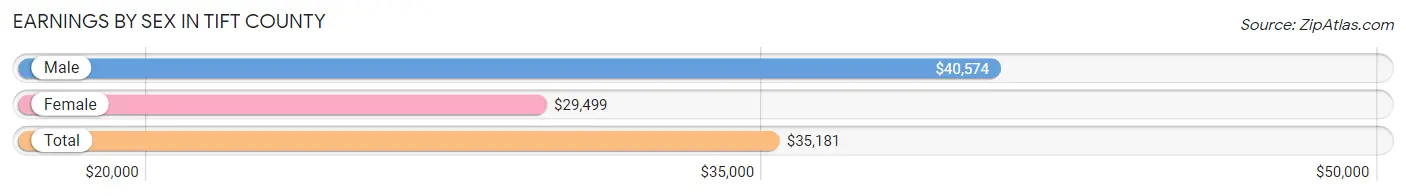
Earnings by Sex in Tift County
Average Earnings in Tift County are $35,181, $40,574 for men and $29,499 for women, a difference of 27.3%.
| Sex | Number | Average Earnings |
| Male | 10,319 (51.9%) | $40,574 |
| Female | 9,549 (48.1%) | $29,499 |
| Total | 19,868 (100.0%) | $35,181 |
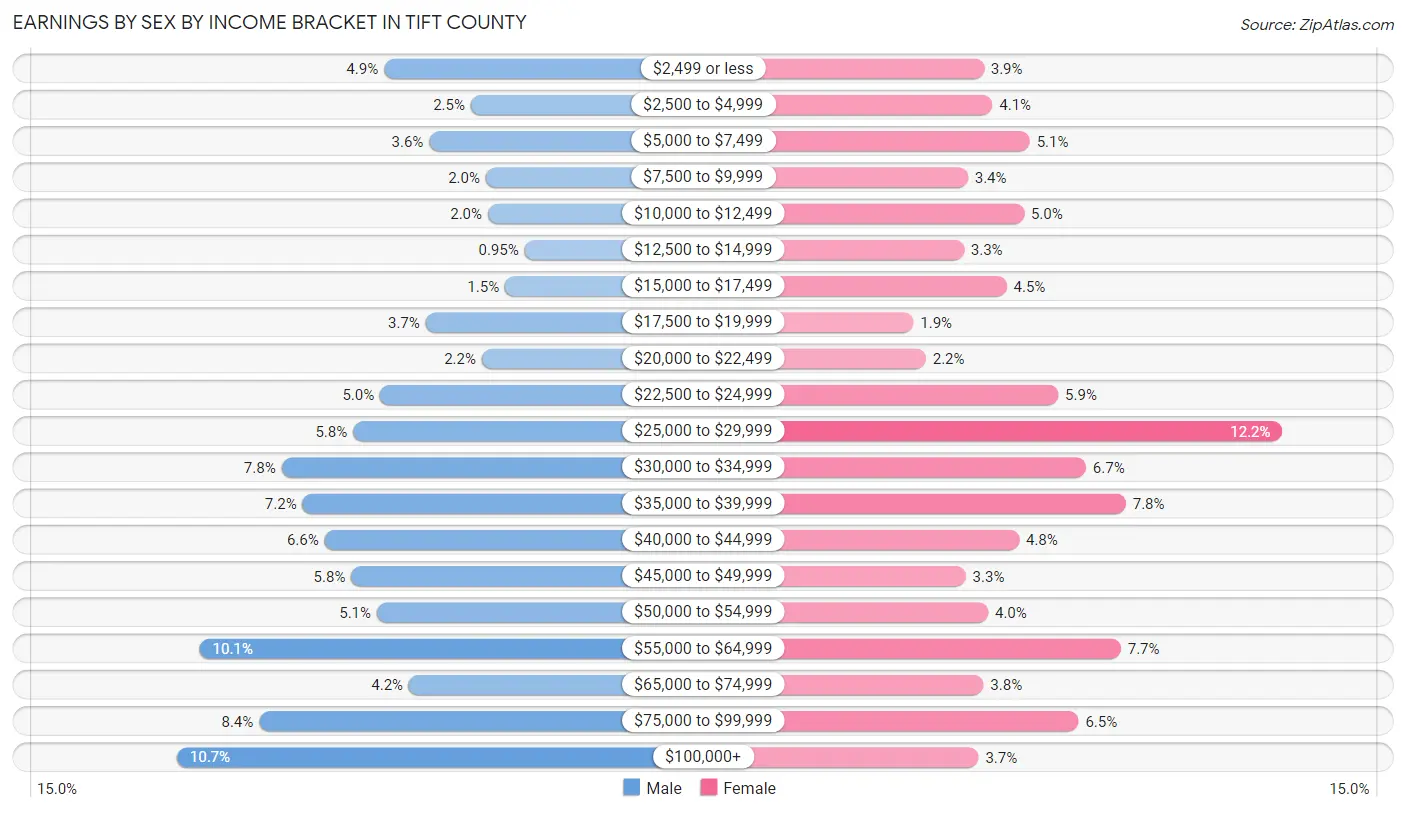
Earnings by Sex by Income Bracket in Tift County
The most common earnings brackets in Tift County are $100,000+ for men (1,106 | 10.7%) and $25,000 to $29,999 for women (1,169 | 12.2%).
| Income | Male | Female |
| $2,499 or less | 506 (4.9%) | 368 (3.8%) |
| $2,500 to $4,999 | 254 (2.5%) | 391 (4.1%) |
| $5,000 to $7,499 | 375 (3.6%) | 491 (5.1%) |
| $7,500 to $9,999 | 211 (2.0%) | 325 (3.4%) |
| $10,000 to $12,499 | 204 (2.0%) | 476 (5.0%) |
| $12,500 to $14,999 | 98 (0.9%) | 314 (3.3%) |
| $15,000 to $17,499 | 155 (1.5%) | 429 (4.5%) |
| $17,500 to $19,999 | 385 (3.7%) | 179 (1.9%) |
| $20,000 to $22,499 | 222 (2.1%) | 212 (2.2%) |
| $22,500 to $24,999 | 517 (5.0%) | 567 (5.9%) |
| $25,000 to $29,999 | 595 (5.8%) | 1,169 (12.2%) |
| $30,000 to $34,999 | 803 (7.8%) | 642 (6.7%) |
| $35,000 to $39,999 | 742 (7.2%) | 749 (7.8%) |
| $40,000 to $44,999 | 678 (6.6%) | 462 (4.8%) |
| $45,000 to $49,999 | 601 (5.8%) | 319 (3.3%) |
| $50,000 to $54,999 | 526 (5.1%) | 379 (4.0%) |
| $55,000 to $64,999 | 1,040 (10.1%) | 735 (7.7%) |
| $65,000 to $74,999 | 433 (4.2%) | 367 (3.8%) |
| $75,000 to $99,999 | 868 (8.4%) | 622 (6.5%) |
| $100,000+ | 1,106 (10.7%) | 353 (3.7%) |
| Total | 10,319 (100.0%) | 9,549 (100.0%) |
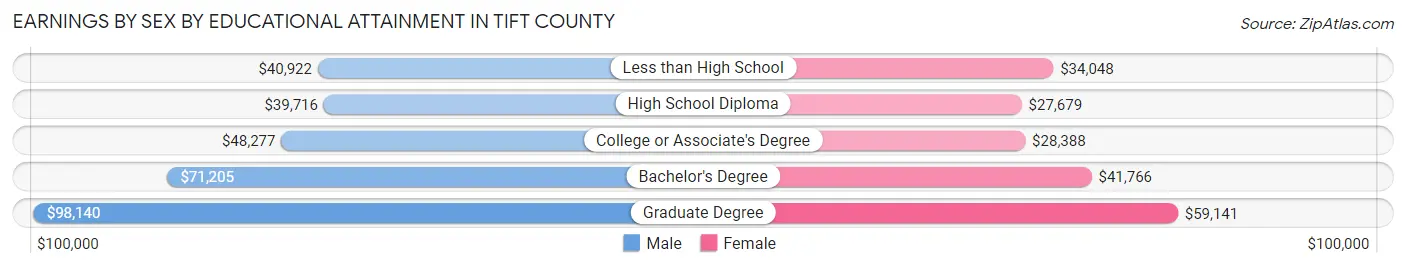
Earnings by Sex by Educational Attainment in Tift County
Average earnings in Tift County are $45,154 for men and $33,692 for women, a difference of 25.4%. Men with an educational attainment of graduate degree enjoy the highest average annual earnings of $98,140, while those with high school diploma education earn the least with $39,716. Women with an educational attainment of graduate degree earn the most with the average annual earnings of $59,141, while those with high school diploma education have the smallest earnings of $27,679.
| Educational Attainment | Male Income | Female Income |
| Less than High School | $40,922 | $34,048 |
| High School Diploma | $39,716 | $27,679 |
| College or Associate's Degree | $48,277 | $28,388 |
| Bachelor's Degree | $71,205 | $41,766 |
| Graduate Degree | $98,140 | $59,141 |
| Total | $45,154 | $33,692 |
Family Income in Tift County
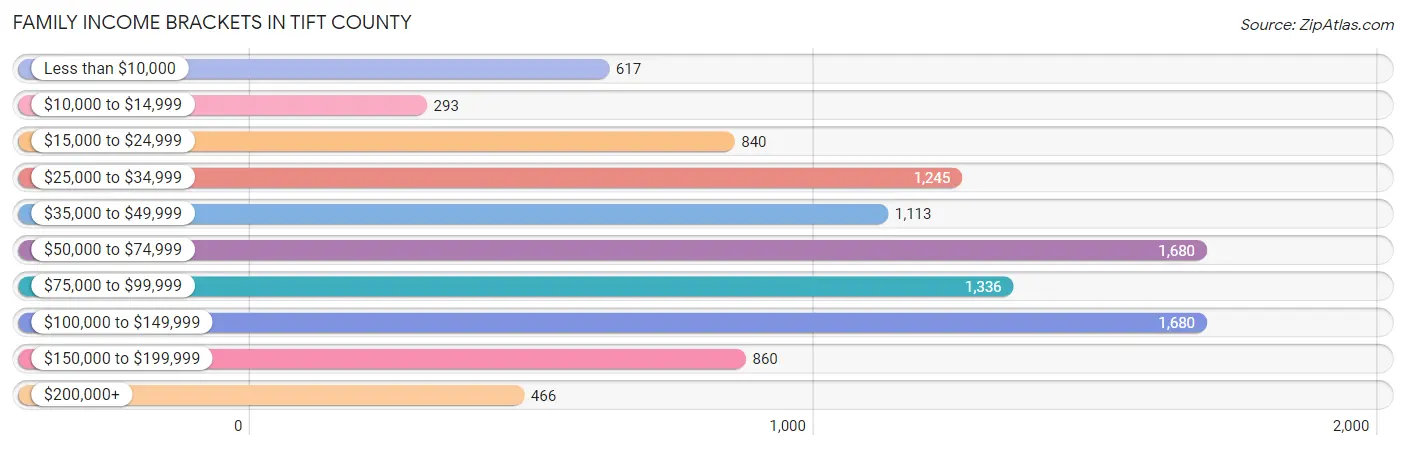
Family Income Brackets in Tift County
According to the Tift County family income data, there are 1,680 families falling into the $50,000 to $74,999 income range, which is the most common income bracket and makes up 16.6% of all families. Conversely, the $10,000 to $14,999 income bracket is the least frequent group with only 293 families (2.9%) belonging to this category.
| Income Bracket | # Families | % Families |
| Less than $10,000 | 617 | 6.1% |
| $10,000 to $14,999 | 293 | 2.9% |
| $15,000 to $24,999 | 840 | 8.3% |
| $25,000 to $34,999 | 1,245 | 12.3% |
| $35,000 to $49,999 | 1,113 | 11.0% |
| $50,000 to $74,999 | 1,680 | 16.6% |
| $75,000 to $99,999 | 1,336 | 13.2% |
| $100,000 to $149,999 | 1,680 | 16.6% |
| $150,000 to $199,999 | 860 | 8.5% |
| $200,000+ | 466 | 4.6% |
Family Income by Famaliy Size in Tift County
6-person families (411 | 4.1%) account for the highest median family income in Tift County with $100,009 per family, while 2-person families (4,793 | 47.4%) have the highest median income of $27,051 per family member.
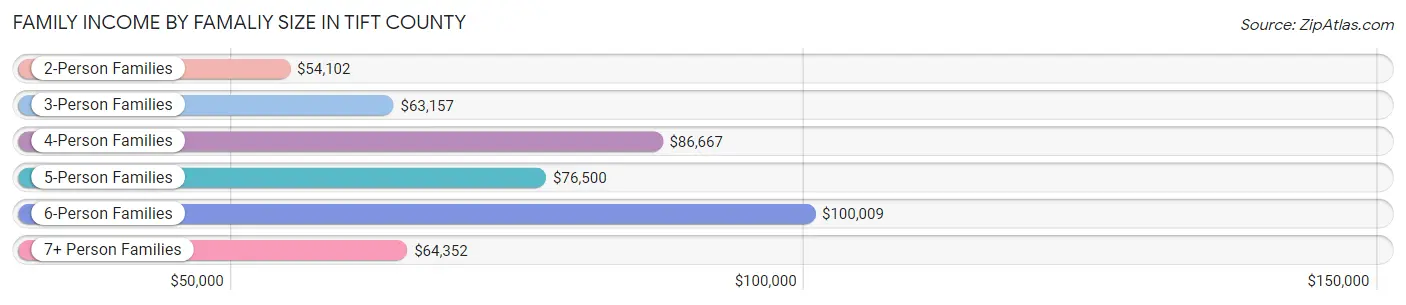
| Income Bracket | # Families | Median Income |
| 2-Person Families | 4,793 (47.4%) | $54,102 |
| 3-Person Families | 2,168 (21.4%) | $63,157 |
| 4-Person Families | 1,984 (19.6%) | $86,667 |
| 5-Person Families | 620 (6.1%) | $76,500 |
| 6-Person Families | 411 (4.1%) | $100,009 |
| 7+ Person Families | 144 (1.4%) | $64,352 |
| Total | 10,120 (100.0%) | $64,812 |
Family Income by Number of Earners in Tift County
The median family income in Tift County is $64,812, with families comprising 3+ earners (648) having the highest median family income of $125,441, while families with no earners (1,893) have the lowest median family income of $25,564, accounting for 6.4% and 18.7% of families, respectively.
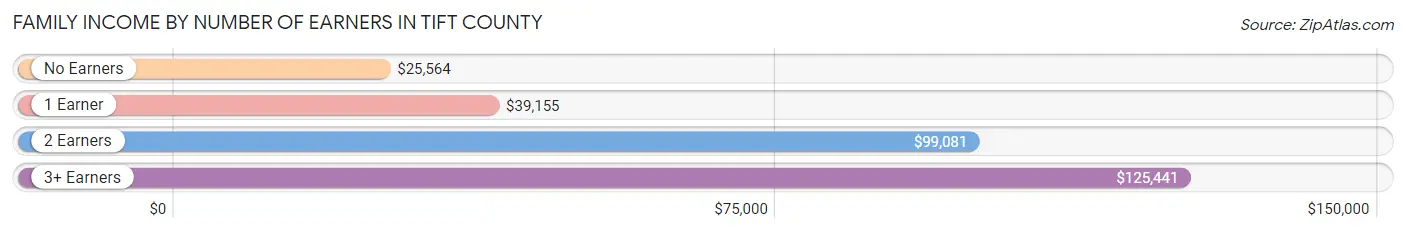
| Number of Earners | # Families | Median Income |
| No Earners | 1,893 (18.7%) | $25,564 |
| 1 Earner | 3,578 (35.4%) | $39,155 |
| 2 Earners | 4,001 (39.5%) | $99,081 |
| 3+ Earners | 648 (6.4%) | $125,441 |
| Total | 10,120 (100.0%) | $64,812 |
Household Income in Tift County
Household Income Brackets in Tift County
With 2,744 households falling in the category, the $50,000 to $74,999 income range is the most frequent in Tift County, accounting for 17.9% of all households. In contrast, only 506 households (3.3%) fall into the $200,000+ income bracket, making it the least populous group.
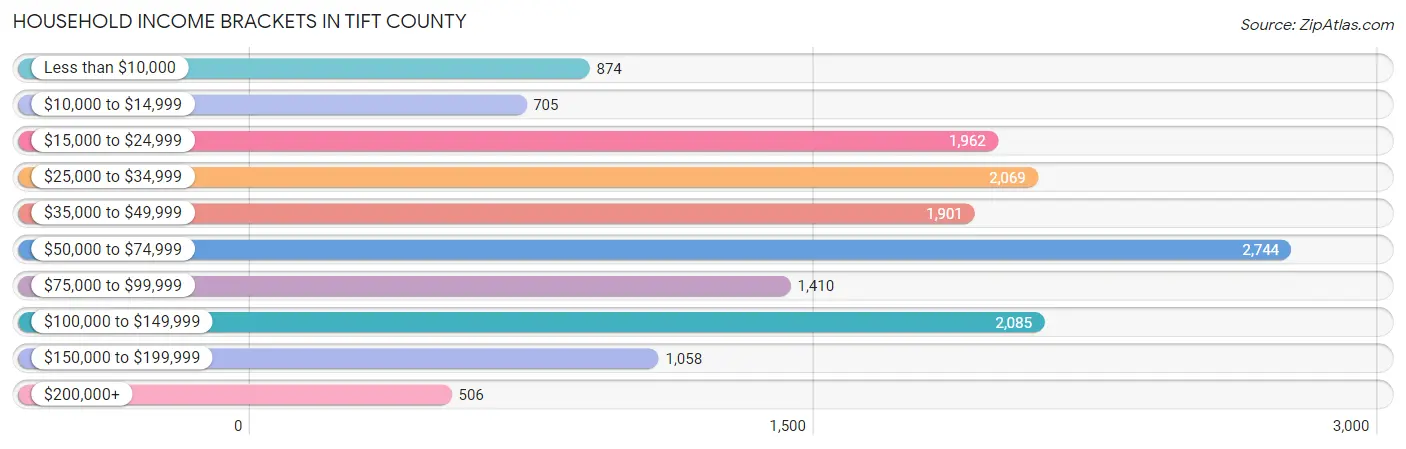
| Income Bracket | # Households | % Households |
| Less than $10,000 | 874 | 5.7% |
| $10,000 to $14,999 | 705 | 4.6% |
| $15,000 to $24,999 | 1,962 | 12.8% |
| $25,000 to $34,999 | 2,069 | 13.5% |
| $35,000 to $49,999 | 1,901 | 12.4% |
| $50,000 to $74,999 | 2,744 | 17.9% |
| $75,000 to $99,999 | 1,410 | 9.2% |
| $100,000 to $149,999 | 2,085 | 13.6% |
| $150,000 to $199,999 | 1,058 | 6.9% |
| $200,000+ | 506 | 3.3% |
Household Income by Householder Age in Tift County
The median household income in Tift County is $52,561, with the highest median household income of $61,090 found in the 25 to 44 years age bracket for the primary householder. A total of 5,333 households (34.8%) fall into this category. Meanwhile, the 65+ years age bracket for the primary householder has the lowest median household income of $34,314, with 4,027 households (26.3%) in this group.
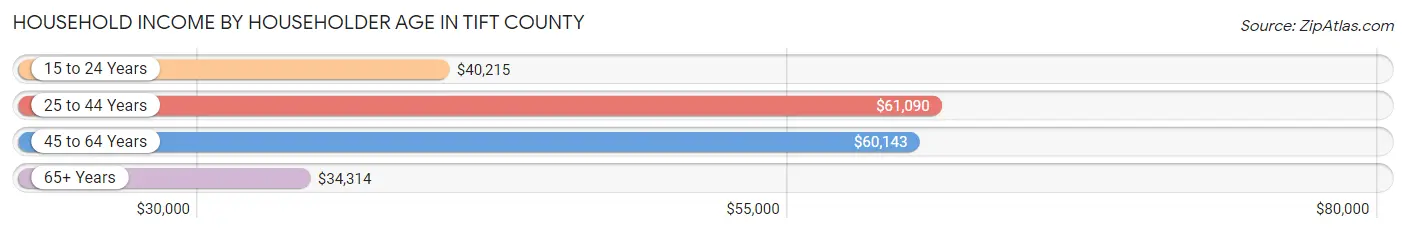
| Income Bracket | # Households | Median Income |
| 15 to 24 Years | 551 (3.6%) | $40,215 |
| 25 to 44 Years | 5,333 (34.8%) | $61,090 |
| 45 to 64 Years | 5,417 (35.3%) | $60,143 |
| 65+ Years | 4,027 (26.3%) | $34,314 |
| Total | 15,328 (100.0%) | $52,561 |
Poverty in Tift County
Income Below Poverty by Sex and Age in Tift County
With 18.3% poverty level for males and 23.4% for females among the residents of Tift County, 5 year old males and 18 to 24 year old females are the most vulnerable to poverty, with 102 males (43.4%) and 598 females (39.7%) in their respective age groups living below the poverty level.
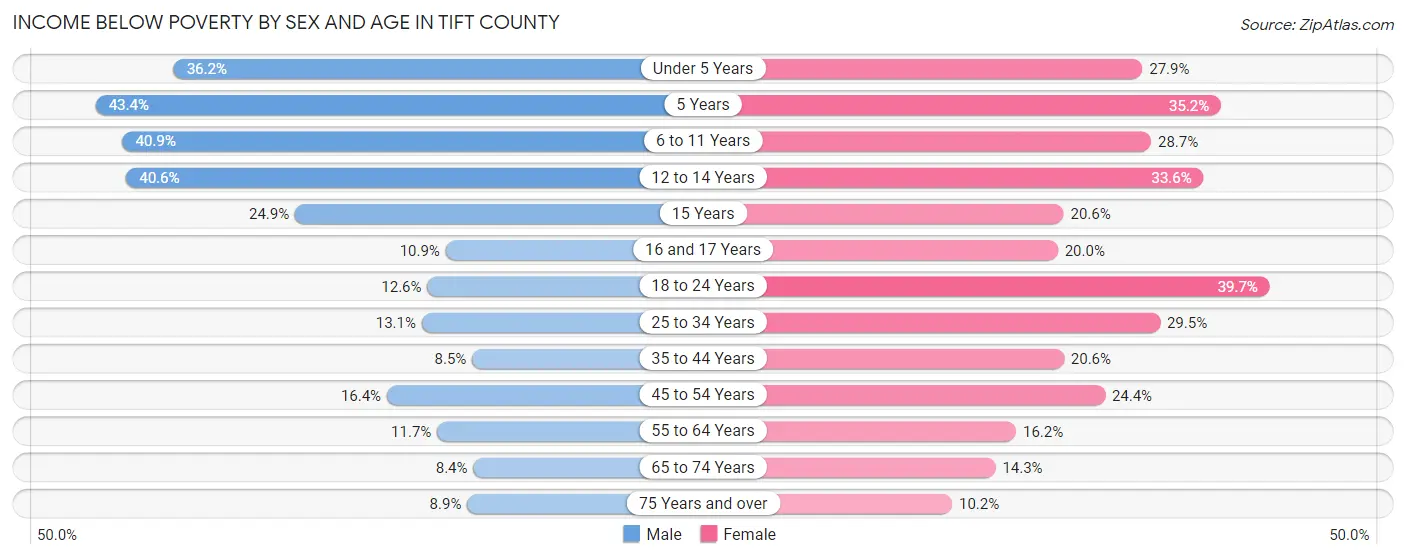
| Age Bracket | Male | Female |
| Under 5 Years | 558 (36.2%) | 338 (27.9%) |
| 5 Years | 102 (43.4%) | 63 (35.2%) |
| 6 to 11 Years | 675 (40.9%) | 512 (28.7%) |
| 12 to 14 Years | 406 (40.6%) | 287 (33.6%) |
| 15 Years | 62 (24.9%) | 71 (20.6%) |
| 16 and 17 Years | 65 (10.9%) | 106 (20.0%) |
| 18 to 24 Years | 160 (12.6%) | 598 (39.7%) |
| 25 to 34 Years | 341 (13.1%) | 773 (29.5%) |
| 35 to 44 Years | 220 (8.5%) | 583 (20.6%) |
| 45 to 54 Years | 380 (16.4%) | 586 (24.4%) |
| 55 to 64 Years | 259 (11.7%) | 442 (16.2%) |
| 65 to 74 Years | 141 (8.4%) | 282 (14.3%) |
| 75 Years and over | 78 (8.9%) | 157 (10.2%) |
| Total | 3,447 (18.3%) | 4,798 (23.4%) |
Income Above Poverty by Sex and Age in Tift County
According to the poverty statistics in Tift County, males aged 65 to 74 years and females aged 75 years and over are the age groups that are most secure financially, with 91.6% of males and 89.8% of females in these age groups living above the poverty line.
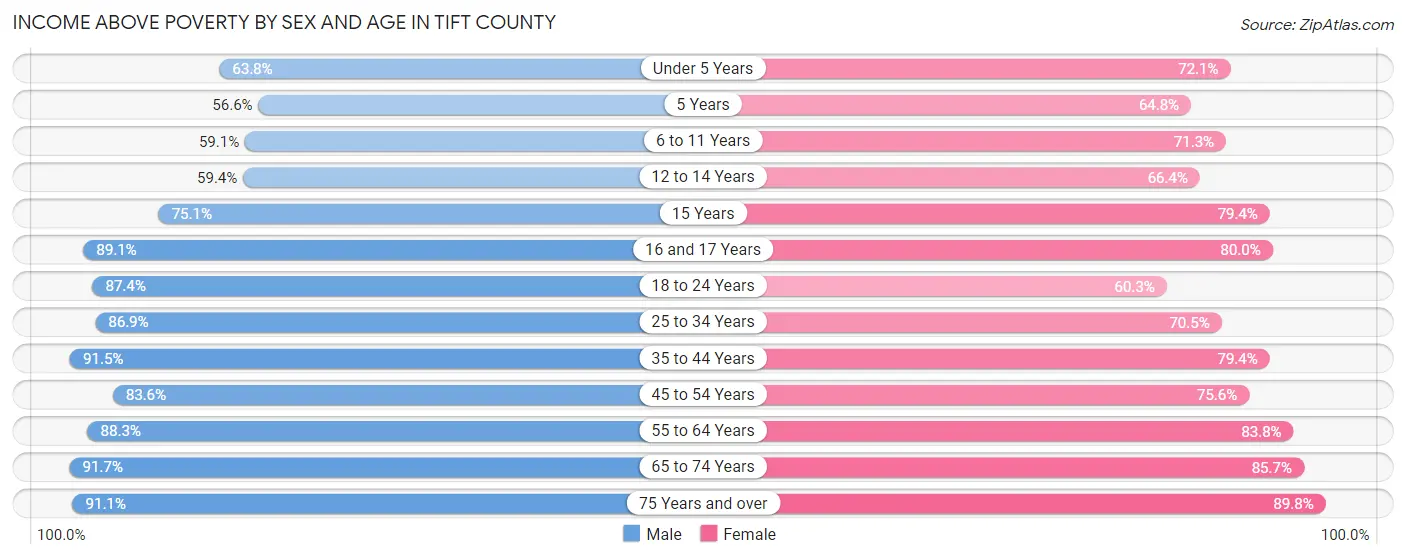
| Age Bracket | Male | Female |
| Under 5 Years | 985 (63.8%) | 874 (72.1%) |
| 5 Years | 133 (56.6%) | 116 (64.8%) |
| 6 to 11 Years | 975 (59.1%) | 1,272 (71.3%) |
| 12 to 14 Years | 595 (59.4%) | 568 (66.4%) |
| 15 Years | 187 (75.1%) | 274 (79.4%) |
| 16 and 17 Years | 530 (89.1%) | 423 (80.0%) |
| 18 to 24 Years | 1,108 (87.4%) | 908 (60.3%) |
| 25 to 34 Years | 2,255 (86.9%) | 1,845 (70.5%) |
| 35 to 44 Years | 2,382 (91.5%) | 2,246 (79.4%) |
| 45 to 54 Years | 1,941 (83.6%) | 1,814 (75.6%) |
| 55 to 64 Years | 1,953 (88.3%) | 2,291 (83.8%) |
| 65 to 74 Years | 1,547 (91.6%) | 1,696 (85.7%) |
| 75 Years and over | 796 (91.1%) | 1,377 (89.8%) |
| Total | 15,387 (81.7%) | 15,704 (76.6%) |
Income Below Poverty Among Married-Couple Families in Tift County
The poverty statistics for married-couple families in Tift County show that 9.0% or 574 of the total 6,371 families live below the poverty line. Families with 3 or 4 children have the highest poverty rate of 14.9%, comprising of 103 families. On the other hand, families with 5 or more children have the lowest poverty rate of 0.0%, which includes 0 families.
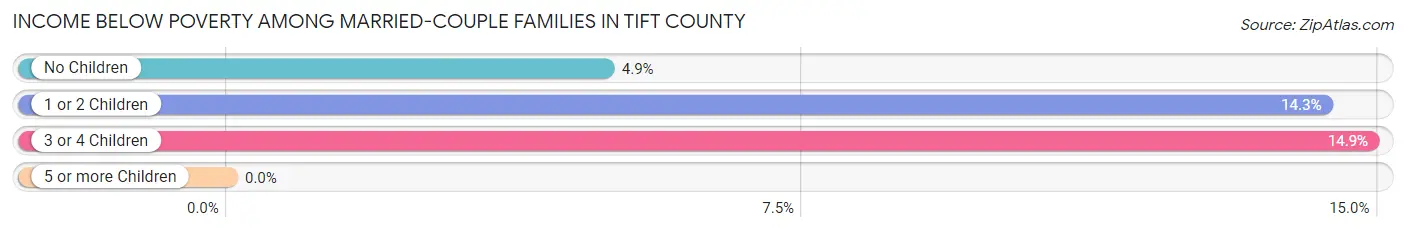
| Children | Above Poverty | Below Poverty |
| No Children | 3,418 (95.1%) | 177 (4.9%) |
| 1 or 2 Children | 1,762 (85.7%) | 294 (14.3%) |
| 3 or 4 Children | 588 (85.1%) | 103 (14.9%) |
| 5 or more Children | 29 (100.0%) | 0 (0.0%) |
| Total | 5,797 (91.0%) | 574 (9.0%) |
Income Below Poverty Among Single-Parent Households in Tift County
According to the poverty data in Tift County, 19.2% or 199 single-father households and 31.6% or 858 single-mother households are living below the poverty line. Among single-father households, those with 3 or 4 children have the highest poverty rate, with 113 households (85.6%) experiencing poverty. Likewise, among single-mother households, those with 3 or 4 children have the highest poverty rate, with 208 households (64.4%) falling below the poverty line.
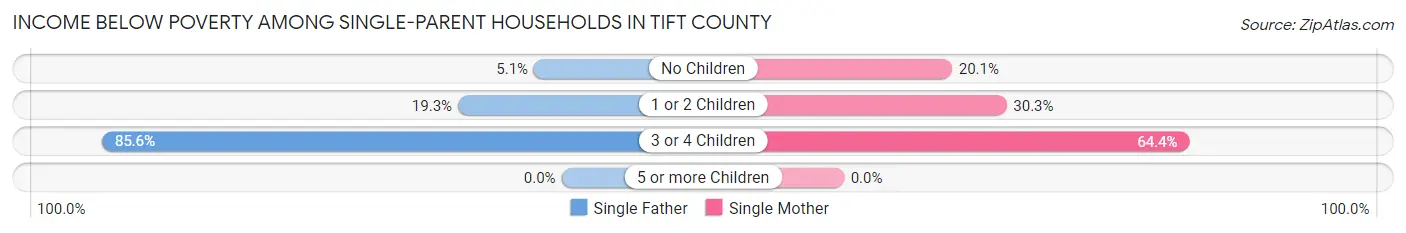
| Children | Single Father | Single Mother |
| No Children | 32 (5.1%) | 147 (20.1%) |
| 1 or 2 Children | 54 (19.3%) | 503 (30.3%) |
| 3 or 4 Children | 113 (85.6%) | 208 (64.4%) |
| 5 or more Children | 0 (0.0%) | 0 (0.0%) |
| Total | 199 (19.2%) | 858 (31.6%) |
Income Below Poverty Among Married-Couple vs Single-Parent Households in Tift County
The poverty data for Tift County shows that 574 of the married-couple family households (9.0%) and 1,057 of the single-parent households (28.2%) are living below the poverty level. Within the married-couple family households, those with 3 or 4 children have the highest poverty rate, with 103 households (14.9%) falling below the poverty line. Among the single-parent households, those with 3 or 4 children have the highest poverty rate, with 321 household (70.6%) living below poverty.
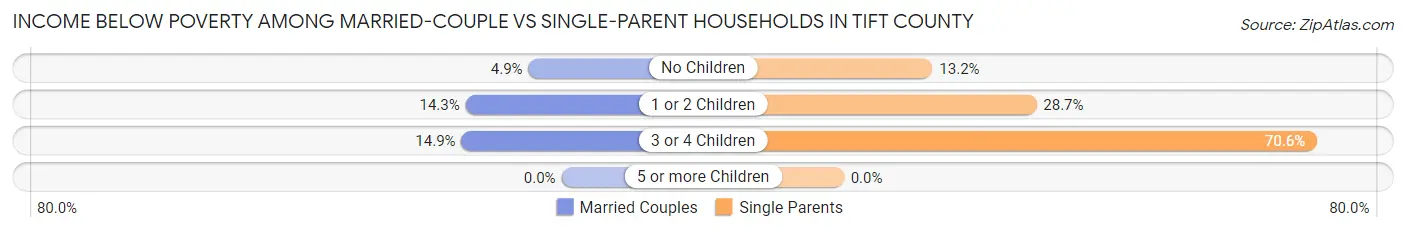
| Children | Married-Couple Families | Single-Parent Households |
| No Children | 177 (4.9%) | 179 (13.2%) |
| 1 or 2 Children | 294 (14.3%) | 557 (28.7%) |
| 3 or 4 Children | 103 (14.9%) | 321 (70.6%) |
| 5 or more Children | 0 (0.0%) | 0 (0.0%) |
| Total | 574 (9.0%) | 1,057 (28.2%) |
Race in Tift County
The most populous races in Tift County are White / Caucasian (24,067 | 58.4%), Black / African American (11,970 | 29.0%), and Hispanic or Latino (5,202 | 12.6%).
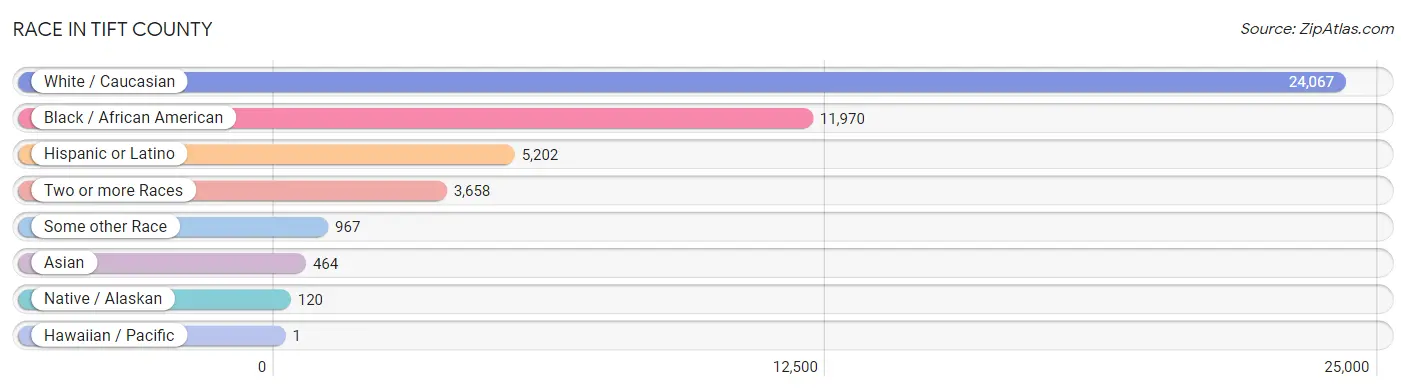
| Race | # Population | % Population |
| Asian | 464 | 1.1% |
| Black / African American | 11,970 | 29.0% |
| Hawaiian / Pacific | 1 | 0.0% |
| Hispanic or Latino | 5,202 | 12.6% |
| Native / Alaskan | 120 | 0.3% |
| White / Caucasian | 24,067 | 58.4% |
| Two or more Races | 3,658 | 8.9% |
| Some other Race | 967 | 2.3% |
| Total | 41,247 | 100.0% |
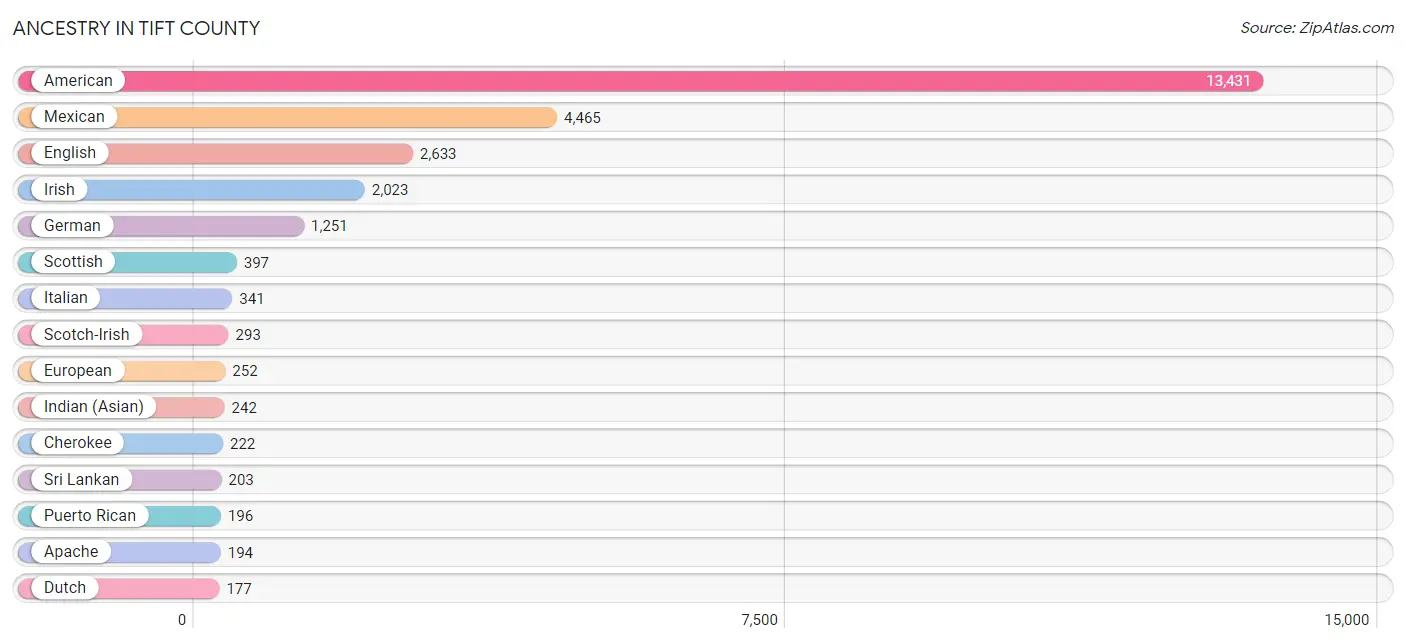
Ancestry in Tift County
The most populous ancestries reported in Tift County are American (13,431 | 32.6%), Mexican (4,465 | 10.8%), English (2,633 | 6.4%), Irish (2,023 | 4.9%), and German (1,251 | 3.0%), together accounting for 57.7% of all Tift County residents.
| Ancestry | # Population | % Population |
| African | 85 | 0.2% |
| American | 13,431 | 32.6% |
| Apache | 194 | 0.5% |
| Arab | 60 | 0.2% |
| Austrian | 14 | 0.0% |
| British | 87 | 0.2% |
| Burmese | 10 | 0.0% |
| Cajun | 20 | 0.1% |
| Canadian | 136 | 0.3% |
| Central American | 116 | 0.3% |
| Cherokee | 222 | 0.5% |
| Chickasaw | 3 | 0.0% |
| Choctaw | 3 | 0.0% |
| Colombian | 25 | 0.1% |
| Colville | 7 | 0.0% |
| Creek | 10 | 0.0% |
| Cuban | 29 | 0.1% |
| Czech | 13 | 0.0% |
| Danish | 5 | 0.0% |
| Dutch | 177 | 0.4% |
| Eastern European | 20 | 0.1% |
| English | 2,633 | 6.4% |
| European | 252 | 0.6% |
| French | 174 | 0.4% |
| French Canadian | 23 | 0.1% |
| German | 1,251 | 3.0% |
| Greek | 11 | 0.0% |
| Haitian | 109 | 0.3% |
| Honduran | 60 | 0.2% |
| Hungarian | 6 | 0.0% |
| Icelander | 6 | 0.0% |
| Indian (Asian) | 242 | 0.6% |
| Iraqi | 23 | 0.1% |
| Irish | 2,023 | 4.9% |
| Iroquois | 11 | 0.0% |
| Italian | 341 | 0.8% |
| Jamaican | 1 | 0.0% |
| Korean | 52 | 0.1% |
| Lithuanian | 10 | 0.0% |
| Mexican | 4,465 | 10.8% |
| Native Hawaiian | 22 | 0.1% |
| Nicaraguan | 43 | 0.1% |
| Norwegian | 12 | 0.0% |
| Panamanian | 13 | 0.0% |
| Polish | 96 | 0.2% |
| Portuguese | 21 | 0.1% |
| Potawatomi | 4 | 0.0% |
| Puerto Rican | 196 | 0.5% |
| Samoan | 1 | 0.0% |
| Scandinavian | 23 | 0.1% |
| Scotch-Irish | 293 | 0.7% |
| Scottish | 397 | 1.0% |
| Seminole | 12 | 0.0% |
| Slovak | 13 | 0.0% |
| South American | 25 | 0.1% |
| Spaniard | 30 | 0.1% |
| Spanish | 87 | 0.2% |
| Sri Lankan | 203 | 0.5% |
| Subsaharan African | 85 | 0.2% |
| Swedish | 19 | 0.1% |
| Swiss | 13 | 0.0% |
| Thai | 103 | 0.3% |
| Trinidadian and Tobagonian | 10 | 0.0% |
| Welsh | 60 | 0.2% | View All 64 Rows |
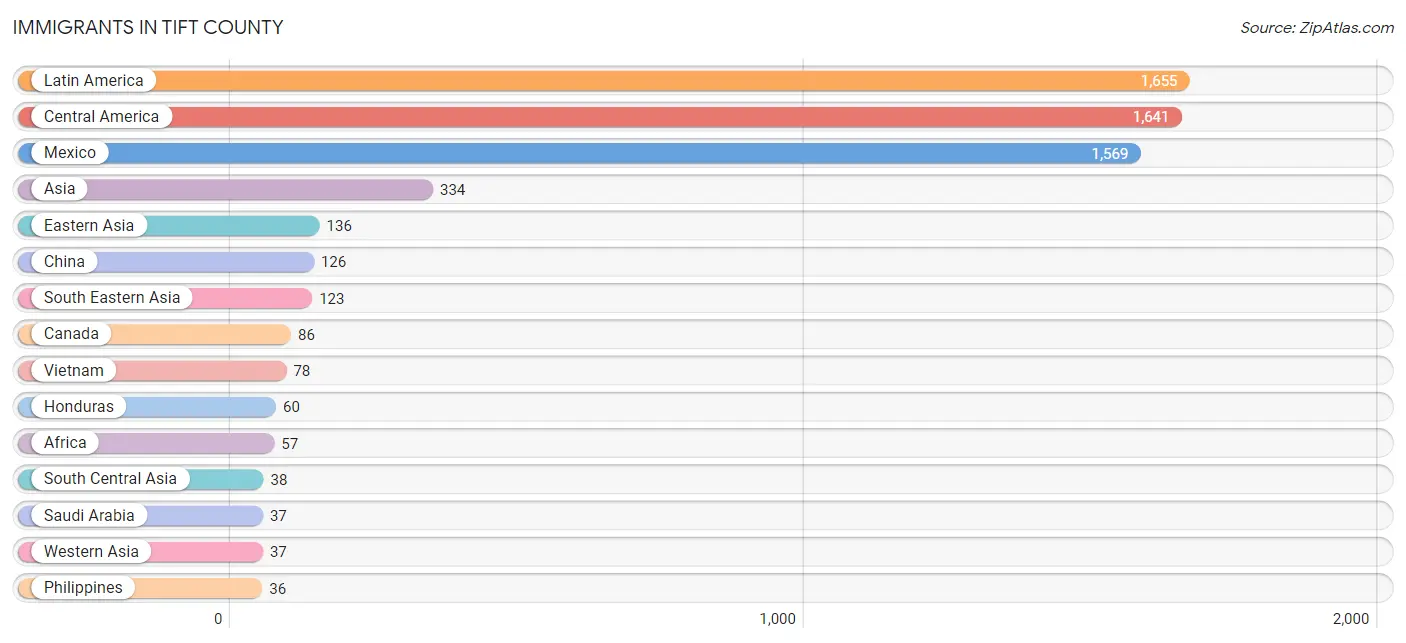
Immigrants in Tift County
The most numerous immigrant groups reported in Tift County came from Latin America (1,655 | 4.0%), Central America (1,641 | 4.0%), Mexico (1,569 | 3.8%), Asia (334 | 0.8%), and Eastern Asia (136 | 0.3%), together accounting for 12.9% of all Tift County residents.
| Immigration Origin | # Population | % Population |
| Africa | 57 | 0.1% |
| Asia | 334 | 0.8% |
| Belize | 10 | 0.0% |
| Canada | 86 | 0.2% |
| Caribbean | 2 | 0.0% |
| Central America | 1,641 | 4.0% |
| China | 126 | 0.3% |
| Eastern Africa | 25 | 0.1% |
| Eastern Asia | 136 | 0.3% |
| Europe | 19 | 0.1% |
| France | 19 | 0.1% |
| Guyana | 12 | 0.0% |
| Honduras | 60 | 0.2% |
| India | 35 | 0.1% |
| Jamaica | 1 | 0.0% |
| Korea | 10 | 0.0% |
| Laos | 9 | 0.0% |
| Latin America | 1,655 | 4.0% |
| Mexico | 1,569 | 3.8% |
| Nicaragua | 2 | 0.0% |
| Philippines | 36 | 0.1% |
| Saudi Arabia | 37 | 0.1% |
| South Africa | 32 | 0.1% |
| South America | 12 | 0.0% |
| South Central Asia | 38 | 0.1% |
| South Eastern Asia | 123 | 0.3% |
| Sri Lanka | 3 | 0.0% |
| Trinidad and Tobago | 1 | 0.0% |
| Vietnam | 78 | 0.2% |
| Western Asia | 37 | 0.1% |
| Western Europe | 19 | 0.1% | View All 31 Rows |
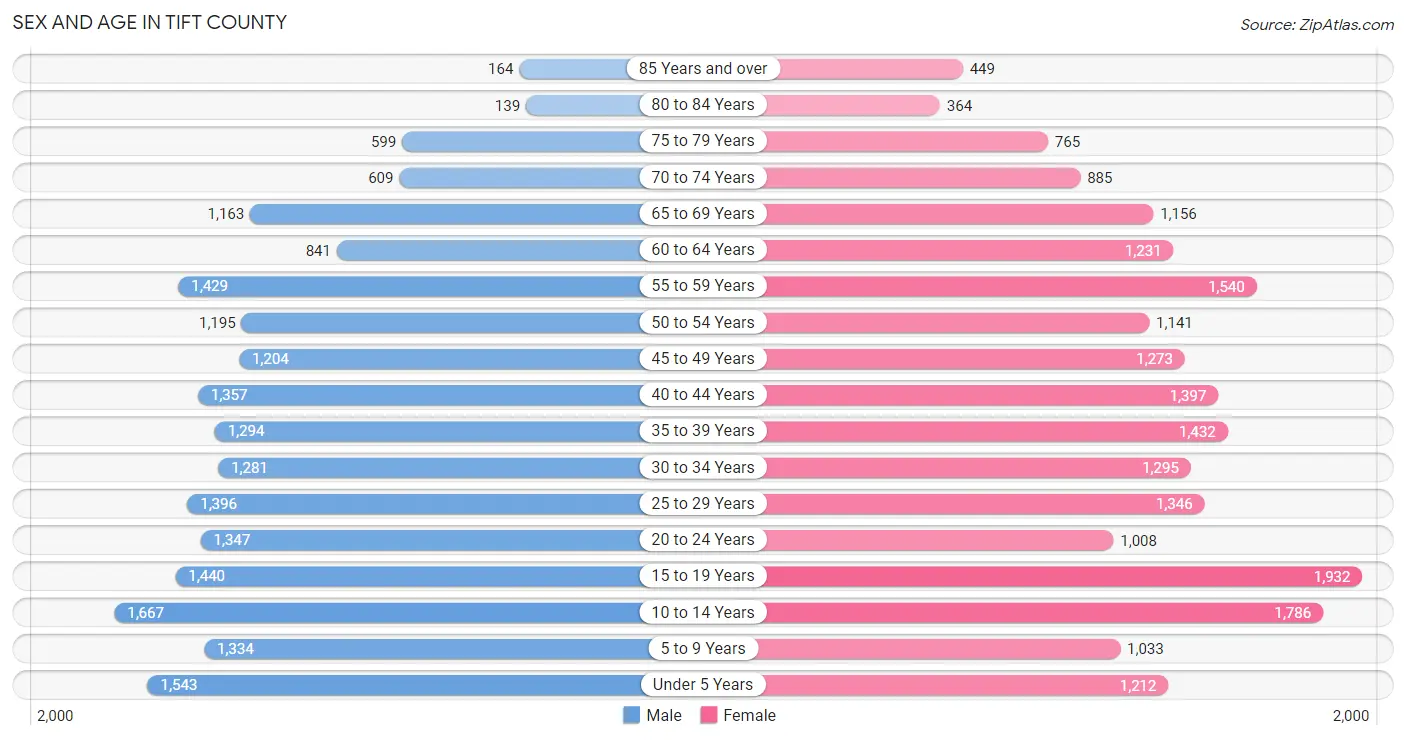
Sex and Age in Tift County
Sex and Age in Tift County
The most populous age groups in Tift County are 10 to 14 Years (1,667 | 8.3%) for men and 15 to 19 Years (1,932 | 9.1%) for women.
| Age Bracket | Male | Female |
| Under 5 Years | 1,543 (7.7%) | 1,212 (5.7%) |
| 5 to 9 Years | 1,334 (6.7%) | 1,033 (4.9%) |
| 10 to 14 Years | 1,667 (8.3%) | 1,786 (8.4%) |
| 15 to 19 Years | 1,440 (7.2%) | 1,932 (9.1%) |
| 20 to 24 Years | 1,347 (6.7%) | 1,008 (4.7%) |
| 25 to 29 Years | 1,396 (7.0%) | 1,346 (6.3%) |
| 30 to 34 Years | 1,281 (6.4%) | 1,295 (6.1%) |
| 35 to 39 Years | 1,294 (6.5%) | 1,432 (6.7%) |
| 40 to 44 Years | 1,357 (6.8%) | 1,397 (6.6%) |
| 45 to 49 Years | 1,204 (6.0%) | 1,273 (6.0%) |
| 50 to 54 Years | 1,195 (6.0%) | 1,141 (5.4%) |
| 55 to 59 Years | 1,429 (7.1%) | 1,540 (7.2%) |
| 60 to 64 Years | 841 (4.2%) | 1,231 (5.8%) |
| 65 to 69 Years | 1,163 (5.8%) | 1,156 (5.4%) |
| 70 to 74 Years | 609 (3.0%) | 885 (4.2%) |
| 75 to 79 Years | 599 (3.0%) | 765 (3.6%) |
| 80 to 84 Years | 139 (0.7%) | 364 (1.7%) |
| 85 Years and over | 164 (0.8%) | 449 (2.1%) |
| Total | 20,002 (100.0%) | 21,245 (100.0%) |
Families and Households in Tift County
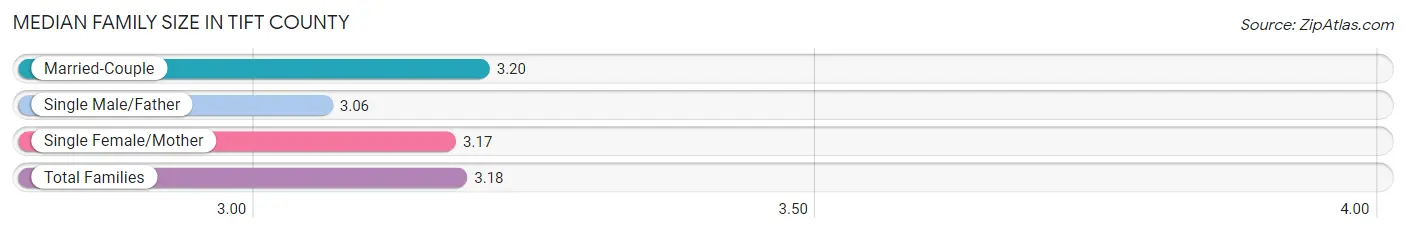
Median Family Size in Tift County
The median family size in Tift County is 3.18 persons per family, with married-couple families (6,371 | 62.9%) accounting for the largest median family size of 3.2 persons per family. On the other hand, single male/father families (1,036 | 10.2%) represent the smallest median family size with 3.06 persons per family.
| Family Type | # Families | Family Size |
| Married-Couple | 6,371 (62.9%) | 3.20 |
| Single Male/Father | 1,036 (10.2%) | 3.06 |
| Single Female/Mother | 2,713 (26.8%) | 3.17 |
| Total Families | 10,120 (100.0%) | 3.18 |
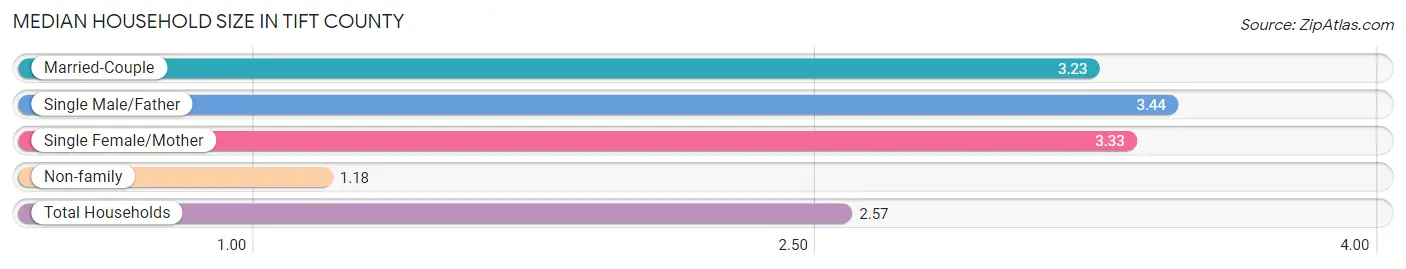
Median Household Size in Tift County
The median household size in Tift County is 2.57 persons per household, with single male/father households (1,036 | 6.8%) accounting for the largest median household size of 3.44 persons per household. non-family households (5,208 | 34.0%) represent the smallest median household size with 1.18 persons per household.
| Household Type | # Households | Household Size |
| Married-Couple | 6,371 (41.6%) | 3.23 |
| Single Male/Father | 1,036 (6.8%) | 3.44 |
| Single Female/Mother | 2,713 (17.7%) | 3.33 |
| Non-family | 5,208 (34.0%) | 1.18 |
| Total Households | 15,328 (100.0%) | 2.57 |
Household Size by Marriage Status in Tift County
Out of a total of 15,328 households in Tift County, 10,120 (66.0%) are family households, while 5,208 (34.0%) are nonfamily households. The most numerous type of family households are 2-person households, comprising 4,362, and the most common type of nonfamily households are 1-person households, comprising 4,503.
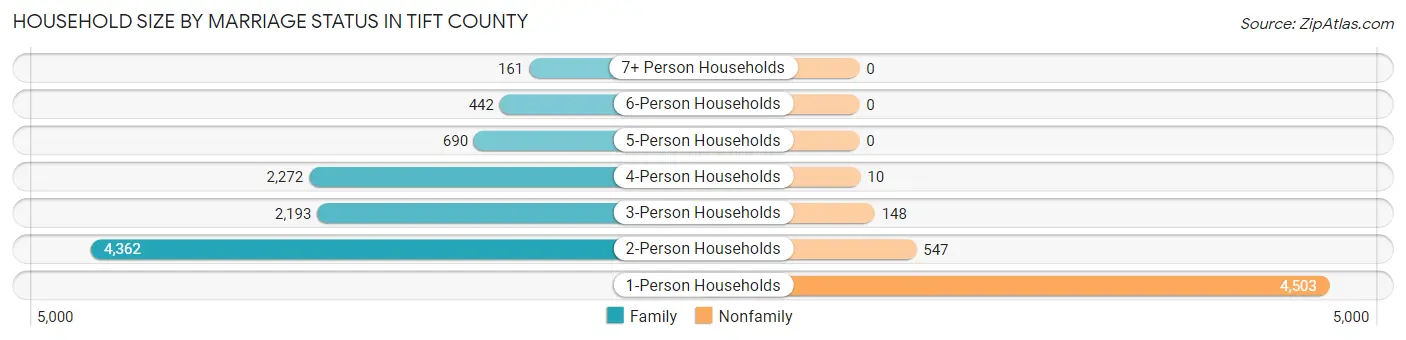
| Household Size | Family Households | Nonfamily Households |
| 1-Person Households | - | 4,503 (29.4%) |
| 2-Person Households | 4,362 (28.5%) | 547 (3.6%) |
| 3-Person Households | 2,193 (14.3%) | 148 (1.0%) |
| 4-Person Households | 2,272 (14.8%) | 10 (0.1%) |
| 5-Person Households | 690 (4.5%) | 0 (0.0%) |
| 6-Person Households | 442 (2.9%) | 0 (0.0%) |
| 7+ Person Households | 161 (1.1%) | 0 (0.0%) |
| Total | 10,120 (66.0%) | 5,208 (34.0%) |
Female Fertility in Tift County
Fertility by Age in Tift County
Average fertility rate in Tift County is 55.0 births per 1,000 women. Women in the age bracket of 20 to 34 years have the highest fertility rate with 82.0 births per 1,000 women. Women in the age bracket of 20 to 34 years acount for 54.7% of all women with births.
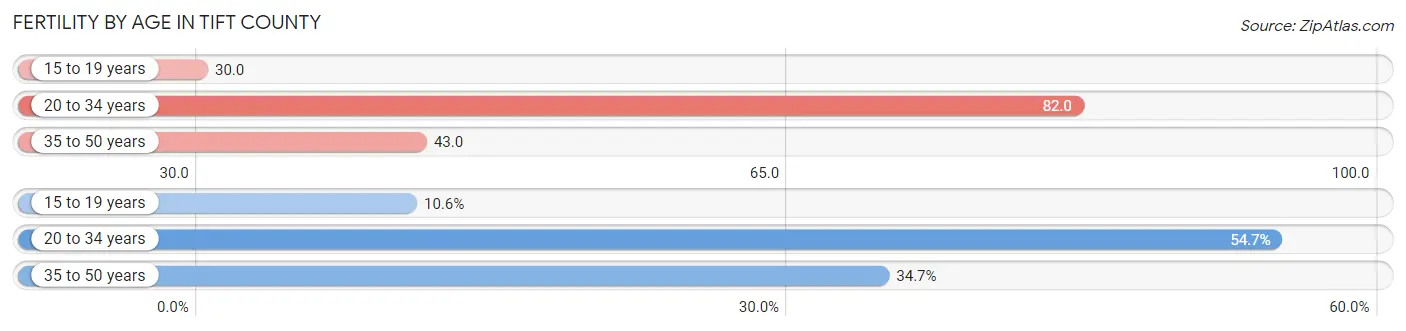
| Age Bracket | Women with Births | Births / 1,000 Women |
| 15 to 19 years | 58 (10.6%) | 30.0 |
| 20 to 34 years | 298 (54.7%) | 82.0 |
| 35 to 50 years | 189 (34.7%) | 43.0 |
| Total | 545 (100.0%) | 55.0 |
Fertility by Age by Marriage Status in Tift County
65.3% of women with births (545) in Tift County are married. The highest percentage of unmarried women with births falls into 15 to 19 years age bracket with 55.2% of them unmarried at the time of birth, while the lowest percentage of unmarried women with births belong to 20 to 34 years age bracket with 20.8% of them unmarried.
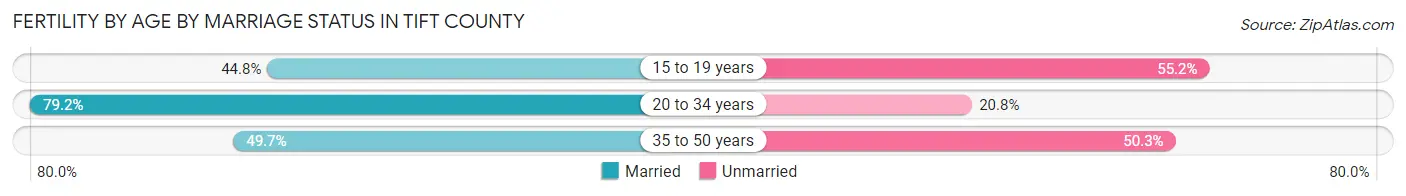
| Age Bracket | Married | Unmarried |
| 15 to 19 years | 26 (44.8%) | 32 (55.2%) |
| 20 to 34 years | 236 (79.2%) | 62 (20.8%) |
| 35 to 50 years | 94 (49.7%) | 95 (50.3%) |
| Total | 356 (65.3%) | 189 (34.7%) |
Fertility by Education in Tift County
Average fertility rate in Tift County is 55.0 births per 1,000 women. Women with the education attainment of graduate degree have the highest fertility rate of 132.0 births per 1,000 women, while women with the education attainment of college or associate's degree have the lowest fertility at 15.0 births per 1,000 women. Women with the education attainment of high school diploma represent 44.4% of all women with births.
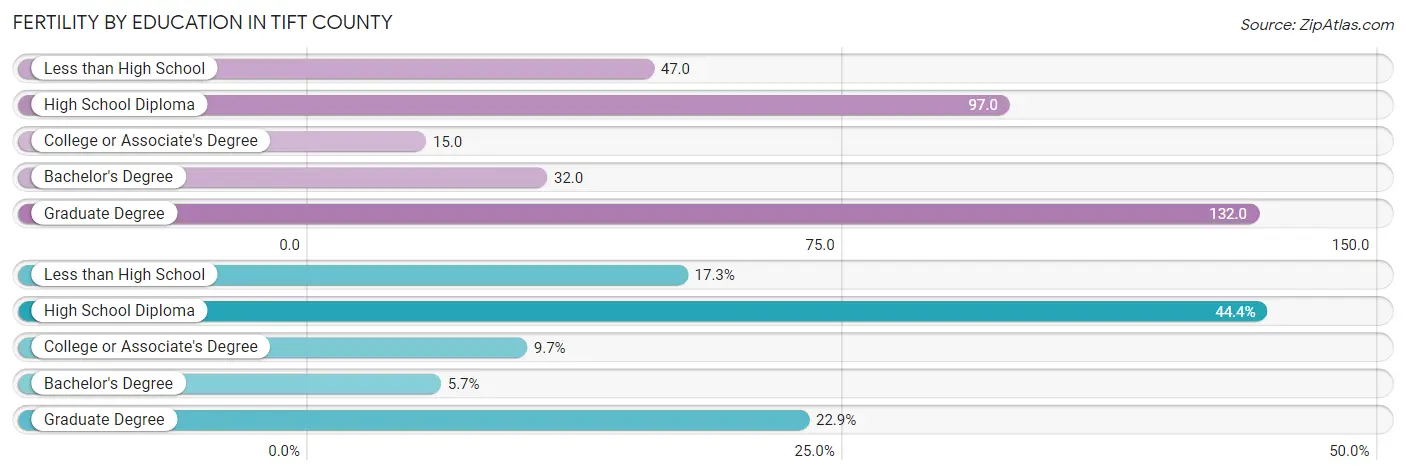
| Educational Attainment | Women with Births | Births / 1,000 Women |
| Less than High School | 94 (17.2%) | 47.0 |
| High School Diploma | 242 (44.4%) | 97.0 |
| College or Associate's Degree | 53 (9.7%) | 15.0 |
| Bachelor's Degree | 31 (5.7%) | 32.0 |
| Graduate Degree | 125 (22.9%) | 132.0 |
| Total | 545 (100.0%) | 55.0 |
Fertility by Education by Marriage Status in Tift County
34.7% of women with births in Tift County are unmarried. Women with the educational attainment of bachelor's degree are most likely to be married with 100.0% of them married at childbirth, while women with the educational attainment of less than high school are least likely to be married with 72.3% of them unmarried at childbirth.
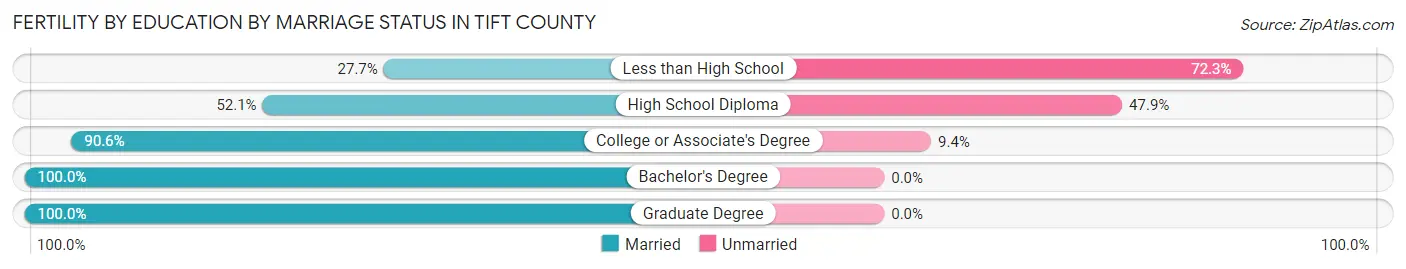
| Educational Attainment | Married | Unmarried |
| Less than High School | 26 (27.7%) | 68 (72.3%) |
| High School Diploma | 126 (52.1%) | 116 (47.9%) |
| College or Associate's Degree | 48 (90.6%) | 5 (9.4%) |
| Bachelor's Degree | 31 (100.0%) | 0 (0.0%) |
| Graduate Degree | 125 (100.0%) | 0 (0.0%) |
| Total | 356 (65.3%) | 189 (34.7%) |
Employment Characteristics in Tift County
Employment by Class of Employer in Tift County
Among the 17,682 employed individuals in Tift County, private company employees (12,652 | 71.6%), not-for-profit organizations (1,176 | 6.7%), and local government employees (955 | 5.4%) make up the most common classes of employment.
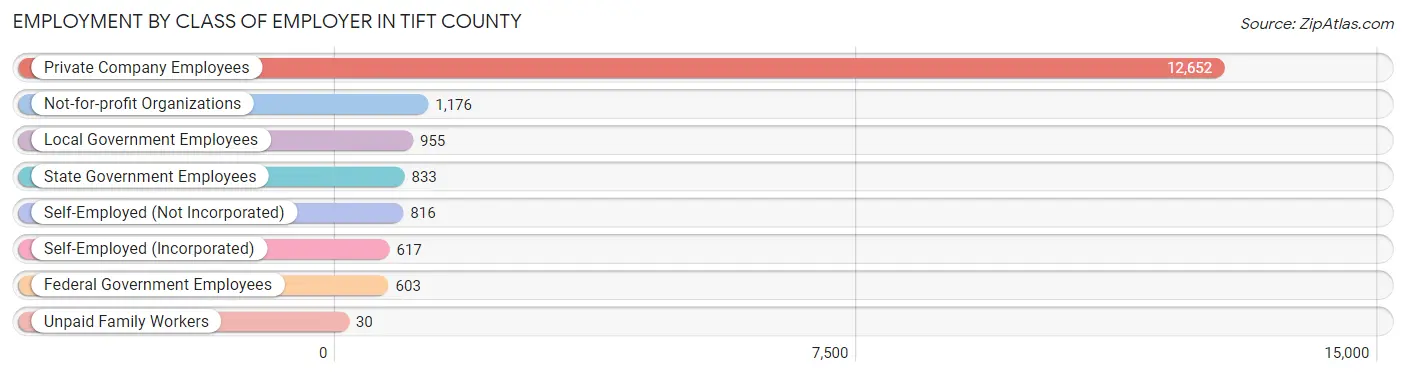
| Employer Class | # Employees | % Employees |
| Private Company Employees | 12,652 | 71.6% |
| Self-Employed (Incorporated) | 617 | 3.5% |
| Self-Employed (Not Incorporated) | 816 | 4.6% |
| Not-for-profit Organizations | 1,176 | 6.7% |
| Local Government Employees | 955 | 5.4% |
| State Government Employees | 833 | 4.7% |
| Federal Government Employees | 603 | 3.4% |
| Unpaid Family Workers | 30 | 0.2% |
| Total | 17,682 | 100.0% |
Employment Status by Age in Tift County
According to the labor force statistics for Tift County, out of the total population over 16 years of age (32,078), 57.4% or 18,413 individuals are in the labor force, with 2.9% or 534 of them unemployed. The age group with the highest labor force participation rate is 30 to 34 years, with 85.5% or 2,202 individuals in the labor force. Within the labor force, the 16 to 19 years age range has the highest percentage of unemployed individuals, with 14.0% or 108 of them being unemployed.
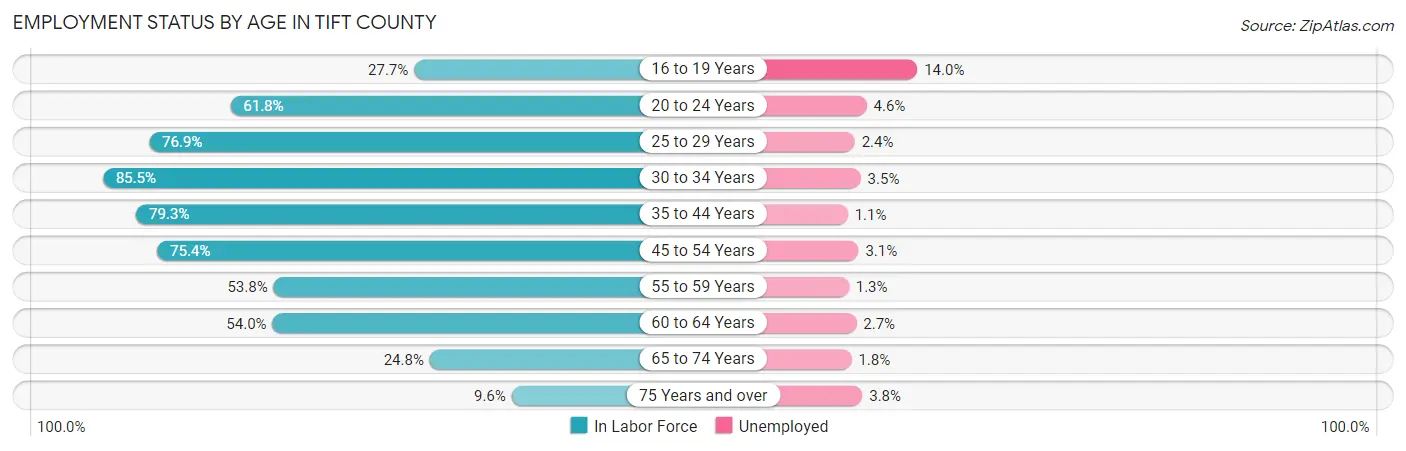
| Age Bracket | In Labor Force | Unemployed |
| 16 to 19 Years | 770 (27.7%) | 108 (14.0%) |
| 20 to 24 Years | 1,455 (61.8%) | 67 (4.6%) |
| 25 to 29 Years | 2,109 (76.9%) | 51 (2.4%) |
| 30 to 34 Years | 2,202 (85.5%) | 77 (3.5%) |
| 35 to 44 Years | 4,346 (79.3%) | 48 (1.1%) |
| 45 to 54 Years | 3,629 (75.4%) | 112 (3.1%) |
| 55 to 59 Years | 1,597 (53.8%) | 21 (1.3%) |
| 60 to 64 Years | 1,119 (54.0%) | 30 (2.7%) |
| 65 to 74 Years | 946 (24.8%) | 17 (1.8%) |
| 75 Years and over | 238 (9.6%) | 9 (3.8%) |
| Total | 18,413 (57.4%) | 534 (2.9%) |
Employment Status by Educational Attainment in Tift County
According to labor force statistics for Tift County, 72.6% of individuals (14,993) out of the total population between 25 and 64 years of age (20,652) are in the labor force, with 2.3% or 345 of them being unemployed. The group with the highest labor force participation rate are those with the educational attainment of bachelor's degree or higher, with 83.5% or 3,395 individuals in the labor force. Within the labor force, individuals with less than high school education have the highest percentage of unemployment, with 3.4% or 56 of them being unemployed.
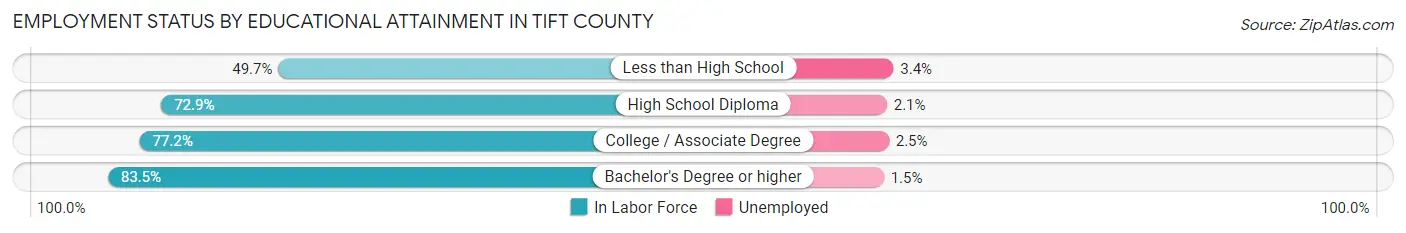
| Educational Attainment | In Labor Force | Unemployed |
| Less than High School | 1,656 (49.7%) | 113 (3.4%) |
| High School Diploma | 4,799 (72.9%) | 138 (2.1%) |
| College / Associate Degree | 5,150 (77.2%) | 167 (2.5%) |
| Bachelor's Degree or higher | 3,395 (83.5%) | 61 (1.5%) |
| Total | 14,993 (72.6%) | 475 (2.3%) |
Employment Occupations by Sex in Tift County
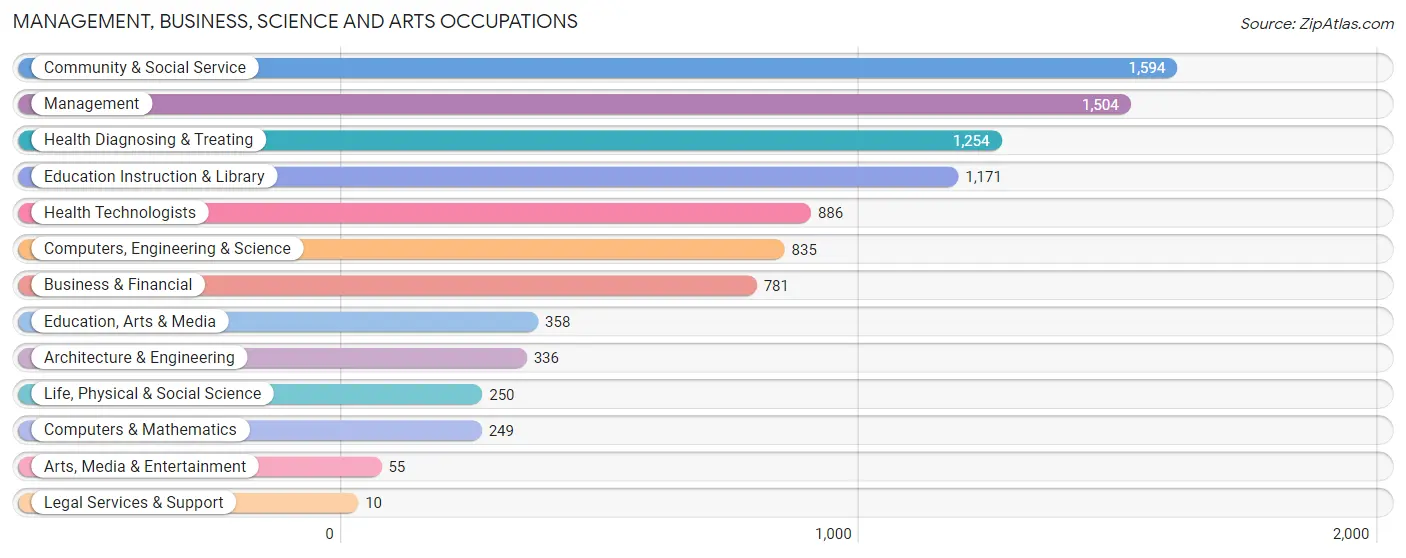
Management, Business, Science and Arts Occupations
The most common Management, Business, Science and Arts occupations in Tift County are Community & Social Service (1,594 | 8.9%), Management (1,504 | 8.5%), Health Diagnosing & Treating (1,254 | 7.0%), Education Instruction & Library (1,171 | 6.6%), and Health Technologists (886 | 5.0%).
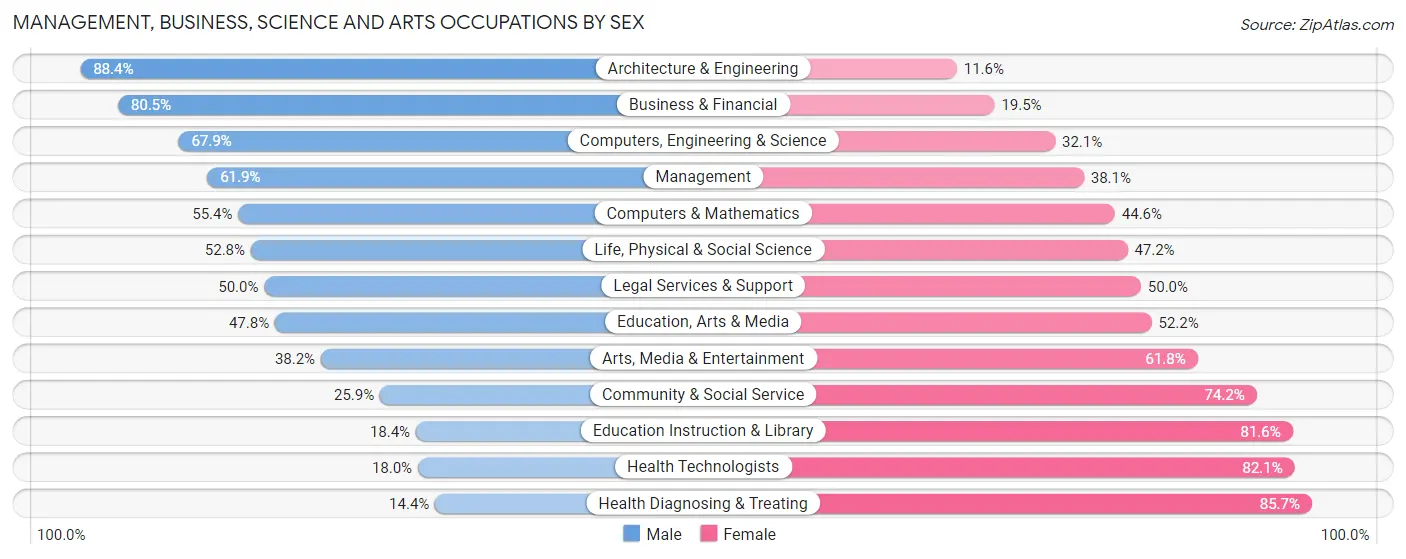
Management, Business, Science and Arts Occupations by Sex
Within the Management, Business, Science and Arts occupations in Tift County, the most male-oriented occupations are Architecture & Engineering (88.4%), Business & Financial (80.5%), and Computers, Engineering & Science (67.9%), while the most female-oriented occupations are Health Diagnosing & Treating (85.7%), Health Technologists (82.1%), and Education Instruction & Library (81.6%).
| Occupation | Male | Female |
| Management | 931 (61.9%) | 573 (38.1%) |
| Business & Financial | 629 (80.5%) | 152 (19.5%) |
| Computers, Engineering & Science | 567 (67.9%) | 268 (32.1%) |
| Computers & Mathematics | 138 (55.4%) | 111 (44.6%) |
| Architecture & Engineering | 297 (88.4%) | 39 (11.6%) |
| Life, Physical & Social Science | 132 (52.8%) | 118 (47.2%) |
| Community & Social Service | 412 (25.9%) | 1,182 (74.2%) |
| Education, Arts & Media | 171 (47.8%) | 187 (52.2%) |
| Legal Services & Support | 5 (50.0%) | 5 (50.0%) |
| Education Instruction & Library | 215 (18.4%) | 956 (81.6%) |
| Arts, Media & Entertainment | 21 (38.2%) | 34 (61.8%) |
| Health Diagnosing & Treating | 180 (14.3%) | 1,074 (85.7%) |
| Health Technologists | 159 (17.9%) | 727 (82.1%) |
| Total (Category) | 2,719 (45.6%) | 3,249 (54.4%) |
| Total (Overall) | 9,473 (53.2%) | 8,336 (46.8%) |
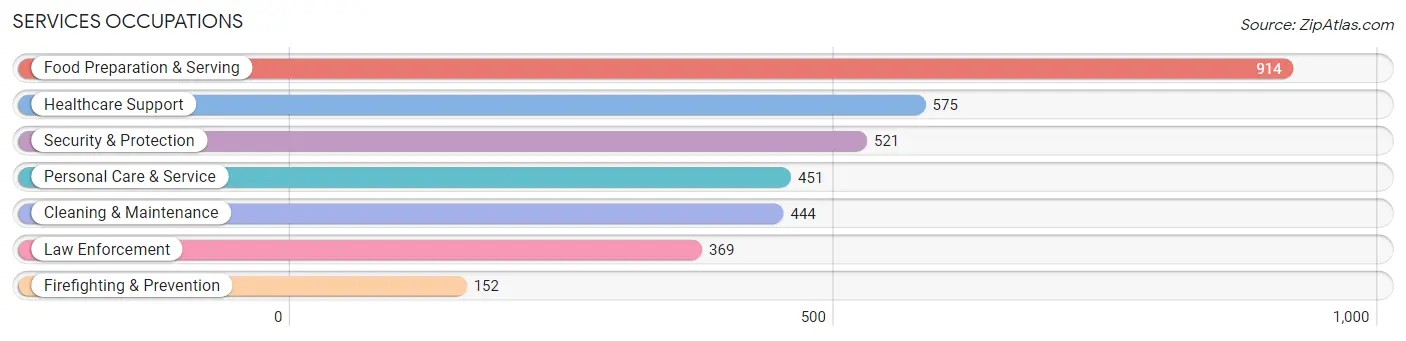
Services Occupations
The most common Services occupations in Tift County are Food Preparation & Serving (914 | 5.1%), Healthcare Support (575 | 3.2%), Security & Protection (521 | 2.9%), Personal Care & Service (451 | 2.5%), and Cleaning & Maintenance (444 | 2.5%).
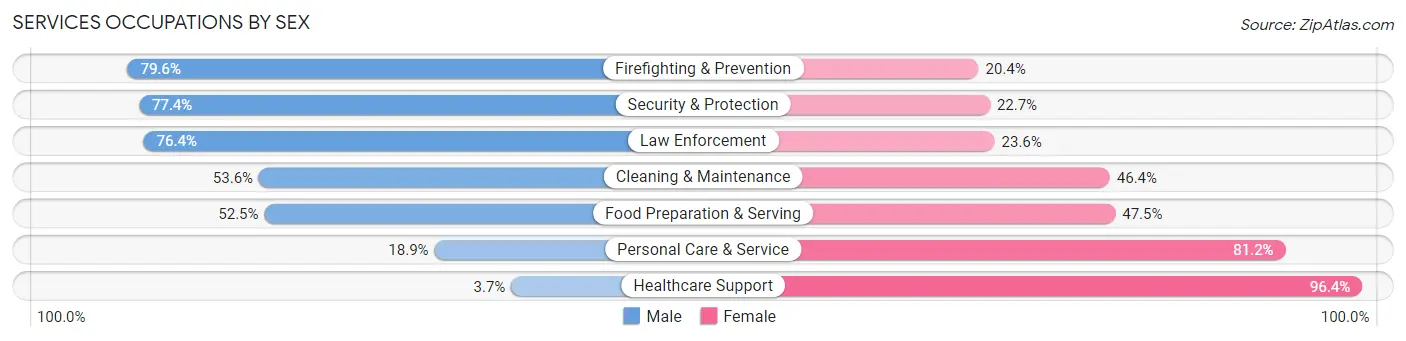
Services Occupations by Sex
Within the Services occupations in Tift County, the most male-oriented occupations are Firefighting & Prevention (79.6%), Security & Protection (77.3%), and Law Enforcement (76.4%), while the most female-oriented occupations are Healthcare Support (96.4%), Personal Care & Service (81.1%), and Food Preparation & Serving (47.5%).
| Occupation | Male | Female |
| Healthcare Support | 21 (3.6%) | 554 (96.4%) |
| Security & Protection | 403 (77.3%) | 118 (22.7%) |
| Firefighting & Prevention | 121 (79.6%) | 31 (20.4%) |
| Law Enforcement | 282 (76.4%) | 87 (23.6%) |
| Food Preparation & Serving | 480 (52.5%) | 434 (47.5%) |
| Cleaning & Maintenance | 238 (53.6%) | 206 (46.4%) |
| Personal Care & Service | 85 (18.9%) | 366 (81.1%) |
| Total (Category) | 1,227 (42.2%) | 1,678 (57.8%) |
| Total (Overall) | 9,473 (53.2%) | 8,336 (46.8%) |
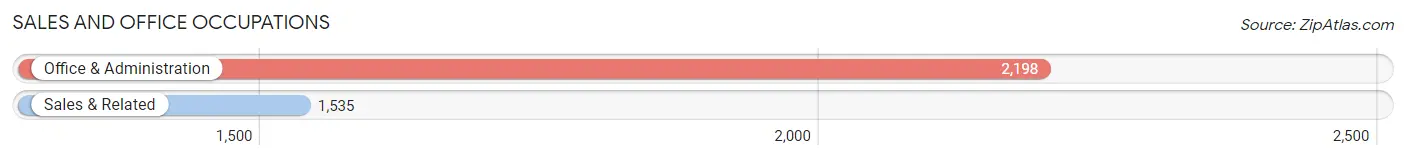
Sales and Office Occupations
The most common Sales and Office occupations in Tift County are Office & Administration (2,198 | 12.3%), and Sales & Related (1,535 | 8.6%).
Sales and Office Occupations by Sex
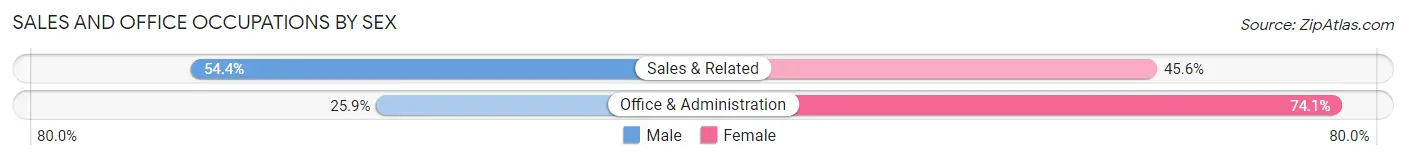
| Occupation | Male | Female |
| Sales & Related | 835 (54.4%) | 700 (45.6%) |
| Office & Administration | 569 (25.9%) | 1,629 (74.1%) |
| Total (Category) | 1,404 (37.6%) | 2,329 (62.4%) |
| Total (Overall) | 9,473 (53.2%) | 8,336 (46.8%) |
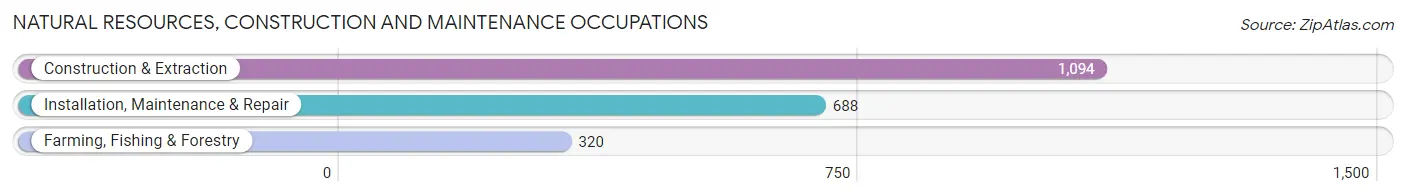
Natural Resources, Construction and Maintenance Occupations
The most common Natural Resources, Construction and Maintenance occupations in Tift County are Construction & Extraction (1,094 | 6.1%), Installation, Maintenance & Repair (688 | 3.9%), and Farming, Fishing & Forestry (320 | 1.8%).
Natural Resources, Construction and Maintenance Occupations by Sex
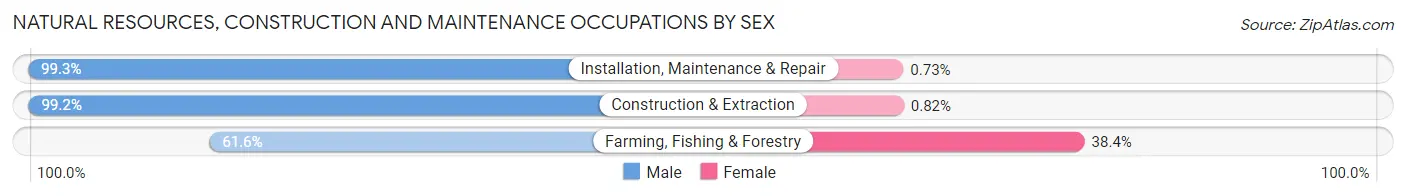
| Occupation | Male | Female |
| Farming, Fishing & Forestry | 197 (61.6%) | 123 (38.4%) |
| Construction & Extraction | 1,085 (99.2%) | 9 (0.8%) |
| Installation, Maintenance & Repair | 683 (99.3%) | 5 (0.7%) |
| Total (Category) | 1,965 (93.5%) | 137 (6.5%) |
| Total (Overall) | 9,473 (53.2%) | 8,336 (46.8%) |
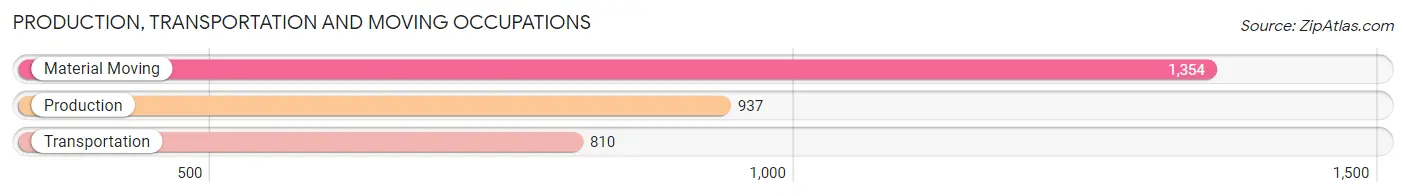
Production, Transportation and Moving Occupations
The most common Production, Transportation and Moving occupations in Tift County are Material Moving (1,354 | 7.6%), Production (937 | 5.3%), and Transportation (810 | 4.5%).
Production, Transportation and Moving Occupations by Sex
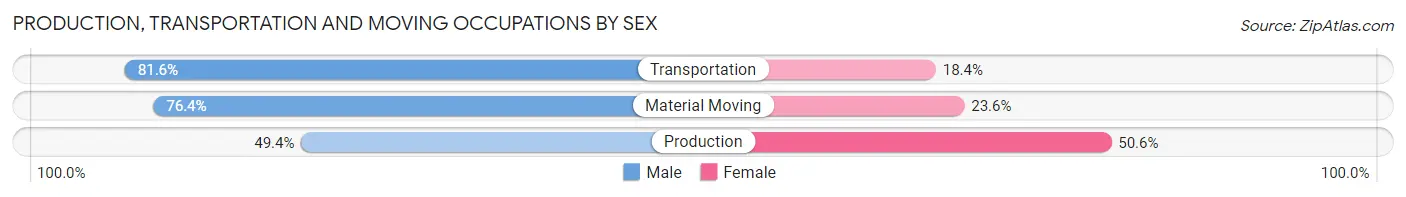
| Occupation | Male | Female |
| Production | 463 (49.4%) | 474 (50.6%) |
| Transportation | 661 (81.6%) | 149 (18.4%) |
| Material Moving | 1,034 (76.4%) | 320 (23.6%) |
| Total (Category) | 2,158 (69.6%) | 943 (30.4%) |
| Total (Overall) | 9,473 (53.2%) | 8,336 (46.8%) |
Employment Industries by Sex in Tift County
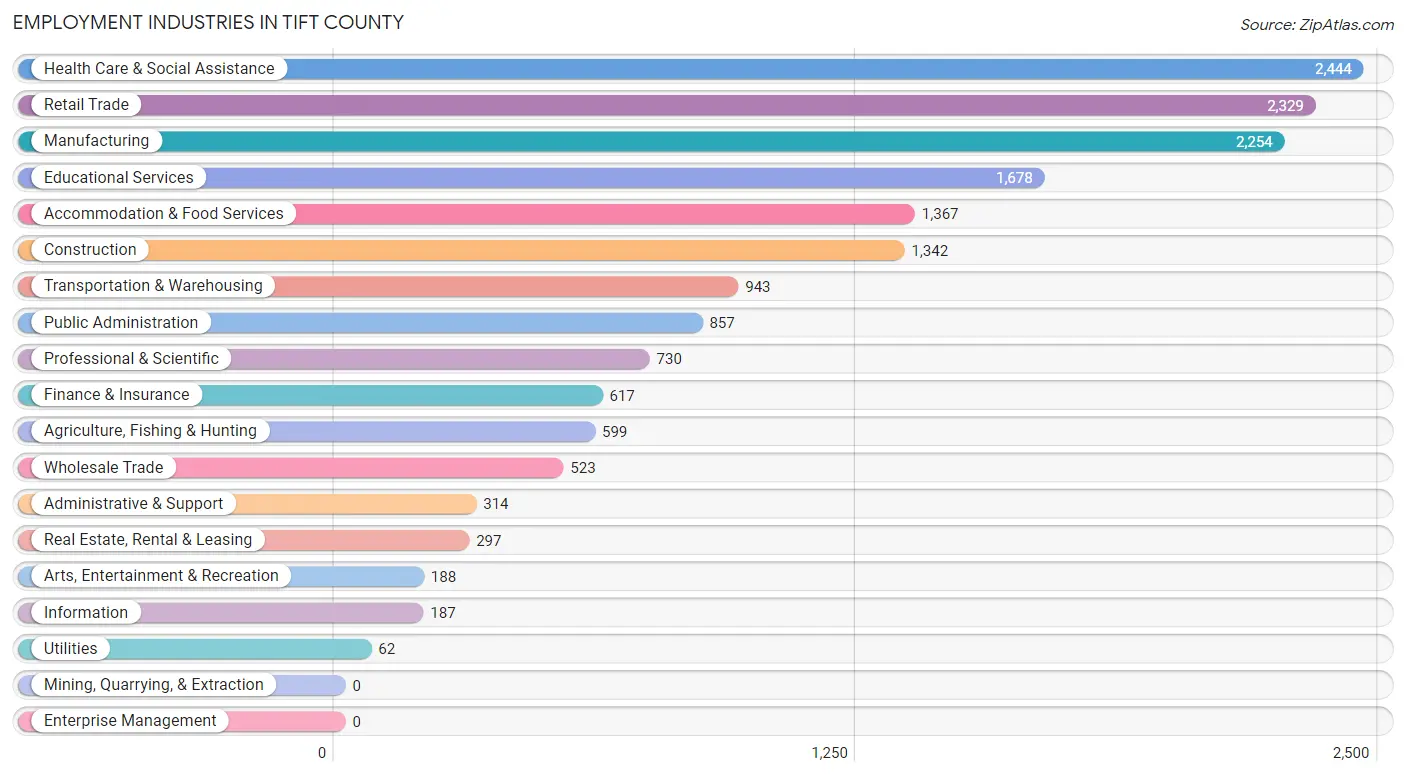
Employment Industries in Tift County
The major employment industries in Tift County include Health Care & Social Assistance (2,444 | 13.7%), Retail Trade (2,329 | 13.1%), Manufacturing (2,254 | 12.7%), Educational Services (1,678 | 9.4%), and Accommodation & Food Services (1,367 | 7.7%).
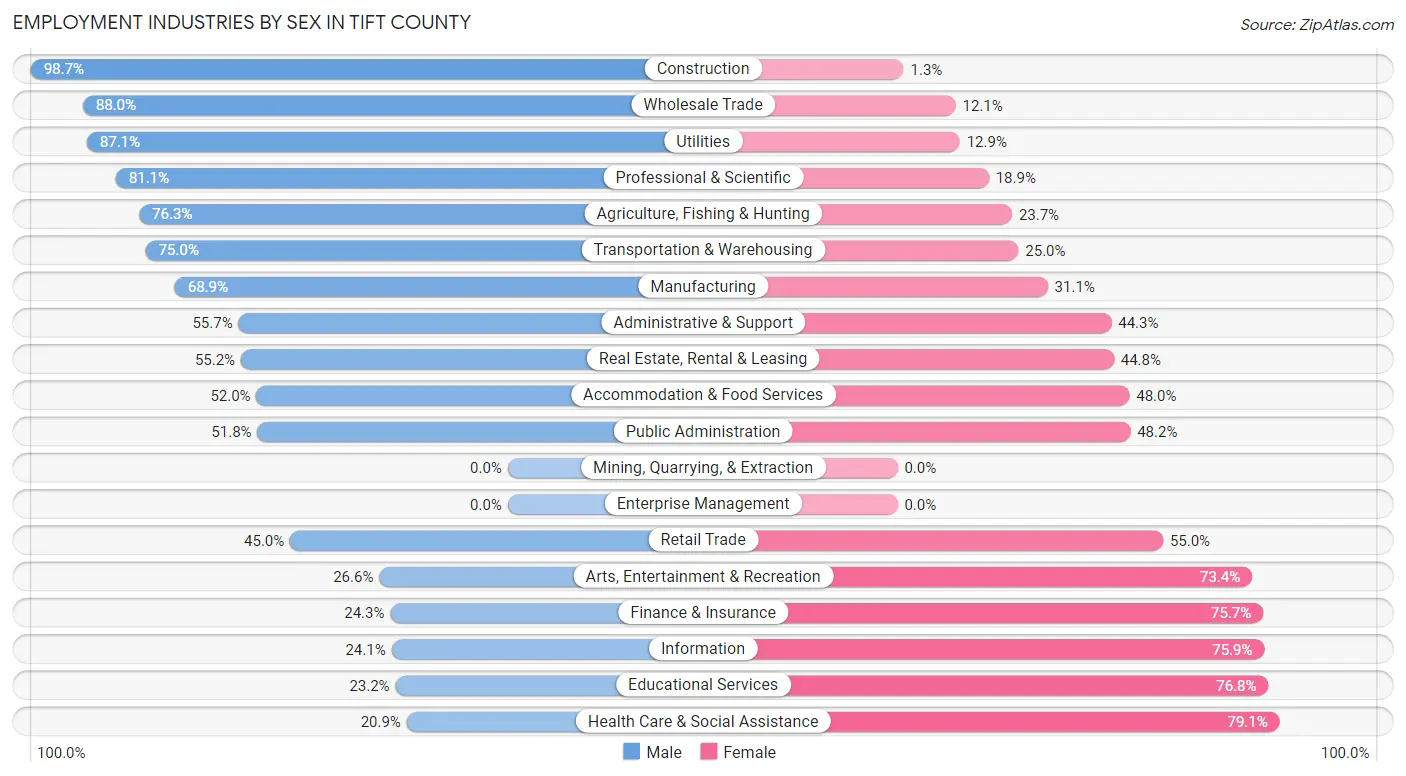
Employment Industries by Sex in Tift County
The Tift County industries that see more men than women are Construction (98.7%), Wholesale Trade (87.9%), and Utilities (87.1%), whereas the industries that tend to have a higher number of women are Health Care & Social Assistance (79.1%), Educational Services (76.8%), and Information (75.9%).
| Industry | Male | Female |
| Agriculture, Fishing & Hunting | 457 (76.3%) | 142 (23.7%) |
| Mining, Quarrying, & Extraction | 0 (0.0%) | 0 (0.0%) |
| Construction | 1,325 (98.7%) | 17 (1.3%) |
| Manufacturing | 1,553 (68.9%) | 701 (31.1%) |
| Wholesale Trade | 460 (87.9%) | 63 (12.0%) |
| Retail Trade | 1,049 (45.0%) | 1,280 (55.0%) |
| Transportation & Warehousing | 707 (75.0%) | 236 (25.0%) |
| Utilities | 54 (87.1%) | 8 (12.9%) |
| Information | 45 (24.1%) | 142 (75.9%) |
| Finance & Insurance | 150 (24.3%) | 467 (75.7%) |
| Real Estate, Rental & Leasing | 164 (55.2%) | 133 (44.8%) |
| Professional & Scientific | 592 (81.1%) | 138 (18.9%) |
| Enterprise Management | 0 (0.0%) | 0 (0.0%) |
| Administrative & Support | 175 (55.7%) | 139 (44.3%) |
| Educational Services | 390 (23.2%) | 1,288 (76.8%) |
| Health Care & Social Assistance | 511 (20.9%) | 1,933 (79.1%) |
| Arts, Entertainment & Recreation | 50 (26.6%) | 138 (73.4%) |
| Accommodation & Food Services | 711 (52.0%) | 656 (48.0%) |
| Public Administration | 444 (51.8%) | 413 (48.2%) |
| Total | 9,473 (53.2%) | 8,336 (46.8%) |
Education in Tift County
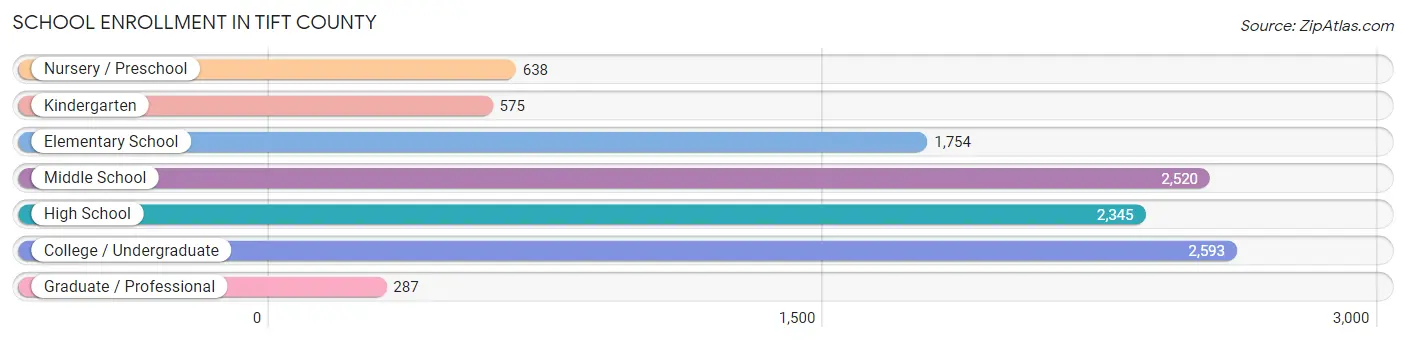
School Enrollment in Tift County
The most common levels of schooling among the 10,712 students in Tift County are college / undergraduate (2,593 | 24.2%), middle school (2,520 | 23.5%), and high school (2,345 | 21.9%).
| School Level | # Students | % Students |
| Nursery / Preschool | 638 | 6.0% |
| Kindergarten | 575 | 5.4% |
| Elementary School | 1,754 | 16.4% |
| Middle School | 2,520 | 23.5% |
| High School | 2,345 | 21.9% |
| College / Undergraduate | 2,593 | 24.2% |
| Graduate / Professional | 287 | 2.7% |
| Total | 10,712 | 100.0% |
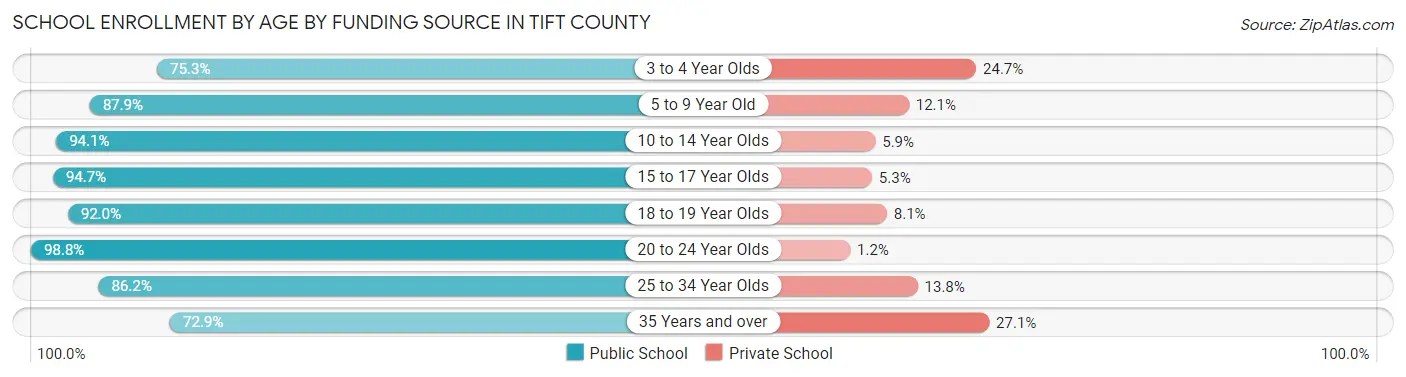
School Enrollment by Age by Funding Source in Tift County
Out of a total of 10,712 students who are enrolled in schools in Tift County, 1,007 (9.4%) attend a private institution, while the remaining 9,705 (90.6%) are enrolled in public schools. The age group of 35 years and over has the highest likelihood of being enrolled in private schools, with 158 (27.1% in the age bracket) enrolled. Conversely, the age group of 20 to 24 year olds has the lowest likelihood of being enrolled in a private school, with 1,000 (98.8% in the age bracket) attending a public institution.
| Age Bracket | Public School | Private School |
| 3 to 4 Year Olds | 452 (75.3%) | 148 (24.7%) |
| 5 to 9 Year Old | 1,789 (87.9%) | 247 (12.1%) |
| 10 to 14 Year Olds | 2,987 (94.1%) | 187 (5.9%) |
| 15 to 17 Year Olds | 1,512 (94.7%) | 84 (5.3%) |
| 18 to 19 Year Olds | 1,119 (91.9%) | 98 (8.1%) |
| 20 to 24 Year Olds | 1,000 (98.8%) | 12 (1.2%) |
| 25 to 34 Year Olds | 426 (86.2%) | 68 (13.8%) |
| 35 Years and over | 425 (72.9%) | 158 (27.1%) |
| Total | 9,705 (90.6%) | 1,007 (9.4%) |
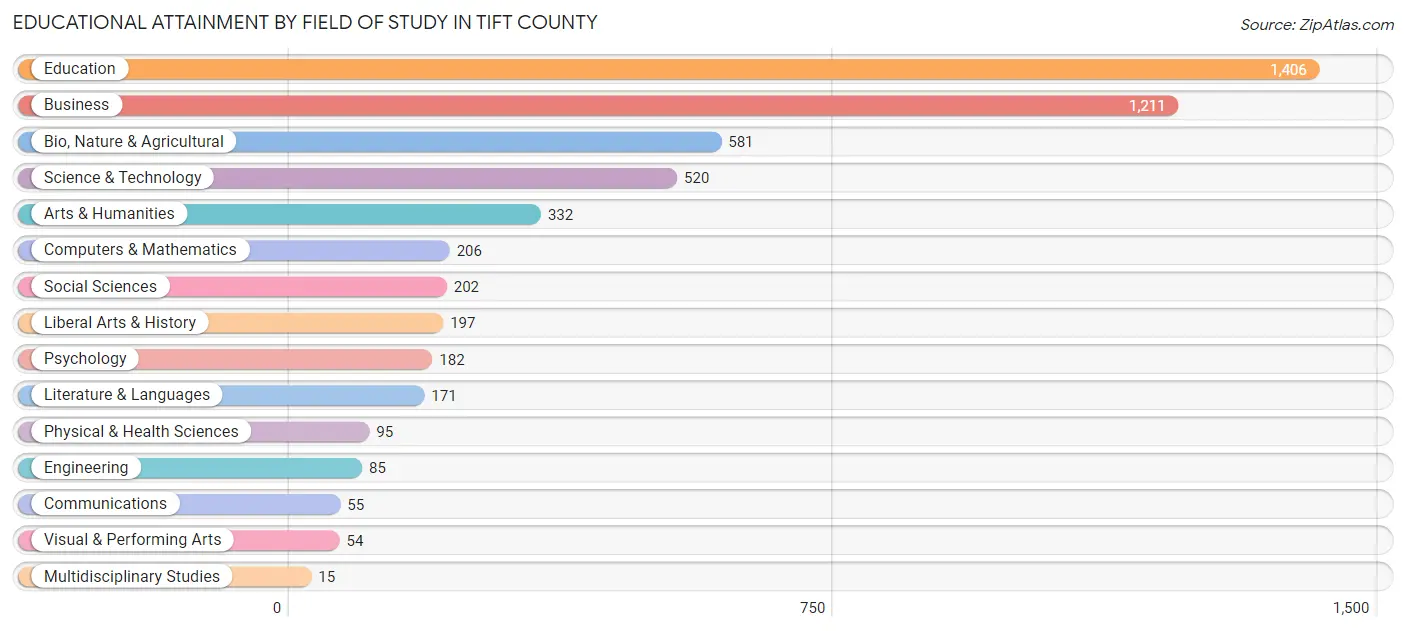
Educational Attainment by Field of Study in Tift County
Education (1,406 | 26.5%), business (1,211 | 22.8%), bio, nature & agricultural (581 | 10.9%), science & technology (520 | 9.8%), and arts & humanities (332 | 6.2%) are the most common fields of study among 5,312 individuals in Tift County who have obtained a bachelor's degree or higher.
| Field of Study | # Graduates | % Graduates |
| Computers & Mathematics | 206 | 3.9% |
| Bio, Nature & Agricultural | 581 | 10.9% |
| Physical & Health Sciences | 95 | 1.8% |
| Psychology | 182 | 3.4% |
| Social Sciences | 202 | 3.8% |
| Engineering | 85 | 1.6% |
| Multidisciplinary Studies | 15 | 0.3% |
| Science & Technology | 520 | 9.8% |
| Business | 1,211 | 22.8% |
| Education | 1,406 | 26.5% |
| Literature & Languages | 171 | 3.2% |
| Liberal Arts & History | 197 | 3.7% |
| Visual & Performing Arts | 54 | 1.0% |
| Communications | 55 | 1.0% |
| Arts & Humanities | 332 | 6.2% |
| Total | 5,312 | 100.0% |
Transportation & Commute in Tift County
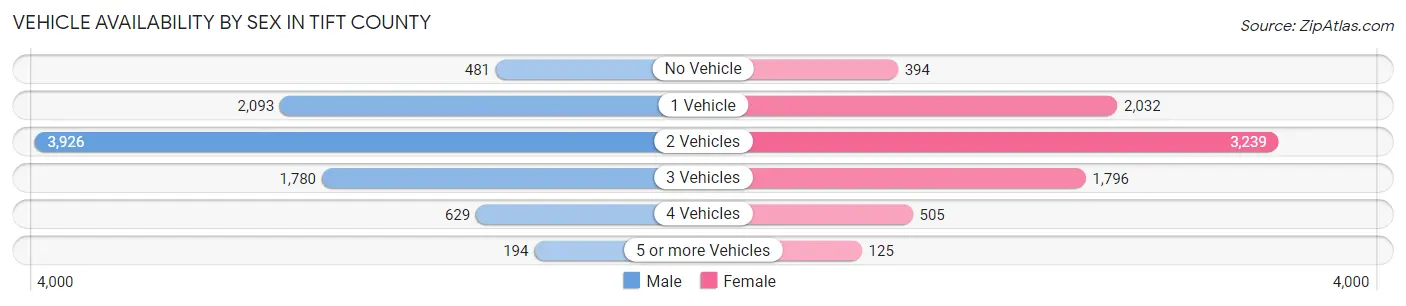
Vehicle Availability by Sex in Tift County
The most prevalent vehicle ownership categories in Tift County are males with 2 vehicles (3,926, accounting for 43.1%) and females with 2 vehicles (3,239, making up 48.5%).
| Vehicles Available | Male | Female |
| No Vehicle | 481 (5.3%) | 394 (4.9%) |
| 1 Vehicle | 2,093 (23.0%) | 2,032 (25.1%) |
| 2 Vehicles | 3,926 (43.1%) | 3,239 (40.0%) |
| 3 Vehicles | 1,780 (19.6%) | 1,796 (22.2%) |
| 4 Vehicles | 629 (6.9%) | 505 (6.2%) |
| 5 or more Vehicles | 194 (2.1%) | 125 (1.5%) |
| Total | 9,103 (100.0%) | 8,091 (100.0%) |
Commute Time in Tift County
The most frequently occuring commute durations in Tift County are 10 to 14 minutes (4,562 commuters, 26.9%), 15 to 19 minutes (4,078 commuters, 24.1%), and 5 to 9 minutes (1,992 commuters, 11.8%).
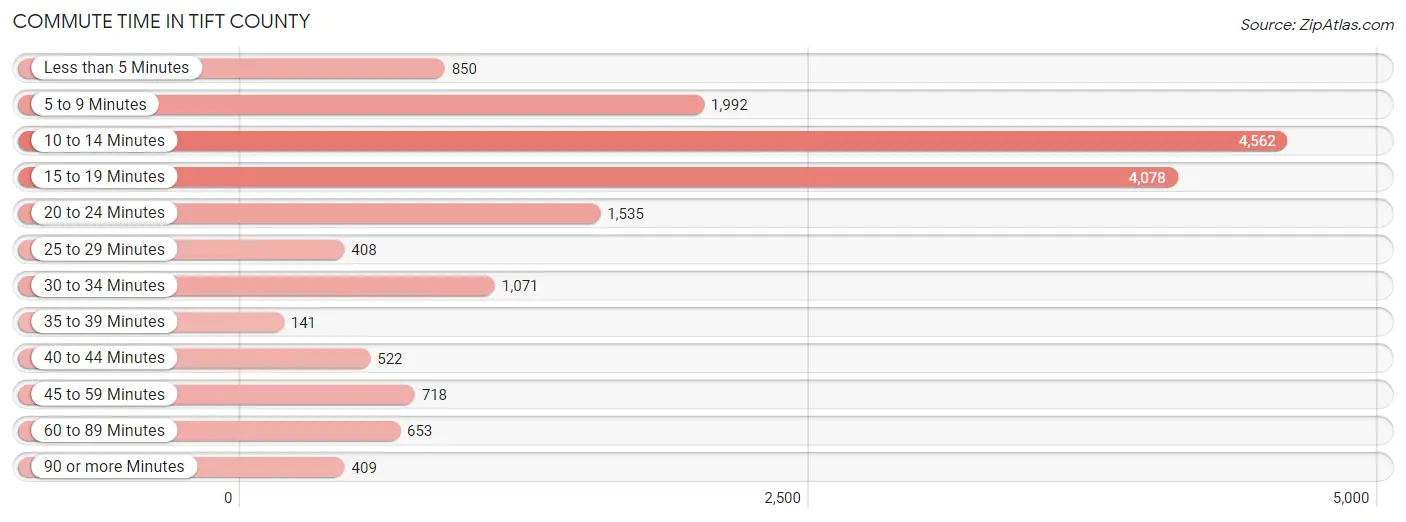
| Commute Time | # Commuters | % Commuters |
| Less than 5 Minutes | 850 | 5.0% |
| 5 to 9 Minutes | 1,992 | 11.8% |
| 10 to 14 Minutes | 4,562 | 26.9% |
| 15 to 19 Minutes | 4,078 | 24.1% |
| 20 to 24 Minutes | 1,535 | 9.1% |
| 25 to 29 Minutes | 408 | 2.4% |
| 30 to 34 Minutes | 1,071 | 6.3% |
| 35 to 39 Minutes | 141 | 0.8% |
| 40 to 44 Minutes | 522 | 3.1% |
| 45 to 59 Minutes | 718 | 4.2% |
| 60 to 89 Minutes | 653 | 3.9% |
| 90 or more Minutes | 409 | 2.4% |
Commute Time by Sex in Tift County
The most common commute times in Tift County are 10 to 14 minutes (2,712 commuters, 30.4%) for males and 15 to 19 minutes (2,258 commuters, 28.2%) for females.
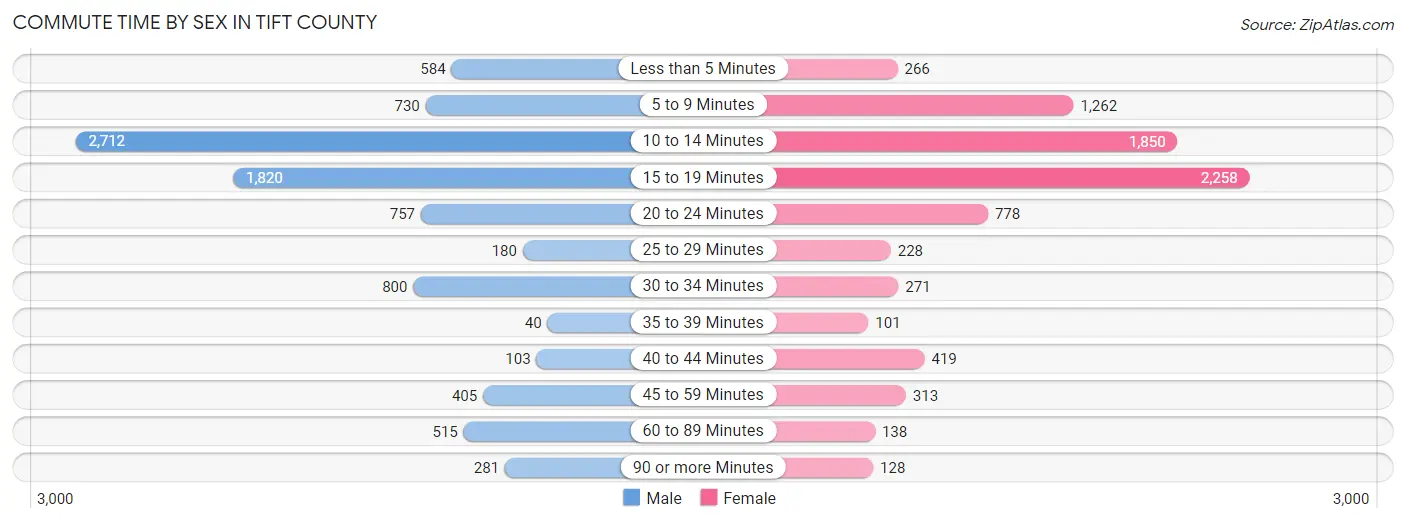
| Commute Time | Male | Female |
| Less than 5 Minutes | 584 (6.5%) | 266 (3.3%) |
| 5 to 9 Minutes | 730 (8.2%) | 1,262 (15.8%) |
| 10 to 14 Minutes | 2,712 (30.4%) | 1,850 (23.1%) |
| 15 to 19 Minutes | 1,820 (20.4%) | 2,258 (28.2%) |
| 20 to 24 Minutes | 757 (8.5%) | 778 (9.7%) |
| 25 to 29 Minutes | 180 (2.0%) | 228 (2.9%) |
| 30 to 34 Minutes | 800 (9.0%) | 271 (3.4%) |
| 35 to 39 Minutes | 40 (0.4%) | 101 (1.3%) |
| 40 to 44 Minutes | 103 (1.1%) | 419 (5.2%) |
| 45 to 59 Minutes | 405 (4.5%) | 313 (3.9%) |
| 60 to 89 Minutes | 515 (5.8%) | 138 (1.7%) |
| 90 or more Minutes | 281 (3.2%) | 128 (1.6%) |
Time of Departure to Work by Sex in Tift County
The most frequent times of departure to work in Tift County are 7:30 AM to 7:59 AM (2,205, 24.7%) for males and 7:30 AM to 7:59 AM (1,817, 22.7%) for females.
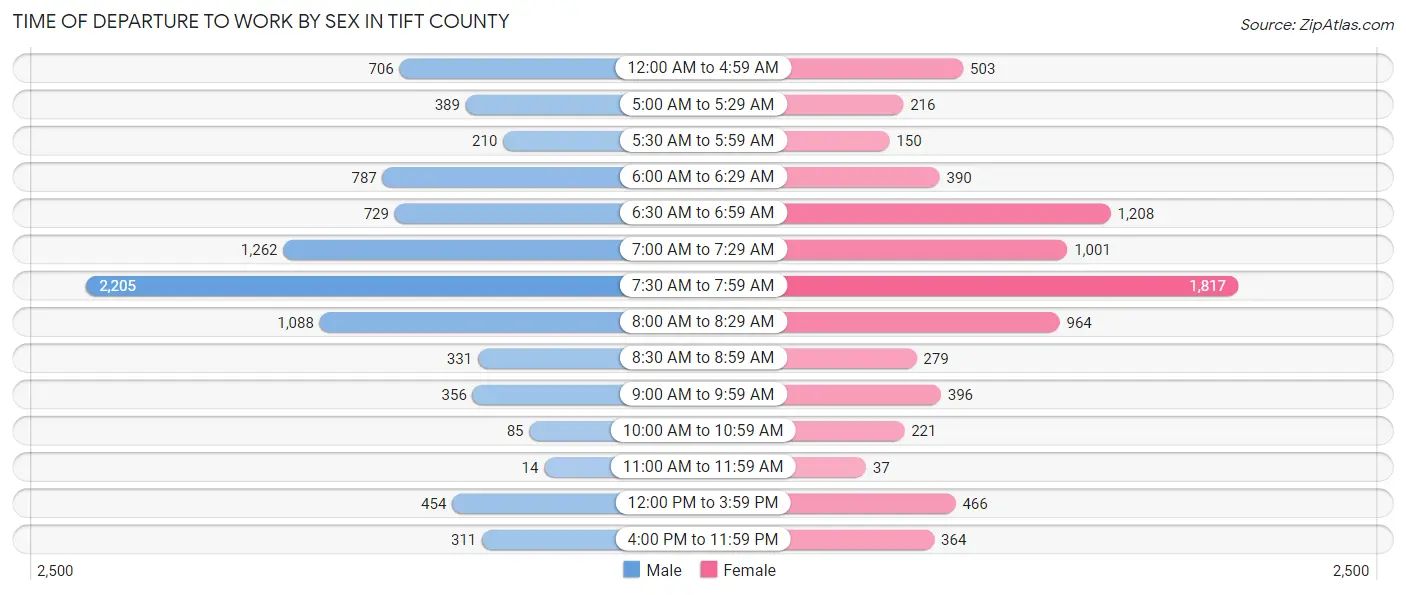
| Time of Departure | Male | Female |
| 12:00 AM to 4:59 AM | 706 (7.9%) | 503 (6.3%) |
| 5:00 AM to 5:29 AM | 389 (4.4%) | 216 (2.7%) |
| 5:30 AM to 5:59 AM | 210 (2.4%) | 150 (1.9%) |
| 6:00 AM to 6:29 AM | 787 (8.8%) | 390 (4.9%) |
| 6:30 AM to 6:59 AM | 729 (8.2%) | 1,208 (15.1%) |
| 7:00 AM to 7:29 AM | 1,262 (14.1%) | 1,001 (12.5%) |
| 7:30 AM to 7:59 AM | 2,205 (24.7%) | 1,817 (22.7%) |
| 8:00 AM to 8:29 AM | 1,088 (12.2%) | 964 (12.0%) |
| 8:30 AM to 8:59 AM | 331 (3.7%) | 279 (3.5%) |
| 9:00 AM to 9:59 AM | 356 (4.0%) | 396 (4.9%) |
| 10:00 AM to 10:59 AM | 85 (0.9%) | 221 (2.8%) |
| 11:00 AM to 11:59 AM | 14 (0.2%) | 37 (0.5%) |
| 12:00 PM to 3:59 PM | 454 (5.1%) | 466 (5.8%) |
| 4:00 PM to 11:59 PM | 311 (3.5%) | 364 (4.5%) |
| Total | 8,927 (100.0%) | 8,012 (100.0%) |
Housing Occupancy in Tift County
Occupancy by Ownership in Tift County
Of the total 15,328 dwellings in Tift County, owner-occupied units account for 9,452 (61.7%), while renter-occupied units make up 5,876 (38.3%).
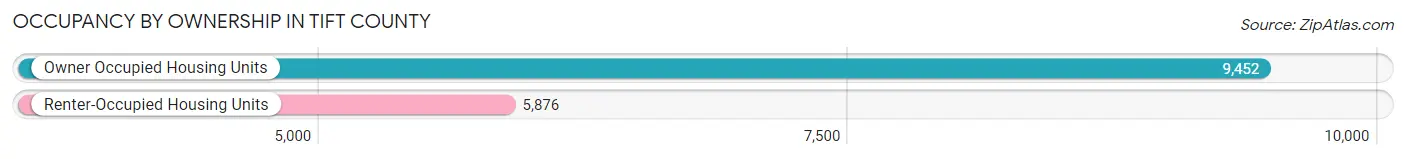
| Occupancy | # Housing Units | % Housing Units |
| Owner Occupied Housing Units | 9,452 | 61.7% |
| Renter-Occupied Housing Units | 5,876 | 38.3% |
| Total Occupied Housing Units | 15,328 | 100.0% |
Occupancy by Household Size in Tift County
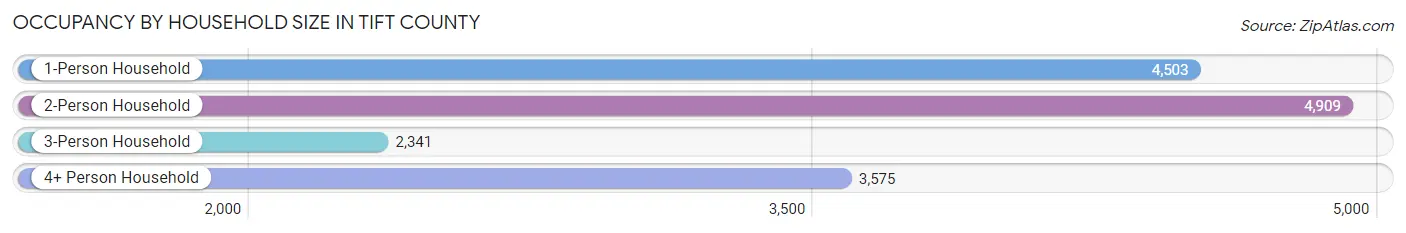
| Household Size | # Housing Units | % Housing Units |
| 1-Person Household | 4,503 | 29.4% |
| 2-Person Household | 4,909 | 32.0% |
| 3-Person Household | 2,341 | 15.3% |
| 4+ Person Household | 3,575 | 23.3% |
| Total Housing Units | 15,328 | 100.0% |
Occupancy by Ownership by Household Size in Tift County
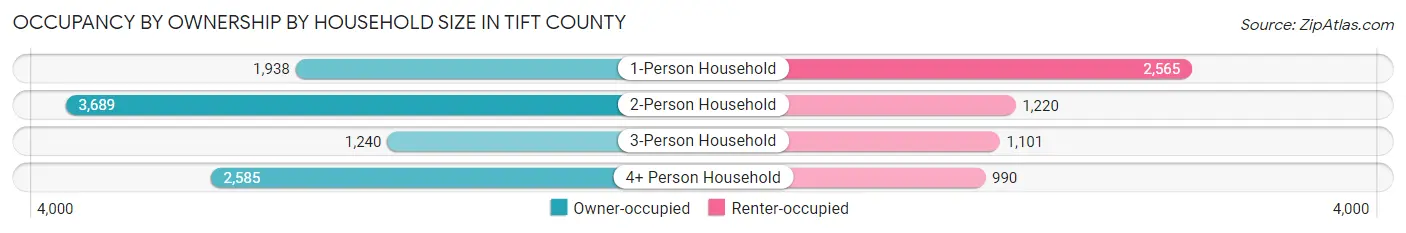
| Household Size | Owner-occupied | Renter-occupied |
| 1-Person Household | 1,938 (43.0%) | 2,565 (57.0%) |
| 2-Person Household | 3,689 (75.1%) | 1,220 (24.8%) |
| 3-Person Household | 1,240 (53.0%) | 1,101 (47.0%) |
| 4+ Person Household | 2,585 (72.3%) | 990 (27.7%) |
| Total Housing Units | 9,452 (61.7%) | 5,876 (38.3%) |
Occupancy by Educational Attainment in Tift County
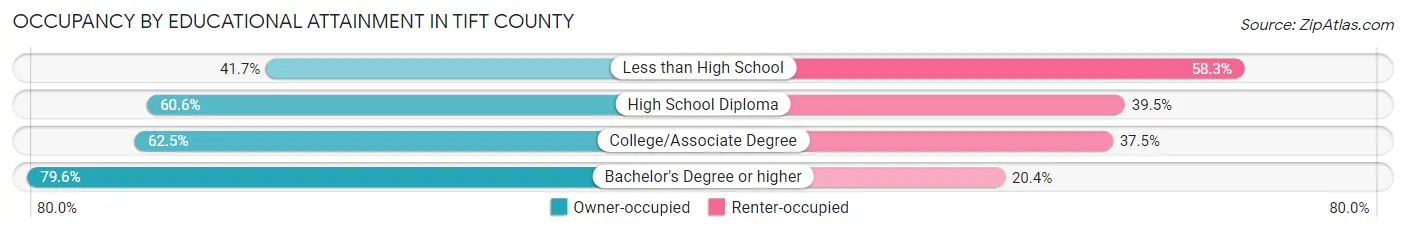
| Household Size | Owner-occupied | Renter-occupied |
| Less than High School | 1,054 (41.7%) | 1,473 (58.3%) |
| High School Diploma | 2,729 (60.6%) | 1,778 (39.5%) |
| College/Associate Degree | 3,402 (62.5%) | 2,043 (37.5%) |
| Bachelor's Degree or higher | 2,267 (79.6%) | 582 (20.4%) |
Occupancy by Age of Householder in Tift County
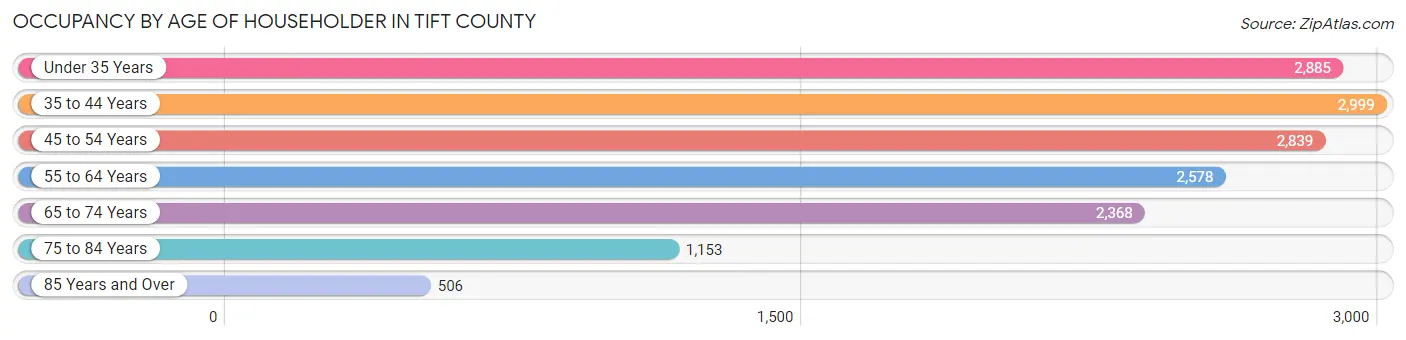
| Age Bracket | # Households | % Households |
| Under 35 Years | 2,885 | 18.8% |
| 35 to 44 Years | 2,999 | 19.6% |
| 45 to 54 Years | 2,839 | 18.5% |
| 55 to 64 Years | 2,578 | 16.8% |
| 65 to 74 Years | 2,368 | 15.4% |
| 75 to 84 Years | 1,153 | 7.5% |
| 85 Years and Over | 506 | 3.3% |
| Total | 15,328 | 100.0% |
Housing Finances in Tift County
Median Income by Occupancy in Tift County
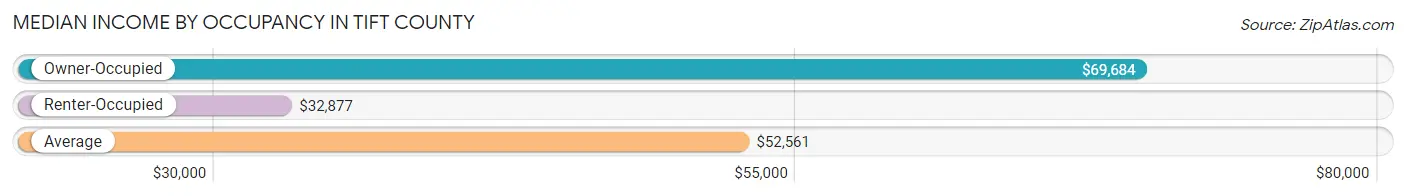
| Occupancy Type | # Households | Median Income |
| Owner-Occupied | 9,452 (61.7%) | $69,684 |
| Renter-Occupied | 5,876 (38.3%) | $32,877 |
| Average | 15,328 (100.0%) | $52,561 |
Occupancy by Householder Income Bracket in Tift County
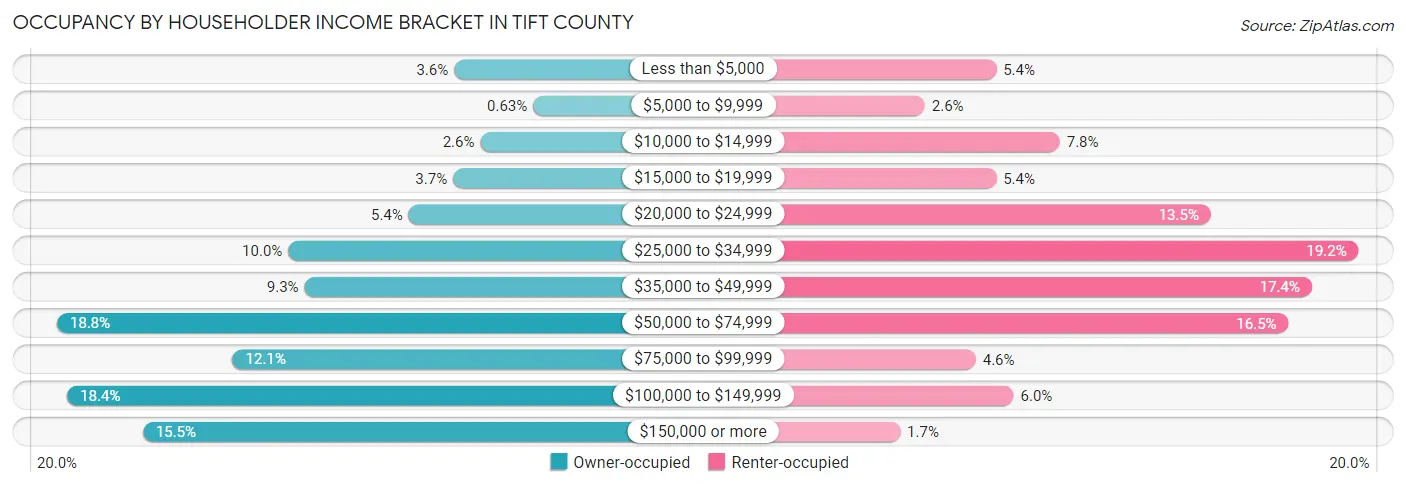
| Income Bracket | Owner-occupied | Renter-occupied |
| Less than $5,000 | 344 (3.6%) | 315 (5.4%) |
| $5,000 to $9,999 | 60 (0.6%) | 155 (2.6%) |
| $10,000 to $14,999 | 250 (2.6%) | 457 (7.8%) |
| $15,000 to $19,999 | 348 (3.7%) | 315 (5.4%) |
| $20,000 to $24,999 | 508 (5.4%) | 795 (13.5%) |
| $25,000 to $34,999 | 941 (10.0%) | 1,126 (19.2%) |
| $35,000 to $49,999 | 883 (9.3%) | 1,021 (17.4%) |
| $50,000 to $74,999 | 1,774 (18.8%) | 969 (16.5%) |
| $75,000 to $99,999 | 1,142 (12.1%) | 269 (4.6%) |
| $100,000 to $149,999 | 1,737 (18.4%) | 354 (6.0%) |
| $150,000 or more | 1,465 (15.5%) | 100 (1.7%) |
| Total | 9,452 (100.0%) | 5,876 (100.0%) |
Monthly Housing Cost Tiers in Tift County
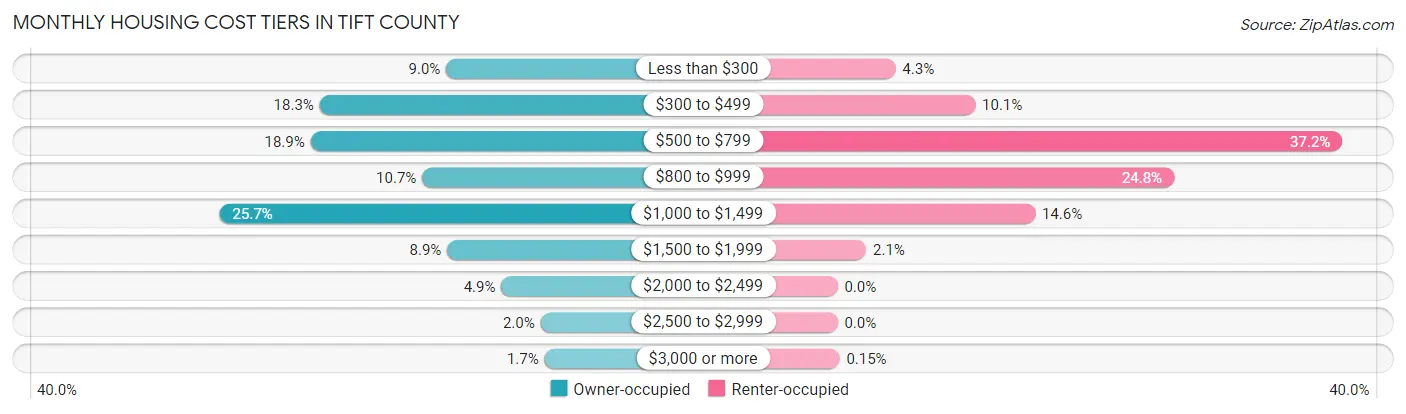
| Monthly Cost | Owner-occupied | Renter-occupied |
| Less than $300 | 846 (8.9%) | 251 (4.3%) |
| $300 to $499 | 1,727 (18.3%) | 596 (10.1%) |
| $500 to $799 | 1,790 (18.9%) | 2,184 (37.2%) |
| $800 to $999 | 1,013 (10.7%) | 1,456 (24.8%) |
| $1,000 to $1,499 | 2,424 (25.7%) | 855 (14.5%) |
| $1,500 to $1,999 | 839 (8.9%) | 124 (2.1%) |
| $2,000 to $2,499 | 462 (4.9%) | 0 (0.0%) |
| $2,500 to $2,999 | 189 (2.0%) | 0 (0.0%) |
| $3,000 or more | 162 (1.7%) | 9 (0.2%) |
| Total | 9,452 (100.0%) | 5,876 (100.0%) |
Physical Housing Characteristics in Tift County
Housing Structures in Tift County
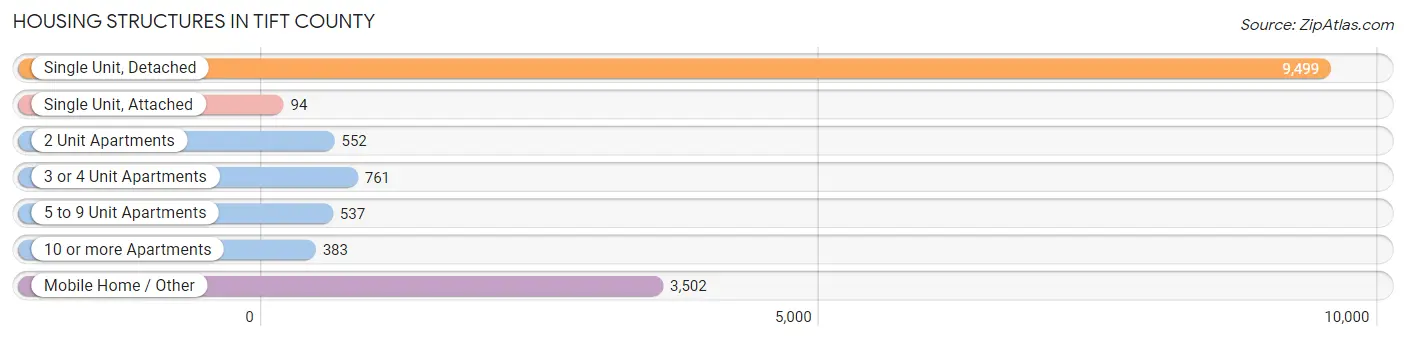
| Structure Type | # Housing Units | % Housing Units |
| Single Unit, Detached | 9,499 | 62.0% |
| Single Unit, Attached | 94 | 0.6% |
| 2 Unit Apartments | 552 | 3.6% |
| 3 or 4 Unit Apartments | 761 | 5.0% |
| 5 to 9 Unit Apartments | 537 | 3.5% |
| 10 or more Apartments | 383 | 2.5% |
| Mobile Home / Other | 3,502 | 22.9% |
| Total | 15,328 | 100.0% |
Housing Structures by Occupancy in Tift County
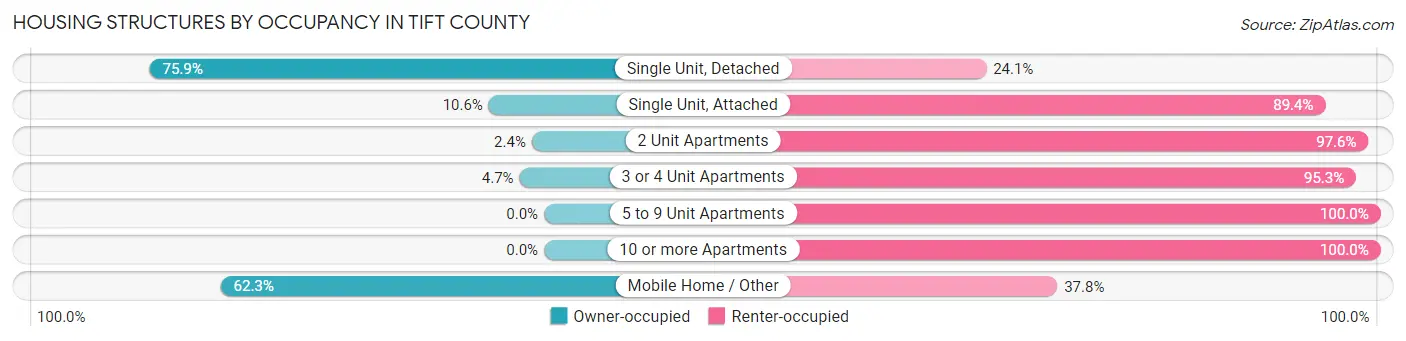
| Structure Type | Owner-occupied | Renter-occupied |
| Single Unit, Detached | 7,213 (75.9%) | 2,286 (24.1%) |
| Single Unit, Attached | 10 (10.6%) | 84 (89.4%) |
| 2 Unit Apartments | 13 (2.4%) | 539 (97.6%) |
| 3 or 4 Unit Apartments | 36 (4.7%) | 725 (95.3%) |
| 5 to 9 Unit Apartments | 0 (0.0%) | 537 (100.0%) |
| 10 or more Apartments | 0 (0.0%) | 383 (100.0%) |
| Mobile Home / Other | 2,180 (62.3%) | 1,322 (37.8%) |
| Total | 9,452 (61.7%) | 5,876 (38.3%) |
Housing Structures by Number of Rooms in Tift County
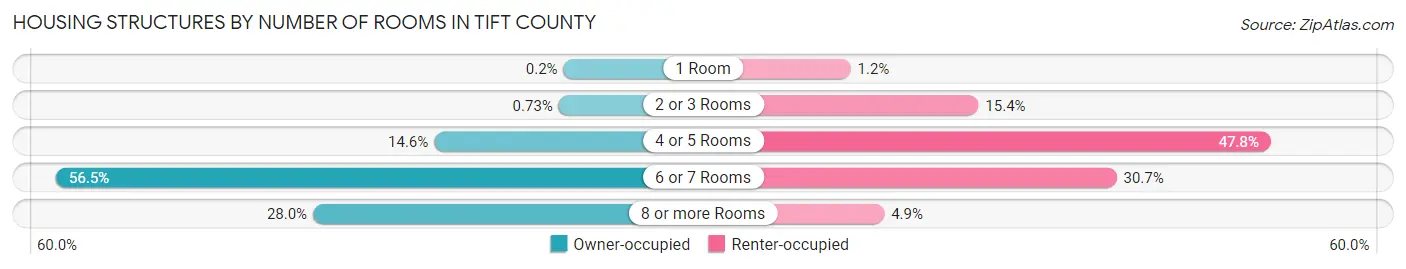
| Number of Rooms | Owner-occupied | Renter-occupied |
| 1 Room | 19 (0.2%) | 70 (1.2%) |
| 2 or 3 Rooms | 69 (0.7%) | 903 (15.4%) |
| 4 or 5 Rooms | 1,375 (14.5%) | 2,810 (47.8%) |
| 6 or 7 Rooms | 5,342 (56.5%) | 1,804 (30.7%) |
| 8 or more Rooms | 2,647 (28.0%) | 289 (4.9%) |
| Total | 9,452 (100.0%) | 5,876 (100.0%) |
Housing Structure by Heating Type in Tift County
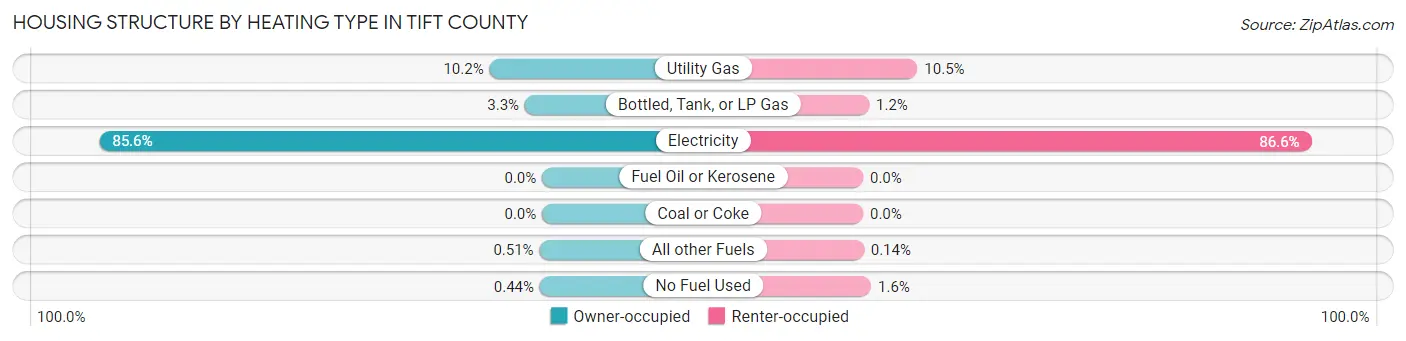
| Heating Type | Owner-occupied | Renter-occupied |
| Utility Gas | 961 (10.2%) | 617 (10.5%) |
| Bottled, Tank, or LP Gas | 314 (3.3%) | 69 (1.2%) |
| Electricity | 8,087 (85.6%) | 5,091 (86.6%) |
| Fuel Oil or Kerosene | 0 (0.0%) | 0 (0.0%) |
| Coal or Coke | 0 (0.0%) | 0 (0.0%) |
| All other Fuels | 48 (0.5%) | 8 (0.1%) |
| No Fuel Used | 42 (0.4%) | 91 (1.5%) |
| Total | 9,452 (100.0%) | 5,876 (100.0%) |
Household Vehicle Usage in Tift County
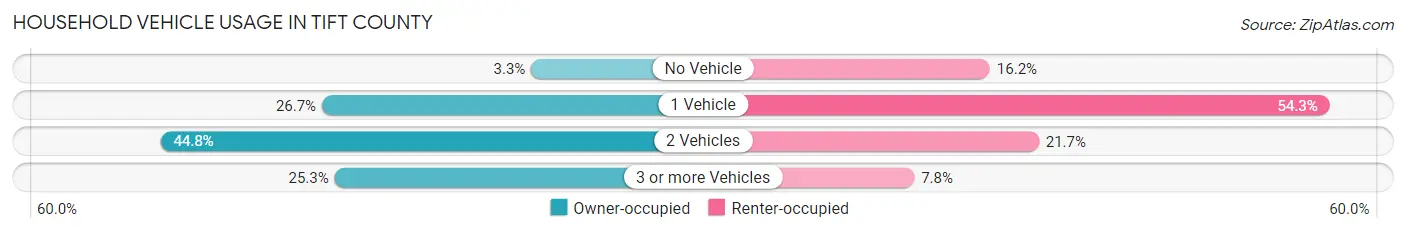
| Vehicles per Household | Owner-occupied | Renter-occupied |
| No Vehicle | 307 (3.3%) | 954 (16.2%) |
| 1 Vehicle | 2,523 (26.7%) | 3,190 (54.3%) |
| 2 Vehicles | 4,233 (44.8%) | 1,276 (21.7%) |
| 3 or more Vehicles | 2,389 (25.3%) | 456 (7.8%) |
| Total | 9,452 (100.0%) | 5,876 (100.0%) |
Real Estate & Mortgages in Tift County
Real Estate and Mortgage Overview in Tift County
| Characteristic | Without Mortgage | With Mortgage |
| Housing Units | 3,990 | 5,462 |
| Median Property Value | $102,900 | $161,900 |
| Median Household Income | $56,628 | $1,013 |
| Monthly Housing Costs | $417 | $162 |
| Real Estate Taxes | $1,003 | $89 |
Property Value by Mortgage Status in Tift County
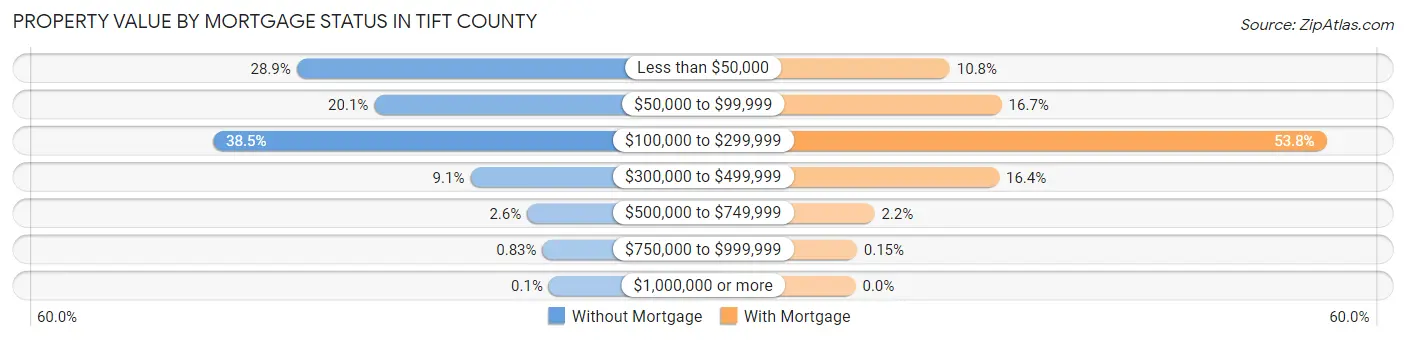
| Property Value | Without Mortgage | With Mortgage |
| Less than $50,000 | 1,154 (28.9%) | 589 (10.8%) |
| $50,000 to $99,999 | 800 (20.1%) | 912 (16.7%) |
| $100,000 to $299,999 | 1,534 (38.5%) | 2,939 (53.8%) |
| $300,000 to $499,999 | 362 (9.1%) | 896 (16.4%) |
| $500,000 to $749,999 | 103 (2.6%) | 118 (2.2%) |
| $750,000 to $999,999 | 33 (0.8%) | 8 (0.2%) |
| $1,000,000 or more | 4 (0.1%) | 0 (0.0%) |
| Total | 3,990 (100.0%) | 5,462 (100.0%) |
Household Income by Mortgage Status in Tift County
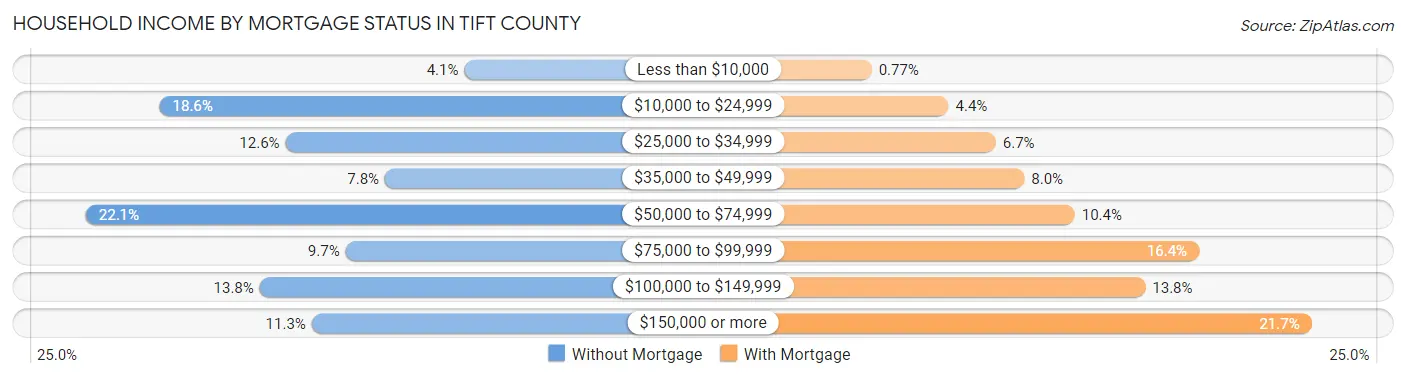
| Household Income | Without Mortgage | With Mortgage |
| Less than $10,000 | 162 (4.1%) | 42 (0.8%) |
| $10,000 to $24,999 | 741 (18.6%) | 242 (4.4%) |
| $25,000 to $34,999 | 502 (12.6%) | 365 (6.7%) |
| $35,000 to $49,999 | 313 (7.8%) | 439 (8.0%) |
| $50,000 to $74,999 | 881 (22.1%) | 570 (10.4%) |
| $75,000 to $99,999 | 388 (9.7%) | 893 (16.4%) |
| $100,000 to $149,999 | 551 (13.8%) | 754 (13.8%) |
| $150,000 or more | 452 (11.3%) | 1,186 (21.7%) |
| Total | 3,990 (100.0%) | 5,462 (100.0%) |
Property Value to Household Income Ratio in Tift County
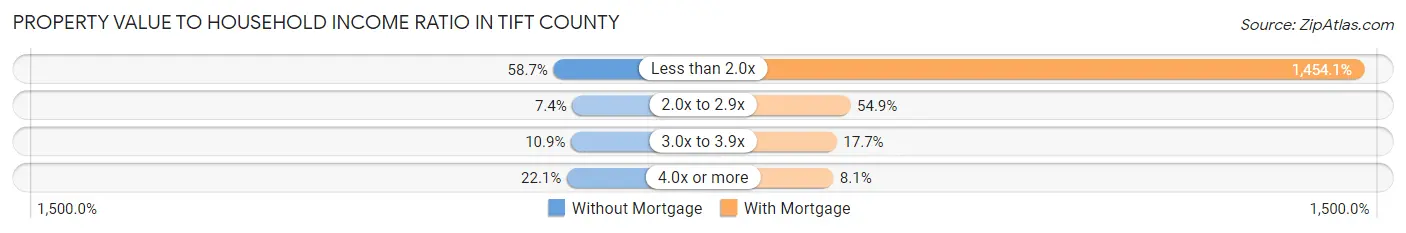
| Value-to-Income Ratio | Without Mortgage | With Mortgage |
| Less than 2.0x | 2,342 (58.7%) | 79,423 (1,454.1%) |
| 2.0x to 2.9x | 294 (7.4%) | 3,000 (54.9%) |
| 3.0x to 3.9x | 433 (10.8%) | 965 (17.7%) |
| 4.0x or more | 880 (22.1%) | 444 (8.1%) |
| Total | 3,990 (100.0%) | 5,462 (100.0%) |
Real Estate Taxes by Mortgage Status in Tift County
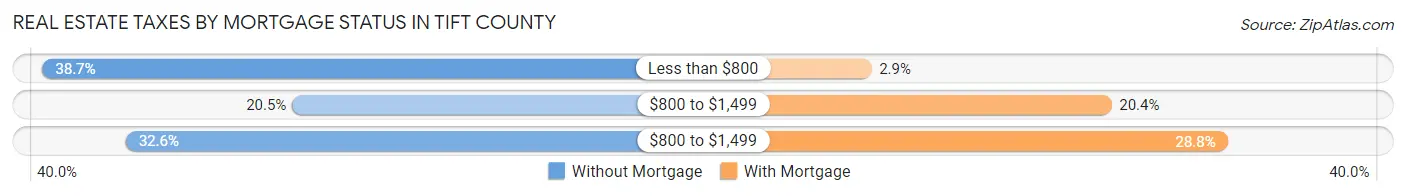
| Property Taxes | Without Mortgage | With Mortgage |
| Less than $800 | 1,544 (38.7%) | 156 (2.9%) |
| $800 to $1,499 | 816 (20.4%) | 1,114 (20.4%) |
| $800 to $1,499 | 1,301 (32.6%) | 1,574 (28.8%) |
| Total | 3,990 (100.0%) | 5,462 (100.0%) |
Health & Disability in Tift County
Health Insurance Coverage by Age in Tift County
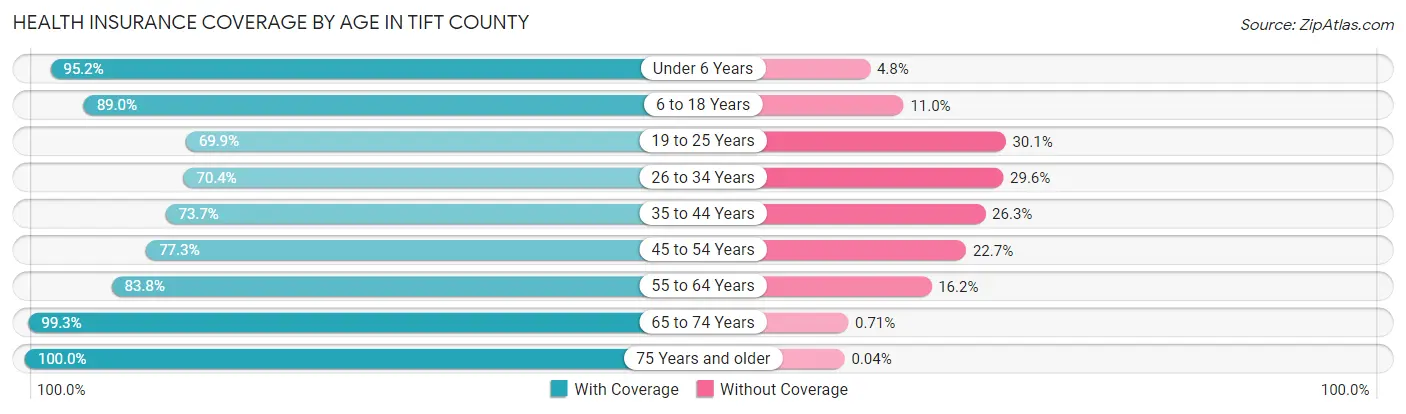
| Age Bracket | With Coverage | Without Coverage |
| Under 6 Years | 3,018 (95.2%) | 152 (4.8%) |
| 6 to 18 Years | 7,248 (89.0%) | 899 (11.0%) |
| 19 to 25 Years | 2,557 (69.9%) | 1,099 (30.1%) |
| 26 to 34 Years | 3,200 (70.4%) | 1,347 (29.6%) |
| 35 to 44 Years | 3,977 (73.7%) | 1,417 (26.3%) |
| 45 to 54 Years | 3,650 (77.3%) | 1,071 (22.7%) |
| 55 to 64 Years | 4,129 (83.8%) | 799 (16.2%) |
| 65 to 74 Years | 3,640 (99.3%) | 26 (0.7%) |
| 75 Years and older | 2,407 (100.0%) | 1 (0.0%) |
| Total | 33,826 (83.2%) | 6,811 (16.8%) |
Health Insurance Coverage by Citizenship Status in Tift County
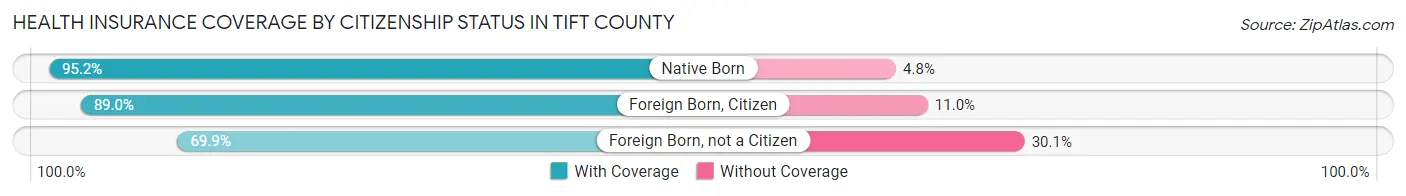
| Citizenship Status | With Coverage | Without Coverage |
| Native Born | 3,018 (95.2%) | 152 (4.8%) |
| Foreign Born, Citizen | 7,248 (89.0%) | 899 (11.0%) |
| Foreign Born, not a Citizen | 2,557 (69.9%) | 1,099 (30.1%) |
Health Insurance Coverage by Household Income in Tift County
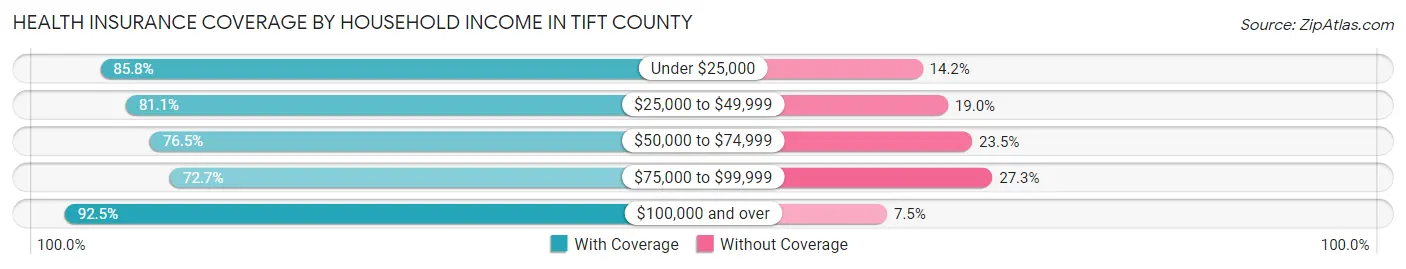
| Household Income | With Coverage | Without Coverage |
| Under $25,000 | 5,830 (85.8%) | 965 (14.2%) |
| $25,000 to $49,999 | 7,617 (81.0%) | 1,781 (19.0%) |
| $50,000 to $74,999 | 5,313 (76.5%) | 1,631 (23.5%) |
| $75,000 to $99,999 | 3,493 (72.7%) | 1,309 (27.3%) |
| $100,000 and over | 10,474 (92.5%) | 854 (7.5%) |
Public vs Private Health Insurance Coverage by Age in Tift County
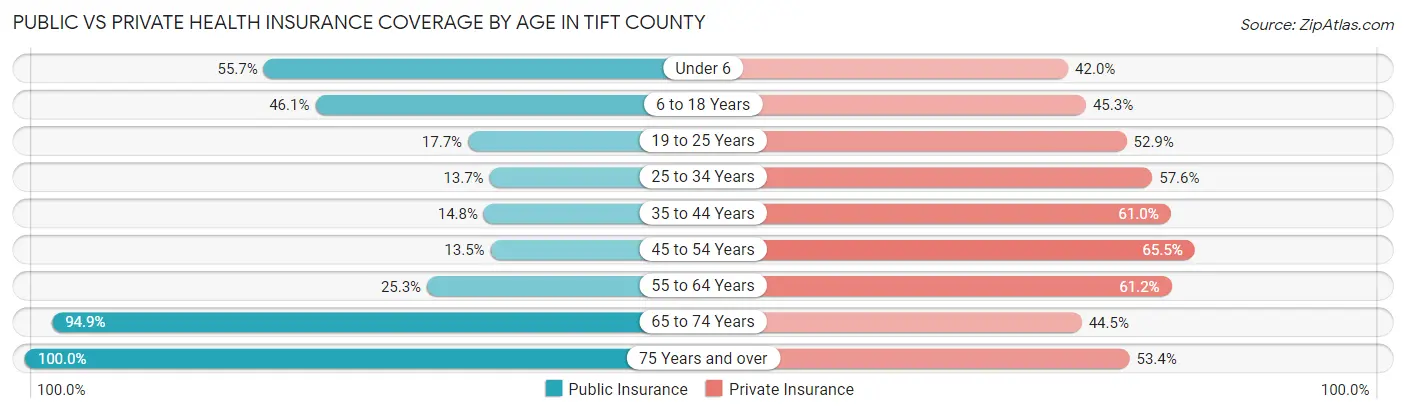
| Age Bracket | Public Insurance | Private Insurance |
| Under 6 | 1,764 (55.6%) | 1,332 (42.0%) |
| 6 to 18 Years | 3,752 (46.1%) | 3,693 (45.3%) |
| 19 to 25 Years | 648 (17.7%) | 1,933 (52.9%) |
| 25 to 34 Years | 624 (13.7%) | 2,621 (57.6%) |
| 35 to 44 Years | 796 (14.8%) | 3,292 (61.0%) |
| 45 to 54 Years | 639 (13.5%) | 3,092 (65.5%) |
| 55 to 64 Years | 1,248 (25.3%) | 3,015 (61.2%) |
| 65 to 74 Years | 3,478 (94.9%) | 1,633 (44.5%) |
| 75 Years and over | 2,407 (100.0%) | 1,286 (53.4%) |
| Total | 15,356 (37.8%) | 21,897 (53.9%) |
Disability Status by Sex by Age in Tift County
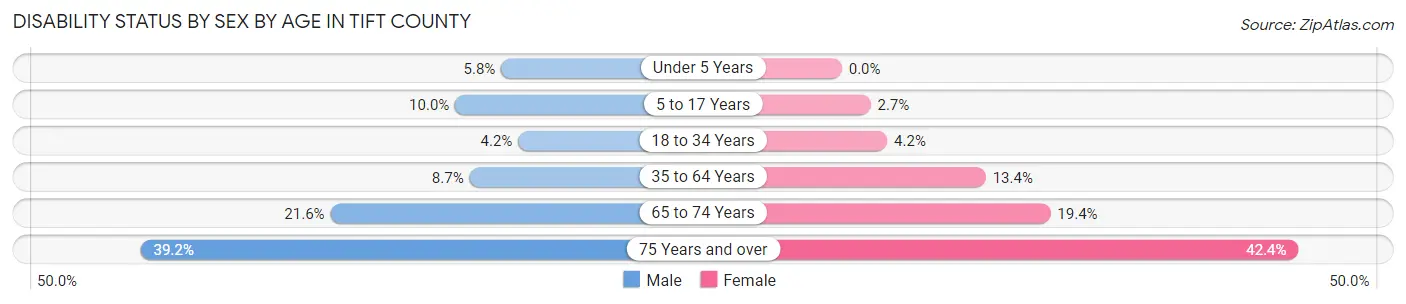
| Age Bracket | Male | Female |
| Under 5 Years | 89 (5.8%) | 0 (0.0%) |
| 5 to 17 Years | 386 (10.0%) | 99 (2.7%) |
| 18 to 34 Years | 191 (4.2%) | 196 (4.2%) |
| 35 to 64 Years | 617 (8.7%) | 1,064 (13.4%) |
| 65 to 74 Years | 365 (21.6%) | 383 (19.4%) |
| 75 Years and over | 343 (39.2%) | 650 (42.4%) |
Disability Class by Sex by Age in Tift County
Disability Class: Hearing Difficulty
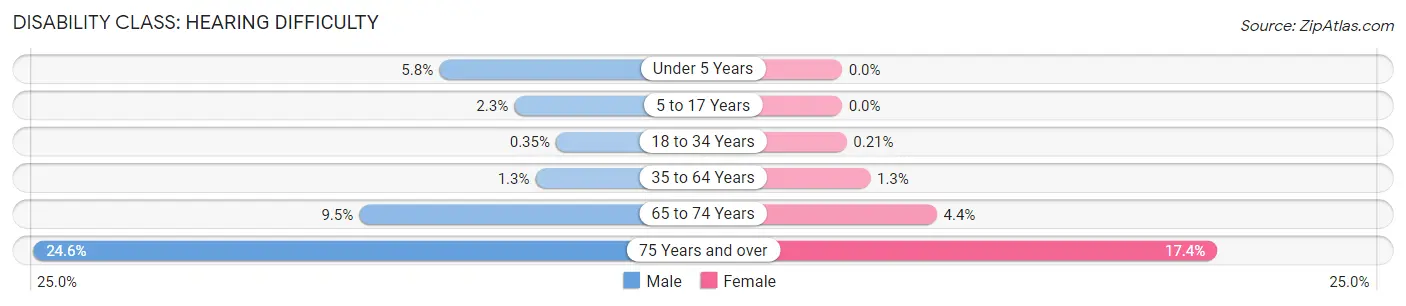
| Age Bracket | Male | Female |
| Under 5 Years | 89 (5.8%) | 0 (0.0%) |
| 5 to 17 Years | 88 (2.3%) | 0 (0.0%) |
| 18 to 34 Years | 16 (0.4%) | 10 (0.2%) |
| 35 to 64 Years | 92 (1.3%) | 104 (1.3%) |
| 65 to 74 Years | 160 (9.5%) | 87 (4.4%) |
| 75 Years and over | 215 (24.6%) | 267 (17.4%) |
Disability Class: Vision Difficulty
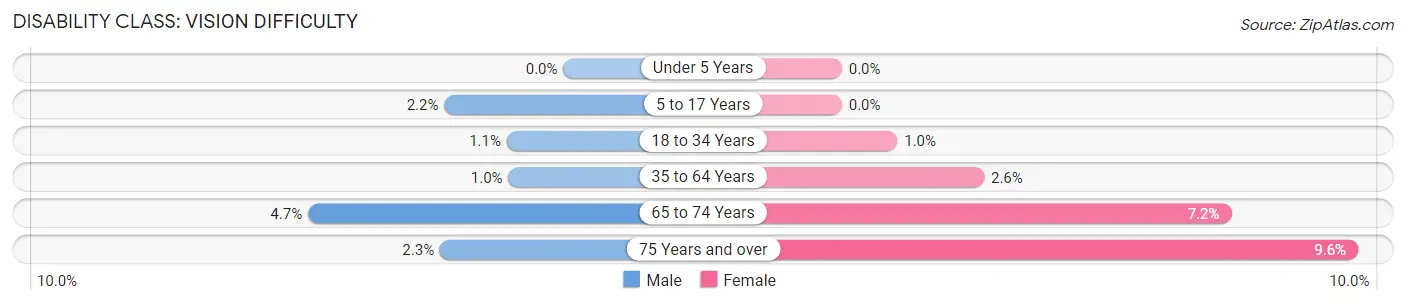
| Age Bracket | Male | Female |
| Under 5 Years | 0 (0.0%) | 0 (0.0%) |
| 5 to 17 Years | 85 (2.2%) | 0 (0.0%) |
| 18 to 34 Years | 48 (1.1%) | 48 (1.0%) |
| 35 to 64 Years | 72 (1.0%) | 210 (2.6%) |
| 65 to 74 Years | 80 (4.7%) | 143 (7.2%) |
| 75 Years and over | 20 (2.3%) | 147 (9.6%) |
Disability Class: Cognitive Difficulty
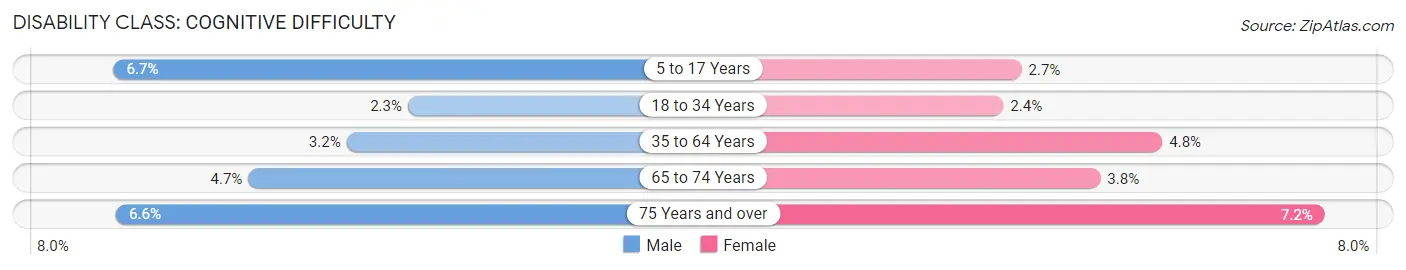
| Age Bracket | Male | Female |
| 5 to 17 Years | 257 (6.7%) | 99 (2.7%) |
| 18 to 34 Years | 105 (2.3%) | 112 (2.4%) |
| 35 to 64 Years | 228 (3.2%) | 379 (4.8%) |
| 65 to 74 Years | 79 (4.7%) | 76 (3.8%) |
| 75 Years and over | 58 (6.6%) | 110 (7.2%) |
Disability Class: Ambulatory Difficulty
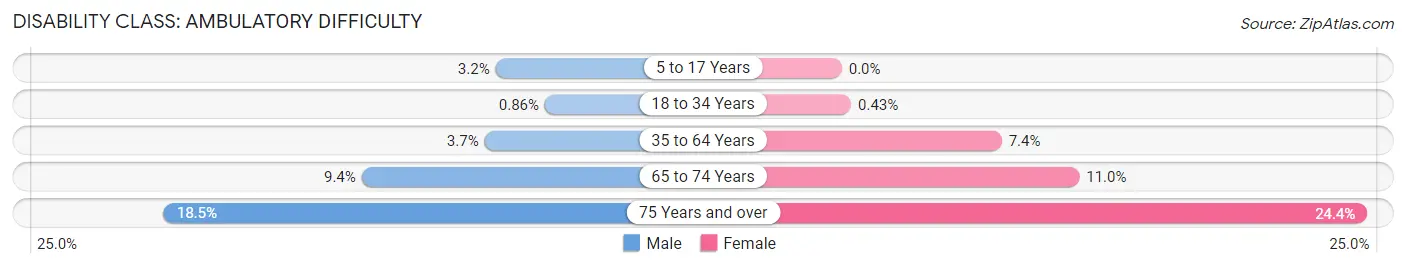
| Age Bracket | Male | Female |
| 5 to 17 Years | 121 (3.2%) | 0 (0.0%) |
| 18 to 34 Years | 39 (0.9%) | 20 (0.4%) |
| 35 to 64 Years | 259 (3.7%) | 591 (7.4%) |
| 65 to 74 Years | 158 (9.4%) | 218 (11.0%) |
| 75 Years and over | 162 (18.5%) | 374 (24.4%) |
Disability Class: Self-Care Difficulty
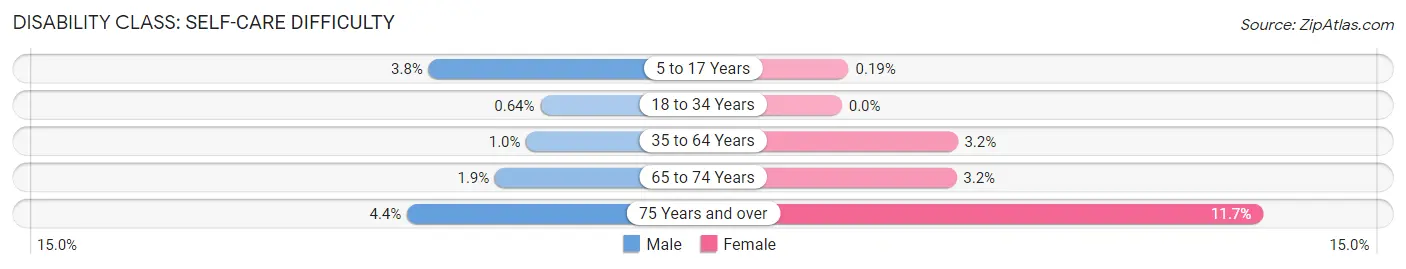
| Age Bracket | Male | Female |
| 5 to 17 Years | 144 (3.7%) | 7 (0.2%) |
| 18 to 34 Years | 29 (0.6%) | 0 (0.0%) |
| 35 to 64 Years | 73 (1.0%) | 256 (3.2%) |
| 65 to 74 Years | 32 (1.9%) | 63 (3.2%) |
| 75 Years and over | 38 (4.3%) | 180 (11.7%) |
Technology Access in Tift County
Computing Device Access in Tift County
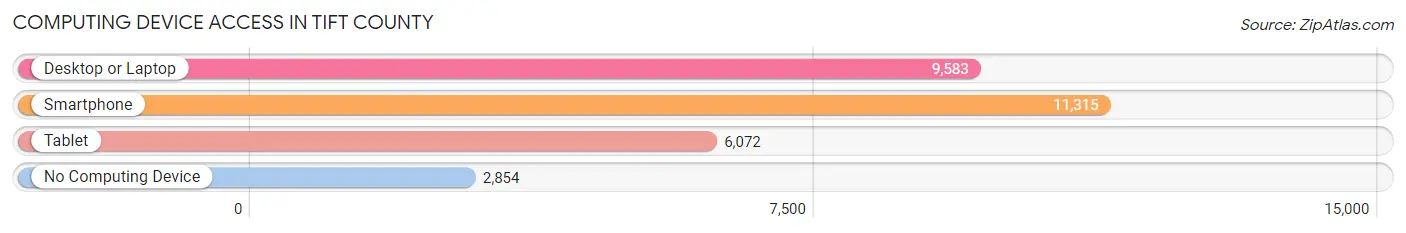
| Device Type | # Households | % Households |
| Desktop or Laptop | 9,583 | 62.5% |
| Smartphone | 11,315 | 73.8% |
| Tablet | 6,072 | 39.6% |
| No Computing Device | 2,854 | 18.6% |
| Total | 15,328 | 100.0% |
Internet Access in Tift County
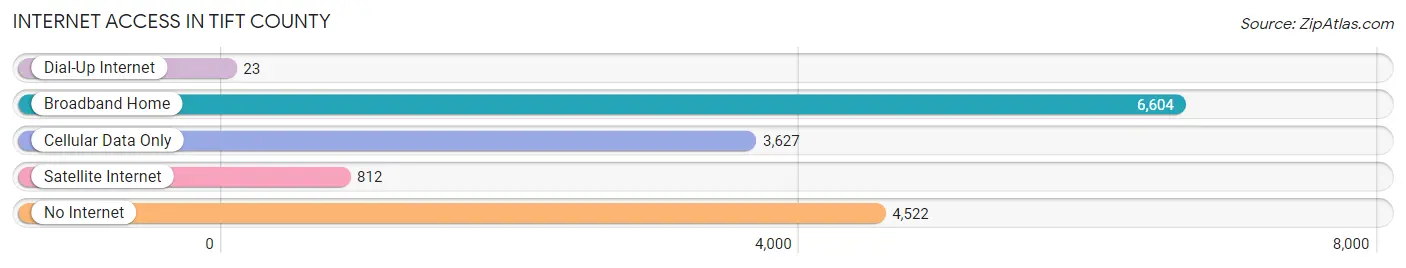
| Internet Type | # Households | % Households |
| Dial-Up Internet | 23 | 0.2% |
| Broadband Home | 6,604 | 43.1% |
| Cellular Data Only | 3,627 | 23.7% |
| Satellite Internet | 812 | 5.3% |
| No Internet | 4,522 | 29.5% |
| Total | 15,328 | 100.0% |
Tift County Summary
Tift County is located in the south-central region of the U.S. state of Georgia. It is part of the Valdosta, Georgia Metropolitan Statistical Area. The county seat is Tifton, and the largest city is Tifton. As of the 2010 census, the population was 40,118.
History
Tift County was created in 1905 from portions of Berrien, Irwin, and Worth counties. It was named for Nelson Tift, a local businessman and philanthropist who founded the city of Tifton.
Tift County was the site of a major battle during the Civil War. On October 22, 1864, Confederate forces under General Howell Cobb clashed with Union forces under General John Geary in the Battle of Tifton. The battle was a Confederate victory, but it was followed by a Union retreat.
Geography
Tift County is located in the south-central region of Georgia, about 90 miles south of Atlanta. It is bordered by Berrien County to the north, Irwin County to the east, Worth County to the south, and Colquitt County to the west.
The county has a total area of 441 square miles, of which 437 square miles is land and 4.2 square miles is water. The county is located in the Coastal Plain region of Georgia, and is mostly flat with some rolling hills. The county is drained by the Little River and the Withlacoochee River.
Economy
Tift County's economy is largely based on agriculture. The county is a major producer of cotton, peanuts, corn, and soybeans. Other important agricultural products include hay, wheat, and pecans.
The county is also home to several manufacturing companies, including a Tyson Foods poultry processing plant, a Georgia-Pacific lumber mill, and a Georgia-Pacific paper mill.
Demographics
As of the 2010 census, there were 40,118 people, 15,845 households, and 11,072 families residing in the county. The population density was 91.3 people per square mile. There were 17,845 housing units at an average density of 40.7 per square mile.
The racial makeup of the county was 68.2% White, 28.2% Black or African American, 0.4% Native American, 0.7% Asian, 0.1% Pacific Islander, 1.2% from other races, and 1.2% from two or more races. 2.7% of the population were Hispanic or Latino of any race.
The median income for a household in the county was $37,845, and the median income for a family was $45,945. The per capita income for the county was $19,845. About 17.2% of families and 21.2% of the population were below the poverty line, including 28.7% of those under age 18 and 16.2% of those age 65 or over.
Common Questions
What is Per Capita Income in Tift County?
Per Capita income in Tift County is $27,987.
What is the Median Family Income in Tift County?
Median Family Income in Tift County is $64,812.
What is the Median Household income in Tift County?
Median Household Income in Tift County is $52,561.
What is Income or Wage Gap in Tift County?
Income or Wage Gap in Tift County is 27.3%.
Women in Tift County earn 72.7 cents for every dollar earned by a man.
What is Family Income Deficit in Tift County?
Family Income Deficit in Tift County is $11,372.
Families that are below poverty line in Tift County earn $11,372 less on average than the poverty threshold level.
What is Inequality or Gini Index in Tift County?
Inequality or Gini Index in Tift County is 0.46.
What is the Total Population of Tift County?
Total Population of Tift County is 41,247.
What is the Total Male Population of Tift County?
Total Male Population of Tift County is 20,002.
What is the Total Female Population of Tift County?
Total Female Population of Tift County is 21,245.
What is the Ratio of Males per 100 Females in Tift County?
There are 94.15 Males per 100 Females in Tift County.
What is the Ratio of Females per 100 Males in Tift County?
There are 106.21 Females per 100 Males in Tift County.
What is the Median Population Age in Tift County?
Median Population Age in Tift County is 36.5 Years.
What is the Average Family Size in Tift County
Average Family Size in Tift County is 3.2 People.
What is the Average Household Size in Tift County
Average Household Size in Tift County is 2.6 People.
How Large is the Labor Force in Tift County?
There are 18,413 People in the Labor Forcein in Tift County.
What is the Percentage of People in the Labor Force in Tift County?
57.4% of People are in the Labor Force in Tift County.
What is the Unemployment Rate in Tift County?
Unemployment Rate in Tift County is 2.9%.