Telfair County, GA Map & Demographics
Telfair County Map
Telfair County Overview
$17,162
PER CAPITA INCOME
$52,008
AVG FAMILY INCOME
$41,801
AVG HOUSEHOLD INCOME
44.2%
WAGE / INCOME GAP [ % ]
55.8¢/ $1
WAGE / INCOME GAP [ $ ]
0.50
INEQUALITY / GINI INDEX
12,619
TOTAL POPULATION
7,534
MALE POPULATION
5,085
FEMALE POPULATION
148.16
MALES / 100 FEMALES
67.49
FEMALES / 100 MALES
40.1
MEDIAN AGE
4.1
AVG FAMILY SIZE
3.4
AVG HOUSEHOLD SIZE
3,794
LABOR FORCE [ PEOPLE ]
38.3%
PERCENT IN LABOR FORCE
2.1%
UNEMPLOYMENT RATE
Income in Telfair County
Income Overview in Telfair County
Per Capita Income in Telfair County is $17,162, while median incomes of families and households are $52,008 and $41,801 respectively.
| Characteristic | Number | Measure |
| Per Capita Income | 12,619 | $17,162 |
| Median Family Income | 2,066 | $52,008 |
| Mean Family Income | 2,066 | $67,090 |
| Median Household Income | 2,948 | $41,801 |
| Mean Household Income | 2,948 | $59,442 |
| Income Deficit | 2,066 | $0 |
| Wage / Income Gap (%) | 12,619 | 44.24% |
| Wage / Income Gap ($) | 12,619 | 55.76¢ per $1 |
| Gini / Inequality Index | 12,619 | 0.50 |
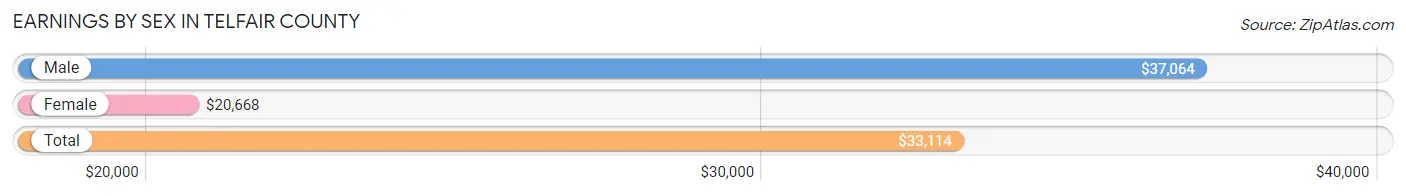
Earnings by Sex in Telfair County
Average Earnings in Telfair County are $33,114, $37,064 for men and $20,668 for women, a difference of 44.2%.
| Sex | Number | Average Earnings |
| Male | 2,209 (55.9%) | $37,064 |
| Female | 1,743 (44.1%) | $20,668 |
| Total | 3,952 (100.0%) | $33,114 |
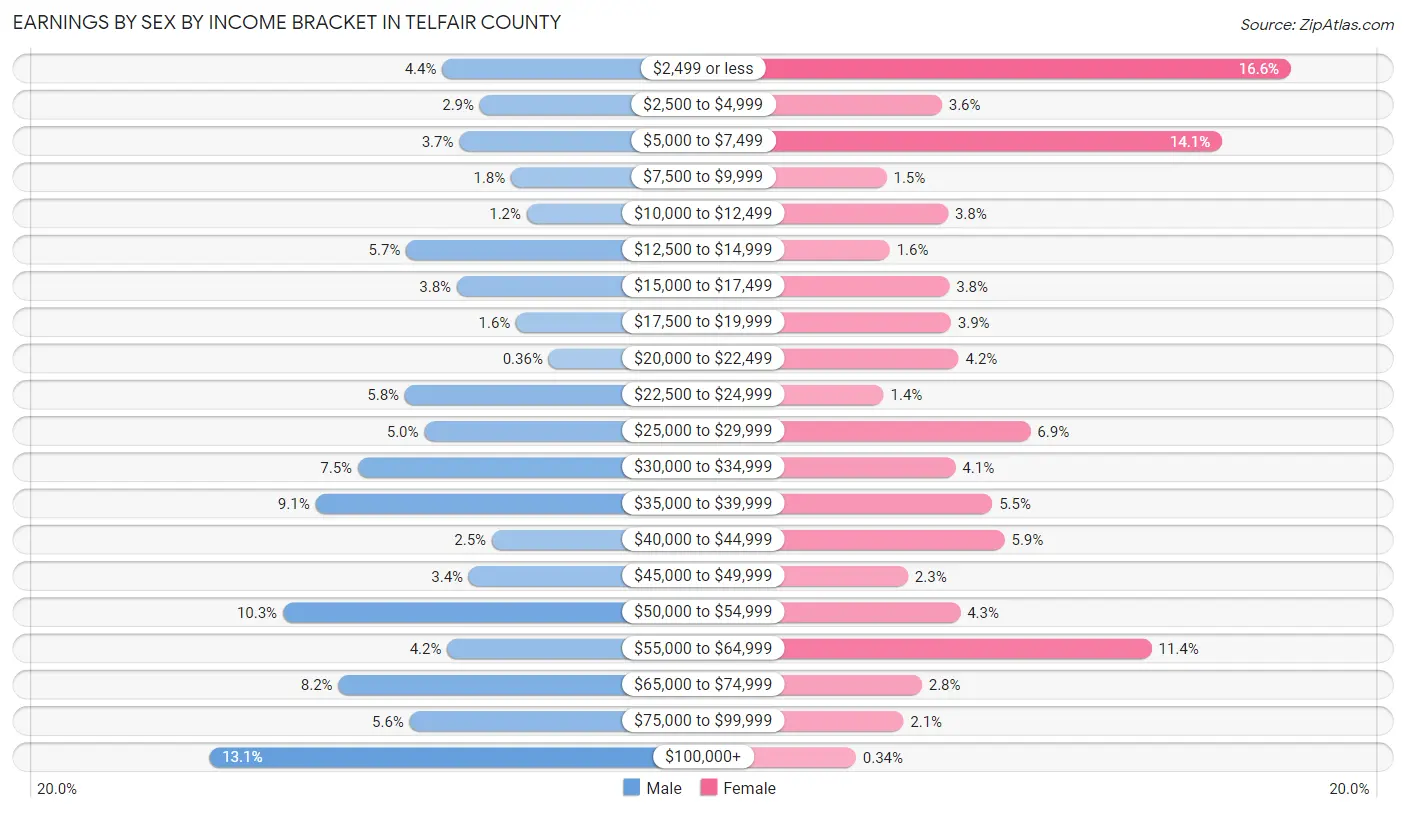
Earnings by Sex by Income Bracket in Telfair County
The most common earnings brackets in Telfair County are $100,000+ for men (289 | 13.1%) and $2,499 or less for women (290 | 16.6%).
| Income | Male | Female |
| $2,499 or less | 96 (4.3%) | 290 (16.6%) |
| $2,500 to $4,999 | 65 (2.9%) | 62 (3.6%) |
| $5,000 to $7,499 | 82 (3.7%) | 245 (14.1%) |
| $7,500 to $9,999 | 39 (1.8%) | 26 (1.5%) |
| $10,000 to $12,499 | 26 (1.2%) | 66 (3.8%) |
| $12,500 to $14,999 | 126 (5.7%) | 28 (1.6%) |
| $15,000 to $17,499 | 84 (3.8%) | 67 (3.8%) |
| $17,500 to $19,999 | 35 (1.6%) | 68 (3.9%) |
| $20,000 to $22,499 | 8 (0.4%) | 73 (4.2%) |
| $22,500 to $24,999 | 127 (5.8%) | 24 (1.4%) |
| $25,000 to $29,999 | 111 (5.0%) | 120 (6.9%) |
| $30,000 to $34,999 | 166 (7.5%) | 71 (4.1%) |
| $35,000 to $39,999 | 201 (9.1%) | 95 (5.4%) |
| $40,000 to $44,999 | 55 (2.5%) | 103 (5.9%) |
| $45,000 to $49,999 | 74 (3.4%) | 40 (2.3%) |
| $50,000 to $54,999 | 228 (10.3%) | 74 (4.3%) |
| $55,000 to $64,999 | 92 (4.2%) | 199 (11.4%) |
| $65,000 to $74,999 | 182 (8.2%) | 49 (2.8%) |
| $75,000 to $99,999 | 123 (5.6%) | 37 (2.1%) |
| $100,000+ | 289 (13.1%) | 6 (0.3%) |
| Total | 2,209 (100.0%) | 1,743 (100.0%) |
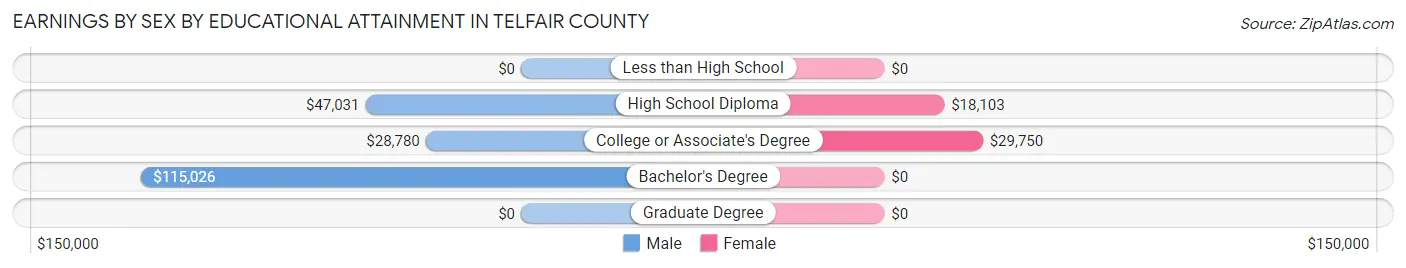
Earnings by Sex by Educational Attainment in Telfair County
Average earnings in Telfair County are $46,652 for men and $22,312 for women, a difference of 52.2%. Men with an educational attainment of bachelor's degree enjoy the highest average annual earnings of $115,026, while those with college or associate's degree education earn the least with $28,780. Women with an educational attainment of college or associate's degree earn the most with the average annual earnings of $29,750, while those with high school diploma education have the smallest earnings of $18,103.
| Educational Attainment | Male Income | Female Income |
| Less than High School | - | - |
| High School Diploma | $47,031 | $18,103 |
| College or Associate's Degree | $28,780 | $29,750 |
| Bachelor's Degree | $115,026 | $0 |
| Graduate Degree | - | - |
| Total | $46,652 | $22,312 |
Family Income in Telfair County
Family Income Brackets in Telfair County
According to the Telfair County family income data, there are 384 families falling into the $50,000 to $74,999 income range, which is the most common income bracket and makes up 18.6% of all families. Conversely, the $10,000 to $14,999 income bracket is the least frequent group with only 29 families (1.4%) belonging to this category.
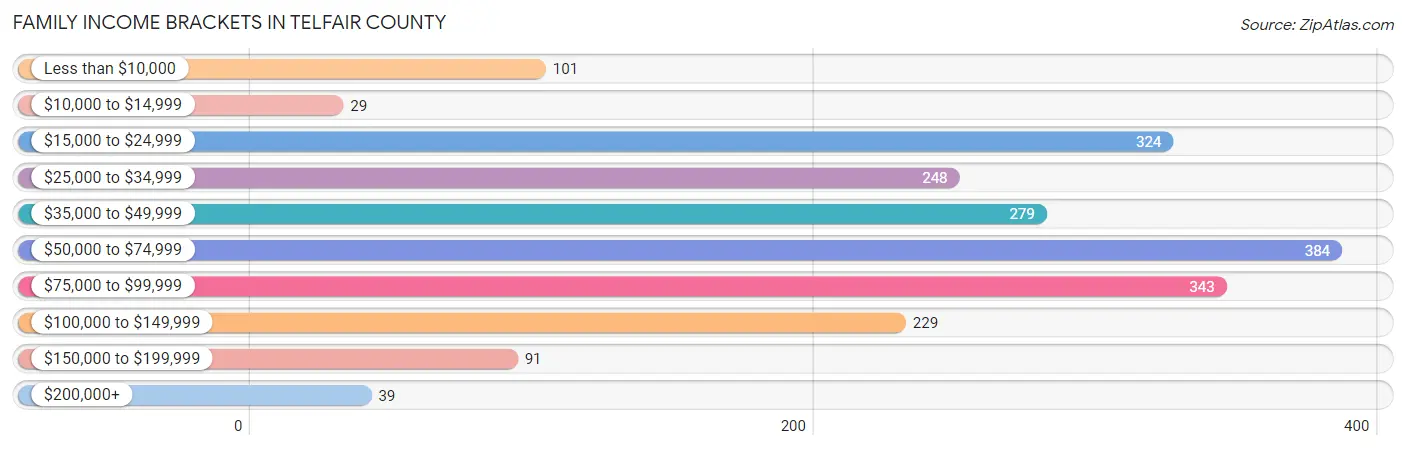
| Income Bracket | # Families | % Families |
| Less than $10,000 | 101 | 4.9% |
| $10,000 to $14,999 | 29 | 1.4% |
| $15,000 to $24,999 | 324 | 15.7% |
| $25,000 to $34,999 | 248 | 12.0% |
| $35,000 to $49,999 | 279 | 13.5% |
| $50,000 to $74,999 | 384 | 18.6% |
| $75,000 to $99,999 | 343 | 16.6% |
| $100,000 to $149,999 | 229 | 11.1% |
| $150,000 to $199,999 | 91 | 4.4% |
| $200,000+ | 39 | 1.9% |
Family Income by Famaliy Size in Telfair County
5-person families (89 | 4.3%) account for the highest median family income in Telfair County with $170,133 per family, while 5-person families (89 | 4.3%) have the highest median income of $34,027 per family member.
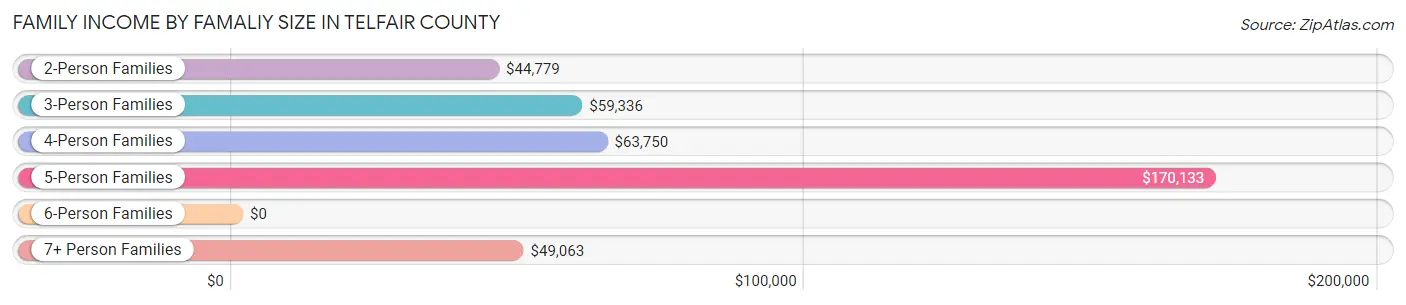
| Income Bracket | # Families | Median Income |
| 2-Person Families | 1,225 (59.3%) | $44,779 |
| 3-Person Families | 513 (24.8%) | $59,336 |
| 4-Person Families | 196 (9.5%) | $63,750 |
| 5-Person Families | 89 (4.3%) | $170,133 |
| 6-Person Families | 3 (0.2%) | $0 |
| 7+ Person Families | 40 (1.9%) | $49,063 |
| Total | 2,066 (100.0%) | $52,008 |
Family Income by Number of Earners in Telfair County
The median family income in Telfair County is $52,008, with families comprising 3+ earners (188) having the highest median family income of $138,661, while families with no earners (601) have the lowest median family income of $23,340, accounting for 9.1% and 29.1% of families, respectively.
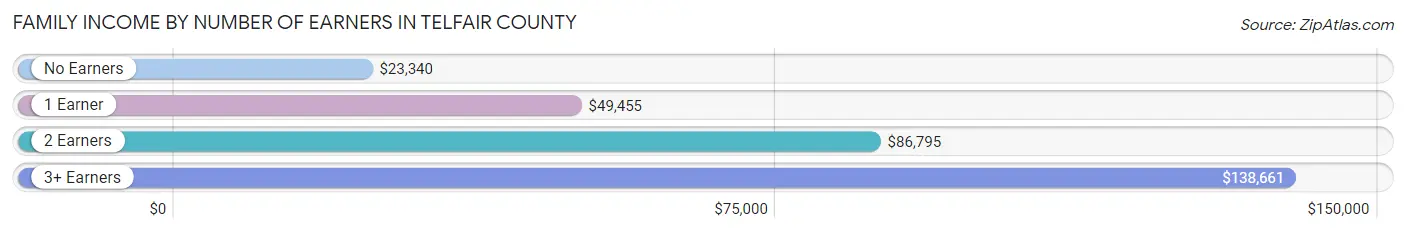
| Number of Earners | # Families | Median Income |
| No Earners | 601 (29.1%) | $23,340 |
| 1 Earner | 599 (29.0%) | $49,455 |
| 2 Earners | 678 (32.8%) | $86,795 |
| 3+ Earners | 188 (9.1%) | $138,661 |
| Total | 2,066 (100.0%) | $52,008 |
Household Income in Telfair County
Household Income Brackets in Telfair County
With 578 households falling in the category, the $15,000 to $24,999 income range is the most frequent in Telfair County, accounting for 19.6% of all households. In contrast, only 47 households (1.6%) fall into the $200,000+ income bracket, making it the least populous group.
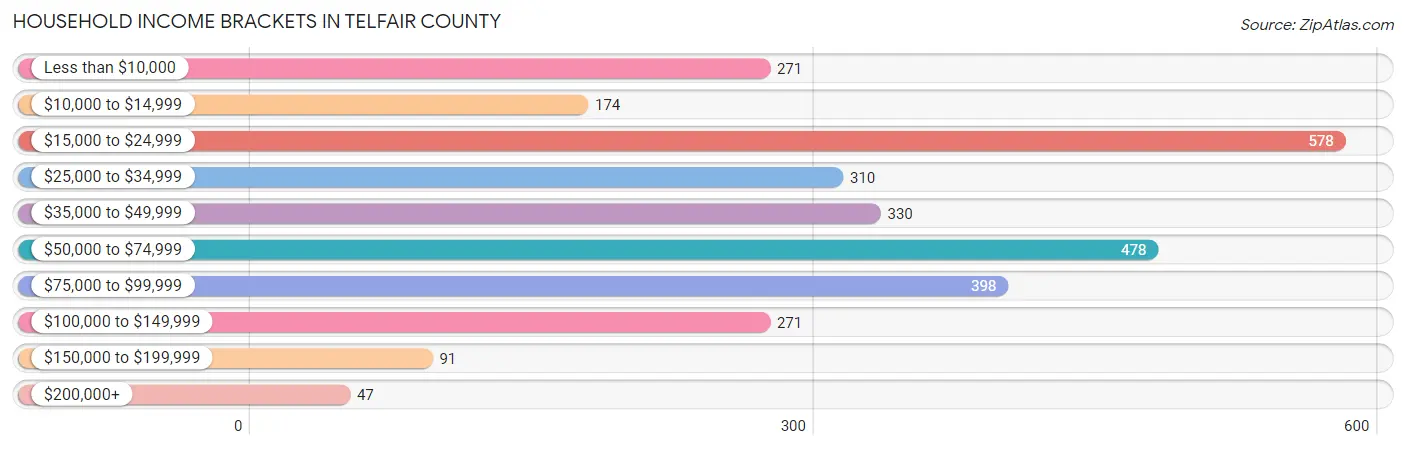
| Income Bracket | # Households | % Households |
| Less than $10,000 | 271 | 9.2% |
| $10,000 to $14,999 | 174 | 5.9% |
| $15,000 to $24,999 | 578 | 19.6% |
| $25,000 to $34,999 | 310 | 10.5% |
| $35,000 to $49,999 | 330 | 11.2% |
| $50,000 to $74,999 | 478 | 16.2% |
| $75,000 to $99,999 | 398 | 13.5% |
| $100,000 to $149,999 | 271 | 9.2% |
| $150,000 to $199,999 | 91 | 3.1% |
| $200,000+ | 47 | 1.6% |
Household Income by Householder Age in Telfair County
The median household income in Telfair County is $41,801, with the highest median household income of $60,285 found in the 45 to 64 years age bracket for the primary householder. A total of 1,123 households (38.1%) fall into this category. Meanwhile, the 15 to 24 years age bracket for the primary householder has the lowest median household income of $29,875, with 57 households (1.9%) in this group.
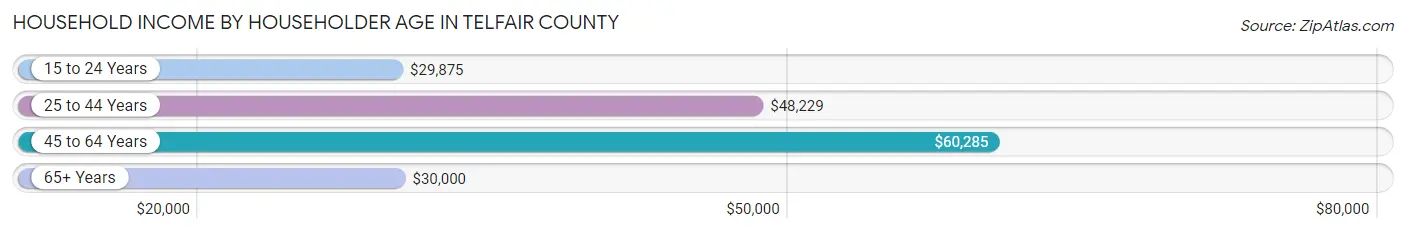
| Income Bracket | # Households | Median Income |
| 15 to 24 Years | 57 (1.9%) | $29,875 |
| 25 to 44 Years | 506 (17.2%) | $48,229 |
| 45 to 64 Years | 1,123 (38.1%) | $60,285 |
| 65+ Years | 1,262 (42.8%) | $30,000 |
| Total | 2,948 (100.0%) | $41,801 |
Poverty in Telfair County
Income Below Poverty by Sex and Age in Telfair County
With 33.1% poverty level for males and 29.5% for females among the residents of Telfair County, 6 to 11 year old males and 15 year old females are the most vulnerable to poverty, with 879 males (81.1%) and 66 females (75.9%) in their respective age groups living below the poverty level.
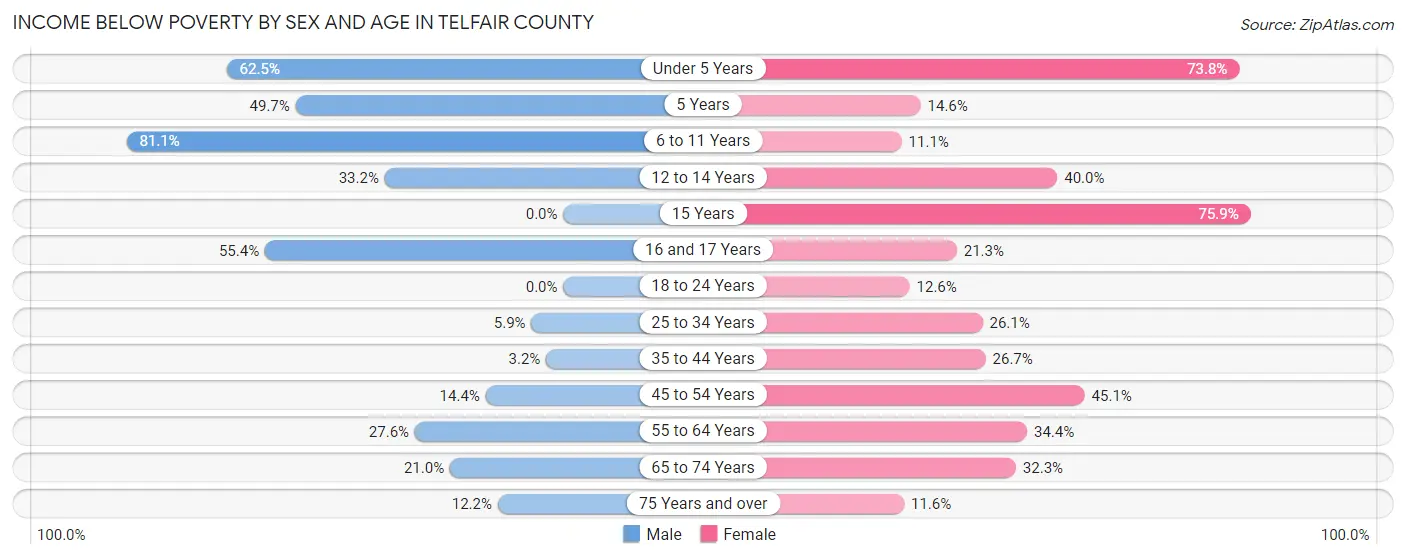
| Age Bracket | Male | Female |
| Under 5 Years | 150 (62.5%) | 149 (73.8%) |
| 5 Years | 84 (49.7%) | 6 (14.6%) |
| 6 to 11 Years | 879 (81.1%) | 49 (11.1%) |
| 12 to 14 Years | 59 (33.2%) | 66 (40.0%) |
| 15 Years | 0 (0.0%) | 66 (75.9%) |
| 16 and 17 Years | 72 (55.4%) | 35 (21.3%) |
| 18 to 24 Years | 0 (0.0%) | 53 (12.6%) |
| 25 to 34 Years | 27 (5.9%) | 104 (26.1%) |
| 35 to 44 Years | 14 (3.2%) | 158 (26.7%) |
| 45 to 54 Years | 89 (14.4%) | 275 (45.1%) |
| 55 to 64 Years | 151 (27.6%) | 242 (34.4%) |
| 65 to 74 Years | 113 (21.0%) | 201 (32.3%) |
| 75 Years and over | 37 (12.2%) | 59 (11.6%) |
| Total | 1,675 (33.1%) | 1,463 (29.5%) |
Income Above Poverty by Sex and Age in Telfair County
According to the poverty statistics in Telfair County, males aged 15 years and females aged 6 to 11 years are the age groups that are most secure financially, with 100.0% of males and 88.9% of females in these age groups living above the poverty line.
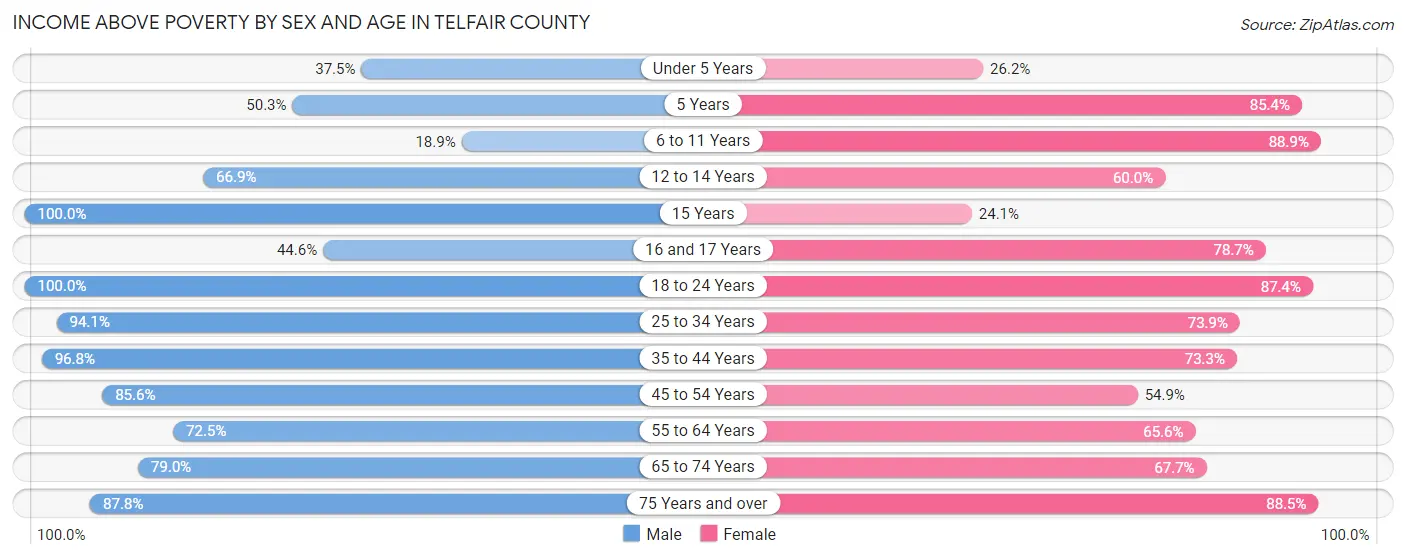
| Age Bracket | Male | Female |
| Under 5 Years | 90 (37.5%) | 53 (26.2%) |
| 5 Years | 85 (50.3%) | 35 (85.4%) |
| 6 to 11 Years | 205 (18.9%) | 392 (88.9%) |
| 12 to 14 Years | 119 (66.8%) | 99 (60.0%) |
| 15 Years | 28 (100.0%) | 21 (24.1%) |
| 16 and 17 Years | 58 (44.6%) | 129 (78.7%) |
| 18 to 24 Years | 324 (100.0%) | 368 (87.4%) |
| 25 to 34 Years | 428 (94.1%) | 294 (73.9%) |
| 35 to 44 Years | 426 (96.8%) | 434 (73.3%) |
| 45 to 54 Years | 528 (85.6%) | 335 (54.9%) |
| 55 to 64 Years | 397 (72.5%) | 462 (65.6%) |
| 65 to 74 Years | 424 (79.0%) | 421 (67.7%) |
| 75 Years and over | 267 (87.8%) | 452 (88.4%) |
| Total | 3,379 (66.9%) | 3,495 (70.5%) |
Income Below Poverty Among Married-Couple Families in Telfair County
The poverty statistics for married-couple families in Telfair County show that 10.2% or 137 of the total 1,349 families live below the poverty line. Families with 5 or more children have the highest poverty rate of 100.0%, comprising of 10 families. On the other hand, families with 1 or 2 children have the lowest poverty rate of 5.7%, which includes 16 families.
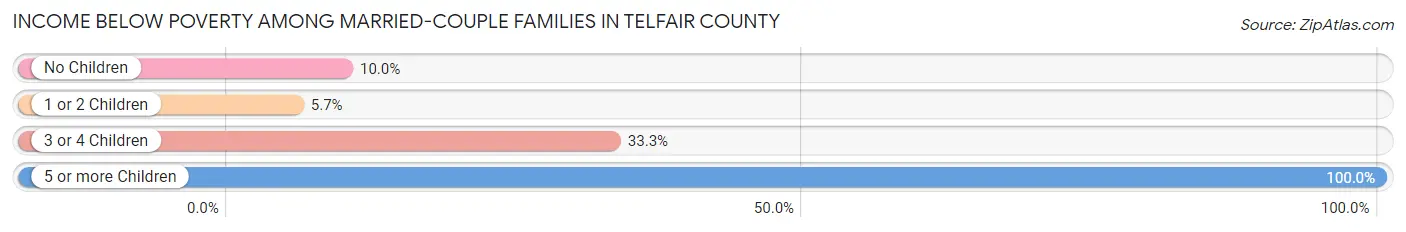
| Children | Above Poverty | Below Poverty |
| No Children | 935 (90.0%) | 104 (10.0%) |
| 1 or 2 Children | 263 (94.3%) | 16 (5.7%) |
| 3 or 4 Children | 14 (66.7%) | 7 (33.3%) |
| 5 or more Children | 0 (0.0%) | 10 (100.0%) |
| Total | 1,212 (89.8%) | 137 (10.2%) |
Income Below Poverty Among Single-Parent Households in Telfair County
According to the poverty data in Telfair County, 9.1% or 12 single-father households and 40.2% or 235 single-mother households are living below the poverty line. Among single-father households, those with 1 or 2 children have the highest poverty rate, with 12 households (25.5%) experiencing poverty. Likewise, among single-mother households, those with 3 or 4 children have the highest poverty rate, with 10 households (83.3%) falling below the poverty line.
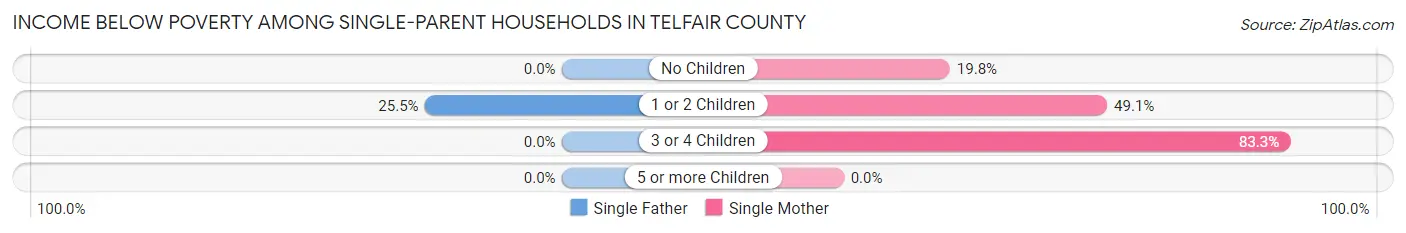
| Children | Single Father | Single Mother |
| No Children | 0 (0.0%) | 38 (19.8%) |
| 1 or 2 Children | 12 (25.5%) | 187 (49.1%) |
| 3 or 4 Children | 0 (0.0%) | 10 (83.3%) |
| 5 or more Children | 0 (0.0%) | 0 (0.0%) |
| Total | 12 (9.1%) | 235 (40.2%) |
Income Below Poverty Among Married-Couple vs Single-Parent Households in Telfair County
The poverty data for Telfair County shows that 137 of the married-couple family households (10.2%) and 247 of the single-parent households (34.4%) are living below the poverty level. Within the married-couple family households, those with 5 or more children have the highest poverty rate, with 10 households (100.0%) falling below the poverty line. Among the single-parent households, those with 3 or 4 children have the highest poverty rate, with 10 household (83.3%) living below poverty.
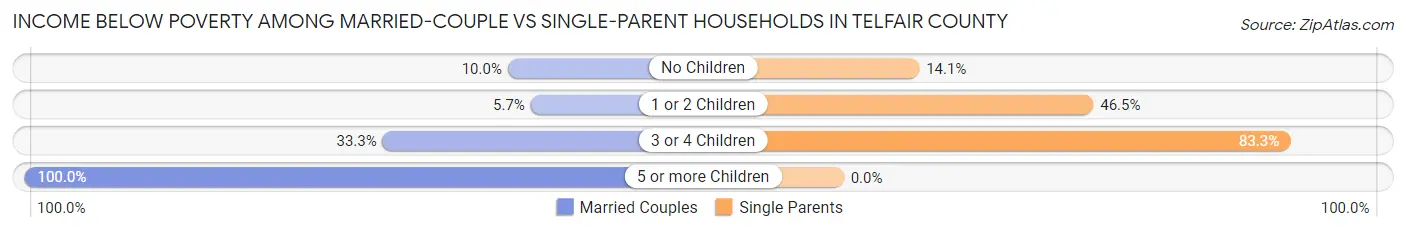
| Children | Married-Couple Families | Single-Parent Households |
| No Children | 104 (10.0%) | 38 (14.1%) |
| 1 or 2 Children | 16 (5.7%) | 199 (46.5%) |
| 3 or 4 Children | 7 (33.3%) | 10 (83.3%) |
| 5 or more Children | 10 (100.0%) | 0 (0.0%) |
| Total | 137 (10.2%) | 247 (34.4%) |
Race in Telfair County
The most populous races in Telfair County are White / Caucasian (6,462 | 51.2%), Black / African American (4,427 | 35.1%), and Hispanic or Latino (2,194 | 17.4%).
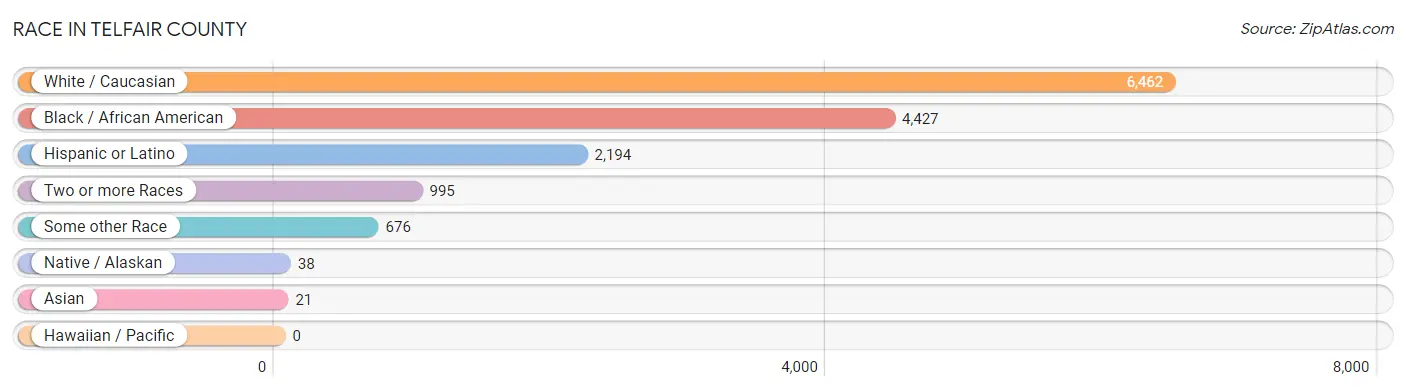
| Race | # Population | % Population |
| Asian | 21 | 0.2% |
| Black / African American | 4,427 | 35.1% |
| Hawaiian / Pacific | 0 | 0.0% |
| Hispanic or Latino | 2,194 | 17.4% |
| Native / Alaskan | 38 | 0.3% |
| White / Caucasian | 6,462 | 51.2% |
| Two or more Races | 995 | 7.9% |
| Some other Race | 676 | 5.4% |
| Total | 12,619 | 100.0% |
Ancestry in Telfair County
The most populous ancestries reported in Telfair County are Mexican (1,725 | 13.7%), Scotch-Irish (901 | 7.1%), American (729 | 5.8%), English (495 | 3.9%), and Irish (225 | 1.8%), together accounting for 32.3% of all Telfair County residents.
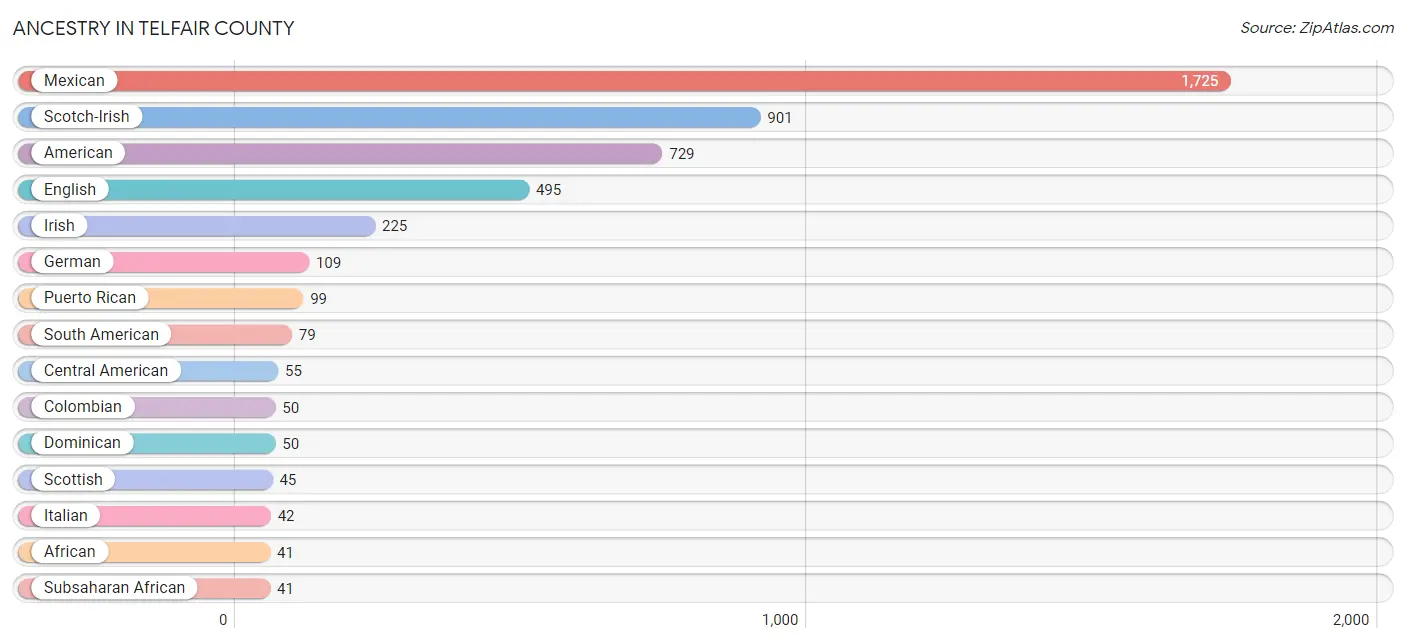
| Ancestry | # Population | % Population |
| African | 41 | 0.3% |
| American | 729 | 5.8% |
| Apache | 9 | 0.1% |
| Bahamian | 9 | 0.1% |
| Burmese | 4 | 0.0% |
| Canadian | 9 | 0.1% |
| Central American | 55 | 0.4% |
| Cherokee | 23 | 0.2% |
| Colombian | 50 | 0.4% |
| Cuban | 37 | 0.3% |
| Dominican | 50 | 0.4% |
| Eastern European | 5 | 0.0% |
| Ecuadorian | 18 | 0.1% |
| English | 495 | 3.9% |
| French | 30 | 0.2% |
| German | 109 | 0.9% |
| Guatemalan | 24 | 0.2% |
| Haitian | 10 | 0.1% |
| Honduran | 3 | 0.0% |
| Irish | 225 | 1.8% |
| Italian | 42 | 0.3% |
| Korean | 9 | 0.1% |
| Mexican | 1,725 | 13.7% |
| Nicaraguan | 15 | 0.1% |
| Norwegian | 3 | 0.0% |
| Panamanian | 9 | 0.1% |
| Polish | 8 | 0.1% |
| Puerto Rican | 99 | 0.8% |
| Salvadoran | 4 | 0.0% |
| Scotch-Irish | 901 | 7.1% |
| Scottish | 45 | 0.4% |
| Sioux | 4 | 0.0% |
| South American | 79 | 0.6% |
| Spaniard | 17 | 0.1% |
| Subsaharan African | 41 | 0.3% |
| Swedish | 7 | 0.1% |
| Venezuelan | 11 | 0.1% | View All 37 Rows |
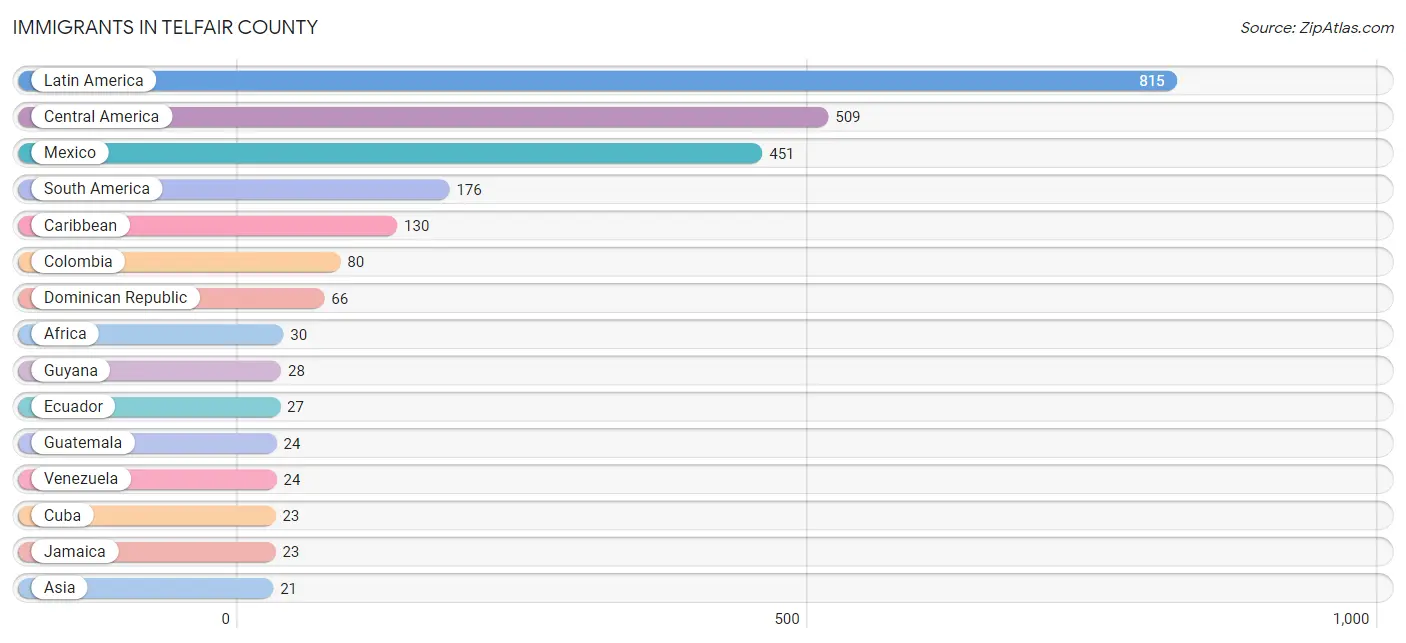
Immigrants in Telfair County
The most numerous immigrant groups reported in Telfair County came from Latin America (815 | 6.5%), Central America (509 | 4.0%), Mexico (451 | 3.6%), South America (176 | 1.4%), and Caribbean (130 | 1.0%), together accounting for 16.5% of all Telfair County residents.
| Immigration Origin | # Population | % Population |
| Africa | 30 | 0.2% |
| Argentina | 17 | 0.1% |
| Asia | 21 | 0.2% |
| Bahamas | 18 | 0.1% |
| Caribbean | 130 | 1.0% |
| Central America | 509 | 4.0% |
| Colombia | 80 | 0.6% |
| Cuba | 23 | 0.2% |
| Dominican Republic | 66 | 0.5% |
| Eastern Asia | 4 | 0.0% |
| Eastern Europe | 11 | 0.1% |
| Ecuador | 27 | 0.2% |
| Europe | 12 | 0.1% |
| Guatemala | 24 | 0.2% |
| Guyana | 28 | 0.2% |
| Honduras | 19 | 0.2% |
| Hungary | 11 | 0.1% |
| Israel | 9 | 0.1% |
| Jamaica | 23 | 0.2% |
| Korea | 4 | 0.0% |
| Latin America | 815 | 6.5% |
| Mexico | 451 | 3.6% |
| Nicaragua | 15 | 0.1% |
| Nigeria | 9 | 0.1% |
| Northern Europe | 1 | 0.0% |
| Oceania | 9 | 0.1% |
| South Africa | 12 | 0.1% |
| South America | 176 | 1.4% |
| South Eastern Asia | 8 | 0.1% |
| Venezuela | 24 | 0.2% |
| Vietnam | 8 | 0.1% |
| Western Africa | 9 | 0.1% |
| Western Asia | 9 | 0.1% | View All 33 Rows |
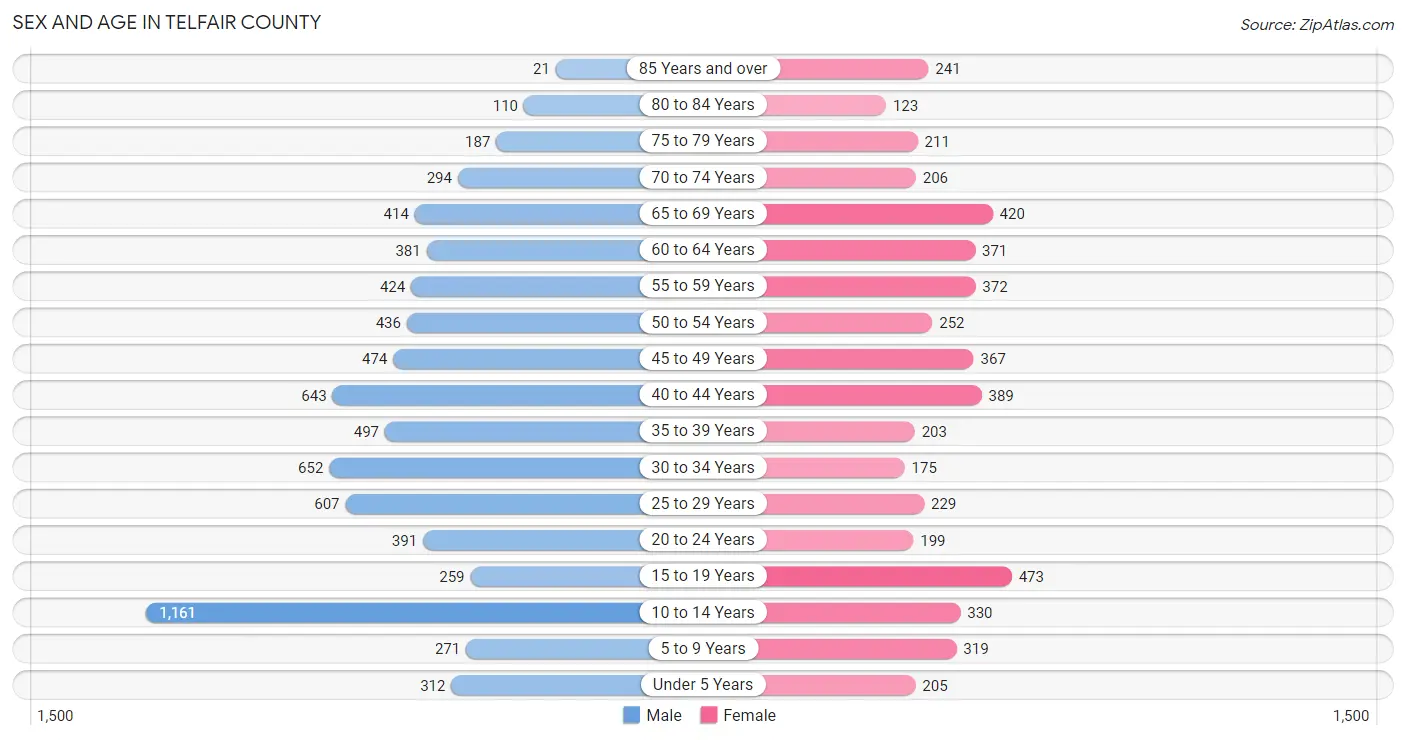
Sex and Age in Telfair County
Sex and Age in Telfair County
The most populous age groups in Telfair County are 10 to 14 Years (1,161 | 15.4%) for men and 15 to 19 Years (473 | 9.3%) for women.
| Age Bracket | Male | Female |
| Under 5 Years | 312 (4.1%) | 205 (4.0%) |
| 5 to 9 Years | 271 (3.6%) | 319 (6.3%) |
| 10 to 14 Years | 1,161 (15.4%) | 330 (6.5%) |
| 15 to 19 Years | 259 (3.4%) | 473 (9.3%) |
| 20 to 24 Years | 391 (5.2%) | 199 (3.9%) |
| 25 to 29 Years | 607 (8.1%) | 229 (4.5%) |
| 30 to 34 Years | 652 (8.6%) | 175 (3.4%) |
| 35 to 39 Years | 497 (6.6%) | 203 (4.0%) |
| 40 to 44 Years | 643 (8.5%) | 389 (7.6%) |
| 45 to 49 Years | 474 (6.3%) | 367 (7.2%) |
| 50 to 54 Years | 436 (5.8%) | 252 (5.0%) |
| 55 to 59 Years | 424 (5.6%) | 372 (7.3%) |
| 60 to 64 Years | 381 (5.1%) | 371 (7.3%) |
| 65 to 69 Years | 414 (5.5%) | 420 (8.3%) |
| 70 to 74 Years | 294 (3.9%) | 206 (4.1%) |
| 75 to 79 Years | 187 (2.5%) | 211 (4.2%) |
| 80 to 84 Years | 110 (1.5%) | 123 (2.4%) |
| 85 Years and over | 21 (0.3%) | 241 (4.7%) |
| Total | 7,534 (100.0%) | 5,085 (100.0%) |
Families and Households in Telfair County
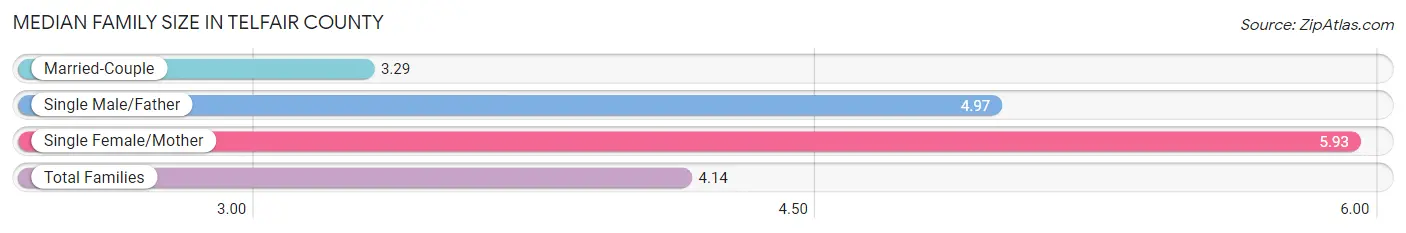
Median Family Size in Telfair County
The median family size in Telfair County is 4.14 persons per family, with single female/mother families (585 | 28.3%) accounting for the largest median family size of 5.93 persons per family. On the other hand, married-couple families (1,349 | 65.3%) represent the smallest median family size with 3.29 persons per family.
| Family Type | # Families | Family Size |
| Married-Couple | 1,349 (65.3%) | 3.29 |
| Single Male/Father | 132 (6.4%) | 4.97 |
| Single Female/Mother | 585 (28.3%) | 5.93 |
| Total Families | 2,066 (100.0%) | 4.14 |
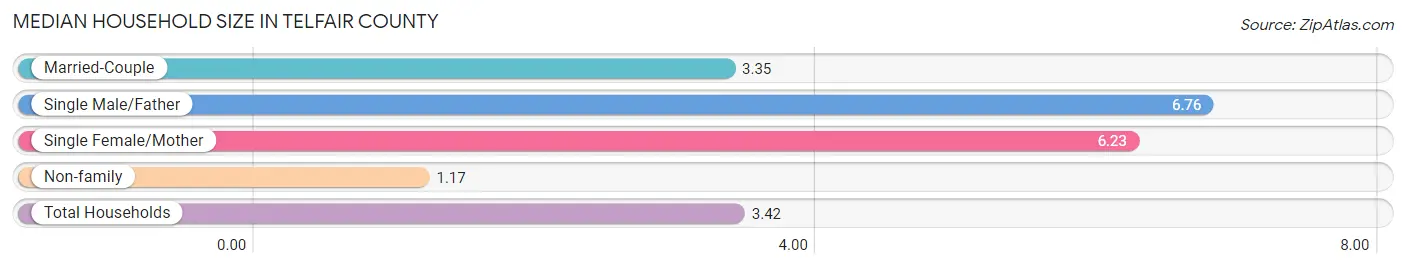
Median Household Size in Telfair County
The median household size in Telfair County is 3.42 persons per household, with single male/father households (132 | 4.5%) accounting for the largest median household size of 6.76 persons per household. non-family households (882 | 29.9%) represent the smallest median household size with 1.17 persons per household.
| Household Type | # Households | Household Size |
| Married-Couple | 1,349 (45.8%) | 3.35 |
| Single Male/Father | 132 (4.5%) | 6.76 |
| Single Female/Mother | 585 (19.8%) | 6.23 |
| Non-family | 882 (29.9%) | 1.17 |
| Total Households | 2,948 (100.0%) | 3.42 |
Household Size by Marriage Status in Telfair County
Out of a total of 2,948 households in Telfair County, 2,066 (70.1%) are family households, while 882 (29.9%) are nonfamily households. The most numerous type of family households are 2-person households, comprising 1,117, and the most common type of nonfamily households are 1-person households, comprising 803.
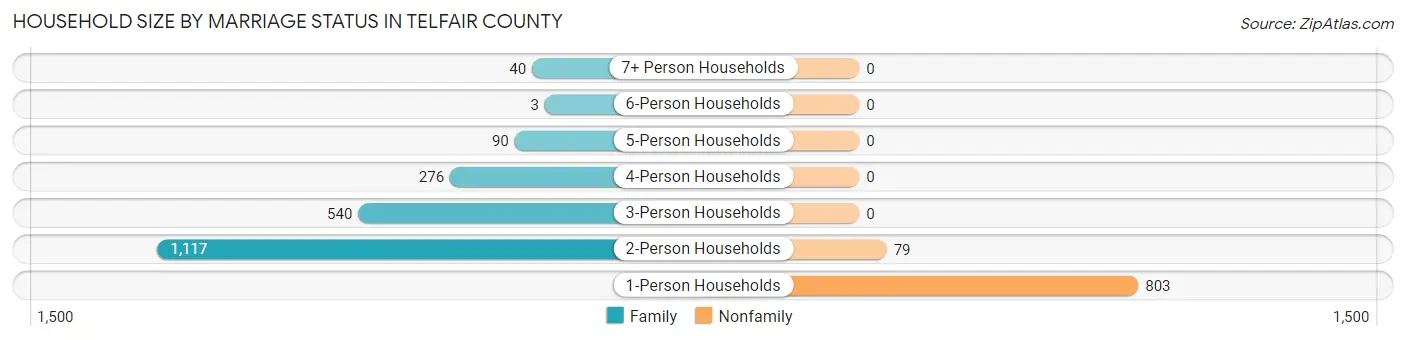
| Household Size | Family Households | Nonfamily Households |
| 1-Person Households | - | 803 (27.2%) |
| 2-Person Households | 1,117 (37.9%) | 79 (2.7%) |
| 3-Person Households | 540 (18.3%) | 0 (0.0%) |
| 4-Person Households | 276 (9.4%) | 0 (0.0%) |
| 5-Person Households | 90 (3.0%) | 0 (0.0%) |
| 6-Person Households | 3 (0.1%) | 0 (0.0%) |
| 7+ Person Households | 40 (1.4%) | 0 (0.0%) |
| Total | 2,066 (70.1%) | 882 (29.9%) |
Female Fertility in Telfair County
Fertility by Age in Telfair County
Average fertility rate in Telfair County is 21.0 births per 1,000 women. Women in the age bracket of 20 to 34 years have the highest fertility rate with 58.0 births per 1,000 women. Women in the age bracket of 20 to 34 years acount for 77.8% of all women with births.
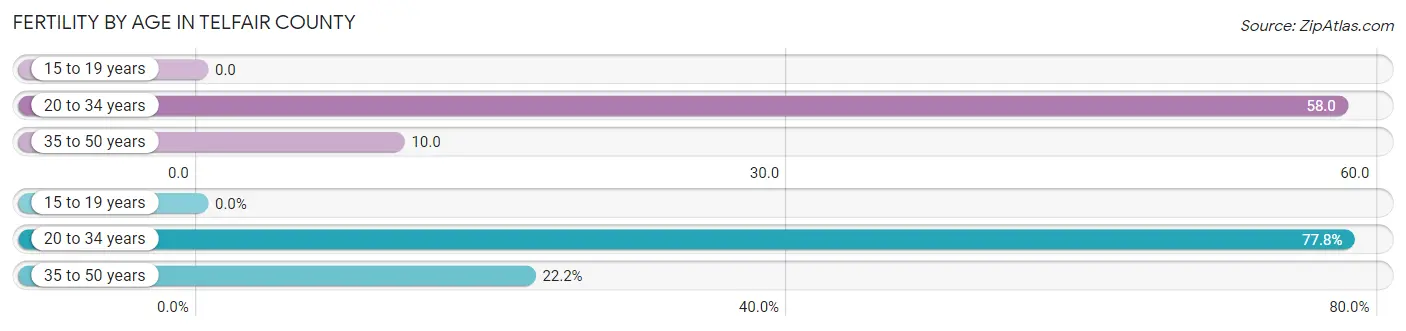
| Age Bracket | Women with Births | Births / 1,000 Women |
| 15 to 19 years | 0 (0.0%) | 0.0 |
| 20 to 34 years | 35 (77.8%) | 58.0 |
| 35 to 50 years | 10 (22.2%) | 10.0 |
| Total | 45 (100.0%) | 21.0 |
Fertility by Age by Marriage Status in Telfair County
40.0% of women with births (45) in Telfair County are married. The highest percentage of unmarried women with births falls into 20 to 34 years age bracket with 77.1% of them unmarried at the time of birth, while the lowest percentage of unmarried women with births belong to 35 to 50 years age bracket with 0.0% of them unmarried.
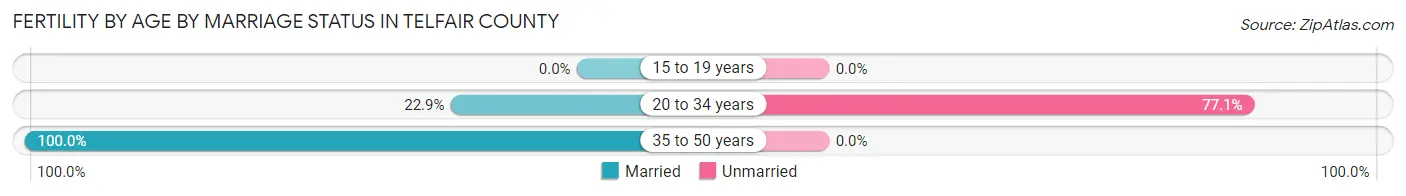
| Age Bracket | Married | Unmarried |
| 15 to 19 years | 0 (0.0%) | 0 (0.0%) |
| 20 to 34 years | 8 (22.9%) | 27 (77.1%) |
| 35 to 50 years | 10 (100.0%) | 0 (0.0%) |
| Total | 18 (40.0%) | 27 (60.0%) |
Fertility by Education in Telfair County
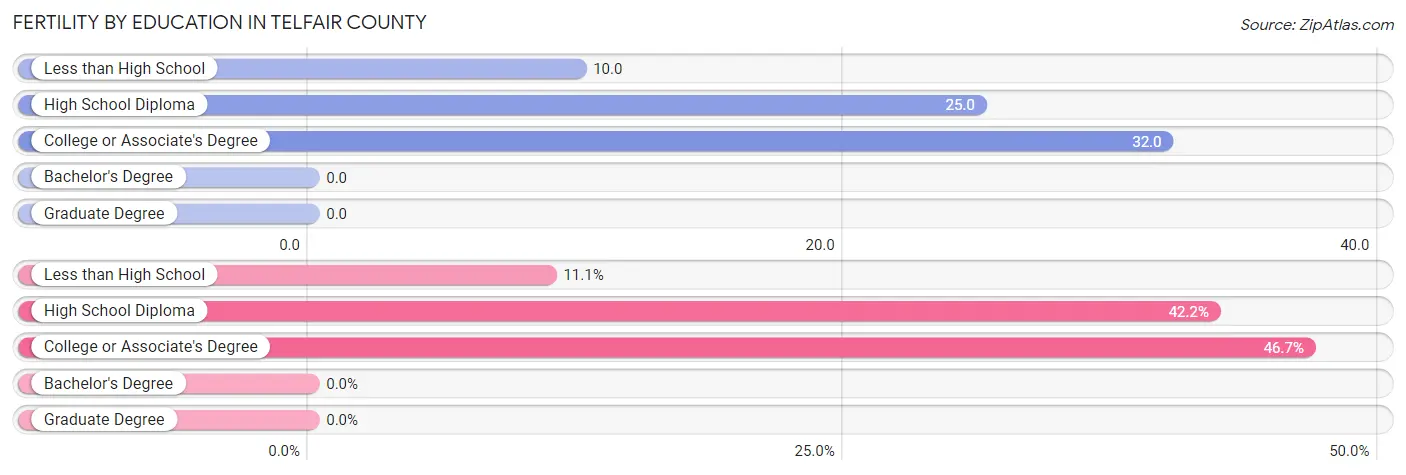
| Educational Attainment | Women with Births | Births / 1,000 Women |
| Less than High School | 5 (11.1%) | 10.0 |
| High School Diploma | 19 (42.2%) | 25.0 |
| College or Associate's Degree | 21 (46.7%) | 32.0 |
| Bachelor's Degree | 0 (0.0%) | 0.0 |
| Graduate Degree | 0 (0.0%) | 0.0 |
| Total | 45 (100.0%) | 21.0 |
Fertility by Education by Marriage Status in Telfair County
60.0% of women with births in Telfair County are unmarried. Women with the educational attainment of college or associate's degree are most likely to be married with 52.4% of them married at childbirth, while women with the educational attainment of less than high school are least likely to be married with 100.0% of them unmarried at childbirth.
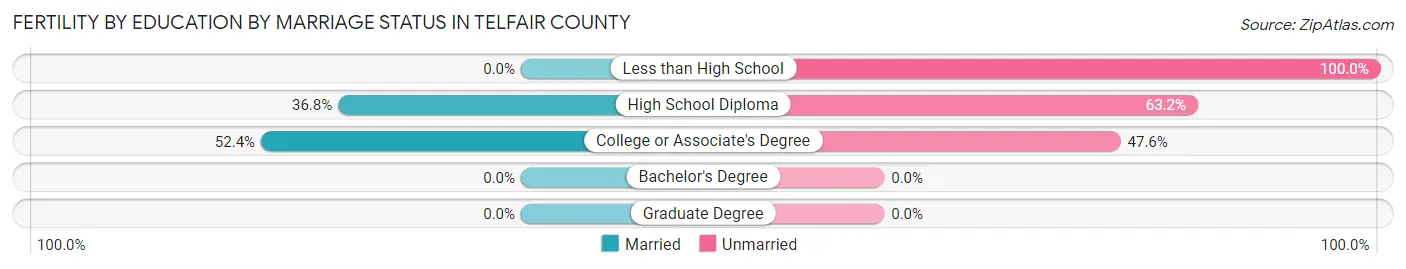
| Educational Attainment | Married | Unmarried |
| Less than High School | 0 (0.0%) | 5 (100.0%) |
| High School Diploma | 7 (36.8%) | 12 (63.2%) |
| College or Associate's Degree | 11 (52.4%) | 10 (47.6%) |
| Bachelor's Degree | 0 (0.0%) | 0 (0.0%) |
| Graduate Degree | 0 (0.0%) | 0 (0.0%) |
| Total | 18 (40.0%) | 27 (60.0%) |
Employment Characteristics in Telfair County
Employment by Class of Employer in Telfair County
Among the 3,676 employed individuals in Telfair County, private company employees (2,194 | 59.7%), not-for-profit organizations (560 | 15.2%), and self-employed (not incorporated) (313 | 8.5%) make up the most common classes of employment.
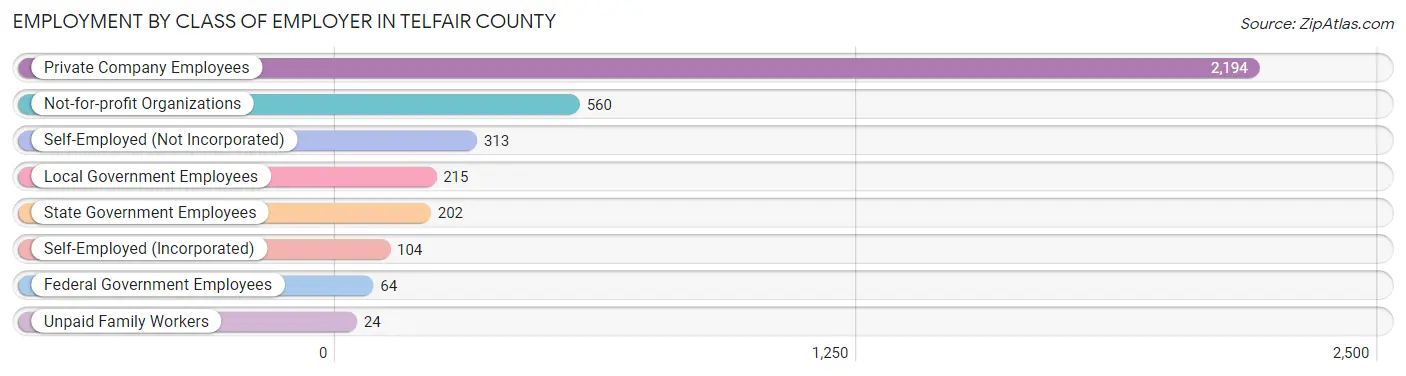
| Employer Class | # Employees | % Employees |
| Private Company Employees | 2,194 | 59.7% |
| Self-Employed (Incorporated) | 104 | 2.8% |
| Self-Employed (Not Incorporated) | 313 | 8.5% |
| Not-for-profit Organizations | 560 | 15.2% |
| Local Government Employees | 215 | 5.9% |
| State Government Employees | 202 | 5.5% |
| Federal Government Employees | 64 | 1.7% |
| Unpaid Family Workers | 24 | 0.6% |
| Total | 3,676 | 100.0% |
Employment Status by Age in Telfair County
According to the labor force statistics for Telfair County, out of the total population over 16 years of age (9,906), 38.3% or 3,794 individuals are in the labor force, with 2.1% or 80 of them unemployed. The age group with the highest labor force participation rate is 20 to 24 years, with 55.1% or 325 individuals in the labor force. Within the labor force, the 25 to 29 years age range has the highest percentage of unemployed individuals, with 8.9% or 34 of them being unemployed.
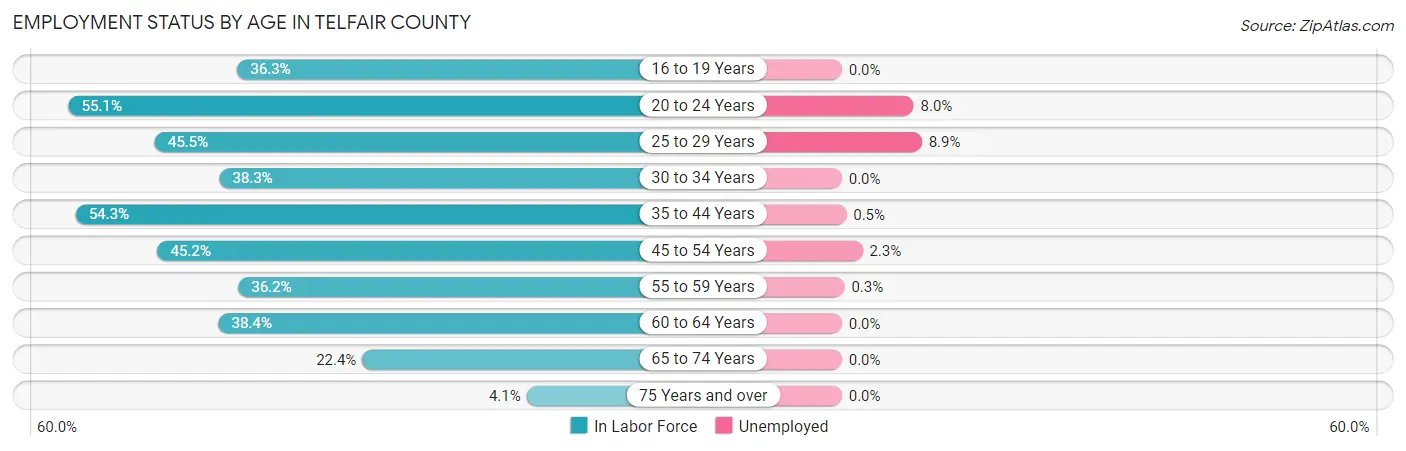
| Age Bracket | In Labor Force | Unemployed |
| 16 to 19 Years | 224 (36.3%) | 0 (0.0%) |
| 20 to 24 Years | 325 (55.1%) | 26 (8.0%) |
| 25 to 29 Years | 380 (45.5%) | 34 (8.9%) |
| 30 to 34 Years | 317 (38.3%) | 0 (0.0%) |
| 35 to 44 Years | 940 (54.3%) | 5 (0.5%) |
| 45 to 54 Years | 691 (45.2%) | 16 (2.3%) |
| 55 to 59 Years | 288 (36.2%) | 1 (0.3%) |
| 60 to 64 Years | 289 (38.4%) | 0 (0.0%) |
| 65 to 74 Years | 299 (22.4%) | 0 (0.0%) |
| 75 Years and over | 37 (4.1%) | 0 (0.0%) |
| Total | 3,794 (38.3%) | 80 (2.1%) |
Employment Status by Educational Attainment in Telfair County
According to labor force statistics for Telfair County, 44.9% of individuals (2,906) out of the total population between 25 and 64 years of age (6,472) are in the labor force, with 1.9% or 55 of them being unemployed. The group with the highest labor force participation rate are those with the educational attainment of bachelor's degree or higher, with 77.6% or 336 individuals in the labor force. Within the labor force, individuals with high school diploma education have the highest percentage of unemployment, with 2.6% or 35 of them being unemployed.
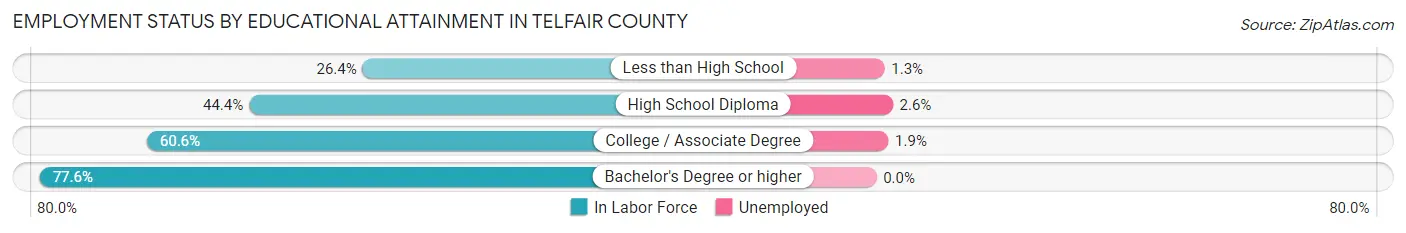
| Educational Attainment | In Labor Force | Unemployed |
| Less than High School | 463 (26.4%) | 23 (1.3%) |
| High School Diploma | 1,344 (44.4%) | 79 (2.6%) |
| College / Associate Degree | 762 (60.6%) | 24 (1.9%) |
| Bachelor's Degree or higher | 336 (77.6%) | 0 (0.0%) |
| Total | 2,906 (44.9%) | 123 (1.9%) |
Employment Occupations by Sex in Telfair County
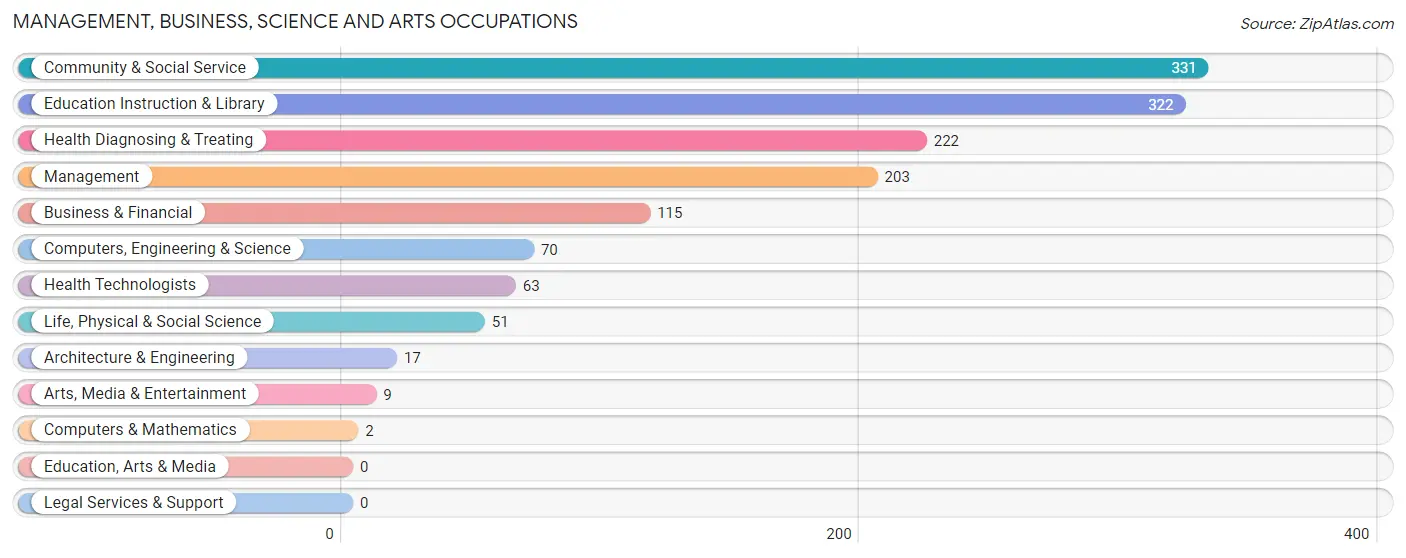
Management, Business, Science and Arts Occupations
The most common Management, Business, Science and Arts occupations in Telfair County are Community & Social Service (331 | 8.9%), Education Instruction & Library (322 | 8.7%), Health Diagnosing & Treating (222 | 6.0%), Management (203 | 5.5%), and Business & Financial (115 | 3.1%).
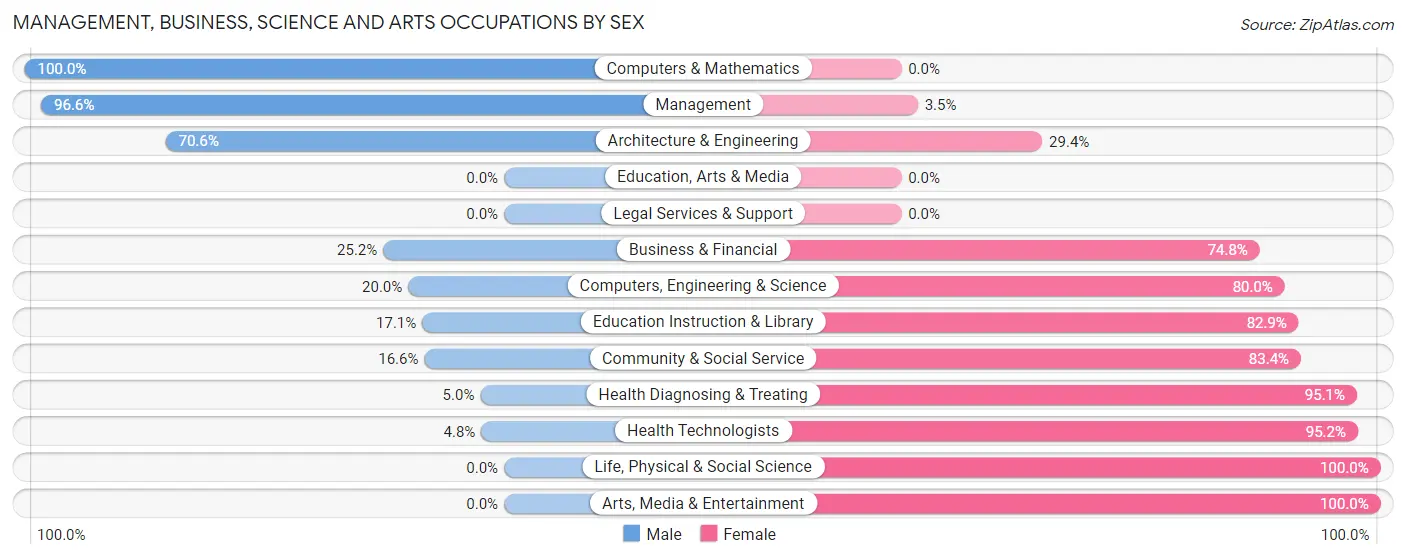
Management, Business, Science and Arts Occupations by Sex
Within the Management, Business, Science and Arts occupations in Telfair County, the most male-oriented occupations are Computers & Mathematics (100.0%), Management (96.6%), and Architecture & Engineering (70.6%), while the most female-oriented occupations are Life, Physical & Social Science (100.0%), Arts, Media & Entertainment (100.0%), and Health Technologists (95.2%).
| Occupation | Male | Female |
| Management | 196 (96.6%) | 7 (3.5%) |
| Business & Financial | 29 (25.2%) | 86 (74.8%) |
| Computers, Engineering & Science | 14 (20.0%) | 56 (80.0%) |
| Computers & Mathematics | 2 (100.0%) | 0 (0.0%) |
| Architecture & Engineering | 12 (70.6%) | 5 (29.4%) |
| Life, Physical & Social Science | 0 (0.0%) | 51 (100.0%) |
| Community & Social Service | 55 (16.6%) | 276 (83.4%) |
| Education, Arts & Media | 0 (0.0%) | 0 (0.0%) |
| Legal Services & Support | 0 (0.0%) | 0 (0.0%) |
| Education Instruction & Library | 55 (17.1%) | 267 (82.9%) |
| Arts, Media & Entertainment | 0 (0.0%) | 9 (100.0%) |
| Health Diagnosing & Treating | 11 (5.0%) | 211 (95.1%) |
| Health Technologists | 3 (4.8%) | 60 (95.2%) |
| Total (Category) | 305 (32.4%) | 636 (67.6%) |
| Total (Overall) | 2,082 (56.3%) | 1,616 (43.7%) |
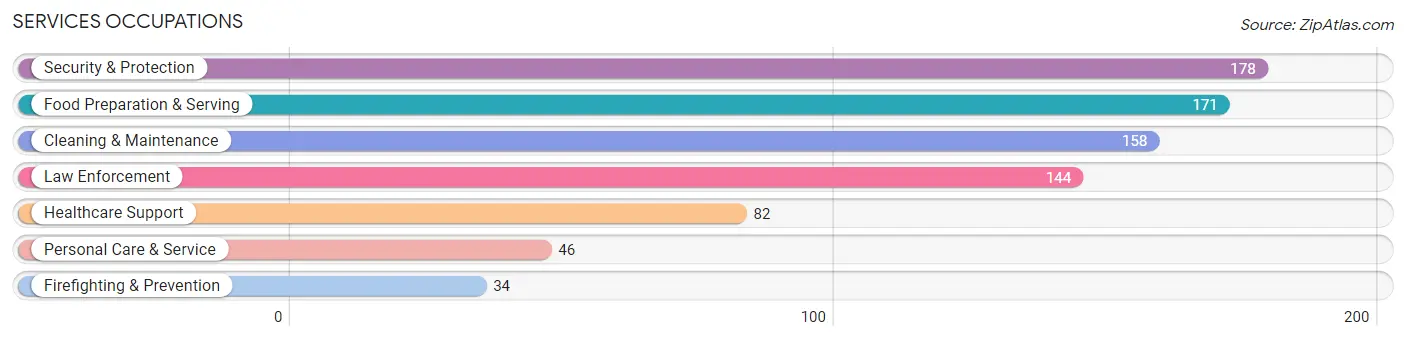
Services Occupations
The most common Services occupations in Telfair County are Security & Protection (178 | 4.8%), Food Preparation & Serving (171 | 4.6%), Cleaning & Maintenance (158 | 4.3%), Law Enforcement (144 | 3.9%), and Healthcare Support (82 | 2.2%).
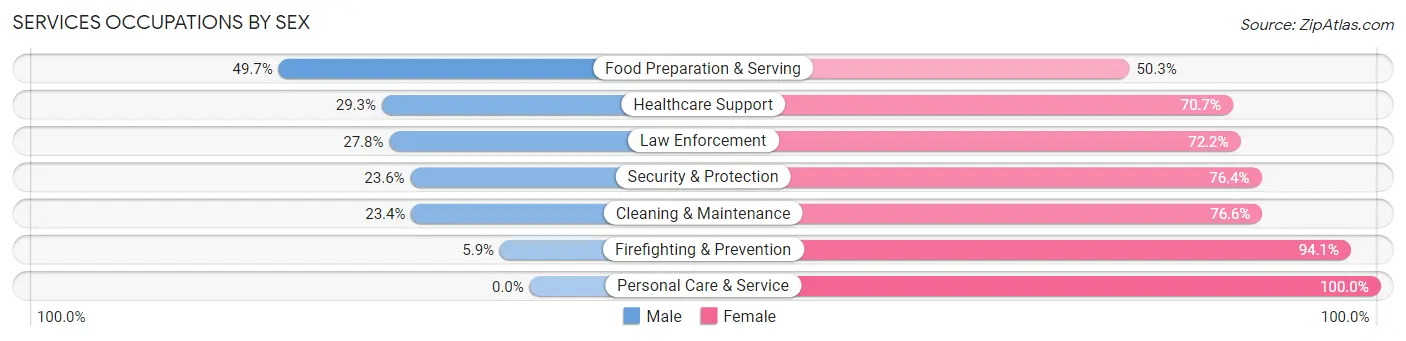
Services Occupations by Sex
Within the Services occupations in Telfair County, the most male-oriented occupations are Food Preparation & Serving (49.7%), Healthcare Support (29.3%), and Law Enforcement (27.8%), while the most female-oriented occupations are Personal Care & Service (100.0%), Firefighting & Prevention (94.1%), and Cleaning & Maintenance (76.6%).
| Occupation | Male | Female |
| Healthcare Support | 24 (29.3%) | 58 (70.7%) |
| Security & Protection | 42 (23.6%) | 136 (76.4%) |
| Firefighting & Prevention | 2 (5.9%) | 32 (94.1%) |
| Law Enforcement | 40 (27.8%) | 104 (72.2%) |
| Food Preparation & Serving | 85 (49.7%) | 86 (50.3%) |
| Cleaning & Maintenance | 37 (23.4%) | 121 (76.6%) |
| Personal Care & Service | 0 (0.0%) | 46 (100.0%) |
| Total (Category) | 188 (29.6%) | 447 (70.4%) |
| Total (Overall) | 2,082 (56.3%) | 1,616 (43.7%) |
Sales and Office Occupations
The most common Sales and Office occupations in Telfair County are Sales & Related (432 | 11.7%), and Office & Administration (170 | 4.6%).
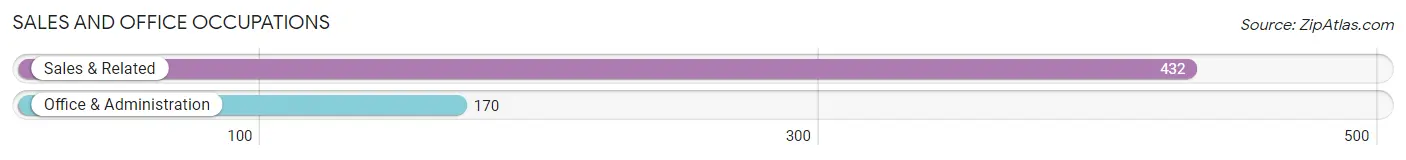
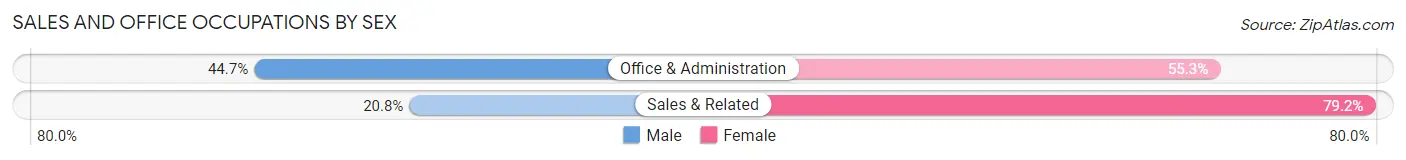
Sales and Office Occupations by Sex
| Occupation | Male | Female |
| Sales & Related | 90 (20.8%) | 342 (79.2%) |
| Office & Administration | 76 (44.7%) | 94 (55.3%) |
| Total (Category) | 166 (27.6%) | 436 (72.4%) |
| Total (Overall) | 2,082 (56.3%) | 1,616 (43.7%) |
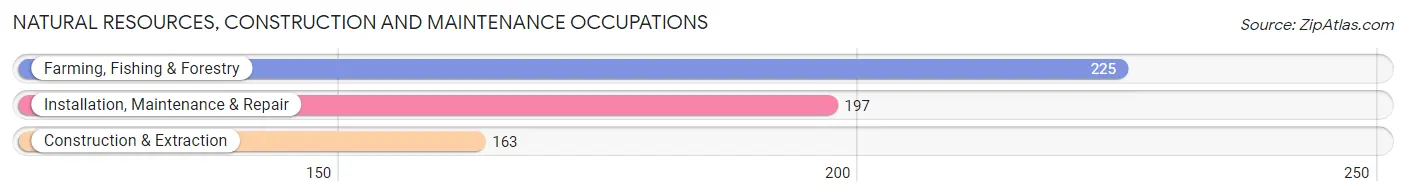
Natural Resources, Construction and Maintenance Occupations
The most common Natural Resources, Construction and Maintenance occupations in Telfair County are Farming, Fishing & Forestry (225 | 6.1%), Installation, Maintenance & Repair (197 | 5.3%), and Construction & Extraction (163 | 4.4%).
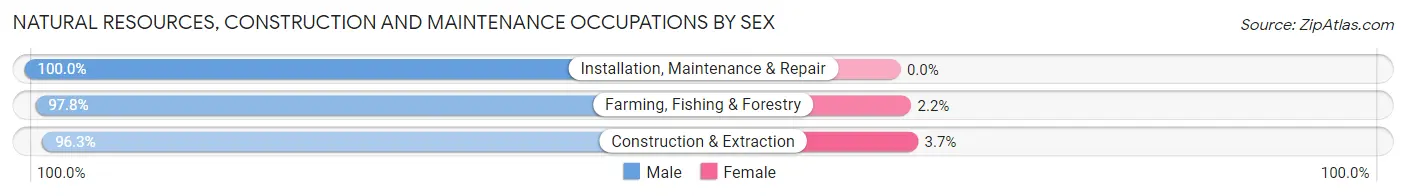
Natural Resources, Construction and Maintenance Occupations by Sex
| Occupation | Male | Female |
| Farming, Fishing & Forestry | 220 (97.8%) | 5 (2.2%) |
| Construction & Extraction | 157 (96.3%) | 6 (3.7%) |
| Installation, Maintenance & Repair | 197 (100.0%) | 0 (0.0%) |
| Total (Category) | 574 (98.1%) | 11 (1.9%) |
| Total (Overall) | 2,082 (56.3%) | 1,616 (43.7%) |
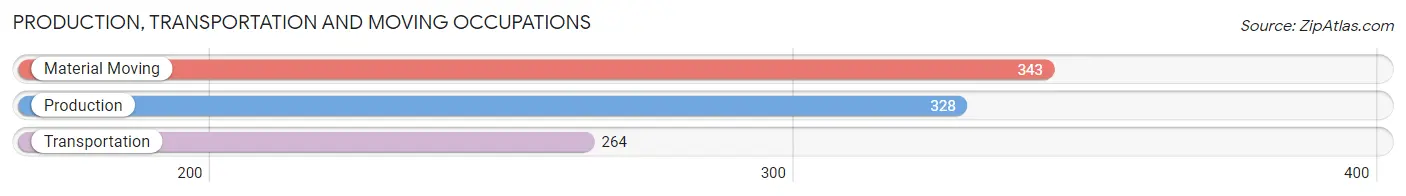
Production, Transportation and Moving Occupations
The most common Production, Transportation and Moving occupations in Telfair County are Material Moving (343 | 9.3%), Production (328 | 8.9%), and Transportation (264 | 7.1%).
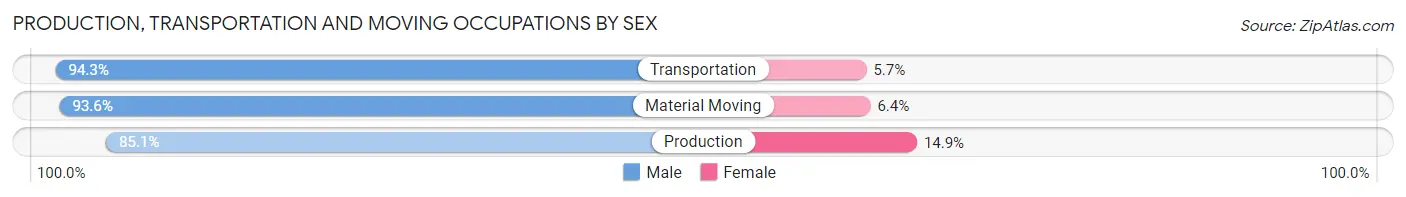
Production, Transportation and Moving Occupations by Sex
| Occupation | Male | Female |
| Production | 279 (85.1%) | 49 (14.9%) |
| Transportation | 249 (94.3%) | 15 (5.7%) |
| Material Moving | 321 (93.6%) | 22 (6.4%) |
| Total (Category) | 849 (90.8%) | 86 (9.2%) |
| Total (Overall) | 2,082 (56.3%) | 1,616 (43.7%) |
Employment Industries by Sex in Telfair County
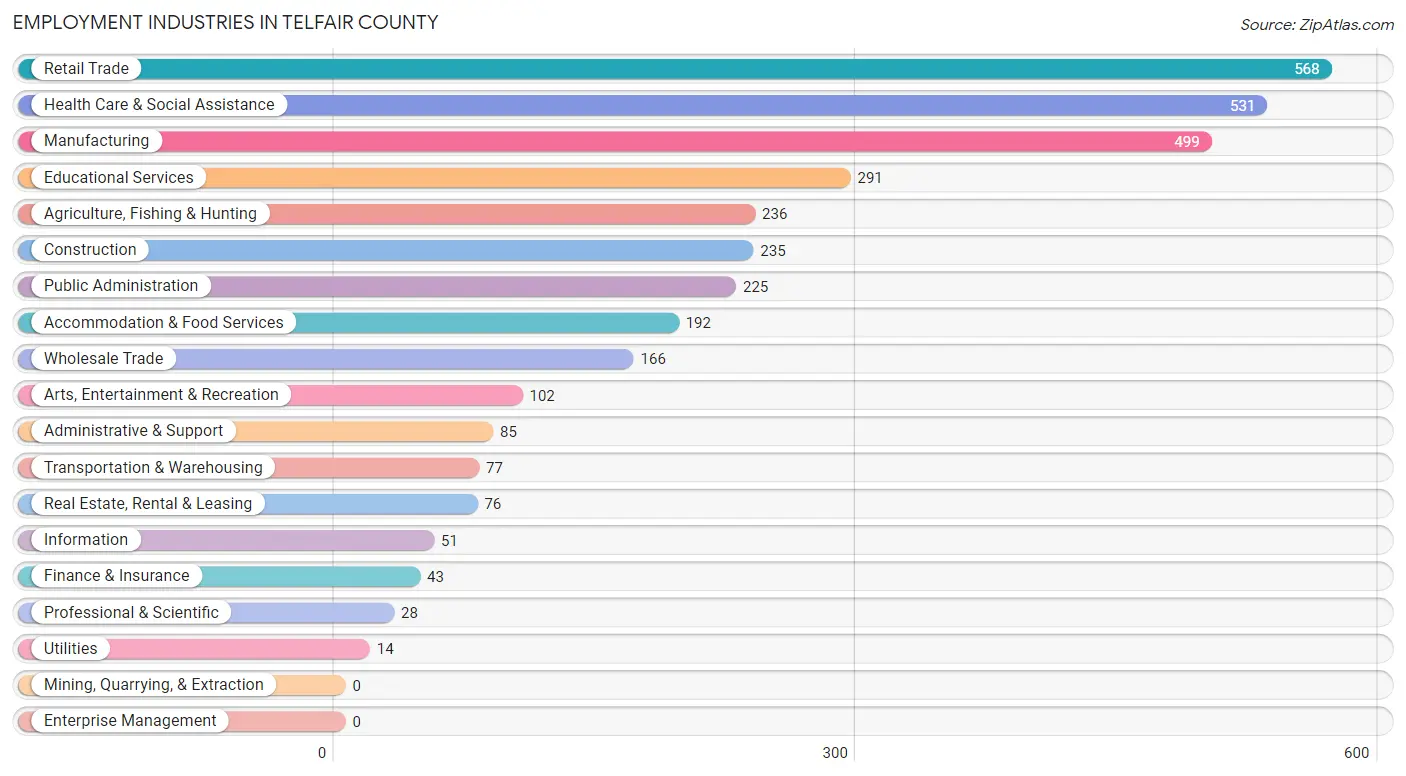
Employment Industries in Telfair County
The major employment industries in Telfair County include Retail Trade (568 | 15.4%), Health Care & Social Assistance (531 | 14.4%), Manufacturing (499 | 13.5%), Educational Services (291 | 7.9%), and Agriculture, Fishing & Hunting (236 | 6.4%).
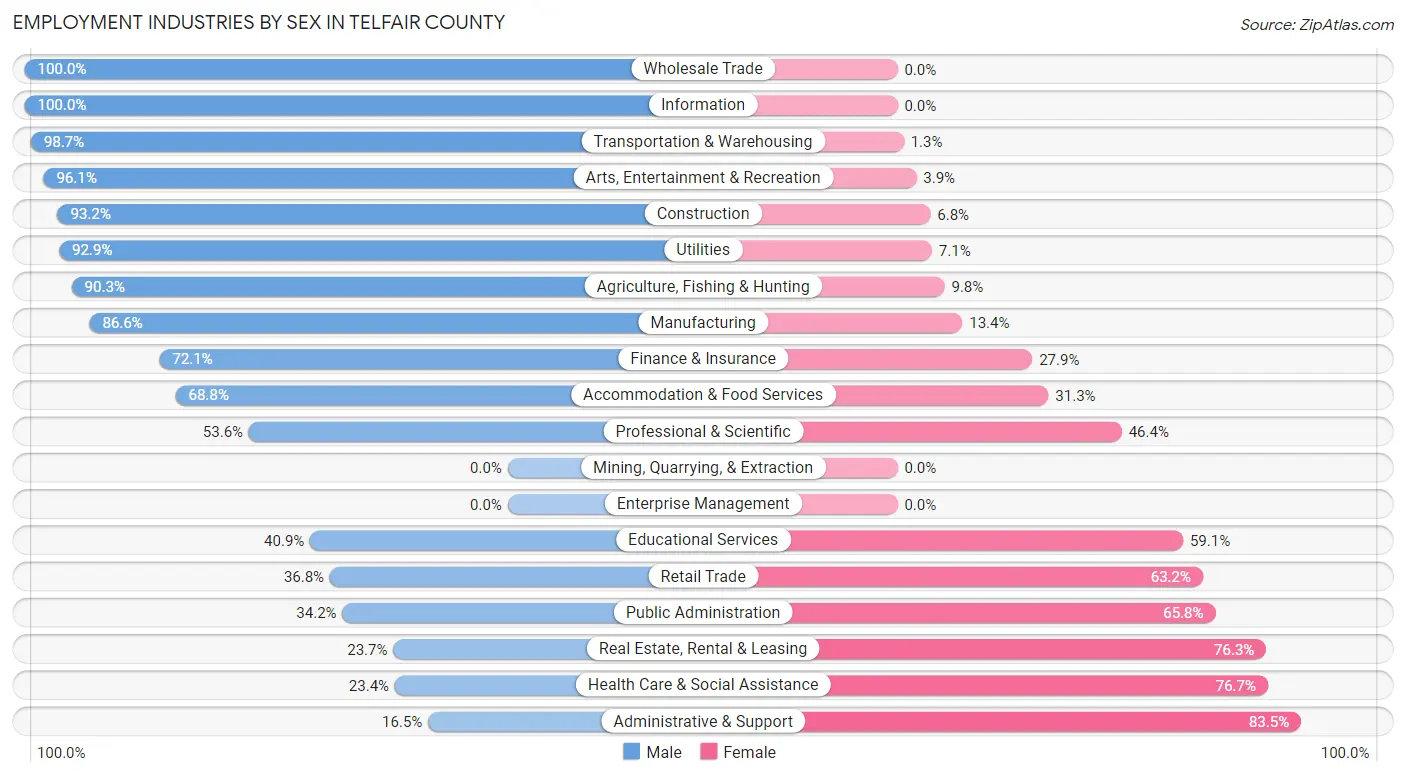
Employment Industries by Sex in Telfair County
The Telfair County industries that see more men than women are Wholesale Trade (100.0%), Information (100.0%), and Transportation & Warehousing (98.7%), whereas the industries that tend to have a higher number of women are Administrative & Support (83.5%), Health Care & Social Assistance (76.6%), and Real Estate, Rental & Leasing (76.3%).
| Industry | Male | Female |
| Agriculture, Fishing & Hunting | 213 (90.2%) | 23 (9.8%) |
| Mining, Quarrying, & Extraction | 0 (0.0%) | 0 (0.0%) |
| Construction | 219 (93.2%) | 16 (6.8%) |
| Manufacturing | 432 (86.6%) | 67 (13.4%) |
| Wholesale Trade | 166 (100.0%) | 0 (0.0%) |
| Retail Trade | 209 (36.8%) | 359 (63.2%) |
| Transportation & Warehousing | 76 (98.7%) | 1 (1.3%) |
| Utilities | 13 (92.9%) | 1 (7.1%) |
| Information | 51 (100.0%) | 0 (0.0%) |
| Finance & Insurance | 31 (72.1%) | 12 (27.9%) |
| Real Estate, Rental & Leasing | 18 (23.7%) | 58 (76.3%) |
| Professional & Scientific | 15 (53.6%) | 13 (46.4%) |
| Enterprise Management | 0 (0.0%) | 0 (0.0%) |
| Administrative & Support | 14 (16.5%) | 71 (83.5%) |
| Educational Services | 119 (40.9%) | 172 (59.1%) |
| Health Care & Social Assistance | 124 (23.4%) | 407 (76.6%) |
| Arts, Entertainment & Recreation | 98 (96.1%) | 4 (3.9%) |
| Accommodation & Food Services | 132 (68.8%) | 60 (31.2%) |
| Public Administration | 77 (34.2%) | 148 (65.8%) |
| Total | 2,082 (56.3%) | 1,616 (43.7%) |
Education in Telfair County
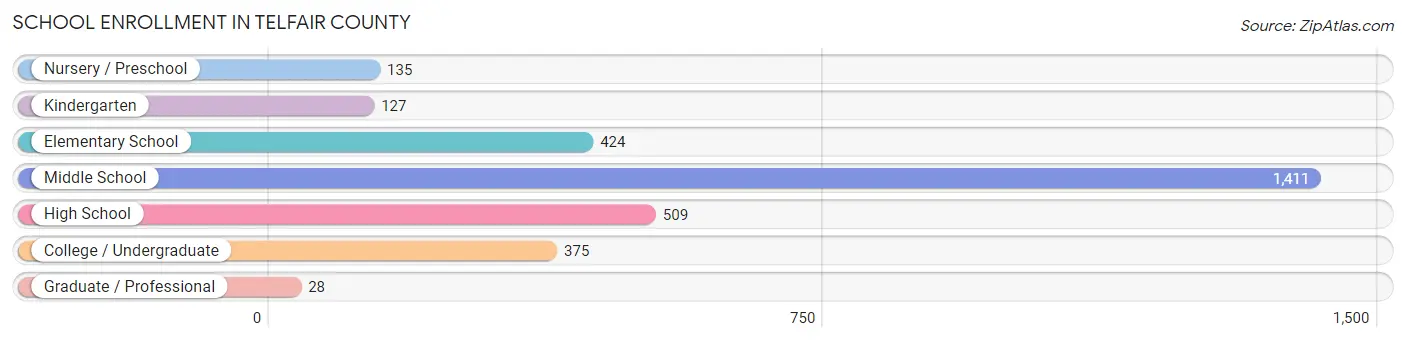
School Enrollment in Telfair County
The most common levels of schooling among the 3,009 students in Telfair County are middle school (1,411 | 46.9%), high school (509 | 16.9%), and elementary school (424 | 14.1%).
| School Level | # Students | % Students |
| Nursery / Preschool | 135 | 4.5% |
| Kindergarten | 127 | 4.2% |
| Elementary School | 424 | 14.1% |
| Middle School | 1,411 | 46.9% |
| High School | 509 | 16.9% |
| College / Undergraduate | 375 | 12.5% |
| Graduate / Professional | 28 | 0.9% |
| Total | 3,009 | 100.0% |
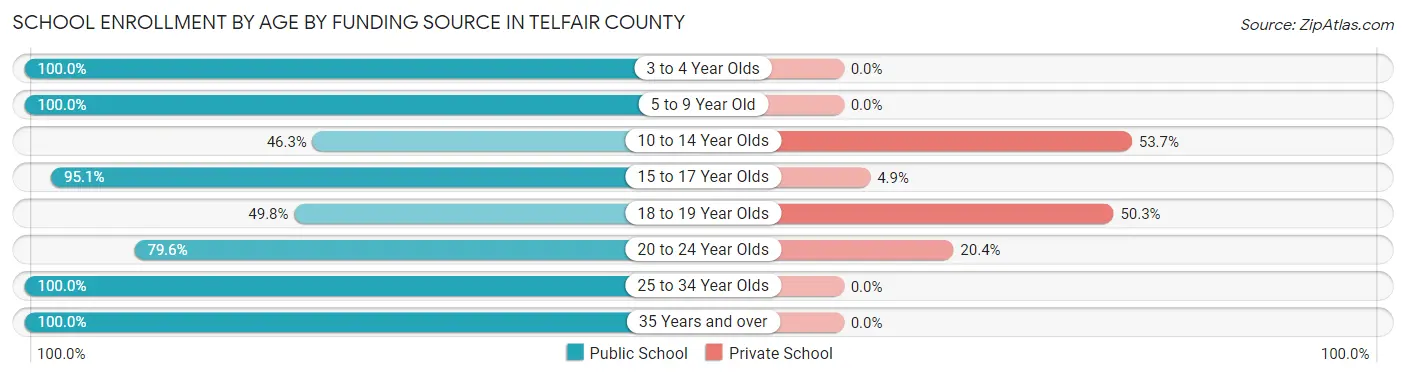
School Enrollment by Age by Funding Source in Telfair County
Out of a total of 3,009 students who are enrolled in schools in Telfair County, 957 (31.8%) attend a private institution, while the remaining 2,052 (68.2%) are enrolled in public schools. The age group of 10 to 14 year olds has the highest likelihood of being enrolled in private schools, with 800 (53.7% in the age bracket) enrolled. Conversely, the age group of 3 to 4 year olds has the lowest likelihood of being enrolled in a private school, with 56 (100.0% in the age bracket) attending a public institution.
| Age Bracket | Public School | Private School |
| 3 to 4 Year Olds | 56 (100.0%) | 0 (0.0%) |
| 5 to 9 Year Old | 567 (100.0%) | 0 (0.0%) |
| 10 to 14 Year Olds | 691 (46.3%) | 800 (53.7%) |
| 15 to 17 Year Olds | 385 (95.1%) | 20 (4.9%) |
| 18 to 19 Year Olds | 98 (49.7%) | 99 (50.2%) |
| 20 to 24 Year Olds | 144 (79.6%) | 37 (20.4%) |
| 25 to 34 Year Olds | 43 (100.0%) | 0 (0.0%) |
| 35 Years and over | 69 (100.0%) | 0 (0.0%) |
| Total | 2,052 (68.2%) | 957 (31.8%) |
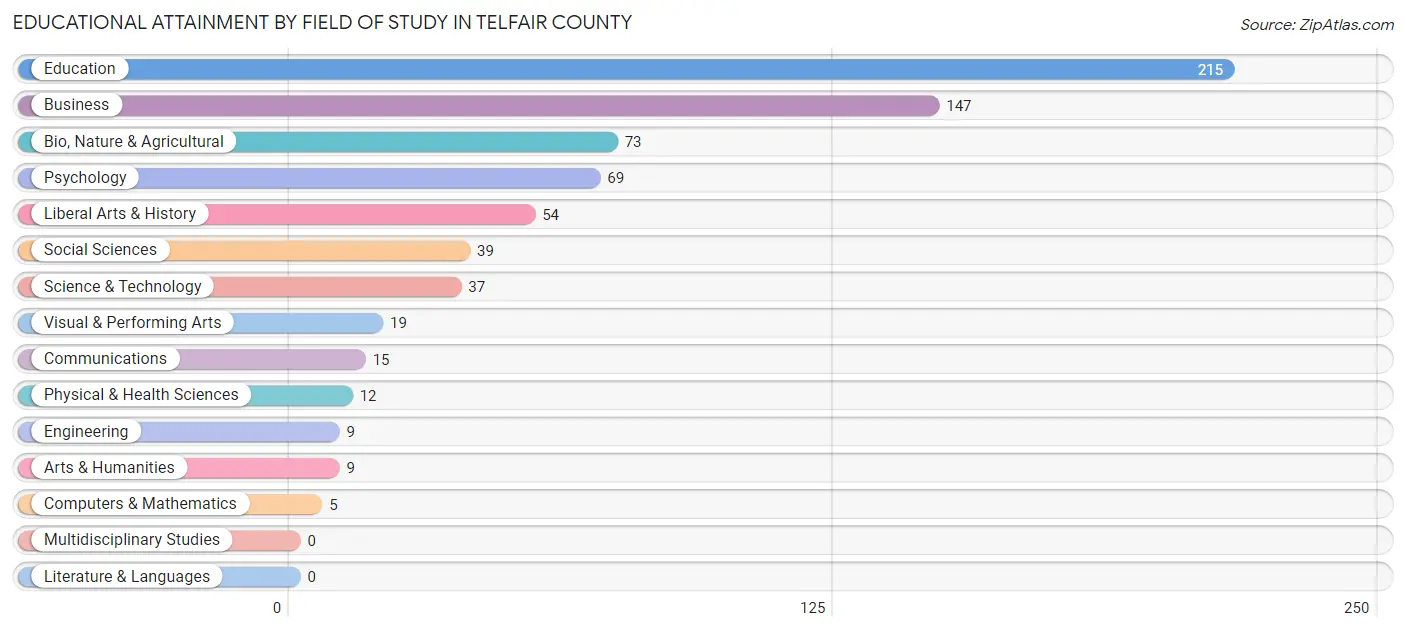
Educational Attainment by Field of Study in Telfair County
Education (215 | 30.6%), business (147 | 20.9%), bio, nature & agricultural (73 | 10.4%), psychology (69 | 9.8%), and liberal arts & history (54 | 7.7%) are the most common fields of study among 703 individuals in Telfair County who have obtained a bachelor's degree or higher.
| Field of Study | # Graduates | % Graduates |
| Computers & Mathematics | 5 | 0.7% |
| Bio, Nature & Agricultural | 73 | 10.4% |
| Physical & Health Sciences | 12 | 1.7% |
| Psychology | 69 | 9.8% |
| Social Sciences | 39 | 5.6% |
| Engineering | 9 | 1.3% |
| Multidisciplinary Studies | 0 | 0.0% |
| Science & Technology | 37 | 5.3% |
| Business | 147 | 20.9% |
| Education | 215 | 30.6% |
| Literature & Languages | 0 | 0.0% |
| Liberal Arts & History | 54 | 7.7% |
| Visual & Performing Arts | 19 | 2.7% |
| Communications | 15 | 2.1% |
| Arts & Humanities | 9 | 1.3% |
| Total | 703 | 100.0% |
Transportation & Commute in Telfair County
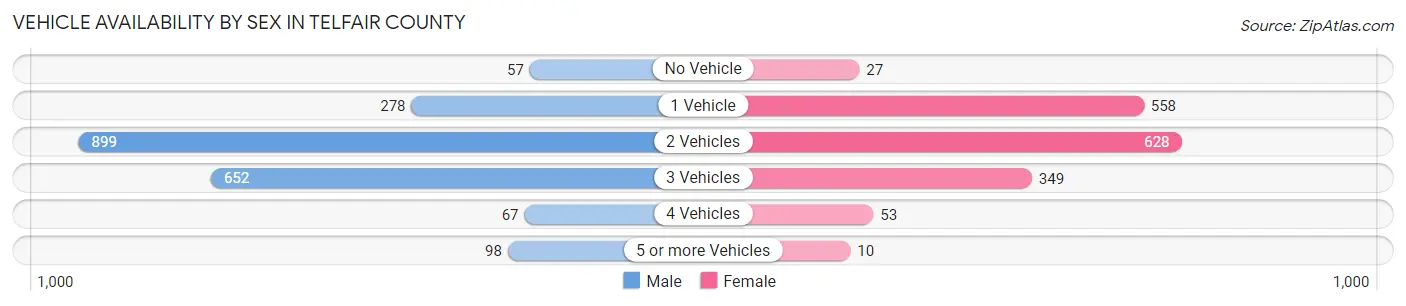
Vehicle Availability by Sex in Telfair County
The most prevalent vehicle ownership categories in Telfair County are males with 2 vehicles (899, accounting for 43.8%) and females with 2 vehicles (628, making up 55.3%).
| Vehicles Available | Male | Female |
| No Vehicle | 57 (2.8%) | 27 (1.7%) |
| 1 Vehicle | 278 (13.6%) | 558 (34.3%) |
| 2 Vehicles | 899 (43.8%) | 628 (38.7%) |
| 3 Vehicles | 652 (31.8%) | 349 (21.5%) |
| 4 Vehicles | 67 (3.3%) | 53 (3.3%) |
| 5 or more Vehicles | 98 (4.8%) | 10 (0.6%) |
| Total | 2,051 (100.0%) | 1,625 (100.0%) |
Commute Time in Telfair County
The most frequently occuring commute durations in Telfair County are 10 to 14 minutes (1,031 commuters, 29.4%), 15 to 19 minutes (608 commuters, 17.3%), and 5 to 9 minutes (557 commuters, 15.9%).
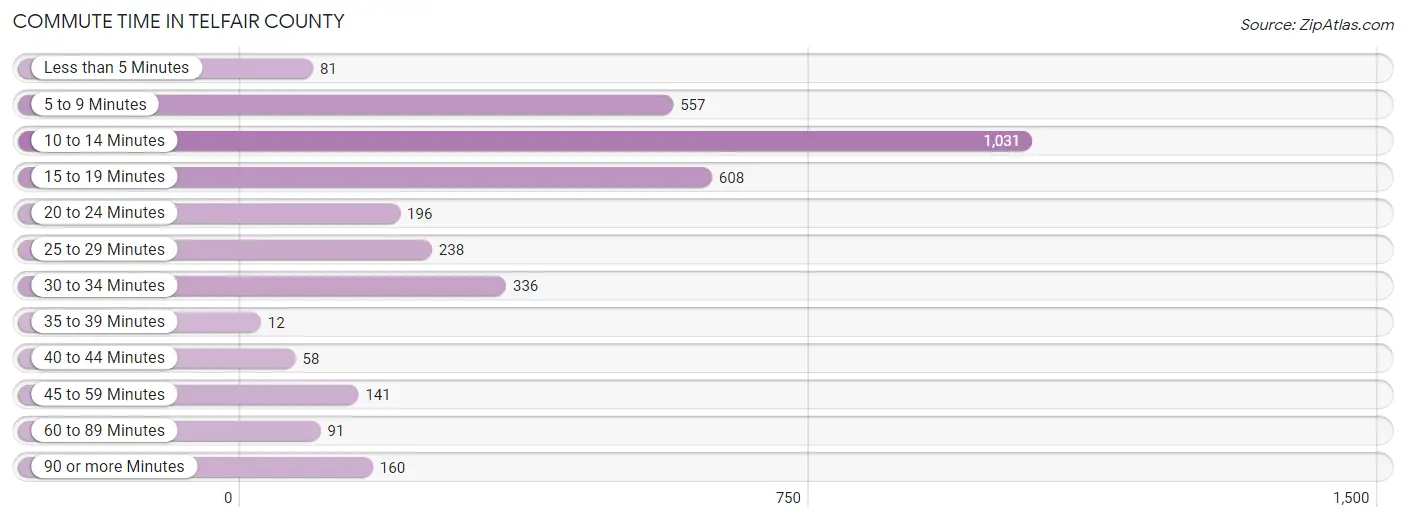
| Commute Time | # Commuters | % Commuters |
| Less than 5 Minutes | 81 | 2.3% |
| 5 to 9 Minutes | 557 | 15.9% |
| 10 to 14 Minutes | 1,031 | 29.4% |
| 15 to 19 Minutes | 608 | 17.3% |
| 20 to 24 Minutes | 196 | 5.6% |
| 25 to 29 Minutes | 238 | 6.8% |
| 30 to 34 Minutes | 336 | 9.6% |
| 35 to 39 Minutes | 12 | 0.3% |
| 40 to 44 Minutes | 58 | 1.7% |
| 45 to 59 Minutes | 141 | 4.0% |
| 60 to 89 Minutes | 91 | 2.6% |
| 90 or more Minutes | 160 | 4.6% |
Commute Time by Sex in Telfair County
The most common commute times in Telfair County are 10 to 14 minutes (626 commuters, 31.4%) for males and 10 to 14 minutes (405 commuters, 26.7%) for females.
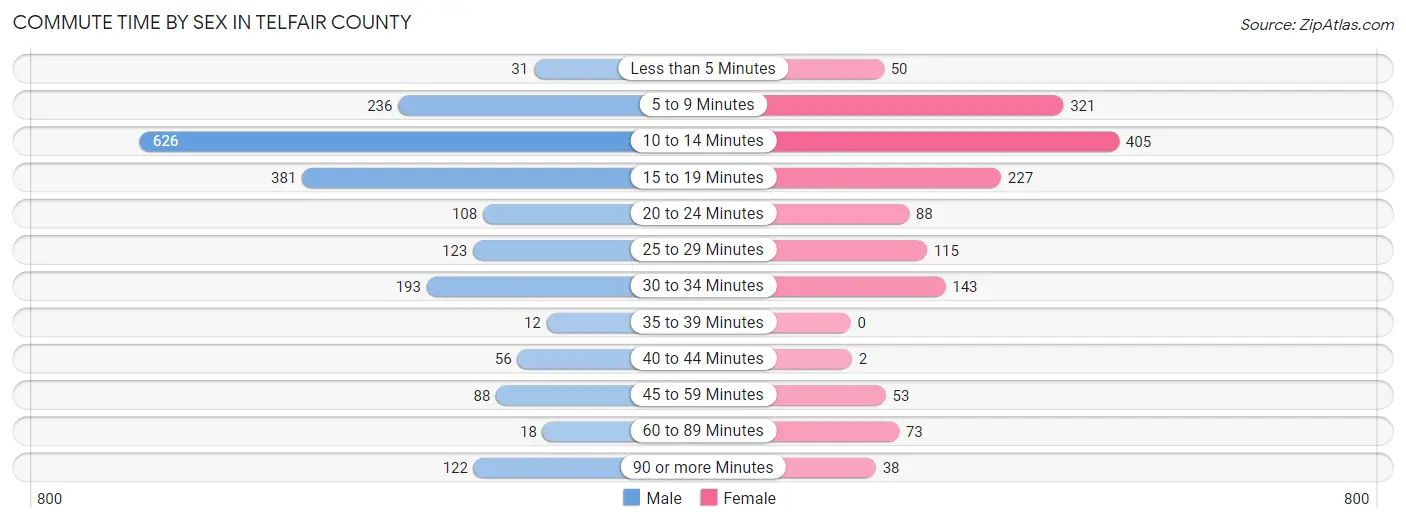
| Commute Time | Male | Female |
| Less than 5 Minutes | 31 (1.5%) | 50 (3.3%) |
| 5 to 9 Minutes | 236 (11.8%) | 321 (21.2%) |
| 10 to 14 Minutes | 626 (31.4%) | 405 (26.7%) |
| 15 to 19 Minutes | 381 (19.1%) | 227 (15.0%) |
| 20 to 24 Minutes | 108 (5.4%) | 88 (5.8%) |
| 25 to 29 Minutes | 123 (6.2%) | 115 (7.6%) |
| 30 to 34 Minutes | 193 (9.7%) | 143 (9.4%) |
| 35 to 39 Minutes | 12 (0.6%) | 0 (0.0%) |
| 40 to 44 Minutes | 56 (2.8%) | 2 (0.1%) |
| 45 to 59 Minutes | 88 (4.4%) | 53 (3.5%) |
| 60 to 89 Minutes | 18 (0.9%) | 73 (4.8%) |
| 90 or more Minutes | 122 (6.1%) | 38 (2.5%) |
Time of Departure to Work by Sex in Telfair County
The most frequent times of departure to work in Telfair County are 7:00 AM to 7:29 AM (524, 26.3%) for males and 7:30 AM to 7:59 AM (229, 15.1%) for females.
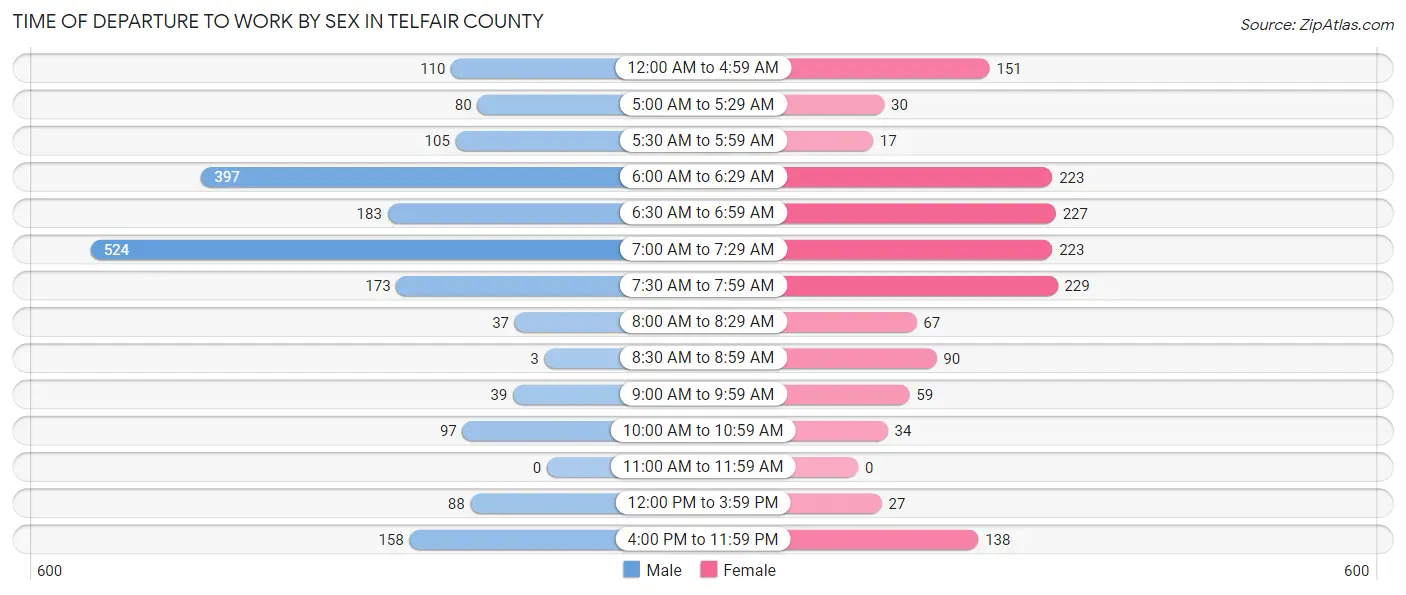
| Time of Departure | Male | Female |
| 12:00 AM to 4:59 AM | 110 (5.5%) | 151 (10.0%) |
| 5:00 AM to 5:29 AM | 80 (4.0%) | 30 (2.0%) |
| 5:30 AM to 5:59 AM | 105 (5.3%) | 17 (1.1%) |
| 6:00 AM to 6:29 AM | 397 (19.9%) | 223 (14.7%) |
| 6:30 AM to 6:59 AM | 183 (9.2%) | 227 (15.0%) |
| 7:00 AM to 7:29 AM | 524 (26.3%) | 223 (14.7%) |
| 7:30 AM to 7:59 AM | 173 (8.7%) | 229 (15.1%) |
| 8:00 AM to 8:29 AM | 37 (1.9%) | 67 (4.4%) |
| 8:30 AM to 8:59 AM | 3 (0.2%) | 90 (5.9%) |
| 9:00 AM to 9:59 AM | 39 (2.0%) | 59 (3.9%) |
| 10:00 AM to 10:59 AM | 97 (4.9%) | 34 (2.2%) |
| 11:00 AM to 11:59 AM | 0 (0.0%) | 0 (0.0%) |
| 12:00 PM to 3:59 PM | 88 (4.4%) | 27 (1.8%) |
| 4:00 PM to 11:59 PM | 158 (7.9%) | 138 (9.1%) |
| Total | 1,994 (100.0%) | 1,515 (100.0%) |
Housing Occupancy in Telfair County
Occupancy by Ownership in Telfair County
Of the total 2,948 dwellings in Telfair County, owner-occupied units account for 2,174 (73.7%), while renter-occupied units make up 774 (26.3%).
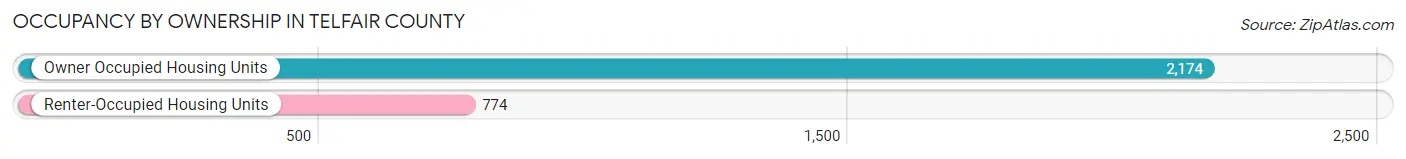
| Occupancy | # Housing Units | % Housing Units |
| Owner Occupied Housing Units | 2,174 | 73.7% |
| Renter-Occupied Housing Units | 774 | 26.3% |
| Total Occupied Housing Units | 2,948 | 100.0% |
Occupancy by Household Size in Telfair County
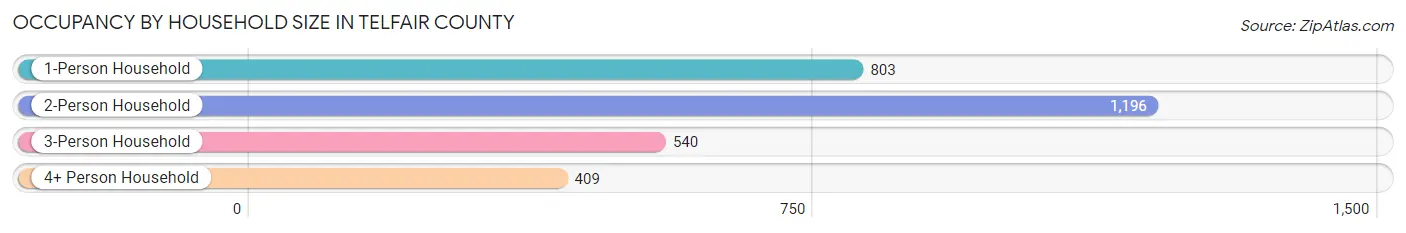
| Household Size | # Housing Units | % Housing Units |
| 1-Person Household | 803 | 27.2% |
| 2-Person Household | 1,196 | 40.6% |
| 3-Person Household | 540 | 18.3% |
| 4+ Person Household | 409 | 13.9% |
| Total Housing Units | 2,948 | 100.0% |
Occupancy by Ownership by Household Size in Telfair County
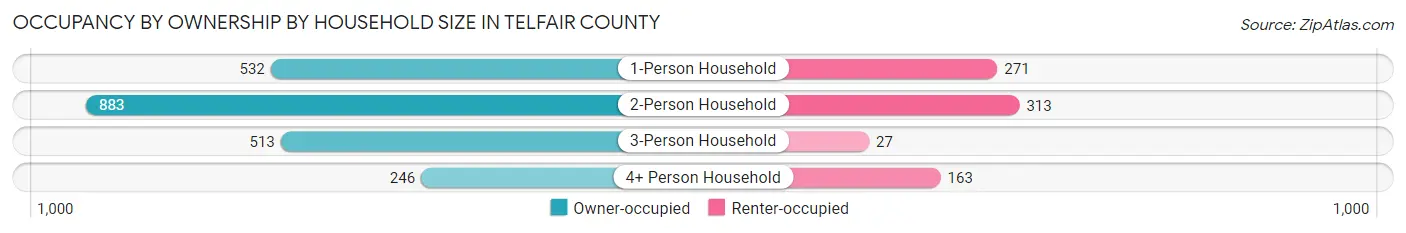
| Household Size | Owner-occupied | Renter-occupied |
| 1-Person Household | 532 (66.2%) | 271 (33.8%) |
| 2-Person Household | 883 (73.8%) | 313 (26.2%) |
| 3-Person Household | 513 (95.0%) | 27 (5.0%) |
| 4+ Person Household | 246 (60.2%) | 163 (39.9%) |
| Total Housing Units | 2,174 (73.7%) | 774 (26.3%) |
Occupancy by Educational Attainment in Telfair County
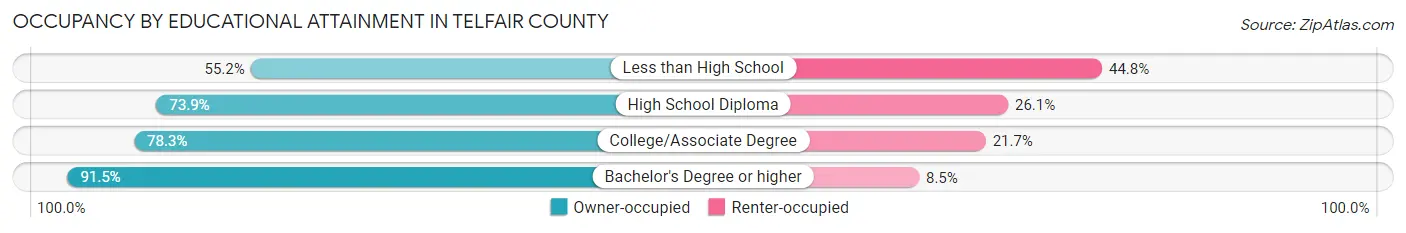
| Household Size | Owner-occupied | Renter-occupied |
| Less than High School | 302 (55.2%) | 245 (44.8%) |
| High School Diploma | 904 (73.9%) | 320 (26.1%) |
| College/Associate Degree | 645 (78.3%) | 179 (21.7%) |
| Bachelor's Degree or higher | 323 (91.5%) | 30 (8.5%) |
Occupancy by Age of Householder in Telfair County
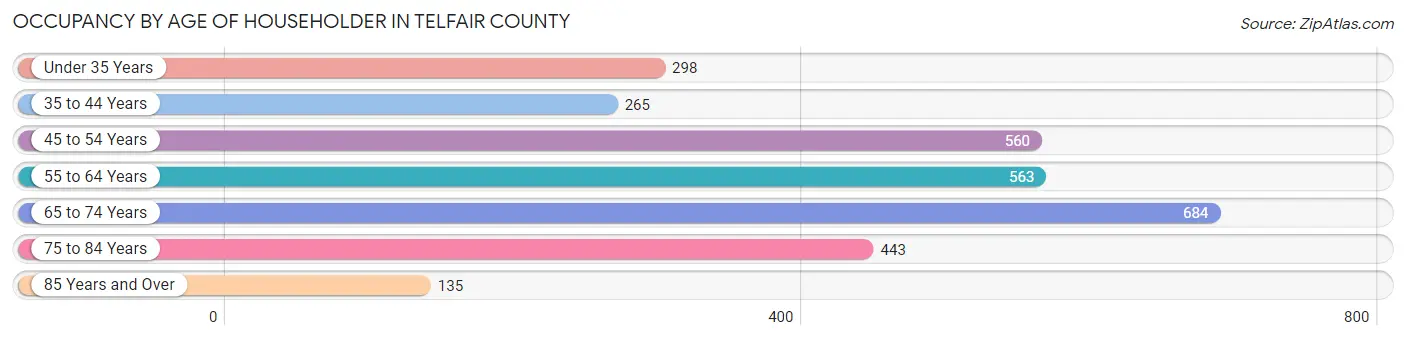
| Age Bracket | # Households | % Households |
| Under 35 Years | 298 | 10.1% |
| 35 to 44 Years | 265 | 9.0% |
| 45 to 54 Years | 560 | 19.0% |
| 55 to 64 Years | 563 | 19.1% |
| 65 to 74 Years | 684 | 23.2% |
| 75 to 84 Years | 443 | 15.0% |
| 85 Years and Over | 135 | 4.6% |
| Total | 2,948 | 100.0% |
Housing Finances in Telfair County
Median Income by Occupancy in Telfair County
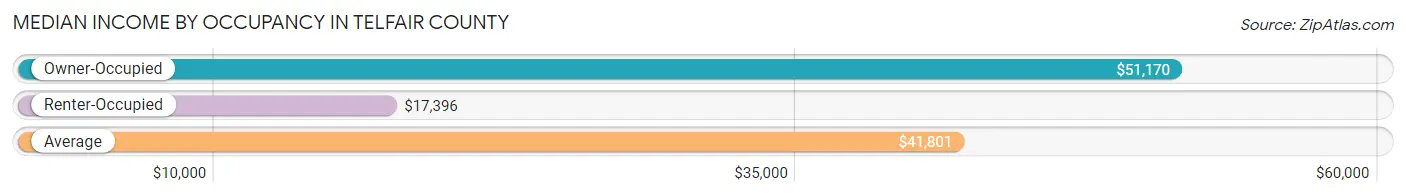
| Occupancy Type | # Households | Median Income |
| Owner-Occupied | 2,174 (73.7%) | $51,170 |
| Renter-Occupied | 774 (26.3%) | $17,396 |
| Average | 2,948 (100.0%) | $41,801 |
Occupancy by Householder Income Bracket in Telfair County
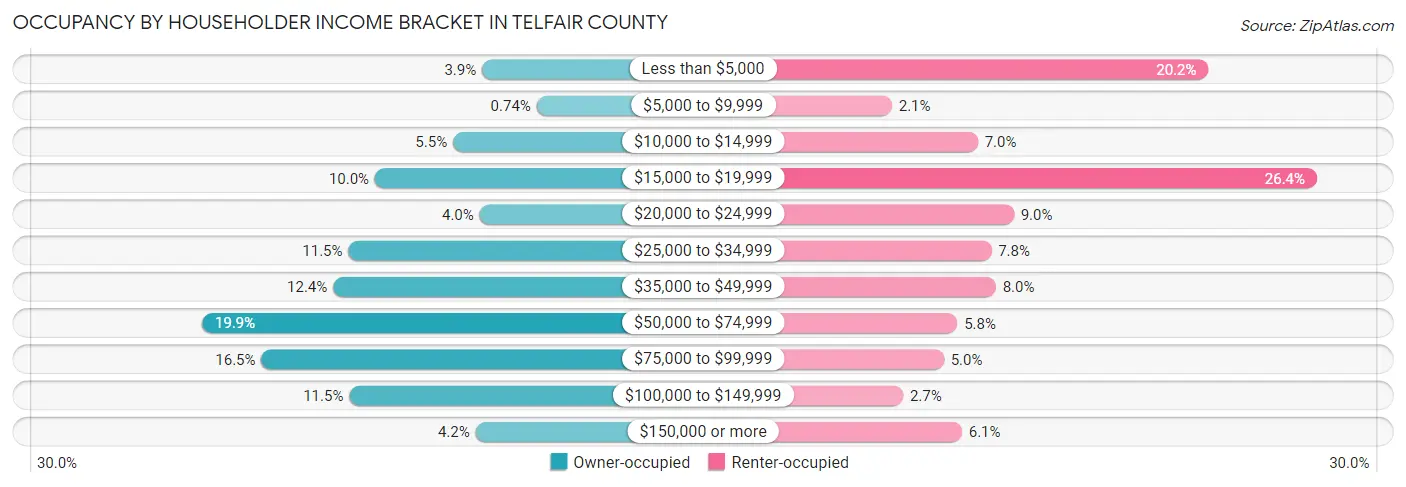
| Income Bracket | Owner-occupied | Renter-occupied |
| Less than $5,000 | 84 (3.9%) | 156 (20.2%) |
| $5,000 to $9,999 | 16 (0.7%) | 16 (2.1%) |
| $10,000 to $14,999 | 120 (5.5%) | 54 (7.0%) |
| $15,000 to $19,999 | 217 (10.0%) | 204 (26.4%) |
| $20,000 to $24,999 | 87 (4.0%) | 70 (9.0%) |
| $25,000 to $34,999 | 250 (11.5%) | 60 (7.7%) |
| $35,000 to $49,999 | 269 (12.4%) | 62 (8.0%) |
| $50,000 to $74,999 | 432 (19.9%) | 45 (5.8%) |
| $75,000 to $99,999 | 358 (16.5%) | 39 (5.0%) |
| $100,000 to $149,999 | 249 (11.5%) | 21 (2.7%) |
| $150,000 or more | 92 (4.2%) | 47 (6.1%) |
| Total | 2,174 (100.0%) | 774 (100.0%) |
Monthly Housing Cost Tiers in Telfair County
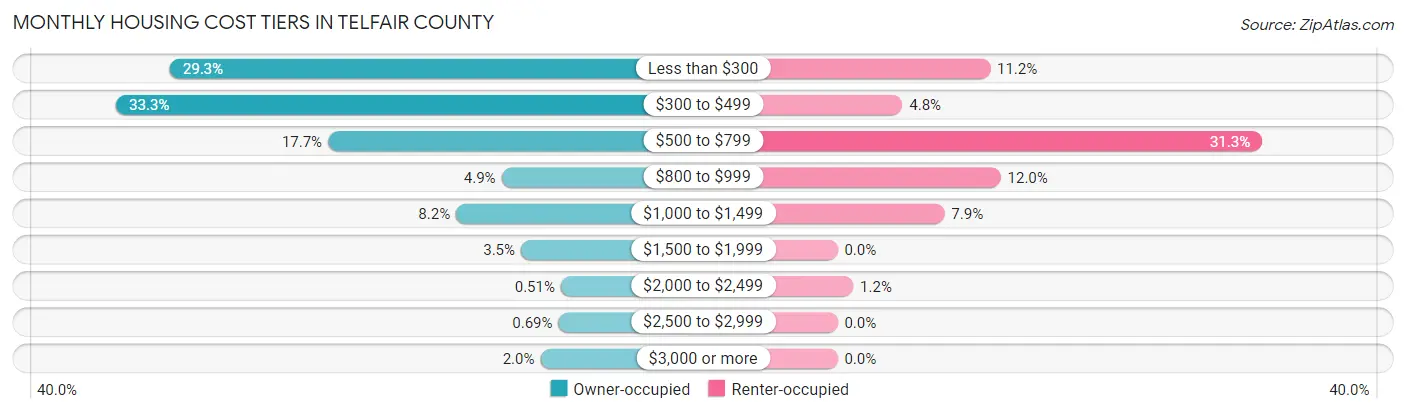
| Monthly Cost | Owner-occupied | Renter-occupied |
| Less than $300 | 637 (29.3%) | 87 (11.2%) |
| $300 to $499 | 723 (33.3%) | 37 (4.8%) |
| $500 to $799 | 384 (17.7%) | 242 (31.3%) |
| $800 to $999 | 106 (4.9%) | 93 (12.0%) |
| $1,000 to $1,499 | 179 (8.2%) | 61 (7.9%) |
| $1,500 to $1,999 | 75 (3.5%) | 0 (0.0%) |
| $2,000 to $2,499 | 11 (0.5%) | 9 (1.2%) |
| $2,500 to $2,999 | 15 (0.7%) | 0 (0.0%) |
| $3,000 or more | 44 (2.0%) | 0 (0.0%) |
| Total | 2,174 (100.0%) | 774 (100.0%) |
Physical Housing Characteristics in Telfair County
Housing Structures in Telfair County
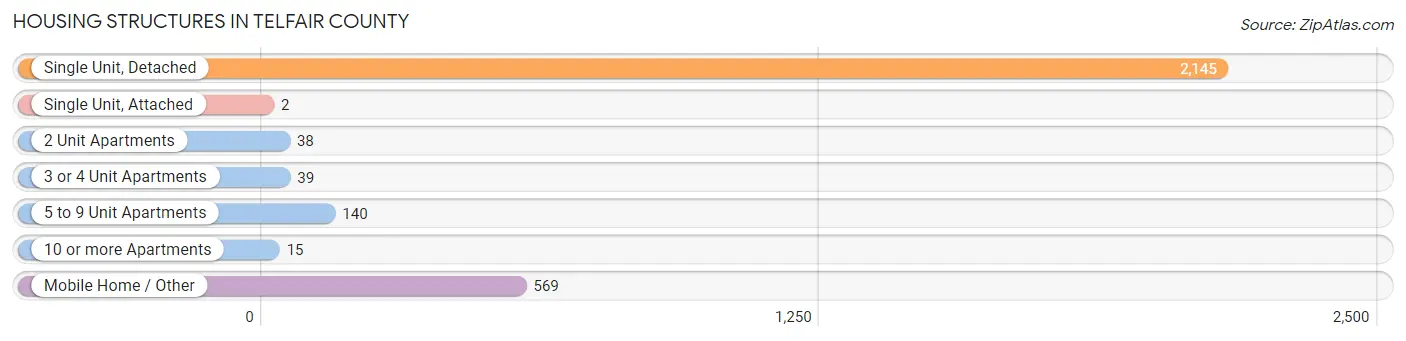
| Structure Type | # Housing Units | % Housing Units |
| Single Unit, Detached | 2,145 | 72.8% |
| Single Unit, Attached | 2 | 0.1% |
| 2 Unit Apartments | 38 | 1.3% |
| 3 or 4 Unit Apartments | 39 | 1.3% |
| 5 to 9 Unit Apartments | 140 | 4.8% |
| 10 or more Apartments | 15 | 0.5% |
| Mobile Home / Other | 569 | 19.3% |
| Total | 2,948 | 100.0% |
Housing Structures by Occupancy in Telfair County
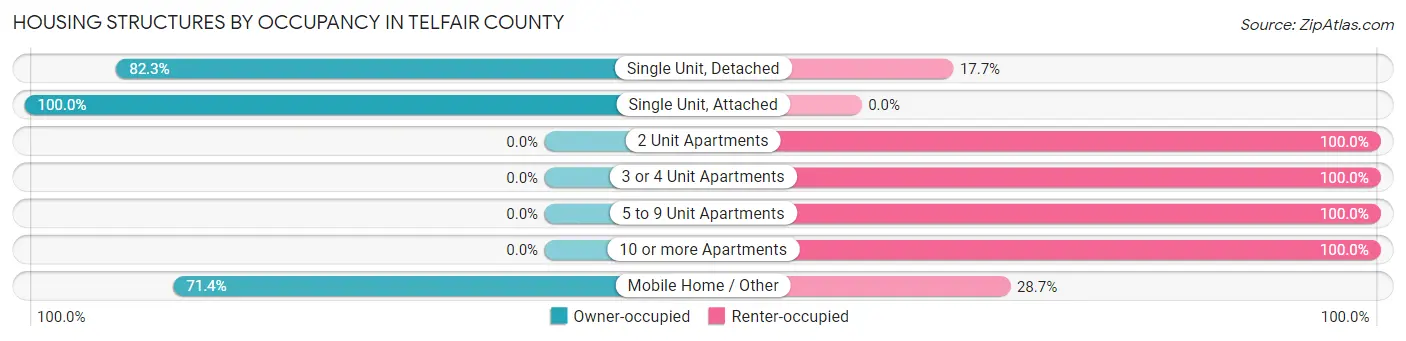
| Structure Type | Owner-occupied | Renter-occupied |
| Single Unit, Detached | 1,766 (82.3%) | 379 (17.7%) |
| Single Unit, Attached | 2 (100.0%) | 0 (0.0%) |
| 2 Unit Apartments | 0 (0.0%) | 38 (100.0%) |
| 3 or 4 Unit Apartments | 0 (0.0%) | 39 (100.0%) |
| 5 to 9 Unit Apartments | 0 (0.0%) | 140 (100.0%) |
| 10 or more Apartments | 0 (0.0%) | 15 (100.0%) |
| Mobile Home / Other | 406 (71.4%) | 163 (28.6%) |
| Total | 2,174 (73.7%) | 774 (26.3%) |
Housing Structures by Number of Rooms in Telfair County
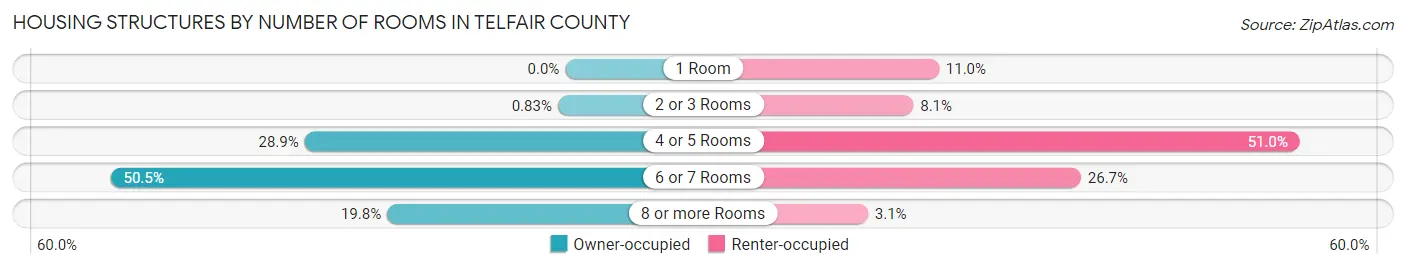
| Number of Rooms | Owner-occupied | Renter-occupied |
| 1 Room | 0 (0.0%) | 85 (11.0%) |
| 2 or 3 Rooms | 18 (0.8%) | 63 (8.1%) |
| 4 or 5 Rooms | 629 (28.9%) | 395 (51.0%) |
| 6 or 7 Rooms | 1,097 (50.5%) | 207 (26.7%) |
| 8 or more Rooms | 430 (19.8%) | 24 (3.1%) |
| Total | 2,174 (100.0%) | 774 (100.0%) |
Housing Structure by Heating Type in Telfair County
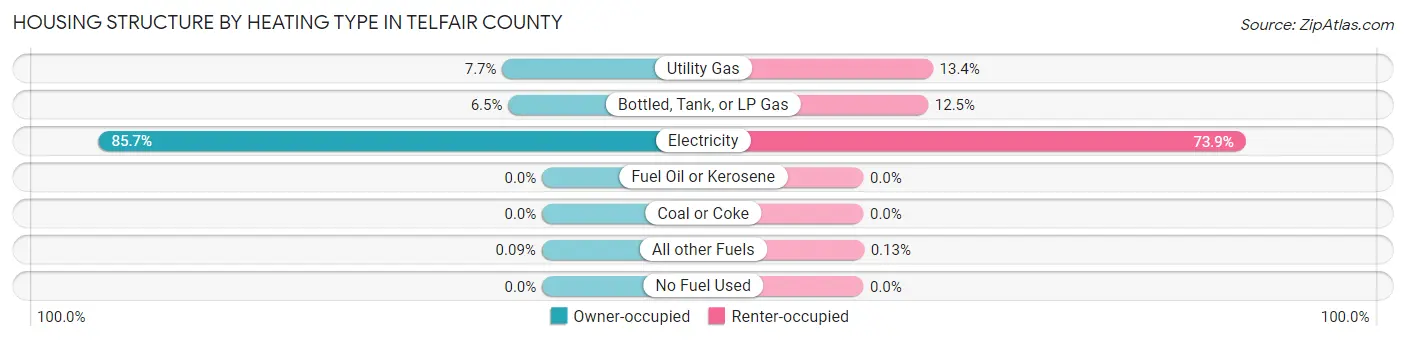
| Heating Type | Owner-occupied | Renter-occupied |
| Utility Gas | 167 (7.7%) | 104 (13.4%) |
| Bottled, Tank, or LP Gas | 142 (6.5%) | 97 (12.5%) |
| Electricity | 1,863 (85.7%) | 572 (73.9%) |
| Fuel Oil or Kerosene | 0 (0.0%) | 0 (0.0%) |
| Coal or Coke | 0 (0.0%) | 0 (0.0%) |
| All other Fuels | 2 (0.1%) | 1 (0.1%) |
| No Fuel Used | 0 (0.0%) | 0 (0.0%) |
| Total | 2,174 (100.0%) | 774 (100.0%) |
Household Vehicle Usage in Telfair County
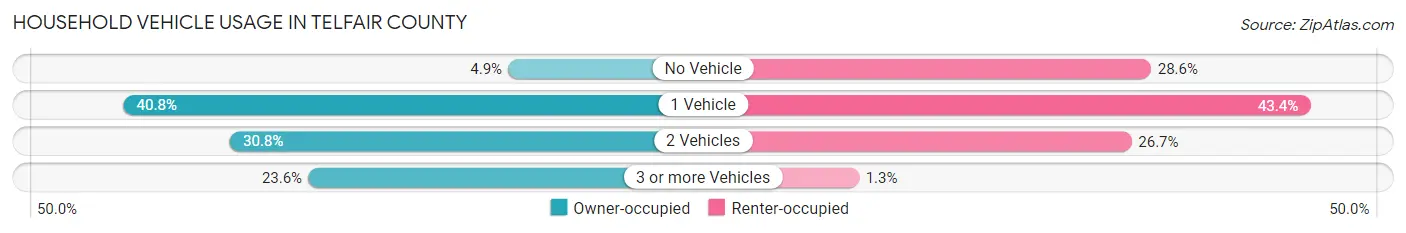
| Vehicles per Household | Owner-occupied | Renter-occupied |
| No Vehicle | 106 (4.9%) | 221 (28.5%) |
| 1 Vehicle | 886 (40.7%) | 336 (43.4%) |
| 2 Vehicles | 670 (30.8%) | 207 (26.7%) |
| 3 or more Vehicles | 512 (23.5%) | 10 (1.3%) |
| Total | 2,174 (100.0%) | 774 (100.0%) |
Real Estate & Mortgages in Telfair County
Real Estate and Mortgage Overview in Telfair County
| Characteristic | Without Mortgage | With Mortgage |
| Housing Units | 1,753 | 421 |
| Median Property Value | $79,800 | $122,700 |
| Median Household Income | $49,949 | $17 |
| Monthly Housing Costs | $351 | $44 |
| Real Estate Taxes | $911 | $4 |
Property Value by Mortgage Status in Telfair County
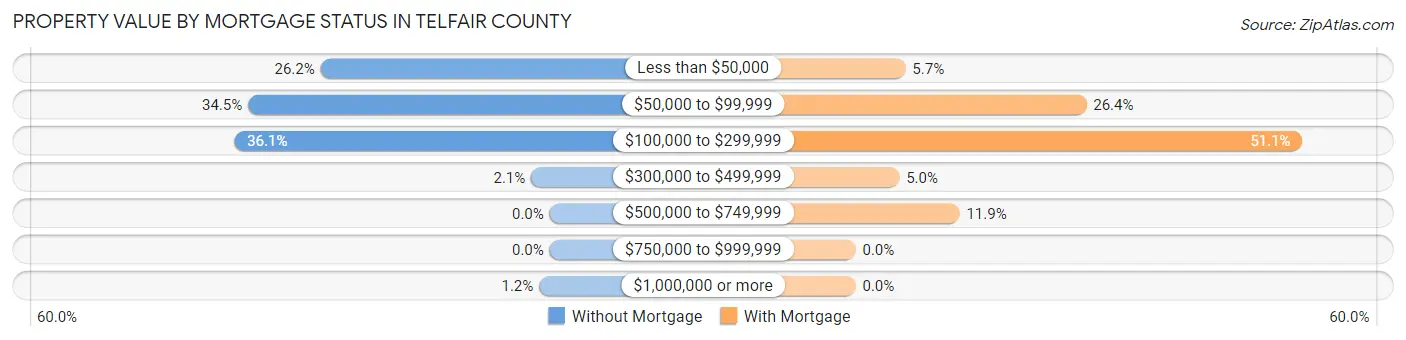
| Property Value | Without Mortgage | With Mortgage |
| Less than $50,000 | 459 (26.2%) | 24 (5.7%) |
| $50,000 to $99,999 | 604 (34.5%) | 111 (26.4%) |
| $100,000 to $299,999 | 632 (36.0%) | 215 (51.1%) |
| $300,000 to $499,999 | 37 (2.1%) | 21 (5.0%) |
| $500,000 to $749,999 | 0 (0.0%) | 50 (11.9%) |
| $750,000 to $999,999 | 0 (0.0%) | 0 (0.0%) |
| $1,000,000 or more | 21 (1.2%) | 0 (0.0%) |
| Total | 1,753 (100.0%) | 421 (100.0%) |
Household Income by Mortgage Status in Telfair County
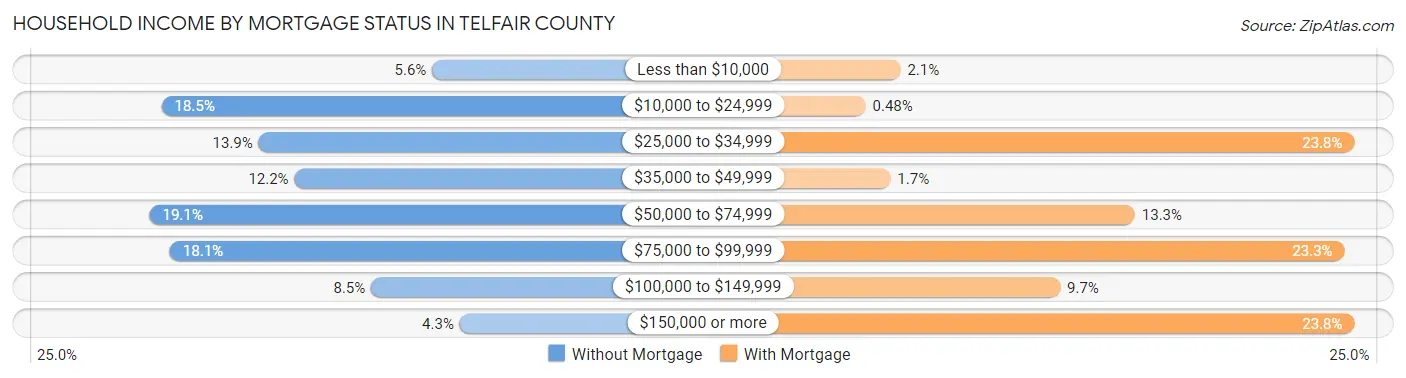
| Household Income | Without Mortgage | With Mortgage |
| Less than $10,000 | 98 (5.6%) | 9 (2.1%) |
| $10,000 to $24,999 | 324 (18.5%) | 2 (0.5%) |
| $25,000 to $34,999 | 243 (13.9%) | 100 (23.7%) |
| $35,000 to $49,999 | 213 (12.1%) | 7 (1.7%) |
| $50,000 to $74,999 | 334 (19.1%) | 56 (13.3%) |
| $75,000 to $99,999 | 317 (18.1%) | 98 (23.3%) |
| $100,000 to $149,999 | 149 (8.5%) | 41 (9.7%) |
| $150,000 or more | 75 (4.3%) | 100 (23.7%) |
| Total | 1,753 (100.0%) | 421 (100.0%) |
Property Value to Household Income Ratio in Telfair County
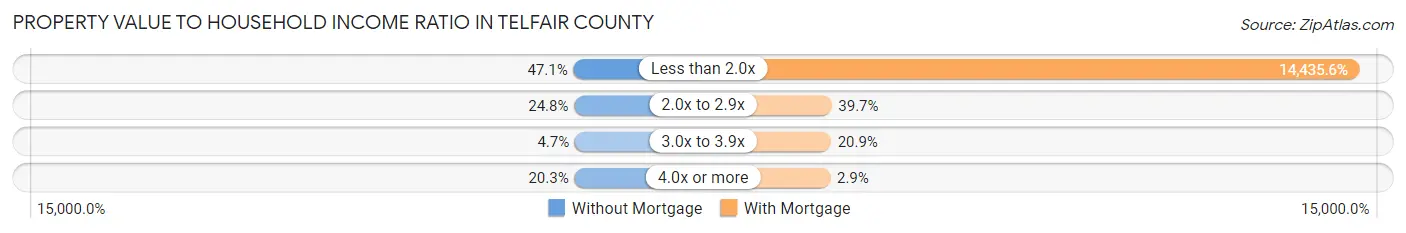
| Value-to-Income Ratio | Without Mortgage | With Mortgage |
| Less than 2.0x | 826 (47.1%) | 60,774 (14,435.6%) |
| 2.0x to 2.9x | 434 (24.8%) | 167 (39.7%) |
| 3.0x to 3.9x | 82 (4.7%) | 88 (20.9%) |
| 4.0x or more | 355 (20.3%) | 12 (2.9%) |
| Total | 1,753 (100.0%) | 421 (100.0%) |
Real Estate Taxes by Mortgage Status in Telfair County
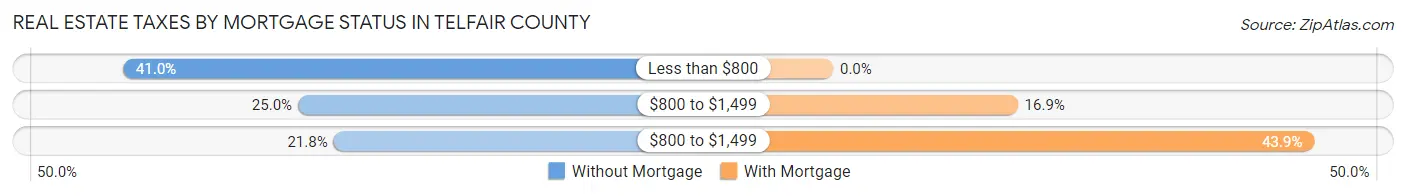
| Property Taxes | Without Mortgage | With Mortgage |
| Less than $800 | 719 (41.0%) | 0 (0.0%) |
| $800 to $1,499 | 439 (25.0%) | 71 (16.9%) |
| $800 to $1,499 | 382 (21.8%) | 185 (43.9%) |
| Total | 1,753 (100.0%) | 421 (100.0%) |
Health & Disability in Telfair County
Health Insurance Coverage by Age in Telfair County
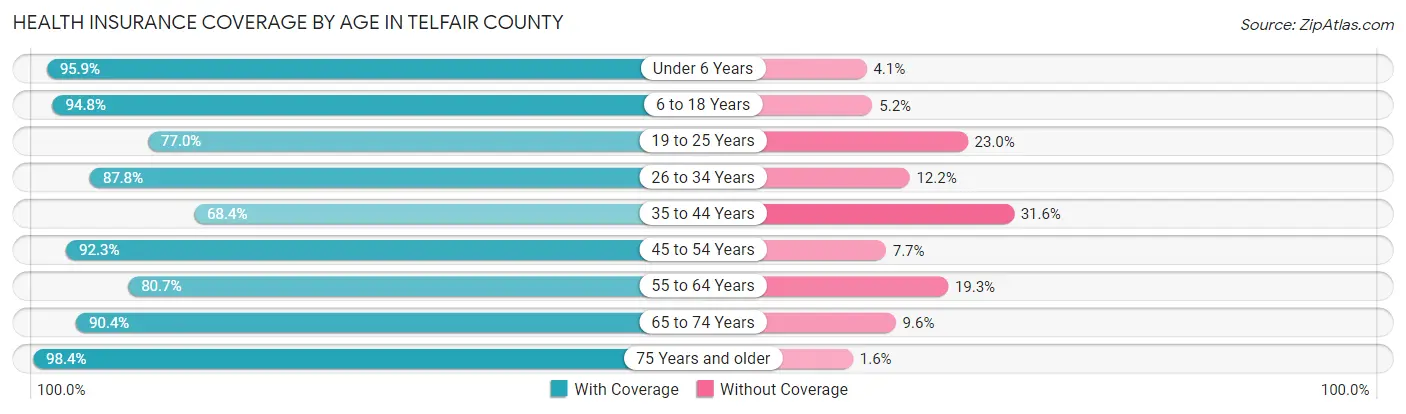
| Age Bracket | With Coverage | Without Coverage |
| Under 6 Years | 697 (95.9%) | 30 (4.1%) |
| 6 to 18 Years | 2,249 (94.8%) | 124 (5.2%) |
| 19 to 25 Years | 606 (77.0%) | 181 (23.0%) |
| 26 to 34 Years | 621 (87.8%) | 86 (12.2%) |
| 35 to 44 Years | 706 (68.4%) | 326 (31.6%) |
| 45 to 54 Years | 1,132 (92.3%) | 95 (7.7%) |
| 55 to 64 Years | 1,010 (80.7%) | 242 (19.3%) |
| 65 to 74 Years | 1,048 (90.4%) | 111 (9.6%) |
| 75 Years and older | 802 (98.4%) | 13 (1.6%) |
| Total | 8,871 (88.0%) | 1,208 (12.0%) |
Health Insurance Coverage by Citizenship Status in Telfair County
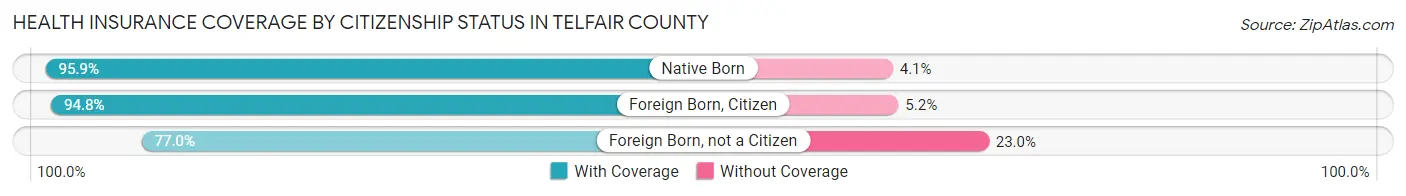
| Citizenship Status | With Coverage | Without Coverage |
| Native Born | 697 (95.9%) | 30 (4.1%) |
| Foreign Born, Citizen | 2,249 (94.8%) | 124 (5.2%) |
| Foreign Born, not a Citizen | 606 (77.0%) | 181 (23.0%) |
Health Insurance Coverage by Household Income in Telfair County
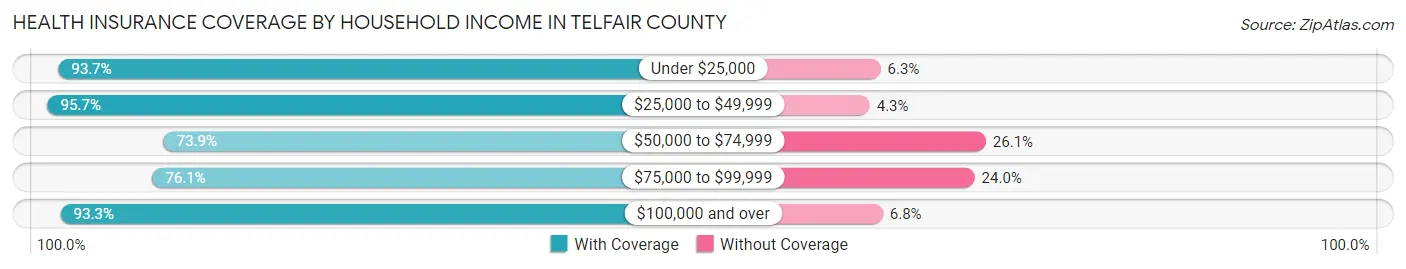
| Household Income | With Coverage | Without Coverage |
| Under $25,000 | 2,723 (93.7%) | 184 (6.3%) |
| $25,000 to $49,999 | 2,175 (95.7%) | 98 (4.3%) |
| $50,000 to $74,999 | 1,163 (73.9%) | 410 (26.1%) |
| $75,000 to $99,999 | 1,273 (76.0%) | 401 (23.9%) |
| $100,000 and over | 1,534 (93.2%) | 111 (6.8%) |
Public vs Private Health Insurance Coverage by Age in Telfair County
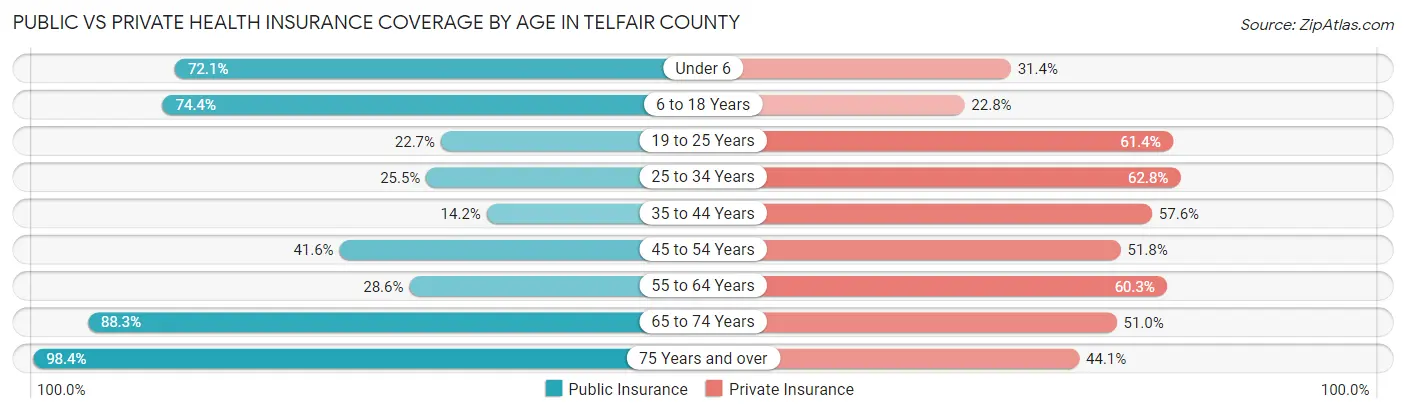
| Age Bracket | Public Insurance | Private Insurance |
| Under 6 | 524 (72.1%) | 228 (31.4%) |
| 6 to 18 Years | 1,765 (74.4%) | 540 (22.8%) |
| 19 to 25 Years | 179 (22.7%) | 483 (61.4%) |
| 25 to 34 Years | 180 (25.5%) | 444 (62.8%) |
| 35 to 44 Years | 147 (14.2%) | 594 (57.6%) |
| 45 to 54 Years | 510 (41.6%) | 635 (51.7%) |
| 55 to 64 Years | 358 (28.6%) | 755 (60.3%) |
| 65 to 74 Years | 1,023 (88.3%) | 591 (51.0%) |
| 75 Years and over | 802 (98.4%) | 359 (44.1%) |
| Total | 5,488 (54.4%) | 4,629 (45.9%) |
Disability Status by Sex by Age in Telfair County
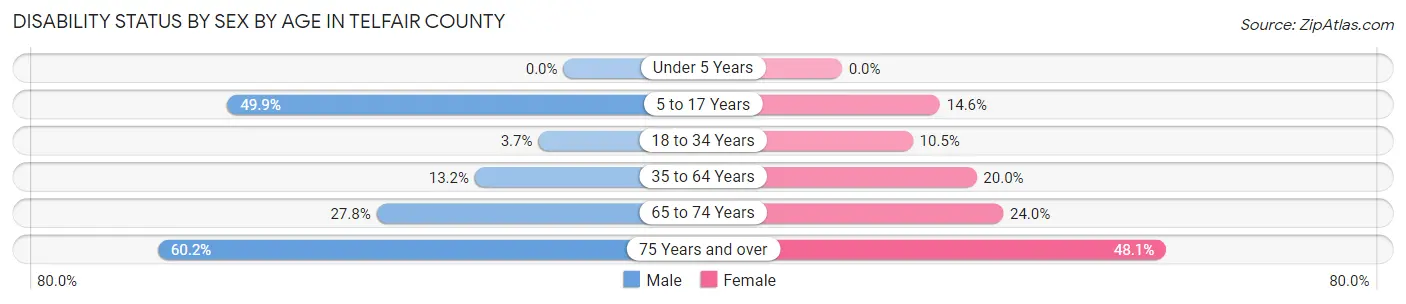
| Age Bracket | Male | Female |
| Under 5 Years | 0 (0.0%) | 0 (0.0%) |
| 5 to 17 Years | 793 (49.9%) | 131 (14.6%) |
| 18 to 34 Years | 29 (3.7%) | 85 (10.5%) |
| 35 to 64 Years | 211 (13.2%) | 381 (20.0%) |
| 65 to 74 Years | 149 (27.8%) | 149 (23.9%) |
| 75 Years and over | 183 (60.2%) | 246 (48.1%) |
Disability Class by Sex by Age in Telfair County
Disability Class: Hearing Difficulty

| Age Bracket | Male | Female |
| Under 5 Years | 0 (0.0%) | 0 (0.0%) |
| 5 to 17 Years | 0 (0.0%) | 0 (0.0%) |
| 18 to 34 Years | 6 (0.8%) | 0 (0.0%) |
| 35 to 64 Years | 189 (11.8%) | 42 (2.2%) |
| 65 to 74 Years | 132 (24.6%) | 36 (5.8%) |
| 75 Years and over | 153 (50.3%) | 0 (0.0%) |
Disability Class: Vision Difficulty
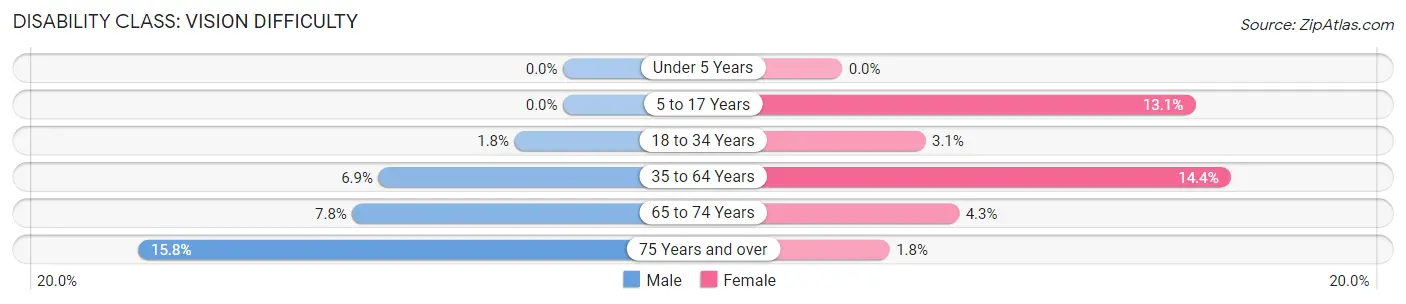
| Age Bracket | Male | Female |
| Under 5 Years | 0 (0.0%) | 0 (0.0%) |
| 5 to 17 Years | 0 (0.0%) | 118 (13.1%) |
| 18 to 34 Years | 14 (1.8%) | 25 (3.1%) |
| 35 to 64 Years | 110 (6.9%) | 275 (14.4%) |
| 65 to 74 Years | 42 (7.8%) | 27 (4.3%) |
| 75 Years and over | 48 (15.8%) | 9 (1.8%) |
Disability Class: Cognitive Difficulty
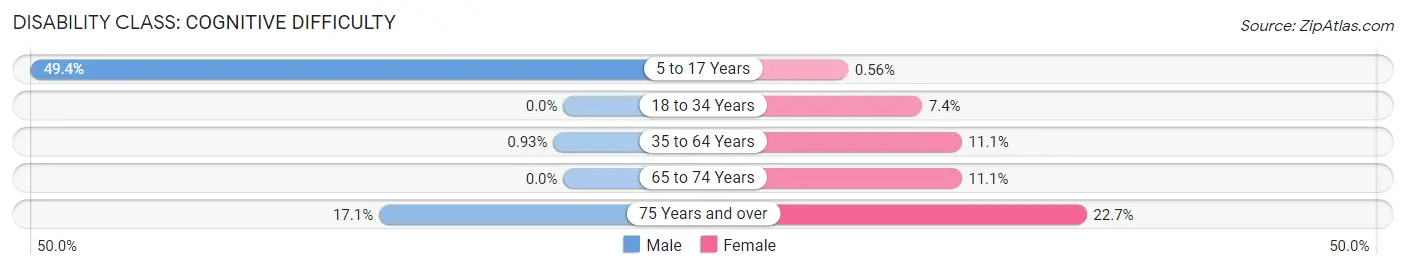
| Age Bracket | Male | Female |
| 5 to 17 Years | 786 (49.4%) | 5 (0.6%) |
| 18 to 34 Years | 0 (0.0%) | 60 (7.4%) |
| 35 to 64 Years | 15 (0.9%) | 212 (11.1%) |
| 65 to 74 Years | 0 (0.0%) | 69 (11.1%) |
| 75 Years and over | 52 (17.1%) | 116 (22.7%) |
Disability Class: Ambulatory Difficulty
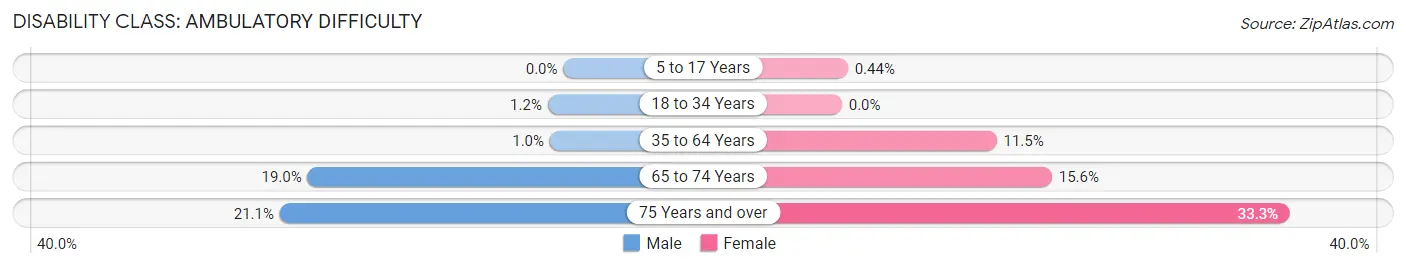
| Age Bracket | Male | Female |
| 5 to 17 Years | 0 (0.0%) | 4 (0.4%) |
| 18 to 34 Years | 9 (1.2%) | 0 (0.0%) |
| 35 to 64 Years | 16 (1.0%) | 219 (11.5%) |
| 65 to 74 Years | 102 (19.0%) | 97 (15.6%) |
| 75 Years and over | 64 (21.0%) | 170 (33.3%) |
Disability Class: Self-Care Difficulty
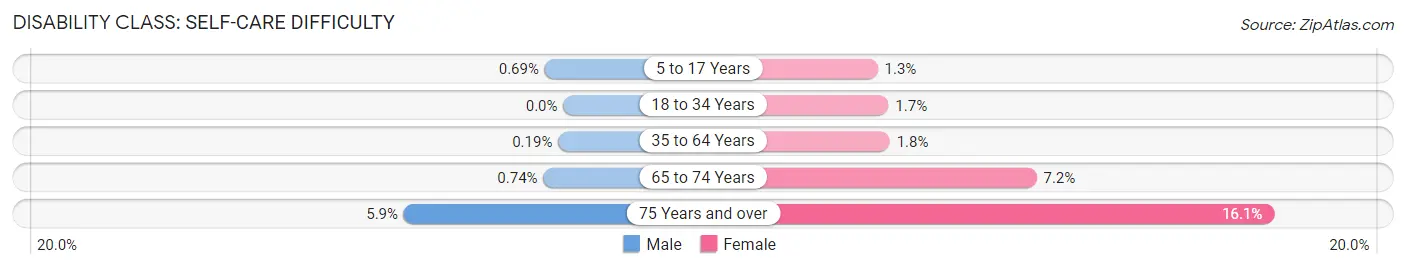
| Age Bracket | Male | Female |
| 5 to 17 Years | 11 (0.7%) | 12 (1.3%) |
| 18 to 34 Years | 0 (0.0%) | 14 (1.7%) |
| 35 to 64 Years | 3 (0.2%) | 34 (1.8%) |
| 65 to 74 Years | 4 (0.7%) | 45 (7.2%) |
| 75 Years and over | 18 (5.9%) | 82 (16.1%) |
Technology Access in Telfair County
Computing Device Access in Telfair County
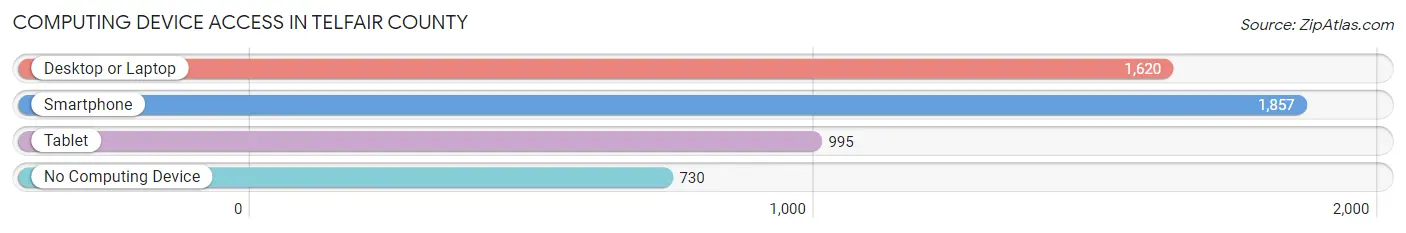
| Device Type | # Households | % Households |
| Desktop or Laptop | 1,620 | 54.9% |
| Smartphone | 1,857 | 63.0% |
| Tablet | 995 | 33.8% |
| No Computing Device | 730 | 24.8% |
| Total | 2,948 | 100.0% |
Internet Access in Telfair County
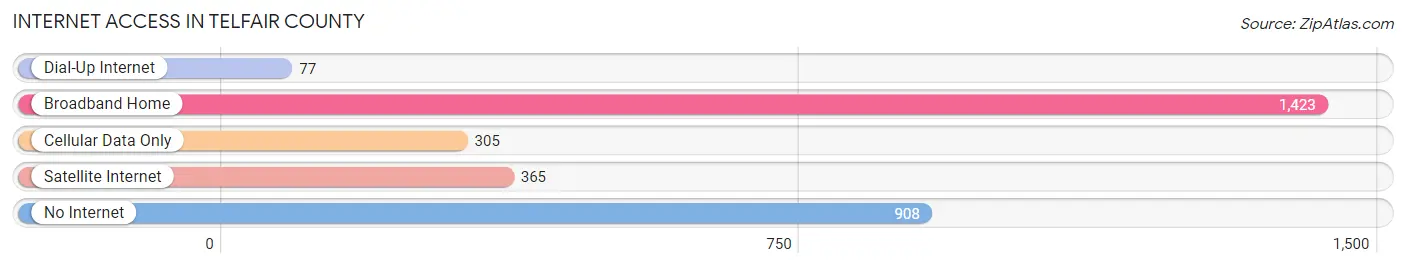
| Internet Type | # Households | % Households |
| Dial-Up Internet | 77 | 2.6% |
| Broadband Home | 1,423 | 48.3% |
| Cellular Data Only | 305 | 10.3% |
| Satellite Internet | 365 | 12.4% |
| No Internet | 908 | 30.8% |
| Total | 2,948 | 100.0% |
Telfair County Summary
Telfair County is located in the southeastern part of the state of Georgia, in the United States. It is bordered by Wheeler County to the north, Laurens County to the east, Dodge County to the south, and Wilcox County to the west. The county seat is McRae-Helena, and the largest city is McRae-Helena. The county was created in 1807 from parts of Laurens and Montgomery counties.
History
Telfair County was created in 1807 from parts of Laurens and Montgomery counties. It was named for Edward Telfair, the Governor of Georgia from 1786 to 1787. The county was originally part of the Creek Nation, and the area was home to many Native American tribes. The first European settlers arrived in the area in the late 1700s.
The county was home to many prominent figures in Georgia history, including Alexander Stephens, the Vice President of the Confederate States of America, and William Few, a signer of the United States Constitution.
Geography
Telfair County is located in the southeastern part of the state of Georgia. It is bordered by Wheeler County to the north, Laurens County to the east, Dodge County to the south, and Wilcox County to the west. The county has a total area of 441 square miles, of which 437 square miles is land and 4 square miles is water.
The county is mostly flat, with some rolling hills in the northern part of the county. The Ocmulgee River forms the western border of the county, and the Little Ocmulgee River forms the eastern border. The county is home to several small lakes, including Lake Telfair, Lake McRae, and Lake Oconee.
Economy
Telfair County has a diverse economy, with a mix of agriculture, manufacturing, and services. The county is home to several large employers, including the Telfair County Hospital, the Telfair County School System, and the Telfair County Sheriff's Office.
Agriculture is an important part of the county's economy. The county is home to several large farms, and the main crops grown in the county are cotton, corn, soybeans, and peanuts.
Manufacturing is also an important part of the county's economy. The county is home to several large manufacturing plants, including a paper mill, a furniture factory, and a plastics plant.
Demographics
As of the 2010 census, Telfair County had a population of 16,500. The population was 53.2% White, 44.2% African American, 0.7% Native American, 0.3% Asian, 0.1% Pacific Islander, 0.7% from other races, and 1.0% from two or more races. Hispanic or Latino of any race were 2.2% of the population.
The median income for a household in the county was $30,938, and the median income for a family was $37,917. The per capita income for the county was $15,945. About 22.2% of the population was below the poverty line.
Common Questions
What is Per Capita Income in Telfair County?
Per Capita income in Telfair County is $17,162.
What is the Median Family Income in Telfair County?
Median Family Income in Telfair County is $52,008.
What is the Median Household income in Telfair County?
Median Household Income in Telfair County is $41,801.
What is Income or Wage Gap in Telfair County?
Income or Wage Gap in Telfair County is 44.2%.
Women in Telfair County earn 55.8 cents for every dollar earned by a man.
What is Inequality or Gini Index in Telfair County?
Inequality or Gini Index in Telfair County is 0.50.
What is the Total Population of Telfair County?
Total Population of Telfair County is 12,619.
What is the Total Male Population of Telfair County?
Total Male Population of Telfair County is 7,534.
What is the Total Female Population of Telfair County?
Total Female Population of Telfair County is 5,085.
What is the Ratio of Males per 100 Females in Telfair County?
There are 148.16 Males per 100 Females in Telfair County.
What is the Ratio of Females per 100 Males in Telfair County?
There are 67.49 Females per 100 Males in Telfair County.
What is the Median Population Age in Telfair County?
Median Population Age in Telfair County is 40.1 Years.
What is the Average Family Size in Telfair County
Average Family Size in Telfair County is 4.1 People.
What is the Average Household Size in Telfair County
Average Household Size in Telfair County is 3.4 People.
How Large is the Labor Force in Telfair County?
There are 3,794 People in the Labor Forcein in Telfair County.
What is the Percentage of People in the Labor Force in Telfair County?
38.3% of People are in the Labor Force in Telfair County.
What is the Unemployment Rate in Telfair County?
Unemployment Rate in Telfair County is 2.1%.