Spalding County, GA Map & Demographics
Spalding County Map
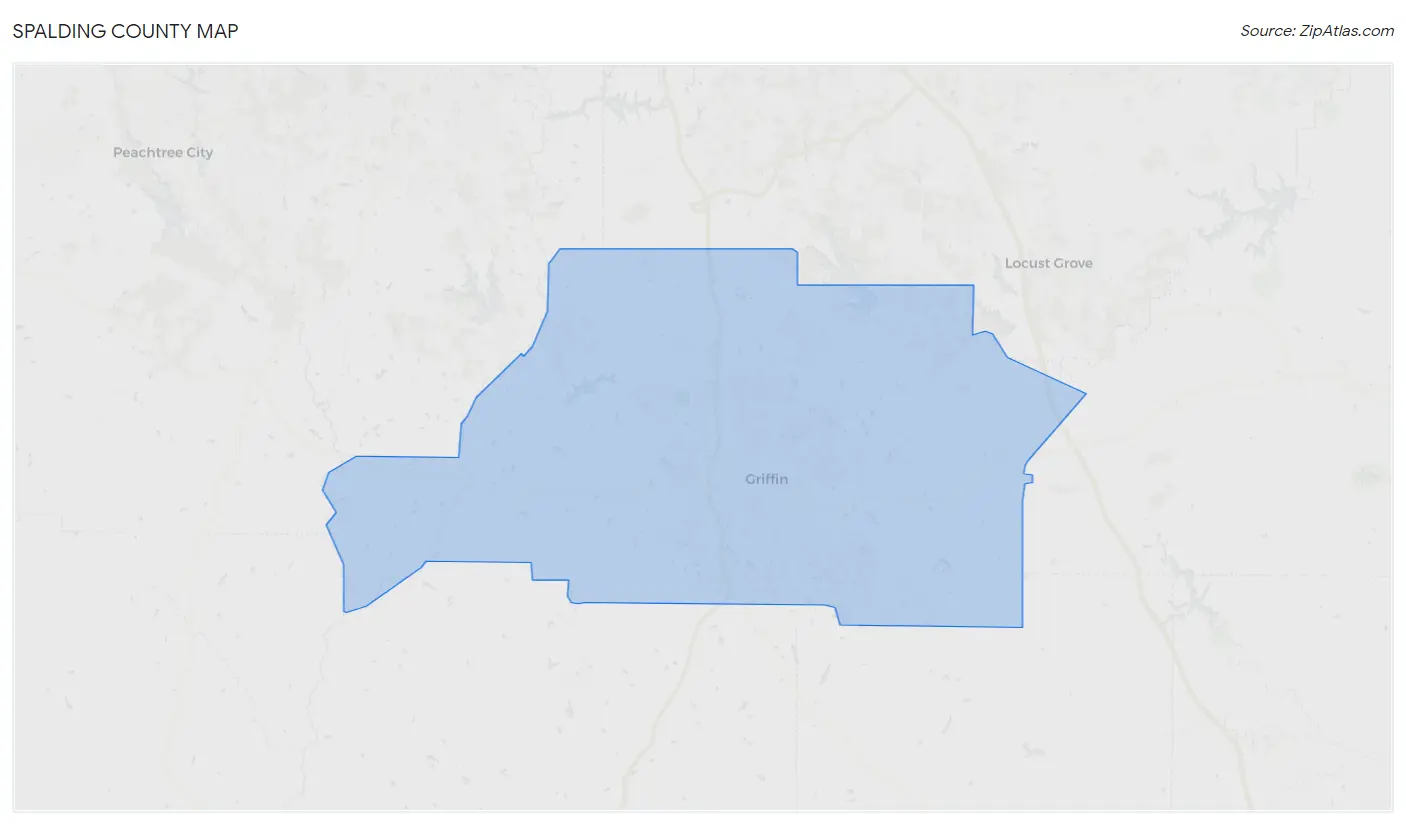
Spalding County Overview
$35,823
PER CAPITA INCOME
$68,566
AVG FAMILY INCOME
$57,367
AVG HOUSEHOLD INCOME
17.0%
WAGE / INCOME GAP [ % ]
83.0¢/ $1
WAGE / INCOME GAP [ $ ]
$13,109
FAMILY INCOME DEFICIT
0.55
INEQUALITY / GINI INDEX
67,415
TOTAL POPULATION
32,327
MALE POPULATION
35,088
FEMALE POPULATION
92.13
MALES / 100 FEMALES
108.54
FEMALES / 100 MALES
38.9
MEDIAN AGE
3.0
AVG FAMILY SIZE
2.5
AVG HOUSEHOLD SIZE
30,160
LABOR FORCE [ PEOPLE ]
56.6%
PERCENT IN LABOR FORCE
5.6%
UNEMPLOYMENT RATE
Income in Spalding County
Income Overview in Spalding County
Per Capita Income in Spalding County is $35,823, while median incomes of families and households are $68,566 and $57,367 respectively.
| Characteristic | Number | Measure |
| Per Capita Income | 67,415 | $35,823 |
| Median Family Income | 17,903 | $68,566 |
| Mean Family Income | 17,903 | $109,541 |
| Median Household Income | 26,303 | $57,367 |
| Mean Household Income | 26,303 | $89,899 |
| Income Deficit | 17,903 | $13,109 |
| Wage / Income Gap (%) | 67,415 | 17.04% |
| Wage / Income Gap ($) | 67,415 | 82.96¢ per $1 |
| Gini / Inequality Index | 67,415 | 0.55 |
Earnings by Sex in Spalding County
Average Earnings in Spalding County are $35,114, $40,000 for men and $33,183 for women, a difference of 17.0%.
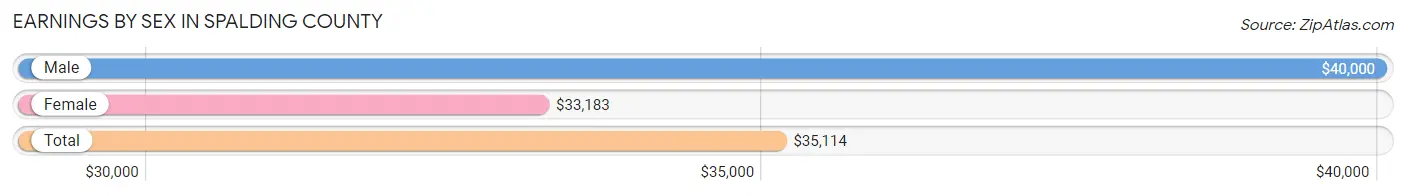
| Sex | Number | Average Earnings |
| Male | 16,204 (52.0%) | $40,000 |
| Female | 14,965 (48.0%) | $33,183 |
| Total | 31,169 (100.0%) | $35,114 |
Earnings by Sex by Income Bracket in Spalding County
The most common earnings brackets in Spalding County are $100,000+ for men (1,716 | 10.6%) and $30,000 to $34,999 for women (1,385 | 9.2%).
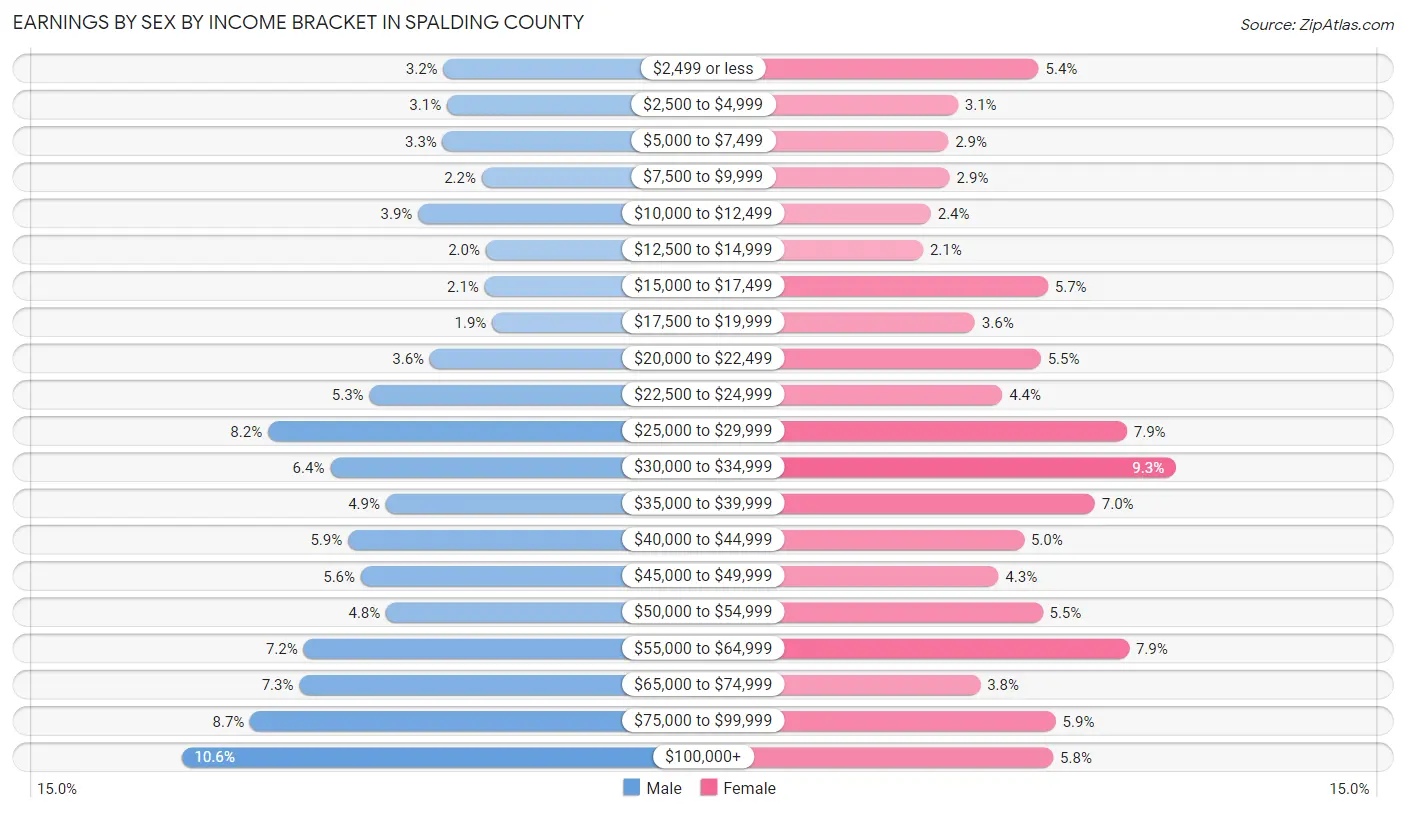
| Income | Male | Female |
| $2,499 or less | 524 (3.2%) | 807 (5.4%) |
| $2,500 to $4,999 | 507 (3.1%) | 467 (3.1%) |
| $5,000 to $7,499 | 526 (3.3%) | 427 (2.9%) |
| $7,500 to $9,999 | 349 (2.1%) | 432 (2.9%) |
| $10,000 to $12,499 | 638 (3.9%) | 353 (2.4%) |
| $12,500 to $14,999 | 330 (2.0%) | 320 (2.1%) |
| $15,000 to $17,499 | 335 (2.1%) | 846 (5.7%) |
| $17,500 to $19,999 | 301 (1.9%) | 538 (3.6%) |
| $20,000 to $22,499 | 585 (3.6%) | 816 (5.4%) |
| $22,500 to $24,999 | 860 (5.3%) | 654 (4.4%) |
| $25,000 to $29,999 | 1,322 (8.2%) | 1,178 (7.9%) |
| $30,000 to $34,999 | 1,039 (6.4%) | 1,385 (9.2%) |
| $35,000 to $39,999 | 786 (4.9%) | 1,043 (7.0%) |
| $40,000 to $44,999 | 957 (5.9%) | 745 (5.0%) |
| $45,000 to $49,999 | 900 (5.6%) | 637 (4.3%) |
| $50,000 to $54,999 | 785 (4.8%) | 823 (5.5%) |
| $55,000 to $64,999 | 1,160 (7.2%) | 1,187 (7.9%) |
| $65,000 to $74,999 | 1,180 (7.3%) | 561 (3.7%) |
| $75,000 to $99,999 | 1,404 (8.7%) | 878 (5.9%) |
| $100,000+ | 1,716 (10.6%) | 868 (5.8%) |
| Total | 16,204 (100.0%) | 14,965 (100.0%) |
Earnings by Sex by Educational Attainment in Spalding County
Average earnings in Spalding County are $44,589 for men and $33,904 for women, a difference of 24.0%. Men with an educational attainment of graduate degree enjoy the highest average annual earnings of $84,697, while those with less than high school education earn the least with $31,244. Women with an educational attainment of graduate degree earn the most with the average annual earnings of $61,745, while those with less than high school education have the smallest earnings of $22,531.
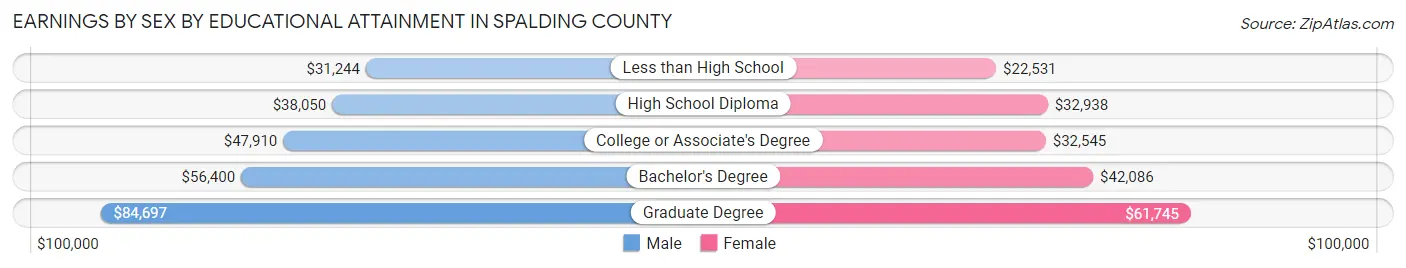
| Educational Attainment | Male Income | Female Income |
| Less than High School | $31,244 | $22,531 |
| High School Diploma | $38,050 | $32,938 |
| College or Associate's Degree | $47,910 | $32,545 |
| Bachelor's Degree | $56,400 | $42,086 |
| Graduate Degree | $84,697 | $61,745 |
| Total | $44,589 | $33,904 |
Family Income in Spalding County
Family Income Brackets in Spalding County
According to the Spalding County family income data, there are 3,670 families falling into the $50,000 to $74,999 income range, which is the most common income bracket and makes up 20.5% of all families. Conversely, the $10,000 to $14,999 income bracket is the least frequent group with only 483 families (2.7%) belonging to this category.
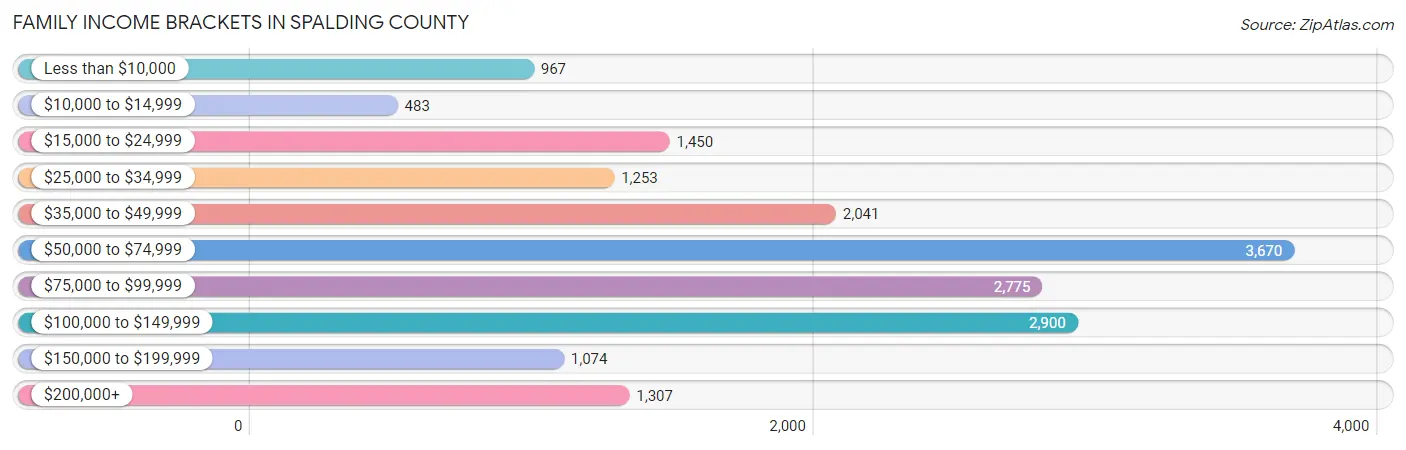
| Income Bracket | # Families | % Families |
| Less than $10,000 | 967 | 5.4% |
| $10,000 to $14,999 | 483 | 2.7% |
| $15,000 to $24,999 | 1,450 | 8.1% |
| $25,000 to $34,999 | 1,253 | 7.0% |
| $35,000 to $49,999 | 2,041 | 11.4% |
| $50,000 to $74,999 | 3,670 | 20.5% |
| $75,000 to $99,999 | 2,775 | 15.5% |
| $100,000 to $149,999 | 2,900 | 16.2% |
| $150,000 to $199,999 | 1,074 | 6.0% |
| $200,000+ | 1,307 | 7.3% |
Family Income by Famaliy Size in Spalding County
4-person families (3,512 | 19.6%) account for the highest median family income in Spalding County with $74,619 per family, while 2-person families (8,264 | 46.2%) have the highest median income of $33,316 per family member.
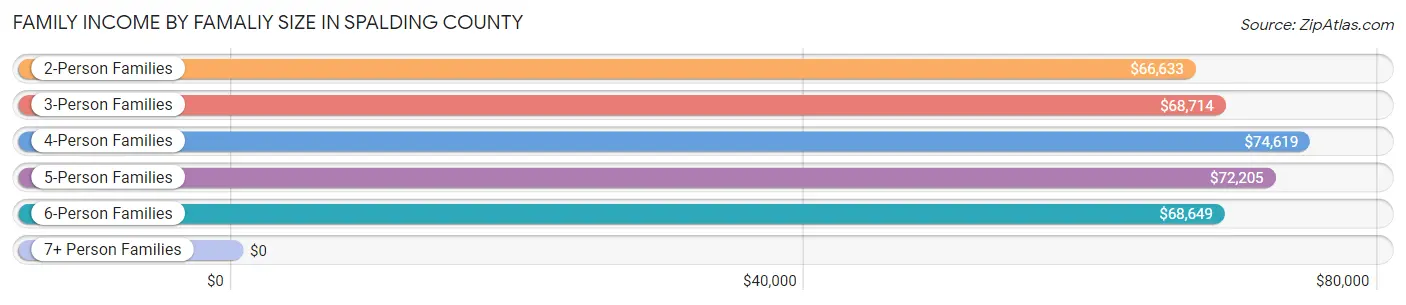
| Income Bracket | # Families | Median Income |
| 2-Person Families | 8,264 (46.2%) | $66,633 |
| 3-Person Families | 4,286 (23.9%) | $68,714 |
| 4-Person Families | 3,512 (19.6%) | $74,619 |
| 5-Person Families | 1,445 (8.1%) | $72,205 |
| 6-Person Families | 268 (1.5%) | $68,649 |
| 7+ Person Families | 128 (0.7%) | $0 |
| Total | 17,903 (100.0%) | $68,566 |
Family Income by Number of Earners in Spalding County
The median family income in Spalding County is $68,566, with families comprising 3+ earners (2,006) having the highest median family income of $119,700, while families with no earners (3,893) have the lowest median family income of $37,982, accounting for 11.2% and 21.7% of families, respectively.
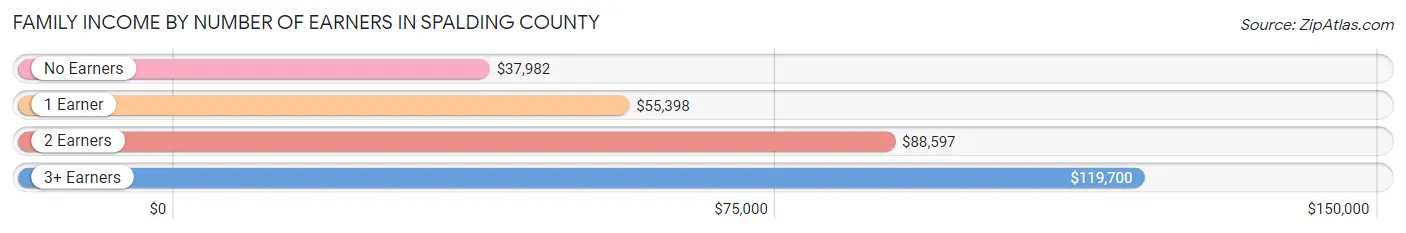
| Number of Earners | # Families | Median Income |
| No Earners | 3,893 (21.7%) | $37,982 |
| 1 Earner | 5,936 (33.2%) | $55,398 |
| 2 Earners | 6,068 (33.9%) | $88,597 |
| 3+ Earners | 2,006 (11.2%) | $119,700 |
| Total | 17,903 (100.0%) | $68,566 |
Household Income in Spalding County
Household Income Brackets in Spalding County
With 4,682 households falling in the category, the $50,000 to $74,999 income range is the most frequent in Spalding County, accounting for 17.8% of all households. In contrast, only 1,131 households (4.3%) fall into the $150,000 to $199,999 income bracket, making it the least populous group.
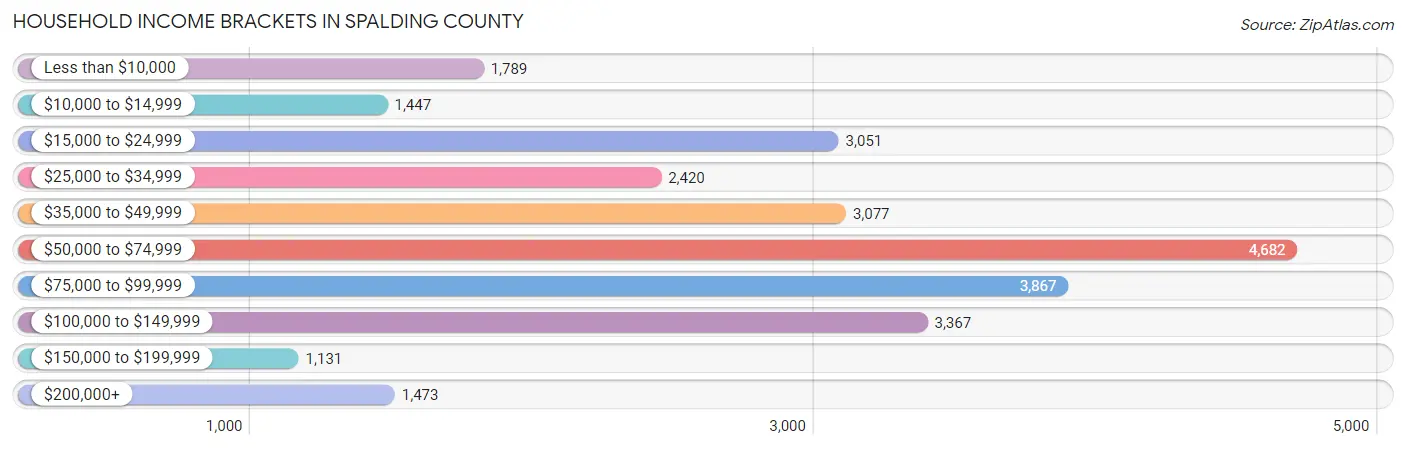
| Income Bracket | # Households | % Households |
| Less than $10,000 | 1,789 | 6.8% |
| $10,000 to $14,999 | 1,447 | 5.5% |
| $15,000 to $24,999 | 3,051 | 11.6% |
| $25,000 to $34,999 | 2,420 | 9.2% |
| $35,000 to $49,999 | 3,077 | 11.7% |
| $50,000 to $74,999 | 4,682 | 17.8% |
| $75,000 to $99,999 | 3,867 | 14.7% |
| $100,000 to $149,999 | 3,367 | 12.8% |
| $150,000 to $199,999 | 1,131 | 4.3% |
| $200,000+ | 1,473 | 5.6% |
Household Income by Householder Age in Spalding County
The median household income in Spalding County is $57,367, with the highest median household income of $73,184 found in the 45 to 64 years age bracket for the primary householder. A total of 9,636 households (36.6%) fall into this category. Meanwhile, the 15 to 24 years age bracket for the primary householder has the lowest median household income of $42,044, with 713 households (2.7%) in this group.
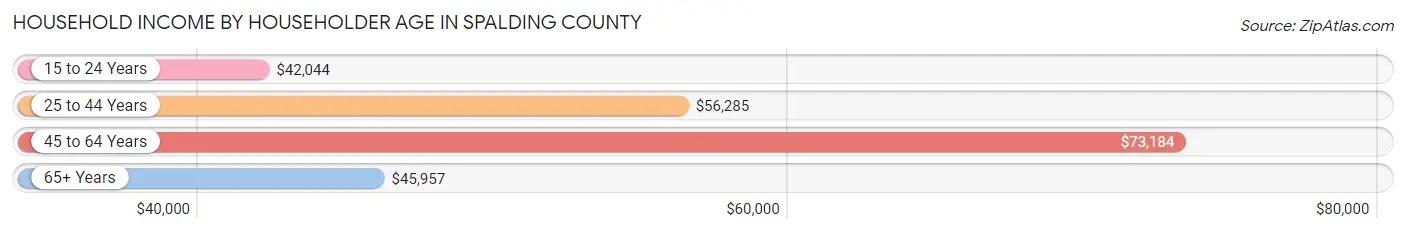
| Income Bracket | # Households | Median Income |
| 15 to 24 Years | 713 (2.7%) | $42,044 |
| 25 to 44 Years | 8,140 (30.9%) | $56,285 |
| 45 to 64 Years | 9,636 (36.6%) | $73,184 |
| 65+ Years | 7,814 (29.7%) | $45,957 |
| Total | 26,303 (100.0%) | $57,367 |
Poverty in Spalding County
Income Below Poverty by Sex and Age in Spalding County
With 17.4% poverty level for males and 20.0% for females among the residents of Spalding County, 5 year old males and 12 to 14 year old females are the most vulnerable to poverty, with 177 males (44.7%) and 415 females (36.3%) in their respective age groups living below the poverty level.
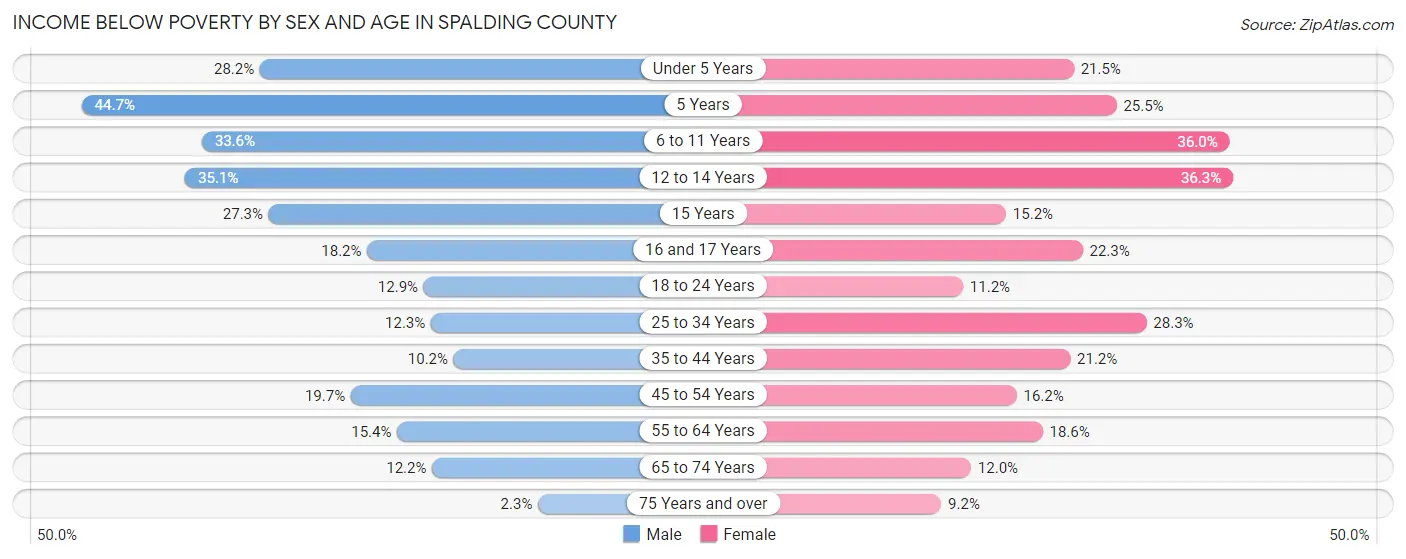
| Age Bracket | Male | Female |
| Under 5 Years | 588 (28.1%) | 407 (21.5%) |
| 5 Years | 177 (44.7%) | 118 (25.5%) |
| 6 to 11 Years | 1,010 (33.6%) | 958 (36.0%) |
| 12 to 14 Years | 371 (35.1%) | 415 (36.3%) |
| 15 Years | 135 (27.3%) | 83 (15.2%) |
| 16 and 17 Years | 149 (18.2%) | 183 (22.3%) |
| 18 to 24 Years | 349 (12.9%) | 301 (11.2%) |
| 25 to 34 Years | 536 (12.3%) | 1,317 (28.3%) |
| 35 to 44 Years | 353 (10.2%) | 886 (21.2%) |
| 45 to 54 Years | 729 (19.7%) | 703 (16.2%) |
| 55 to 64 Years | 622 (15.4%) | 825 (18.6%) |
| 65 to 74 Years | 401 (12.2%) | 500 (12.0%) |
| 75 Years and over | 45 (2.3%) | 251 (9.2%) |
| Total | 5,465 (17.4%) | 6,947 (20.0%) |
Income Above Poverty by Sex and Age in Spalding County
According to the poverty statistics in Spalding County, males aged 75 years and over and females aged 75 years and over are the age groups that are most secure financially, with 97.7% of males and 90.8% of females in these age groups living above the poverty line.
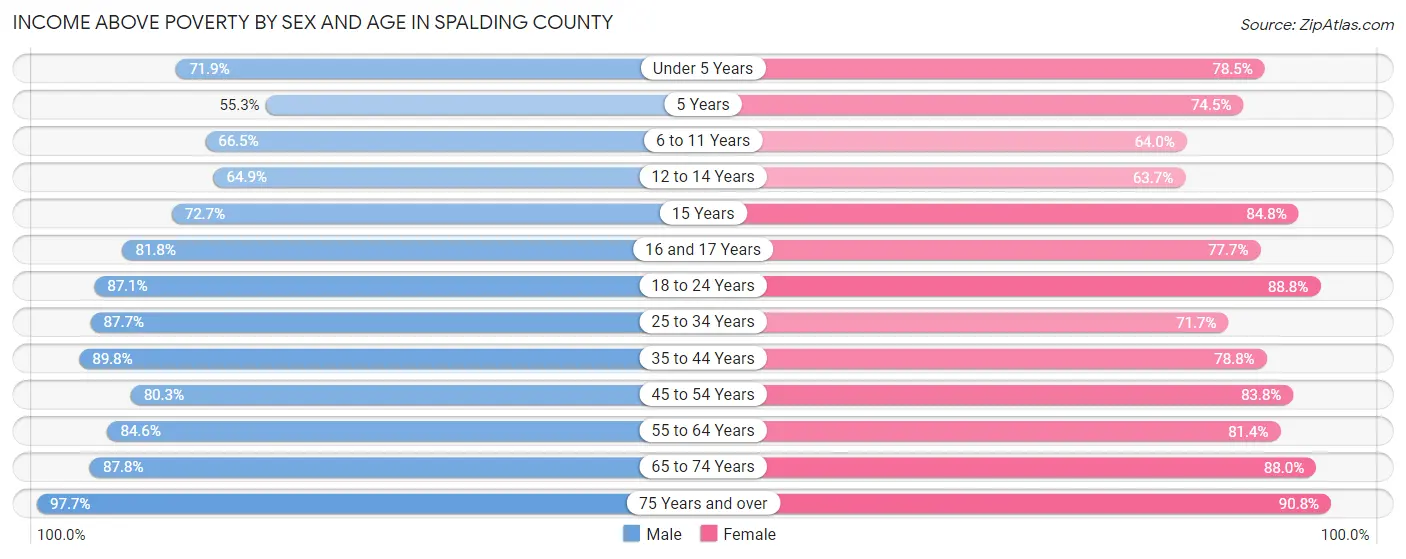
| Age Bracket | Male | Female |
| Under 5 Years | 1,501 (71.9%) | 1,484 (78.5%) |
| 5 Years | 219 (55.3%) | 345 (74.5%) |
| 6 to 11 Years | 2,000 (66.4%) | 1,704 (64.0%) |
| 12 to 14 Years | 686 (64.9%) | 728 (63.7%) |
| 15 Years | 359 (72.7%) | 462 (84.8%) |
| 16 and 17 Years | 670 (81.8%) | 636 (77.7%) |
| 18 to 24 Years | 2,349 (87.1%) | 2,376 (88.8%) |
| 25 to 34 Years | 3,834 (87.7%) | 3,342 (71.7%) |
| 35 to 44 Years | 3,123 (89.8%) | 3,295 (78.8%) |
| 45 to 54 Years | 2,969 (80.3%) | 3,630 (83.8%) |
| 55 to 64 Years | 3,415 (84.6%) | 3,604 (81.4%) |
| 65 to 74 Years | 2,898 (87.8%) | 3,675 (88.0%) |
| 75 Years and over | 1,890 (97.7%) | 2,472 (90.8%) |
| Total | 25,913 (82.6%) | 27,753 (80.0%) |
Income Below Poverty Among Married-Couple Families in Spalding County
The poverty statistics for married-couple families in Spalding County show that 5.8% or 651 of the total 11,261 families live below the poverty line. Families with 3 or 4 children have the highest poverty rate of 21.8%, comprising of 141 families. On the other hand, families with no children have the lowest poverty rate of 3.4%, which includes 245 families.
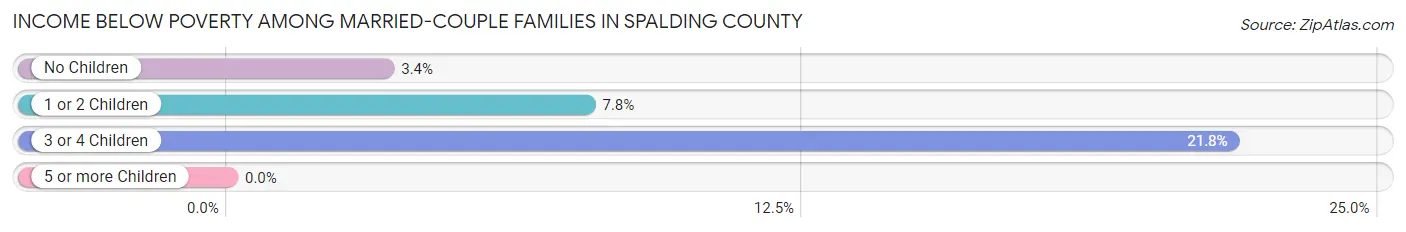
| Children | Above Poverty | Below Poverty |
| No Children | 6,964 (96.6%) | 245 (3.4%) |
| 1 or 2 Children | 3,140 (92.2%) | 265 (7.8%) |
| 3 or 4 Children | 506 (78.2%) | 141 (21.8%) |
| 5 or more Children | 0 (0.0%) | 0 (0.0%) |
| Total | 10,610 (94.2%) | 651 (5.8%) |
Income Below Poverty Among Single-Parent Households in Spalding County
According to the poverty data in Spalding County, 9.7% or 146 single-father households and 35.0% or 1,798 single-mother households are living below the poverty line. Among single-father households, those with 5 or more children have the highest poverty rate, with 27 households (100.0%) experiencing poverty. Likewise, among single-mother households, those with 5 or more children have the highest poverty rate, with 13 households (100.0%) falling below the poverty line.
| Children | Single Father | Single Mother |
| No Children | 42 (5.5%) | 340 (17.5%) |
| 1 or 2 Children | 60 (10.2%) | 976 (41.3%) |
| 3 or 4 Children | 17 (13.3%) | 469 (57.6%) |
| 5 or more Children | 27 (100.0%) | 13 (100.0%) |
| Total | 146 (9.7%) | 1,798 (35.0%) |
Income Below Poverty Among Married-Couple vs Single-Parent Households in Spalding County
The poverty data for Spalding County shows that 651 of the married-couple family households (5.8%) and 1,944 of the single-parent households (29.3%) are living below the poverty level. Within the married-couple family households, those with 3 or 4 children have the highest poverty rate, with 141 households (21.8%) falling below the poverty line. Among the single-parent households, those with 5 or more children have the highest poverty rate, with 40 household (100.0%) living below poverty.
| Children | Married-Couple Families | Single-Parent Households |
| No Children | 245 (3.4%) | 382 (14.1%) |
| 1 or 2 Children | 265 (7.8%) | 1,036 (35.1%) |
| 3 or 4 Children | 141 (21.8%) | 486 (51.5%) |
| 5 or more Children | 0 (0.0%) | 40 (100.0%) |
| Total | 651 (5.8%) | 1,944 (29.3%) |
Race in Spalding County
The most populous races in Spalding County are White / Caucasian (39,829 | 59.1%), Black / African American (23,260 | 34.5%), and Hispanic or Latino (3,444 | 5.1%).
| Race | # Population | % Population |
| Asian | 597 | 0.9% |
| Black / African American | 23,260 | 34.5% |
| Hawaiian / Pacific | 0 | 0.0% |
| Hispanic or Latino | 3,444 | 5.1% |
| Native / Alaskan | 309 | 0.5% |
| White / Caucasian | 39,829 | 59.1% |
| Two or more Races | 2,674 | 4.0% |
| Some other Race | 746 | 1.1% |
| Total | 67,415 | 100.0% |
Ancestry in Spalding County
The most populous ancestries reported in Spalding County are American (25,765 | 38.2%), English (4,302 | 6.4%), Irish (3,186 | 4.7%), German (2,489 | 3.7%), and Mexican (2,051 | 3.0%), together accounting for 56.1% of all Spalding County residents.
| Ancestry | # Population | % Population |
| African | 501 | 0.7% |
| Aleut | 29 | 0.0% |
| American | 25,765 | 38.2% |
| Arab | 61 | 0.1% |
| Australian | 13 | 0.0% |
| Austrian | 33 | 0.1% |
| Bhutanese | 86 | 0.1% |
| Blackfeet | 19 | 0.0% |
| British | 278 | 0.4% |
| Burmese | 155 | 0.2% |
| Canadian | 46 | 0.1% |
| Celtic | 106 | 0.2% |
| Central American | 242 | 0.4% |
| Cherokee | 41 | 0.1% |
| Choctaw | 5 | 0.0% |
| Colombian | 10 | 0.0% |
| Creek | 104 | 0.2% |
| Cuban | 39 | 0.1% |
| Czech | 5 | 0.0% |
| Danish | 17 | 0.0% |
| Dominican | 43 | 0.1% |
| Dutch | 155 | 0.2% |
| Eastern European | 13 | 0.0% |
| Ecuadorian | 64 | 0.1% |
| English | 4,302 | 6.4% |
| European | 578 | 0.9% |
| Finnish | 11 | 0.0% |
| French | 356 | 0.5% |
| French Canadian | 42 | 0.1% |
| German | 2,489 | 3.7% |
| Guatemalan | 26 | 0.0% |
| Haitian | 55 | 0.1% |
| Honduran | 198 | 0.3% |
| Hungarian | 18 | 0.0% |
| Indian (Asian) | 24 | 0.0% |
| Iranian | 16 | 0.0% |
| Irish | 3,186 | 4.7% |
| Israeli | 32 | 0.1% |
| Italian | 625 | 0.9% |
| Jamaican | 74 | 0.1% |
| Japanese | 16 | 0.0% |
| Korean | 152 | 0.2% |
| Lebanese | 44 | 0.1% |
| Lumbee | 21 | 0.0% |
| Mexican | 2,051 | 3.0% |
| Moroccan | 17 | 0.0% |
| Northern European | 28 | 0.0% |
| Norwegian | 365 | 0.5% |
| Pakistani | 1 | 0.0% |
| Panamanian | 10 | 0.0% |
| Peruvian | 46 | 0.1% |
| Polish | 238 | 0.4% |
| Portuguese | 32 | 0.1% |
| Puerto Rican | 677 | 1.0% |
| Russian | 135 | 0.2% |
| Salvadoran | 8 | 0.0% |
| Scandinavian | 59 | 0.1% |
| Scotch-Irish | 555 | 0.8% |
| Scottish | 886 | 1.3% |
| Slavic | 19 | 0.0% |
| South African | 100 | 0.2% |
| South American | 163 | 0.2% |
| Spaniard | 96 | 0.1% |
| Sri Lankan | 10 | 0.0% |
| Subsaharan African | 601 | 0.9% |
| Swedish | 145 | 0.2% |
| Swiss | 141 | 0.2% |
| Syrian | 16 | 0.0% |
| Thai | 183 | 0.3% |
| Trinidadian and Tobagonian | 228 | 0.3% |
| Turkish | 20 | 0.0% |
| Ukrainian | 140 | 0.2% |
| Uruguayan | 25 | 0.0% |
| Venezuelan | 18 | 0.0% |
| Welsh | 194 | 0.3% |
| West Indian | 20 | 0.0% | View All 76 Rows |
Immigrants in Spalding County
The most numerous immigrant groups reported in Spalding County came from Latin America (970 | 1.4%), Asia (607 | 0.9%), Central America (587 | 0.9%), Mexico (380 | 0.6%), and Caribbean (311 | 0.5%), together accounting for 4.2% of all Spalding County residents.
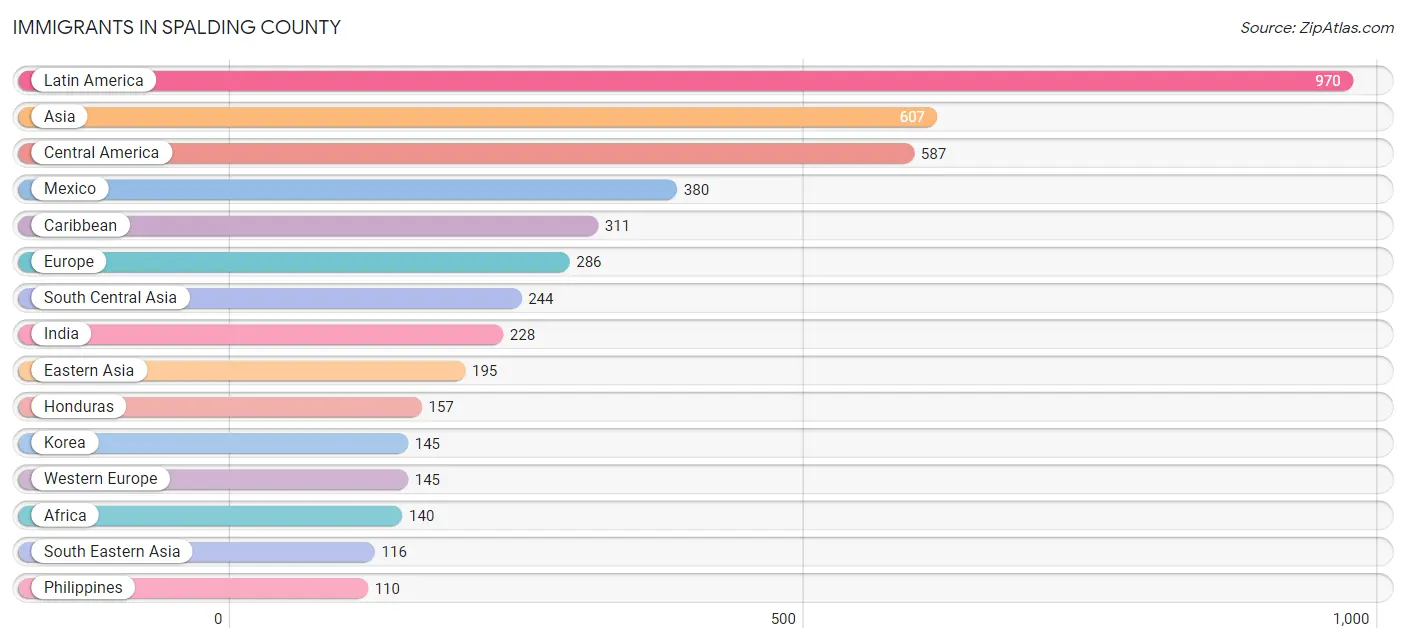
| Immigration Origin | # Population | % Population |
| Africa | 140 | 0.2% |
| Asia | 607 | 0.9% |
| Cambodia | 5 | 0.0% |
| Canada | 8 | 0.0% |
| Caribbean | 311 | 0.5% |
| Central America | 587 | 0.9% |
| Colombia | 10 | 0.0% |
| Cuba | 75 | 0.1% |
| Dominican Republic | 43 | 0.1% |
| Eastern Asia | 195 | 0.3% |
| Eastern Europe | 73 | 0.1% |
| Ecuador | 4 | 0.0% |
| El Salvador | 8 | 0.0% |
| England | 44 | 0.1% |
| Europe | 286 | 0.4% |
| Germany | 106 | 0.2% |
| Ghana | 38 | 0.1% |
| Haiti | 38 | 0.1% |
| Honduras | 157 | 0.2% |
| Hungary | 18 | 0.0% |
| India | 228 | 0.3% |
| Iran | 16 | 0.0% |
| Jamaica | 56 | 0.1% |
| Japan | 50 | 0.1% |
| Korea | 145 | 0.2% |
| Kuwait | 52 | 0.1% |
| Latin America | 970 | 1.4% |
| Mexico | 380 | 0.6% |
| Netherlands | 39 | 0.1% |
| Northern Europe | 68 | 0.1% |
| Panama | 42 | 0.1% |
| Peru | 33 | 0.1% |
| Philippines | 110 | 0.2% |
| Russia | 17 | 0.0% |
| Scotland | 16 | 0.0% |
| South Africa | 72 | 0.1% |
| South America | 72 | 0.1% |
| South Central Asia | 244 | 0.4% |
| South Eastern Asia | 116 | 0.2% |
| Thailand | 1 | 0.0% |
| Trinidad and Tobago | 89 | 0.1% |
| Uruguay | 25 | 0.0% |
| Western Africa | 38 | 0.1% |
| Western Asia | 52 | 0.1% |
| Western Europe | 145 | 0.2% | View All 45 Rows |
Sex and Age in Spalding County
Sex and Age in Spalding County
The most populous age groups in Spalding County are 25 to 29 Years (2,425 | 7.5%) for men and 25 to 29 Years (2,370 | 6.8%) for women.
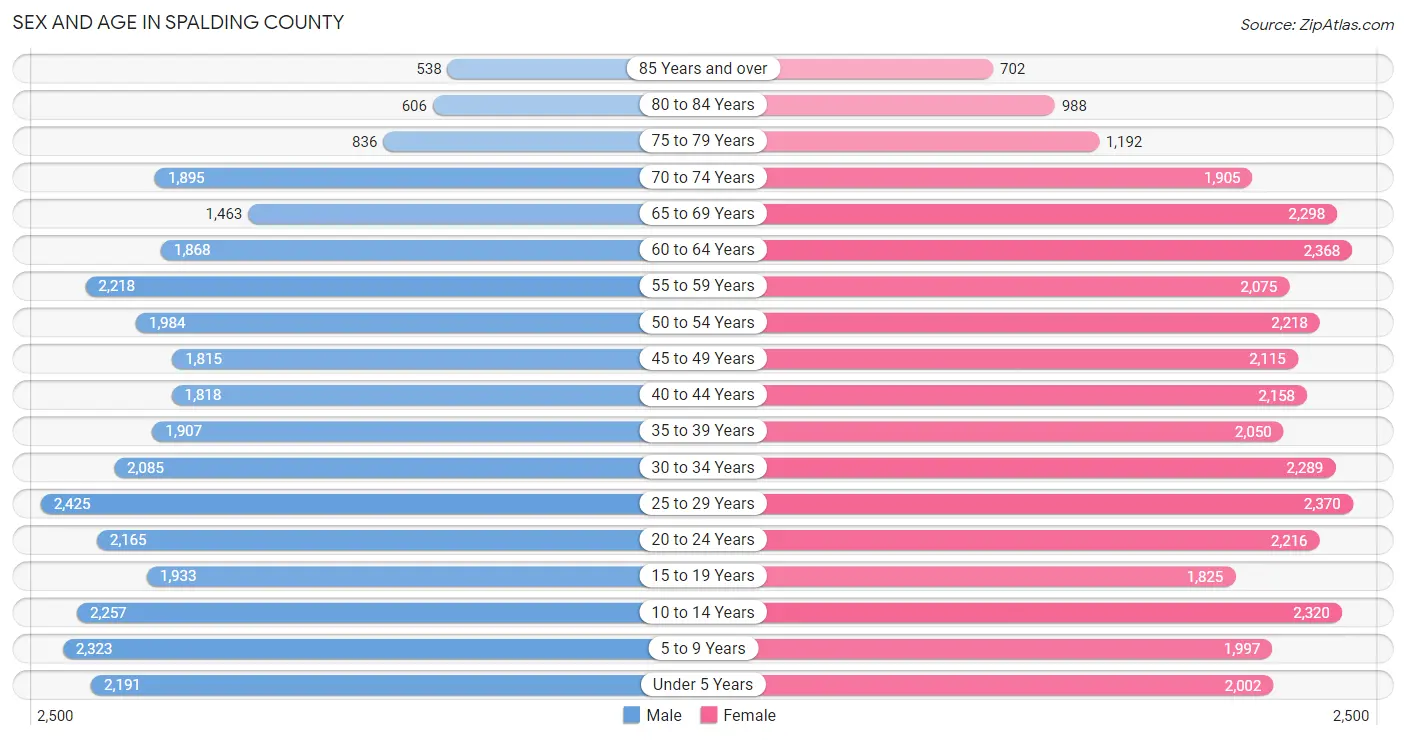
| Age Bracket | Male | Female |
| Under 5 Years | 2,191 (6.8%) | 2,002 (5.7%) |
| 5 to 9 Years | 2,323 (7.2%) | 1,997 (5.7%) |
| 10 to 14 Years | 2,257 (7.0%) | 2,320 (6.6%) |
| 15 to 19 Years | 1,933 (6.0%) | 1,825 (5.2%) |
| 20 to 24 Years | 2,165 (6.7%) | 2,216 (6.3%) |
| 25 to 29 Years | 2,425 (7.5%) | 2,370 (6.8%) |
| 30 to 34 Years | 2,085 (6.5%) | 2,289 (6.5%) |
| 35 to 39 Years | 1,907 (5.9%) | 2,050 (5.8%) |
| 40 to 44 Years | 1,818 (5.6%) | 2,158 (6.1%) |
| 45 to 49 Years | 1,815 (5.6%) | 2,115 (6.0%) |
| 50 to 54 Years | 1,984 (6.1%) | 2,218 (6.3%) |
| 55 to 59 Years | 2,218 (6.9%) | 2,075 (5.9%) |
| 60 to 64 Years | 1,868 (5.8%) | 2,368 (6.8%) |
| 65 to 69 Years | 1,463 (4.5%) | 2,298 (6.6%) |
| 70 to 74 Years | 1,895 (5.9%) | 1,905 (5.4%) |
| 75 to 79 Years | 836 (2.6%) | 1,192 (3.4%) |
| 80 to 84 Years | 606 (1.9%) | 988 (2.8%) |
| 85 Years and over | 538 (1.7%) | 702 (2.0%) |
| Total | 32,327 (100.0%) | 35,088 (100.0%) |
Families and Households in Spalding County
Median Family Size in Spalding County
The median family size in Spalding County is 3.05 persons per family, with single female/mother families (5,134 | 28.7%) accounting for the largest median family size of 3.15 persons per family. On the other hand, single male/father families (1,508 | 8.4%) represent the smallest median family size with 2.61 persons per family.
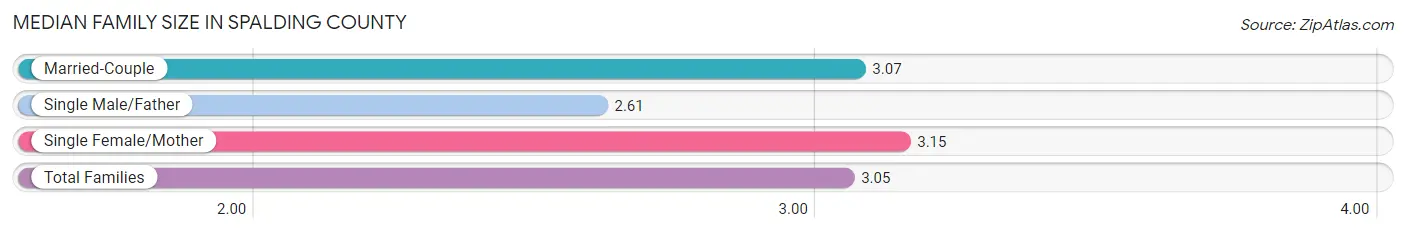
| Family Type | # Families | Family Size |
| Married-Couple | 11,261 (62.9%) | 3.07 |
| Single Male/Father | 1,508 (8.4%) | 2.61 |
| Single Female/Mother | 5,134 (28.7%) | 3.15 |
| Total Families | 17,903 (100.0%) | 3.05 |
Median Household Size in Spalding County
The median household size in Spalding County is 2.52 persons per household, with single female/mother households (5,134 | 19.5%) accounting for the largest median household size of 3.3 persons per household. non-family households (8,400 | 31.9%) represent the smallest median household size with 1.16 persons per household.
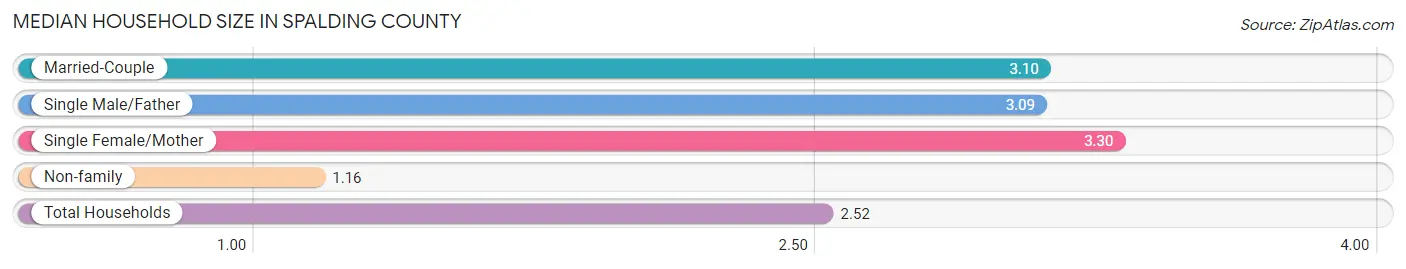
| Household Type | # Households | Household Size |
| Married-Couple | 11,261 (42.8%) | 3.10 |
| Single Male/Father | 1,508 (5.7%) | 3.09 |
| Single Female/Mother | 5,134 (19.5%) | 3.30 |
| Non-family | 8,400 (31.9%) | 1.16 |
| Total Households | 26,303 (100.0%) | 2.52 |
Household Size by Marriage Status in Spalding County
Out of a total of 26,303 households in Spalding County, 17,903 (68.1%) are family households, while 8,400 (31.9%) are nonfamily households. The most numerous type of family households are 2-person households, comprising 7,864, and the most common type of nonfamily households are 1-person households, comprising 7,225.
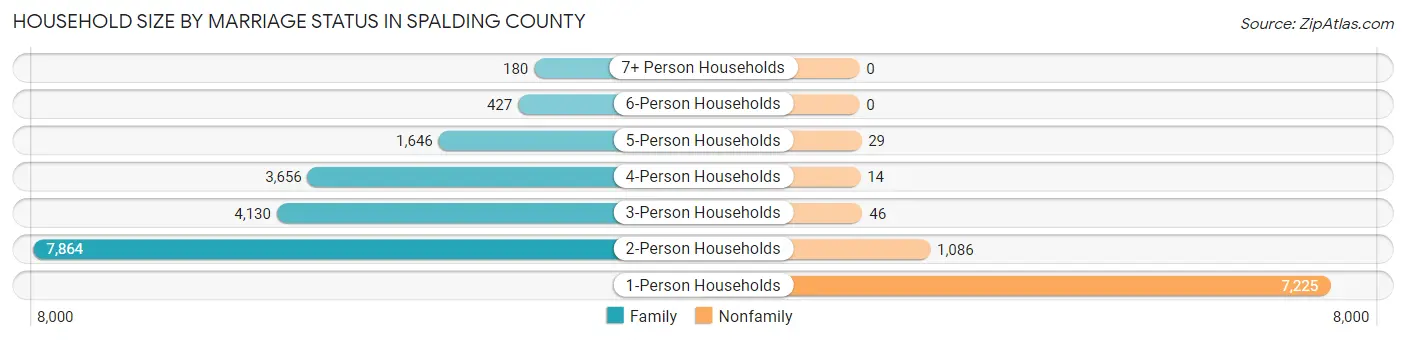
| Household Size | Family Households | Nonfamily Households |
| 1-Person Households | - | 7,225 (27.5%) |
| 2-Person Households | 7,864 (29.9%) | 1,086 (4.1%) |
| 3-Person Households | 4,130 (15.7%) | 46 (0.2%) |
| 4-Person Households | 3,656 (13.9%) | 14 (0.1%) |
| 5-Person Households | 1,646 (6.3%) | 29 (0.1%) |
| 6-Person Households | 427 (1.6%) | 0 (0.0%) |
| 7+ Person Households | 180 (0.7%) | 0 (0.0%) |
| Total | 17,903 (68.1%) | 8,400 (31.9%) |
Female Fertility in Spalding County
Fertility by Age in Spalding County
Average fertility rate in Spalding County is 66.0 births per 1,000 women. Women in the age bracket of 20 to 34 years have the highest fertility rate with 137.0 births per 1,000 women. Women in the age bracket of 20 to 34 years acount for 92.4% of all women with births.
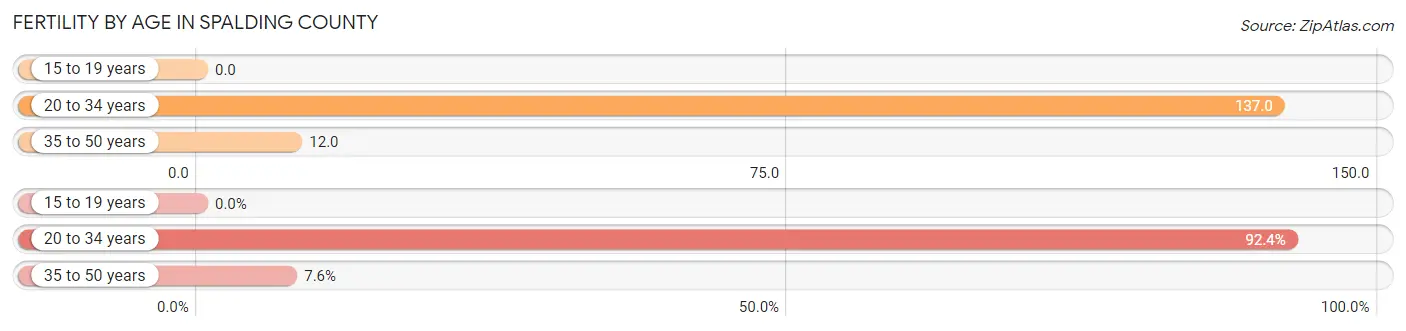
| Age Bracket | Women with Births | Births / 1,000 Women |
| 15 to 19 years | 0 (0.0%) | 0.0 |
| 20 to 34 years | 940 (92.4%) | 137.0 |
| 35 to 50 years | 77 (7.6%) | 12.0 |
| Total | 1,017 (100.0%) | 66.0 |
Fertility by Age by Marriage Status in Spalding County
42.9% of women with births (1,017) in Spalding County are married. The highest percentage of unmarried women with births falls into 35 to 50 years age bracket with 76.6% of them unmarried at the time of birth, while the lowest percentage of unmarried women with births belong to 20 to 34 years age bracket with 55.5% of them unmarried.
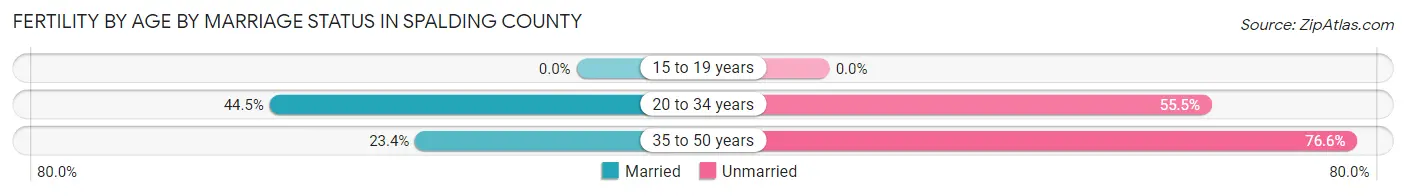
| Age Bracket | Married | Unmarried |
| 15 to 19 years | 0 (0.0%) | 0 (0.0%) |
| 20 to 34 years | 418 (44.5%) | 522 (55.5%) |
| 35 to 50 years | 18 (23.4%) | 59 (76.6%) |
| Total | 436 (42.9%) | 581 (57.1%) |
Fertility by Education in Spalding County
Average fertility rate in Spalding County is 66.0 births per 1,000 women. Women with the education attainment of graduate degree have the highest fertility rate of 96.0 births per 1,000 women, while women with the education attainment of less than high school have the lowest fertility at 40.0 births per 1,000 women. Women with the education attainment of high school diploma represent 42.7% of all women with births.
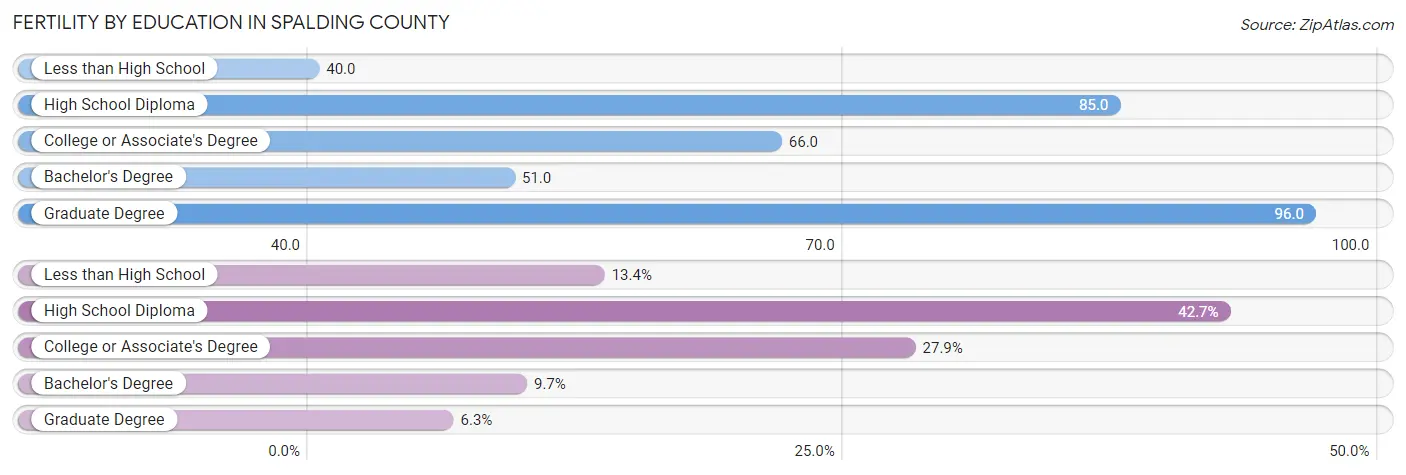
| Educational Attainment | Women with Births | Births / 1,000 Women |
| Less than High School | 136 (13.4%) | 40.0 |
| High School Diploma | 434 (42.7%) | 85.0 |
| College or Associate's Degree | 284 (27.9%) | 66.0 |
| Bachelor's Degree | 99 (9.7%) | 51.0 |
| Graduate Degree | 64 (6.3%) | 96.0 |
| Total | 1,017 (100.0%) | 66.0 |
Fertility by Education by Marriage Status in Spalding County
57.1% of women with births in Spalding County are unmarried. Women with the educational attainment of graduate degree are most likely to be married with 100.0% of them married at childbirth, while women with the educational attainment of less than high school are least likely to be married with 100.0% of them unmarried at childbirth.
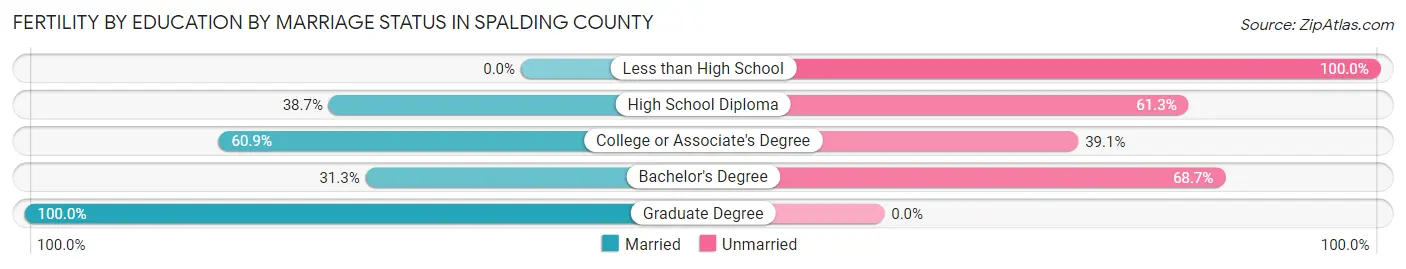
| Educational Attainment | Married | Unmarried |
| Less than High School | 0 (0.0%) | 136 (100.0%) |
| High School Diploma | 168 (38.7%) | 266 (61.3%) |
| College or Associate's Degree | 173 (60.9%) | 111 (39.1%) |
| Bachelor's Degree | 31 (31.3%) | 68 (68.7%) |
| Graduate Degree | 64 (100.0%) | 0 (0.0%) |
| Total | 436 (42.9%) | 581 (57.1%) |
Employment Characteristics in Spalding County
Employment by Class of Employer in Spalding County
Among the 27,798 employed individuals in Spalding County, private company employees (20,365 | 73.3%), local government employees (2,225 | 8.0%), and not-for-profit organizations (1,434 | 5.2%) make up the most common classes of employment.
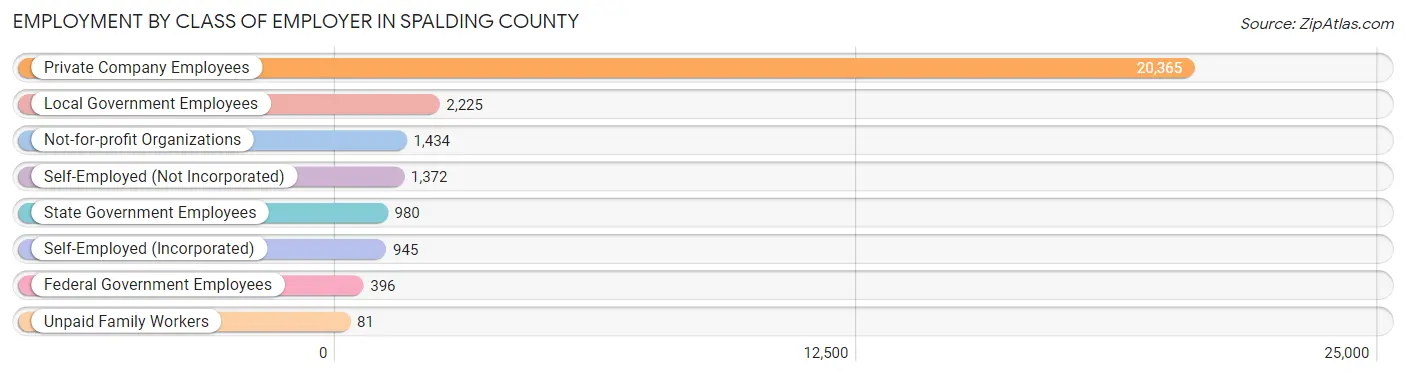
| Employer Class | # Employees | % Employees |
| Private Company Employees | 20,365 | 73.3% |
| Self-Employed (Incorporated) | 945 | 3.4% |
| Self-Employed (Not Incorporated) | 1,372 | 4.9% |
| Not-for-profit Organizations | 1,434 | 5.2% |
| Local Government Employees | 2,225 | 8.0% |
| State Government Employees | 980 | 3.5% |
| Federal Government Employees | 396 | 1.4% |
| Unpaid Family Workers | 81 | 0.3% |
| Total | 27,798 | 100.0% |
Employment Status by Age in Spalding County
According to the labor force statistics for Spalding County, out of the total population over 16 years of age (53,286), 56.6% or 30,160 individuals are in the labor force, with 5.6% or 1,689 of them unemployed. The age group with the highest labor force participation rate is 25 to 29 years, with 83.2% or 3,989 individuals in the labor force. Within the labor force, the 20 to 24 years age range has the highest percentage of unemployed individuals, with 16.0% or 542 of them being unemployed.
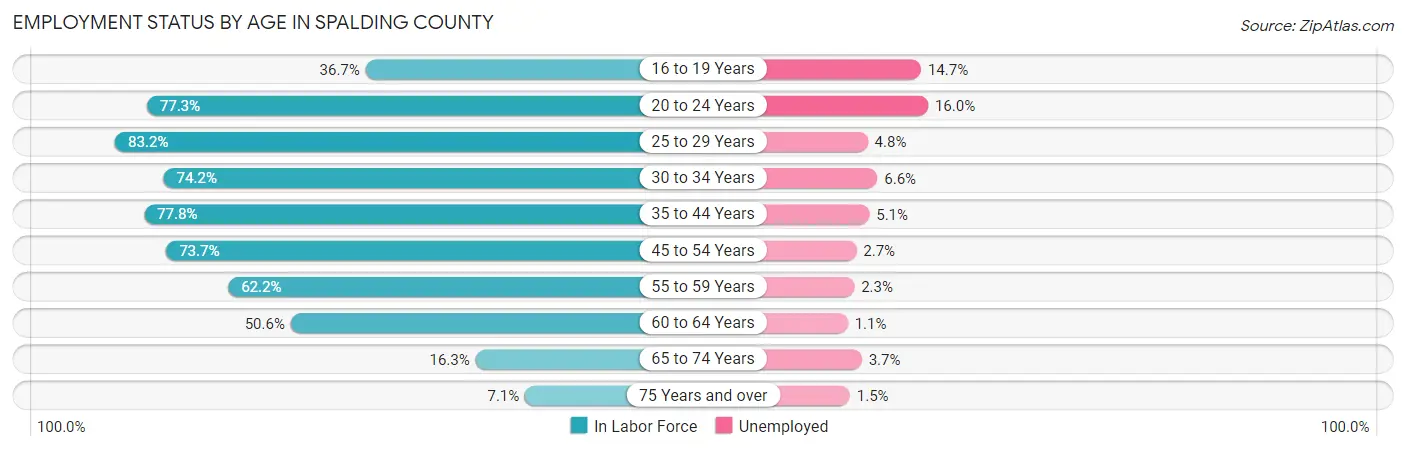
| Age Bracket | In Labor Force | Unemployed |
| 16 to 19 Years | 998 (36.7%) | 147 (14.7%) |
| 20 to 24 Years | 3,387 (77.3%) | 542 (16.0%) |
| 25 to 29 Years | 3,989 (83.2%) | 191 (4.8%) |
| 30 to 34 Years | 3,246 (74.2%) | 214 (6.6%) |
| 35 to 44 Years | 6,172 (77.8%) | 315 (5.1%) |
| 45 to 54 Years | 5,993 (73.7%) | 162 (2.7%) |
| 55 to 59 Years | 2,670 (62.2%) | 61 (2.3%) |
| 60 to 64 Years | 2,143 (50.6%) | 24 (1.1%) |
| 65 to 74 Years | 1,232 (16.3%) | 46 (3.7%) |
| 75 Years and over | 345 (7.1%) | 5 (1.5%) |
| Total | 30,160 (56.6%) | 1,689 (5.6%) |
Employment Status by Educational Attainment in Spalding County
According to labor force statistics for Spalding County, 71.7% of individuals (24,208) out of the total population between 25 and 64 years of age (33,763) are in the labor force, with 4.0% or 968 of them being unemployed. The group with the highest labor force participation rate are those with the educational attainment of bachelor's degree or higher, with 85.9% or 5,288 individuals in the labor force. Within the labor force, individuals with less than high school education have the highest percentage of unemployment, with 9.0% or 242 of them being unemployed.
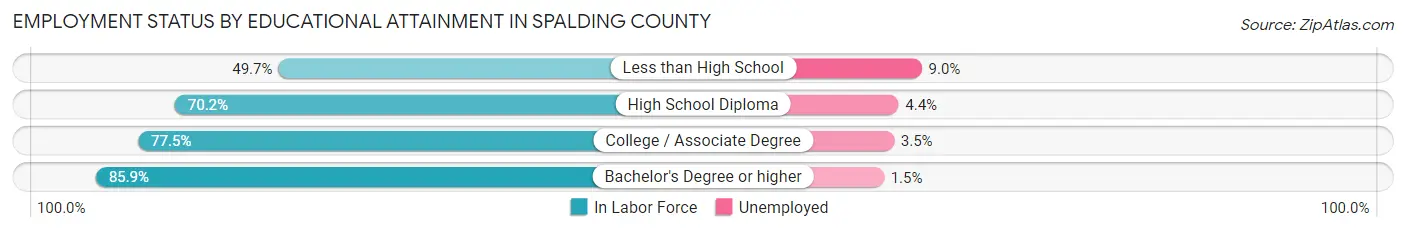
| Educational Attainment | In Labor Force | Unemployed |
| Less than High School | 2,687 (49.7%) | 487 (9.0%) |
| High School Diploma | 9,312 (70.2%) | 584 (4.4%) |
| College / Associate Degree | 6,925 (77.5%) | 313 (3.5%) |
| Bachelor's Degree or higher | 5,288 (85.9%) | 92 (1.5%) |
| Total | 24,208 (71.7%) | 1,351 (4.0%) |
Employment Occupations by Sex in Spalding County
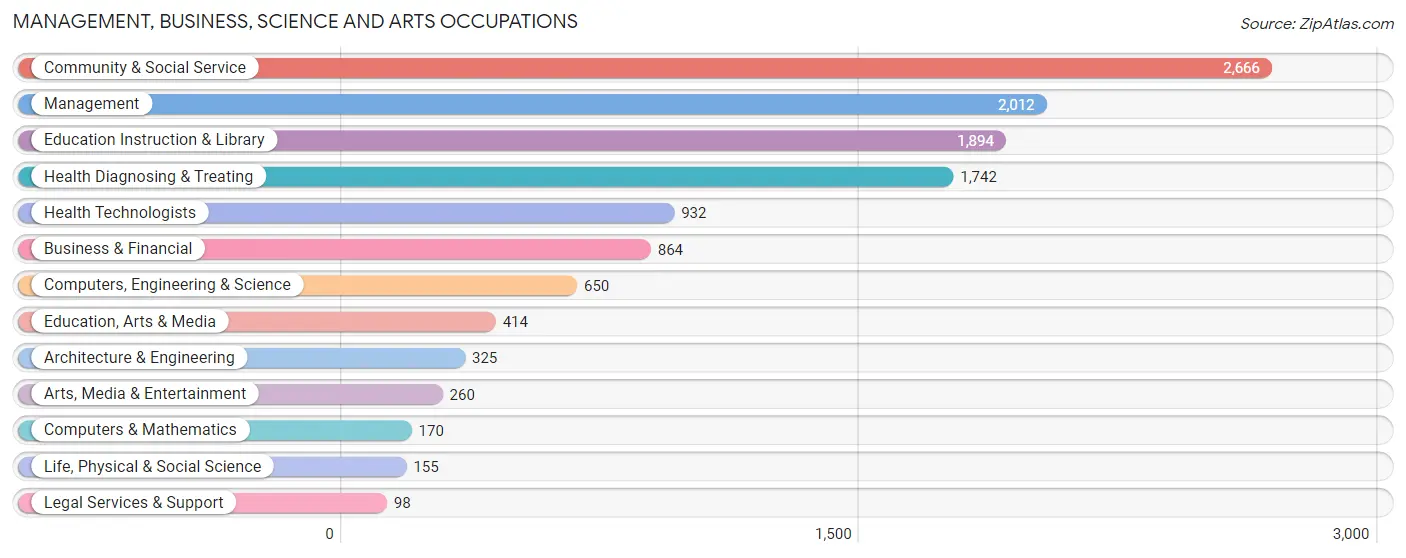
Management, Business, Science and Arts Occupations
The most common Management, Business, Science and Arts occupations in Spalding County are Community & Social Service (2,666 | 9.4%), Management (2,012 | 7.1%), Education Instruction & Library (1,894 | 6.7%), Health Diagnosing & Treating (1,742 | 6.1%), and Health Technologists (932 | 3.3%).
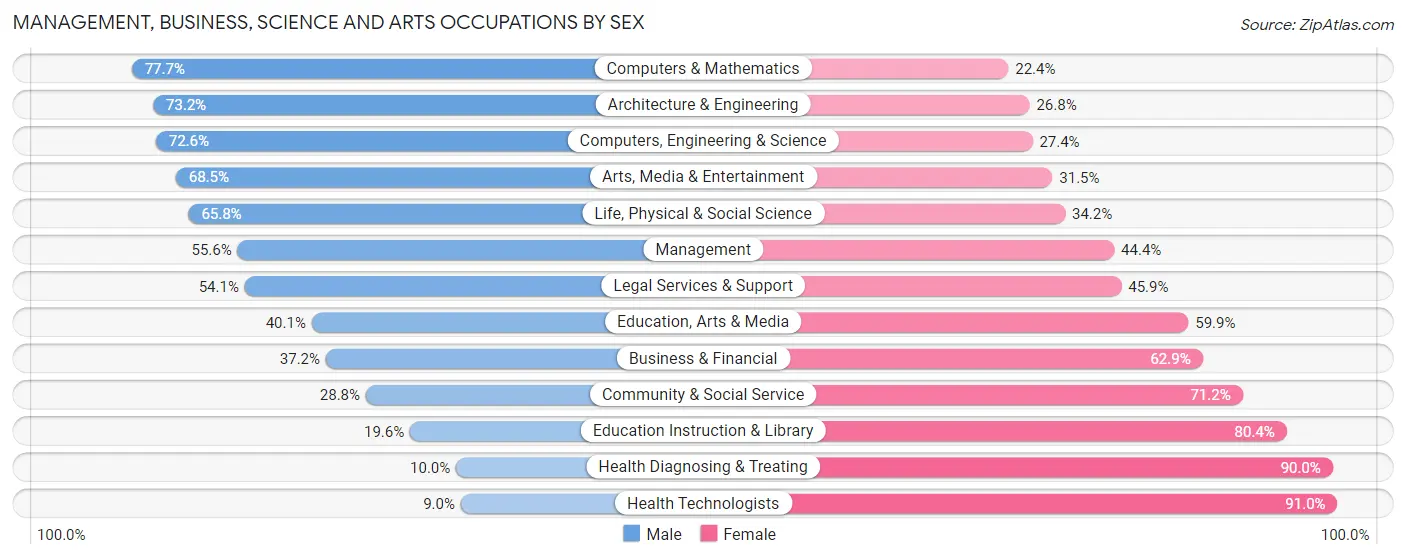
Management, Business, Science and Arts Occupations by Sex
Within the Management, Business, Science and Arts occupations in Spalding County, the most male-oriented occupations are Computers & Mathematics (77.6%), Architecture & Engineering (73.2%), and Computers, Engineering & Science (72.6%), while the most female-oriented occupations are Health Technologists (91.0%), Health Diagnosing & Treating (90.0%), and Education Instruction & Library (80.4%).
| Occupation | Male | Female |
| Management | 1,118 (55.6%) | 894 (44.4%) |
| Business & Financial | 321 (37.1%) | 543 (62.8%) |
| Computers, Engineering & Science | 472 (72.6%) | 178 (27.4%) |
| Computers & Mathematics | 132 (77.6%) | 38 (22.4%) |
| Architecture & Engineering | 238 (73.2%) | 87 (26.8%) |
| Life, Physical & Social Science | 102 (65.8%) | 53 (34.2%) |
| Community & Social Service | 768 (28.8%) | 1,898 (71.2%) |
| Education, Arts & Media | 166 (40.1%) | 248 (59.9%) |
| Legal Services & Support | 53 (54.1%) | 45 (45.9%) |
| Education Instruction & Library | 371 (19.6%) | 1,523 (80.4%) |
| Arts, Media & Entertainment | 178 (68.5%) | 82 (31.5%) |
| Health Diagnosing & Treating | 174 (10.0%) | 1,568 (90.0%) |
| Health Technologists | 84 (9.0%) | 848 (91.0%) |
| Total (Category) | 2,853 (36.0%) | 5,081 (64.0%) |
| Total (Overall) | 14,921 (52.5%) | 13,471 (47.4%) |
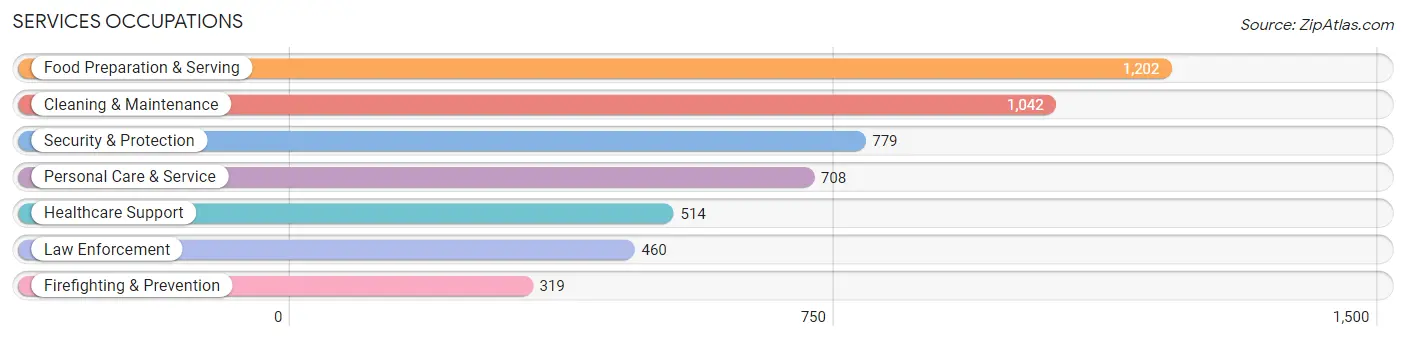
Services Occupations
The most common Services occupations in Spalding County are Food Preparation & Serving (1,202 | 4.2%), Cleaning & Maintenance (1,042 | 3.7%), Security & Protection (779 | 2.7%), Personal Care & Service (708 | 2.5%), and Healthcare Support (514 | 1.8%).
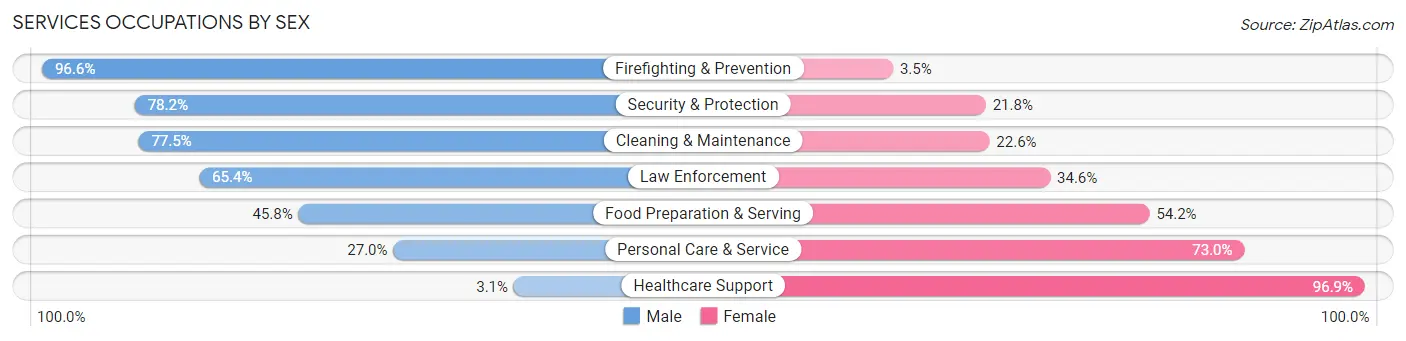
Services Occupations by Sex
Within the Services occupations in Spalding County, the most male-oriented occupations are Firefighting & Prevention (96.6%), Security & Protection (78.2%), and Cleaning & Maintenance (77.4%), while the most female-oriented occupations are Healthcare Support (96.9%), Personal Care & Service (73.0%), and Food Preparation & Serving (54.2%).
| Occupation | Male | Female |
| Healthcare Support | 16 (3.1%) | 498 (96.9%) |
| Security & Protection | 609 (78.2%) | 170 (21.8%) |
| Firefighting & Prevention | 308 (96.6%) | 11 (3.5%) |
| Law Enforcement | 301 (65.4%) | 159 (34.6%) |
| Food Preparation & Serving | 550 (45.8%) | 652 (54.2%) |
| Cleaning & Maintenance | 807 (77.4%) | 235 (22.6%) |
| Personal Care & Service | 191 (27.0%) | 517 (73.0%) |
| Total (Category) | 2,173 (51.2%) | 2,072 (48.8%) |
| Total (Overall) | 14,921 (52.5%) | 13,471 (47.4%) |
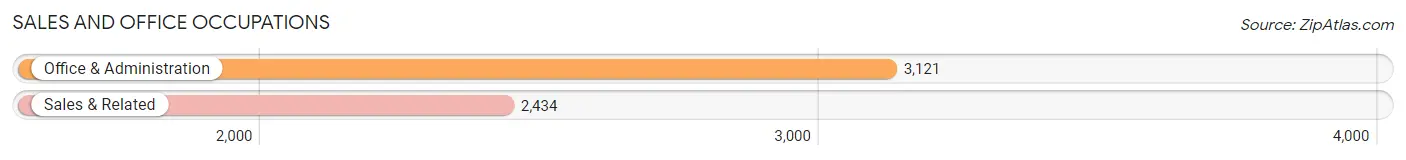
Sales and Office Occupations
The most common Sales and Office occupations in Spalding County are Office & Administration (3,121 | 11.0%), and Sales & Related (2,434 | 8.6%).
Sales and Office Occupations by Sex
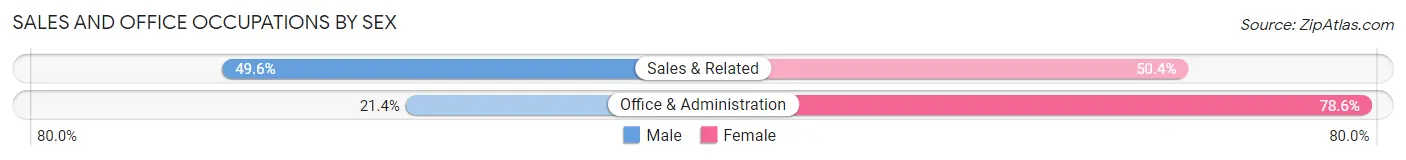
| Occupation | Male | Female |
| Sales & Related | 1,207 (49.6%) | 1,227 (50.4%) |
| Office & Administration | 667 (21.4%) | 2,454 (78.6%) |
| Total (Category) | 1,874 (33.7%) | 3,681 (66.3%) |
| Total (Overall) | 14,921 (52.5%) | 13,471 (47.4%) |
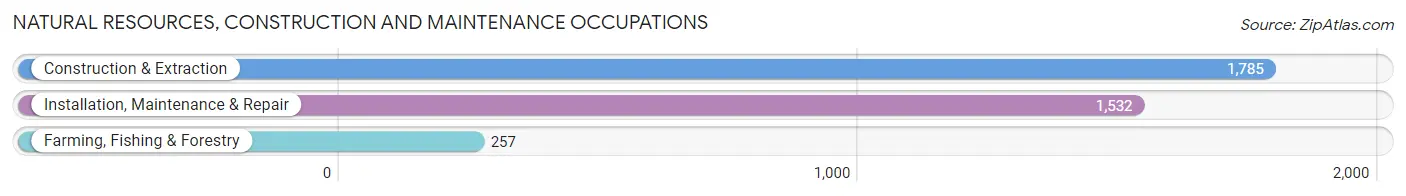
Natural Resources, Construction and Maintenance Occupations
The most common Natural Resources, Construction and Maintenance occupations in Spalding County are Construction & Extraction (1,785 | 6.3%), Installation, Maintenance & Repair (1,532 | 5.4%), and Farming, Fishing & Forestry (257 | 0.9%).
Natural Resources, Construction and Maintenance Occupations by Sex
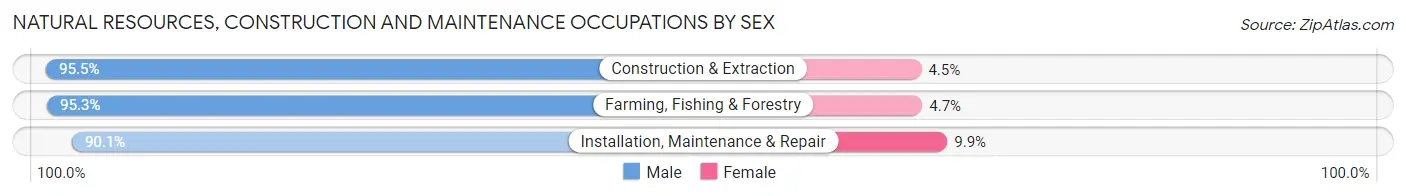
| Occupation | Male | Female |
| Farming, Fishing & Forestry | 245 (95.3%) | 12 (4.7%) |
| Construction & Extraction | 1,705 (95.5%) | 80 (4.5%) |
| Installation, Maintenance & Repair | 1,381 (90.1%) | 151 (9.9%) |
| Total (Category) | 3,331 (93.2%) | 243 (6.8%) |
| Total (Overall) | 14,921 (52.5%) | 13,471 (47.4%) |
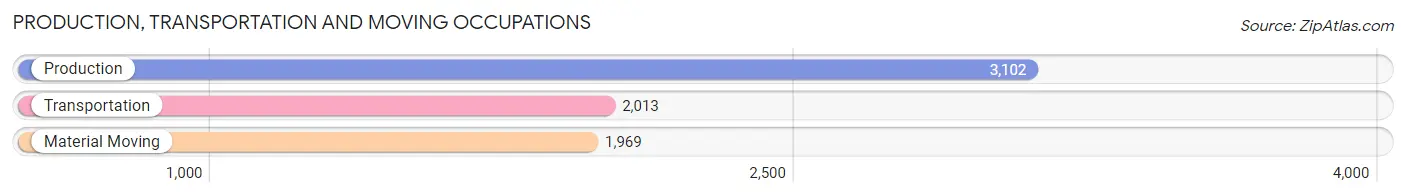
Production, Transportation and Moving Occupations
The most common Production, Transportation and Moving occupations in Spalding County are Production (3,102 | 10.9%), Transportation (2,013 | 7.1%), and Material Moving (1,969 | 6.9%).
Production, Transportation and Moving Occupations by Sex
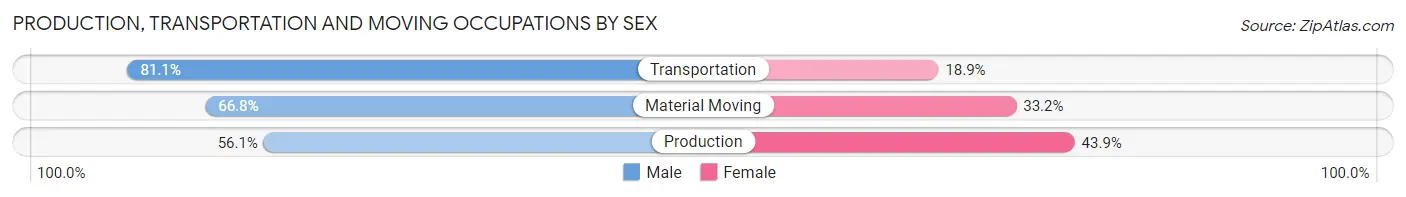
| Occupation | Male | Female |
| Production | 1,741 (56.1%) | 1,361 (43.9%) |
| Transportation | 1,633 (81.1%) | 380 (18.9%) |
| Material Moving | 1,316 (66.8%) | 653 (33.2%) |
| Total (Category) | 4,690 (66.2%) | 2,394 (33.8%) |
| Total (Overall) | 14,921 (52.5%) | 13,471 (47.4%) |
Employment Industries by Sex in Spalding County
Employment Industries in Spalding County
The major employment industries in Spalding County include Manufacturing (4,487 | 15.8%), Retail Trade (3,585 | 12.6%), Health Care & Social Assistance (3,550 | 12.5%), Transportation & Warehousing (2,530 | 8.9%), and Educational Services (2,474 | 8.7%).
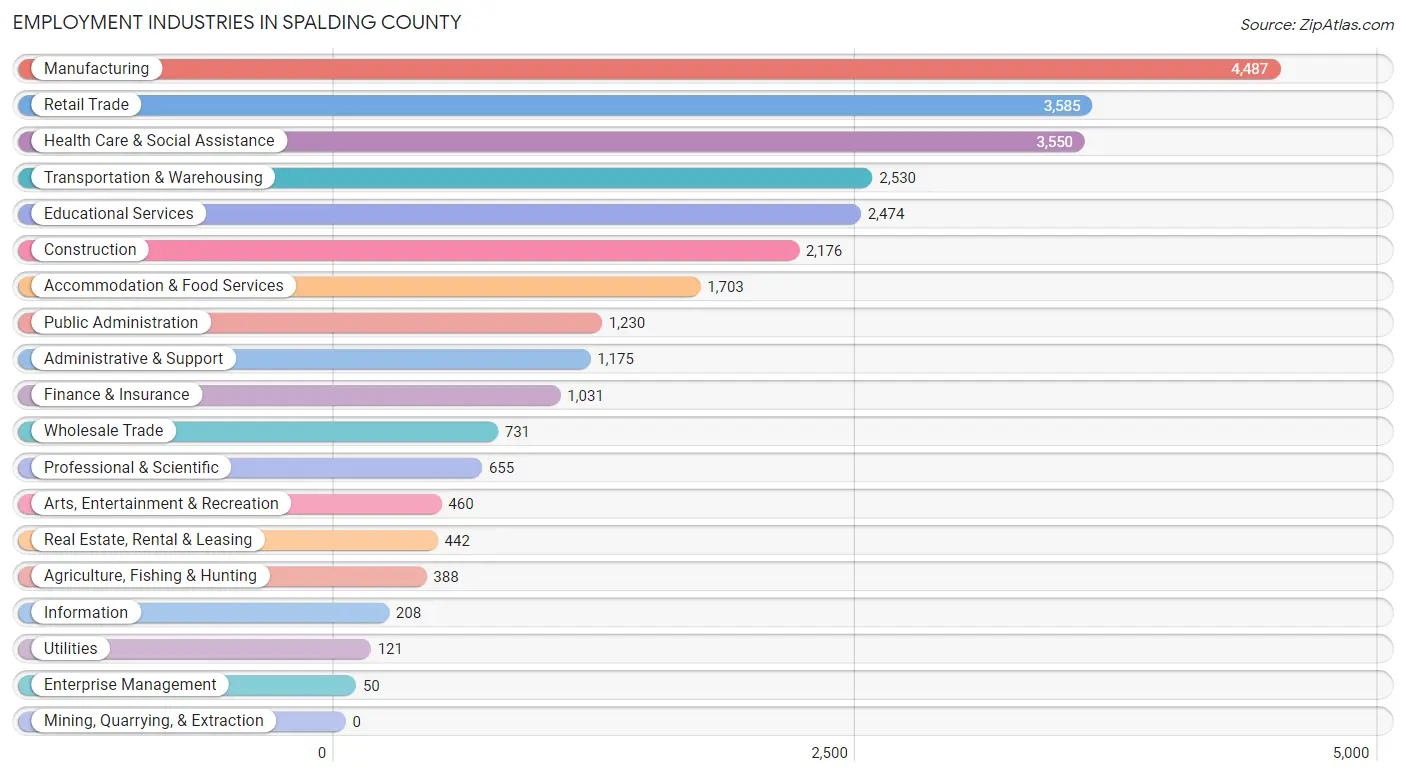
Employment Industries by Sex in Spalding County
The Spalding County industries that see more men than women are Construction (90.8%), Agriculture, Fishing & Hunting (88.4%), and Utilities (87.6%), whereas the industries that tend to have a higher number of women are Health Care & Social Assistance (89.5%), Educational Services (72.1%), and Finance & Insurance (68.2%).
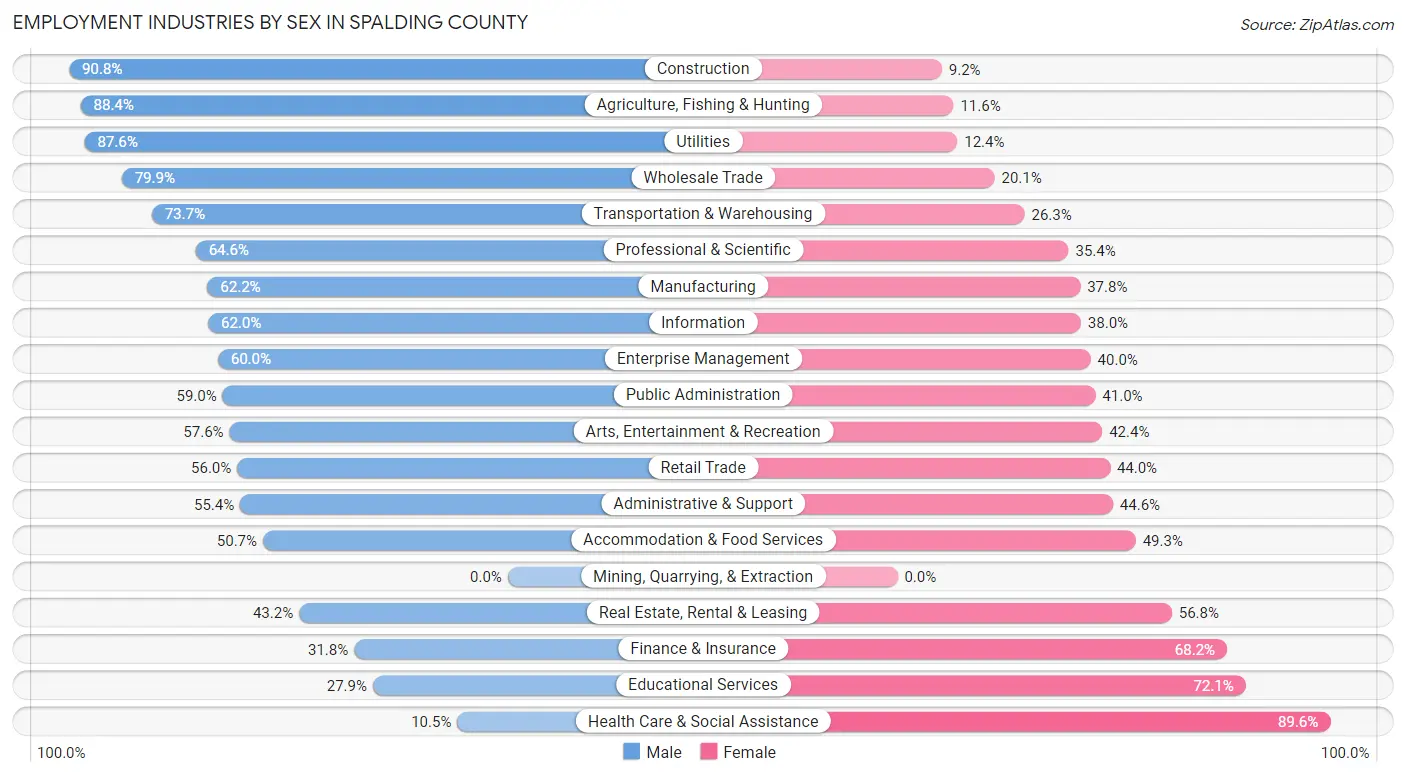
| Industry | Male | Female |
| Agriculture, Fishing & Hunting | 343 (88.4%) | 45 (11.6%) |
| Mining, Quarrying, & Extraction | 0 (0.0%) | 0 (0.0%) |
| Construction | 1,976 (90.8%) | 200 (9.2%) |
| Manufacturing | 2,789 (62.2%) | 1,698 (37.8%) |
| Wholesale Trade | 584 (79.9%) | 147 (20.1%) |
| Retail Trade | 2,008 (56.0%) | 1,577 (44.0%) |
| Transportation & Warehousing | 1,864 (73.7%) | 666 (26.3%) |
| Utilities | 106 (87.6%) | 15 (12.4%) |
| Information | 129 (62.0%) | 79 (38.0%) |
| Finance & Insurance | 328 (31.8%) | 703 (68.2%) |
| Real Estate, Rental & Leasing | 191 (43.2%) | 251 (56.8%) |
| Professional & Scientific | 423 (64.6%) | 232 (35.4%) |
| Enterprise Management | 30 (60.0%) | 20 (40.0%) |
| Administrative & Support | 651 (55.4%) | 524 (44.6%) |
| Educational Services | 691 (27.9%) | 1,783 (72.1%) |
| Health Care & Social Assistance | 371 (10.4%) | 3,179 (89.5%) |
| Arts, Entertainment & Recreation | 265 (57.6%) | 195 (42.4%) |
| Accommodation & Food Services | 863 (50.7%) | 840 (49.3%) |
| Public Administration | 726 (59.0%) | 504 (41.0%) |
| Total | 14,921 (52.5%) | 13,471 (47.4%) |
Education in Spalding County
School Enrollment in Spalding County
The most common levels of schooling among the 14,414 students in Spalding County are middle school (3,827 | 26.6%), elementary school (3,258 | 22.6%), and high school (3,251 | 22.6%).
| School Level | # Students | % Students |
| Nursery / Preschool | 978 | 6.8% |
| Kindergarten | 918 | 6.4% |
| Elementary School | 3,258 | 22.6% |
| Middle School | 3,827 | 26.6% |
| High School | 3,251 | 22.6% |
| College / Undergraduate | 1,804 | 12.5% |
| Graduate / Professional | 378 | 2.6% |
| Total | 14,414 | 100.0% |
School Enrollment by Age by Funding Source in Spalding County
Out of a total of 14,414 students who are enrolled in schools in Spalding County, 1,629 (11.3%) attend a private institution, while the remaining 12,785 (88.7%) are enrolled in public schools. The age group of 3 to 4 year olds has the highest likelihood of being enrolled in private schools, with 260 (31.8% in the age bracket) enrolled. Conversely, the age group of 15 to 17 year olds has the lowest likelihood of being enrolled in a private school, with 2,390 (93.0% in the age bracket) attending a public institution.
| Age Bracket | Public School | Private School |
| 3 to 4 Year Olds | 559 (68.2%) | 260 (31.8%) |
| 5 to 9 Year Old | 3,551 (87.8%) | 495 (12.2%) |
| 10 to 14 Year Olds | 4,119 (90.4%) | 436 (9.6%) |
| 15 to 17 Year Olds | 2,390 (93.0%) | 179 (7.0%) |
| 18 to 19 Year Olds | 450 (92.4%) | 37 (7.6%) |
| 20 to 24 Year Olds | 642 (91.1%) | 63 (8.9%) |
| 25 to 34 Year Olds | 442 (91.9%) | 39 (8.1%) |
| 35 Years and over | 634 (84.3%) | 118 (15.7%) |
| Total | 12,785 (88.7%) | 1,629 (11.3%) |
Educational Attainment by Field of Study in Spalding County
Business (1,672 | 18.6%), education (1,638 | 18.2%), science & technology (1,278 | 14.2%), arts & humanities (700 | 7.8%), and social sciences (562 | 6.3%) are the most common fields of study among 8,974 individuals in Spalding County who have obtained a bachelor's degree or higher.
| Field of Study | # Graduates | % Graduates |
| Computers & Mathematics | 252 | 2.8% |
| Bio, Nature & Agricultural | 463 | 5.2% |
| Physical & Health Sciences | 107 | 1.2% |
| Psychology | 505 | 5.6% |
| Social Sciences | 562 | 6.3% |
| Engineering | 425 | 4.7% |
| Multidisciplinary Studies | 52 | 0.6% |
| Science & Technology | 1,278 | 14.2% |
| Business | 1,672 | 18.6% |
| Education | 1,638 | 18.2% |
| Literature & Languages | 427 | 4.8% |
| Liberal Arts & History | 437 | 4.9% |
| Visual & Performing Arts | 217 | 2.4% |
| Communications | 239 | 2.7% |
| Arts & Humanities | 700 | 7.8% |
| Total | 8,974 | 100.0% |
Transportation & Commute in Spalding County
Vehicle Availability by Sex in Spalding County
The most prevalent vehicle ownership categories in Spalding County are males with 2 vehicles (6,102, accounting for 41.4%) and females with 2 vehicles (5,049, making up 46.8%).
| Vehicles Available | Male | Female |
| No Vehicle | 285 (1.9%) | 376 (2.9%) |
| 1 Vehicle | 2,816 (19.1%) | 2,584 (19.8%) |
| 2 Vehicles | 6,102 (41.4%) | 5,049 (38.7%) |
| 3 Vehicles | 2,852 (19.4%) | 2,950 (22.6%) |
| 4 Vehicles | 1,723 (11.7%) | 1,221 (9.4%) |
| 5 or more Vehicles | 956 (6.5%) | 865 (6.6%) |
| Total | 14,734 (100.0%) | 13,045 (100.0%) |
Commute Time in Spalding County
The most frequently occuring commute durations in Spalding County are 15 to 19 minutes (4,457 commuters, 17.3%), 10 to 14 minutes (4,032 commuters, 15.6%), and 30 to 34 minutes (3,643 commuters, 14.1%).
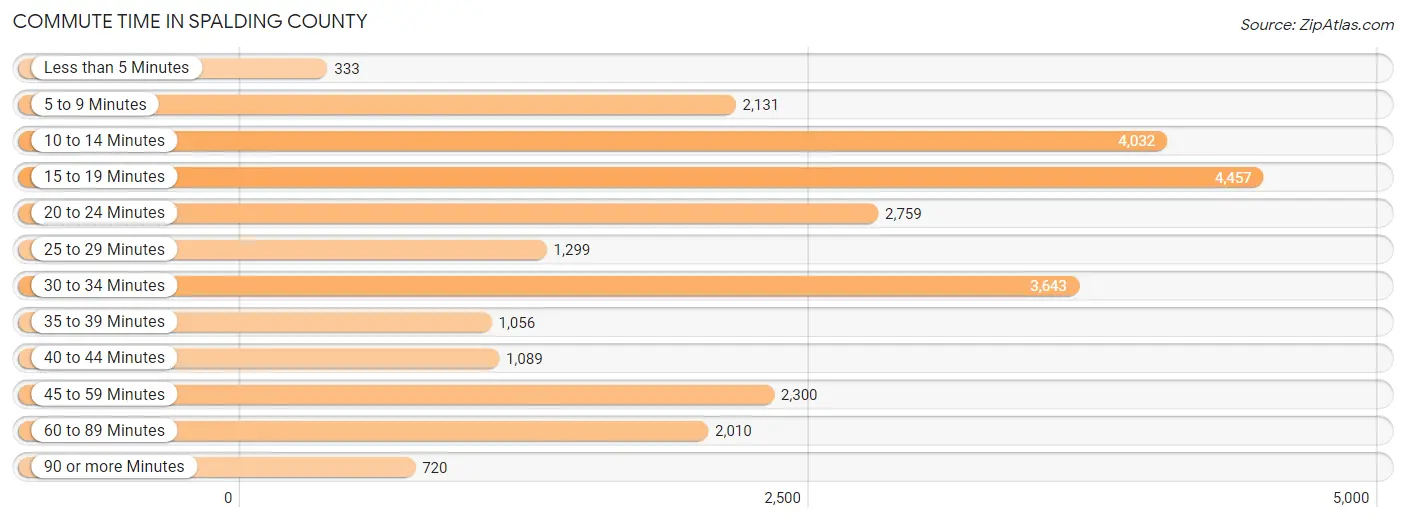
| Commute Time | # Commuters | % Commuters |
| Less than 5 Minutes | 333 | 1.3% |
| 5 to 9 Minutes | 2,131 | 8.3% |
| 10 to 14 Minutes | 4,032 | 15.6% |
| 15 to 19 Minutes | 4,457 | 17.3% |
| 20 to 24 Minutes | 2,759 | 10.7% |
| 25 to 29 Minutes | 1,299 | 5.0% |
| 30 to 34 Minutes | 3,643 | 14.1% |
| 35 to 39 Minutes | 1,056 | 4.1% |
| 40 to 44 Minutes | 1,089 | 4.2% |
| 45 to 59 Minutes | 2,300 | 8.9% |
| 60 to 89 Minutes | 2,010 | 7.8% |
| 90 or more Minutes | 720 | 2.8% |
Commute Time by Sex in Spalding County
The most common commute times in Spalding County are 15 to 19 minutes (2,193 commuters, 15.9%) for males and 15 to 19 minutes (2,264 commuters, 18.8%) for females.
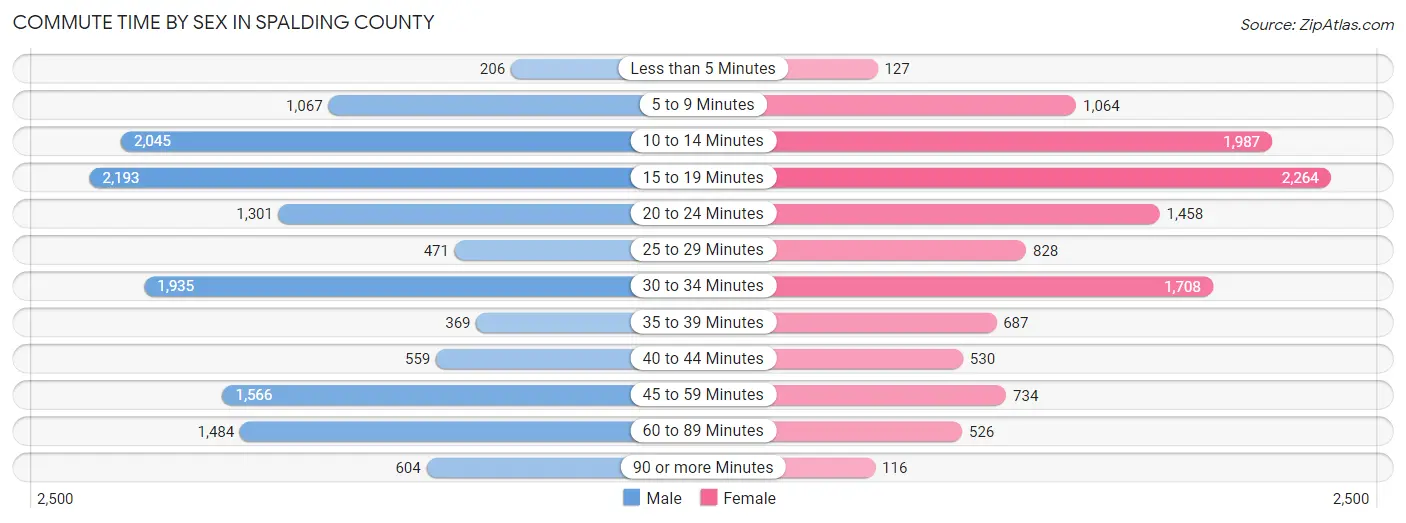
| Commute Time | Male | Female |
| Less than 5 Minutes | 206 (1.5%) | 127 (1.1%) |
| 5 to 9 Minutes | 1,067 (7.7%) | 1,064 (8.8%) |
| 10 to 14 Minutes | 2,045 (14.8%) | 1,987 (16.5%) |
| 15 to 19 Minutes | 2,193 (15.9%) | 2,264 (18.8%) |
| 20 to 24 Minutes | 1,301 (9.4%) | 1,458 (12.1%) |
| 25 to 29 Minutes | 471 (3.4%) | 828 (6.9%) |
| 30 to 34 Minutes | 1,935 (14.0%) | 1,708 (14.2%) |
| 35 to 39 Minutes | 369 (2.7%) | 687 (5.7%) |
| 40 to 44 Minutes | 559 (4.1%) | 530 (4.4%) |
| 45 to 59 Minutes | 1,566 (11.4%) | 734 (6.1%) |
| 60 to 89 Minutes | 1,484 (10.7%) | 526 (4.4%) |
| 90 or more Minutes | 604 (4.4%) | 116 (1.0%) |
Time of Departure to Work by Sex in Spalding County
The most frequent times of departure to work in Spalding County are 7:00 AM to 7:29 AM (2,771, 20.1%) for males and 7:30 AM to 7:59 AM (2,054, 17.1%) for females.
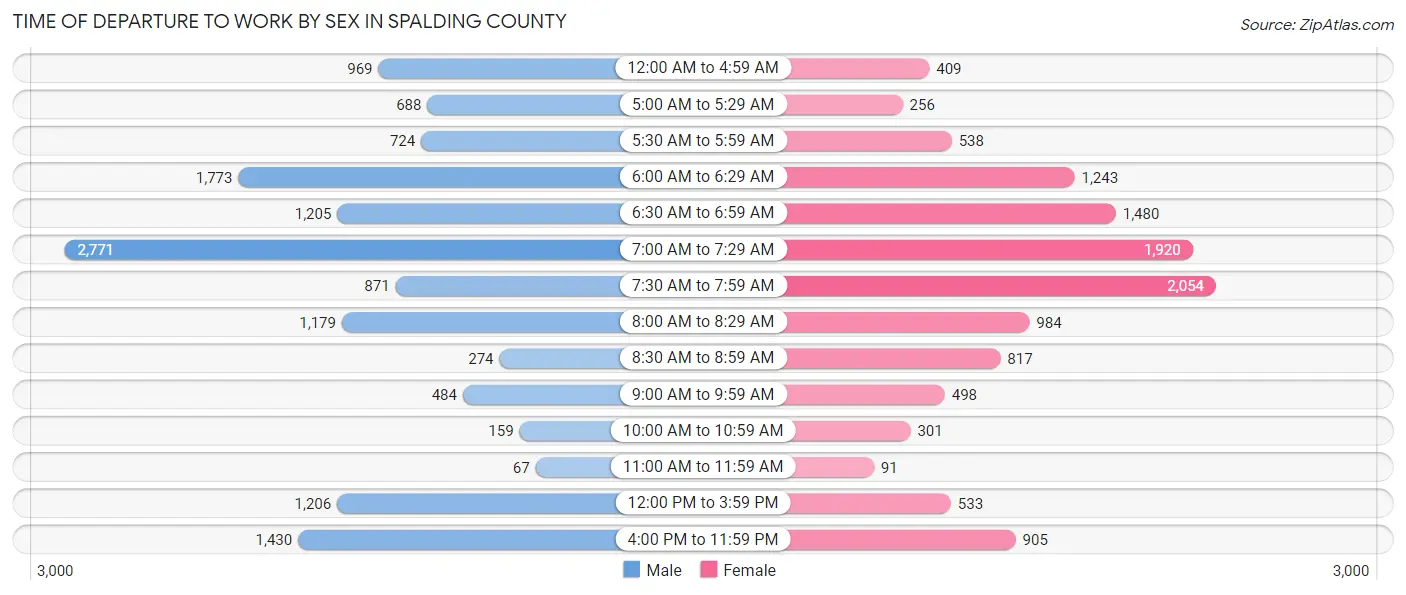
| Time of Departure | Male | Female |
| 12:00 AM to 4:59 AM | 969 (7.0%) | 409 (3.4%) |
| 5:00 AM to 5:29 AM | 688 (5.0%) | 256 (2.1%) |
| 5:30 AM to 5:59 AM | 724 (5.2%) | 538 (4.5%) |
| 6:00 AM to 6:29 AM | 1,773 (12.9%) | 1,243 (10.3%) |
| 6:30 AM to 6:59 AM | 1,205 (8.7%) | 1,480 (12.3%) |
| 7:00 AM to 7:29 AM | 2,771 (20.1%) | 1,920 (16.0%) |
| 7:30 AM to 7:59 AM | 871 (6.3%) | 2,054 (17.1%) |
| 8:00 AM to 8:29 AM | 1,179 (8.5%) | 984 (8.2%) |
| 8:30 AM to 8:59 AM | 274 (2.0%) | 817 (6.8%) |
| 9:00 AM to 9:59 AM | 484 (3.5%) | 498 (4.1%) |
| 10:00 AM to 10:59 AM | 159 (1.1%) | 301 (2.5%) |
| 11:00 AM to 11:59 AM | 67 (0.5%) | 91 (0.8%) |
| 12:00 PM to 3:59 PM | 1,206 (8.7%) | 533 (4.4%) |
| 4:00 PM to 11:59 PM | 1,430 (10.4%) | 905 (7.5%) |
| Total | 13,800 (100.0%) | 12,029 (100.0%) |
Housing Occupancy in Spalding County
Occupancy by Ownership in Spalding County
Of the total 26,303 dwellings in Spalding County, owner-occupied units account for 17,011 (64.7%), while renter-occupied units make up 9,292 (35.3%).
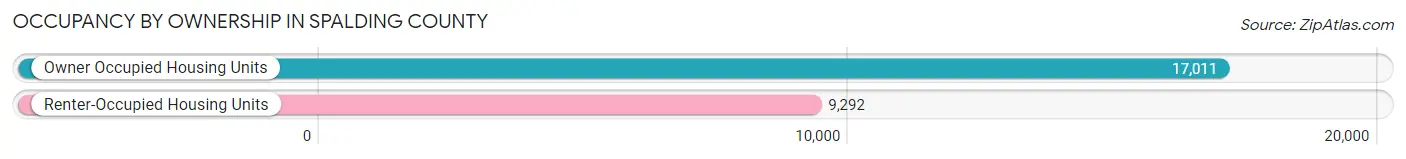
| Occupancy | # Housing Units | % Housing Units |
| Owner Occupied Housing Units | 17,011 | 64.7% |
| Renter-Occupied Housing Units | 9,292 | 35.3% |
| Total Occupied Housing Units | 26,303 | 100.0% |
Occupancy by Household Size in Spalding County
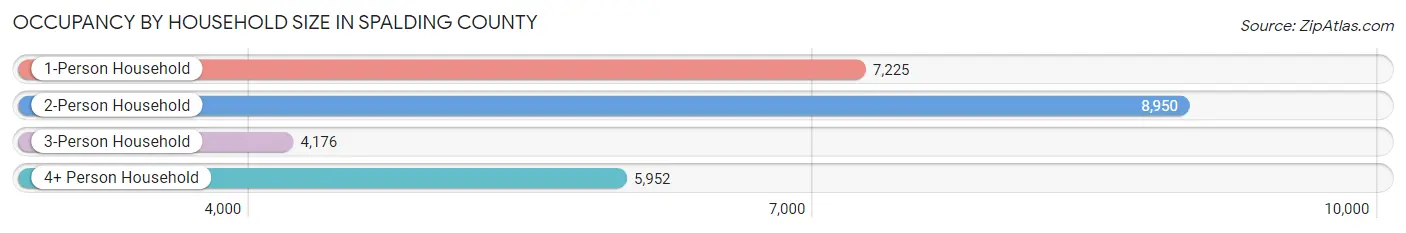
| Household Size | # Housing Units | % Housing Units |
| 1-Person Household | 7,225 | 27.5% |
| 2-Person Household | 8,950 | 34.0% |
| 3-Person Household | 4,176 | 15.9% |
| 4+ Person Household | 5,952 | 22.6% |
| Total Housing Units | 26,303 | 100.0% |
Occupancy by Ownership by Household Size in Spalding County
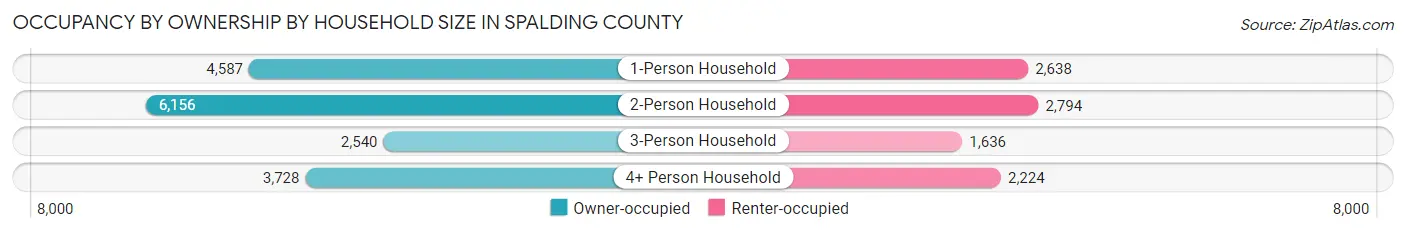
| Household Size | Owner-occupied | Renter-occupied |
| 1-Person Household | 4,587 (63.5%) | 2,638 (36.5%) |
| 2-Person Household | 6,156 (68.8%) | 2,794 (31.2%) |
| 3-Person Household | 2,540 (60.8%) | 1,636 (39.2%) |
| 4+ Person Household | 3,728 (62.6%) | 2,224 (37.4%) |
| Total Housing Units | 17,011 (64.7%) | 9,292 (35.3%) |
Occupancy by Educational Attainment in Spalding County
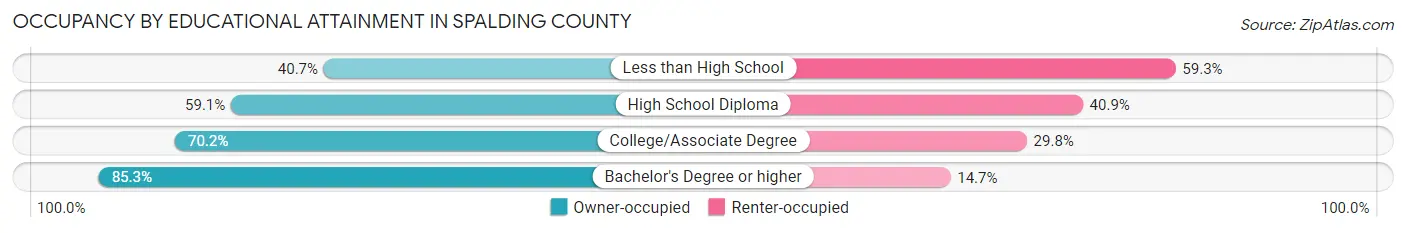
| Household Size | Owner-occupied | Renter-occupied |
| Less than High School | 1,600 (40.7%) | 2,334 (59.3%) |
| High School Diploma | 5,723 (59.1%) | 3,967 (40.9%) |
| College/Associate Degree | 5,225 (70.2%) | 2,222 (29.8%) |
| Bachelor's Degree or higher | 4,463 (85.3%) | 769 (14.7%) |
Occupancy by Age of Householder in Spalding County
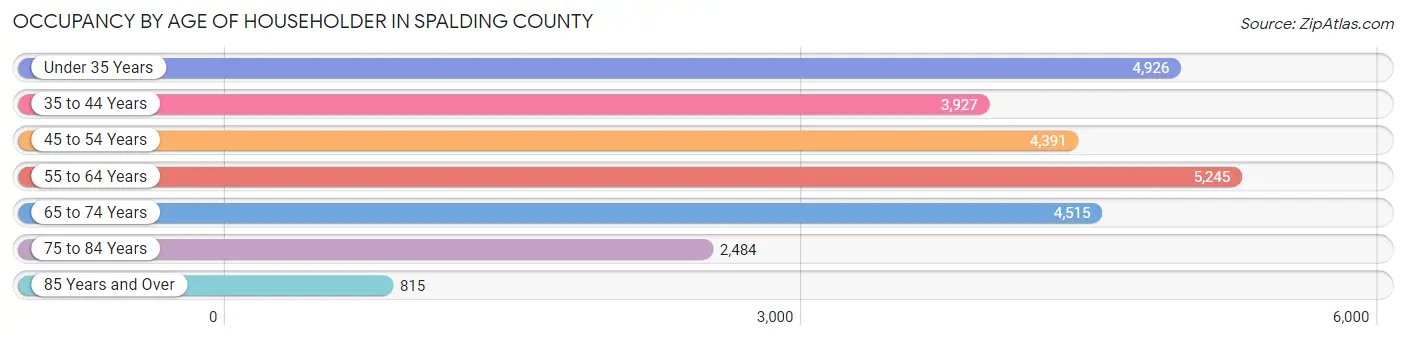
| Age Bracket | # Households | % Households |
| Under 35 Years | 4,926 | 18.7% |
| 35 to 44 Years | 3,927 | 14.9% |
| 45 to 54 Years | 4,391 | 16.7% |
| 55 to 64 Years | 5,245 | 19.9% |
| 65 to 74 Years | 4,515 | 17.2% |
| 75 to 84 Years | 2,484 | 9.4% |
| 85 Years and Over | 815 | 3.1% |
| Total | 26,303 | 100.0% |
Housing Finances in Spalding County
Median Income by Occupancy in Spalding County
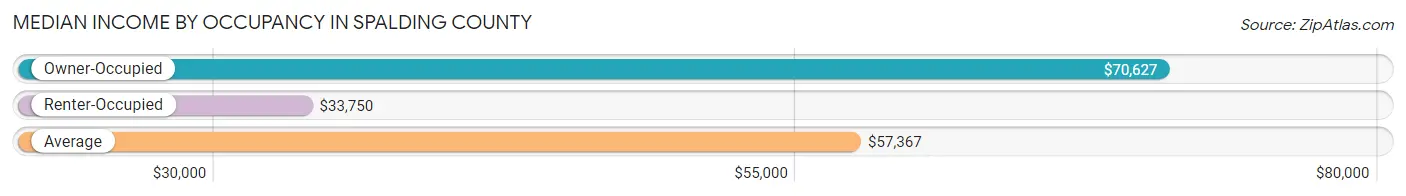
| Occupancy Type | # Households | Median Income |
| Owner-Occupied | 17,011 (64.7%) | $70,627 |
| Renter-Occupied | 9,292 (35.3%) | $33,750 |
| Average | 26,303 (100.0%) | $57,367 |
Occupancy by Householder Income Bracket in Spalding County
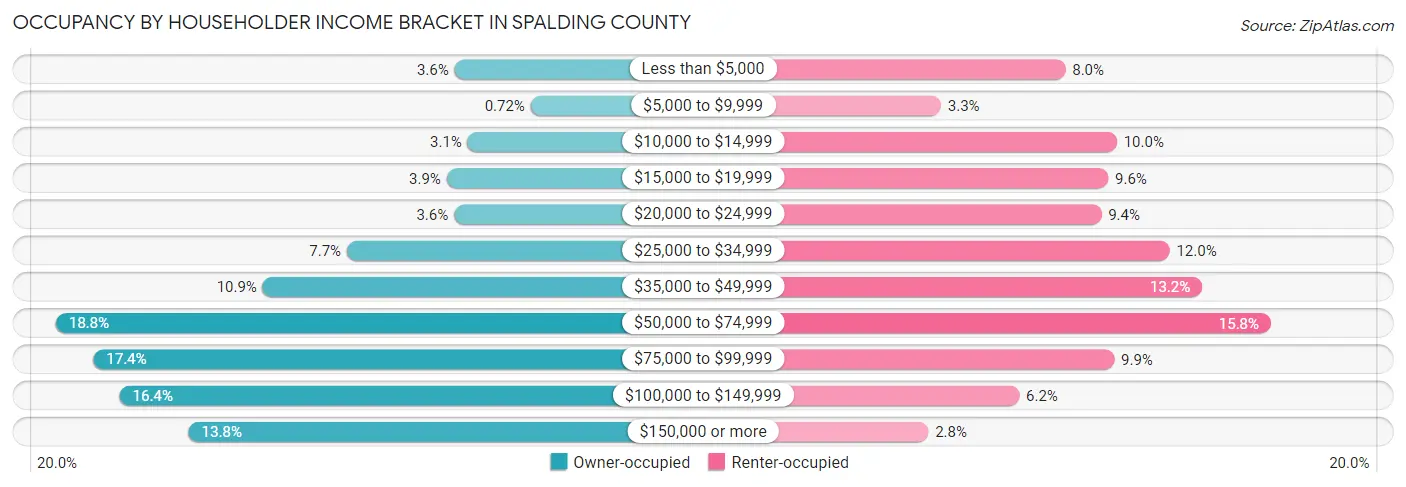
| Income Bracket | Owner-occupied | Renter-occupied |
| Less than $5,000 | 616 (3.6%) | 742 (8.0%) |
| $5,000 to $9,999 | 123 (0.7%) | 302 (3.3%) |
| $10,000 to $14,999 | 531 (3.1%) | 925 (10.0%) |
| $15,000 to $19,999 | 666 (3.9%) | 894 (9.6%) |
| $20,000 to $24,999 | 620 (3.6%) | 870 (9.4%) |
| $25,000 to $34,999 | 1,314 (7.7%) | 1,111 (12.0%) |
| $35,000 to $49,999 | 1,859 (10.9%) | 1,227 (13.2%) |
| $50,000 to $74,999 | 3,200 (18.8%) | 1,470 (15.8%) |
| $75,000 to $99,999 | 2,956 (17.4%) | 915 (9.9%) |
| $100,000 to $149,999 | 2,787 (16.4%) | 579 (6.2%) |
| $150,000 or more | 2,339 (13.8%) | 257 (2.8%) |
| Total | 17,011 (100.0%) | 9,292 (100.0%) |
Monthly Housing Cost Tiers in Spalding County
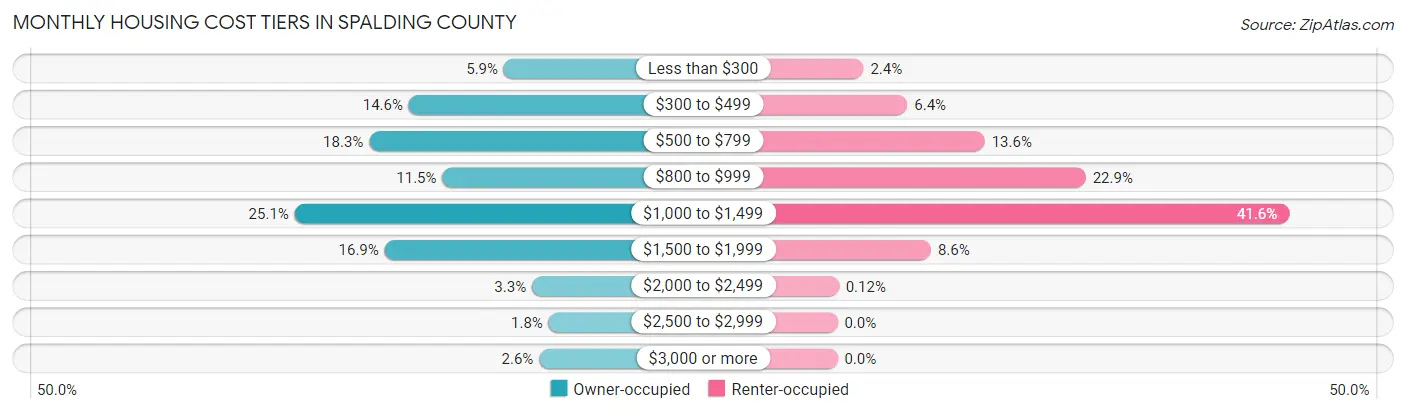
| Monthly Cost | Owner-occupied | Renter-occupied |
| Less than $300 | 1,000 (5.9%) | 223 (2.4%) |
| $300 to $499 | 2,488 (14.6%) | 598 (6.4%) |
| $500 to $799 | 3,109 (18.3%) | 1,260 (13.6%) |
| $800 to $999 | 1,963 (11.5%) | 2,124 (22.9%) |
| $1,000 to $1,499 | 4,277 (25.1%) | 3,864 (41.6%) |
| $1,500 to $1,999 | 2,868 (16.9%) | 800 (8.6%) |
| $2,000 to $2,499 | 560 (3.3%) | 11 (0.1%) |
| $2,500 to $2,999 | 298 (1.8%) | 0 (0.0%) |
| $3,000 or more | 448 (2.6%) | 0 (0.0%) |
| Total | 17,011 (100.0%) | 9,292 (100.0%) |
Physical Housing Characteristics in Spalding County
Housing Structures in Spalding County
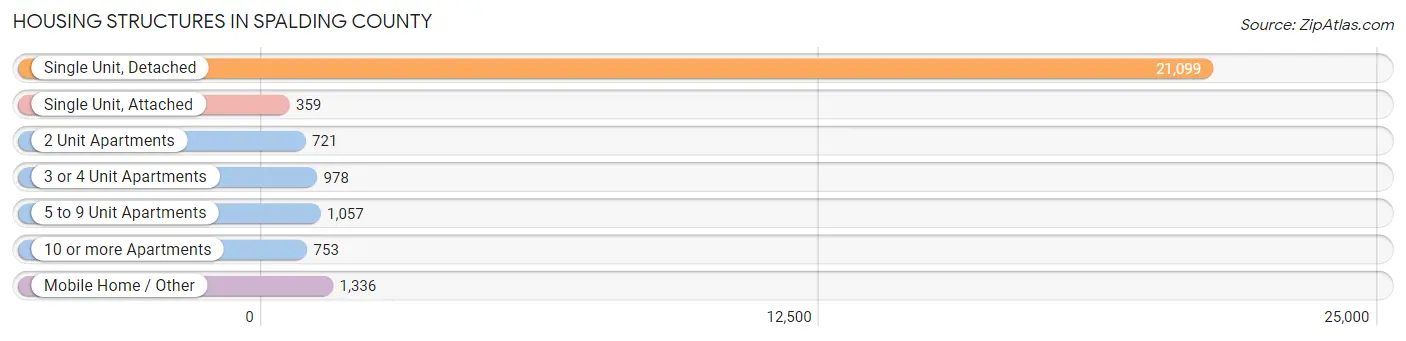
| Structure Type | # Housing Units | % Housing Units |
| Single Unit, Detached | 21,099 | 80.2% |
| Single Unit, Attached | 359 | 1.4% |
| 2 Unit Apartments | 721 | 2.7% |
| 3 or 4 Unit Apartments | 978 | 3.7% |
| 5 to 9 Unit Apartments | 1,057 | 4.0% |
| 10 or more Apartments | 753 | 2.9% |
| Mobile Home / Other | 1,336 | 5.1% |
| Total | 26,303 | 100.0% |
Housing Structures by Occupancy in Spalding County
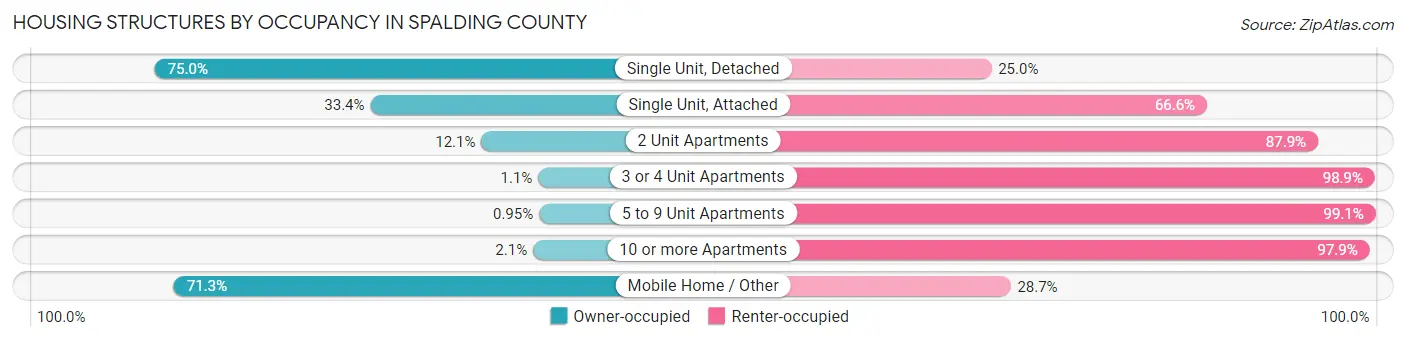
| Structure Type | Owner-occupied | Renter-occupied |
| Single Unit, Detached | 15,815 (75.0%) | 5,284 (25.0%) |
| Single Unit, Attached | 120 (33.4%) | 239 (66.6%) |
| 2 Unit Apartments | 87 (12.1%) | 634 (87.9%) |
| 3 or 4 Unit Apartments | 11 (1.1%) | 967 (98.9%) |
| 5 to 9 Unit Apartments | 10 (0.9%) | 1,047 (99.1%) |
| 10 or more Apartments | 16 (2.1%) | 737 (97.9%) |
| Mobile Home / Other | 952 (71.3%) | 384 (28.7%) |
| Total | 17,011 (64.7%) | 9,292 (35.3%) |
Housing Structures by Number of Rooms in Spalding County
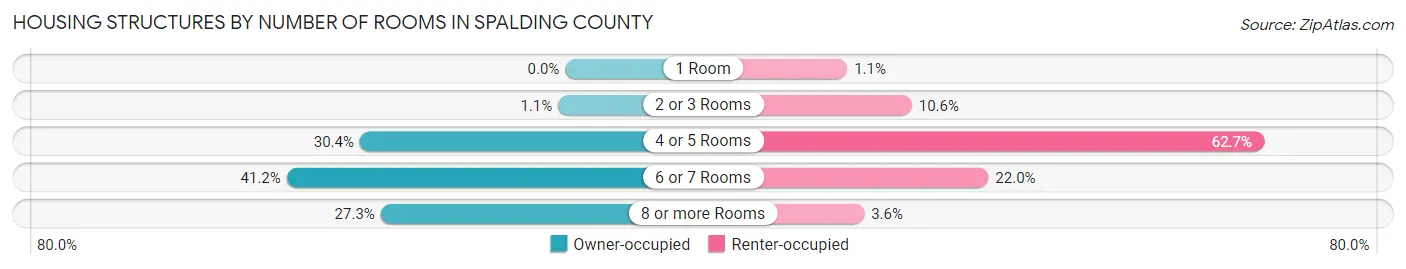
| Number of Rooms | Owner-occupied | Renter-occupied |
| 1 Room | 0 (0.0%) | 100 (1.1%) |
| 2 or 3 Rooms | 180 (1.1%) | 989 (10.6%) |
| 4 or 5 Rooms | 5,171 (30.4%) | 5,828 (62.7%) |
| 6 or 7 Rooms | 7,014 (41.2%) | 2,041 (22.0%) |
| 8 or more Rooms | 4,646 (27.3%) | 334 (3.6%) |
| Total | 17,011 (100.0%) | 9,292 (100.0%) |
Housing Structure by Heating Type in Spalding County
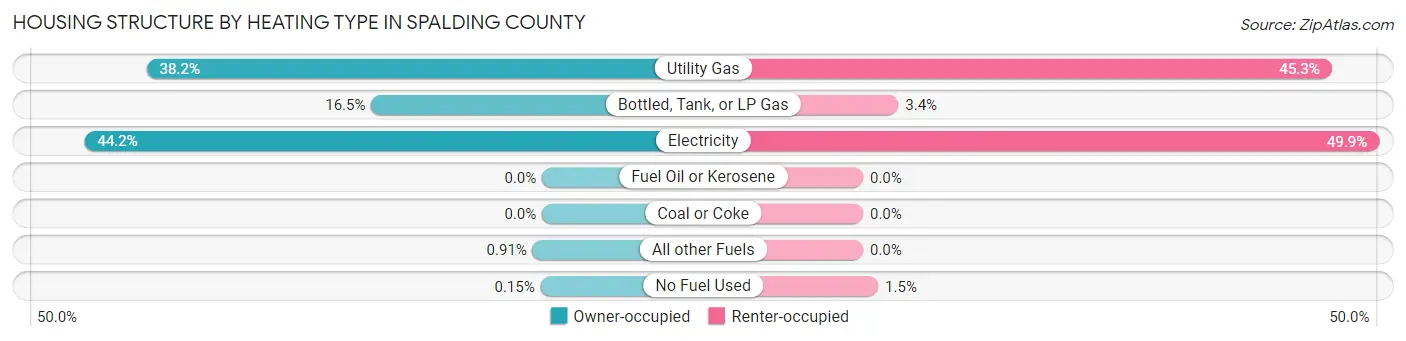
| Heating Type | Owner-occupied | Renter-occupied |
| Utility Gas | 6,502 (38.2%) | 4,206 (45.3%) |
| Bottled, Tank, or LP Gas | 2,806 (16.5%) | 317 (3.4%) |
| Electricity | 7,524 (44.2%) | 4,633 (49.9%) |
| Fuel Oil or Kerosene | 0 (0.0%) | 0 (0.0%) |
| Coal or Coke | 0 (0.0%) | 0 (0.0%) |
| All other Fuels | 154 (0.9%) | 0 (0.0%) |
| No Fuel Used | 25 (0.2%) | 136 (1.5%) |
| Total | 17,011 (100.0%) | 9,292 (100.0%) |
Household Vehicle Usage in Spalding County
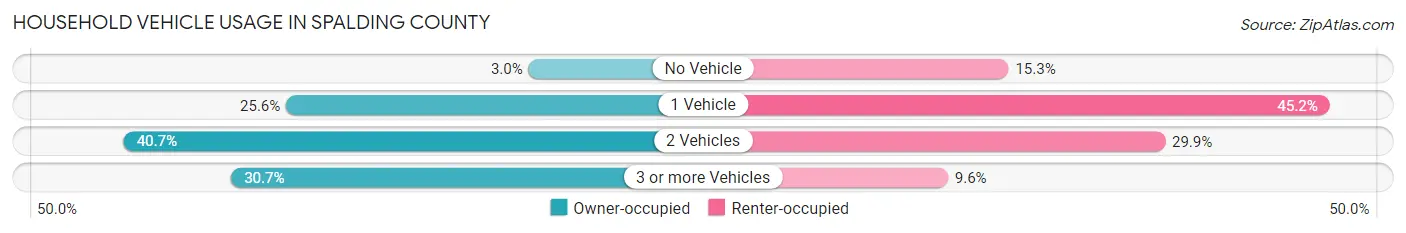
| Vehicles per Household | Owner-occupied | Renter-occupied |
| No Vehicle | 503 (3.0%) | 1,419 (15.3%) |
| 1 Vehicle | 4,353 (25.6%) | 4,204 (45.2%) |
| 2 Vehicles | 6,931 (40.7%) | 2,776 (29.9%) |
| 3 or more Vehicles | 5,224 (30.7%) | 893 (9.6%) |
| Total | 17,011 (100.0%) | 9,292 (100.0%) |
Real Estate & Mortgages in Spalding County
Real Estate and Mortgage Overview in Spalding County
| Characteristic | Without Mortgage | With Mortgage |
| Housing Units | 6,573 | 10,438 |
| Median Property Value | $154,000 | $191,300 |
| Median Household Income | $51,721 | $1,897 |
| Monthly Housing Costs | $491 | $446 |
| Real Estate Taxes | $1,465 | $179 |
Property Value by Mortgage Status in Spalding County
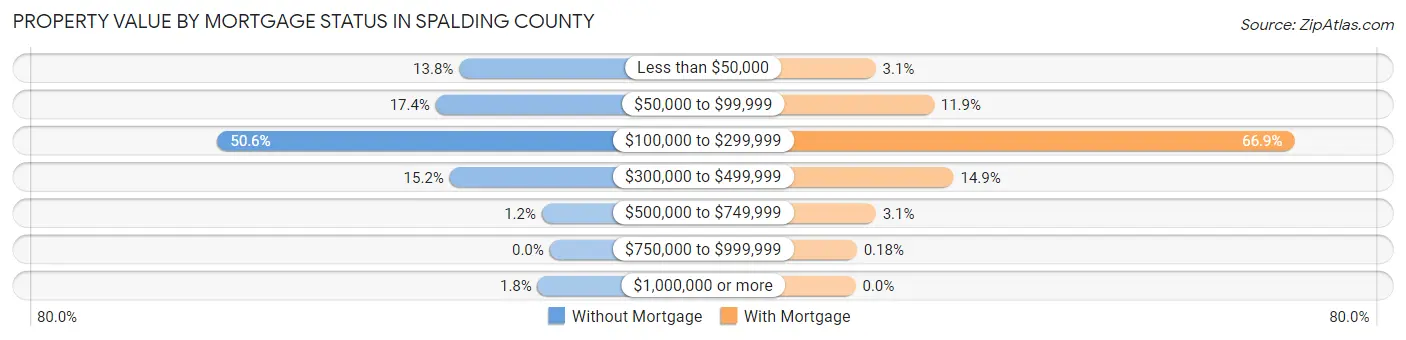
| Property Value | Without Mortgage | With Mortgage |
| Less than $50,000 | 906 (13.8%) | 319 (3.1%) |
| $50,000 to $99,999 | 1,141 (17.4%) | 1,244 (11.9%) |
| $100,000 to $299,999 | 3,327 (50.6%) | 6,978 (66.8%) |
| $300,000 to $499,999 | 1,001 (15.2%) | 1,558 (14.9%) |
| $500,000 to $749,999 | 78 (1.2%) | 320 (3.1%) |
| $750,000 to $999,999 | 0 (0.0%) | 19 (0.2%) |
| $1,000,000 or more | 120 (1.8%) | 0 (0.0%) |
| Total | 6,573 (100.0%) | 10,438 (100.0%) |
Household Income by Mortgage Status in Spalding County
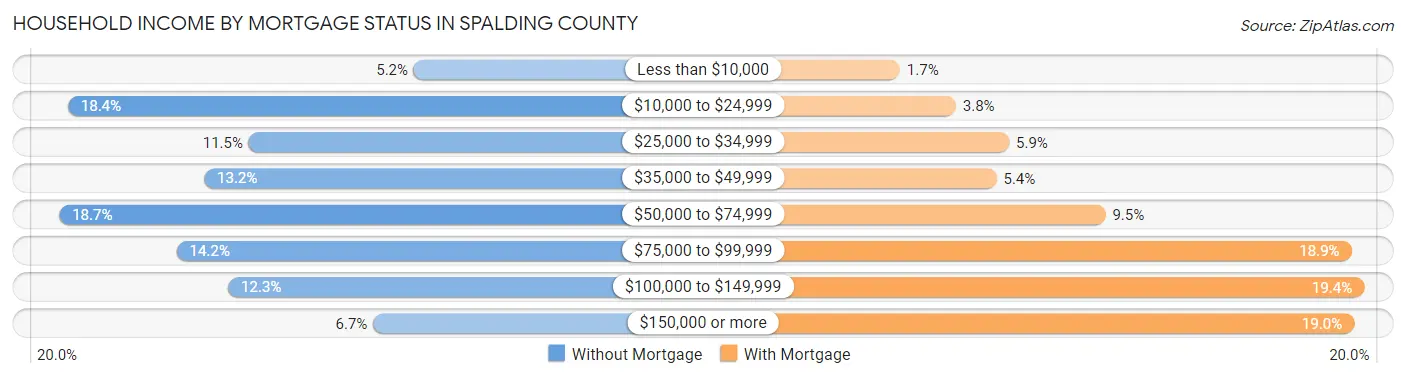
| Household Income | Without Mortgage | With Mortgage |
| Less than $10,000 | 340 (5.2%) | 176 (1.7%) |
| $10,000 to $24,999 | 1,206 (18.3%) | 399 (3.8%) |
| $25,000 to $34,999 | 753 (11.5%) | 611 (5.9%) |
| $35,000 to $49,999 | 865 (13.2%) | 561 (5.4%) |
| $50,000 to $74,999 | 1,228 (18.7%) | 994 (9.5%) |
| $75,000 to $99,999 | 934 (14.2%) | 1,972 (18.9%) |
| $100,000 to $149,999 | 805 (12.2%) | 2,022 (19.4%) |
| $150,000 or more | 442 (6.7%) | 1,982 (19.0%) |
| Total | 6,573 (100.0%) | 10,438 (100.0%) |
Property Value to Household Income Ratio in Spalding County
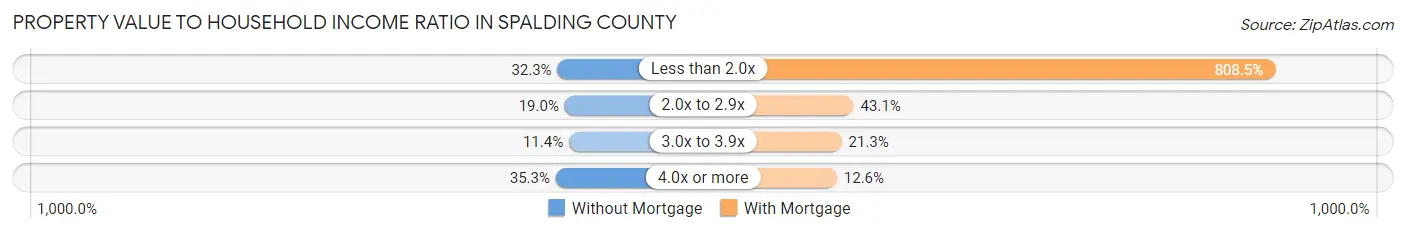
| Value-to-Income Ratio | Without Mortgage | With Mortgage |
| Less than 2.0x | 2,120 (32.3%) | 84,393 (808.5%) |
| 2.0x to 2.9x | 1,251 (19.0%) | 4,502 (43.1%) |
| 3.0x to 3.9x | 746 (11.4%) | 2,221 (21.3%) |
| 4.0x or more | 2,318 (35.3%) | 1,314 (12.6%) |
| Total | 6,573 (100.0%) | 10,438 (100.0%) |
Real Estate Taxes by Mortgage Status in Spalding County
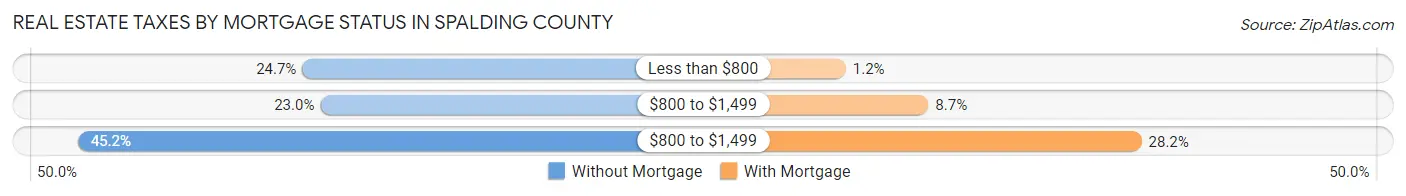
| Property Taxes | Without Mortgage | With Mortgage |
| Less than $800 | 1,620 (24.6%) | 122 (1.2%) |
| $800 to $1,499 | 1,512 (23.0%) | 909 (8.7%) |
| $800 to $1,499 | 2,968 (45.2%) | 2,941 (28.2%) |
| Total | 6,573 (100.0%) | 10,438 (100.0%) |
Health & Disability in Spalding County
Health Insurance Coverage by Age in Spalding County
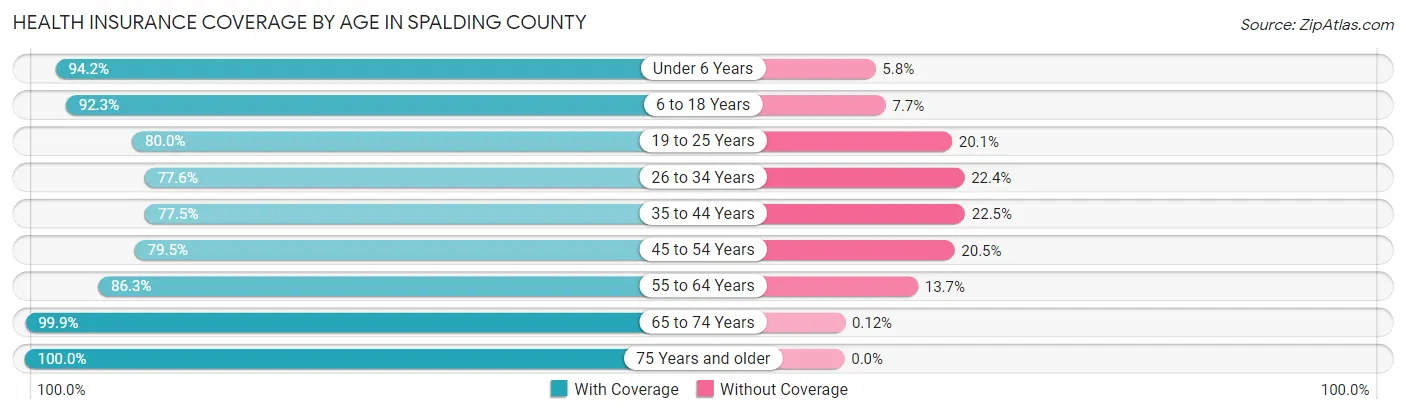
| Age Bracket | With Coverage | Without Coverage |
| Under 6 Years | 4,787 (94.2%) | 295 (5.8%) |
| 6 to 18 Years | 10,306 (92.3%) | 859 (7.7%) |
| 19 to 25 Years | 4,550 (79.9%) | 1,141 (20.1%) |
| 26 to 34 Years | 6,321 (77.6%) | 1,820 (22.4%) |
| 35 to 44 Years | 5,936 (77.5%) | 1,721 (22.5%) |
| 45 to 54 Years | 6,382 (79.5%) | 1,649 (20.5%) |
| 55 to 64 Years | 7,305 (86.3%) | 1,161 (13.7%) |
| 65 to 74 Years | 7,465 (99.9%) | 9 (0.1%) |
| 75 Years and older | 4,658 (100.0%) | 0 (0.0%) |
| Total | 57,710 (87.0%) | 8,655 (13.0%) |
Health Insurance Coverage by Citizenship Status in Spalding County
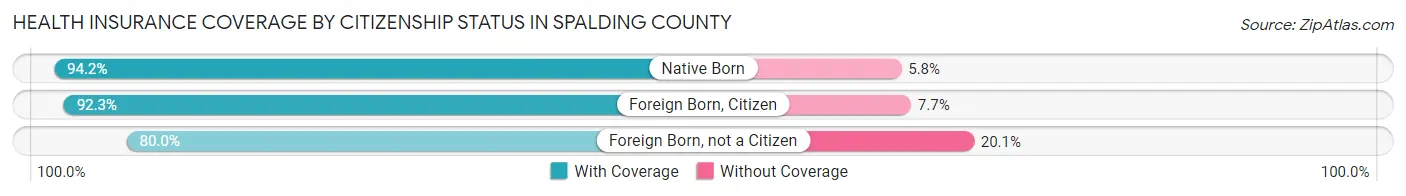
| Citizenship Status | With Coverage | Without Coverage |
| Native Born | 4,787 (94.2%) | 295 (5.8%) |
| Foreign Born, Citizen | 10,306 (92.3%) | 859 (7.7%) |
| Foreign Born, not a Citizen | 4,550 (79.9%) | 1,141 (20.1%) |
Health Insurance Coverage by Household Income in Spalding County
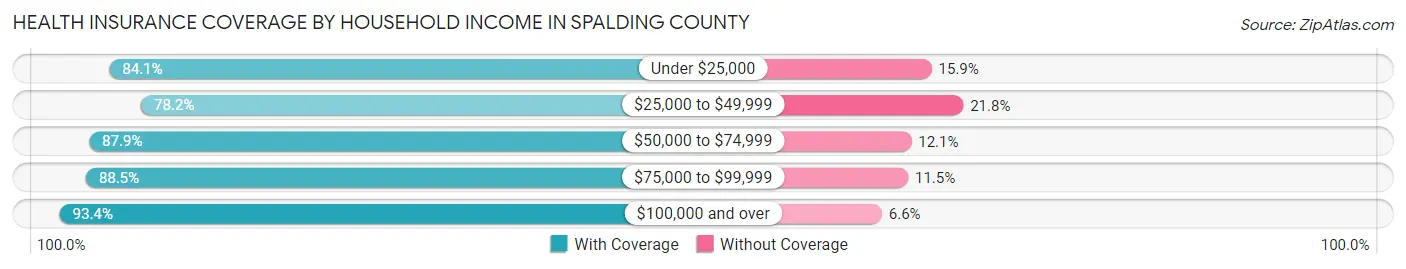
| Household Income | With Coverage | Without Coverage |
| Under $25,000 | 10,433 (84.1%) | 1,971 (15.9%) |
| $25,000 to $49,999 | 9,673 (78.2%) | 2,699 (21.8%) |
| $50,000 to $74,999 | 11,215 (87.9%) | 1,542 (12.1%) |
| $75,000 to $99,999 | 9,436 (88.5%) | 1,224 (11.5%) |
| $100,000 and over | 16,791 (93.4%) | 1,180 (6.6%) |
Public vs Private Health Insurance Coverage by Age in Spalding County
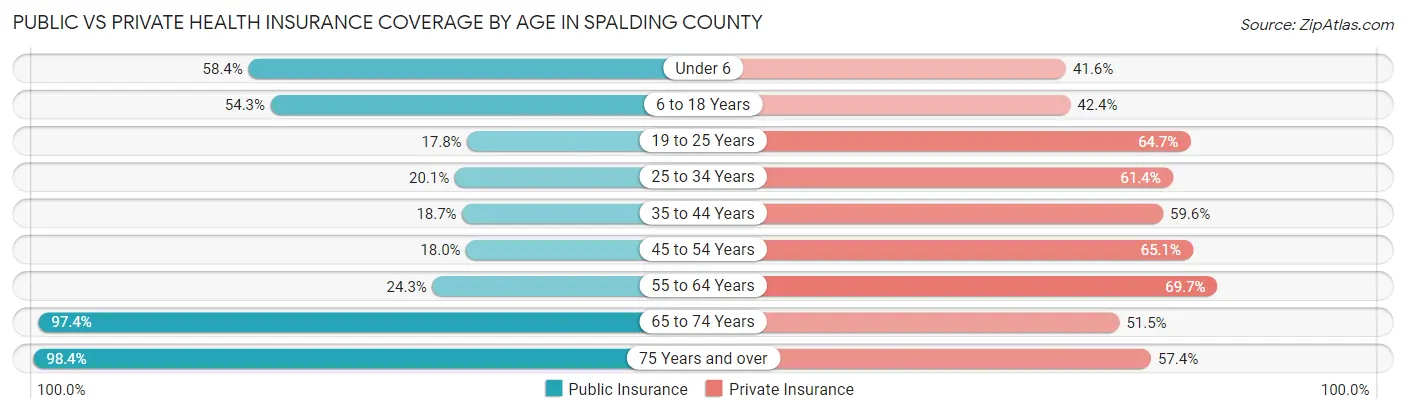
| Age Bracket | Public Insurance | Private Insurance |
| Under 6 | 2,969 (58.4%) | 2,116 (41.6%) |
| 6 to 18 Years | 6,061 (54.3%) | 4,736 (42.4%) |
| 19 to 25 Years | 1,013 (17.8%) | 3,680 (64.7%) |
| 25 to 34 Years | 1,636 (20.1%) | 4,997 (61.4%) |
| 35 to 44 Years | 1,434 (18.7%) | 4,566 (59.6%) |
| 45 to 54 Years | 1,445 (18.0%) | 5,231 (65.1%) |
| 55 to 64 Years | 2,054 (24.3%) | 5,902 (69.7%) |
| 65 to 74 Years | 7,282 (97.4%) | 3,852 (51.5%) |
| 75 Years and over | 4,582 (98.4%) | 2,674 (57.4%) |
| Total | 28,476 (42.9%) | 37,754 (56.9%) |
Disability Status by Sex by Age in Spalding County
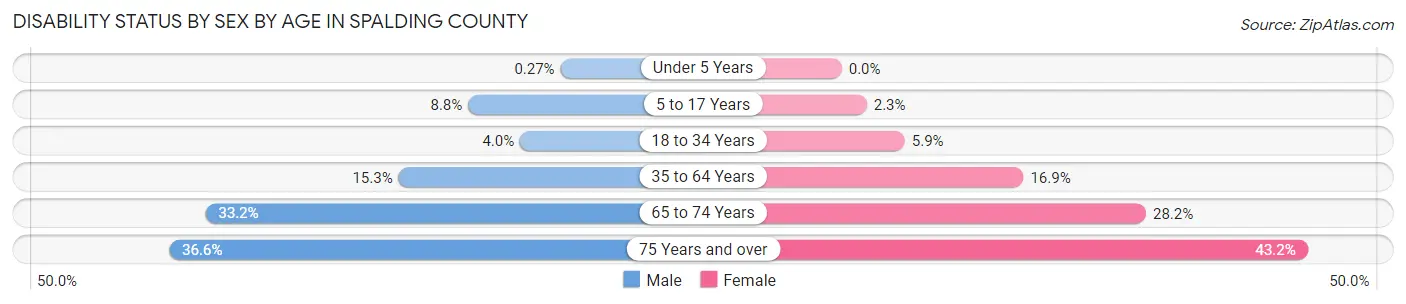
| Age Bracket | Male | Female |
| Under 5 Years | 6 (0.3%) | 0 (0.0%) |
| 5 to 17 Years | 521 (8.8%) | 132 (2.3%) |
| 18 to 34 Years | 283 (4.0%) | 425 (5.9%) |
| 35 to 64 Years | 1,715 (15.3%) | 2,182 (16.9%) |
| 65 to 74 Years | 1,096 (33.2%) | 1,179 (28.2%) |
| 75 Years and over | 708 (36.6%) | 1,177 (43.2%) |
Disability Class by Sex by Age in Spalding County
Disability Class: Hearing Difficulty
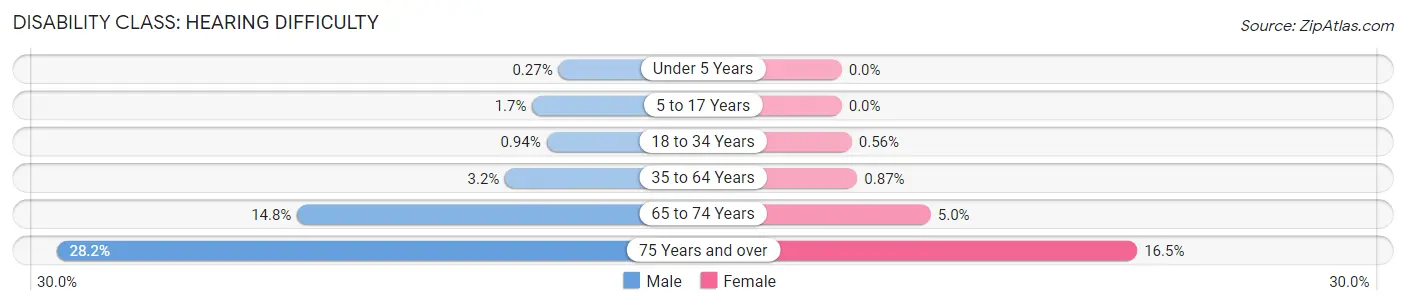
| Age Bracket | Male | Female |
| Under 5 Years | 6 (0.3%) | 0 (0.0%) |
| 5 to 17 Years | 102 (1.7%) | 0 (0.0%) |
| 18 to 34 Years | 66 (0.9%) | 41 (0.6%) |
| 35 to 64 Years | 363 (3.2%) | 112 (0.9%) |
| 65 to 74 Years | 489 (14.8%) | 207 (5.0%) |
| 75 Years and over | 546 (28.2%) | 448 (16.5%) |
Disability Class: Vision Difficulty
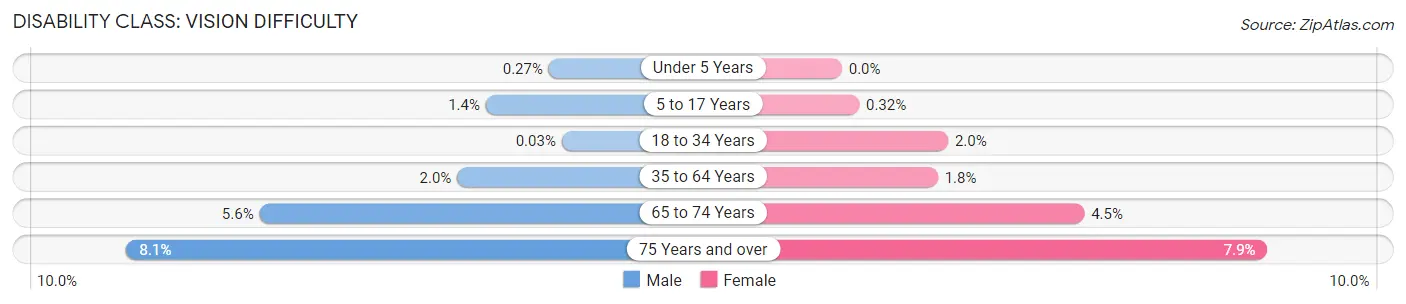
| Age Bracket | Male | Female |
| Under 5 Years | 6 (0.3%) | 0 (0.0%) |
| 5 to 17 Years | 85 (1.4%) | 18 (0.3%) |
| 18 to 34 Years | 2 (0.0%) | 143 (2.0%) |
| 35 to 64 Years | 221 (2.0%) | 231 (1.8%) |
| 65 to 74 Years | 186 (5.6%) | 188 (4.5%) |
| 75 Years and over | 157 (8.1%) | 215 (7.9%) |
Disability Class: Cognitive Difficulty
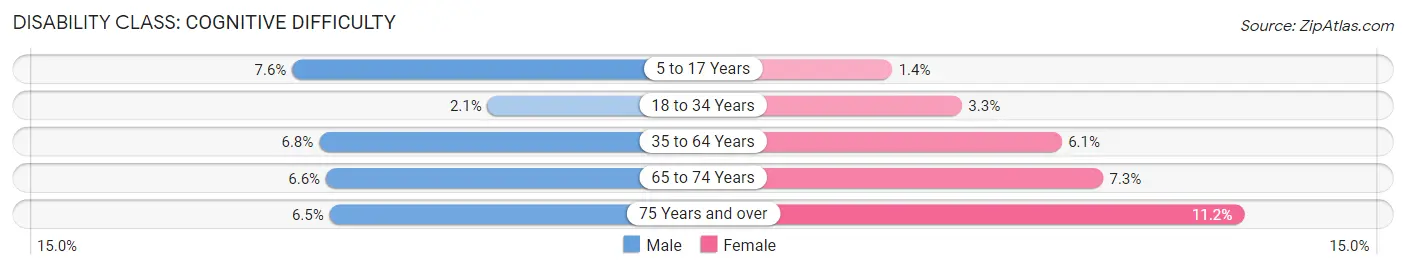
| Age Bracket | Male | Female |
| 5 to 17 Years | 445 (7.5%) | 79 (1.4%) |
| 18 to 34 Years | 149 (2.1%) | 242 (3.3%) |
| 35 to 64 Years | 762 (6.8%) | 791 (6.1%) |
| 65 to 74 Years | 218 (6.6%) | 303 (7.3%) |
| 75 Years and over | 126 (6.5%) | 305 (11.2%) |
Disability Class: Ambulatory Difficulty
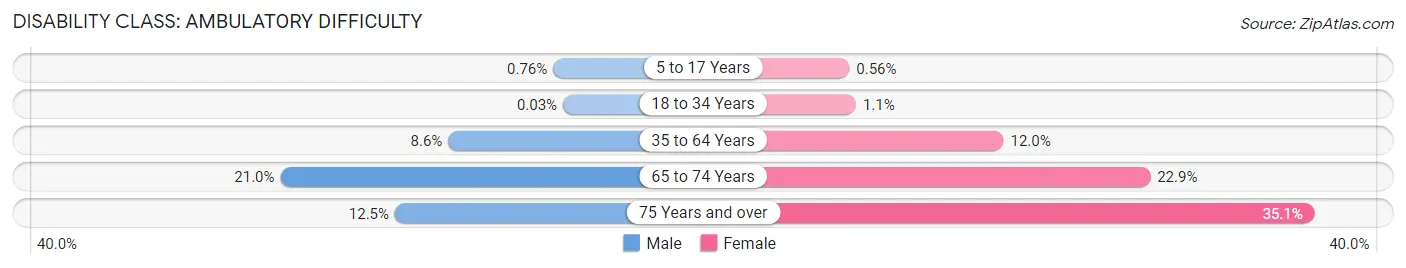
| Age Bracket | Male | Female |
| 5 to 17 Years | 45 (0.8%) | 32 (0.6%) |
| 18 to 34 Years | 2 (0.0%) | 76 (1.1%) |
| 35 to 64 Years | 959 (8.6%) | 1,555 (12.0%) |
| 65 to 74 Years | 693 (21.0%) | 956 (22.9%) |
| 75 Years and over | 242 (12.5%) | 956 (35.1%) |
Disability Class: Self-Care Difficulty
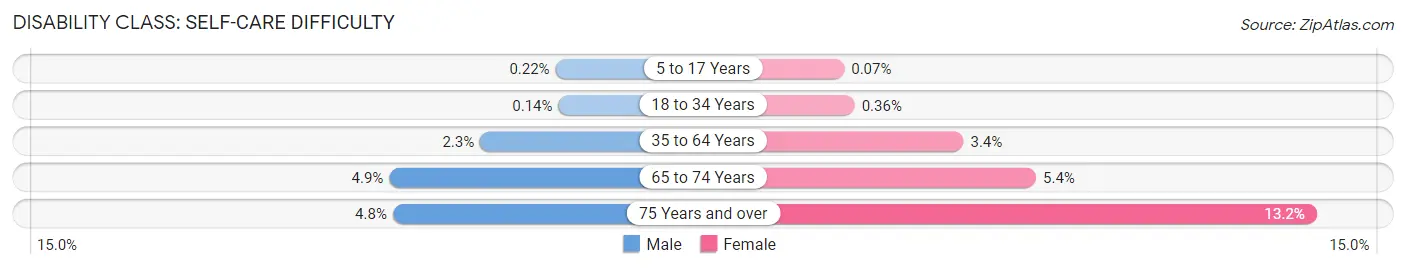
| Age Bracket | Male | Female |
| 5 to 17 Years | 13 (0.2%) | 4 (0.1%) |
| 18 to 34 Years | 10 (0.1%) | 26 (0.4%) |
| 35 to 64 Years | 260 (2.3%) | 439 (3.4%) |
| 65 to 74 Years | 160 (4.9%) | 226 (5.4%) |
| 75 Years and over | 92 (4.8%) | 360 (13.2%) |
Technology Access in Spalding County
Computing Device Access in Spalding County
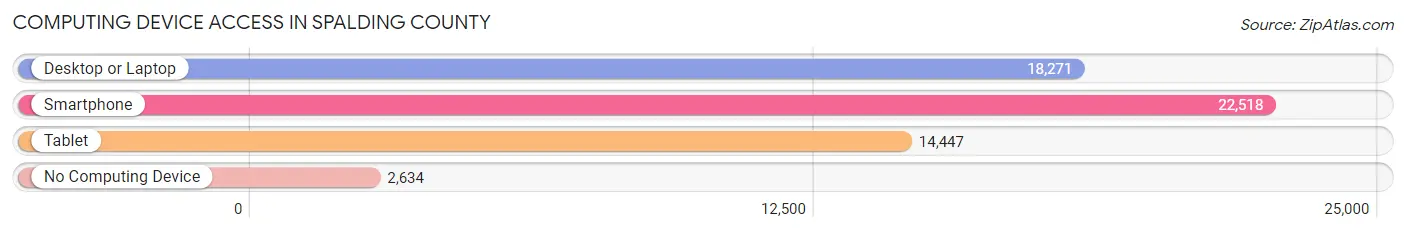
| Device Type | # Households | % Households |
| Desktop or Laptop | 18,271 | 69.5% |
| Smartphone | 22,518 | 85.6% |
| Tablet | 14,447 | 54.9% |
| No Computing Device | 2,634 | 10.0% |
| Total | 26,303 | 100.0% |
Internet Access in Spalding County
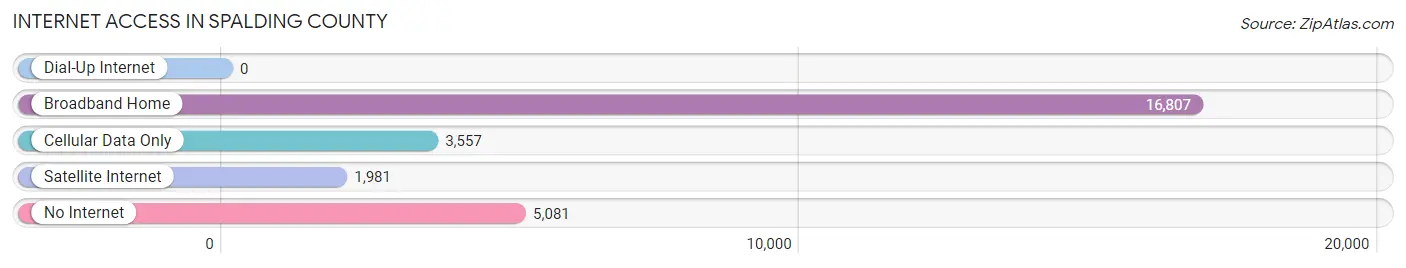
| Internet Type | # Households | % Households |
| Dial-Up Internet | 0 | 0.0% |
| Broadband Home | 16,807 | 63.9% |
| Cellular Data Only | 3,557 | 13.5% |
| Satellite Internet | 1,981 | 7.5% |
| No Internet | 5,081 | 19.3% |
| Total | 26,303 | 100.0% |
Spalding County Summary
Spalding County is located in the west-central part of the state of Georgia, in the United States. It is part of the Atlanta metropolitan area and is bordered by Fayette, Coweta, Pike, Lamar, Butts, and Henry counties. The county seat is Griffin, and the county was created in 1851 from parts of Fayette, Henry, and Pike counties.
Geography
Spalding County covers an area of approximately 437 square miles, with a population of 64,073 as of the 2010 census. The county is located in the Piedmont region of Georgia, with the Flint River running through the center of the county. The terrain is mostly flat, with some rolling hills in the northern part of the county. The county is home to several state parks, including High Falls State Park, Indian Springs State Park, and F.D. Roosevelt State Park.
Climate
Spalding County has a humid subtropical climate, with hot, humid summers and mild winters. The average annual temperature is around 64°F, with an average high of around 88°F in the summer and an average low of around 40°F in the winter. The average annual precipitation is around 50 inches, with most of the rain falling in the summer months.
Demographics
As of the 2010 census, the population of Spalding County was 64,073, with a population density of 145 people per square mile. The racial makeup of the county was 63.3% White, 30.2% African American, 0.5% Native American, 1.3% Asian, 0.1% Pacific Islander, 2.7% from other races, and 2.0% from two or more races. Hispanic or Latino of any race were 5.3% of the population.
The median income for a household in the county was $41,945, and the median income for a family was $50,945. The per capita income for the county was $20,945. About 17.3% of the population was below the poverty line.
Economy
Spalding County is home to several major industries, including manufacturing, agriculture, and tourism. The county is home to several large manufacturing companies, including Griffin Industries, which produces animal feed, and Georgia-Pacific, which produces paper products. The county is also home to several agricultural operations, including poultry farms, cattle farms, and vegetable farms.
Tourism is also an important part of the economy, with several state parks and historic sites located in the county. The county is also home to several golf courses, as well as several wineries and breweries.
Conclusion
Spalding County is a diverse county located in the west-central part of the state of Georgia. It is part of the Atlanta metropolitan area and is home to several major industries, including manufacturing, agriculture, and tourism. The county has a humid subtropical climate, with hot, humid summers and mild winters. The population of the county was 64,073 as of the 2010 census, with a median household income of $41,945. The county is home to several state parks and historic sites, as well as several golf courses, wineries, and breweries.
Common Questions
What is Per Capita Income in Spalding County?
Per Capita income in Spalding County is $35,823.
What is the Median Family Income in Spalding County?
Median Family Income in Spalding County is $68,566.
What is the Median Household income in Spalding County?
Median Household Income in Spalding County is $57,367.
What is Income or Wage Gap in Spalding County?
Income or Wage Gap in Spalding County is 17.0%.
Women in Spalding County earn 83.0 cents for every dollar earned by a man.
What is Family Income Deficit in Spalding County?
Family Income Deficit in Spalding County is $13,109.
Families that are below poverty line in Spalding County earn $13,109 less on average than the poverty threshold level.
What is Inequality or Gini Index in Spalding County?
Inequality or Gini Index in Spalding County is 0.55.
What is the Total Population of Spalding County?
Total Population of Spalding County is 67,415.
What is the Total Male Population of Spalding County?
Total Male Population of Spalding County is 32,327.
What is the Total Female Population of Spalding County?
Total Female Population of Spalding County is 35,088.
What is the Ratio of Males per 100 Females in Spalding County?
There are 92.13 Males per 100 Females in Spalding County.
What is the Ratio of Females per 100 Males in Spalding County?
There are 108.54 Females per 100 Males in Spalding County.
What is the Median Population Age in Spalding County?
Median Population Age in Spalding County is 38.9 Years.
What is the Average Family Size in Spalding County
Average Family Size in Spalding County is 3.0 People.
What is the Average Household Size in Spalding County
Average Household Size in Spalding County is 2.5 People.
How Large is the Labor Force in Spalding County?
There are 30,160 People in the Labor Forcein in Spalding County.
What is the Percentage of People in the Labor Force in Spalding County?
56.6% of People are in the Labor Force in Spalding County.
What is the Unemployment Rate in Spalding County?
Unemployment Rate in Spalding County is 5.6%.