Randolph County, GA Map & Demographics
Randolph County Map
Randolph County Overview
$18,208
PER CAPITA INCOME
$34,813
AVG FAMILY INCOME
$24,638
AVG HOUSEHOLD INCOME
36.6%
WAGE / INCOME GAP [ % ]
63.4¢/ $1
WAGE / INCOME GAP [ $ ]
$12,948
FAMILY INCOME DEFICIT
0.46
INEQUALITY / GINI INDEX
6,365
TOTAL POPULATION
2,939
MALE POPULATION
3,426
FEMALE POPULATION
85.79
MALES / 100 FEMALES
116.57
FEMALES / 100 MALES
39.0
MEDIAN AGE
3.3
AVG FAMILY SIZE
2.4
AVG HOUSEHOLD SIZE
2,653
LABOR FORCE [ PEOPLE ]
54.3%
PERCENT IN LABOR FORCE
7.5%
UNEMPLOYMENT RATE
Randolph County Area Codes
Income in Randolph County
Income Overview in Randolph County
Per Capita Income in Randolph County is $18,208, while median incomes of families and households are $34,813 and $24,638 respectively.
| Characteristic | Number | Measure |
| Per Capita Income | 6,365 | $18,208 |
| Median Family Income | 1,504 | $34,813 |
| Mean Family Income | 1,504 | $49,106 |
| Median Household Income | 2,553 | $24,638 |
| Mean Household Income | 2,553 | $39,003 |
| Income Deficit | 1,504 | $12,948 |
| Wage / Income Gap (%) | 6,365 | 36.59% |
| Wage / Income Gap ($) | 6,365 | 63.41¢ per $1 |
| Gini / Inequality Index | 6,365 | 0.46 |
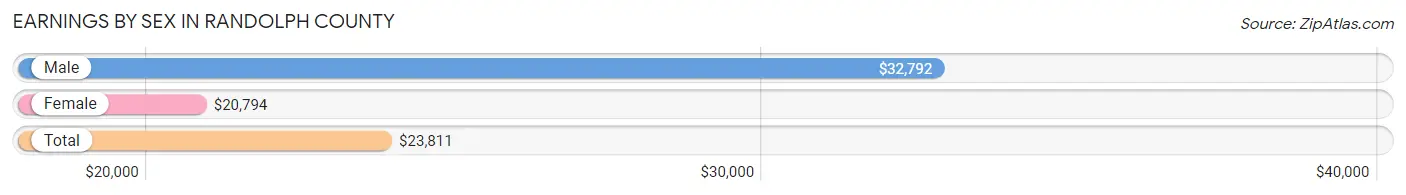
Earnings by Sex in Randolph County
Average Earnings in Randolph County are $23,811, $32,792 for men and $20,794 for women, a difference of 36.6%.
| Sex | Number | Average Earnings |
| Male | 1,219 (44.0%) | $32,792 |
| Female | 1,550 (56.0%) | $20,794 |
| Total | 2,769 (100.0%) | $23,811 |
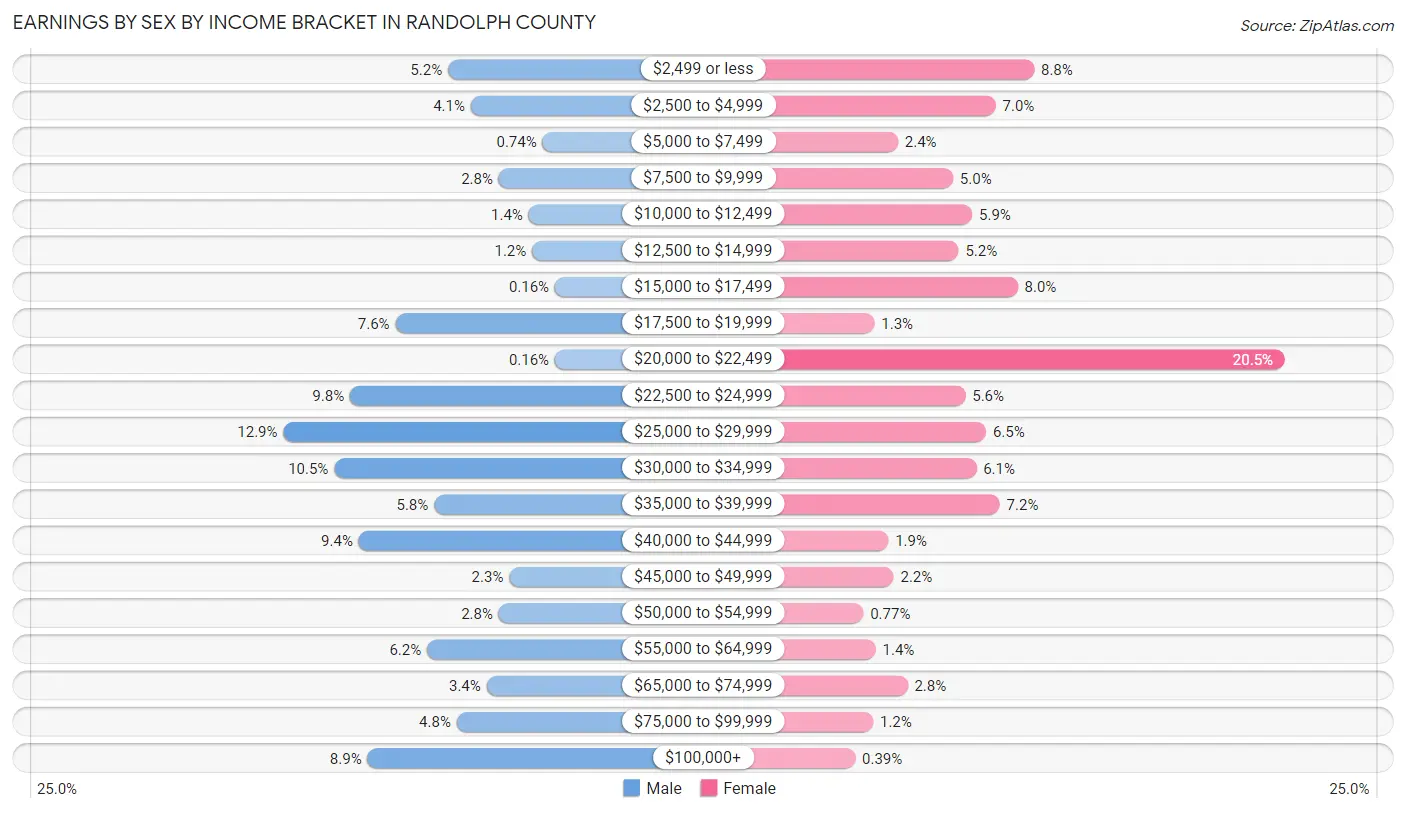
Earnings by Sex by Income Bracket in Randolph County
The most common earnings brackets in Randolph County are $25,000 to $29,999 for men (157 | 12.9%) and $20,000 to $22,499 for women (318 | 20.5%).
| Income | Male | Female |
| $2,499 or less | 63 (5.2%) | 136 (8.8%) |
| $2,500 to $4,999 | 50 (4.1%) | 108 (7.0%) |
| $5,000 to $7,499 | 9 (0.7%) | 37 (2.4%) |
| $7,500 to $9,999 | 34 (2.8%) | 77 (5.0%) |
| $10,000 to $12,499 | 17 (1.4%) | 91 (5.9%) |
| $12,500 to $14,999 | 15 (1.2%) | 81 (5.2%) |
| $15,000 to $17,499 | 2 (0.2%) | 124 (8.0%) |
| $17,500 to $19,999 | 93 (7.6%) | 20 (1.3%) |
| $20,000 to $22,499 | 2 (0.2%) | 318 (20.5%) |
| $22,500 to $24,999 | 119 (9.8%) | 86 (5.6%) |
| $25,000 to $29,999 | 157 (12.9%) | 101 (6.5%) |
| $30,000 to $34,999 | 128 (10.5%) | 94 (6.1%) |
| $35,000 to $39,999 | 71 (5.8%) | 111 (7.2%) |
| $40,000 to $44,999 | 114 (9.3%) | 30 (1.9%) |
| $45,000 to $49,999 | 28 (2.3%) | 34 (2.2%) |
| $50,000 to $54,999 | 34 (2.8%) | 12 (0.8%) |
| $55,000 to $64,999 | 75 (6.1%) | 21 (1.3%) |
| $65,000 to $74,999 | 41 (3.4%) | 44 (2.8%) |
| $75,000 to $99,999 | 58 (4.8%) | 19 (1.2%) |
| $100,000+ | 109 (8.9%) | 6 (0.4%) |
| Total | 1,219 (100.0%) | 1,550 (100.0%) |
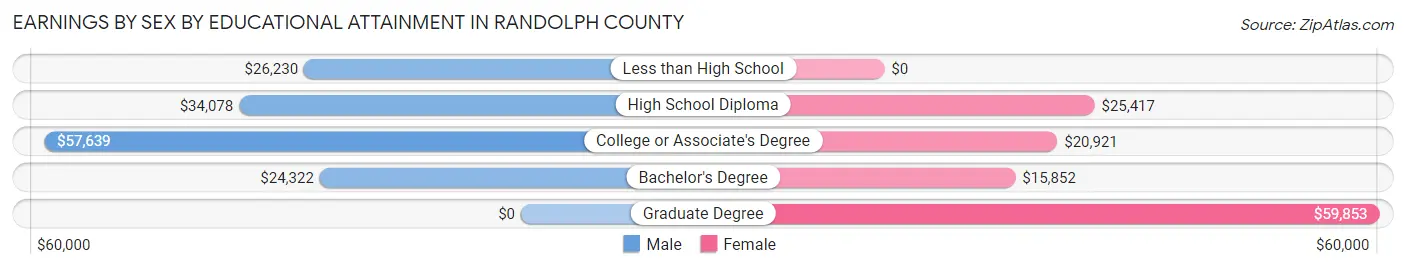
Earnings by Sex by Educational Attainment in Randolph County
Average earnings in Randolph County are $33,542 for men and $21,105 for women, a difference of 37.1%. Men with an educational attainment of college or associate's degree enjoy the highest average annual earnings of $57,639, while those with bachelor's degree education earn the least with $24,322. Women with an educational attainment of graduate degree earn the most with the average annual earnings of $59,853, while those with bachelor's degree education have the smallest earnings of $15,852.
| Educational Attainment | Male Income | Female Income |
| Less than High School | $26,230 | $0 |
| High School Diploma | $34,078 | $25,417 |
| College or Associate's Degree | $57,639 | $20,921 |
| Bachelor's Degree | $24,322 | $15,852 |
| Graduate Degree | - | - |
| Total | $33,542 | $21,105 |
Family Income in Randolph County
Family Income Brackets in Randolph County
According to the Randolph County family income data, there are 359 families falling into the $15,000 to $24,999 income range, which is the most common income bracket and makes up 23.9% of all families. Conversely, the $200,000+ income bracket is the least frequent group with only 14 families (0.9%) belonging to this category.
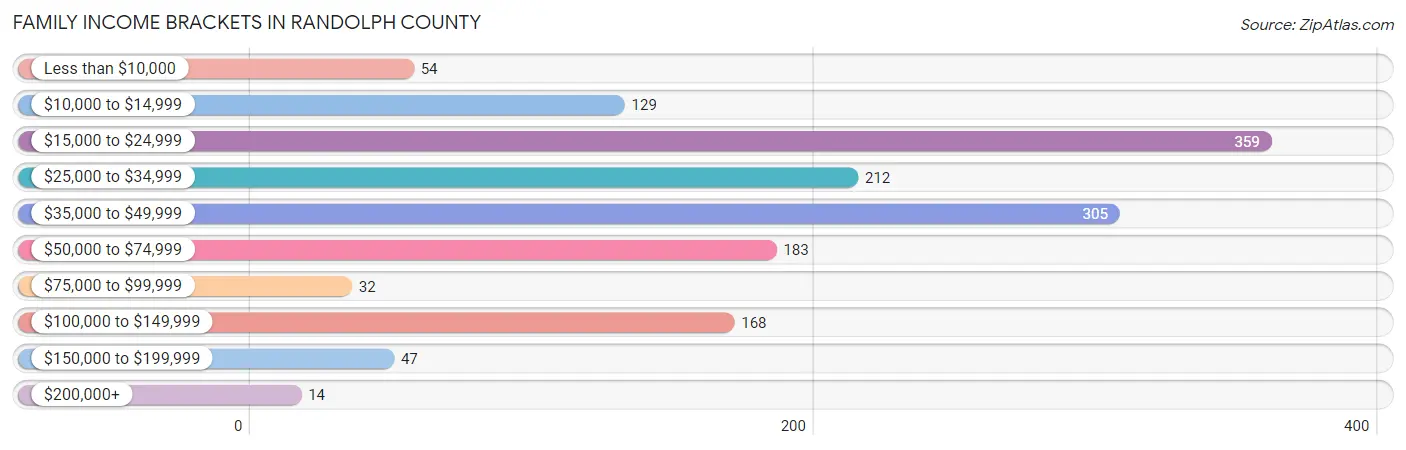
| Income Bracket | # Families | % Families |
| Less than $10,000 | 54 | 3.6% |
| $10,000 to $14,999 | 129 | 8.6% |
| $15,000 to $24,999 | 359 | 23.9% |
| $25,000 to $34,999 | 212 | 14.1% |
| $35,000 to $49,999 | 305 | 20.3% |
| $50,000 to $74,999 | 183 | 12.2% |
| $75,000 to $99,999 | 32 | 2.1% |
| $100,000 to $149,999 | 168 | 11.2% |
| $150,000 to $199,999 | 47 | 3.1% |
| $200,000+ | 14 | 0.9% |
Family Income by Famaliy Size in Randolph County
4-person families (263 | 17.5%) account for the highest median family income in Randolph County with $36,182 per family, while 2-person families (913 | 60.7%) have the highest median income of $15,534 per family member.
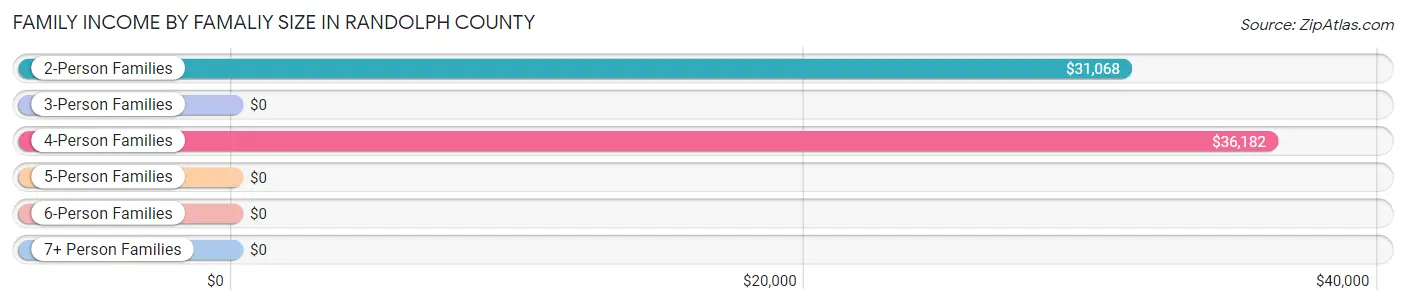
| Income Bracket | # Families | Median Income |
| 2-Person Families | 913 (60.7%) | $31,068 |
| 3-Person Families | 256 (17.0%) | $0 |
| 4-Person Families | 263 (17.5%) | $36,182 |
| 5-Person Families | 13 (0.9%) | $0 |
| 6-Person Families | 53 (3.5%) | $0 |
| 7+ Person Families | 6 (0.4%) | $0 |
| Total | 1,504 (100.0%) | $34,813 |
Family Income by Number of Earners in Randolph County
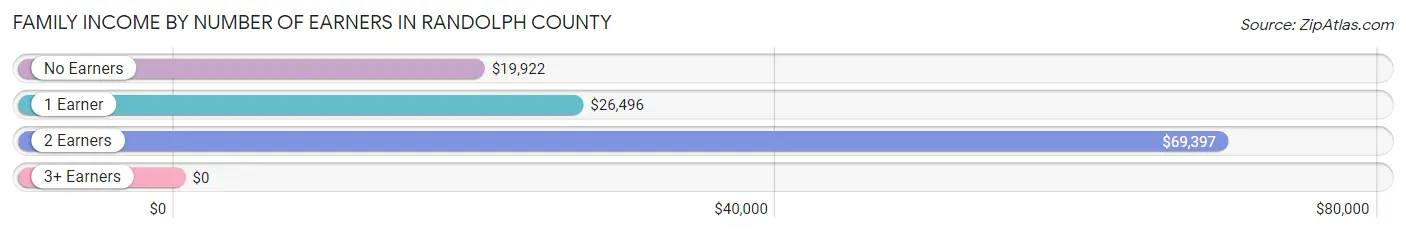
| Number of Earners | # Families | Median Income |
| No Earners | 229 (15.2%) | $19,922 |
| 1 Earner | 783 (52.1%) | $26,496 |
| 2 Earners | 467 (31.0%) | $69,397 |
| 3+ Earners | 25 (1.7%) | $0 |
| Total | 1,504 (100.0%) | $34,813 |
Household Income in Randolph County
Household Income Brackets in Randolph County
With 689 households falling in the category, the $15,000 to $24,999 income range is the most frequent in Randolph County, accounting for 27.0% of all households. In contrast, only 13 households (0.5%) fall into the $200,000+ income bracket, making it the least populous group.
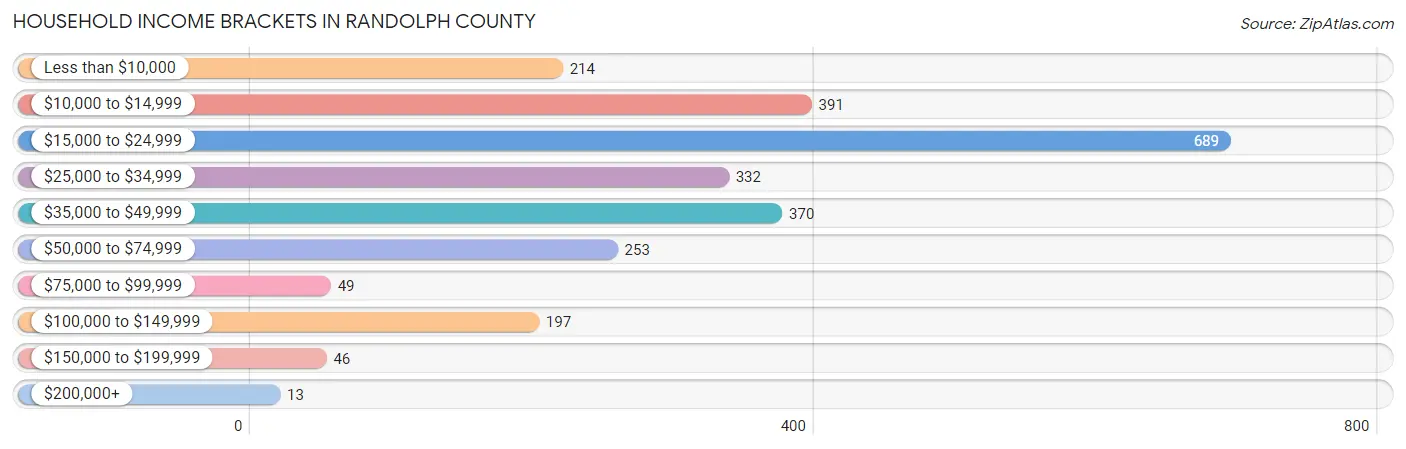
| Income Bracket | # Households | % Households |
| Less than $10,000 | 214 | 8.4% |
| $10,000 to $14,999 | 391 | 15.3% |
| $15,000 to $24,999 | 689 | 27.0% |
| $25,000 to $34,999 | 332 | 13.0% |
| $35,000 to $49,999 | 370 | 14.5% |
| $50,000 to $74,999 | 253 | 9.9% |
| $75,000 to $99,999 | 49 | 1.9% |
| $100,000 to $149,999 | 197 | 7.7% |
| $150,000 to $199,999 | 46 | 1.8% |
| $200,000+ | 13 | 0.5% |
Household Income by Householder Age in Randolph County
The median household income in Randolph County is $24,638, with the highest median household income of $33,019 found in the 45 to 64 years age bracket for the primary householder. A total of 929 households (36.4%) fall into this category. Meanwhile, the 15 to 24 years age bracket for the primary householder has the lowest median household income of $0, with 25 households (1.0%) in this group.
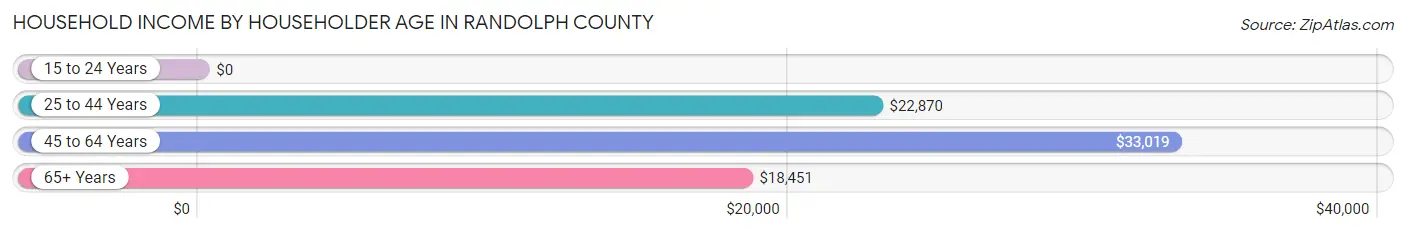
| Income Bracket | # Households | Median Income |
| 15 to 24 Years | 25 (1.0%) | $0 |
| 25 to 44 Years | 730 (28.6%) | $22,870 |
| 45 to 64 Years | 929 (36.4%) | $33,019 |
| 65+ Years | 869 (34.0%) | $18,451 |
| Total | 2,553 (100.0%) | $24,638 |
Poverty in Randolph County
Income Below Poverty by Sex and Age in Randolph County
With 24.8% poverty level for males and 30.9% for females among the residents of Randolph County, 6 to 11 year old males and 5 year old females are the most vulnerable to poverty, with 153 males (59.1%) and 46 females (92.0%) in their respective age groups living below the poverty level.
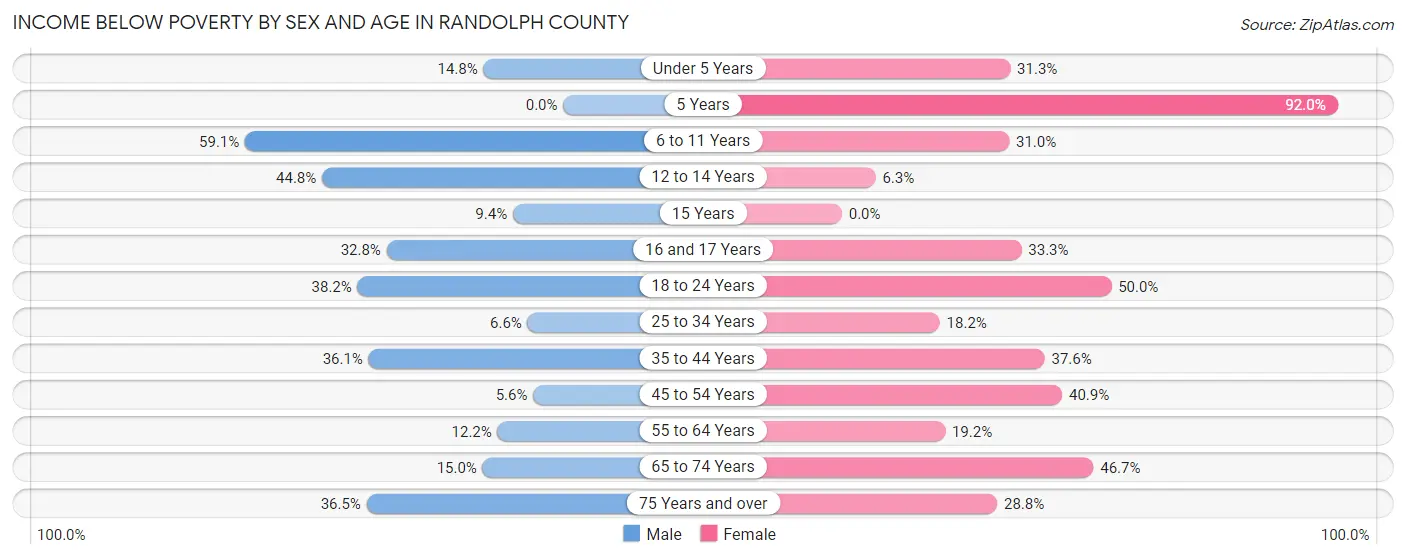
| Age Bracket | Male | Female |
| Under 5 Years | 28 (14.8%) | 55 (31.2%) |
| 5 Years | 0 (0.0%) | 46 (92.0%) |
| 6 to 11 Years | 153 (59.1%) | 140 (31.0%) |
| 12 to 14 Years | 60 (44.8%) | 1 (6.2%) |
| 15 Years | 10 (9.3%) | 0 (0.0%) |
| 16 and 17 Years | 20 (32.8%) | 17 (33.3%) |
| 18 to 24 Years | 97 (38.2%) | 96 (50.0%) |
| 25 to 34 Years | 20 (6.6%) | 95 (18.2%) |
| 35 to 44 Years | 129 (36.1%) | 143 (37.6%) |
| 45 to 54 Years | 13 (5.6%) | 74 (40.9%) |
| 55 to 64 Years | 45 (12.2%) | 112 (19.2%) |
| 65 to 74 Years | 53 (15.0%) | 176 (46.7%) |
| 75 Years and over | 73 (36.5%) | 83 (28.8%) |
| Total | 701 (24.8%) | 1,038 (30.9%) |
Income Above Poverty by Sex and Age in Randolph County
According to the poverty statistics in Randolph County, males aged 5 years and females aged 15 years are the age groups that are most secure financially, with 100.0% of males and 100.0% of females in these age groups living above the poverty line.
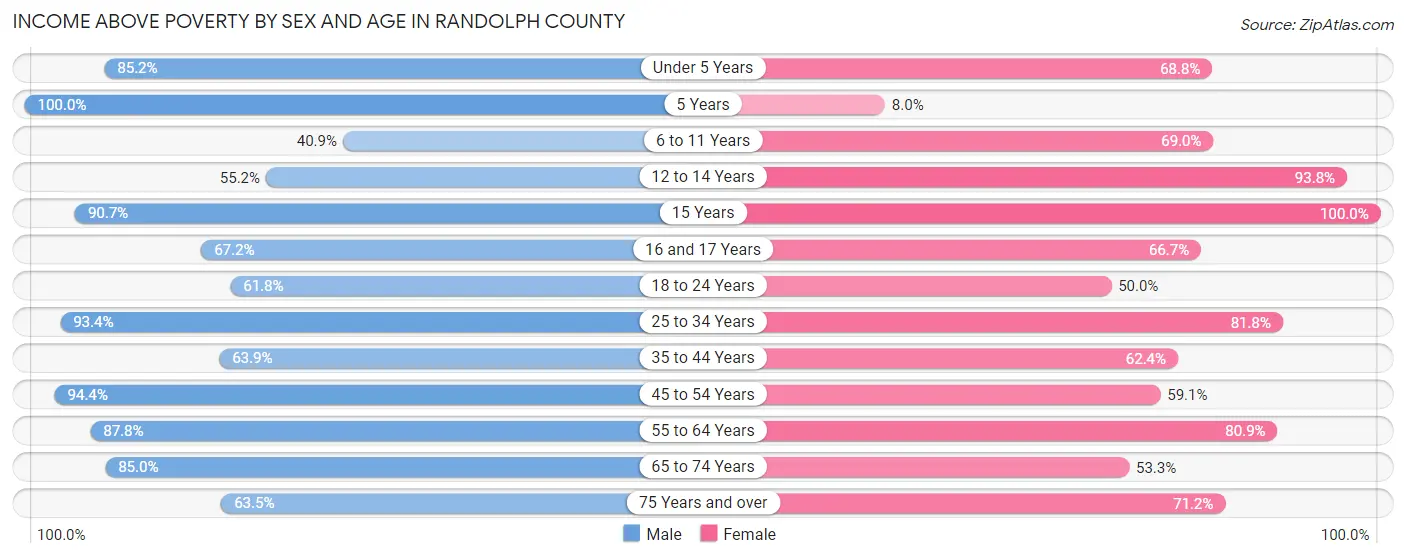
| Age Bracket | Male | Female |
| Under 5 Years | 161 (85.2%) | 121 (68.8%) |
| 5 Years | 5 (100.0%) | 4 (8.0%) |
| 6 to 11 Years | 106 (40.9%) | 311 (69.0%) |
| 12 to 14 Years | 74 (55.2%) | 15 (93.8%) |
| 15 Years | 97 (90.6%) | 93 (100.0%) |
| 16 and 17 Years | 41 (67.2%) | 34 (66.7%) |
| 18 to 24 Years | 157 (61.8%) | 96 (50.0%) |
| 25 to 34 Years | 282 (93.4%) | 428 (81.8%) |
| 35 to 44 Years | 228 (63.9%) | 237 (62.4%) |
| 45 to 54 Years | 220 (94.4%) | 107 (59.1%) |
| 55 to 64 Years | 324 (87.8%) | 473 (80.8%) |
| 65 to 74 Years | 301 (85.0%) | 201 (53.3%) |
| 75 Years and over | 127 (63.5%) | 205 (71.2%) |
| Total | 2,123 (75.2%) | 2,325 (69.1%) |
Income Below Poverty Among Married-Couple Families in Randolph County
The poverty statistics for married-couple families in Randolph County show that 2.4% or 15 of the total 626 families live below the poverty line. Families with 3 or 4 children have the highest poverty rate of 28.6%, comprising of 4 families. On the other hand, families with 1 or 2 children have the lowest poverty rate of 0.0%, which includes 0 families.
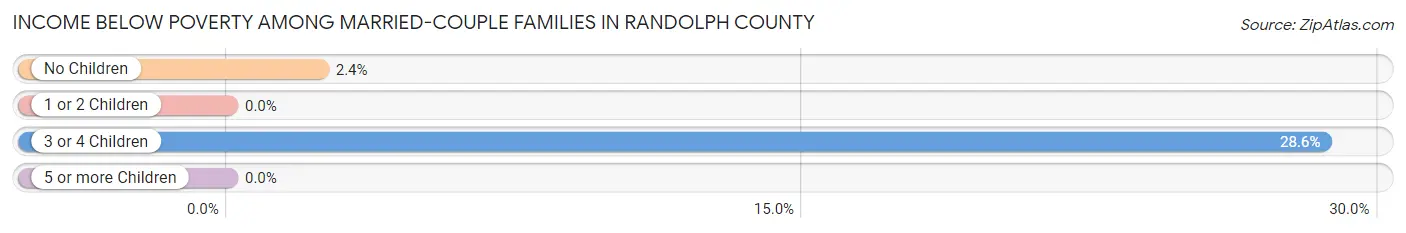
| Children | Above Poverty | Below Poverty |
| No Children | 453 (97.6%) | 11 (2.4%) |
| 1 or 2 Children | 148 (100.0%) | 0 (0.0%) |
| 3 or 4 Children | 10 (71.4%) | 4 (28.6%) |
| 5 or more Children | 0 (0.0%) | 0 (0.0%) |
| Total | 611 (97.6%) | 15 (2.4%) |
Income Below Poverty Among Single-Parent Households in Randolph County
According to the poverty data in Randolph County, 30.4% or 91 single-father households and 27.6% or 160 single-mother households are living below the poverty line. Among single-father households, those with no children have the highest poverty rate, with 22 households (44.9%) experiencing poverty. Likewise, among single-mother households, those with 3 or 4 children have the highest poverty rate, with 43 households (55.1%) falling below the poverty line.
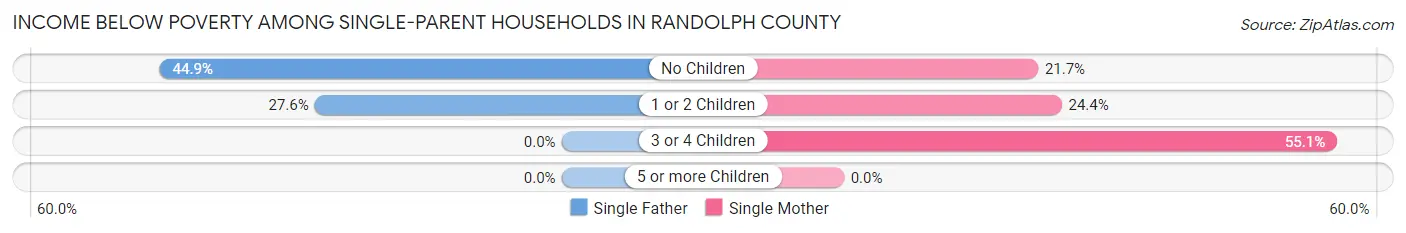
| Children | Single Father | Single Mother |
| No Children | 22 (44.9%) | 33 (21.7%) |
| 1 or 2 Children | 69 (27.6%) | 84 (24.3%) |
| 3 or 4 Children | 0 (0.0%) | 43 (55.1%) |
| 5 or more Children | 0 (0.0%) | 0 (0.0%) |
| Total | 91 (30.4%) | 160 (27.6%) |
Income Below Poverty Among Married-Couple vs Single-Parent Households in Randolph County
The poverty data for Randolph County shows that 15 of the married-couple family households (2.4%) and 251 of the single-parent households (28.6%) are living below the poverty level. Within the married-couple family households, those with 3 or 4 children have the highest poverty rate, with 4 households (28.6%) falling below the poverty line. Among the single-parent households, those with 3 or 4 children have the highest poverty rate, with 43 household (55.1%) living below poverty.
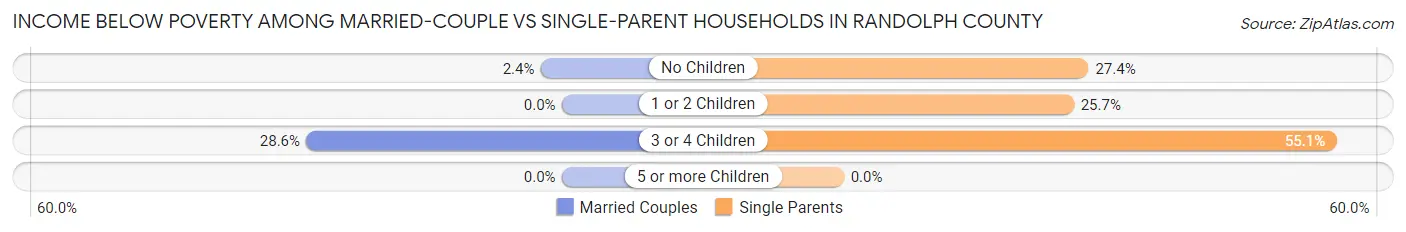
| Children | Married-Couple Families | Single-Parent Households |
| No Children | 11 (2.4%) | 55 (27.4%) |
| 1 or 2 Children | 0 (0.0%) | 153 (25.7%) |
| 3 or 4 Children | 4 (28.6%) | 43 (55.1%) |
| 5 or more Children | 0 (0.0%) | 0 (0.0%) |
| Total | 15 (2.4%) | 251 (28.6%) |
Race in Randolph County
The most populous races in Randolph County are Black / African American (4,116 | 64.7%), White / Caucasian (1,960 | 30.8%), and Hispanic or Latino (210 | 3.3%).
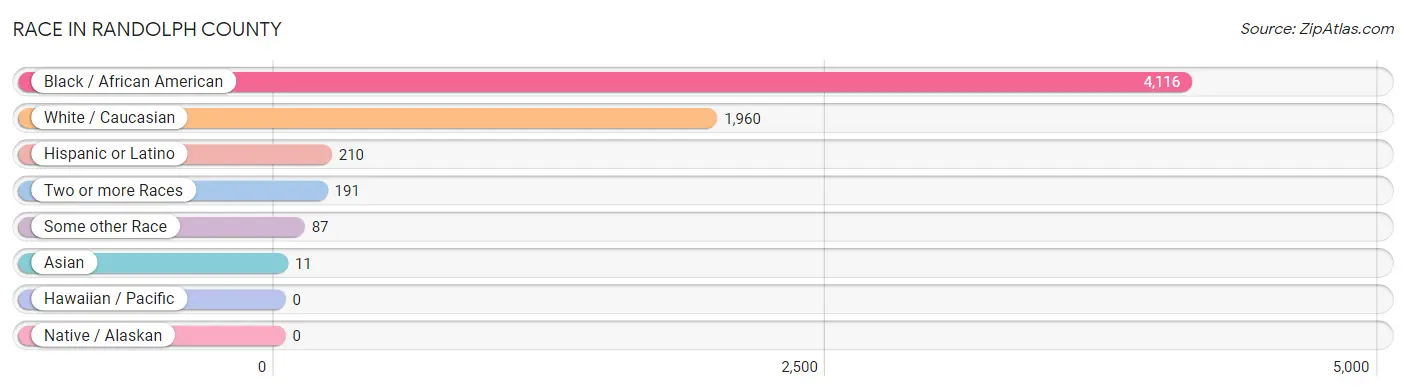
| Race | # Population | % Population |
| Asian | 11 | 0.2% |
| Black / African American | 4,116 | 64.7% |
| Hawaiian / Pacific | 0 | 0.0% |
| Hispanic or Latino | 210 | 3.3% |
| Native / Alaskan | 0 | 0.0% |
| White / Caucasian | 1,960 | 30.8% |
| Two or more Races | 191 | 3.0% |
| Some other Race | 87 | 1.4% |
| Total | 6,365 | 100.0% |
Ancestry in Randolph County
The most populous ancestries reported in Randolph County are American (980 | 15.4%), English (344 | 5.4%), Mexican (164 | 2.6%), Irish (147 | 2.3%), and German (112 | 1.8%), together accounting for 27.4% of all Randolph County residents.
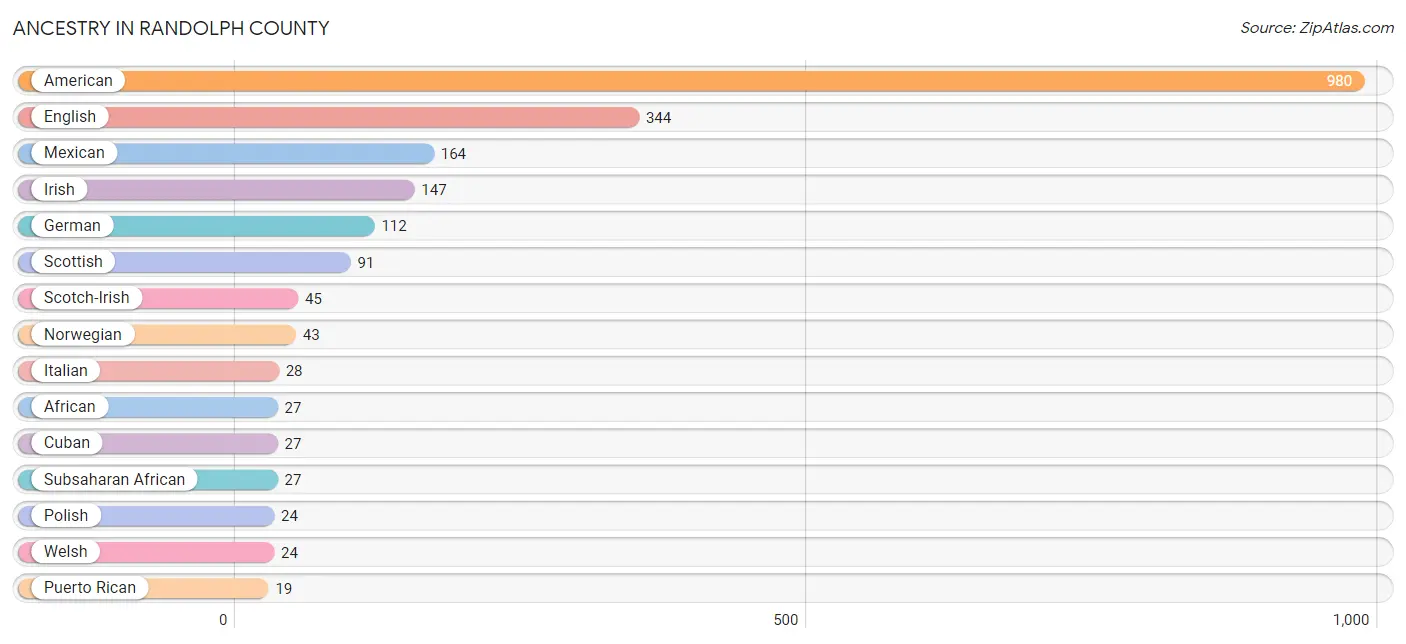
| Ancestry | # Population | % Population |
| African | 27 | 0.4% |
| American | 980 | 15.4% |
| British | 2 | 0.0% |
| Cherokee | 14 | 0.2% |
| Choctaw | 7 | 0.1% |
| Cuban | 27 | 0.4% |
| Eastern European | 8 | 0.1% |
| English | 344 | 5.4% |
| European | 10 | 0.2% |
| French | 2 | 0.0% |
| German | 112 | 1.8% |
| Greek | 13 | 0.2% |
| Indian (Asian) | 11 | 0.2% |
| Irish | 147 | 2.3% |
| Iroquois | 7 | 0.1% |
| Israeli | 4 | 0.1% |
| Italian | 28 | 0.4% |
| Mexican | 164 | 2.6% |
| Mexican American Indian | 1 | 0.0% |
| Norwegian | 43 | 0.7% |
| Polish | 24 | 0.4% |
| Puerto Rican | 19 | 0.3% |
| Scotch-Irish | 45 | 0.7% |
| Scottish | 91 | 1.4% |
| Subsaharan African | 27 | 0.4% |
| Welsh | 24 | 0.4% | View All 26 Rows |
Immigrants in Randolph County
The most numerous immigrant groups reported in Randolph County came from Europe (27 | 0.4%), Northern Europe (27 | 0.4%), Scotland (27 | 0.4%), Central America (19 | 0.3%), and Latin America (19 | 0.3%), together accounting for 1.9% of all Randolph County residents.
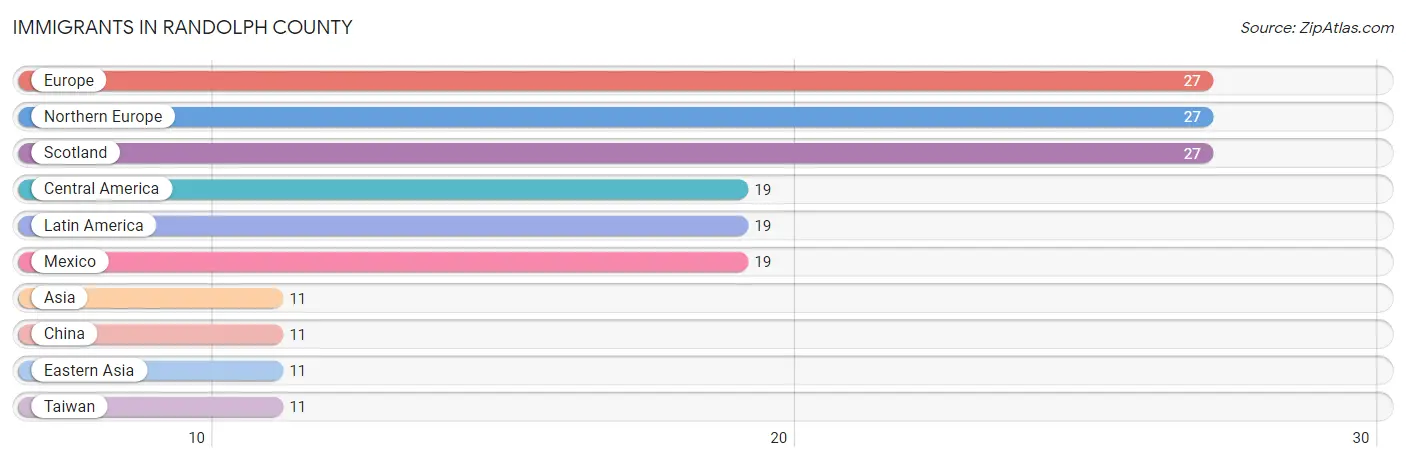
| Immigration Origin | # Population | % Population |
| Asia | 11 | 0.2% |
| Central America | 19 | 0.3% |
| China | 11 | 0.2% |
| Eastern Asia | 11 | 0.2% |
| Europe | 27 | 0.4% |
| Latin America | 19 | 0.3% |
| Mexico | 19 | 0.3% |
| Northern Europe | 27 | 0.4% |
| Scotland | 27 | 0.4% |
| Taiwan | 11 | 0.2% | View All 10 Rows |
Sex and Age in Randolph County
Sex and Age in Randolph County
The most populous age groups in Randolph County are 15 to 19 Years (309 | 10.5%) for men and 25 to 29 Years (389 | 11.4%) for women.
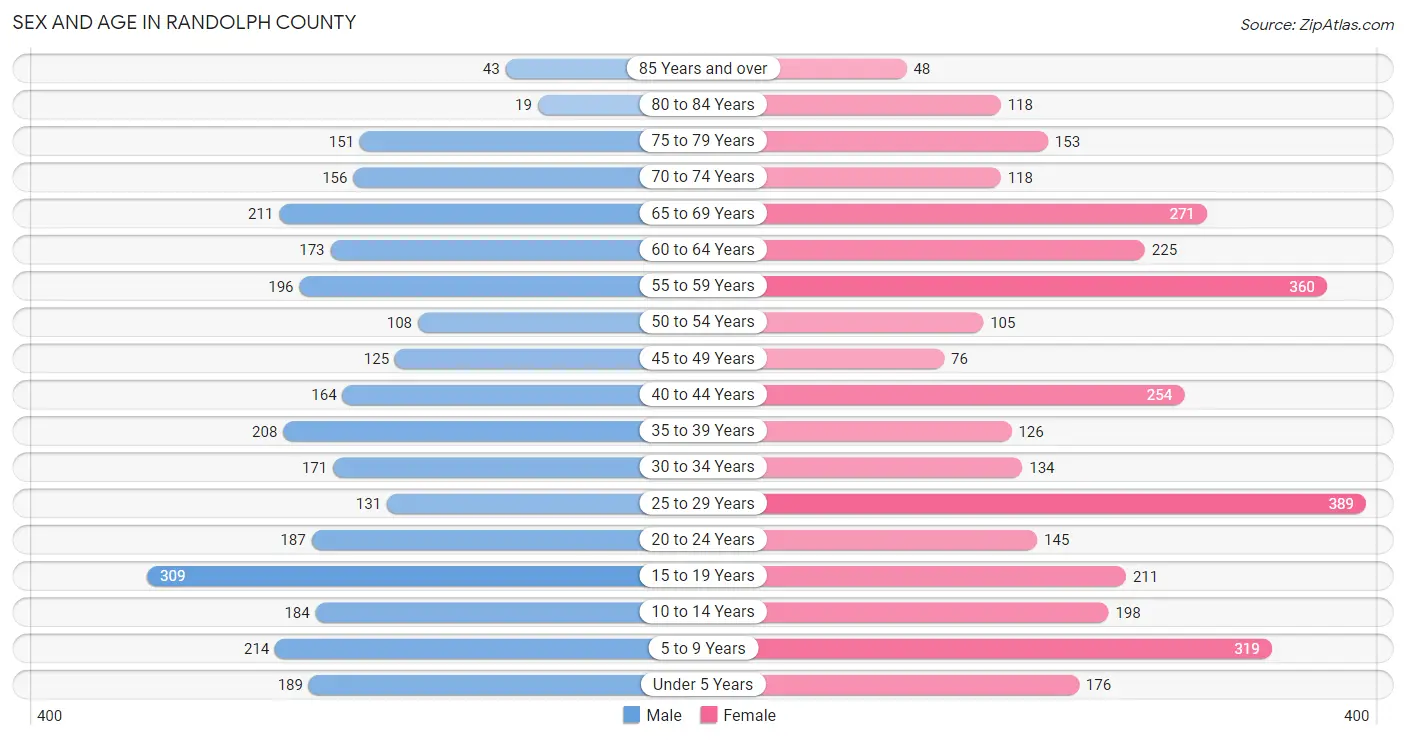
| Age Bracket | Male | Female |
| Under 5 Years | 189 (6.4%) | 176 (5.1%) |
| 5 to 9 Years | 214 (7.3%) | 319 (9.3%) |
| 10 to 14 Years | 184 (6.3%) | 198 (5.8%) |
| 15 to 19 Years | 309 (10.5%) | 211 (6.2%) |
| 20 to 24 Years | 187 (6.4%) | 145 (4.2%) |
| 25 to 29 Years | 131 (4.5%) | 389 (11.4%) |
| 30 to 34 Years | 171 (5.8%) | 134 (3.9%) |
| 35 to 39 Years | 208 (7.1%) | 126 (3.7%) |
| 40 to 44 Years | 164 (5.6%) | 254 (7.4%) |
| 45 to 49 Years | 125 (4.3%) | 76 (2.2%) |
| 50 to 54 Years | 108 (3.7%) | 105 (3.1%) |
| 55 to 59 Years | 196 (6.7%) | 360 (10.5%) |
| 60 to 64 Years | 173 (5.9%) | 225 (6.6%) |
| 65 to 69 Years | 211 (7.2%) | 271 (7.9%) |
| 70 to 74 Years | 156 (5.3%) | 118 (3.4%) |
| 75 to 79 Years | 151 (5.1%) | 153 (4.5%) |
| 80 to 84 Years | 19 (0.6%) | 118 (3.4%) |
| 85 Years and over | 43 (1.5%) | 48 (1.4%) |
| Total | 2,939 (100.0%) | 3,426 (100.0%) |
Families and Households in Randolph County
Median Family Size in Randolph County
The median family size in Randolph County is 3.29 persons per family, with single female/mother families (579 | 38.5%) accounting for the largest median family size of 3.72 persons per family. On the other hand, married-couple families (626 | 41.6%) represent the smallest median family size with 2.97 persons per family.
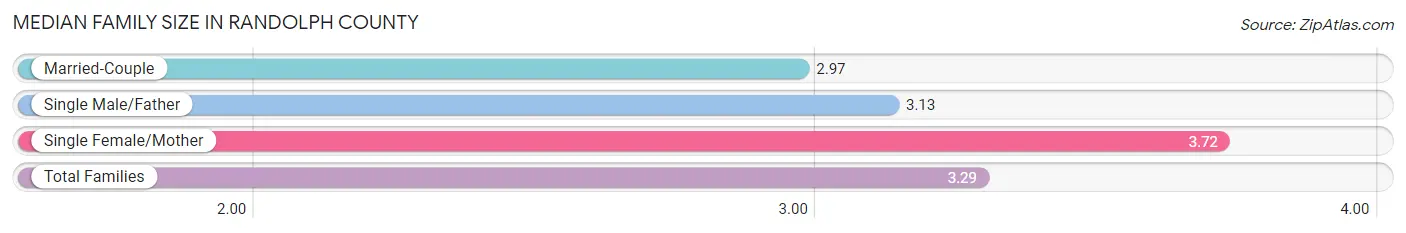
| Family Type | # Families | Family Size |
| Married-Couple | 626 (41.6%) | 2.97 |
| Single Male/Father | 299 (19.9%) | 3.13 |
| Single Female/Mother | 579 (38.5%) | 3.72 |
| Total Families | 1,504 (100.0%) | 3.29 |
Median Household Size in Randolph County
The median household size in Randolph County is 2.42 persons per household, with single female/mother households (579 | 22.7%) accounting for the largest median household size of 3.73 persons per household. non-family households (1,049 | 41.1%) represent the smallest median household size with 1.08 persons per household.
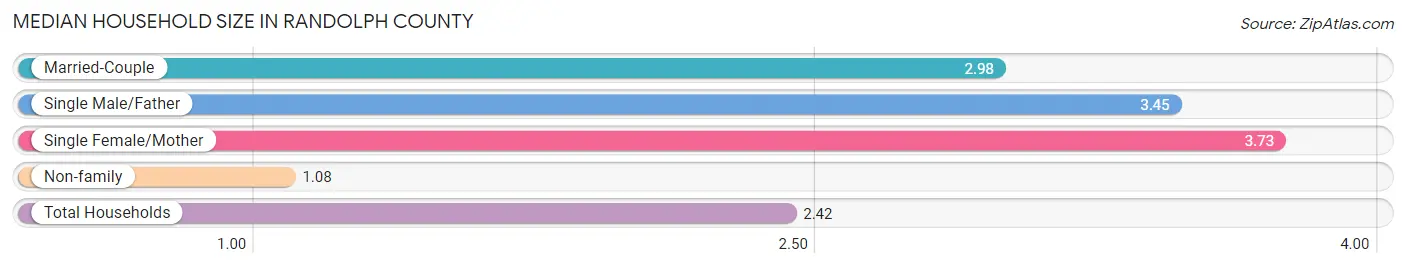
| Household Type | # Households | Household Size |
| Married-Couple | 626 (24.5%) | 2.98 |
| Single Male/Father | 299 (11.7%) | 3.45 |
| Single Female/Mother | 579 (22.7%) | 3.73 |
| Non-family | 1,049 (41.1%) | 1.08 |
| Total Households | 2,553 (100.0%) | 2.42 |
Household Size by Marriage Status in Randolph County
Out of a total of 2,553 households in Randolph County, 1,504 (58.9%) are family households, while 1,049 (41.1%) are nonfamily households. The most numerous type of family households are 2-person households, comprising 894, and the most common type of nonfamily households are 1-person households, comprising 989.
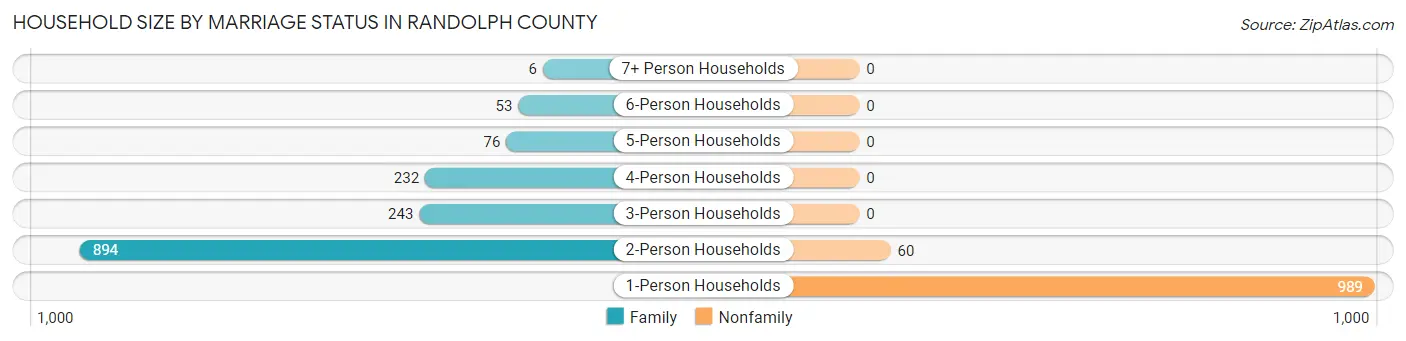
| Household Size | Family Households | Nonfamily Households |
| 1-Person Households | - | 989 (38.7%) |
| 2-Person Households | 894 (35.0%) | 60 (2.4%) |
| 3-Person Households | 243 (9.5%) | 0 (0.0%) |
| 4-Person Households | 232 (9.1%) | 0 (0.0%) |
| 5-Person Households | 76 (3.0%) | 0 (0.0%) |
| 6-Person Households | 53 (2.1%) | 0 (0.0%) |
| 7+ Person Households | 6 (0.2%) | 0 (0.0%) |
| Total | 1,504 (58.9%) | 1,049 (41.1%) |
Female Fertility in Randolph County
Fertility by Age in Randolph County
Average fertility rate in Randolph County is 38.0 births per 1,000 women. Women in the age bracket of 20 to 34 years have the highest fertility rate with 79.0 births per 1,000 women. Women in the age bracket of 20 to 34 years acount for 100.0% of all women with births.
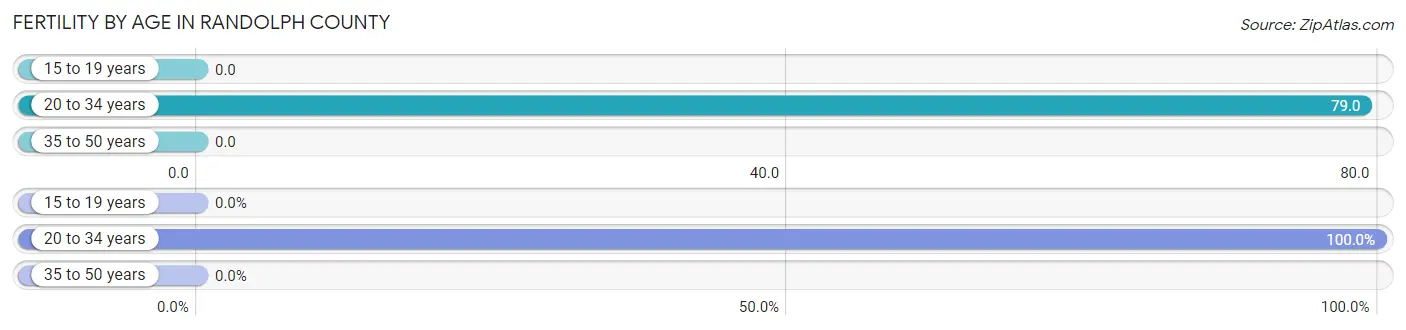
| Age Bracket | Women with Births | Births / 1,000 Women |
| 15 to 19 years | 0 (0.0%) | 0.0 |
| 20 to 34 years | 53 (100.0%) | 79.0 |
| 35 to 50 years | 0 (0.0%) | 0.0 |
| Total | 53 (100.0%) | 38.0 |
Fertility by Age by Marriage Status in Randolph County
24.5% of women with births (53) in Randolph County are married. The highest percentage of unmarried women with births falls into 20 to 34 years age bracket with 75.5% of them unmarried at the time of birth, while the lowest percentage of unmarried women with births belong to 20 to 34 years age bracket with 75.5% of them unmarried.
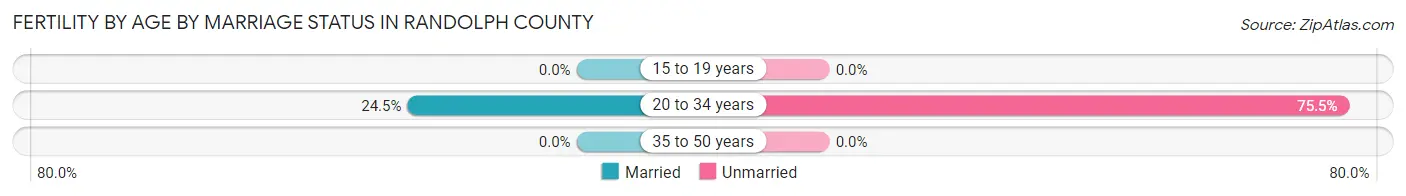
| Age Bracket | Married | Unmarried |
| 15 to 19 years | 0 (0.0%) | 0 (0.0%) |
| 20 to 34 years | 13 (24.5%) | 40 (75.5%) |
| 35 to 50 years | 0 (0.0%) | 0 (0.0%) |
| Total | 13 (24.5%) | 40 (75.5%) |
Fertility by Education in Randolph County
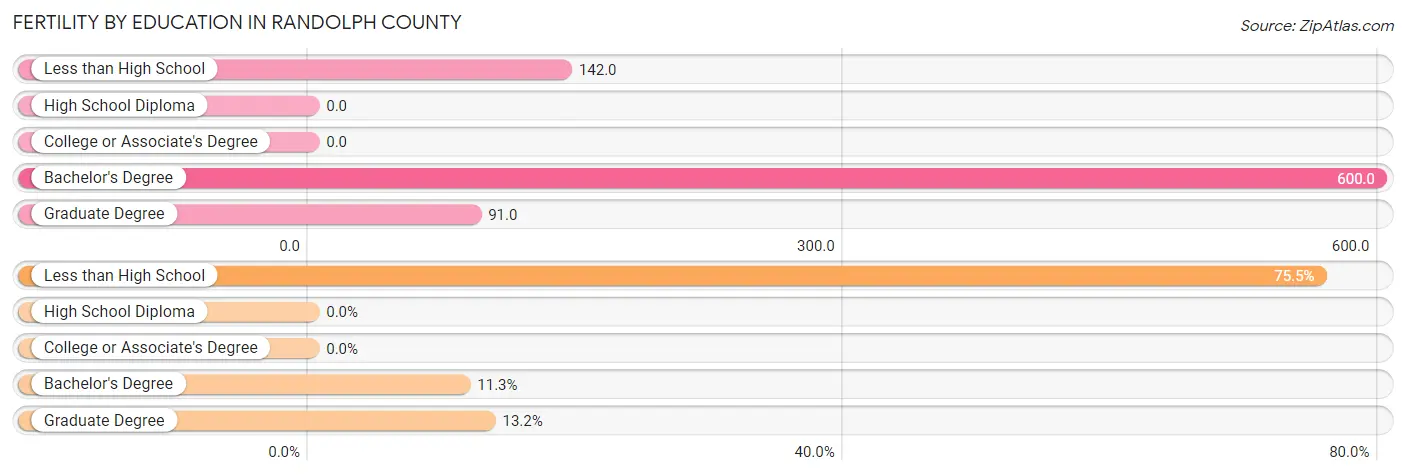
| Educational Attainment | Women with Births | Births / 1,000 Women |
| Less than High School | 40 (75.5%) | 142.0 |
| High School Diploma | 0 (0.0%) | 0.0 |
| College or Associate's Degree | 0 (0.0%) | 0.0 |
| Bachelor's Degree | 6 (11.3%) | 600.0 |
| Graduate Degree | 7 (13.2%) | 91.0 |
| Total | 53 (100.0%) | 38.0 |
Fertility by Education by Marriage Status in Randolph County
75.5% of women with births in Randolph County are unmarried. Women with the educational attainment of bachelor's degree are most likely to be married with 100.0% of them married at childbirth, while women with the educational attainment of less than high school are least likely to be married with 100.0% of them unmarried at childbirth.
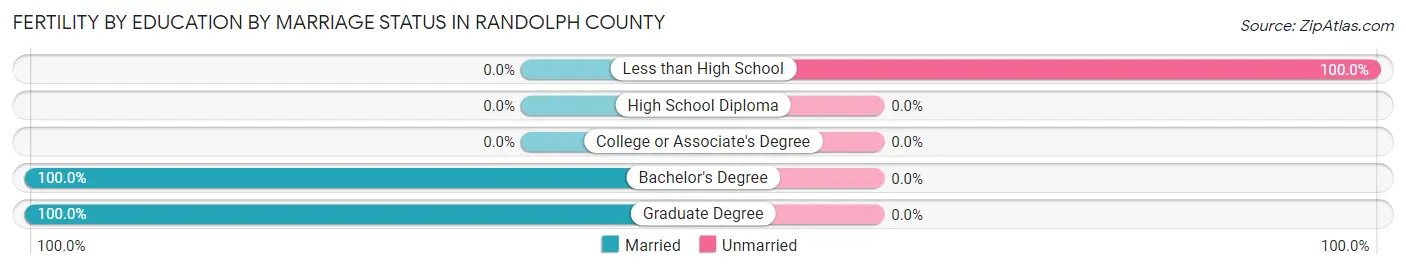
| Educational Attainment | Married | Unmarried |
| Less than High School | 0 (0.0%) | 40 (100.0%) |
| High School Diploma | 0 (0.0%) | 0 (0.0%) |
| College or Associate's Degree | 0 (0.0%) | 0 (0.0%) |
| Bachelor's Degree | 6 (100.0%) | 0 (0.0%) |
| Graduate Degree | 7 (100.0%) | 0 (0.0%) |
| Total | 13 (24.5%) | 40 (75.5%) |
Employment Characteristics in Randolph County
Employment by Class of Employer in Randolph County
Among the 2,390 employed individuals in Randolph County, private company employees (1,522 | 63.7%), local government employees (364 | 15.2%), and self-employed (not incorporated) (179 | 7.5%) make up the most common classes of employment.
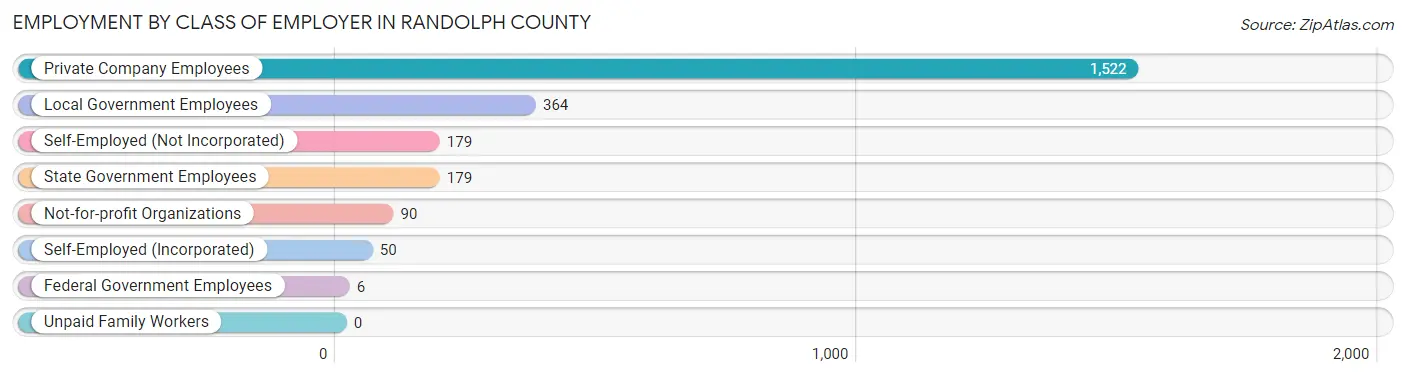
| Employer Class | # Employees | % Employees |
| Private Company Employees | 1,522 | 63.7% |
| Self-Employed (Incorporated) | 50 | 2.1% |
| Self-Employed (Not Incorporated) | 179 | 7.5% |
| Not-for-profit Organizations | 90 | 3.8% |
| Local Government Employees | 364 | 15.2% |
| State Government Employees | 179 | 7.5% |
| Federal Government Employees | 6 | 0.3% |
| Unpaid Family Workers | 0 | 0.0% |
| Total | 2,390 | 100.0% |
Employment Status by Age in Randolph County
According to the labor force statistics for Randolph County, out of the total population over 16 years of age (4,885), 54.3% or 2,653 individuals are in the labor force, with 7.5% or 199 of them unemployed. The age group with the highest labor force participation rate is 30 to 34 years, with 96.7% or 295 individuals in the labor force. Within the labor force, the 20 to 24 years age range has the highest percentage of unemployed individuals, with 36.6% or 71 of them being unemployed.
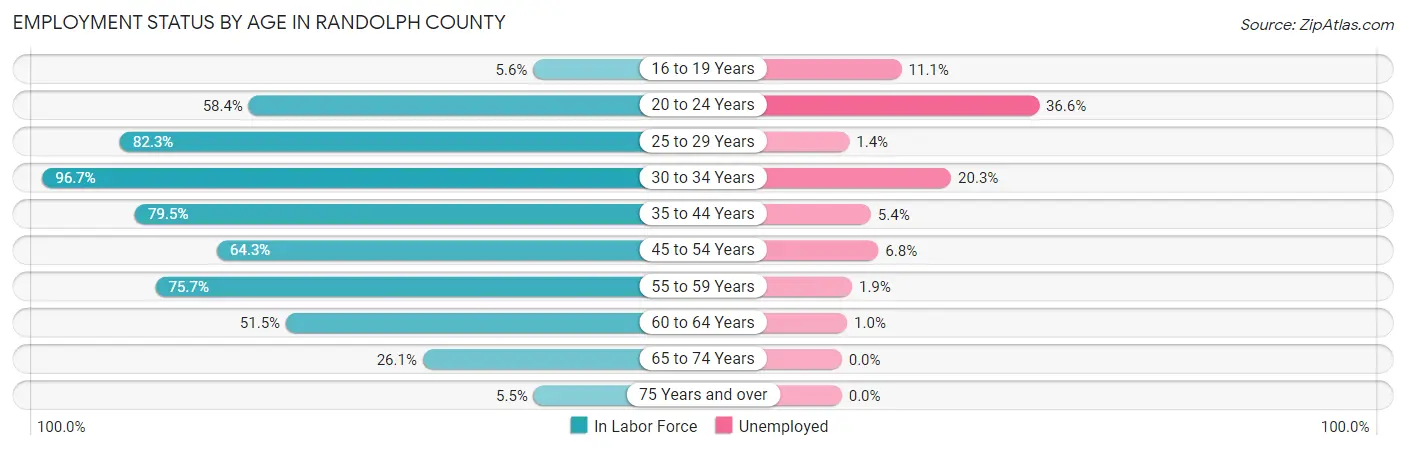
| Age Bracket | In Labor Force | Unemployed |
| 16 to 19 Years | 18 (5.6%) | 2 (11.1%) |
| 20 to 24 Years | 194 (58.4%) | 71 (36.6%) |
| 25 to 29 Years | 428 (82.3%) | 6 (1.4%) |
| 30 to 34 Years | 295 (96.7%) | 60 (20.3%) |
| 35 to 44 Years | 598 (79.5%) | 32 (5.4%) |
| 45 to 54 Years | 266 (64.3%) | 18 (6.8%) |
| 55 to 59 Years | 421 (75.7%) | 8 (1.9%) |
| 60 to 64 Years | 205 (51.5%) | 2 (1.0%) |
| 65 to 74 Years | 197 (26.1%) | 0 (0.0%) |
| 75 Years and over | 29 (5.5%) | 0 (0.0%) |
| Total | 2,653 (54.3%) | 199 (7.5%) |
Employment Status by Educational Attainment in Randolph County
According to labor force statistics for Randolph County, 75.1% of individuals (2,212) out of the total population between 25 and 64 years of age (2,945) are in the labor force, with 5.7% or 126 of them being unemployed. The group with the highest labor force participation rate are those with the educational attainment of bachelor's degree or higher, with 92.9% or 381 individuals in the labor force. Within the labor force, individuals with high school diploma education have the highest percentage of unemployment, with 10.2% or 64 of them being unemployed.
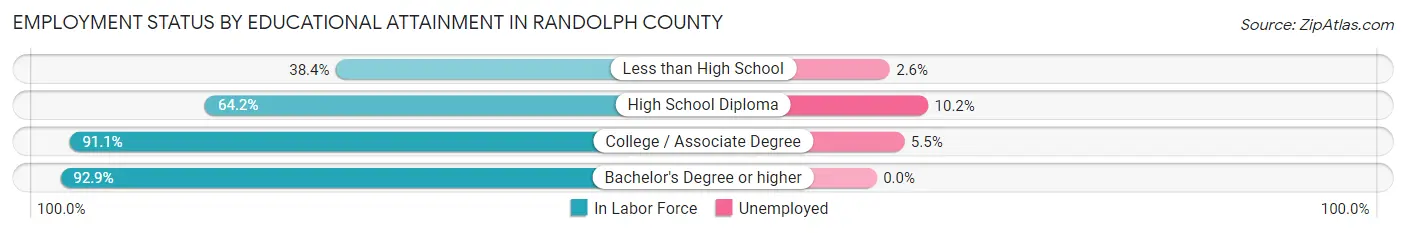
| Educational Attainment | In Labor Force | Unemployed |
| Less than High School | 156 (38.4%) | 11 (2.6%) |
| High School Diploma | 630 (64.2%) | 100 (10.2%) |
| College / Associate Degree | 1,046 (91.1%) | 63 (5.5%) |
| Bachelor's Degree or higher | 381 (92.9%) | 0 (0.0%) |
| Total | 2,212 (75.1%) | 168 (5.7%) |
Employment Occupations by Sex in Randolph County
Management, Business, Science and Arts Occupations
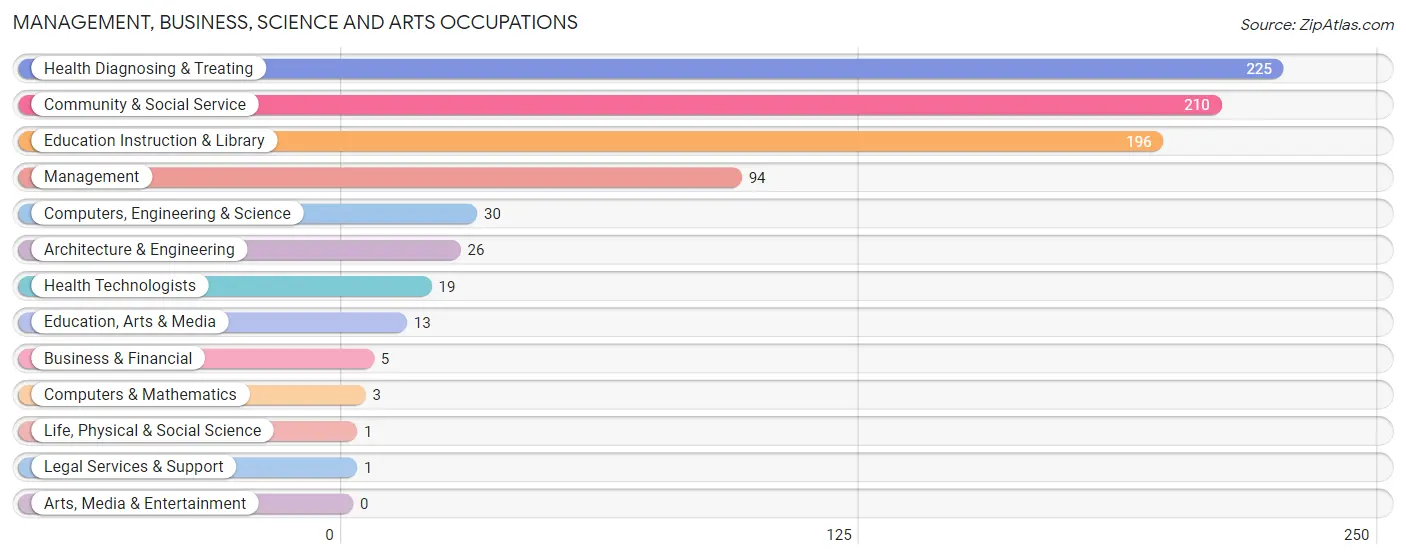
The most common Management, Business, Science and Arts occupations in Randolph County are Health Diagnosing & Treating (225 | 9.2%), Community & Social Service (210 | 8.6%), Education Instruction & Library (196 | 8.0%), Management (94 | 3.8%), and Computers, Engineering & Science (30 | 1.2%).
Management, Business, Science and Arts Occupations by Sex
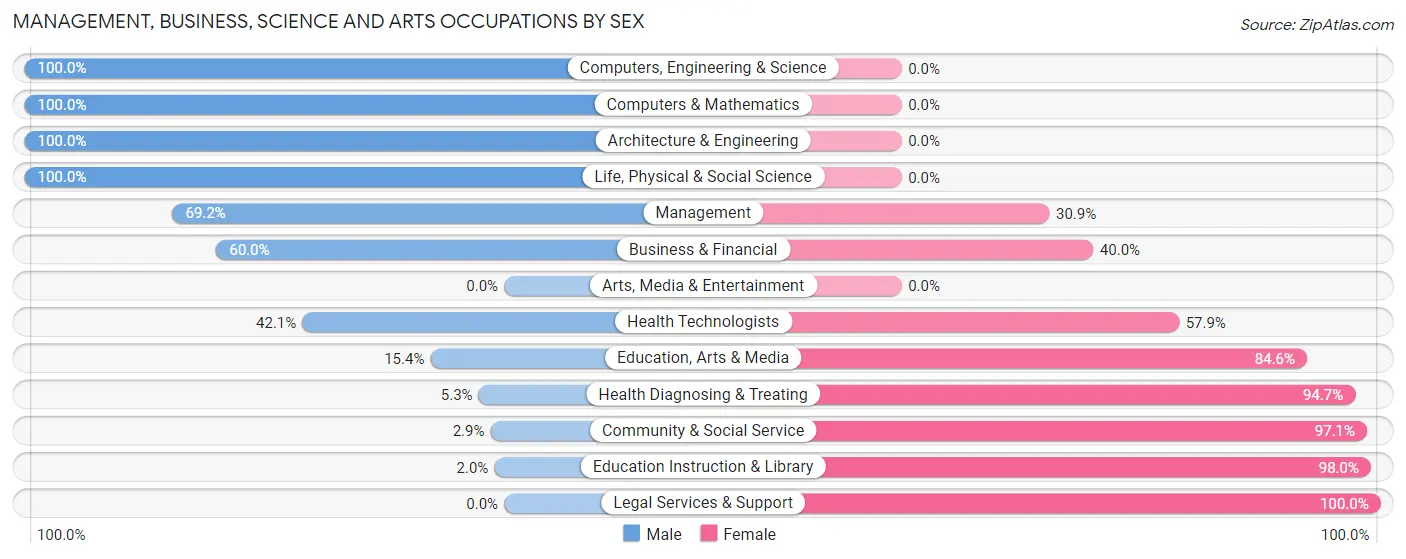
Within the Management, Business, Science and Arts occupations in Randolph County, the most male-oriented occupations are Computers, Engineering & Science (100.0%), Computers & Mathematics (100.0%), and Architecture & Engineering (100.0%), while the most female-oriented occupations are Legal Services & Support (100.0%), Education Instruction & Library (98.0%), and Community & Social Service (97.1%).
| Occupation | Male | Female |
| Management | 65 (69.2%) | 29 (30.8%) |
| Business & Financial | 3 (60.0%) | 2 (40.0%) |
| Computers, Engineering & Science | 30 (100.0%) | 0 (0.0%) |
| Computers & Mathematics | 3 (100.0%) | 0 (0.0%) |
| Architecture & Engineering | 26 (100.0%) | 0 (0.0%) |
| Life, Physical & Social Science | 1 (100.0%) | 0 (0.0%) |
| Community & Social Service | 6 (2.9%) | 204 (97.1%) |
| Education, Arts & Media | 2 (15.4%) | 11 (84.6%) |
| Legal Services & Support | 0 (0.0%) | 1 (100.0%) |
| Education Instruction & Library | 4 (2.0%) | 192 (98.0%) |
| Arts, Media & Entertainment | 0 (0.0%) | 0 (0.0%) |
| Health Diagnosing & Treating | 12 (5.3%) | 213 (94.7%) |
| Health Technologists | 8 (42.1%) | 11 (57.9%) |
| Total (Category) | 116 (20.6%) | 448 (79.4%) |
| Total (Overall) | 1,035 (42.2%) | 1,417 (57.8%) |
Services Occupations
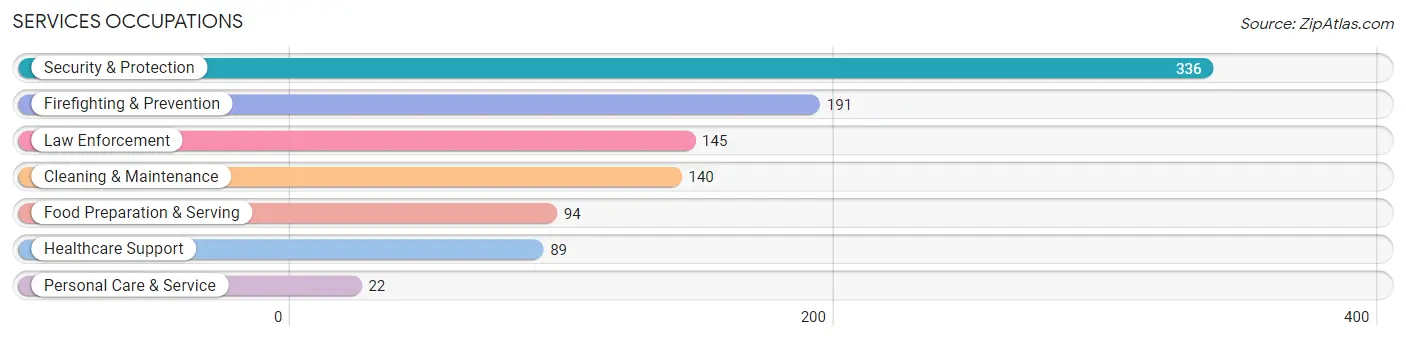
The most common Services occupations in Randolph County are Security & Protection (336 | 13.7%), Firefighting & Prevention (191 | 7.8%), Law Enforcement (145 | 5.9%), Cleaning & Maintenance (140 | 5.7%), and Food Preparation & Serving (94 | 3.8%).
Services Occupations by Sex
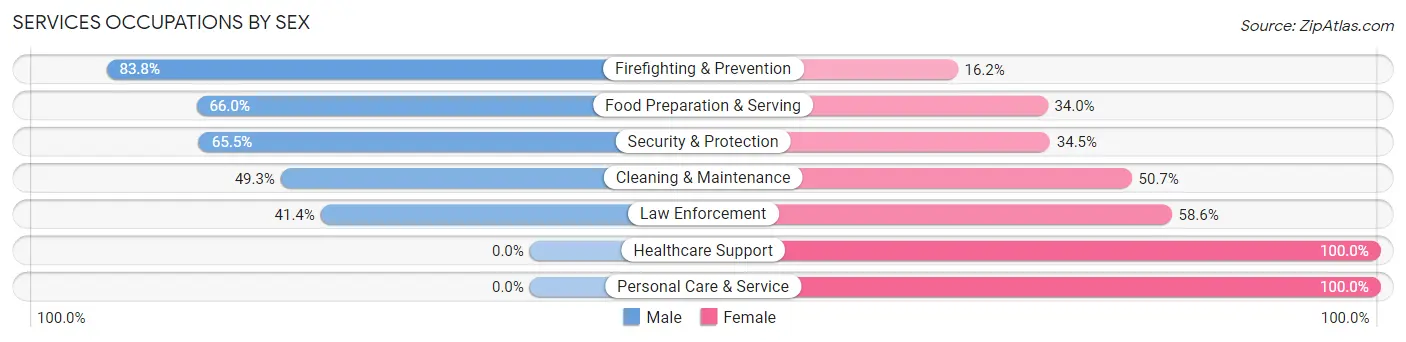
Within the Services occupations in Randolph County, the most male-oriented occupations are Firefighting & Prevention (83.8%), Food Preparation & Serving (66.0%), and Security & Protection (65.5%), while the most female-oriented occupations are Healthcare Support (100.0%), Personal Care & Service (100.0%), and Law Enforcement (58.6%).
| Occupation | Male | Female |
| Healthcare Support | 0 (0.0%) | 89 (100.0%) |
| Security & Protection | 220 (65.5%) | 116 (34.5%) |
| Firefighting & Prevention | 160 (83.8%) | 31 (16.2%) |
| Law Enforcement | 60 (41.4%) | 85 (58.6%) |
| Food Preparation & Serving | 62 (66.0%) | 32 (34.0%) |
| Cleaning & Maintenance | 69 (49.3%) | 71 (50.7%) |
| Personal Care & Service | 0 (0.0%) | 22 (100.0%) |
| Total (Category) | 351 (51.5%) | 330 (48.5%) |
| Total (Overall) | 1,035 (42.2%) | 1,417 (57.8%) |
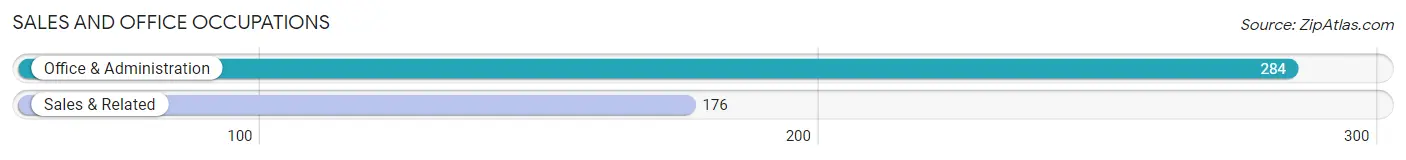
Sales and Office Occupations
The most common Sales and Office occupations in Randolph County are Office & Administration (284 | 11.6%), and Sales & Related (176 | 7.2%).
Sales and Office Occupations by Sex
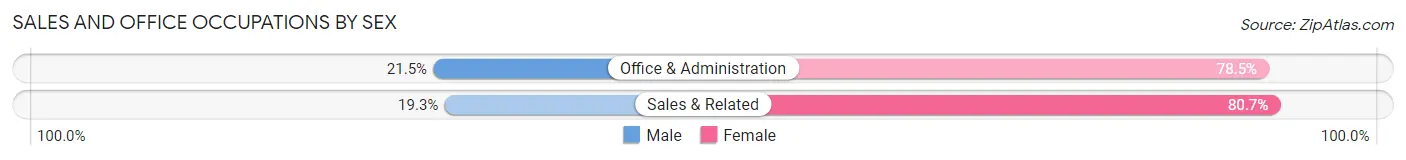
| Occupation | Male | Female |
| Sales & Related | 34 (19.3%) | 142 (80.7%) |
| Office & Administration | 61 (21.5%) | 223 (78.5%) |
| Total (Category) | 95 (20.6%) | 365 (79.3%) |
| Total (Overall) | 1,035 (42.2%) | 1,417 (57.8%) |
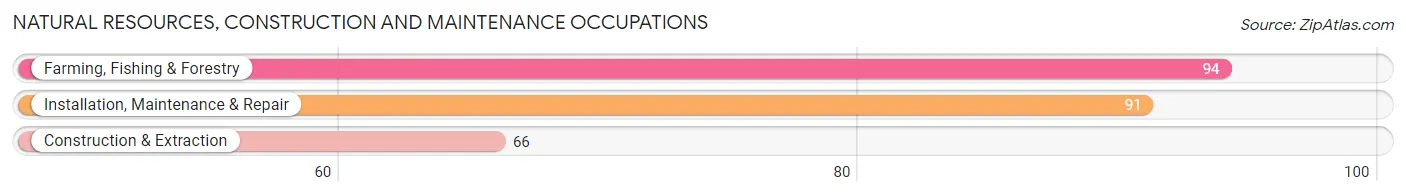
Natural Resources, Construction and Maintenance Occupations
The most common Natural Resources, Construction and Maintenance occupations in Randolph County are Farming, Fishing & Forestry (94 | 3.8%), Installation, Maintenance & Repair (91 | 3.7%), and Construction & Extraction (66 | 2.7%).
Natural Resources, Construction and Maintenance Occupations by Sex
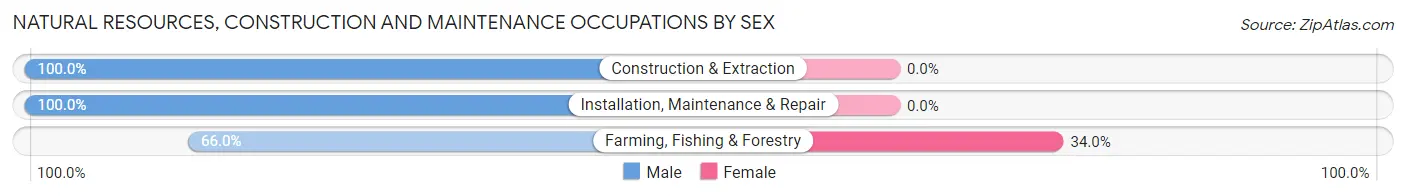
| Occupation | Male | Female |
| Farming, Fishing & Forestry | 62 (66.0%) | 32 (34.0%) |
| Construction & Extraction | 66 (100.0%) | 0 (0.0%) |
| Installation, Maintenance & Repair | 91 (100.0%) | 0 (0.0%) |
| Total (Category) | 219 (87.3%) | 32 (12.8%) |
| Total (Overall) | 1,035 (42.2%) | 1,417 (57.8%) |
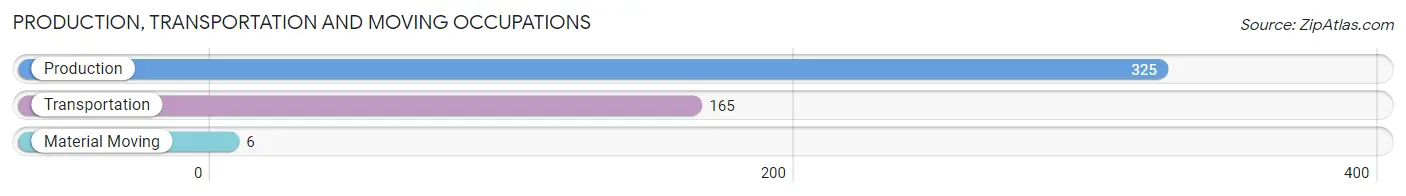
Production, Transportation and Moving Occupations
The most common Production, Transportation and Moving occupations in Randolph County are Production (325 | 13.3%), Transportation (165 | 6.7%), and Material Moving (6 | 0.2%).
Production, Transportation and Moving Occupations by Sex
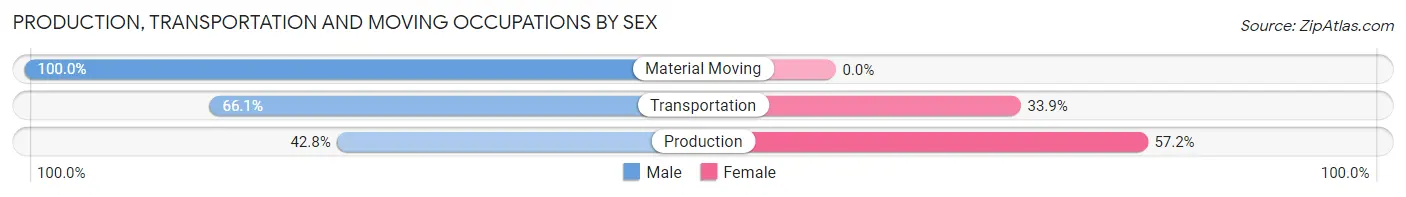
| Occupation | Male | Female |
| Production | 139 (42.8%) | 186 (57.2%) |
| Transportation | 109 (66.1%) | 56 (33.9%) |
| Material Moving | 6 (100.0%) | 0 (0.0%) |
| Total (Category) | 254 (51.2%) | 242 (48.8%) |
| Total (Overall) | 1,035 (42.2%) | 1,417 (57.8%) |
Employment Industries by Sex in Randolph County
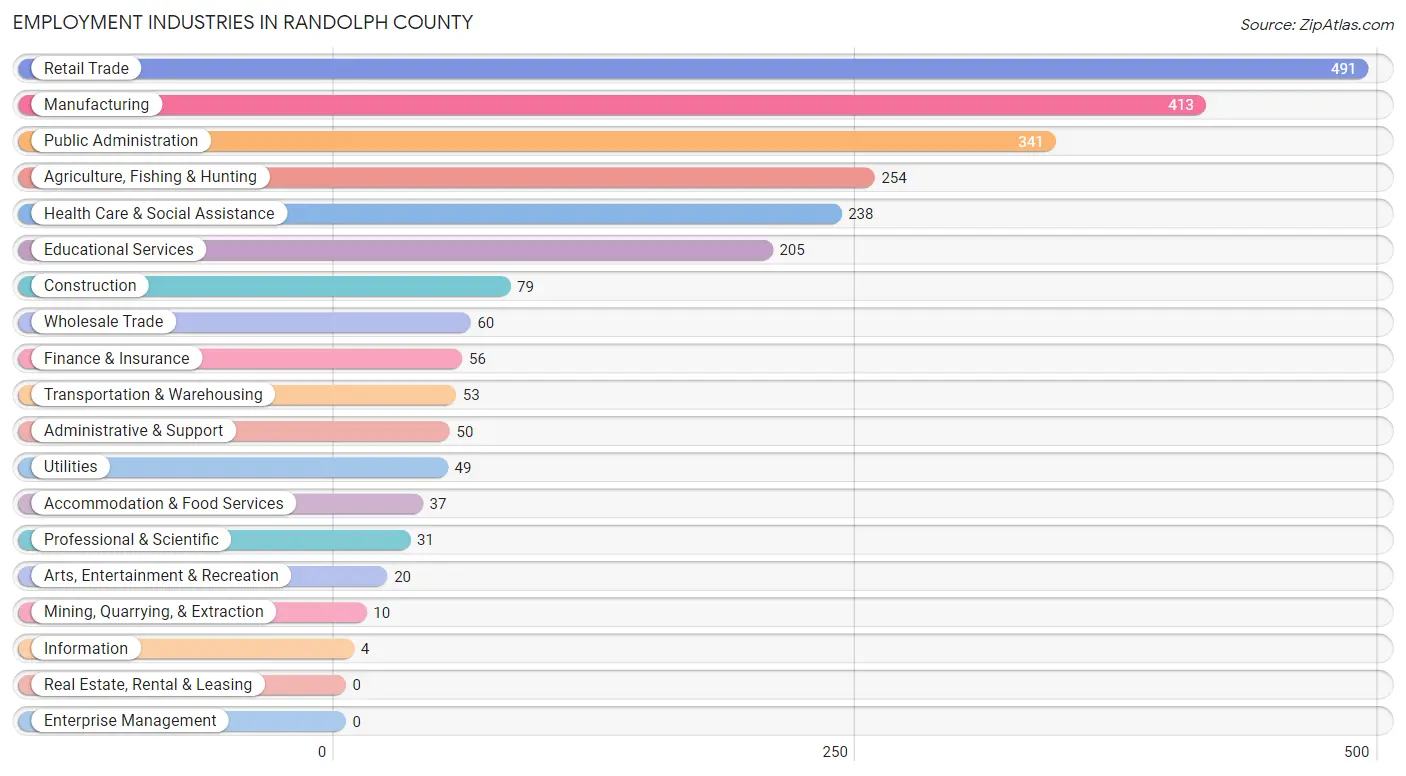
Employment Industries in Randolph County
The major employment industries in Randolph County include Retail Trade (491 | 20.0%), Manufacturing (413 | 16.8%), Public Administration (341 | 13.9%), Agriculture, Fishing & Hunting (254 | 10.4%), and Health Care & Social Assistance (238 | 9.7%).
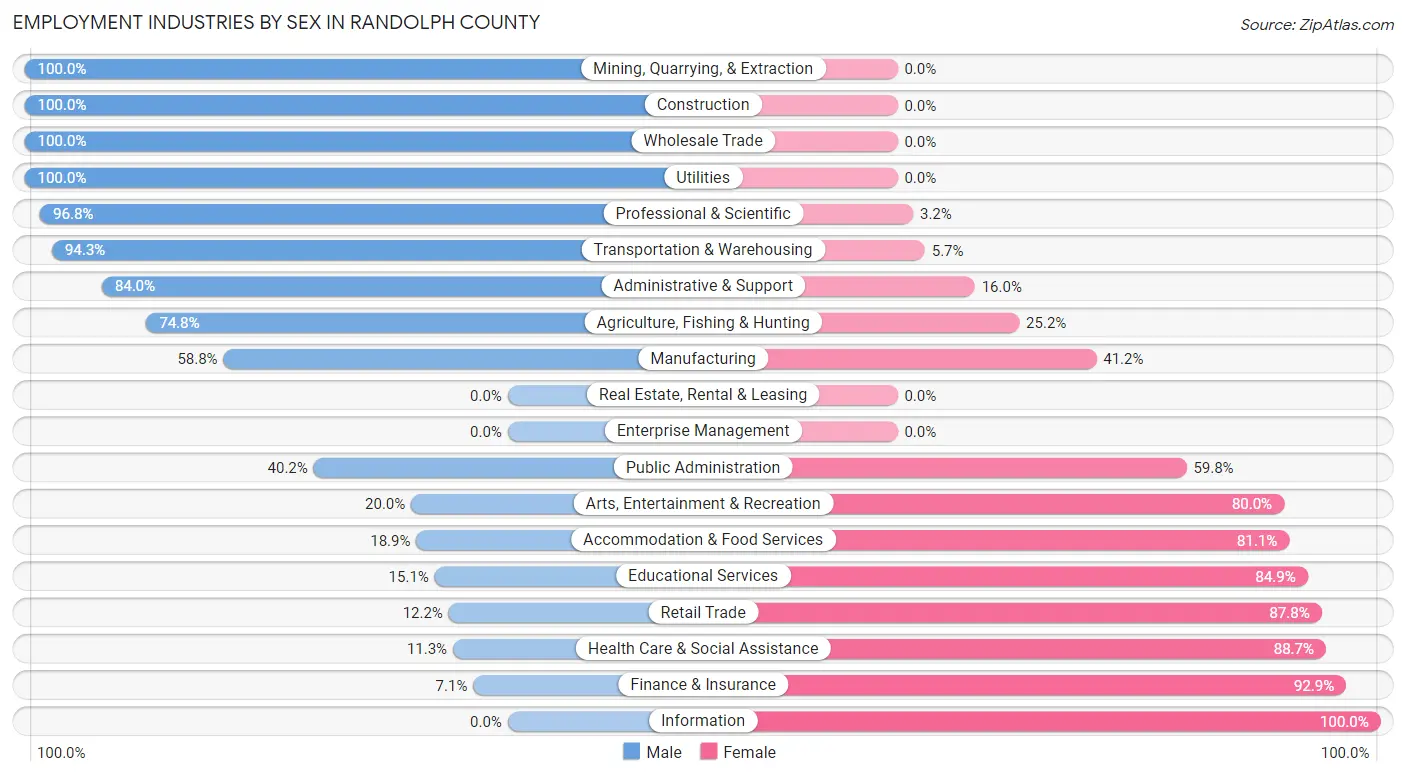
Employment Industries by Sex in Randolph County
The Randolph County industries that see more men than women are Mining, Quarrying, & Extraction (100.0%), Construction (100.0%), and Wholesale Trade (100.0%), whereas the industries that tend to have a higher number of women are Information (100.0%), Finance & Insurance (92.9%), and Health Care & Social Assistance (88.7%).
| Industry | Male | Female |
| Agriculture, Fishing & Hunting | 190 (74.8%) | 64 (25.2%) |
| Mining, Quarrying, & Extraction | 10 (100.0%) | 0 (0.0%) |
| Construction | 79 (100.0%) | 0 (0.0%) |
| Manufacturing | 243 (58.8%) | 170 (41.2%) |
| Wholesale Trade | 60 (100.0%) | 0 (0.0%) |
| Retail Trade | 60 (12.2%) | 431 (87.8%) |
| Transportation & Warehousing | 50 (94.3%) | 3 (5.7%) |
| Utilities | 49 (100.0%) | 0 (0.0%) |
| Information | 0 (0.0%) | 4 (100.0%) |
| Finance & Insurance | 4 (7.1%) | 52 (92.9%) |
| Real Estate, Rental & Leasing | 0 (0.0%) | 0 (0.0%) |
| Professional & Scientific | 30 (96.8%) | 1 (3.2%) |
| Enterprise Management | 0 (0.0%) | 0 (0.0%) |
| Administrative & Support | 42 (84.0%) | 8 (16.0%) |
| Educational Services | 31 (15.1%) | 174 (84.9%) |
| Health Care & Social Assistance | 27 (11.3%) | 211 (88.7%) |
| Arts, Entertainment & Recreation | 4 (20.0%) | 16 (80.0%) |
| Accommodation & Food Services | 7 (18.9%) | 30 (81.1%) |
| Public Administration | 137 (40.2%) | 204 (59.8%) |
| Total | 1,035 (42.2%) | 1,417 (57.8%) |
Education in Randolph County
School Enrollment in Randolph County
The most common levels of schooling among the 1,850 students in Randolph County are elementary school (443 | 23.9%), high school (399 | 21.6%), and college / undergraduate (358 | 19.4%).
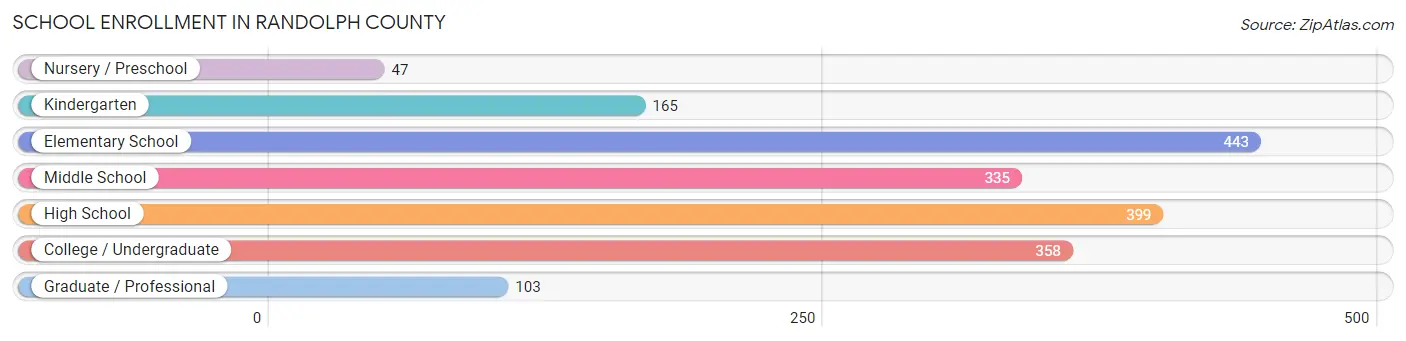
| School Level | # Students | % Students |
| Nursery / Preschool | 47 | 2.5% |
| Kindergarten | 165 | 8.9% |
| Elementary School | 443 | 23.9% |
| Middle School | 335 | 18.1% |
| High School | 399 | 21.6% |
| College / Undergraduate | 358 | 19.4% |
| Graduate / Professional | 103 | 5.6% |
| Total | 1,850 | 100.0% |
School Enrollment by Age by Funding Source in Randolph County
Out of a total of 1,850 students who are enrolled in schools in Randolph County, 133 (7.2%) attend a private institution, while the remaining 1,717 (92.8%) are enrolled in public schools. The age group of 35 years and over has the highest likelihood of being enrolled in private schools, with 35 (28.2% in the age bracket) enrolled. Conversely, the age group of 10 to 14 year olds has the lowest likelihood of being enrolled in a private school, with 378 (99.0% in the age bracket) attending a public institution.
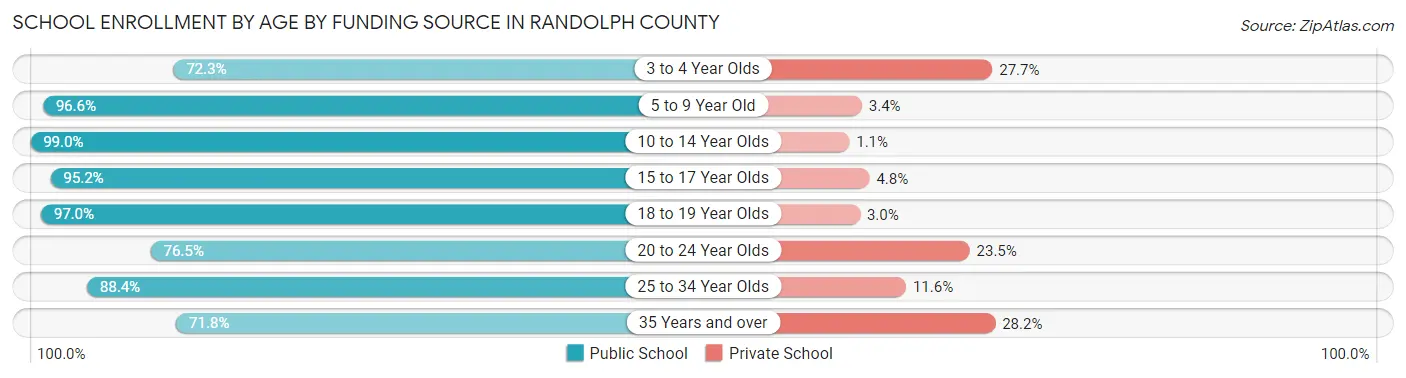
| Age Bracket | Public School | Private School |
| 3 to 4 Year Olds | 47 (72.3%) | 18 (27.7%) |
| 5 to 9 Year Old | 515 (96.6%) | 18 (3.4%) |
| 10 to 14 Year Olds | 378 (99.0%) | 4 (1.1%) |
| 15 to 17 Year Olds | 297 (95.2%) | 15 (4.8%) |
| 18 to 19 Year Olds | 192 (97.0%) | 6 (3.0%) |
| 20 to 24 Year Olds | 62 (76.5%) | 19 (23.5%) |
| 25 to 34 Year Olds | 137 (88.4%) | 18 (11.6%) |
| 35 Years and over | 89 (71.8%) | 35 (28.2%) |
| Total | 1,717 (92.8%) | 133 (7.2%) |
Educational Attainment by Field of Study in Randolph County
Science & technology (104 | 18.4%), business (97 | 17.2%), psychology (80 | 14.2%), arts & humanities (79 | 14.0%), and social sciences (56 | 9.9%) are the most common fields of study among 564 individuals in Randolph County who have obtained a bachelor's degree or higher.
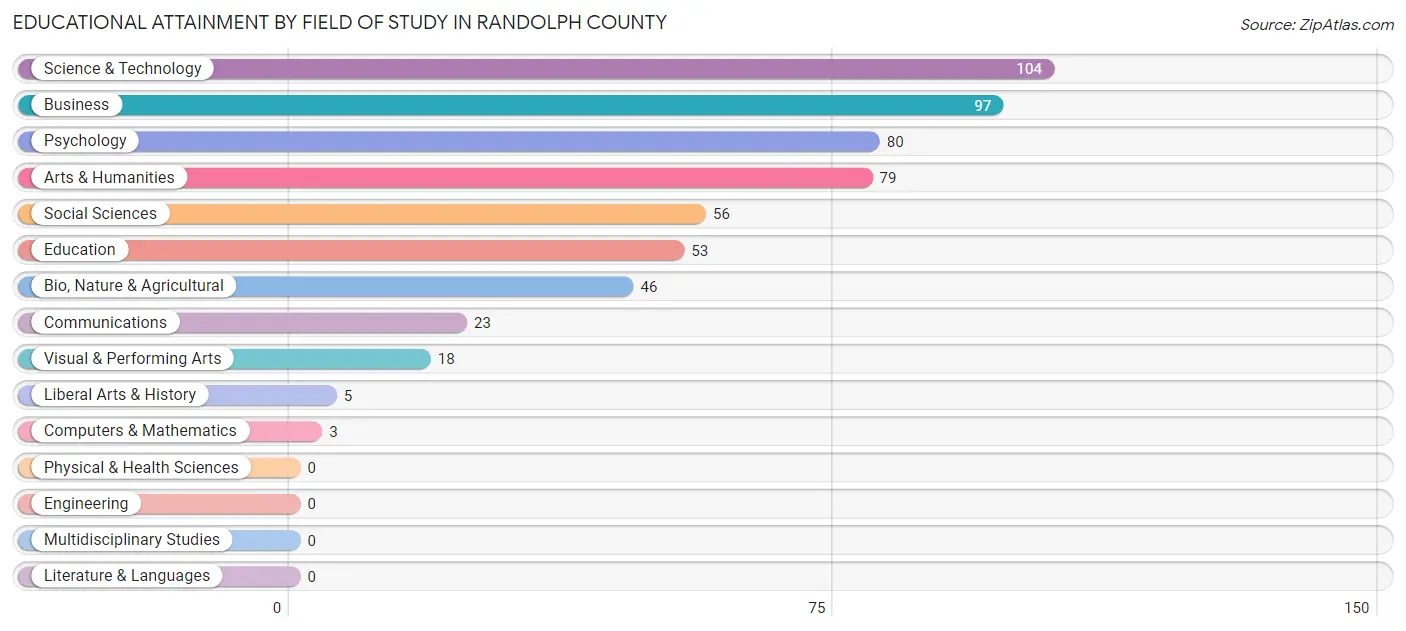
| Field of Study | # Graduates | % Graduates |
| Computers & Mathematics | 3 | 0.5% |
| Bio, Nature & Agricultural | 46 | 8.2% |
| Physical & Health Sciences | 0 | 0.0% |
| Psychology | 80 | 14.2% |
| Social Sciences | 56 | 9.9% |
| Engineering | 0 | 0.0% |
| Multidisciplinary Studies | 0 | 0.0% |
| Science & Technology | 104 | 18.4% |
| Business | 97 | 17.2% |
| Education | 53 | 9.4% |
| Literature & Languages | 0 | 0.0% |
| Liberal Arts & History | 5 | 0.9% |
| Visual & Performing Arts | 18 | 3.2% |
| Communications | 23 | 4.1% |
| Arts & Humanities | 79 | 14.0% |
| Total | 564 | 100.0% |
Transportation & Commute in Randolph County
Vehicle Availability by Sex in Randolph County
The most prevalent vehicle ownership categories in Randolph County are males with 2 vehicles (351, accounting for 35.6%) and females with 2 vehicles (516, making up 25.2%).
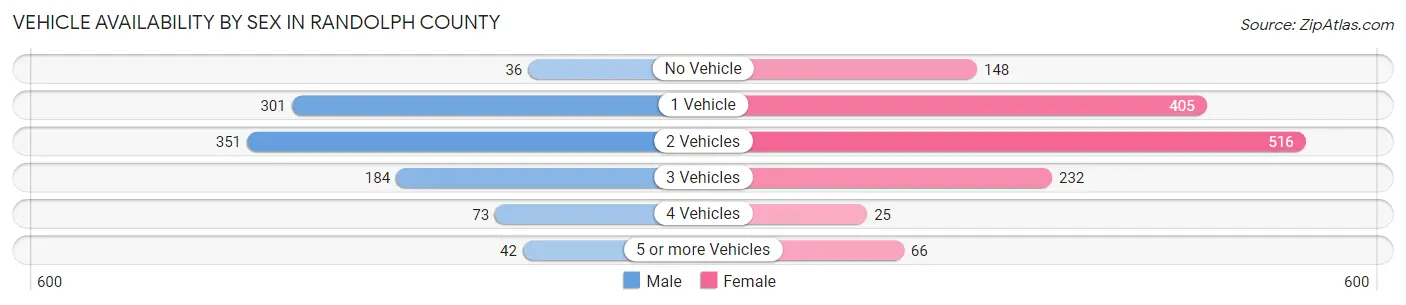
| Vehicles Available | Male | Female |
| No Vehicle | 36 (3.6%) | 148 (10.6%) |
| 1 Vehicle | 301 (30.5%) | 405 (29.1%) |
| 2 Vehicles | 351 (35.6%) | 516 (37.1%) |
| 3 Vehicles | 184 (18.6%) | 232 (16.7%) |
| 4 Vehicles | 73 (7.4%) | 25 (1.8%) |
| 5 or more Vehicles | 42 (4.3%) | 66 (4.7%) |
| Total | 987 (100.0%) | 1,392 (100.0%) |
Commute Time in Randolph County
The most frequently occuring commute durations in Randolph County are 5 to 9 minutes (445 commuters, 19.3%), 10 to 14 minutes (349 commuters, 15.1%), and 30 to 34 minutes (271 commuters, 11.7%).
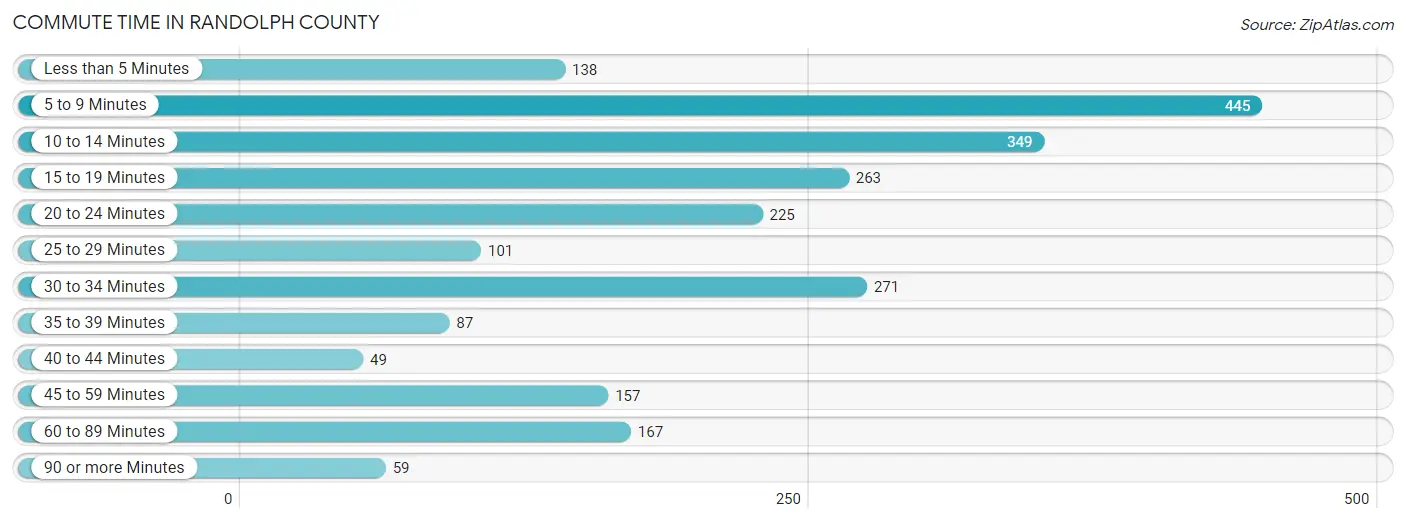
| Commute Time | # Commuters | % Commuters |
| Less than 5 Minutes | 138 | 6.0% |
| 5 to 9 Minutes | 445 | 19.3% |
| 10 to 14 Minutes | 349 | 15.1% |
| 15 to 19 Minutes | 263 | 11.4% |
| 20 to 24 Minutes | 225 | 9.7% |
| 25 to 29 Minutes | 101 | 4.4% |
| 30 to 34 Minutes | 271 | 11.7% |
| 35 to 39 Minutes | 87 | 3.8% |
| 40 to 44 Minutes | 49 | 2.1% |
| 45 to 59 Minutes | 157 | 6.8% |
| 60 to 89 Minutes | 167 | 7.2% |
| 90 or more Minutes | 59 | 2.5% |
Commute Time by Sex in Randolph County
The most common commute times in Randolph County are 10 to 14 minutes (182 commuters, 19.6%) for males and 5 to 9 minutes (310 commuters, 22.4%) for females.
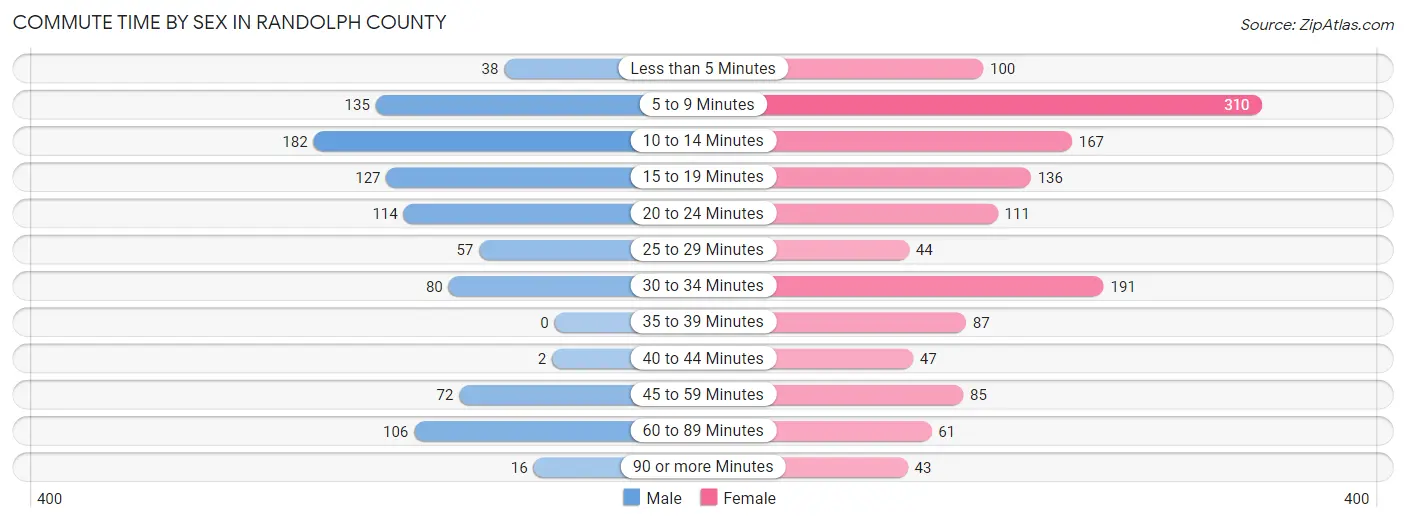
| Commute Time | Male | Female |
| Less than 5 Minutes | 38 (4.1%) | 100 (7.2%) |
| 5 to 9 Minutes | 135 (14.5%) | 310 (22.4%) |
| 10 to 14 Minutes | 182 (19.6%) | 167 (12.1%) |
| 15 to 19 Minutes | 127 (13.7%) | 136 (9.8%) |
| 20 to 24 Minutes | 114 (12.3%) | 111 (8.0%) |
| 25 to 29 Minutes | 57 (6.1%) | 44 (3.2%) |
| 30 to 34 Minutes | 80 (8.6%) | 191 (13.8%) |
| 35 to 39 Minutes | 0 (0.0%) | 87 (6.3%) |
| 40 to 44 Minutes | 2 (0.2%) | 47 (3.4%) |
| 45 to 59 Minutes | 72 (7.7%) | 85 (6.1%) |
| 60 to 89 Minutes | 106 (11.4%) | 61 (4.4%) |
| 90 or more Minutes | 16 (1.7%) | 43 (3.1%) |
Time of Departure to Work by Sex in Randolph County
The most frequent times of departure to work in Randolph County are 7:00 AM to 7:29 AM (210, 22.6%) for males and 10:00 AM to 10:59 AM (191, 13.8%) for females.
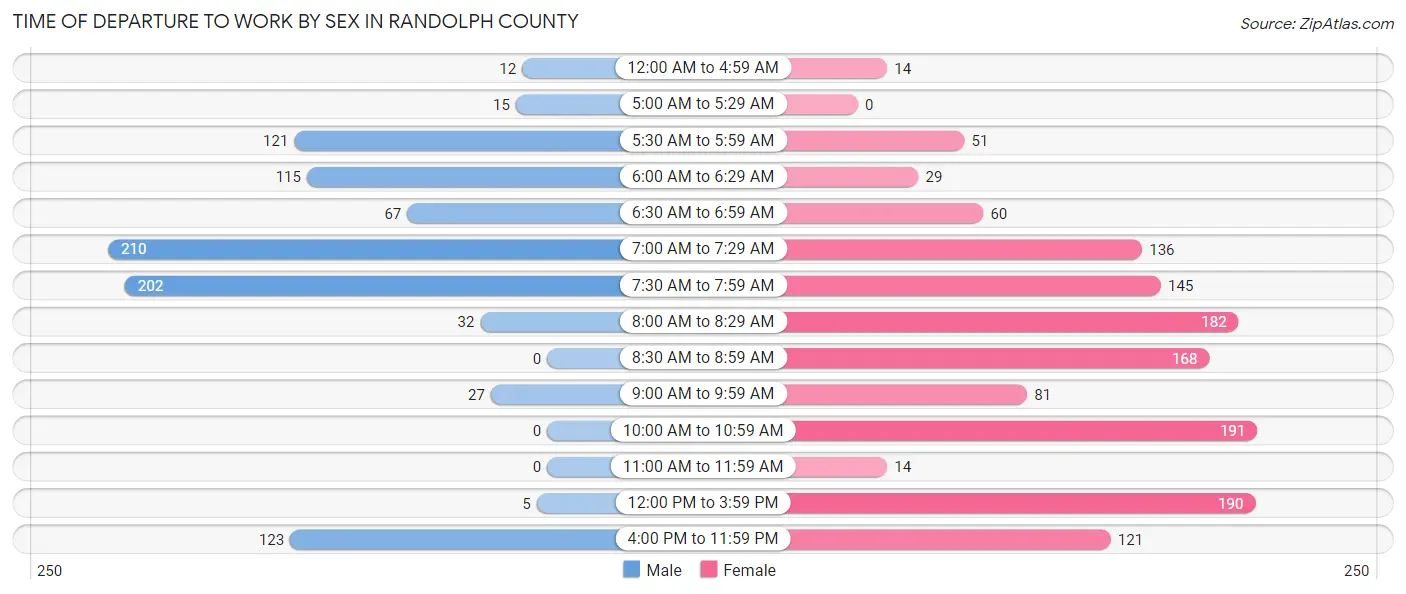
| Time of Departure | Male | Female |
| 12:00 AM to 4:59 AM | 12 (1.3%) | 14 (1.0%) |
| 5:00 AM to 5:29 AM | 15 (1.6%) | 0 (0.0%) |
| 5:30 AM to 5:59 AM | 121 (13.0%) | 51 (3.7%) |
| 6:00 AM to 6:29 AM | 115 (12.4%) | 29 (2.1%) |
| 6:30 AM to 6:59 AM | 67 (7.2%) | 60 (4.3%) |
| 7:00 AM to 7:29 AM | 210 (22.6%) | 136 (9.8%) |
| 7:30 AM to 7:59 AM | 202 (21.7%) | 145 (10.5%) |
| 8:00 AM to 8:29 AM | 32 (3.4%) | 182 (13.2%) |
| 8:30 AM to 8:59 AM | 0 (0.0%) | 168 (12.2%) |
| 9:00 AM to 9:59 AM | 27 (2.9%) | 81 (5.9%) |
| 10:00 AM to 10:59 AM | 0 (0.0%) | 191 (13.8%) |
| 11:00 AM to 11:59 AM | 0 (0.0%) | 14 (1.0%) |
| 12:00 PM to 3:59 PM | 5 (0.5%) | 190 (13.8%) |
| 4:00 PM to 11:59 PM | 123 (13.2%) | 121 (8.8%) |
| Total | 929 (100.0%) | 1,382 (100.0%) |
Housing Occupancy in Randolph County
Occupancy by Ownership in Randolph County
Of the total 2,553 dwellings in Randolph County, owner-occupied units account for 1,228 (48.1%), while renter-occupied units make up 1,325 (51.9%).
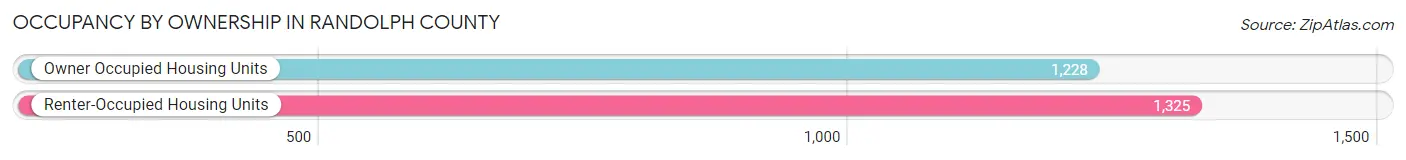
| Occupancy | # Housing Units | % Housing Units |
| Owner Occupied Housing Units | 1,228 | 48.1% |
| Renter-Occupied Housing Units | 1,325 | 51.9% |
| Total Occupied Housing Units | 2,553 | 100.0% |
Occupancy by Household Size in Randolph County
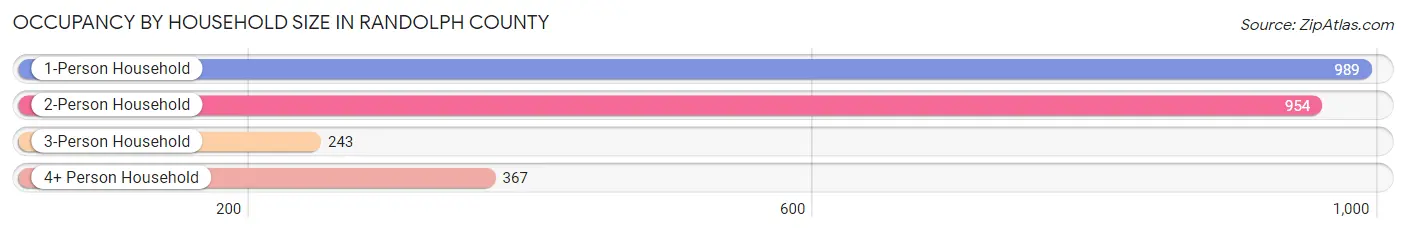
| Household Size | # Housing Units | % Housing Units |
| 1-Person Household | 989 | 38.7% |
| 2-Person Household | 954 | 37.4% |
| 3-Person Household | 243 | 9.5% |
| 4+ Person Household | 367 | 14.4% |
| Total Housing Units | 2,553 | 100.0% |
Occupancy by Ownership by Household Size in Randolph County
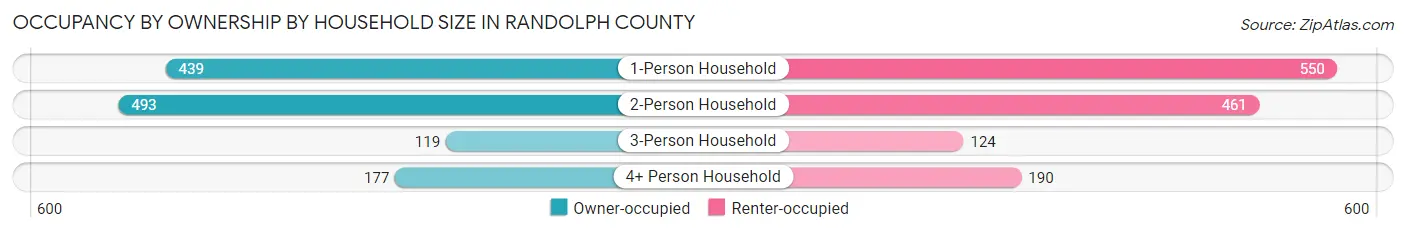
| Household Size | Owner-occupied | Renter-occupied |
| 1-Person Household | 439 (44.4%) | 550 (55.6%) |
| 2-Person Household | 493 (51.7%) | 461 (48.3%) |
| 3-Person Household | 119 (49.0%) | 124 (51.0%) |
| 4+ Person Household | 177 (48.2%) | 190 (51.8%) |
| Total Housing Units | 1,228 (48.1%) | 1,325 (51.9%) |
Occupancy by Educational Attainment in Randolph County
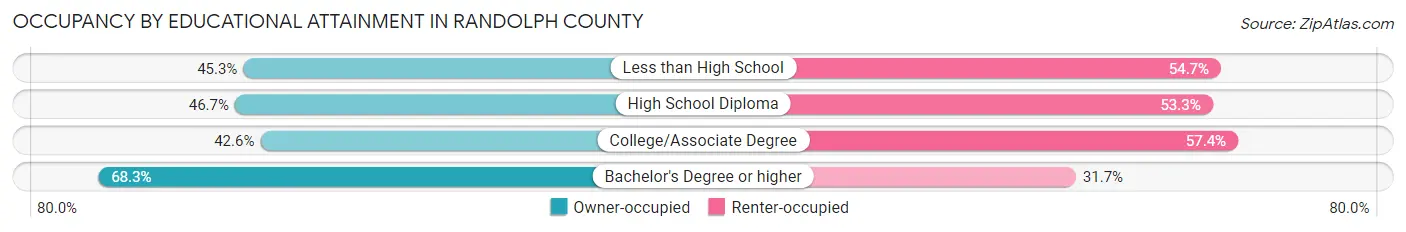
| Household Size | Owner-occupied | Renter-occupied |
| Less than High School | 223 (45.3%) | 269 (54.7%) |
| High School Diploma | 384 (46.7%) | 439 (53.3%) |
| College/Associate Degree | 373 (42.6%) | 502 (57.4%) |
| Bachelor's Degree or higher | 248 (68.3%) | 115 (31.7%) |
Occupancy by Age of Householder in Randolph County
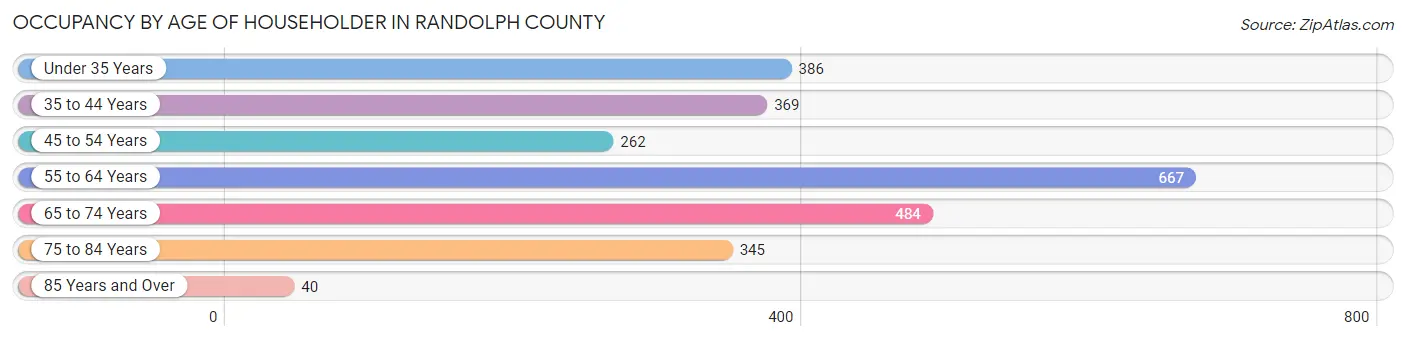
| Age Bracket | # Households | % Households |
| Under 35 Years | 386 | 15.1% |
| 35 to 44 Years | 369 | 14.4% |
| 45 to 54 Years | 262 | 10.3% |
| 55 to 64 Years | 667 | 26.1% |
| 65 to 74 Years | 484 | 19.0% |
| 75 to 84 Years | 345 | 13.5% |
| 85 Years and Over | 40 | 1.6% |
| Total | 2,553 | 100.0% |
Housing Finances in Randolph County
Median Income by Occupancy in Randolph County
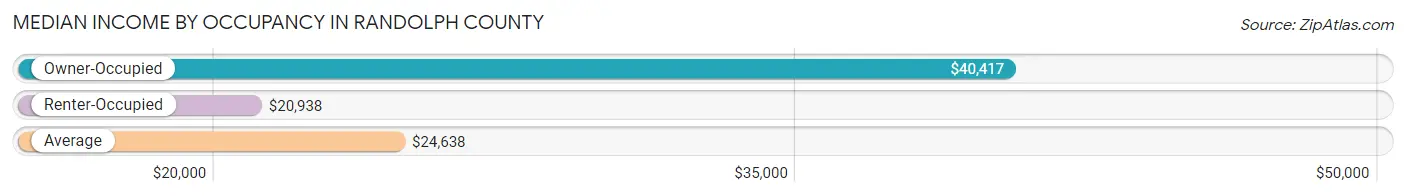
| Occupancy Type | # Households | Median Income |
| Owner-Occupied | 1,228 (48.1%) | $40,417 |
| Renter-Occupied | 1,325 (51.9%) | $20,938 |
| Average | 2,553 (100.0%) | $24,638 |
Occupancy by Householder Income Bracket in Randolph County
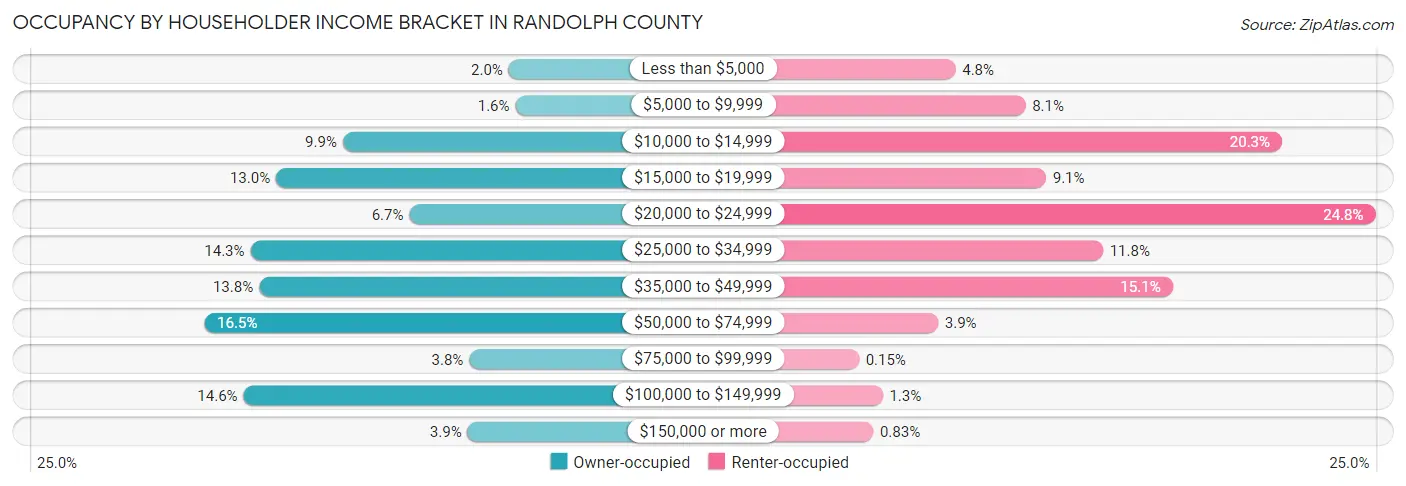
| Income Bracket | Owner-occupied | Renter-occupied |
| Less than $5,000 | 24 (1.9%) | 63 (4.8%) |
| $5,000 to $9,999 | 20 (1.6%) | 107 (8.1%) |
| $10,000 to $14,999 | 121 (9.9%) | 269 (20.3%) |
| $15,000 to $19,999 | 160 (13.0%) | 120 (9.1%) |
| $20,000 to $24,999 | 82 (6.7%) | 328 (24.7%) |
| $25,000 to $34,999 | 175 (14.2%) | 156 (11.8%) |
| $35,000 to $49,999 | 170 (13.8%) | 200 (15.1%) |
| $50,000 to $74,999 | 202 (16.5%) | 52 (3.9%) |
| $75,000 to $99,999 | 47 (3.8%) | 2 (0.2%) |
| $100,000 to $149,999 | 179 (14.6%) | 17 (1.3%) |
| $150,000 or more | 48 (3.9%) | 11 (0.8%) |
| Total | 1,228 (100.0%) | 1,325 (100.0%) |
Monthly Housing Cost Tiers in Randolph County
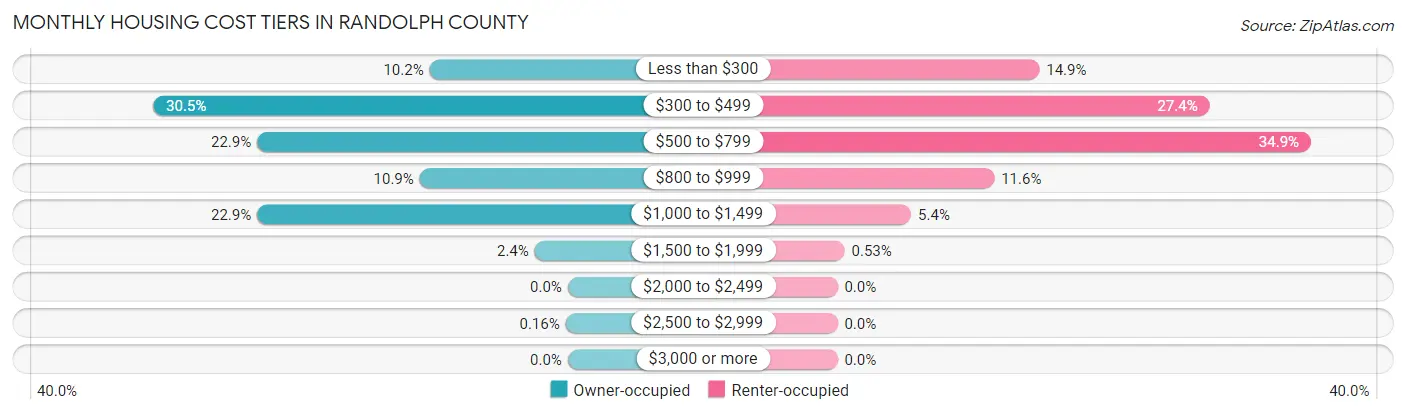
| Monthly Cost | Owner-occupied | Renter-occupied |
| Less than $300 | 125 (10.2%) | 197 (14.9%) |
| $300 to $499 | 375 (30.5%) | 363 (27.4%) |
| $500 to $799 | 281 (22.9%) | 462 (34.9%) |
| $800 to $999 | 134 (10.9%) | 153 (11.6%) |
| $1,000 to $1,499 | 281 (22.9%) | 72 (5.4%) |
| $1,500 to $1,999 | 30 (2.4%) | 7 (0.5%) |
| $2,000 to $2,499 | 0 (0.0%) | 0 (0.0%) |
| $2,500 to $2,999 | 2 (0.2%) | 0 (0.0%) |
| $3,000 or more | 0 (0.0%) | 0 (0.0%) |
| Total | 1,228 (100.0%) | 1,325 (100.0%) |
Physical Housing Characteristics in Randolph County
Housing Structures in Randolph County
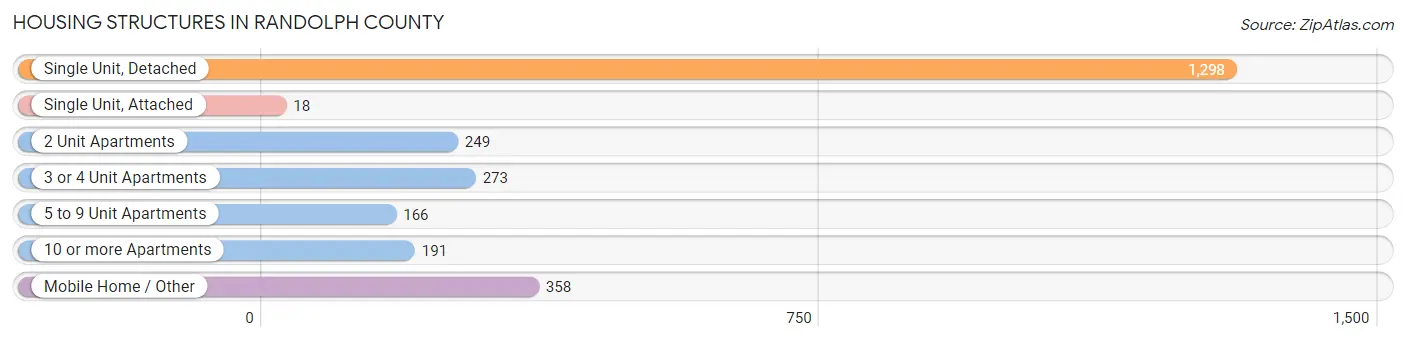
| Structure Type | # Housing Units | % Housing Units |
| Single Unit, Detached | 1,298 | 50.8% |
| Single Unit, Attached | 18 | 0.7% |
| 2 Unit Apartments | 249 | 9.8% |
| 3 or 4 Unit Apartments | 273 | 10.7% |
| 5 to 9 Unit Apartments | 166 | 6.5% |
| 10 or more Apartments | 191 | 7.5% |
| Mobile Home / Other | 358 | 14.0% |
| Total | 2,553 | 100.0% |
Housing Structures by Occupancy in Randolph County
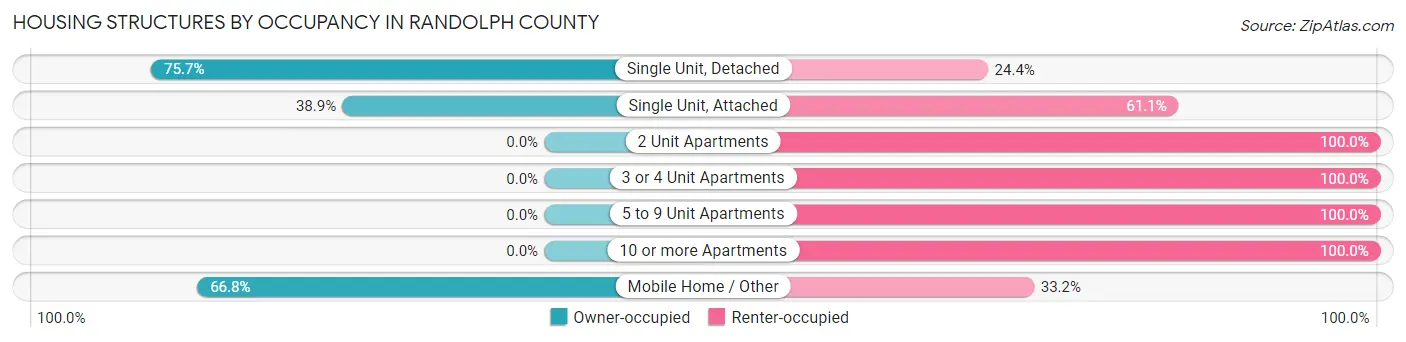
| Structure Type | Owner-occupied | Renter-occupied |
| Single Unit, Detached | 982 (75.6%) | 316 (24.3%) |
| Single Unit, Attached | 7 (38.9%) | 11 (61.1%) |
| 2 Unit Apartments | 0 (0.0%) | 249 (100.0%) |
| 3 or 4 Unit Apartments | 0 (0.0%) | 273 (100.0%) |
| 5 to 9 Unit Apartments | 0 (0.0%) | 166 (100.0%) |
| 10 or more Apartments | 0 (0.0%) | 191 (100.0%) |
| Mobile Home / Other | 239 (66.8%) | 119 (33.2%) |
| Total | 1,228 (48.1%) | 1,325 (51.9%) |
Housing Structures by Number of Rooms in Randolph County
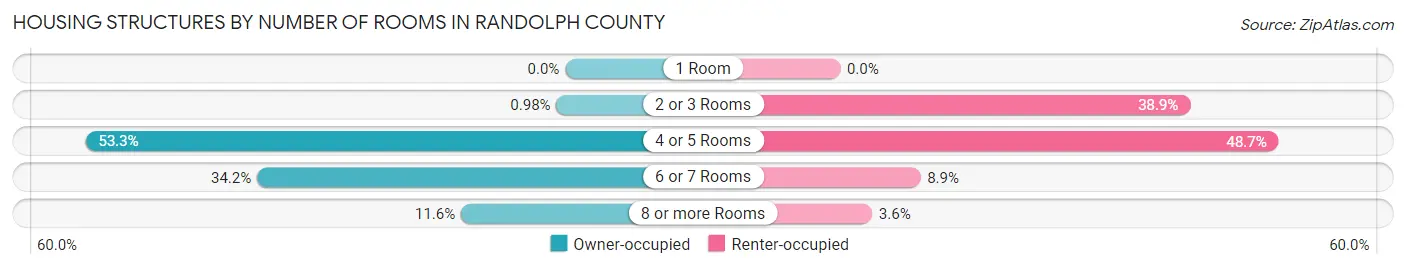
| Number of Rooms | Owner-occupied | Renter-occupied |
| 1 Room | 0 (0.0%) | 0 (0.0%) |
| 2 or 3 Rooms | 12 (1.0%) | 515 (38.9%) |
| 4 or 5 Rooms | 654 (53.3%) | 645 (48.7%) |
| 6 or 7 Rooms | 420 (34.2%) | 118 (8.9%) |
| 8 or more Rooms | 142 (11.6%) | 47 (3.5%) |
| Total | 1,228 (100.0%) | 1,325 (100.0%) |
Housing Structure by Heating Type in Randolph County
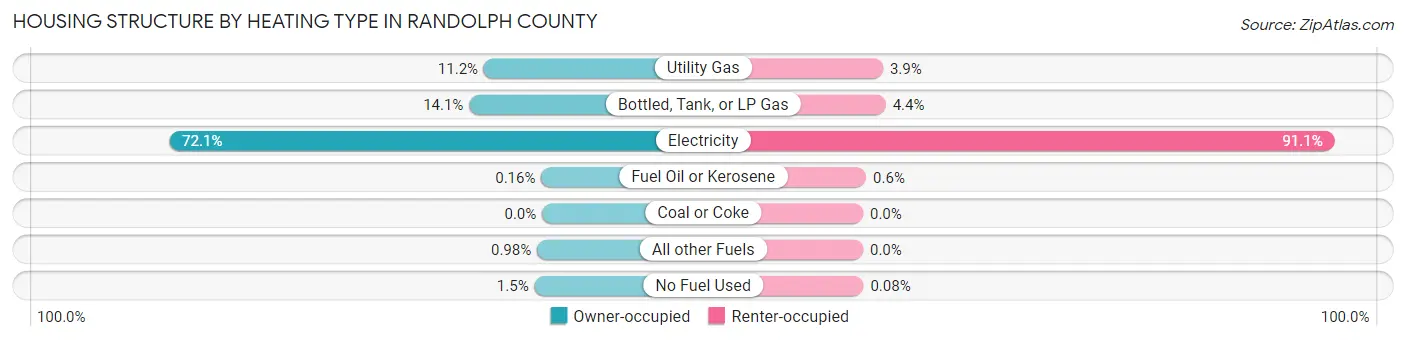
| Heating Type | Owner-occupied | Renter-occupied |
| Utility Gas | 138 (11.2%) | 51 (3.8%) |
| Bottled, Tank, or LP Gas | 173 (14.1%) | 58 (4.4%) |
| Electricity | 885 (72.1%) | 1,207 (91.1%) |
| Fuel Oil or Kerosene | 2 (0.2%) | 8 (0.6%) |
| Coal or Coke | 0 (0.0%) | 0 (0.0%) |
| All other Fuels | 12 (1.0%) | 0 (0.0%) |
| No Fuel Used | 18 (1.5%) | 1 (0.1%) |
| Total | 1,228 (100.0%) | 1,325 (100.0%) |
Household Vehicle Usage in Randolph County
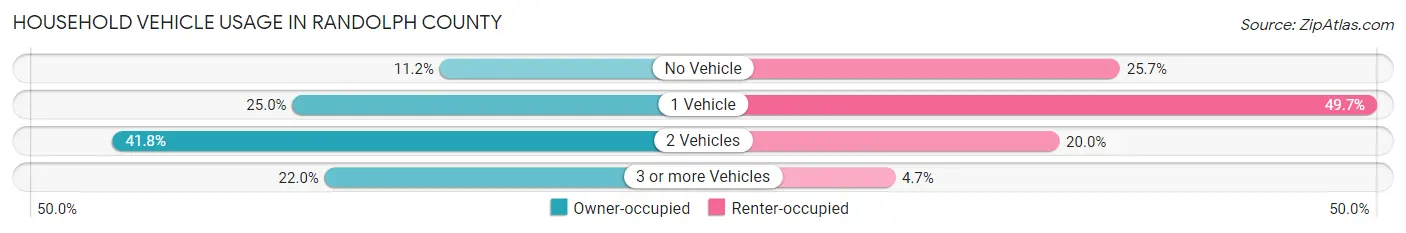
| Vehicles per Household | Owner-occupied | Renter-occupied |
| No Vehicle | 138 (11.2%) | 340 (25.7%) |
| 1 Vehicle | 307 (25.0%) | 658 (49.7%) |
| 2 Vehicles | 513 (41.8%) | 265 (20.0%) |
| 3 or more Vehicles | 270 (22.0%) | 62 (4.7%) |
| Total | 1,228 (100.0%) | 1,325 (100.0%) |
Real Estate & Mortgages in Randolph County
Real Estate and Mortgage Overview in Randolph County
| Characteristic | Without Mortgage | With Mortgage |
| Housing Units | 638 | 590 |
| Median Property Value | $88,000 | $73,300 |
| Median Household Income | $27,500 | $29 |
| Monthly Housing Costs | $391 | $0 |
| Real Estate Taxes | $718 | $0 |
Property Value by Mortgage Status in Randolph County
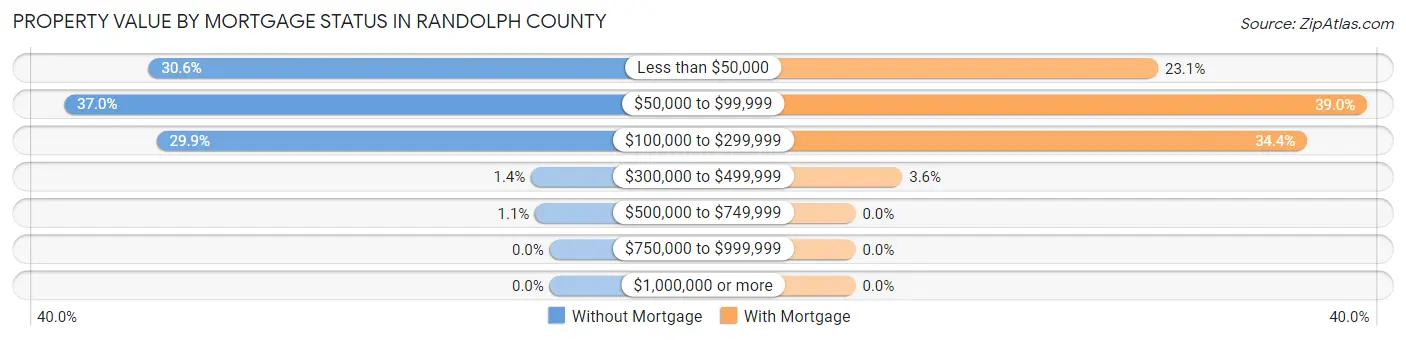
| Property Value | Without Mortgage | With Mortgage |
| Less than $50,000 | 195 (30.6%) | 136 (23.1%) |
| $50,000 to $99,999 | 236 (37.0%) | 230 (39.0%) |
| $100,000 to $299,999 | 191 (29.9%) | 203 (34.4%) |
| $300,000 to $499,999 | 9 (1.4%) | 21 (3.6%) |
| $500,000 to $749,999 | 7 (1.1%) | 0 (0.0%) |
| $750,000 to $999,999 | 0 (0.0%) | 0 (0.0%) |
| $1,000,000 or more | 0 (0.0%) | 0 (0.0%) |
| Total | 638 (100.0%) | 590 (100.0%) |
Household Income by Mortgage Status in Randolph County
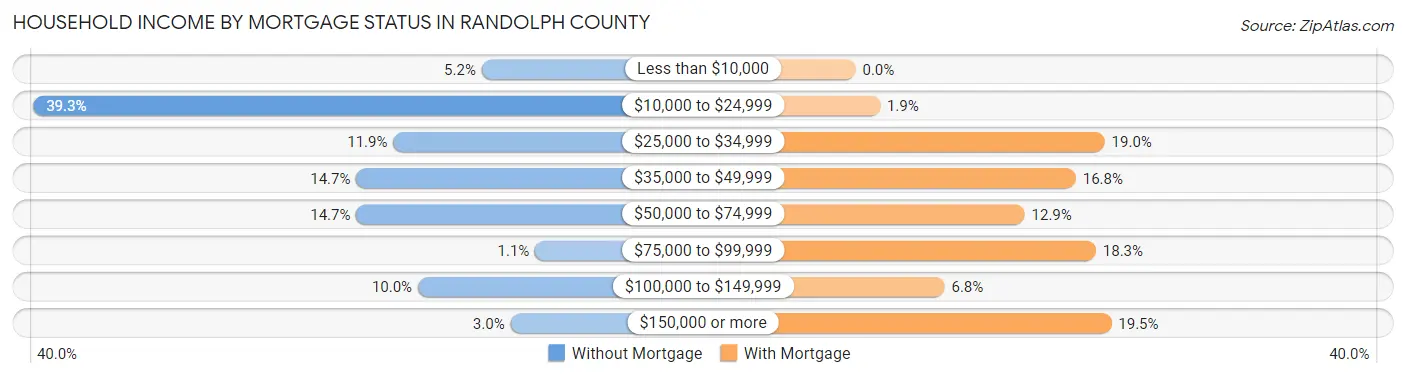
| Household Income | Without Mortgage | With Mortgage |
| Less than $10,000 | 33 (5.2%) | 0 (0.0%) |
| $10,000 to $24,999 | 251 (39.3%) | 11 (1.9%) |
| $25,000 to $34,999 | 76 (11.9%) | 112 (19.0%) |
| $35,000 to $49,999 | 94 (14.7%) | 99 (16.8%) |
| $50,000 to $74,999 | 94 (14.7%) | 76 (12.9%) |
| $75,000 to $99,999 | 7 (1.1%) | 108 (18.3%) |
| $100,000 to $149,999 | 64 (10.0%) | 40 (6.8%) |
| $150,000 or more | 19 (3.0%) | 115 (19.5%) |
| Total | 638 (100.0%) | 590 (100.0%) |
Property Value to Household Income Ratio in Randolph County
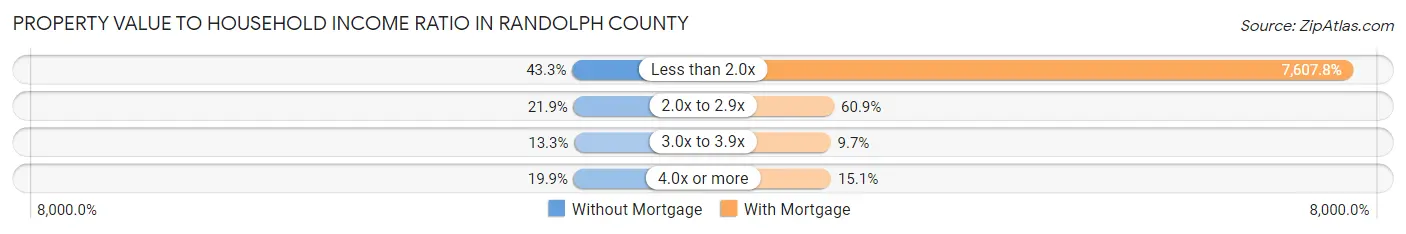
| Value-to-Income Ratio | Without Mortgage | With Mortgage |
| Less than 2.0x | 276 (43.3%) | 44,886 (7,607.8%) |
| 2.0x to 2.9x | 140 (21.9%) | 359 (60.9%) |
| 3.0x to 3.9x | 85 (13.3%) | 57 (9.7%) |
| 4.0x or more | 127 (19.9%) | 89 (15.1%) |
| Total | 638 (100.0%) | 590 (100.0%) |
Real Estate Taxes by Mortgage Status in Randolph County
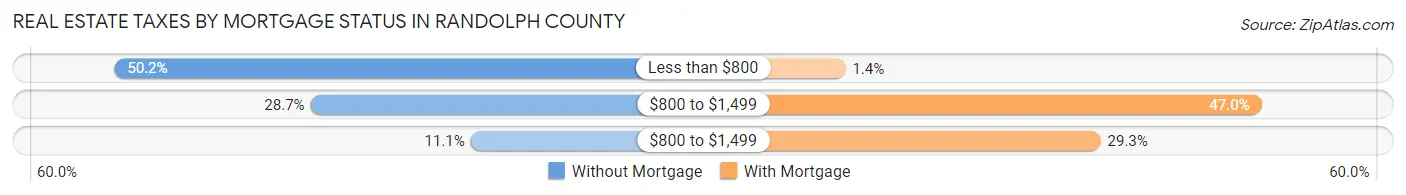
| Property Taxes | Without Mortgage | With Mortgage |
| Less than $800 | 320 (50.2%) | 8 (1.4%) |
| $800 to $1,499 | 183 (28.7%) | 277 (46.9%) |
| $800 to $1,499 | 71 (11.1%) | 173 (29.3%) |
| Total | 638 (100.0%) | 590 (100.0%) |
Health & Disability in Randolph County
Health Insurance Coverage by Age in Randolph County
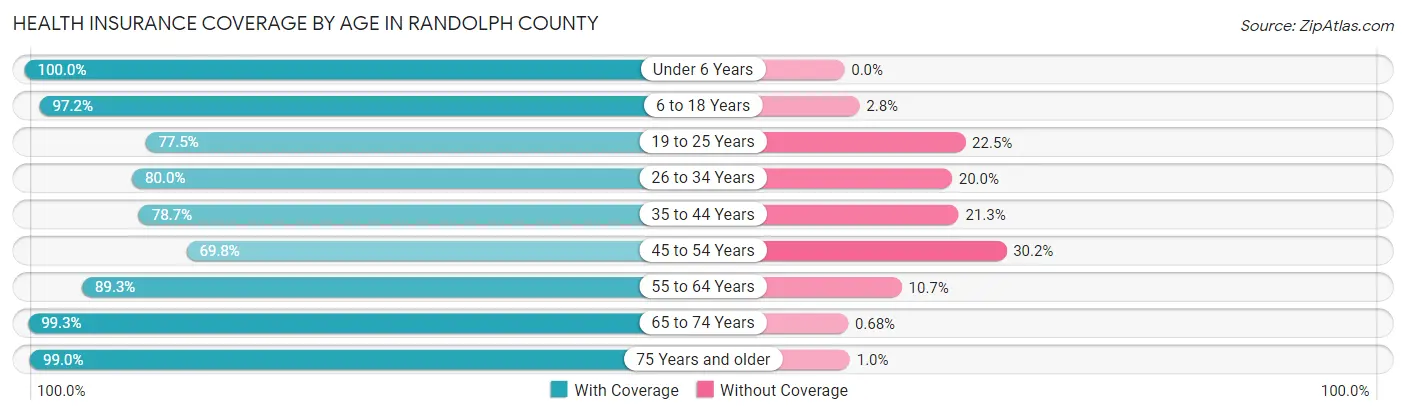
| Age Bracket | With Coverage | Without Coverage |
| Under 6 Years | 420 (100.0%) | 0 (0.0%) |
| 6 to 18 Years | 1,278 (97.2%) | 37 (2.8%) |
| 19 to 25 Years | 519 (77.5%) | 151 (22.5%) |
| 26 to 34 Years | 435 (80.0%) | 109 (20.0%) |
| 35 to 44 Years | 580 (78.7%) | 157 (21.3%) |
| 45 to 54 Years | 289 (69.8%) | 125 (30.2%) |
| 55 to 64 Years | 852 (89.3%) | 102 (10.7%) |
| 65 to 74 Years | 726 (99.3%) | 5 (0.7%) |
| 75 Years and older | 483 (99.0%) | 5 (1.0%) |
| Total | 5,582 (89.0%) | 691 (11.0%) |
Health Insurance Coverage by Citizenship Status in Randolph County
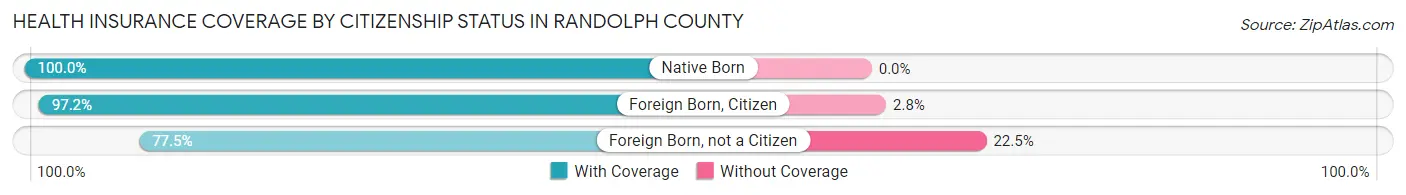
| Citizenship Status | With Coverage | Without Coverage |
| Native Born | 420 (100.0%) | 0 (0.0%) |
| Foreign Born, Citizen | 1,278 (97.2%) | 37 (2.8%) |
| Foreign Born, not a Citizen | 519 (77.5%) | 151 (22.5%) |
Health Insurance Coverage by Household Income in Randolph County
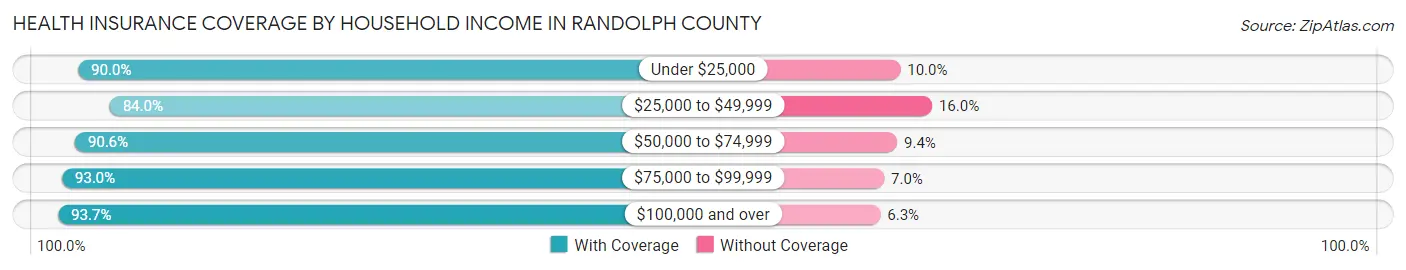
| Household Income | With Coverage | Without Coverage |
| Under $25,000 | 2,145 (90.0%) | 239 (10.0%) |
| $25,000 to $49,999 | 1,616 (84.0%) | 307 (16.0%) |
| $50,000 to $74,999 | 750 (90.6%) | 78 (9.4%) |
| $75,000 to $99,999 | 133 (93.0%) | 10 (7.0%) |
| $100,000 and over | 849 (93.7%) | 57 (6.3%) |
Public vs Private Health Insurance Coverage by Age in Randolph County
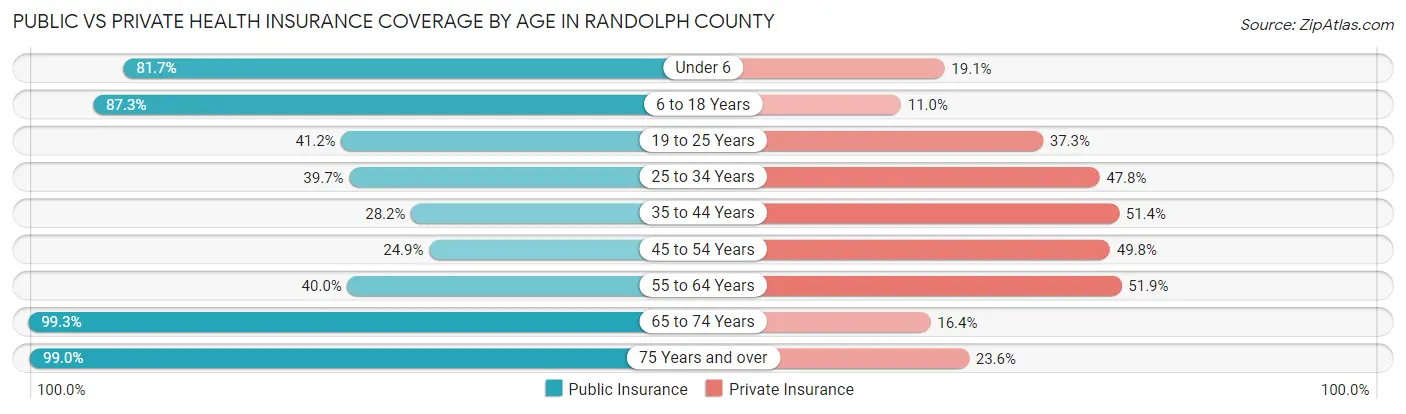
| Age Bracket | Public Insurance | Private Insurance |
| Under 6 | 343 (81.7%) | 80 (19.1%) |
| 6 to 18 Years | 1,148 (87.3%) | 144 (11.0%) |
| 19 to 25 Years | 276 (41.2%) | 250 (37.3%) |
| 25 to 34 Years | 216 (39.7%) | 260 (47.8%) |
| 35 to 44 Years | 208 (28.2%) | 379 (51.4%) |
| 45 to 54 Years | 103 (24.9%) | 206 (49.8%) |
| 55 to 64 Years | 382 (40.0%) | 495 (51.9%) |
| 65 to 74 Years | 726 (99.3%) | 120 (16.4%) |
| 75 Years and over | 483 (99.0%) | 115 (23.6%) |
| Total | 3,885 (61.9%) | 2,049 (32.7%) |
Disability Status by Sex by Age in Randolph County
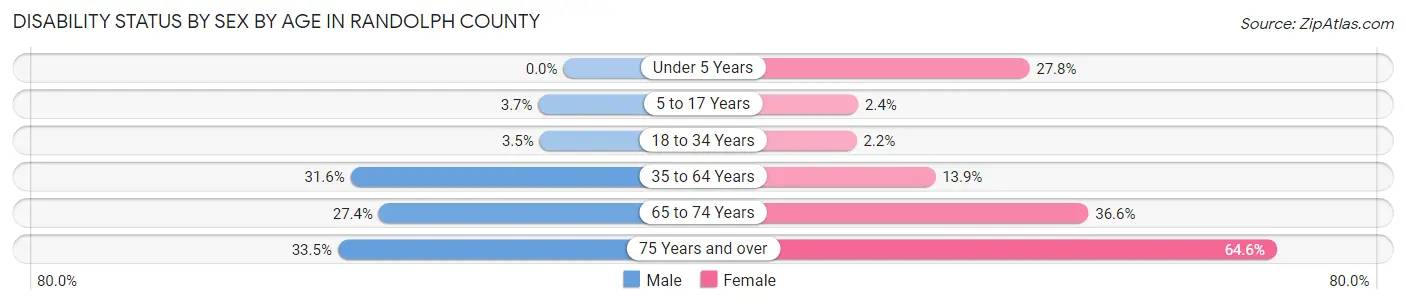
| Age Bracket | Male | Female |
| Under 5 Years | 0 (0.0%) | 49 (27.8%) |
| 5 to 17 Years | 21 (3.7%) | 16 (2.4%) |
| 18 to 34 Years | 22 (3.5%) | 16 (2.2%) |
| 35 to 64 Years | 303 (31.6%) | 159 (13.9%) |
| 65 to 74 Years | 97 (27.4%) | 138 (36.6%) |
| 75 Years and over | 67 (33.5%) | 186 (64.6%) |
Disability Class by Sex by Age in Randolph County
Disability Class: Hearing Difficulty
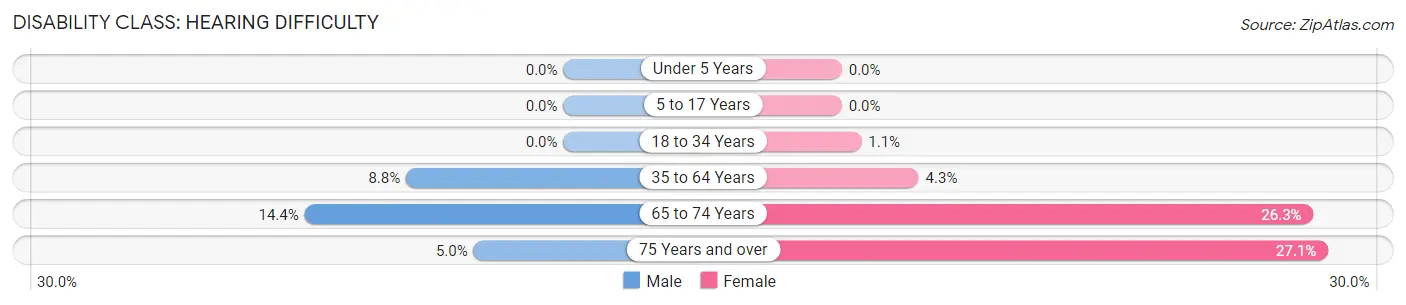
| Age Bracket | Male | Female |
| Under 5 Years | 0 (0.0%) | 0 (0.0%) |
| 5 to 17 Years | 0 (0.0%) | 0 (0.0%) |
| 18 to 34 Years | 0 (0.0%) | 8 (1.1%) |
| 35 to 64 Years | 84 (8.8%) | 49 (4.3%) |
| 65 to 74 Years | 51 (14.4%) | 99 (26.3%) |
| 75 Years and over | 10 (5.0%) | 78 (27.1%) |
Disability Class: Vision Difficulty
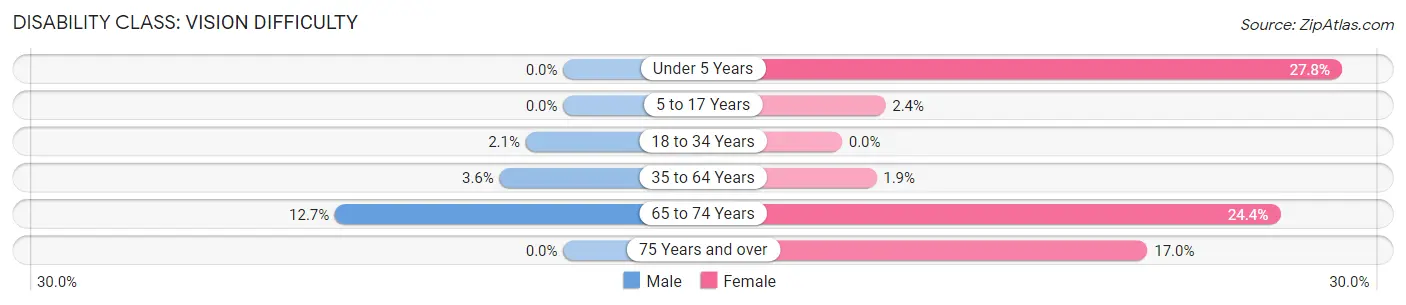
| Age Bracket | Male | Female |
| Under 5 Years | 0 (0.0%) | 49 (27.8%) |
| 5 to 17 Years | 0 (0.0%) | 16 (2.4%) |
| 18 to 34 Years | 13 (2.1%) | 0 (0.0%) |
| 35 to 64 Years | 34 (3.5%) | 22 (1.9%) |
| 65 to 74 Years | 45 (12.7%) | 92 (24.4%) |
| 75 Years and over | 0 (0.0%) | 49 (17.0%) |
Disability Class: Cognitive Difficulty
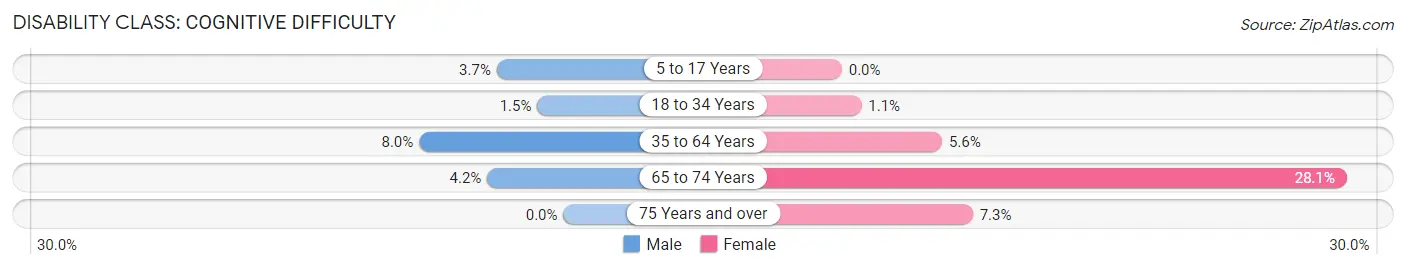
| Age Bracket | Male | Female |
| 5 to 17 Years | 21 (3.7%) | 0 (0.0%) |
| 18 to 34 Years | 9 (1.5%) | 8 (1.1%) |
| 35 to 64 Years | 77 (8.0%) | 64 (5.6%) |
| 65 to 74 Years | 15 (4.2%) | 106 (28.1%) |
| 75 Years and over | 0 (0.0%) | 21 (7.3%) |
Disability Class: Ambulatory Difficulty
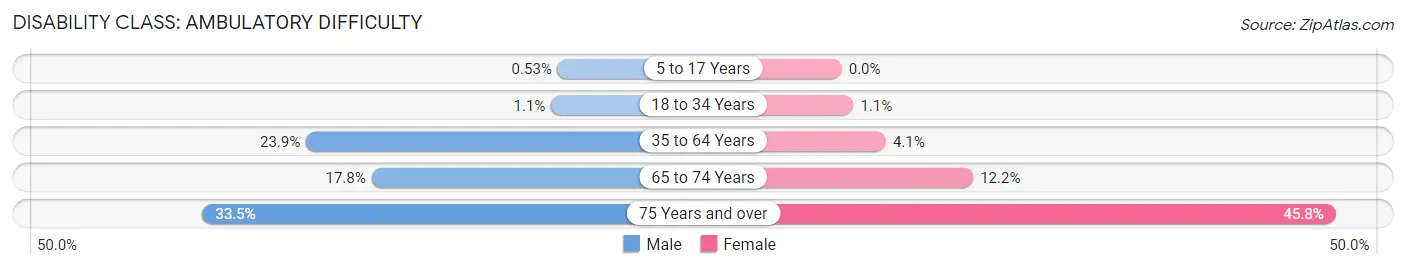
| Age Bracket | Male | Female |
| 5 to 17 Years | 3 (0.5%) | 0 (0.0%) |
| 18 to 34 Years | 7 (1.1%) | 8 (1.1%) |
| 35 to 64 Years | 229 (23.9%) | 47 (4.1%) |
| 65 to 74 Years | 63 (17.8%) | 46 (12.2%) |
| 75 Years and over | 67 (33.5%) | 132 (45.8%) |
Disability Class: Self-Care Difficulty
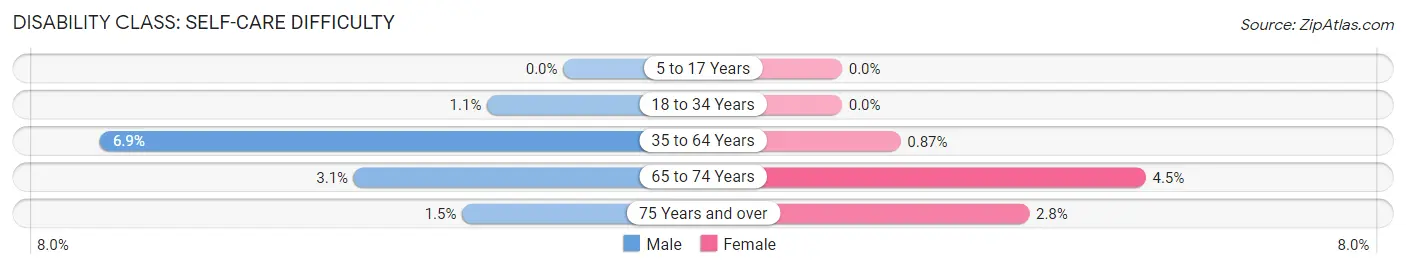
| Age Bracket | Male | Female |
| 5 to 17 Years | 0 (0.0%) | 0 (0.0%) |
| 18 to 34 Years | 7 (1.1%) | 0 (0.0%) |
| 35 to 64 Years | 66 (6.9%) | 10 (0.9%) |
| 65 to 74 Years | 11 (3.1%) | 17 (4.5%) |
| 75 Years and over | 3 (1.5%) | 8 (2.8%) |
Technology Access in Randolph County
Computing Device Access in Randolph County
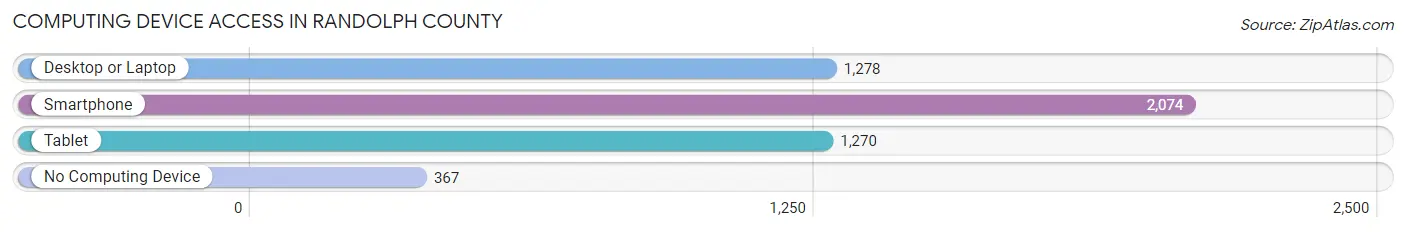
| Device Type | # Households | % Households |
| Desktop or Laptop | 1,278 | 50.1% |
| Smartphone | 2,074 | 81.2% |
| Tablet | 1,270 | 49.7% |
| No Computing Device | 367 | 14.4% |
| Total | 2,553 | 100.0% |
Internet Access in Randolph County
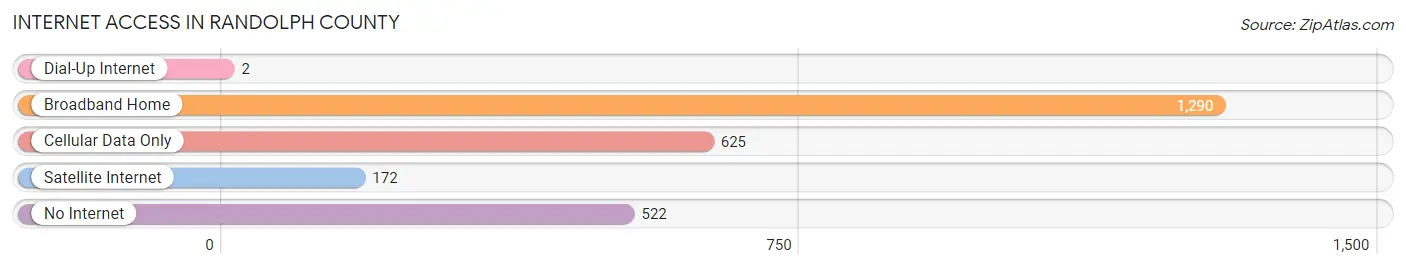
| Internet Type | # Households | % Households |
| Dial-Up Internet | 2 | 0.1% |
| Broadband Home | 1,290 | 50.5% |
| Cellular Data Only | 625 | 24.5% |
| Satellite Internet | 172 | 6.7% |
| No Internet | 522 | 20.4% |
| Total | 2,553 | 100.0% |
Randolph County Summary
Randolph County, Georgia is located in the southwestern part of the state, and is part of the Chattahoochee Valley region. It is bordered by Clay, Calhoun, Terrell, Lee, and Stewart counties. The county seat is Cuthbert, and the county has a population of 6,837 as of the 2010 census.
History
Randolph County was created in 1828 from a portion of Stewart County. It was named for John Randolph, a prominent Virginia statesman. The county was originally part of the Creek Nation, and the area was home to many Native American tribes. The first white settlers arrived in the early 1800s, and the county was officially organized in 1828.
The county was home to several prominent figures in the Civil War, including Confederate General John B. Gordon and Union General William Tecumseh Sherman. The county was also the site of several battles, including the Battle of Cuthbert in 1864.
Geography
Randolph County is located in the southwestern part of the state, and is part of the Chattahoochee Valley region. It is bordered by Clay, Calhoun, Terrell, Lee, and Stewart counties. The county has a total area of 441 square miles, of which 439 square miles is land and 2 square miles is water. The county is mostly flat, with some rolling hills in the northern part. The Flint River runs through the county, and there are several small lakes and ponds.
Economy
The economy of Randolph County is largely based on agriculture. The county is home to several large farms, and the main crops grown are cotton, corn, soybeans, and peanuts. The county also has a thriving timber industry, and there are several sawmills in the area.
The county is also home to several small businesses, including restaurants, retail stores, and service providers. The county is home to several manufacturing companies, including a paper mill and a furniture factory.
Demographics
As of the 2010 census, Randolph County had a population of 6,837. The racial makeup of the county was 63.3% White, 34.2% African American, 0.3% Native American, 0.2% Asian, 0.1% Pacific Islander, 0.7% from other races, and 1.4% from two or more races. Hispanic or Latino of any race were 1.7% of the population.
The median income for a household in the county was $30,938, and the median income for a family was $37,917. The per capita income for the county was $15,845. About 22.2% of the population was below the poverty line.
Common Questions
What is Per Capita Income in Randolph County?
Per Capita income in Randolph County is $18,208.
What is the Median Family Income in Randolph County?
Median Family Income in Randolph County is $34,813.
What is the Median Household income in Randolph County?
Median Household Income in Randolph County is $24,638.
What is Income or Wage Gap in Randolph County?
Income or Wage Gap in Randolph County is 36.6%.
Women in Randolph County earn 63.4 cents for every dollar earned by a man.
What is Family Income Deficit in Randolph County?
Family Income Deficit in Randolph County is $12,948.
Families that are below poverty line in Randolph County earn $12,948 less on average than the poverty threshold level.
What is Inequality or Gini Index in Randolph County?
Inequality or Gini Index in Randolph County is 0.46.
What is the Total Population of Randolph County?
Total Population of Randolph County is 6,365.
What is the Total Male Population of Randolph County?
Total Male Population of Randolph County is 2,939.
What is the Total Female Population of Randolph County?
Total Female Population of Randolph County is 3,426.
What is the Ratio of Males per 100 Females in Randolph County?
There are 85.79 Males per 100 Females in Randolph County.
What is the Ratio of Females per 100 Males in Randolph County?
There are 116.57 Females per 100 Males in Randolph County.
What is the Median Population Age in Randolph County?
Median Population Age in Randolph County is 39.0 Years.
What is the Average Family Size in Randolph County
Average Family Size in Randolph County is 3.3 People.
What is the Average Household Size in Randolph County
Average Household Size in Randolph County is 2.4 People.
How Large is the Labor Force in Randolph County?
There are 2,653 People in the Labor Forcein in Randolph County.
What is the Percentage of People in the Labor Force in Randolph County?
54.3% of People are in the Labor Force in Randolph County.
What is the Unemployment Rate in Randolph County?
Unemployment Rate in Randolph County is 7.5%.