Oconee County, GA Map & Demographics
Oconee County Map
Oconee County Overview
$53,848
PER CAPITA INCOME
$133,014
AVG FAMILY INCOME
$116,221
AVG HOUSEHOLD INCOME
44.6%
WAGE / INCOME GAP [ % ]
55.4¢/ $1
WAGE / INCOME GAP [ $ ]
0.46
INEQUALITY / GINI INDEX
41,978
TOTAL POPULATION
20,864
MALE POPULATION
21,114
FEMALE POPULATION
98.82
MALES / 100 FEMALES
101.20
FEMALES / 100 MALES
41.2
MEDIAN AGE
3.2
AVG FAMILY SIZE
2.9
AVG HOUSEHOLD SIZE
21,326
LABOR FORCE [ PEOPLE ]
65.4%
PERCENT IN LABOR FORCE
2.9%
UNEMPLOYMENT RATE
Income in Oconee County
Income Overview in Oconee County
Per Capita Income in Oconee County is $53,848, while median incomes of families and households are $133,014 and $116,221 respectively.
| Characteristic | Number | Measure |
| Per Capita Income | 41,978 | $53,848 |
| Median Family Income | 11,869 | $133,014 |
| Mean Family Income | 11,869 | $173,319 |
| Median Household Income | 14,330 | $116,221 |
| Mean Household Income | 14,330 | $156,856 |
| Income Deficit | 11,869 | $0 |
| Wage / Income Gap (%) | 41,978 | 44.60% |
| Wage / Income Gap ($) | 41,978 | 55.40¢ per $1 |
| Gini / Inequality Index | 41,978 | 0.46 |
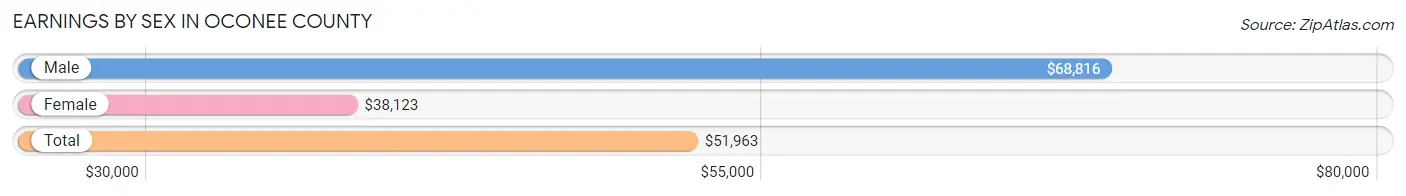
Earnings by Sex in Oconee County
Average Earnings in Oconee County are $51,963, $68,816 for men and $38,123 for women, a difference of 44.6%.
| Sex | Number | Average Earnings |
| Male | 12,223 (53.6%) | $68,816 |
| Female | 10,592 (46.4%) | $38,123 |
| Total | 22,815 (100.0%) | $51,963 |
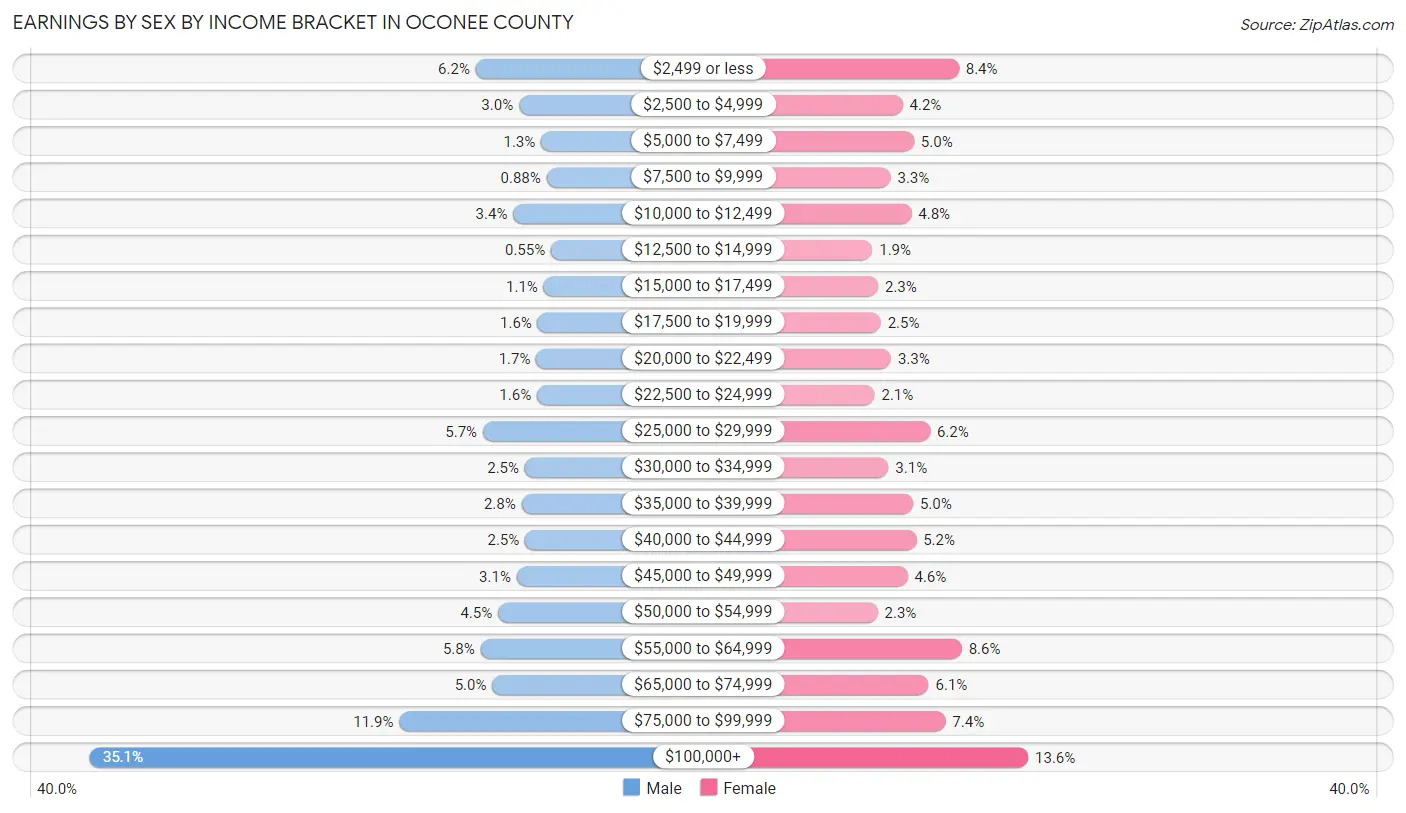
Earnings by Sex by Income Bracket in Oconee County
The most common earnings brackets in Oconee County are $100,000+ for men (4,292 | 35.1%) and $100,000+ for women (1,439 | 13.6%).
| Income | Male | Female |
| $2,499 or less | 757 (6.2%) | 889 (8.4%) |
| $2,500 to $4,999 | 361 (2.9%) | 443 (4.2%) |
| $5,000 to $7,499 | 158 (1.3%) | 533 (5.0%) |
| $7,500 to $9,999 | 107 (0.9%) | 347 (3.3%) |
| $10,000 to $12,499 | 413 (3.4%) | 513 (4.8%) |
| $12,500 to $14,999 | 67 (0.5%) | 202 (1.9%) |
| $15,000 to $17,499 | 135 (1.1%) | 248 (2.3%) |
| $17,500 to $19,999 | 190 (1.5%) | 269 (2.5%) |
| $20,000 to $22,499 | 202 (1.7%) | 351 (3.3%) |
| $22,500 to $24,999 | 195 (1.6%) | 220 (2.1%) |
| $25,000 to $29,999 | 690 (5.7%) | 660 (6.2%) |
| $30,000 to $34,999 | 307 (2.5%) | 331 (3.1%) |
| $35,000 to $39,999 | 337 (2.8%) | 525 (5.0%) |
| $40,000 to $44,999 | 304 (2.5%) | 551 (5.2%) |
| $45,000 to $49,999 | 381 (3.1%) | 482 (4.5%) |
| $50,000 to $54,999 | 552 (4.5%) | 245 (2.3%) |
| $55,000 to $64,999 | 713 (5.8%) | 912 (8.6%) |
| $65,000 to $74,999 | 605 (5.0%) | 649 (6.1%) |
| $75,000 to $99,999 | 1,457 (11.9%) | 783 (7.4%) |
| $100,000+ | 4,292 (35.1%) | 1,439 (13.6%) |
| Total | 12,223 (100.0%) | 10,592 (100.0%) |
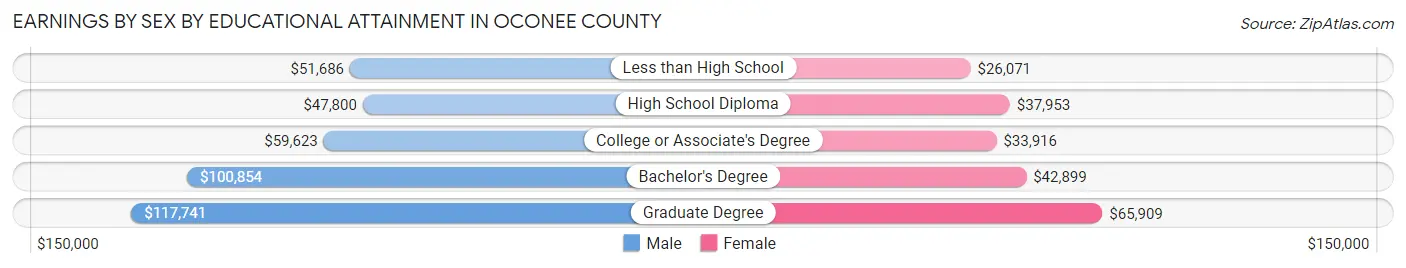
Earnings by Sex by Educational Attainment in Oconee County
Average earnings in Oconee County are $80,663 for men and $44,507 for women, a difference of 44.8%. Men with an educational attainment of graduate degree enjoy the highest average annual earnings of $117,741, while those with high school diploma education earn the least with $47,800. Women with an educational attainment of graduate degree earn the most with the average annual earnings of $65,909, while those with less than high school education have the smallest earnings of $26,071.
| Educational Attainment | Male Income | Female Income |
| Less than High School | $51,686 | $26,071 |
| High School Diploma | $47,800 | $37,953 |
| College or Associate's Degree | $59,623 | $33,916 |
| Bachelor's Degree | $100,854 | $42,899 |
| Graduate Degree | $117,741 | $65,909 |
| Total | $80,663 | $44,507 |
Family Income in Oconee County
Family Income Brackets in Oconee County
According to the Oconee County family income data, there are 2,979 families falling into the $200,000+ income range, which is the most common income bracket and makes up 25.1% of all families. Conversely, the $10,000 to $14,999 income bracket is the least frequent group with only 71 families (0.6%) belonging to this category.
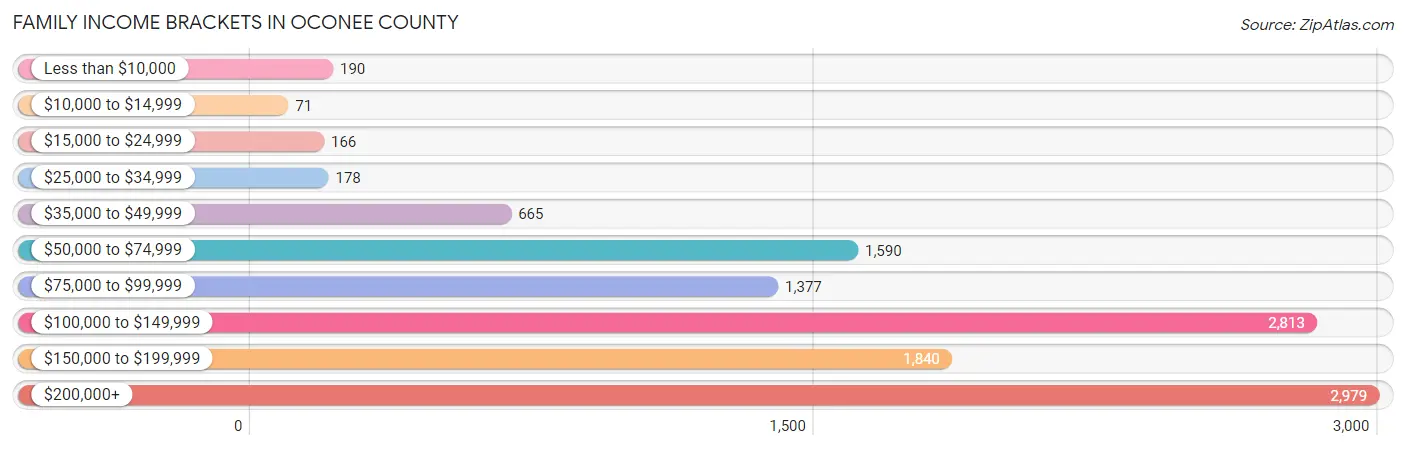
| Income Bracket | # Families | % Families |
| Less than $10,000 | 190 | 1.6% |
| $10,000 to $14,999 | 71 | 0.6% |
| $15,000 to $24,999 | 166 | 1.4% |
| $25,000 to $34,999 | 178 | 1.5% |
| $35,000 to $49,999 | 665 | 5.6% |
| $50,000 to $74,999 | 1,590 | 13.4% |
| $75,000 to $99,999 | 1,377 | 11.6% |
| $100,000 to $149,999 | 2,813 | 23.7% |
| $150,000 to $199,999 | 1,840 | 15.5% |
| $200,000+ | 2,979 | 25.1% |
Family Income by Famaliy Size in Oconee County
7+ person families (180 | 1.5%) account for the highest median family income in Oconee County with $178,404 per family, while 2-person families (4,786 | 40.3%) have the highest median income of $50,854 per family member.
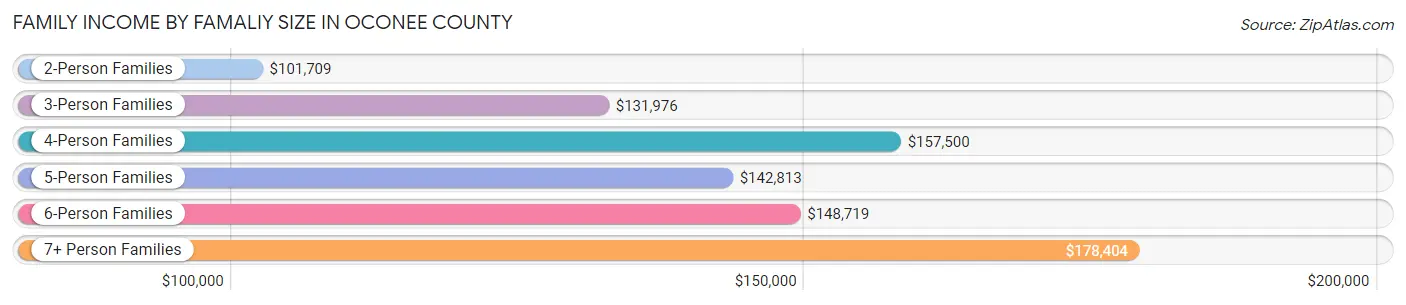
| Income Bracket | # Families | Median Income |
| 2-Person Families | 4,786 (40.3%) | $101,709 |
| 3-Person Families | 2,983 (25.1%) | $131,976 |
| 4-Person Families | 2,700 (22.8%) | $157,500 |
| 5-Person Families | 903 (7.6%) | $142,813 |
| 6-Person Families | 317 (2.7%) | $148,719 |
| 7+ Person Families | 180 (1.5%) | $178,404 |
| Total | 11,869 (100.0%) | $133,014 |
Family Income by Number of Earners in Oconee County
The median family income in Oconee County is $133,014, with families comprising 3+ earners (1,377) having the highest median family income of $167,813, while families with no earners (1,471) have the lowest median family income of $63,806, accounting for 11.6% and 12.4% of families, respectively.
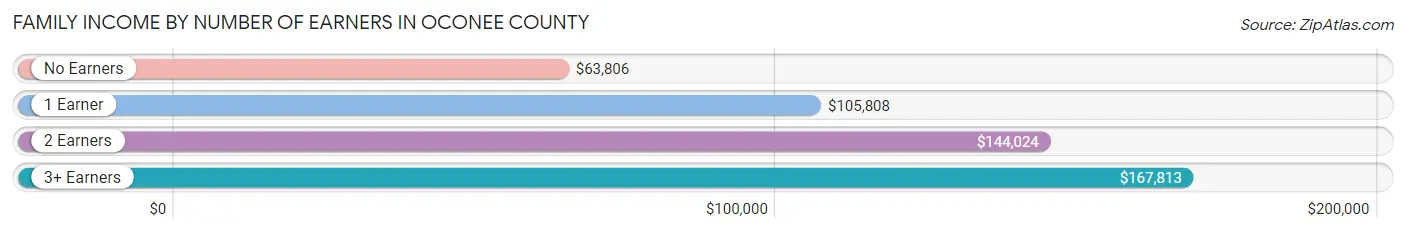
| Number of Earners | # Families | Median Income |
| No Earners | 1,471 (12.4%) | $63,806 |
| 1 Earner | 2,761 (23.3%) | $105,808 |
| 2 Earners | 6,260 (52.7%) | $144,024 |
| 3+ Earners | 1,377 (11.6%) | $167,813 |
| Total | 11,869 (100.0%) | $133,014 |
Household Income in Oconee County
Household Income Brackets in Oconee County
With 3,095 households falling in the category, the $200,000+ income range is the most frequent in Oconee County, accounting for 21.6% of all households. In contrast, only 100 households (0.7%) fall into the $10,000 to $14,999 income bracket, making it the least populous group.
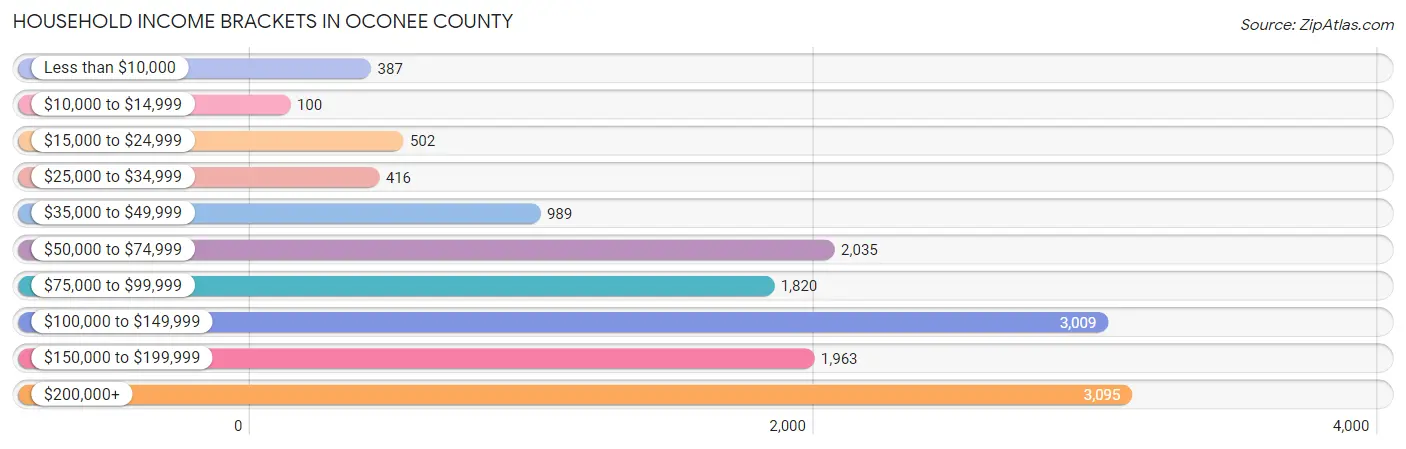
| Income Bracket | # Households | % Households |
| Less than $10,000 | 387 | 2.7% |
| $10,000 to $14,999 | 100 | 0.7% |
| $15,000 to $24,999 | 502 | 3.5% |
| $25,000 to $34,999 | 416 | 2.9% |
| $35,000 to $49,999 | 989 | 6.9% |
| $50,000 to $74,999 | 2,035 | 14.2% |
| $75,000 to $99,999 | 1,820 | 12.7% |
| $100,000 to $149,999 | 3,009 | 21.0% |
| $150,000 to $199,999 | 1,963 | 13.7% |
| $200,000+ | 3,095 | 21.6% |
Household Income by Householder Age in Oconee County
The median household income in Oconee County is $116,221, with the highest median household income of $138,559 found in the 45 to 64 years age bracket for the primary householder. A total of 6,336 households (44.2%) fall into this category. Meanwhile, the 15 to 24 years age bracket for the primary householder has the lowest median household income of $68,155, with 176 households (1.2%) in this group.
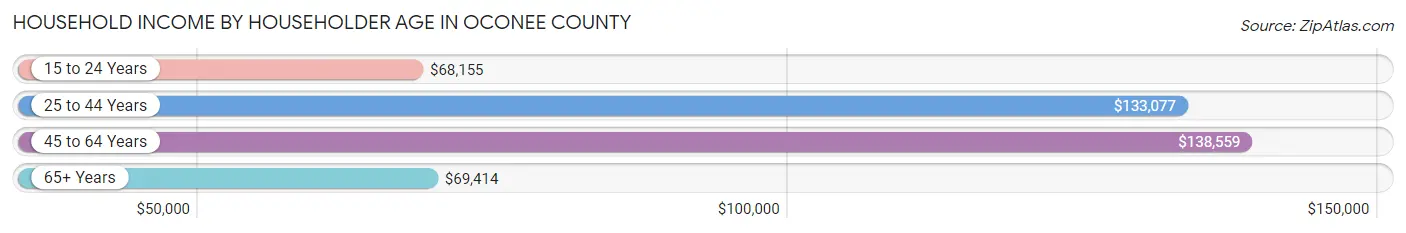
| Income Bracket | # Households | Median Income |
| 15 to 24 Years | 176 (1.2%) | $68,155 |
| 25 to 44 Years | 4,034 (28.1%) | $133,077 |
| 45 to 64 Years | 6,336 (44.2%) | $138,559 |
| 65+ Years | 3,784 (26.4%) | $69,414 |
| Total | 14,330 (100.0%) | $116,221 |
Poverty in Oconee County
Income Below Poverty by Sex and Age in Oconee County
With 4.0% poverty level for males and 5.0% for females among the residents of Oconee County, under 5 year old males and 18 to 24 year old females are the most vulnerable to poverty, with 125 males (11.2%) and 245 females (14.5%) in their respective age groups living below the poverty level.
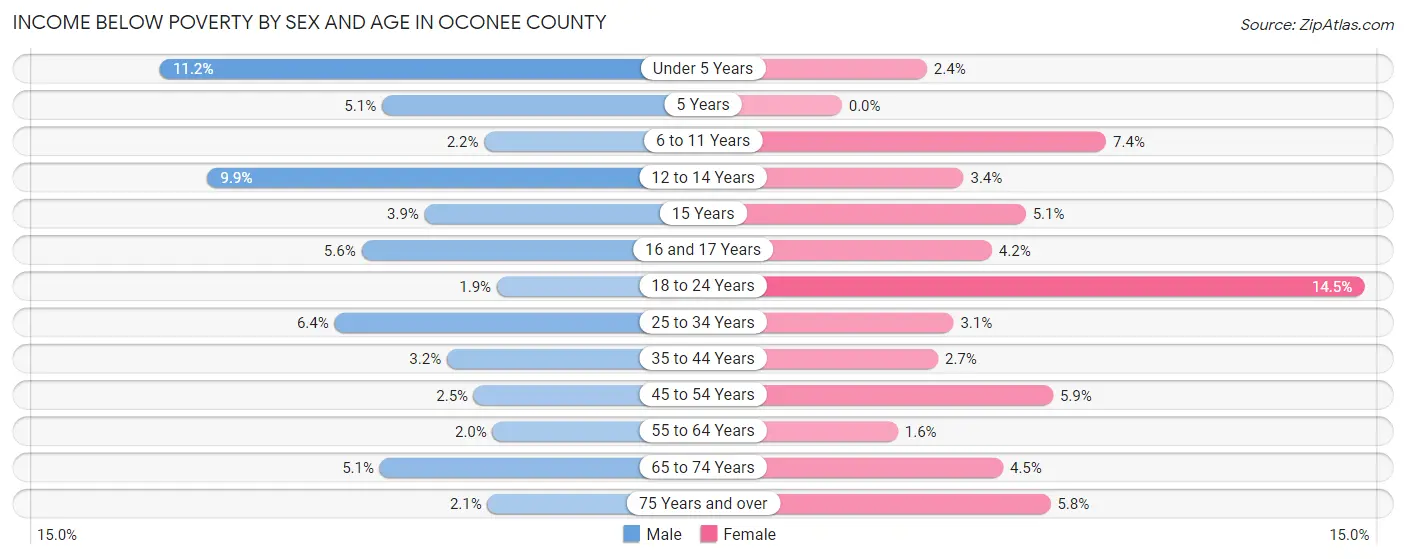
| Age Bracket | Male | Female |
| Under 5 Years | 125 (11.2%) | 21 (2.4%) |
| 5 Years | 11 (5.1%) | 0 (0.0%) |
| 6 to 11 Years | 50 (2.2%) | 153 (7.4%) |
| 12 to 14 Years | 103 (9.9%) | 26 (3.4%) |
| 15 Years | 10 (3.9%) | 21 (5.1%) |
| 16 and 17 Years | 47 (5.6%) | 34 (4.2%) |
| 18 to 24 Years | 33 (1.8%) | 245 (14.5%) |
| 25 to 34 Years | 101 (6.4%) | 54 (3.1%) |
| 35 to 44 Years | 88 (3.2%) | 81 (2.7%) |
| 45 to 54 Years | 80 (2.5%) | 192 (5.9%) |
| 55 to 64 Years | 52 (2.0%) | 42 (1.6%) |
| 65 to 74 Years | 100 (5.1%) | 90 (4.5%) |
| 75 Years and over | 23 (2.1%) | 80 (5.8%) |
| Total | 823 (4.0%) | 1,039 (5.0%) |
Income Above Poverty by Sex and Age in Oconee County
According to the poverty statistics in Oconee County, males aged 18 to 24 years and females aged 5 years are the age groups that are most secure financially, with 98.2% of males and 100.0% of females in these age groups living above the poverty line.
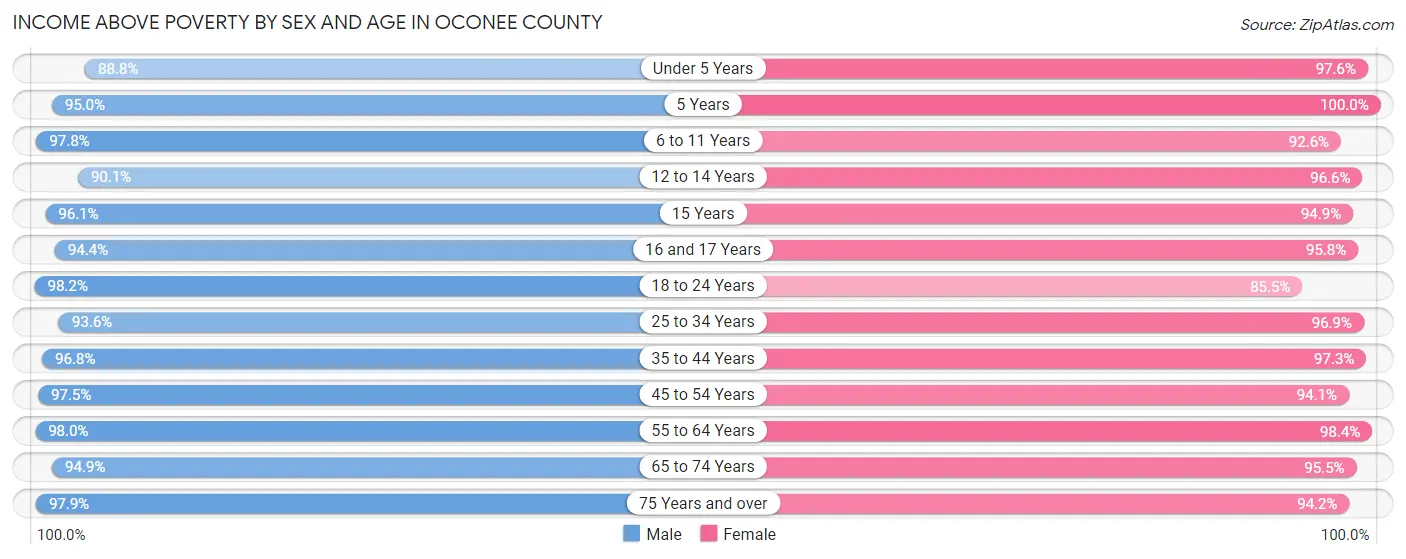
| Age Bracket | Male | Female |
| Under 5 Years | 988 (88.8%) | 866 (97.6%) |
| 5 Years | 207 (95.0%) | 207 (100.0%) |
| 6 to 11 Years | 2,225 (97.8%) | 1,925 (92.6%) |
| 12 to 14 Years | 936 (90.1%) | 741 (96.6%) |
| 15 Years | 249 (96.1%) | 389 (94.9%) |
| 16 and 17 Years | 790 (94.4%) | 779 (95.8%) |
| 18 to 24 Years | 1,755 (98.2%) | 1,440 (85.5%) |
| 25 to 34 Years | 1,485 (93.6%) | 1,683 (96.9%) |
| 35 to 44 Years | 2,631 (96.8%) | 2,944 (97.3%) |
| 45 to 54 Years | 3,127 (97.5%) | 3,073 (94.1%) |
| 55 to 64 Years | 2,588 (98.0%) | 2,644 (98.4%) |
| 65 to 74 Years | 1,856 (94.9%) | 1,914 (95.5%) |
| 75 Years and over | 1,066 (97.9%) | 1,296 (94.2%) |
| Total | 19,903 (96.0%) | 19,901 (95.0%) |
Income Below Poverty Among Married-Couple Families in Oconee County
The poverty statistics for married-couple families in Oconee County show that 2.7% or 280 of the total 10,387 families live below the poverty line. Families with 5 or more children have the highest poverty rate of 19.5%, comprising of 16 families. On the other hand, families with 1 or 2 children have the lowest poverty rate of 1.3%, which includes 59 families.
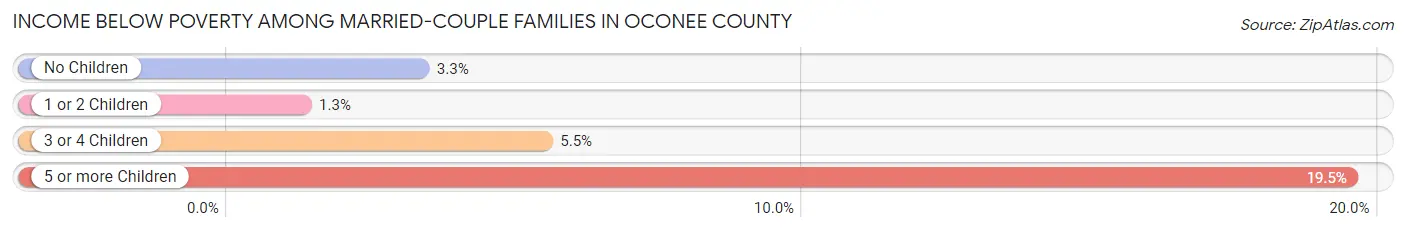
| Children | Above Poverty | Below Poverty |
| No Children | 4,919 (96.7%) | 170 (3.3%) |
| 1 or 2 Children | 4,519 (98.7%) | 59 (1.3%) |
| 3 or 4 Children | 603 (94.5%) | 35 (5.5%) |
| 5 or more Children | 66 (80.5%) | 16 (19.5%) |
| Total | 10,107 (97.3%) | 280 (2.7%) |
Income Below Poverty Among Single-Parent Households in Oconee County
According to the poverty data in Oconee County, 1.9% or 12 single-father households and 14.0% or 120 single-mother households are living below the poverty line. Among single-father households, those with 3 or 4 children have the highest poverty rate, with 12 households (15.4%) experiencing poverty. Likewise, among single-mother households, those with 3 or 4 children have the highest poverty rate, with 18 households (36.0%) falling below the poverty line.
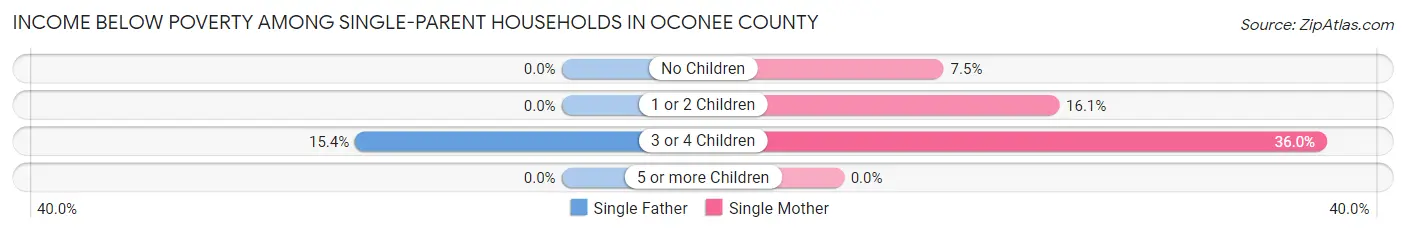
| Children | Single Father | Single Mother |
| No Children | 0 (0.0%) | 24 (7.4%) |
| 1 or 2 Children | 0 (0.0%) | 78 (16.1%) |
| 3 or 4 Children | 12 (15.4%) | 18 (36.0%) |
| 5 or more Children | 0 (0.0%) | 0 (0.0%) |
| Total | 12 (1.9%) | 120 (14.0%) |
Income Below Poverty Among Married-Couple vs Single-Parent Households in Oconee County
The poverty data for Oconee County shows that 280 of the married-couple family households (2.7%) and 132 of the single-parent households (8.9%) are living below the poverty level. Within the married-couple family households, those with 5 or more children have the highest poverty rate, with 16 households (19.5%) falling below the poverty line. Among the single-parent households, those with 3 or 4 children have the highest poverty rate, with 30 household (23.4%) living below poverty.
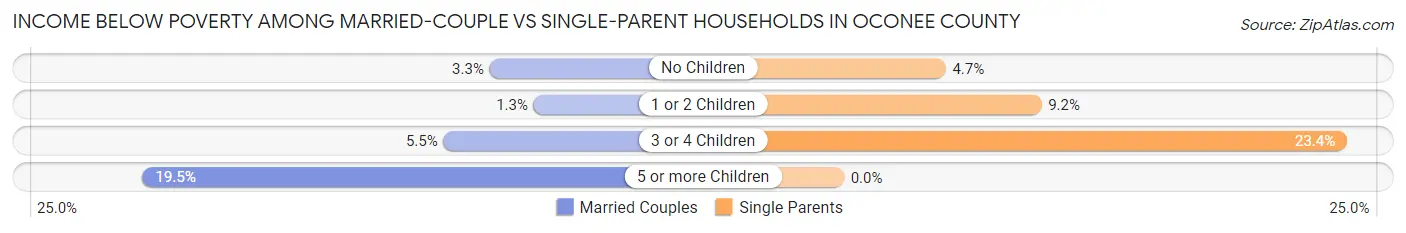
| Children | Married-Couple Families | Single-Parent Households |
| No Children | 170 (3.3%) | 24 (4.7%) |
| 1 or 2 Children | 59 (1.3%) | 78 (9.2%) |
| 3 or 4 Children | 35 (5.5%) | 30 (23.4%) |
| 5 or more Children | 16 (19.5%) | 0 (0.0%) |
| Total | 280 (2.7%) | 132 (8.9%) |
Race in Oconee County
The most populous races in Oconee County are White / Caucasian (35,586 | 84.8%), Hispanic or Latino (2,398 | 5.7%), and Two or more Races (2,272 | 5.4%).
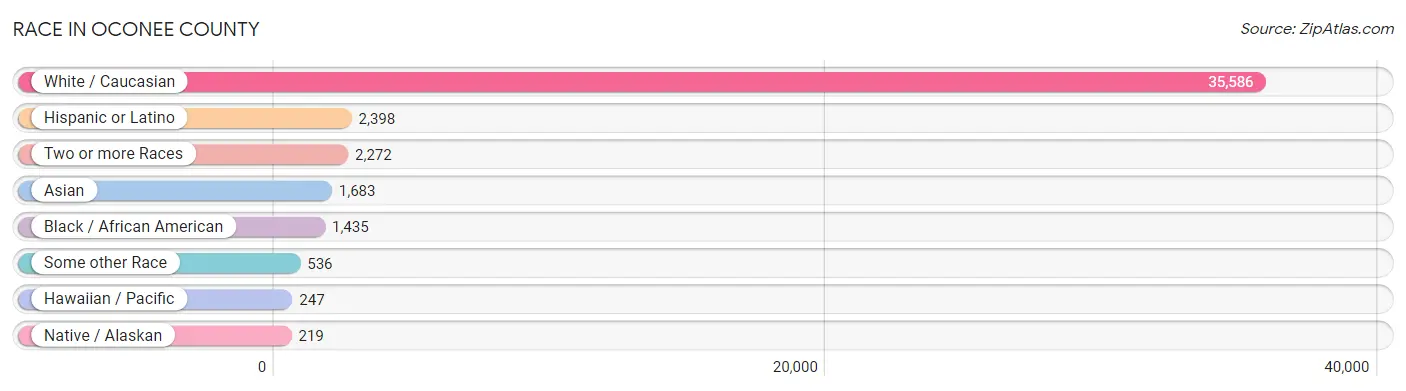
| Race | # Population | % Population |
| Asian | 1,683 | 4.0% |
| Black / African American | 1,435 | 3.4% |
| Hawaiian / Pacific | 247 | 0.6% |
| Hispanic or Latino | 2,398 | 5.7% |
| Native / Alaskan | 219 | 0.5% |
| White / Caucasian | 35,586 | 84.8% |
| Two or more Races | 2,272 | 5.4% |
| Some other Race | 536 | 1.3% |
| Total | 41,978 | 100.0% |
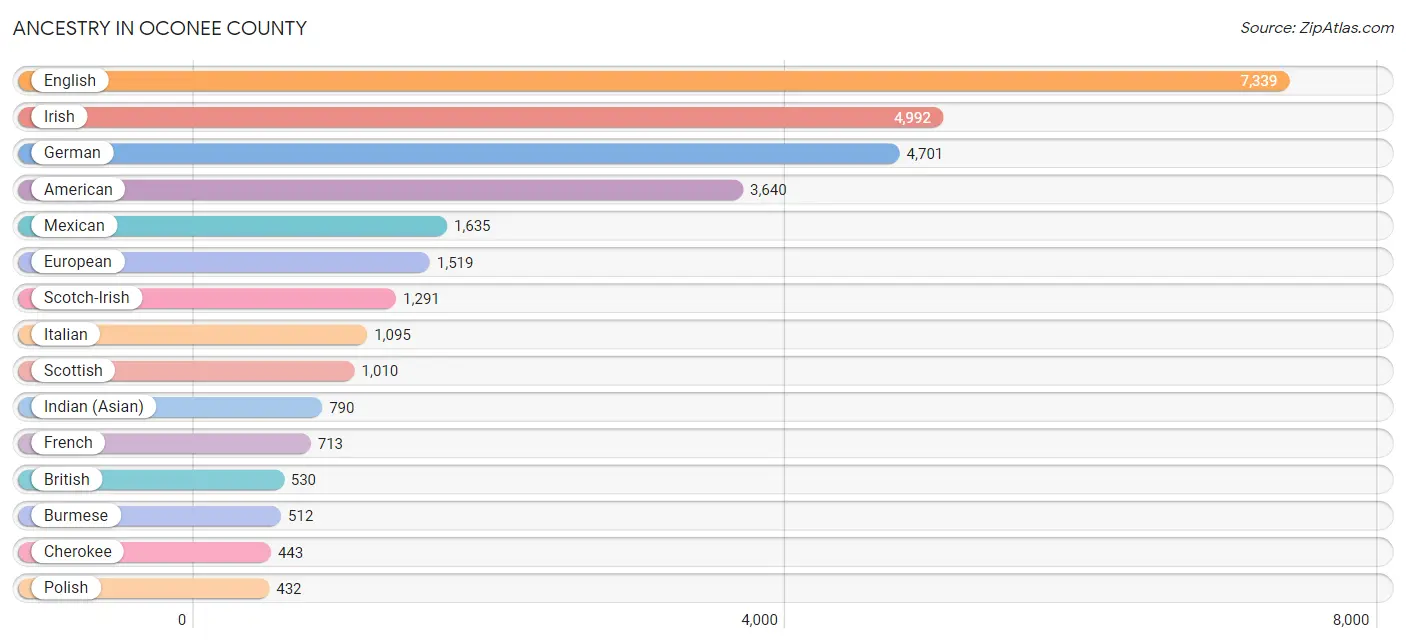
Ancestry in Oconee County
The most populous ancestries reported in Oconee County are English (7,339 | 17.5%), Irish (4,992 | 11.9%), German (4,701 | 11.2%), American (3,640 | 8.7%), and Mexican (1,635 | 3.9%), together accounting for 53.1% of all Oconee County residents.
| Ancestry | # Population | % Population |
| Albanian | 15 | 0.0% |
| American | 3,640 | 8.7% |
| Arab | 254 | 0.6% |
| Australian | 19 | 0.1% |
| Austrian | 101 | 0.2% |
| Bhutanese | 178 | 0.4% |
| Blackfeet | 6 | 0.0% |
| Brazilian | 54 | 0.1% |
| British | 530 | 1.3% |
| Bulgarian | 53 | 0.1% |
| Burmese | 512 | 1.2% |
| Cajun | 1 | 0.0% |
| Canadian | 43 | 0.1% |
| Celtic | 18 | 0.0% |
| Central American | 399 | 0.9% |
| Central American Indian | 99 | 0.2% |
| Cherokee | 443 | 1.1% |
| Colombian | 43 | 0.1% |
| Costa Rican | 10 | 0.0% |
| Creek | 20 | 0.1% |
| Croatian | 9 | 0.0% |
| Cuban | 33 | 0.1% |
| Czech | 96 | 0.2% |
| Czechoslovakian | 9 | 0.0% |
| Danish | 285 | 0.7% |
| Dominican | 8 | 0.0% |
| Dutch | 221 | 0.5% |
| Eastern European | 90 | 0.2% |
| Egyptian | 114 | 0.3% |
| English | 7,339 | 17.5% |
| European | 1,519 | 3.6% |
| Filipino | 84 | 0.2% |
| Finnish | 26 | 0.1% |
| French | 713 | 1.7% |
| French American Indian | 9 | 0.0% |
| French Canadian | 51 | 0.1% |
| German | 4,701 | 11.2% |
| Greek | 96 | 0.2% |
| Guamanian / Chamorro | 220 | 0.5% |
| Guatemalan | 270 | 0.6% |
| Haitian | 228 | 0.5% |
| Hungarian | 121 | 0.3% |
| Indian (Asian) | 790 | 1.9% |
| Irish | 4,992 | 11.9% |
| Italian | 1,095 | 2.6% |
| Jamaican | 246 | 0.6% |
| Japanese | 16 | 0.0% |
| Korean | 55 | 0.1% |
| Latvian | 24 | 0.1% |
| Lebanese | 121 | 0.3% |
| Lithuanian | 34 | 0.1% |
| Macedonian | 43 | 0.1% |
| Malaysian | 13 | 0.0% |
| Mexican | 1,635 | 3.9% |
| Mexican American Indian | 73 | 0.2% |
| Nicaraguan | 83 | 0.2% |
| Nigerian | 8 | 0.0% |
| Northern European | 97 | 0.2% |
| Norwegian | 346 | 0.8% |
| Pakistani | 10 | 0.0% |
| Peruvian | 21 | 0.1% |
| Polish | 432 | 1.0% |
| Portuguese | 6 | 0.0% |
| Puerto Rican | 112 | 0.3% |
| Romanian | 10 | 0.0% |
| Russian | 205 | 0.5% |
| Salvadoran | 36 | 0.1% |
| Scandinavian | 114 | 0.3% |
| Scotch-Irish | 1,291 | 3.1% |
| Scottish | 1,010 | 2.4% |
| Sioux | 5 | 0.0% |
| Slovak | 6 | 0.0% |
| South African | 2 | 0.0% |
| South American | 173 | 0.4% |
| Spaniard | 32 | 0.1% |
| Sri Lankan | 70 | 0.2% |
| Subsaharan African | 23 | 0.1% |
| Swedish | 269 | 0.6% |
| Swiss | 98 | 0.2% |
| Syrian | 19 | 0.1% |
| Thai | 142 | 0.3% |
| Turkish | 64 | 0.2% |
| Ukrainian | 80 | 0.2% |
| Venezuelan | 109 | 0.3% |
| Welsh | 258 | 0.6% |
| Yugoslavian | 9 | 0.0% | View All 86 Rows |
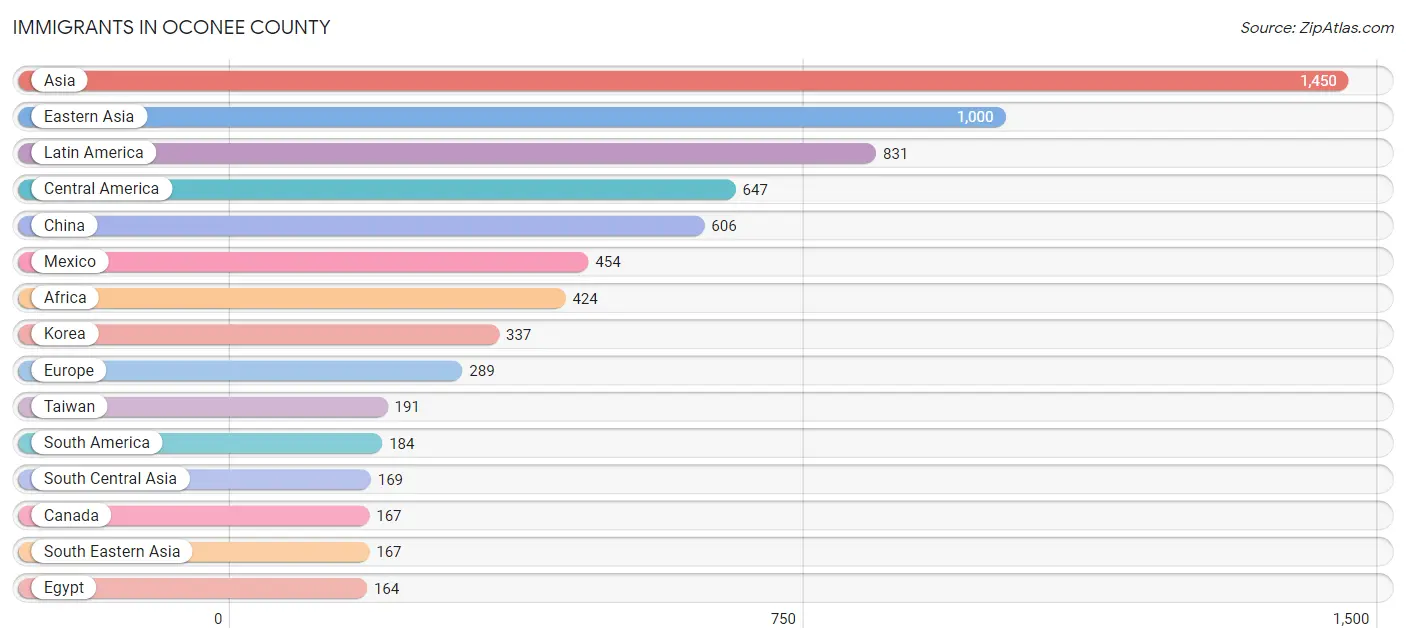
Immigrants in Oconee County
The most numerous immigrant groups reported in Oconee County came from Asia (1,450 | 3.5%), Eastern Asia (1,000 | 2.4%), Latin America (831 | 2.0%), Central America (647 | 1.5%), and China (606 | 1.4%), together accounting for 10.8% of all Oconee County residents.
| Immigration Origin | # Population | % Population |
| Africa | 424 | 1.0% |
| Asia | 1,450 | 3.5% |
| Australia | 19 | 0.1% |
| Bosnia and Herzegovina | 9 | 0.0% |
| Brazil | 44 | 0.1% |
| Cameroon | 13 | 0.0% |
| Canada | 167 | 0.4% |
| Central America | 647 | 1.5% |
| China | 606 | 1.4% |
| Colombia | 10 | 0.0% |
| Eastern Asia | 1,000 | 2.4% |
| Eastern Europe | 114 | 0.3% |
| Egypt | 164 | 0.4% |
| El Salvador | 15 | 0.0% |
| England | 15 | 0.0% |
| Europe | 289 | 0.7% |
| Germany | 65 | 0.2% |
| Greece | 31 | 0.1% |
| Guatemala | 103 | 0.3% |
| Hong Kong | 20 | 0.1% |
| India | 137 | 0.3% |
| Italy | 8 | 0.0% |
| Japan | 57 | 0.1% |
| Kazakhstan | 18 | 0.0% |
| Korea | 337 | 0.8% |
| Latin America | 831 | 2.0% |
| Latvia | 24 | 0.1% |
| Lebanon | 12 | 0.0% |
| Malaysia | 32 | 0.1% |
| Mexico | 454 | 1.1% |
| Middle Africa | 13 | 0.0% |
| Nicaragua | 75 | 0.2% |
| Nigeria | 8 | 0.0% |
| North Macedonia | 43 | 0.1% |
| Northern Africa | 164 | 0.4% |
| Northern Europe | 67 | 0.2% |
| Oceania | 19 | 0.1% |
| Pakistan | 14 | 0.0% |
| Peru | 21 | 0.1% |
| Philippines | 81 | 0.2% |
| Romania | 2 | 0.0% |
| South Africa | 2 | 0.0% |
| South America | 184 | 0.4% |
| South Central Asia | 169 | 0.4% |
| South Eastern Asia | 167 | 0.4% |
| Southern Europe | 43 | 0.1% |
| Spain | 4 | 0.0% |
| Taiwan | 191 | 0.5% |
| Thailand | 10 | 0.0% |
| Turkey | 49 | 0.1% |
| Ukraine | 30 | 0.1% |
| Venezuela | 109 | 0.3% |
| Vietnam | 44 | 0.1% |
| Western Africa | 8 | 0.0% |
| Western Asia | 114 | 0.3% |
| Western Europe | 65 | 0.2% | View All 56 Rows |
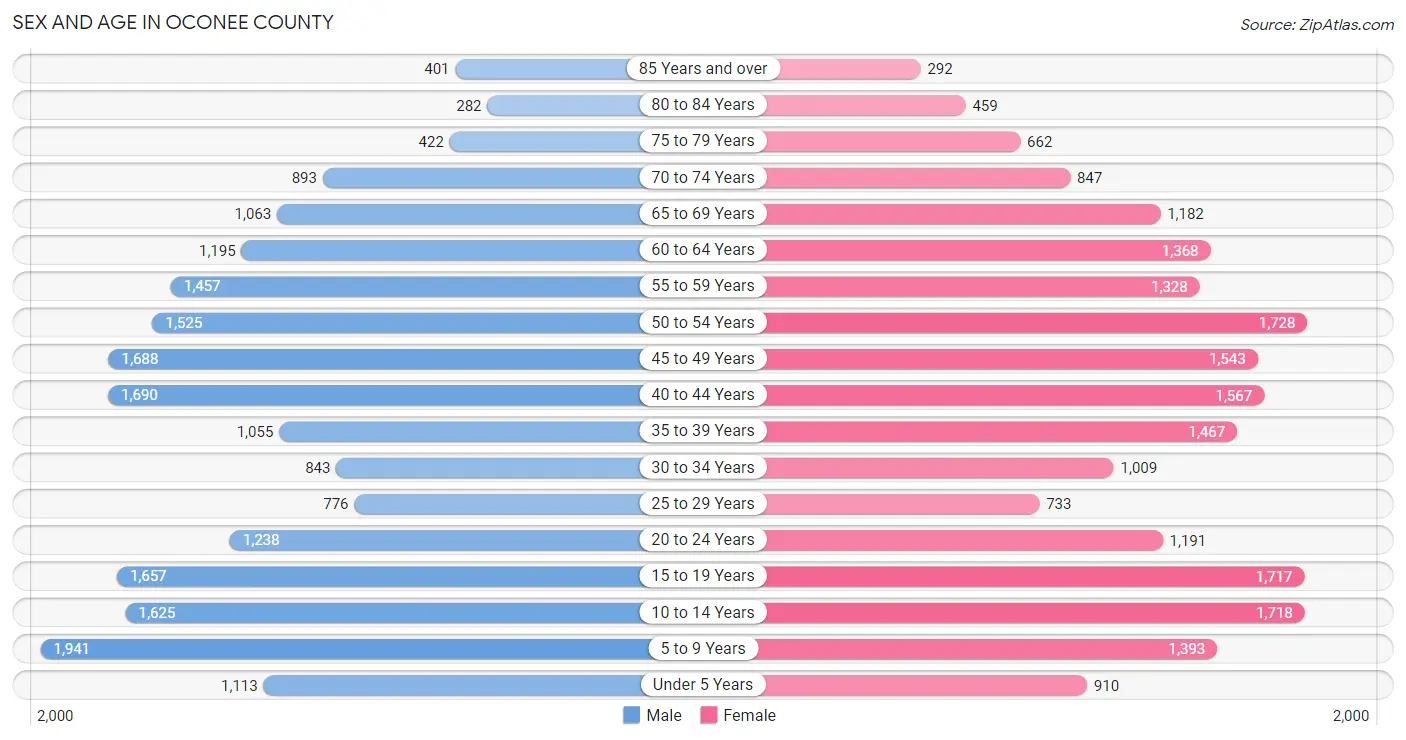
Sex and Age in Oconee County
Sex and Age in Oconee County
The most populous age groups in Oconee County are 5 to 9 Years (1,941 | 9.3%) for men and 50 to 54 Years (1,728 | 8.2%) for women.
| Age Bracket | Male | Female |
| Under 5 Years | 1,113 (5.3%) | 910 (4.3%) |
| 5 to 9 Years | 1,941 (9.3%) | 1,393 (6.6%) |
| 10 to 14 Years | 1,625 (7.8%) | 1,718 (8.1%) |
| 15 to 19 Years | 1,657 (7.9%) | 1,717 (8.1%) |
| 20 to 24 Years | 1,238 (5.9%) | 1,191 (5.6%) |
| 25 to 29 Years | 776 (3.7%) | 733 (3.5%) |
| 30 to 34 Years | 843 (4.0%) | 1,009 (4.8%) |
| 35 to 39 Years | 1,055 (5.1%) | 1,467 (7.0%) |
| 40 to 44 Years | 1,690 (8.1%) | 1,567 (7.4%) |
| 45 to 49 Years | 1,688 (8.1%) | 1,543 (7.3%) |
| 50 to 54 Years | 1,525 (7.3%) | 1,728 (8.2%) |
| 55 to 59 Years | 1,457 (7.0%) | 1,328 (6.3%) |
| 60 to 64 Years | 1,195 (5.7%) | 1,368 (6.5%) |
| 65 to 69 Years | 1,063 (5.1%) | 1,182 (5.6%) |
| 70 to 74 Years | 893 (4.3%) | 847 (4.0%) |
| 75 to 79 Years | 422 (2.0%) | 662 (3.1%) |
| 80 to 84 Years | 282 (1.3%) | 459 (2.2%) |
| 85 Years and over | 401 (1.9%) | 292 (1.4%) |
| Total | 20,864 (100.0%) | 21,114 (100.0%) |
Families and Households in Oconee County
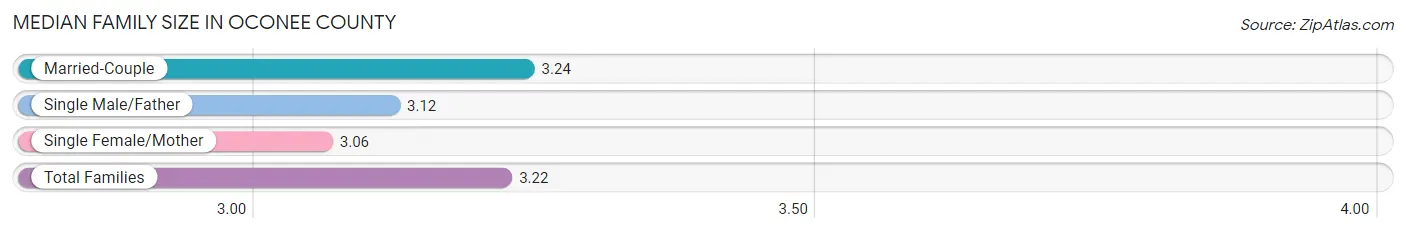
Median Family Size in Oconee County
The median family size in Oconee County is 3.22 persons per family, with married-couple families (10,387 | 87.5%) accounting for the largest median family size of 3.24 persons per family. On the other hand, single female/mother families (858 | 7.2%) represent the smallest median family size with 3.06 persons per family.
| Family Type | # Families | Family Size |
| Married-Couple | 10,387 (87.5%) | 3.24 |
| Single Male/Father | 624 (5.3%) | 3.12 |
| Single Female/Mother | 858 (7.2%) | 3.06 |
| Total Families | 11,869 (100.0%) | 3.22 |
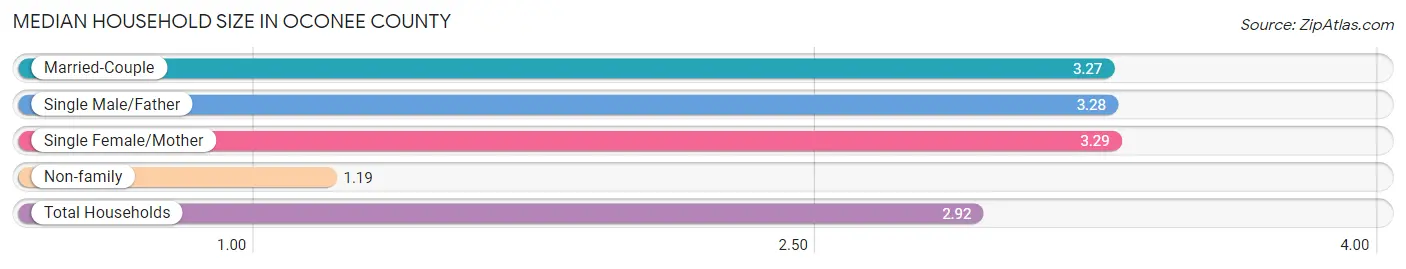
Median Household Size in Oconee County
The median household size in Oconee County is 2.92 persons per household, with single female/mother households (858 | 6.0%) accounting for the largest median household size of 3.29 persons per household. non-family households (2,461 | 17.2%) represent the smallest median household size with 1.19 persons per household.
| Household Type | # Households | Household Size |
| Married-Couple | 10,387 (72.5%) | 3.27 |
| Single Male/Father | 624 (4.3%) | 3.28 |
| Single Female/Mother | 858 (6.0%) | 3.29 |
| Non-family | 2,461 (17.2%) | 1.19 |
| Total Households | 14,330 (100.0%) | 2.92 |
Household Size by Marriage Status in Oconee County
Out of a total of 14,330 households in Oconee County, 11,869 (82.8%) are family households, while 2,461 (17.2%) are nonfamily households. The most numerous type of family households are 2-person households, comprising 4,652, and the most common type of nonfamily households are 1-person households, comprising 2,196.
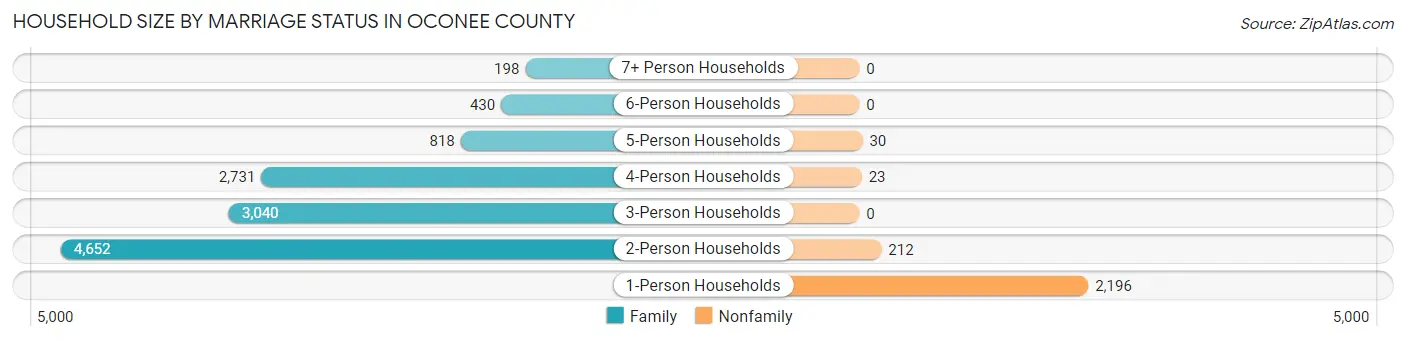
| Household Size | Family Households | Nonfamily Households |
| 1-Person Households | - | 2,196 (15.3%) |
| 2-Person Households | 4,652 (32.5%) | 212 (1.5%) |
| 3-Person Households | 3,040 (21.2%) | 0 (0.0%) |
| 4-Person Households | 2,731 (19.1%) | 23 (0.2%) |
| 5-Person Households | 818 (5.7%) | 30 (0.2%) |
| 6-Person Households | 430 (3.0%) | 0 (0.0%) |
| 7+ Person Households | 198 (1.4%) | 0 (0.0%) |
| Total | 11,869 (82.8%) | 2,461 (17.2%) |
Female Fertility in Oconee County
Fertility by Age in Oconee County
Average fertility rate in Oconee County is 40.0 births per 1,000 women. Women in the age bracket of 20 to 34 years have the highest fertility rate with 90.0 births per 1,000 women. Women in the age bracket of 20 to 34 years acount for 69.6% of all women with births.
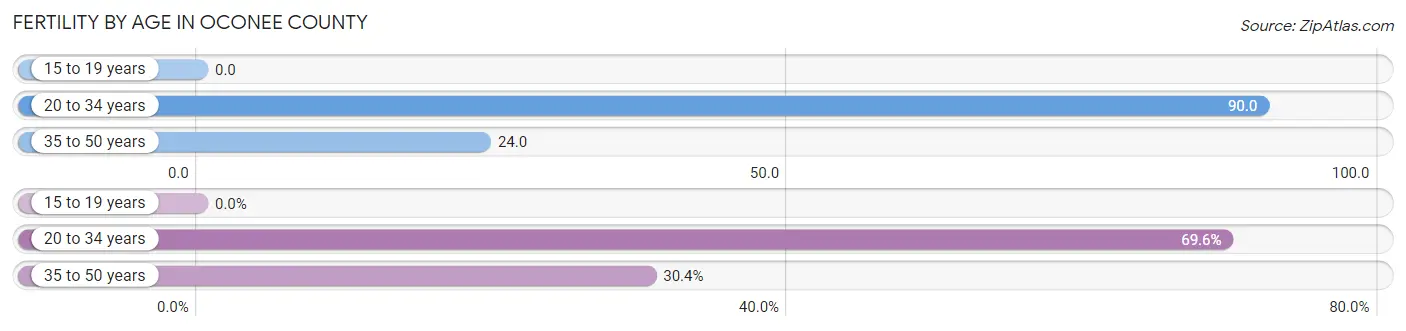
| Age Bracket | Women with Births | Births / 1,000 Women |
| 15 to 19 years | 0 (0.0%) | 0.0 |
| 20 to 34 years | 263 (69.6%) | 90.0 |
| 35 to 50 years | 115 (30.4%) | 24.0 |
| Total | 378 (100.0%) | 40.0 |
Fertility by Age by Marriage Status in Oconee County
98.1% of women with births (378) in Oconee County are married. The highest percentage of unmarried women with births falls into 20 to 34 years age bracket with 2.7% of them unmarried at the time of birth, while the lowest percentage of unmarried women with births belong to 35 to 50 years age bracket with 0.0% of them unmarried.
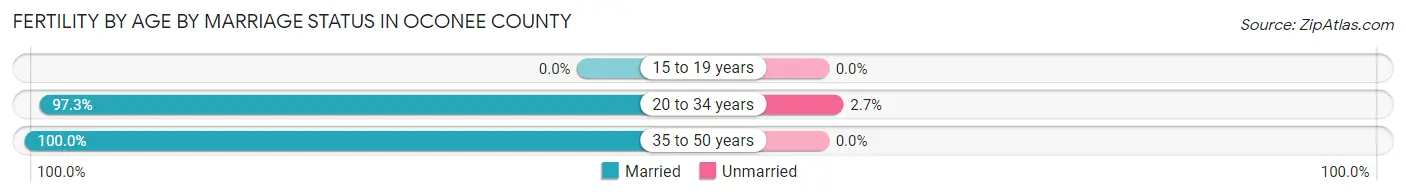
| Age Bracket | Married | Unmarried |
| 15 to 19 years | 0 (0.0%) | 0 (0.0%) |
| 20 to 34 years | 256 (97.3%) | 7 (2.7%) |
| 35 to 50 years | 115 (100.0%) | 0 (0.0%) |
| Total | 371 (98.2%) | 7 (1.8%) |
Fertility by Education in Oconee County
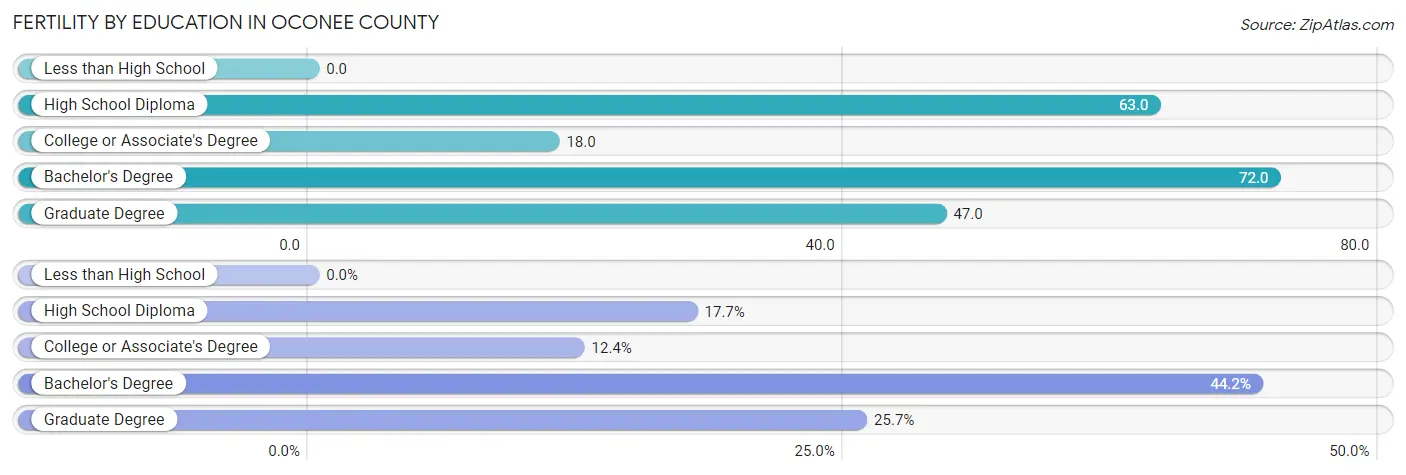
| Educational Attainment | Women with Births | Births / 1,000 Women |
| Less than High School | 0 (0.0%) | 0.0 |
| High School Diploma | 67 (17.7%) | 63.0 |
| College or Associate's Degree | 47 (12.4%) | 18.0 |
| Bachelor's Degree | 167 (44.2%) | 72.0 |
| Graduate Degree | 97 (25.7%) | 47.0 |
| Total | 378 (100.0%) | 40.0 |
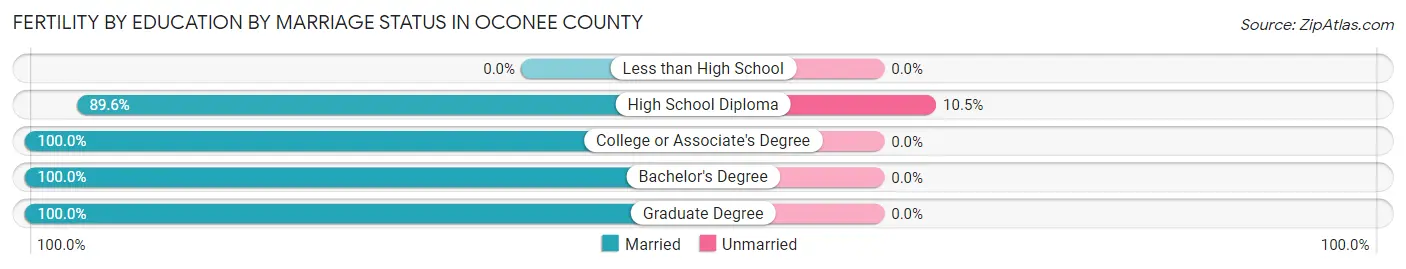
Fertility by Education by Marriage Status in Oconee County
1.8% of women with births in Oconee County are unmarried. Women with the educational attainment of college or associate's degree are most likely to be married with 100.0% of them married at childbirth, while women with the educational attainment of high school diploma are least likely to be married with 10.4% of them unmarried at childbirth.
| Educational Attainment | Married | Unmarried |
| Less than High School | 0 (0.0%) | 0 (0.0%) |
| High School Diploma | 60 (89.5%) | 7 (10.4%) |
| College or Associate's Degree | 47 (100.0%) | 0 (0.0%) |
| Bachelor's Degree | 167 (100.0%) | 0 (0.0%) |
| Graduate Degree | 97 (100.0%) | 0 (0.0%) |
| Total | 371 (98.2%) | 7 (1.8%) |
Employment Characteristics in Oconee County
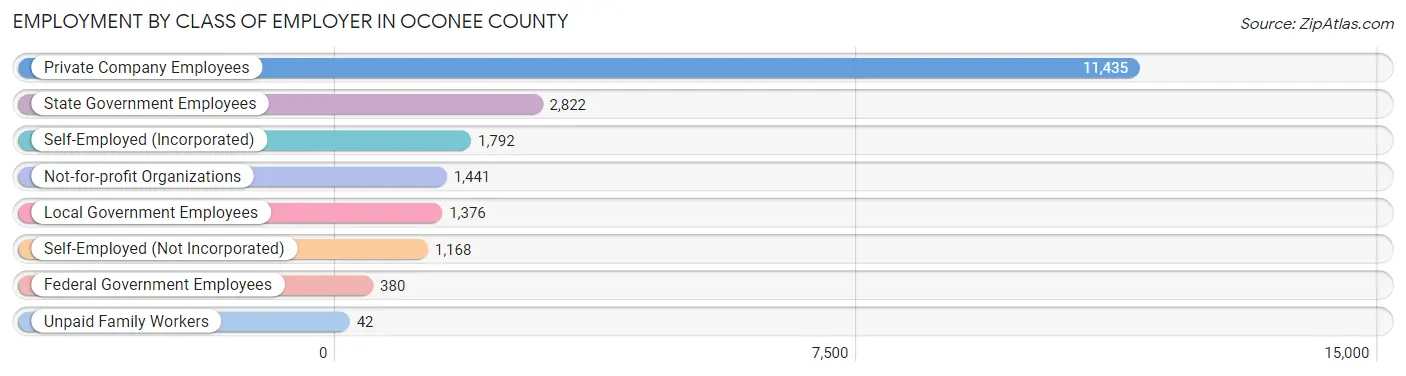
Employment by Class of Employer in Oconee County
Among the 20,456 employed individuals in Oconee County, private company employees (11,435 | 55.9%), state government employees (2,822 | 13.8%), and self-employed (incorporated) (1,792 | 8.8%) make up the most common classes of employment.
| Employer Class | # Employees | % Employees |
| Private Company Employees | 11,435 | 55.9% |
| Self-Employed (Incorporated) | 1,792 | 8.8% |
| Self-Employed (Not Incorporated) | 1,168 | 5.7% |
| Not-for-profit Organizations | 1,441 | 7.0% |
| Local Government Employees | 1,376 | 6.7% |
| State Government Employees | 2,822 | 13.8% |
| Federal Government Employees | 380 | 1.9% |
| Unpaid Family Workers | 42 | 0.2% |
| Total | 20,456 | 100.0% |
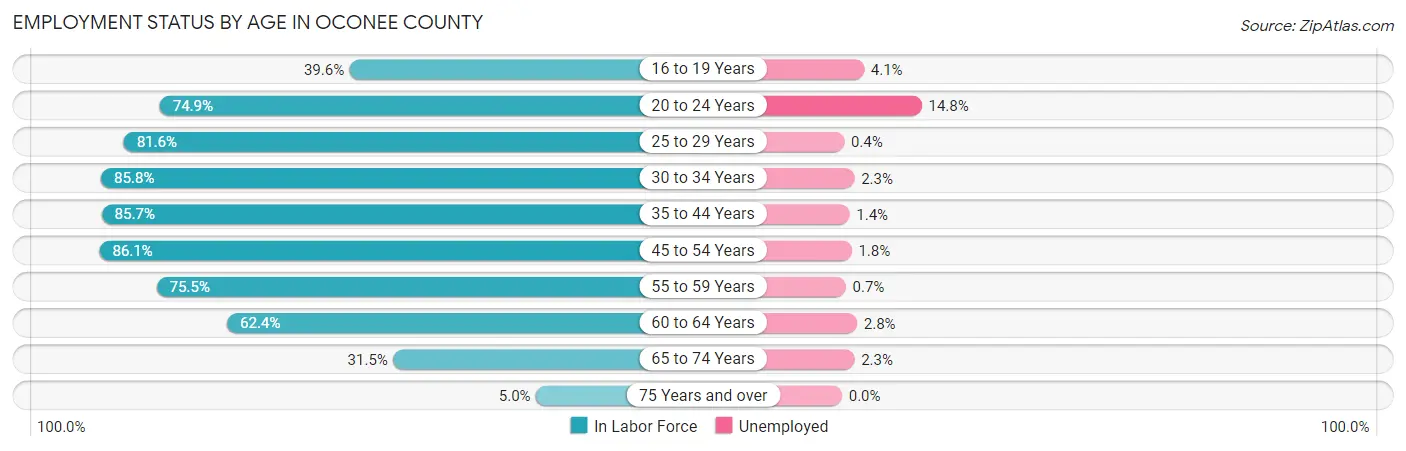
Employment Status by Age in Oconee County
According to the labor force statistics for Oconee County, out of the total population over 16 years of age (32,609), 65.4% or 21,326 individuals are in the labor force, with 2.9% or 618 of them unemployed. The age group with the highest labor force participation rate is 45 to 54 years, with 86.1% or 5,583 individuals in the labor force. Within the labor force, the 20 to 24 years age range has the highest percentage of unemployed individuals, with 14.8% or 269 of them being unemployed.
| Age Bracket | In Labor Force | Unemployed |
| 16 to 19 Years | 1,071 (39.6%) | 44 (4.1%) |
| 20 to 24 Years | 1,819 (74.9%) | 269 (14.8%) |
| 25 to 29 Years | 1,231 (81.6%) | 5 (0.4%) |
| 30 to 34 Years | 1,589 (85.8%) | 37 (2.3%) |
| 35 to 44 Years | 4,953 (85.7%) | 69 (1.4%) |
| 45 to 54 Years | 5,583 (86.1%) | 100 (1.8%) |
| 55 to 59 Years | 2,103 (75.5%) | 15 (0.7%) |
| 60 to 64 Years | 1,599 (62.4%) | 45 (2.8%) |
| 65 to 74 Years | 1,255 (31.5%) | 29 (2.3%) |
| 75 Years and over | 126 (5.0%) | 0 (0.0%) |
| Total | 21,326 (65.4%) | 618 (2.9%) |
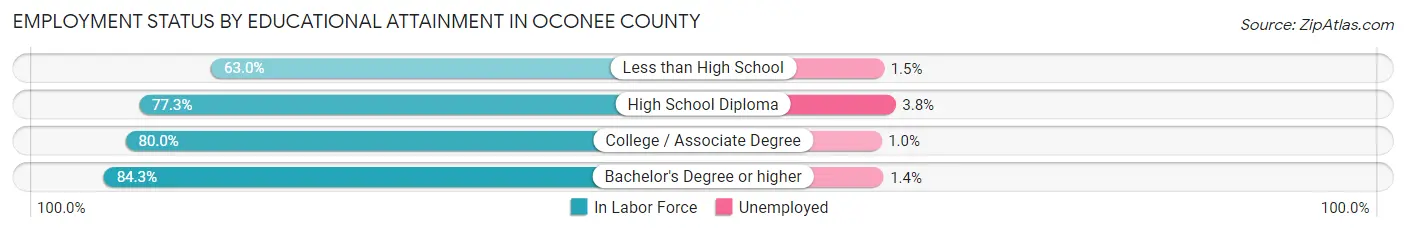
Employment Status by Educational Attainment in Oconee County
According to labor force statistics for Oconee County, 81.3% of individuals (17,050) out of the total population between 25 and 64 years of age (20,972) are in the labor force, with 1.6% or 273 of them being unemployed. The group with the highest labor force participation rate are those with the educational attainment of bachelor's degree or higher, with 84.3% or 10,080 individuals in the labor force. Within the labor force, individuals with high school diploma education have the highest percentage of unemployment, with 3.8% or 82 of them being unemployed.
| Educational Attainment | In Labor Force | Unemployed |
| Less than High School | 590 (63.0%) | 14 (1.5%) |
| High School Diploma | 2,165 (77.3%) | 106 (3.8%) |
| College / Associate Degree | 4,222 (80.0%) | 53 (1.0%) |
| Bachelor's Degree or higher | 10,080 (84.3%) | 167 (1.4%) |
| Total | 17,050 (81.3%) | 336 (1.6%) |
Employment Occupations by Sex in Oconee County
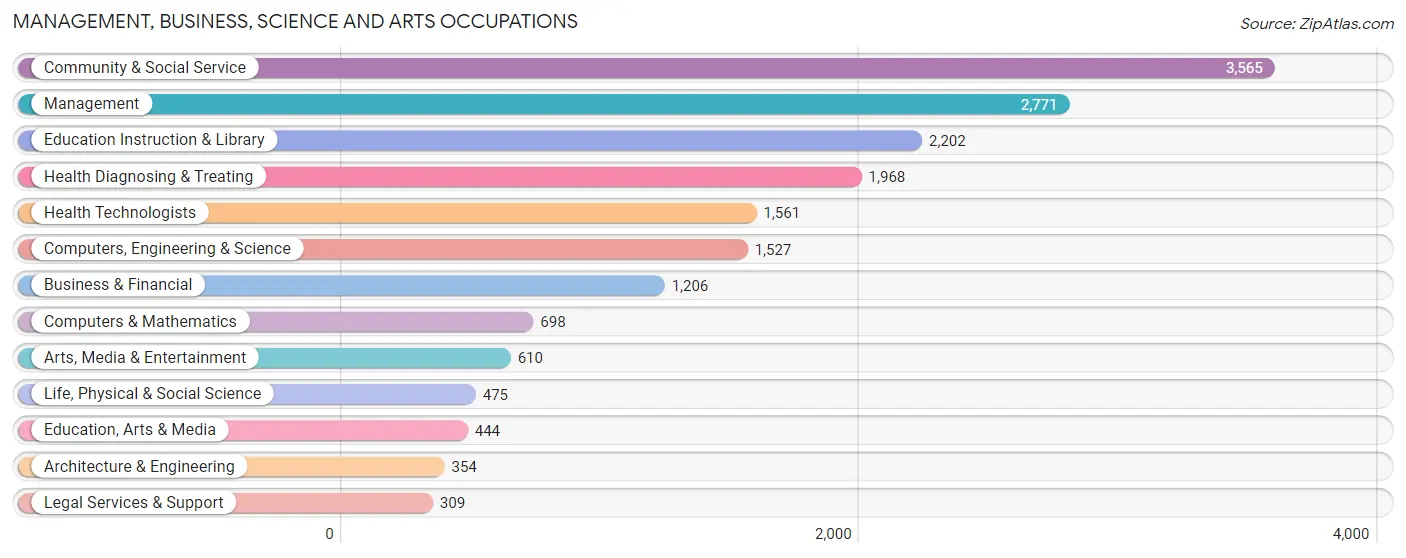
Management, Business, Science and Arts Occupations
The most common Management, Business, Science and Arts occupations in Oconee County are Community & Social Service (3,565 | 17.2%), Management (2,771 | 13.4%), Education Instruction & Library (2,202 | 10.6%), Health Diagnosing & Treating (1,968 | 9.5%), and Health Technologists (1,561 | 7.5%).
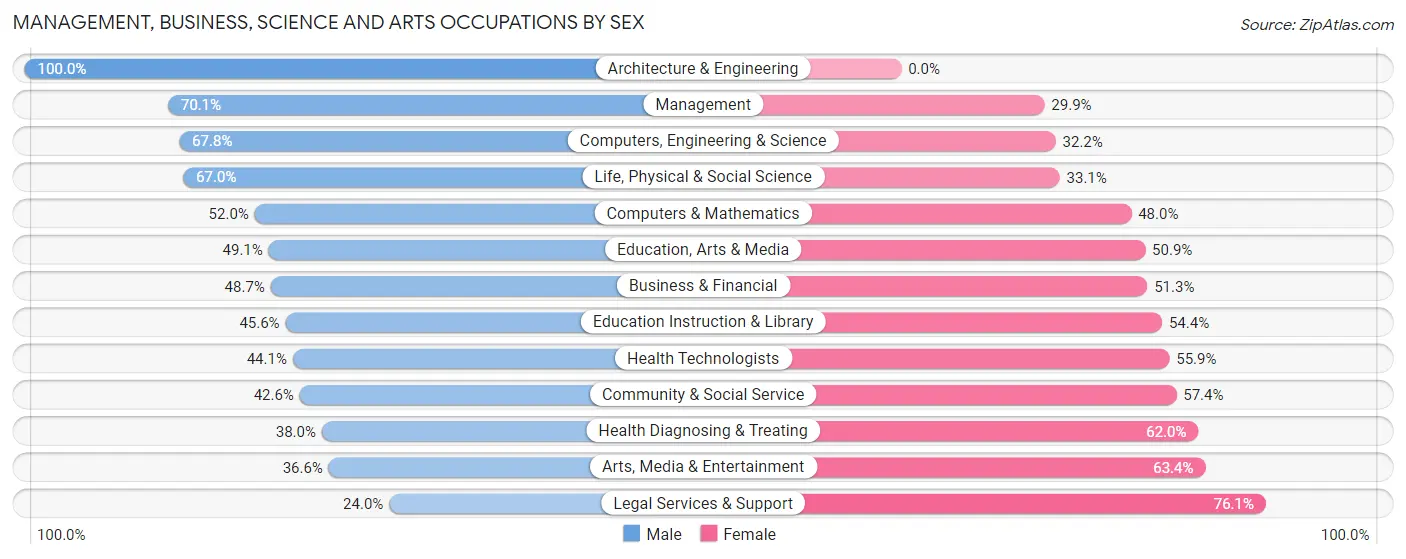
Management, Business, Science and Arts Occupations by Sex
Within the Management, Business, Science and Arts occupations in Oconee County, the most male-oriented occupations are Architecture & Engineering (100.0%), Management (70.1%), and Computers, Engineering & Science (67.8%), while the most female-oriented occupations are Legal Services & Support (76.0%), Arts, Media & Entertainment (63.4%), and Health Diagnosing & Treating (62.0%).
| Occupation | Male | Female |
| Management | 1,943 (70.1%) | 828 (29.9%) |
| Business & Financial | 587 (48.7%) | 619 (51.3%) |
| Computers, Engineering & Science | 1,035 (67.8%) | 492 (32.2%) |
| Computers & Mathematics | 363 (52.0%) | 335 (48.0%) |
| Architecture & Engineering | 354 (100.0%) | 0 (0.0%) |
| Life, Physical & Social Science | 318 (66.9%) | 157 (33.1%) |
| Community & Social Service | 1,519 (42.6%) | 2,046 (57.4%) |
| Education, Arts & Media | 218 (49.1%) | 226 (50.9%) |
| Legal Services & Support | 74 (23.9%) | 235 (76.0%) |
| Education Instruction & Library | 1,004 (45.6%) | 1,198 (54.4%) |
| Arts, Media & Entertainment | 223 (36.6%) | 387 (63.4%) |
| Health Diagnosing & Treating | 748 (38.0%) | 1,220 (62.0%) |
| Health Technologists | 688 (44.1%) | 873 (55.9%) |
| Total (Category) | 5,832 (52.8%) | 5,205 (47.2%) |
| Total (Overall) | 11,124 (53.7%) | 9,578 (46.3%) |
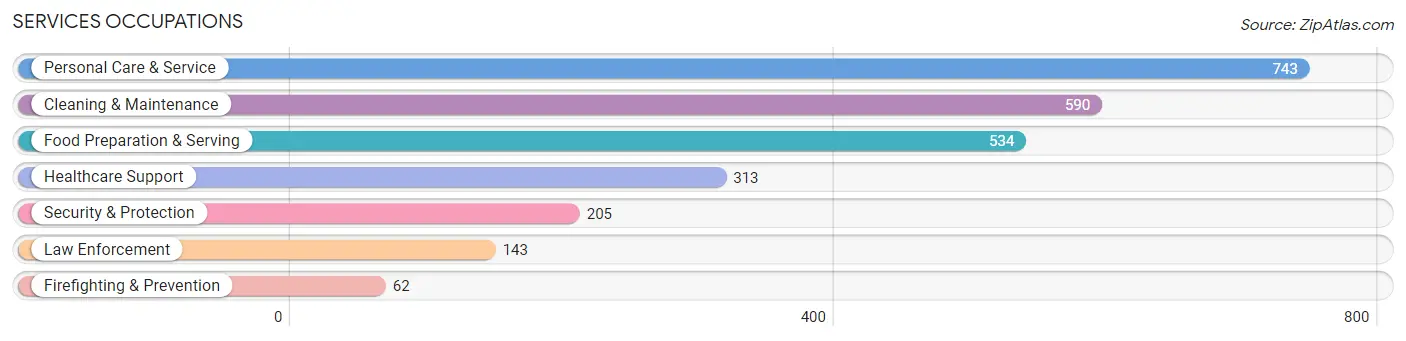
Services Occupations
The most common Services occupations in Oconee County are Personal Care & Service (743 | 3.6%), Cleaning & Maintenance (590 | 2.9%), Food Preparation & Serving (534 | 2.6%), Healthcare Support (313 | 1.5%), and Security & Protection (205 | 1.0%).
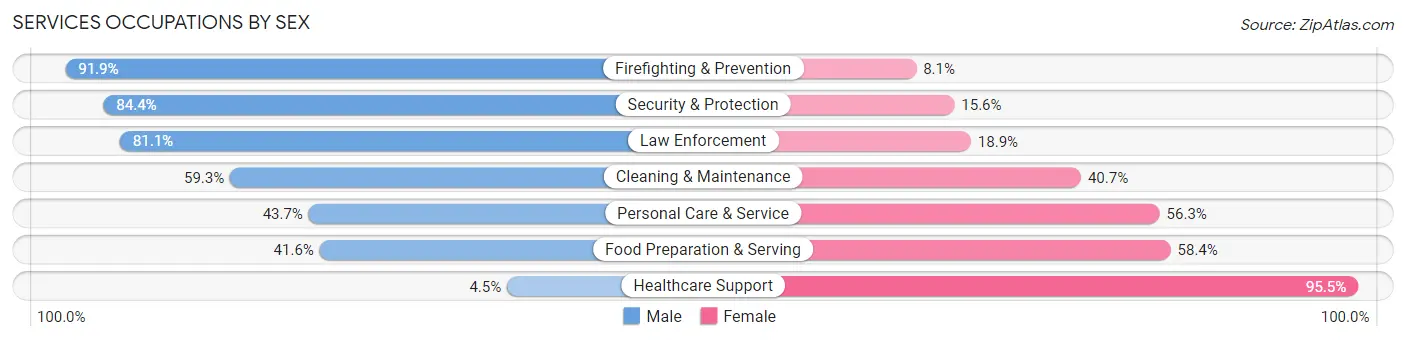
Services Occupations by Sex
Within the Services occupations in Oconee County, the most male-oriented occupations are Firefighting & Prevention (91.9%), Security & Protection (84.4%), and Law Enforcement (81.1%), while the most female-oriented occupations are Healthcare Support (95.5%), Food Preparation & Serving (58.4%), and Personal Care & Service (56.3%).
| Occupation | Male | Female |
| Healthcare Support | 14 (4.5%) | 299 (95.5%) |
| Security & Protection | 173 (84.4%) | 32 (15.6%) |
| Firefighting & Prevention | 57 (91.9%) | 5 (8.1%) |
| Law Enforcement | 116 (81.1%) | 27 (18.9%) |
| Food Preparation & Serving | 222 (41.6%) | 312 (58.4%) |
| Cleaning & Maintenance | 350 (59.3%) | 240 (40.7%) |
| Personal Care & Service | 325 (43.7%) | 418 (56.3%) |
| Total (Category) | 1,084 (45.5%) | 1,301 (54.5%) |
| Total (Overall) | 11,124 (53.7%) | 9,578 (46.3%) |
Sales and Office Occupations
The most common Sales and Office occupations in Oconee County are Sales & Related (2,124 | 10.3%), and Office & Administration (1,896 | 9.2%).

Sales and Office Occupations by Sex

| Occupation | Male | Female |
| Sales & Related | 1,129 (53.1%) | 995 (46.9%) |
| Office & Administration | 458 (24.2%) | 1,438 (75.8%) |
| Total (Category) | 1,587 (39.5%) | 2,433 (60.5%) |
| Total (Overall) | 11,124 (53.7%) | 9,578 (46.3%) |
Natural Resources, Construction and Maintenance Occupations
The most common Natural Resources, Construction and Maintenance occupations in Oconee County are Construction & Extraction (720 | 3.5%), Installation, Maintenance & Repair (444 | 2.1%), and Farming, Fishing & Forestry (177 | 0.9%).
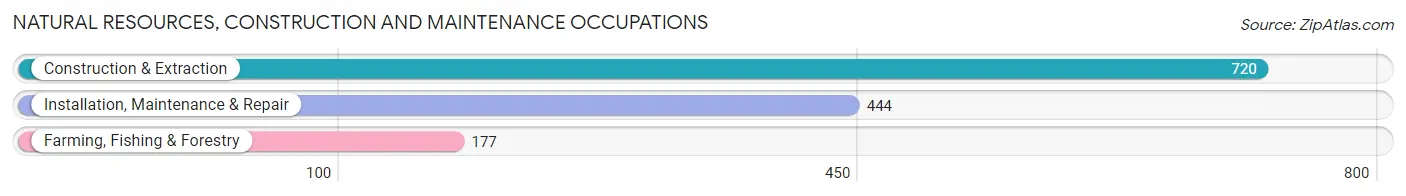
Natural Resources, Construction and Maintenance Occupations by Sex
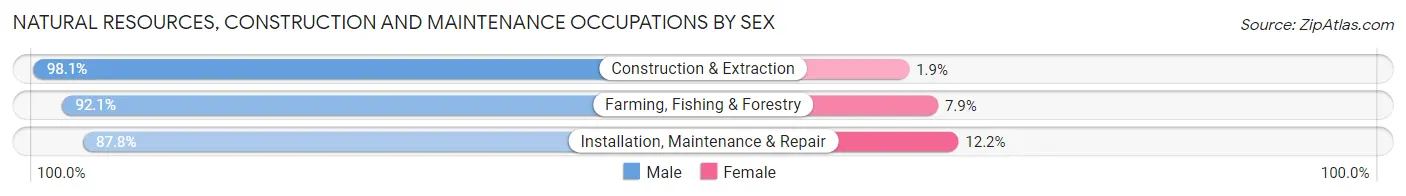
| Occupation | Male | Female |
| Farming, Fishing & Forestry | 163 (92.1%) | 14 (7.9%) |
| Construction & Extraction | 706 (98.1%) | 14 (1.9%) |
| Installation, Maintenance & Repair | 390 (87.8%) | 54 (12.2%) |
| Total (Category) | 1,259 (93.9%) | 82 (6.1%) |
| Total (Overall) | 11,124 (53.7%) | 9,578 (46.3%) |
Production, Transportation and Moving Occupations
The most common Production, Transportation and Moving occupations in Oconee County are Production (1,089 | 5.3%), Transportation (546 | 2.6%), and Material Moving (284 | 1.4%).
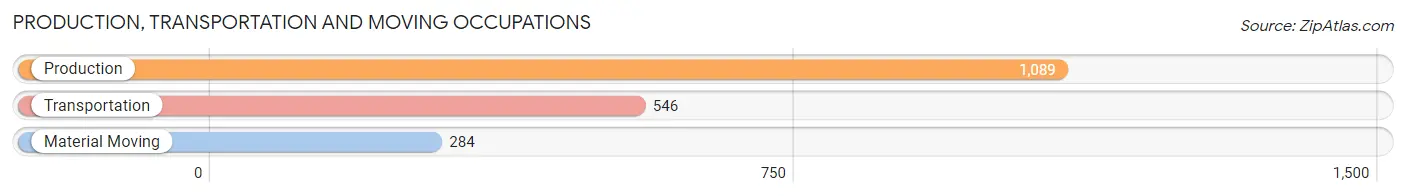
Production, Transportation and Moving Occupations by Sex
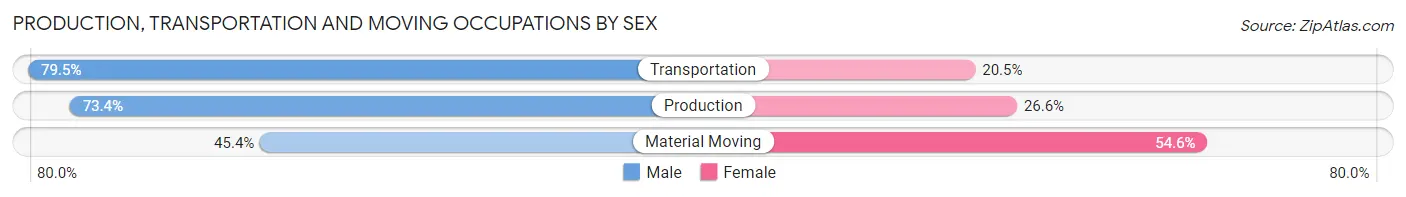
| Occupation | Male | Female |
| Production | 799 (73.4%) | 290 (26.6%) |
| Transportation | 434 (79.5%) | 112 (20.5%) |
| Material Moving | 129 (45.4%) | 155 (54.6%) |
| Total (Category) | 1,362 (71.0%) | 557 (29.0%) |
| Total (Overall) | 11,124 (53.7%) | 9,578 (46.3%) |
Employment Industries by Sex in Oconee County
Employment Industries in Oconee County
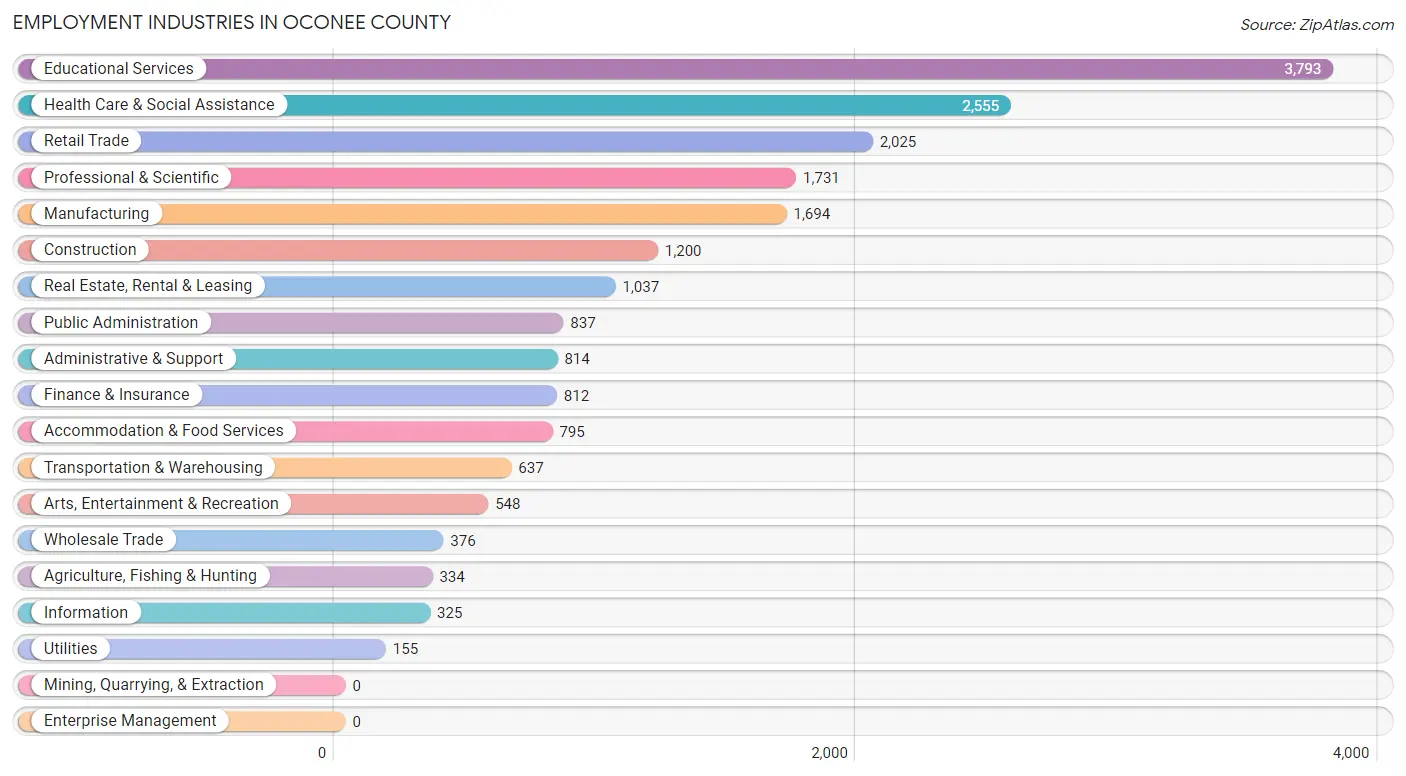
The major employment industries in Oconee County include Educational Services (3,793 | 18.3%), Health Care & Social Assistance (2,555 | 12.3%), Retail Trade (2,025 | 9.8%), Professional & Scientific (1,731 | 8.4%), and Manufacturing (1,694 | 8.2%).
Employment Industries by Sex in Oconee County
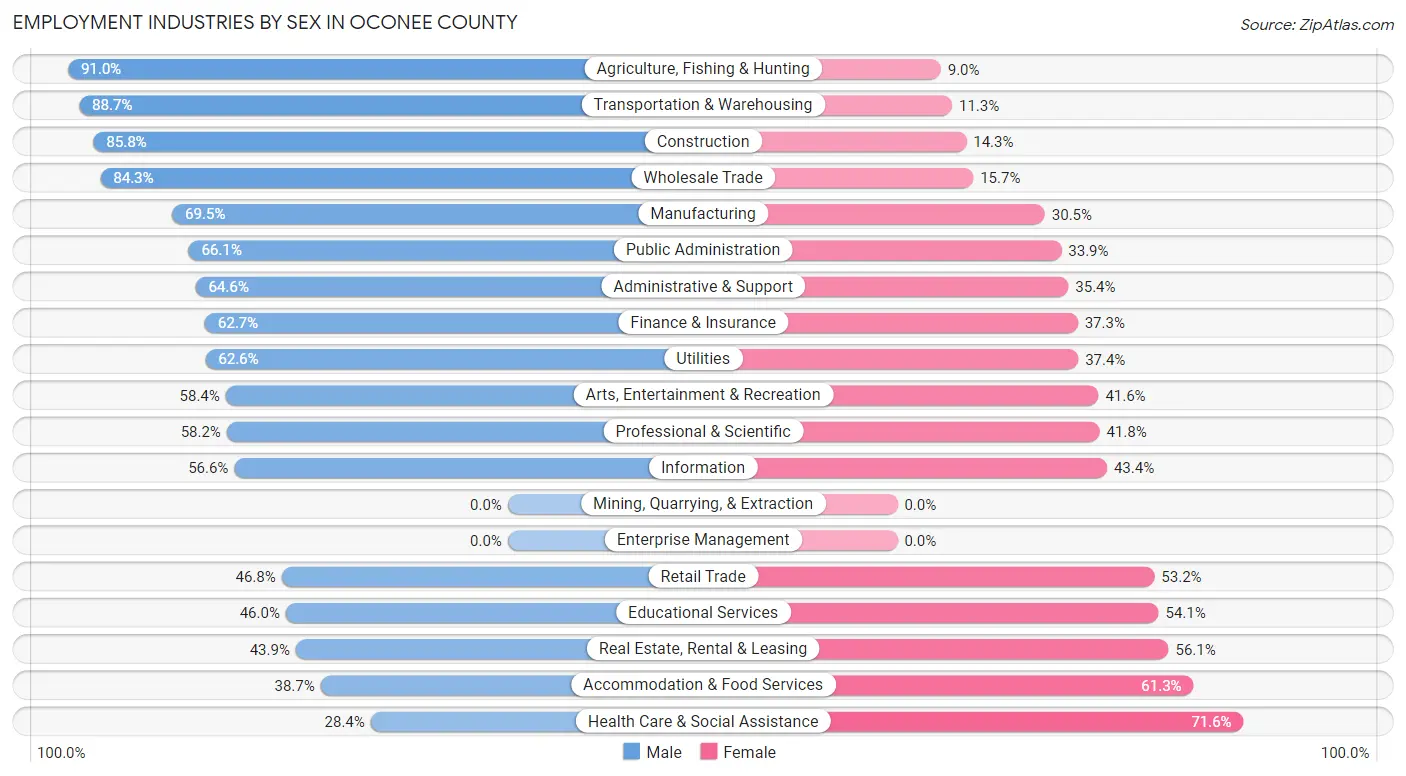
The Oconee County industries that see more men than women are Agriculture, Fishing & Hunting (91.0%), Transportation & Warehousing (88.7%), and Construction (85.8%), whereas the industries that tend to have a higher number of women are Health Care & Social Assistance (71.6%), Accommodation & Food Services (61.3%), and Real Estate, Rental & Leasing (56.1%).
| Industry | Male | Female |
| Agriculture, Fishing & Hunting | 304 (91.0%) | 30 (9.0%) |
| Mining, Quarrying, & Extraction | 0 (0.0%) | 0 (0.0%) |
| Construction | 1,029 (85.8%) | 171 (14.2%) |
| Manufacturing | 1,177 (69.5%) | 517 (30.5%) |
| Wholesale Trade | 317 (84.3%) | 59 (15.7%) |
| Retail Trade | 948 (46.8%) | 1,077 (53.2%) |
| Transportation & Warehousing | 565 (88.7%) | 72 (11.3%) |
| Utilities | 97 (62.6%) | 58 (37.4%) |
| Information | 184 (56.6%) | 141 (43.4%) |
| Finance & Insurance | 509 (62.7%) | 303 (37.3%) |
| Real Estate, Rental & Leasing | 455 (43.9%) | 582 (56.1%) |
| Professional & Scientific | 1,007 (58.2%) | 724 (41.8%) |
| Enterprise Management | 0 (0.0%) | 0 (0.0%) |
| Administrative & Support | 526 (64.6%) | 288 (35.4%) |
| Educational Services | 1,743 (46.0%) | 2,050 (54.0%) |
| Health Care & Social Assistance | 725 (28.4%) | 1,830 (71.6%) |
| Arts, Entertainment & Recreation | 320 (58.4%) | 228 (41.6%) |
| Accommodation & Food Services | 308 (38.7%) | 487 (61.3%) |
| Public Administration | 553 (66.1%) | 284 (33.9%) |
| Total | 11,124 (53.7%) | 9,578 (46.3%) |
Education in Oconee County
School Enrollment in Oconee County
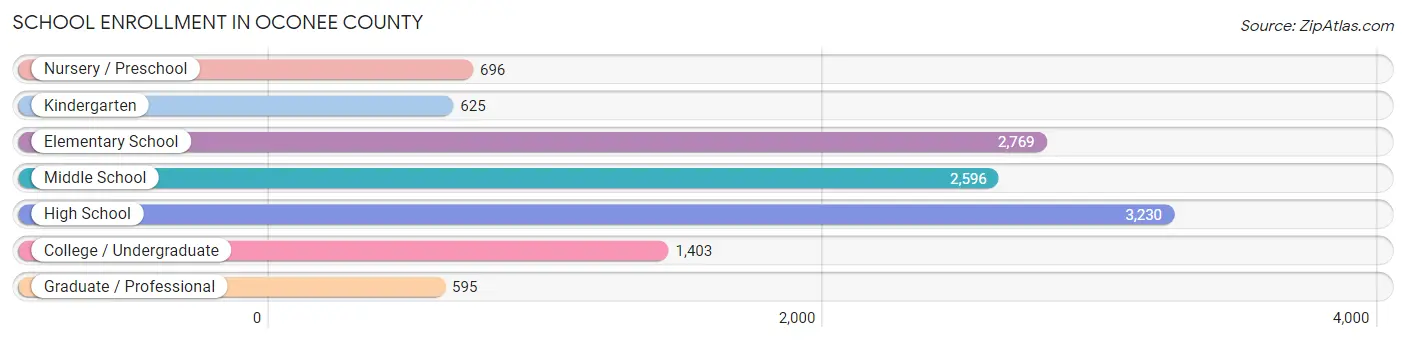
The most common levels of schooling among the 11,914 students in Oconee County are high school (3,230 | 27.1%), elementary school (2,769 | 23.2%), and middle school (2,596 | 21.8%).
| School Level | # Students | % Students |
| Nursery / Preschool | 696 | 5.8% |
| Kindergarten | 625 | 5.2% |
| Elementary School | 2,769 | 23.2% |
| Middle School | 2,596 | 21.8% |
| High School | 3,230 | 27.1% |
| College / Undergraduate | 1,403 | 11.8% |
| Graduate / Professional | 595 | 5.0% |
| Total | 11,914 | 100.0% |
School Enrollment by Age by Funding Source in Oconee County
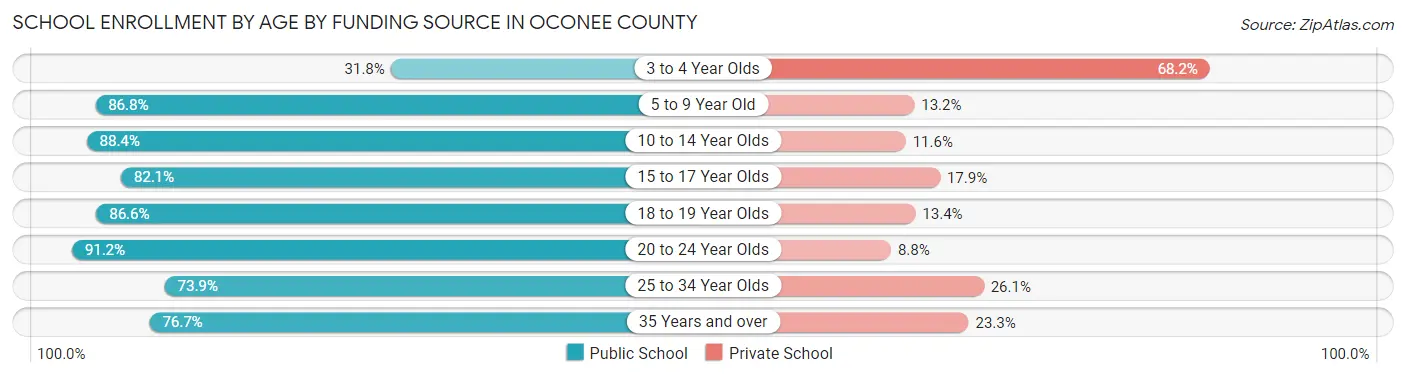
Out of a total of 11,914 students who are enrolled in schools in Oconee County, 1,954 (16.4%) attend a private institution, while the remaining 9,960 (83.6%) are enrolled in public schools. The age group of 3 to 4 year olds has the highest likelihood of being enrolled in private schools, with 332 (68.2% in the age bracket) enrolled. Conversely, the age group of 20 to 24 year olds has the lowest likelihood of being enrolled in a private school, with 818 (91.2% in the age bracket) attending a public institution.
| Age Bracket | Public School | Private School |
| 3 to 4 Year Olds | 155 (31.8%) | 332 (68.2%) |
| 5 to 9 Year Old | 2,752 (86.8%) | 417 (13.2%) |
| 10 to 14 Year Olds | 2,922 (88.4%) | 382 (11.6%) |
| 15 to 17 Year Olds | 1,885 (82.1%) | 412 (17.9%) |
| 18 to 19 Year Olds | 759 (86.6%) | 117 (13.4%) |
| 20 to 24 Year Olds | 818 (91.2%) | 79 (8.8%) |
| 25 to 34 Year Olds | 272 (73.9%) | 96 (26.1%) |
| 35 Years and over | 396 (76.7%) | 120 (23.3%) |
| Total | 9,960 (83.6%) | 1,954 (16.4%) |
Educational Attainment by Field of Study in Oconee County
Business (3,004 | 19.2%), education (2,338 | 14.9%), bio, nature & agricultural (1,944 | 12.4%), science & technology (1,391 | 8.9%), and arts & humanities (1,382 | 8.8%) are the most common fields of study among 15,687 individuals in Oconee County who have obtained a bachelor's degree or higher.
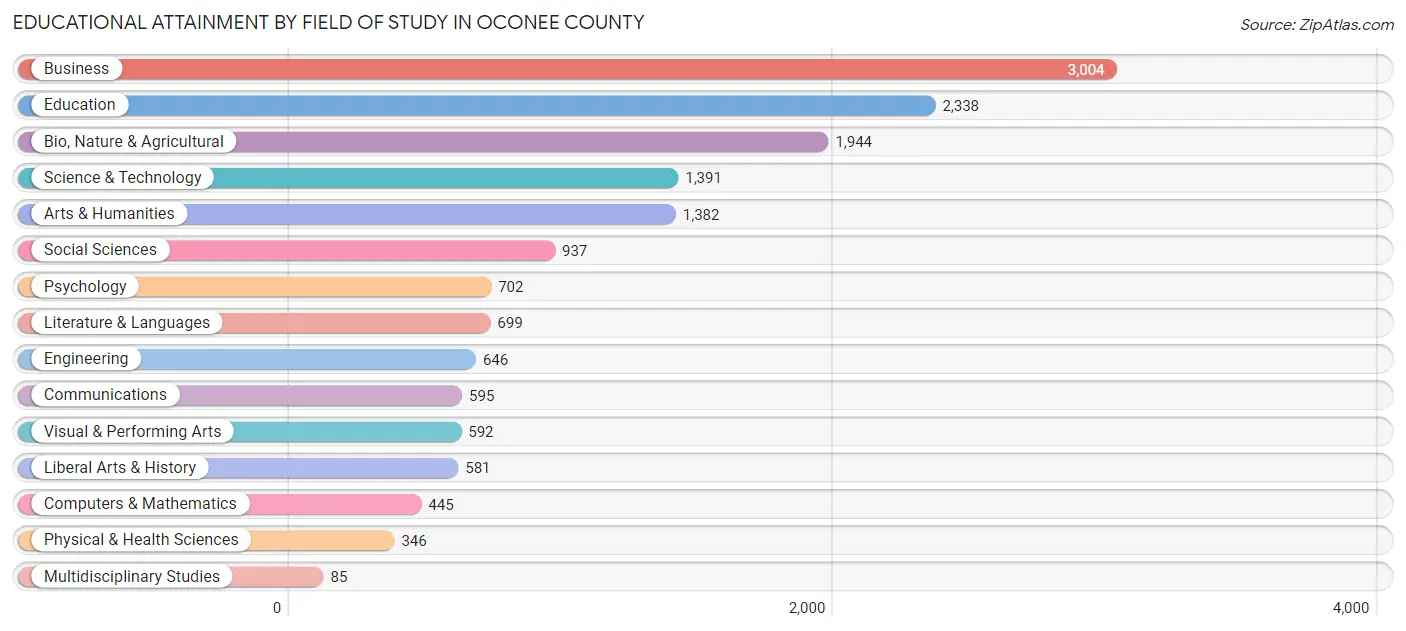
| Field of Study | # Graduates | % Graduates |
| Computers & Mathematics | 445 | 2.8% |
| Bio, Nature & Agricultural | 1,944 | 12.4% |
| Physical & Health Sciences | 346 | 2.2% |
| Psychology | 702 | 4.5% |
| Social Sciences | 937 | 6.0% |
| Engineering | 646 | 4.1% |
| Multidisciplinary Studies | 85 | 0.5% |
| Science & Technology | 1,391 | 8.9% |
| Business | 3,004 | 19.2% |
| Education | 2,338 | 14.9% |
| Literature & Languages | 699 | 4.5% |
| Liberal Arts & History | 581 | 3.7% |
| Visual & Performing Arts | 592 | 3.8% |
| Communications | 595 | 3.8% |
| Arts & Humanities | 1,382 | 8.8% |
| Total | 15,687 | 100.0% |
Transportation & Commute in Oconee County
Vehicle Availability by Sex in Oconee County
The most prevalent vehicle ownership categories in Oconee County are males with 2 vehicles (4,812, accounting for 43.4%) and females with 2 vehicles (4,038, making up 51.3%).
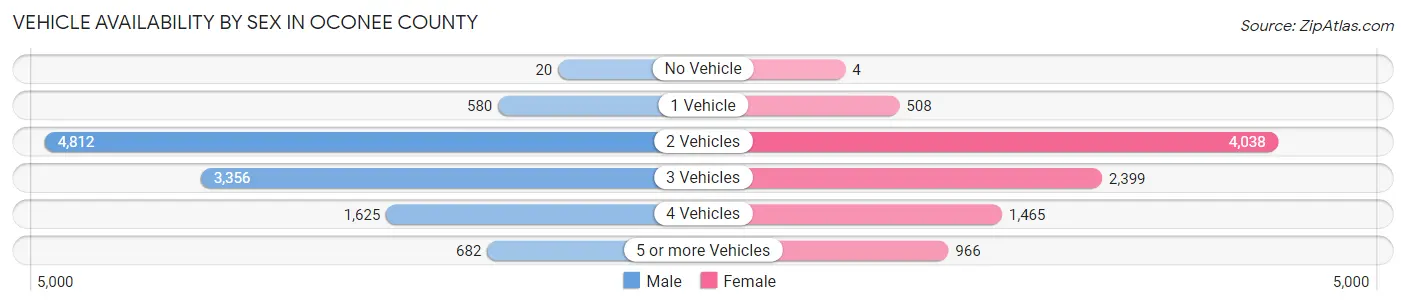
| Vehicles Available | Male | Female |
| No Vehicle | 20 (0.2%) | 4 (0.0%) |
| 1 Vehicle | 580 (5.2%) | 508 (5.4%) |
| 2 Vehicles | 4,812 (43.4%) | 4,038 (43.0%) |
| 3 Vehicles | 3,356 (30.3%) | 2,399 (25.6%) |
| 4 Vehicles | 1,625 (14.7%) | 1,465 (15.6%) |
| 5 or more Vehicles | 682 (6.2%) | 966 (10.3%) |
| Total | 11,075 (100.0%) | 9,380 (100.0%) |
Commute Time in Oconee County
The most frequently occuring commute durations in Oconee County are 20 to 24 minutes (4,487 commuters, 26.2%), 15 to 19 minutes (3,917 commuters, 22.8%), and 10 to 14 minutes (1,844 commuters, 10.7%).
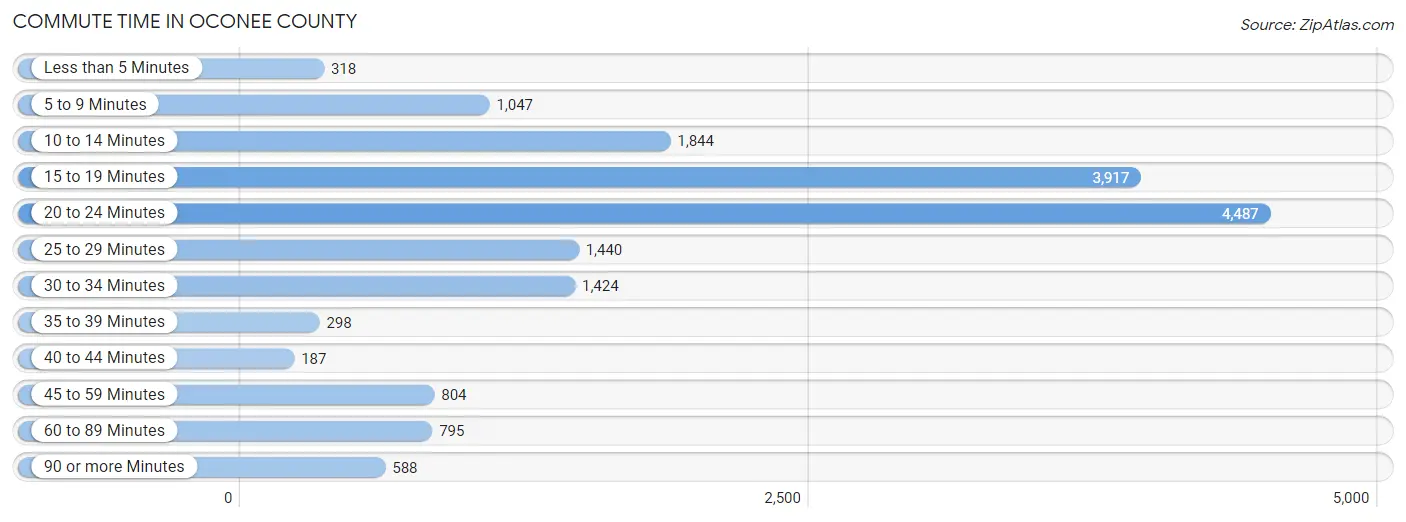
| Commute Time | # Commuters | % Commuters |
| Less than 5 Minutes | 318 | 1.8% |
| 5 to 9 Minutes | 1,047 | 6.1% |
| 10 to 14 Minutes | 1,844 | 10.7% |
| 15 to 19 Minutes | 3,917 | 22.8% |
| 20 to 24 Minutes | 4,487 | 26.2% |
| 25 to 29 Minutes | 1,440 | 8.4% |
| 30 to 34 Minutes | 1,424 | 8.3% |
| 35 to 39 Minutes | 298 | 1.7% |
| 40 to 44 Minutes | 187 | 1.1% |
| 45 to 59 Minutes | 804 | 4.7% |
| 60 to 89 Minutes | 795 | 4.6% |
| 90 or more Minutes | 588 | 3.4% |
Commute Time by Sex in Oconee County
The most common commute times in Oconee County are 20 to 24 minutes (2,346 commuters, 25.9%) for males and 20 to 24 minutes (2,141 commuters, 26.5%) for females.
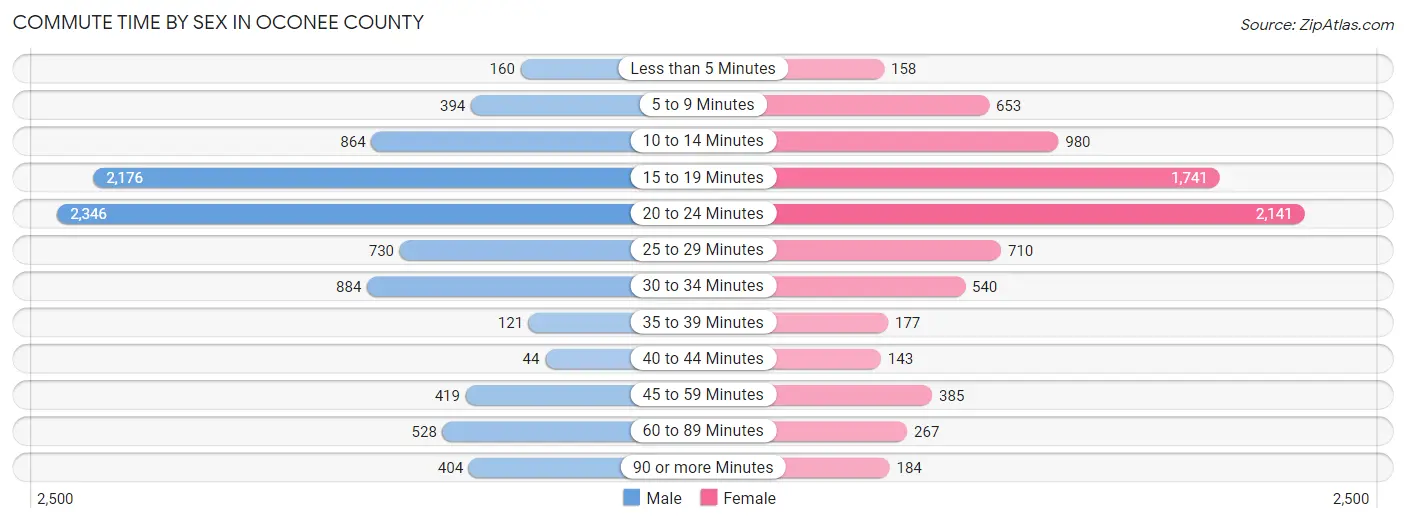
| Commute Time | Male | Female |
| Less than 5 Minutes | 160 (1.8%) | 158 (2.0%) |
| 5 to 9 Minutes | 394 (4.3%) | 653 (8.1%) |
| 10 to 14 Minutes | 864 (9.5%) | 980 (12.1%) |
| 15 to 19 Minutes | 2,176 (24.0%) | 1,741 (21.5%) |
| 20 to 24 Minutes | 2,346 (25.9%) | 2,141 (26.5%) |
| 25 to 29 Minutes | 730 (8.1%) | 710 (8.8%) |
| 30 to 34 Minutes | 884 (9.8%) | 540 (6.7%) |
| 35 to 39 Minutes | 121 (1.3%) | 177 (2.2%) |
| 40 to 44 Minutes | 44 (0.5%) | 143 (1.8%) |
| 45 to 59 Minutes | 419 (4.6%) | 385 (4.8%) |
| 60 to 89 Minutes | 528 (5.8%) | 267 (3.3%) |
| 90 or more Minutes | 404 (4.4%) | 184 (2.3%) |
Time of Departure to Work by Sex in Oconee County
The most frequent times of departure to work in Oconee County are 7:30 AM to 7:59 AM (2,201, 24.3%) for males and 7:30 AM to 7:59 AM (1,379, 17.1%) for females.
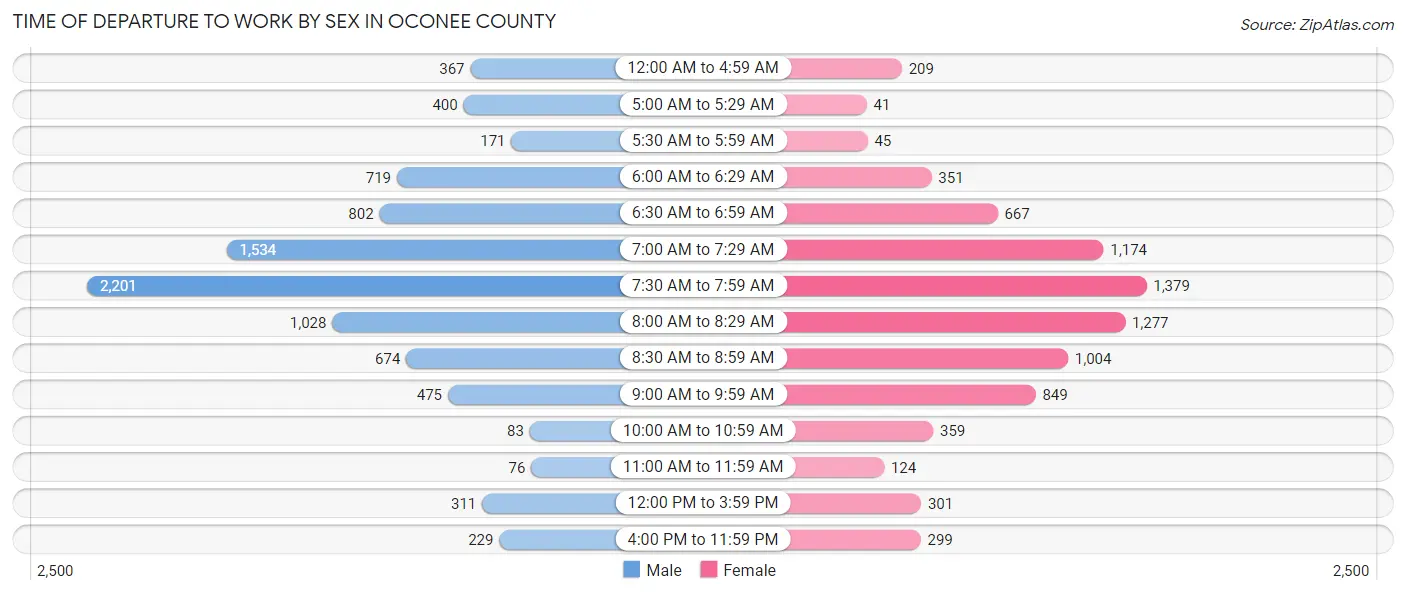
| Time of Departure | Male | Female |
| 12:00 AM to 4:59 AM | 367 (4.1%) | 209 (2.6%) |
| 5:00 AM to 5:29 AM | 400 (4.4%) | 41 (0.5%) |
| 5:30 AM to 5:59 AM | 171 (1.9%) | 45 (0.6%) |
| 6:00 AM to 6:29 AM | 719 (7.9%) | 351 (4.3%) |
| 6:30 AM to 6:59 AM | 802 (8.8%) | 667 (8.3%) |
| 7:00 AM to 7:29 AM | 1,534 (16.9%) | 1,174 (14.5%) |
| 7:30 AM to 7:59 AM | 2,201 (24.3%) | 1,379 (17.1%) |
| 8:00 AM to 8:29 AM | 1,028 (11.3%) | 1,277 (15.8%) |
| 8:30 AM to 8:59 AM | 674 (7.4%) | 1,004 (12.4%) |
| 9:00 AM to 9:59 AM | 475 (5.2%) | 849 (10.5%) |
| 10:00 AM to 10:59 AM | 83 (0.9%) | 359 (4.4%) |
| 11:00 AM to 11:59 AM | 76 (0.8%) | 124 (1.5%) |
| 12:00 PM to 3:59 PM | 311 (3.4%) | 301 (3.7%) |
| 4:00 PM to 11:59 PM | 229 (2.5%) | 299 (3.7%) |
| Total | 9,070 (100.0%) | 8,079 (100.0%) |
Housing Occupancy in Oconee County
Occupancy by Ownership in Oconee County
Of the total 14,330 dwellings in Oconee County, owner-occupied units account for 11,977 (83.6%), while renter-occupied units make up 2,353 (16.4%).
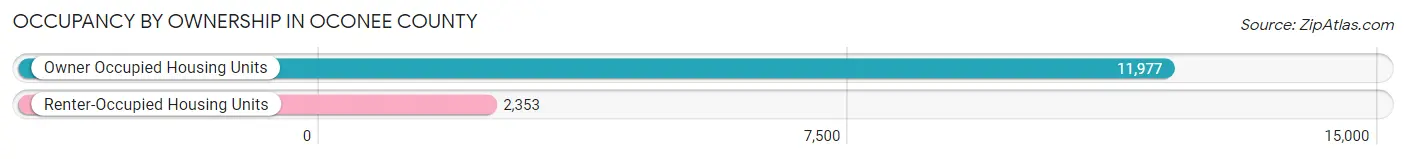
| Occupancy | # Housing Units | % Housing Units |
| Owner Occupied Housing Units | 11,977 | 83.6% |
| Renter-Occupied Housing Units | 2,353 | 16.4% |
| Total Occupied Housing Units | 14,330 | 100.0% |
Occupancy by Household Size in Oconee County
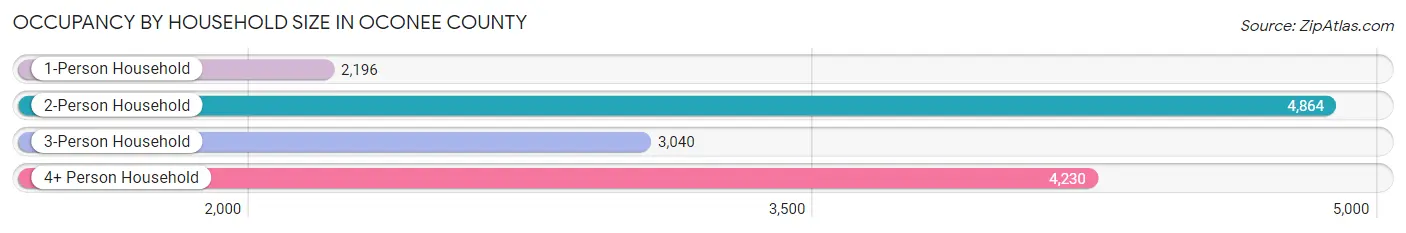
| Household Size | # Housing Units | % Housing Units |
| 1-Person Household | 2,196 | 15.3% |
| 2-Person Household | 4,864 | 33.9% |
| 3-Person Household | 3,040 | 21.2% |
| 4+ Person Household | 4,230 | 29.5% |
| Total Housing Units | 14,330 | 100.0% |
Occupancy by Ownership by Household Size in Oconee County
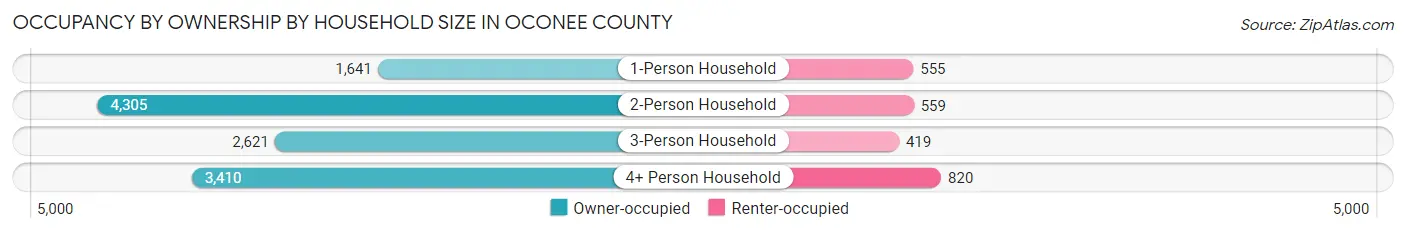
| Household Size | Owner-occupied | Renter-occupied |
| 1-Person Household | 1,641 (74.7%) | 555 (25.3%) |
| 2-Person Household | 4,305 (88.5%) | 559 (11.5%) |
| 3-Person Household | 2,621 (86.2%) | 419 (13.8%) |
| 4+ Person Household | 3,410 (80.6%) | 820 (19.4%) |
| Total Housing Units | 11,977 (83.6%) | 2,353 (16.4%) |
Occupancy by Educational Attainment in Oconee County
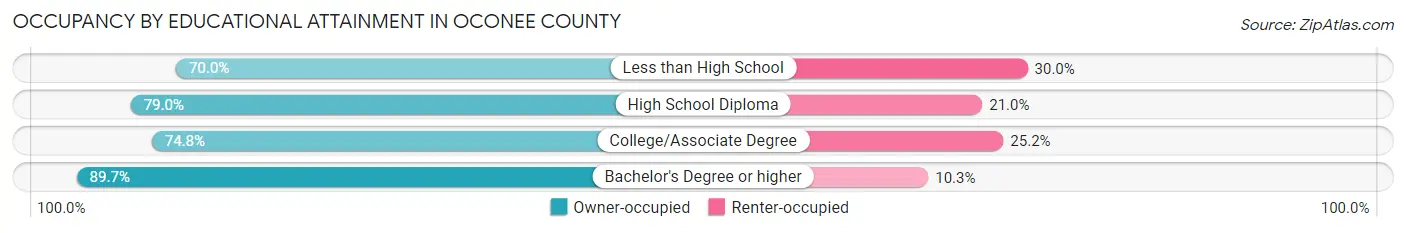
| Household Size | Owner-occupied | Renter-occupied |
| Less than High School | 324 (70.0%) | 139 (30.0%) |
| High School Diploma | 1,310 (79.0%) | 349 (21.0%) |
| College/Associate Degree | 3,029 (74.8%) | 1,022 (25.2%) |
| Bachelor's Degree or higher | 7,314 (89.7%) | 843 (10.3%) |
Occupancy by Age of Householder in Oconee County
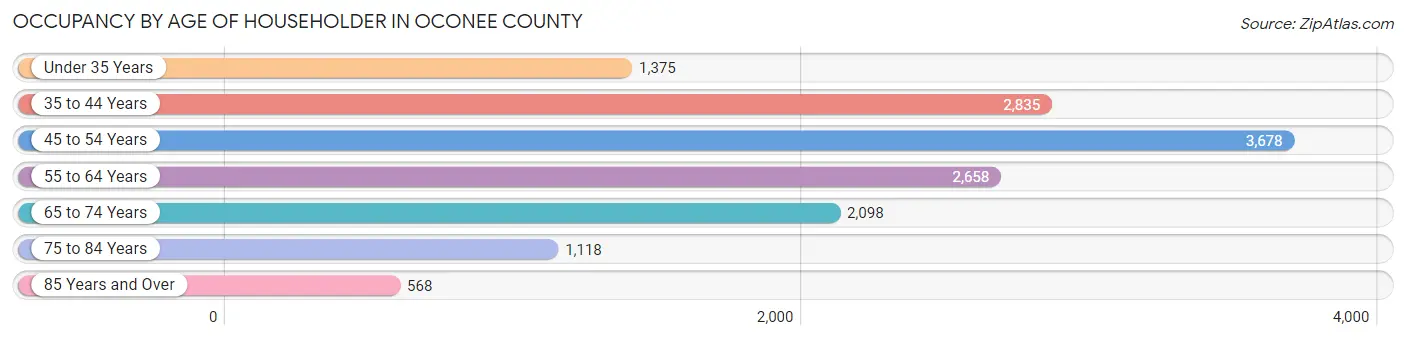
| Age Bracket | # Households | % Households |
| Under 35 Years | 1,375 | 9.6% |
| 35 to 44 Years | 2,835 | 19.8% |
| 45 to 54 Years | 3,678 | 25.7% |
| 55 to 64 Years | 2,658 | 18.5% |
| 65 to 74 Years | 2,098 | 14.6% |
| 75 to 84 Years | 1,118 | 7.8% |
| 85 Years and Over | 568 | 4.0% |
| Total | 14,330 | 100.0% |
Housing Finances in Oconee County
Median Income by Occupancy in Oconee County
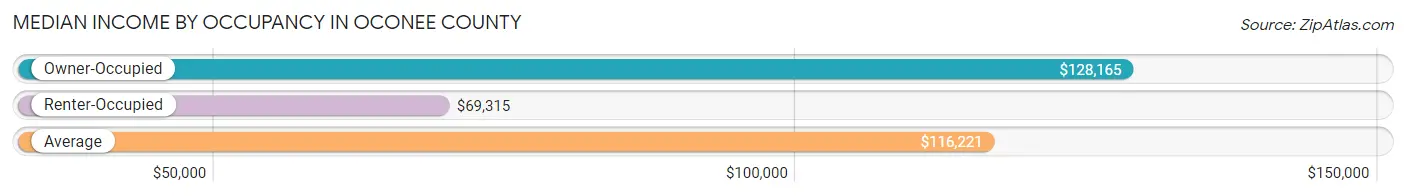
| Occupancy Type | # Households | Median Income |
| Owner-Occupied | 11,977 (83.6%) | $128,165 |
| Renter-Occupied | 2,353 (16.4%) | $69,315 |
| Average | 14,330 (100.0%) | $116,221 |
Occupancy by Householder Income Bracket in Oconee County
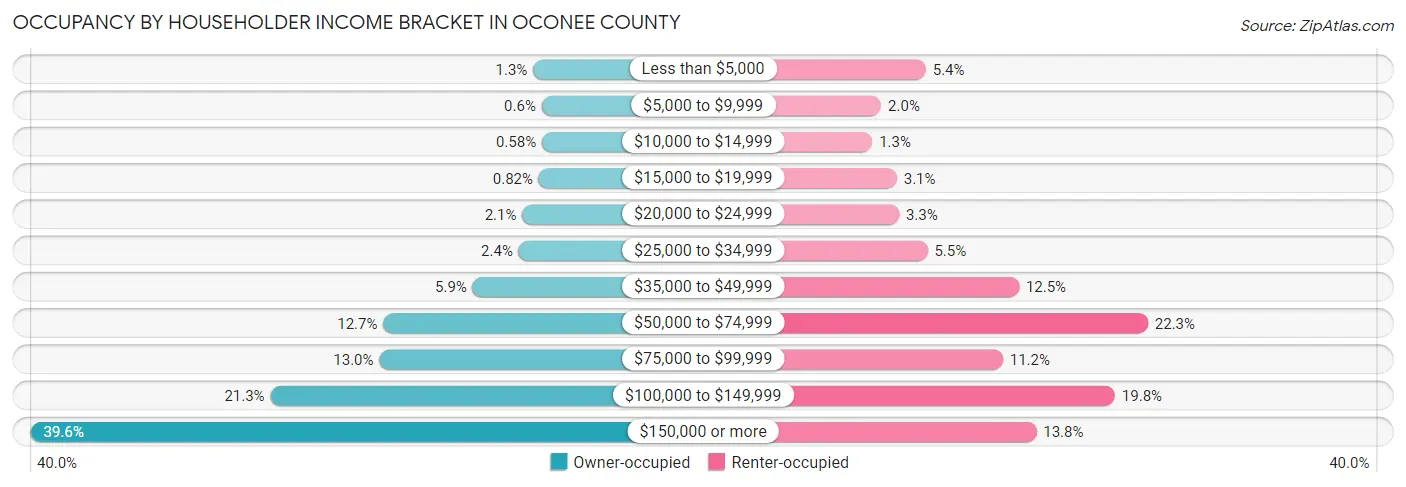
| Income Bracket | Owner-occupied | Renter-occupied |
| Less than $5,000 | 150 (1.3%) | 126 (5.3%) |
| $5,000 to $9,999 | 72 (0.6%) | 46 (1.9%) |
| $10,000 to $14,999 | 69 (0.6%) | 30 (1.3%) |
| $15,000 to $19,999 | 98 (0.8%) | 74 (3.1%) |
| $20,000 to $24,999 | 249 (2.1%) | 78 (3.3%) |
| $25,000 to $34,999 | 281 (2.4%) | 129 (5.5%) |
| $35,000 to $49,999 | 702 (5.9%) | 293 (12.4%) |
| $50,000 to $74,999 | 1,517 (12.7%) | 524 (22.3%) |
| $75,000 to $99,999 | 1,554 (13.0%) | 264 (11.2%) |
| $100,000 to $149,999 | 2,548 (21.3%) | 465 (19.8%) |
| $150,000 or more | 4,737 (39.6%) | 324 (13.8%) |
| Total | 11,977 (100.0%) | 2,353 (100.0%) |
Monthly Housing Cost Tiers in Oconee County
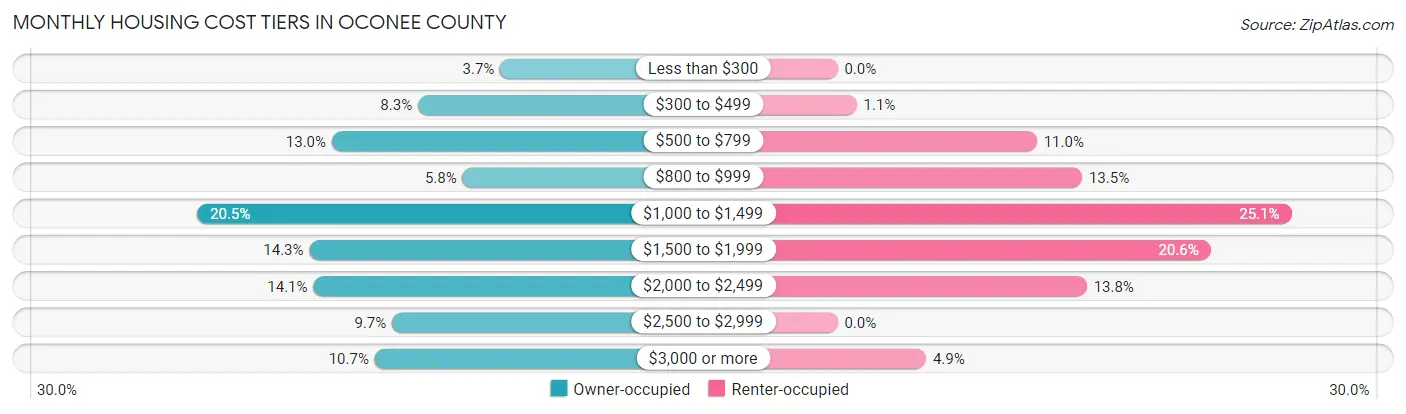
| Monthly Cost | Owner-occupied | Renter-occupied |
| Less than $300 | 447 (3.7%) | 0 (0.0%) |
| $300 to $499 | 990 (8.3%) | 25 (1.1%) |
| $500 to $799 | 1,561 (13.0%) | 259 (11.0%) |
| $800 to $999 | 696 (5.8%) | 318 (13.5%) |
| $1,000 to $1,499 | 2,452 (20.5%) | 590 (25.1%) |
| $1,500 to $1,999 | 1,709 (14.3%) | 485 (20.6%) |
| $2,000 to $2,499 | 1,683 (14.1%) | 324 (13.8%) |
| $2,500 to $2,999 | 1,162 (9.7%) | 0 (0.0%) |
| $3,000 or more | 1,277 (10.7%) | 115 (4.9%) |
| Total | 11,977 (100.0%) | 2,353 (100.0%) |
Physical Housing Characteristics in Oconee County
Housing Structures in Oconee County
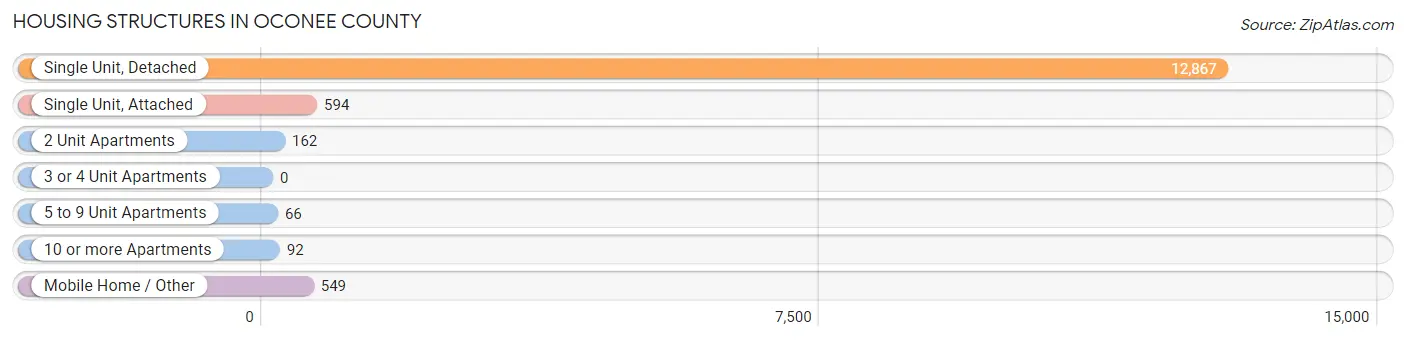
| Structure Type | # Housing Units | % Housing Units |
| Single Unit, Detached | 12,867 | 89.8% |
| Single Unit, Attached | 594 | 4.2% |
| 2 Unit Apartments | 162 | 1.1% |
| 3 or 4 Unit Apartments | 0 | 0.0% |
| 5 to 9 Unit Apartments | 66 | 0.5% |
| 10 or more Apartments | 92 | 0.6% |
| Mobile Home / Other | 549 | 3.8% |
| Total | 14,330 | 100.0% |
Housing Structures by Occupancy in Oconee County
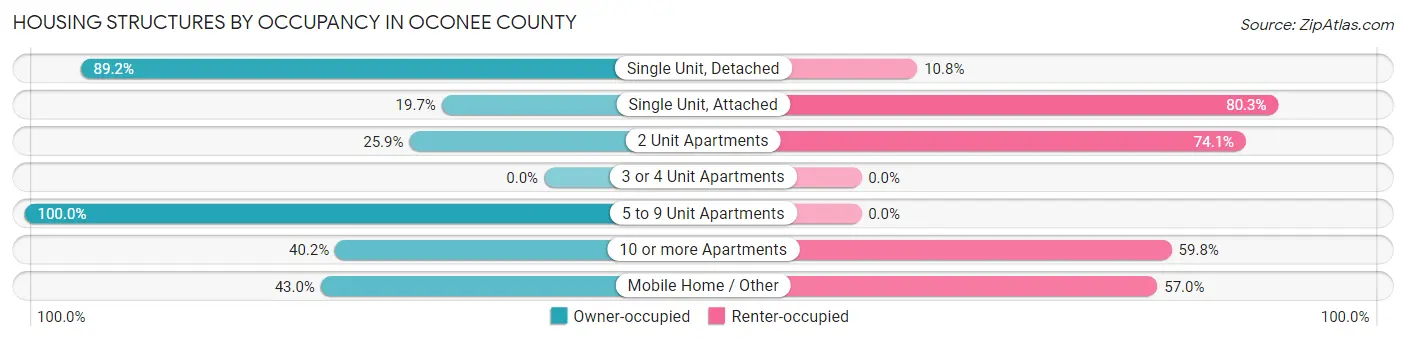
| Structure Type | Owner-occupied | Renter-occupied |
| Single Unit, Detached | 11,479 (89.2%) | 1,388 (10.8%) |
| Single Unit, Attached | 117 (19.7%) | 477 (80.3%) |
| 2 Unit Apartments | 42 (25.9%) | 120 (74.1%) |
| 3 or 4 Unit Apartments | 0 (0.0%) | 0 (0.0%) |
| 5 to 9 Unit Apartments | 66 (100.0%) | 0 (0.0%) |
| 10 or more Apartments | 37 (40.2%) | 55 (59.8%) |
| Mobile Home / Other | 236 (43.0%) | 313 (57.0%) |
| Total | 11,977 (83.6%) | 2,353 (16.4%) |
Housing Structures by Number of Rooms in Oconee County
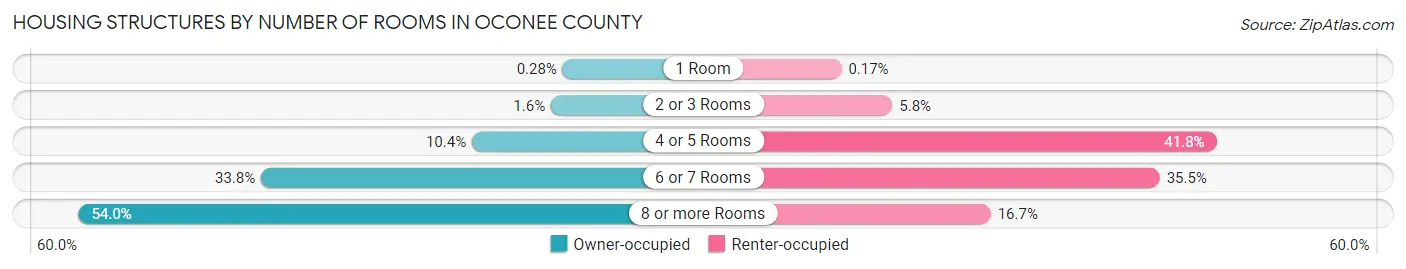
| Number of Rooms | Owner-occupied | Renter-occupied |
| 1 Room | 34 (0.3%) | 4 (0.2%) |
| 2 or 3 Rooms | 189 (1.6%) | 137 (5.8%) |
| 4 or 5 Rooms | 1,240 (10.3%) | 983 (41.8%) |
| 6 or 7 Rooms | 4,044 (33.8%) | 835 (35.5%) |
| 8 or more Rooms | 6,470 (54.0%) | 394 (16.7%) |
| Total | 11,977 (100.0%) | 2,353 (100.0%) |
Housing Structure by Heating Type in Oconee County
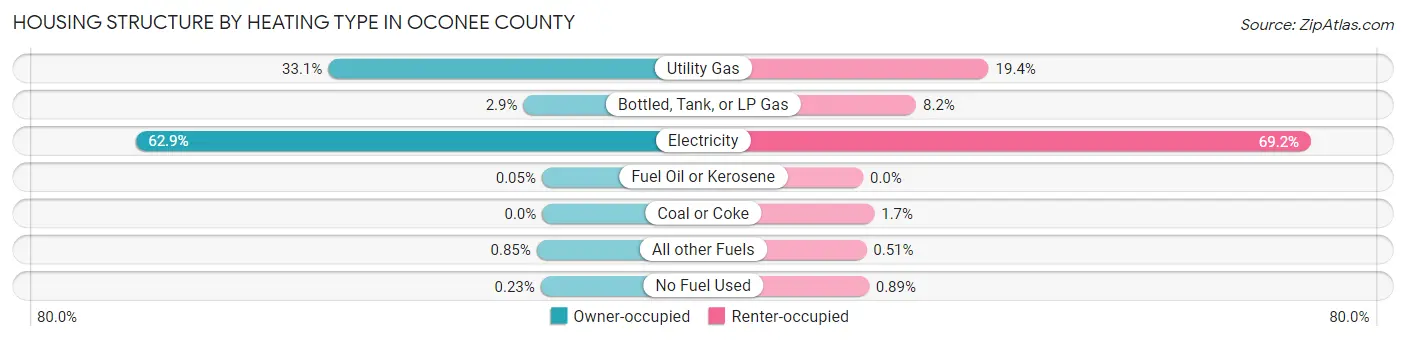
| Heating Type | Owner-occupied | Renter-occupied |
| Utility Gas | 3,962 (33.1%) | 457 (19.4%) |
| Bottled, Tank, or LP Gas | 348 (2.9%) | 193 (8.2%) |
| Electricity | 7,531 (62.9%) | 1,629 (69.2%) |
| Fuel Oil or Kerosene | 6 (0.1%) | 0 (0.0%) |
| Coal or Coke | 0 (0.0%) | 41 (1.7%) |
| All other Fuels | 102 (0.9%) | 12 (0.5%) |
| No Fuel Used | 28 (0.2%) | 21 (0.9%) |
| Total | 11,977 (100.0%) | 2,353 (100.0%) |
Household Vehicle Usage in Oconee County
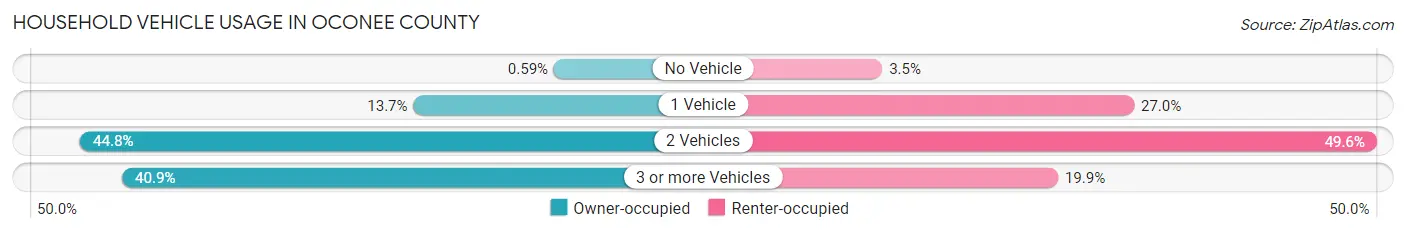
| Vehicles per Household | Owner-occupied | Renter-occupied |
| No Vehicle | 71 (0.6%) | 82 (3.5%) |
| 1 Vehicle | 1,642 (13.7%) | 635 (27.0%) |
| 2 Vehicles | 5,367 (44.8%) | 1,168 (49.6%) |
| 3 or more Vehicles | 4,897 (40.9%) | 468 (19.9%) |
| Total | 11,977 (100.0%) | 2,353 (100.0%) |
Real Estate & Mortgages in Oconee County
Real Estate and Mortgage Overview in Oconee County
| Characteristic | Without Mortgage | With Mortgage |
| Housing Units | 4,056 | 7,921 |
| Median Property Value | $380,200 | $393,000 |
| Median Household Income | $92,174 | $3,444 |
| Monthly Housing Costs | $606 | $1,225 |
| Real Estate Taxes | $2,633 | $75 |
Property Value by Mortgage Status in Oconee County
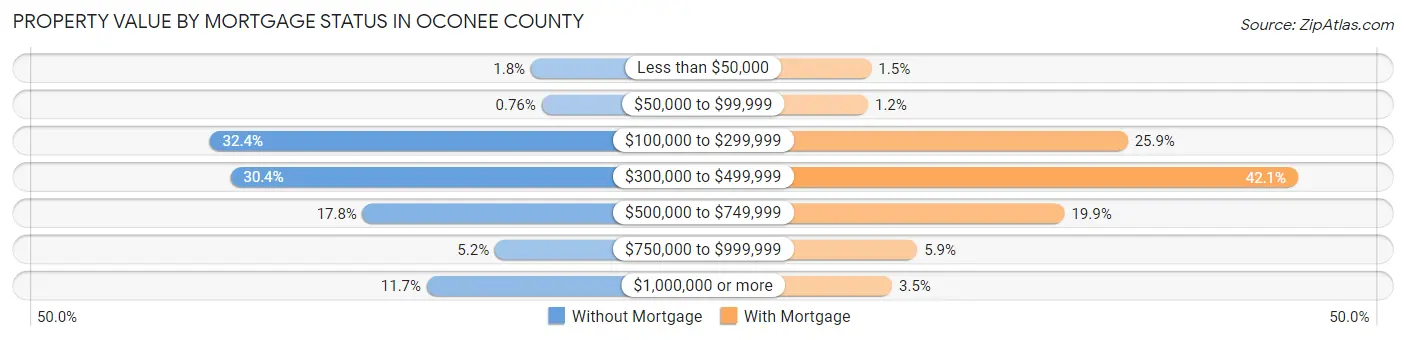
| Property Value | Without Mortgage | With Mortgage |
| Less than $50,000 | 72 (1.8%) | 120 (1.5%) |
| $50,000 to $99,999 | 31 (0.8%) | 94 (1.2%) |
| $100,000 to $299,999 | 1,313 (32.4%) | 2,053 (25.9%) |
| $300,000 to $499,999 | 1,233 (30.4%) | 3,336 (42.1%) |
| $500,000 to $749,999 | 722 (17.8%) | 1,576 (19.9%) |
| $750,000 to $999,999 | 211 (5.2%) | 466 (5.9%) |
| $1,000,000 or more | 474 (11.7%) | 276 (3.5%) |
| Total | 4,056 (100.0%) | 7,921 (100.0%) |
Household Income by Mortgage Status in Oconee County
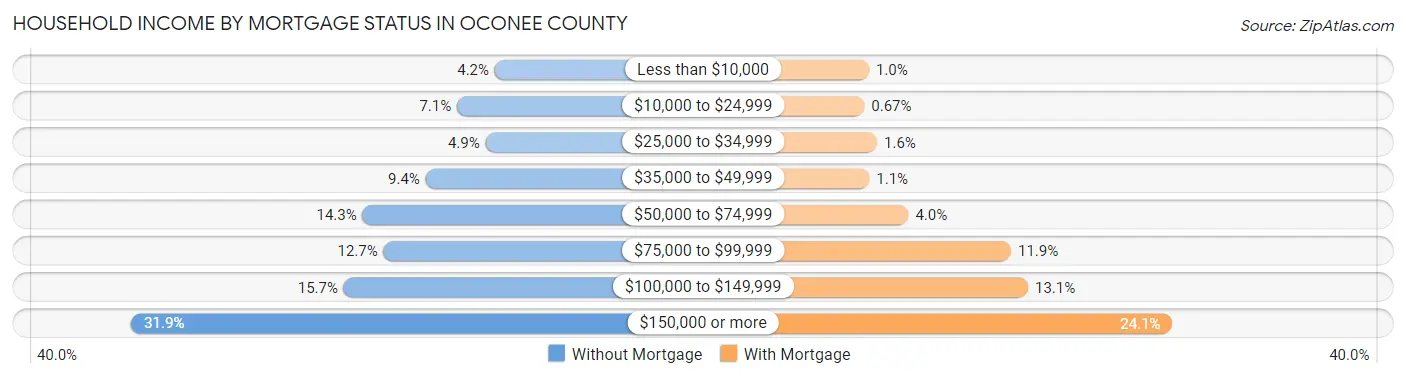
| Household Income | Without Mortgage | With Mortgage |
| Less than $10,000 | 169 (4.2%) | 81 (1.0%) |
| $10,000 to $24,999 | 286 (7.0%) | 53 (0.7%) |
| $25,000 to $34,999 | 198 (4.9%) | 130 (1.6%) |
| $35,000 to $49,999 | 383 (9.4%) | 83 (1.1%) |
| $50,000 to $74,999 | 578 (14.2%) | 319 (4.0%) |
| $75,000 to $99,999 | 513 (12.7%) | 939 (11.8%) |
| $100,000 to $149,999 | 636 (15.7%) | 1,041 (13.1%) |
| $150,000 or more | 1,293 (31.9%) | 1,912 (24.1%) |
| Total | 4,056 (100.0%) | 7,921 (100.0%) |
Property Value to Household Income Ratio in Oconee County
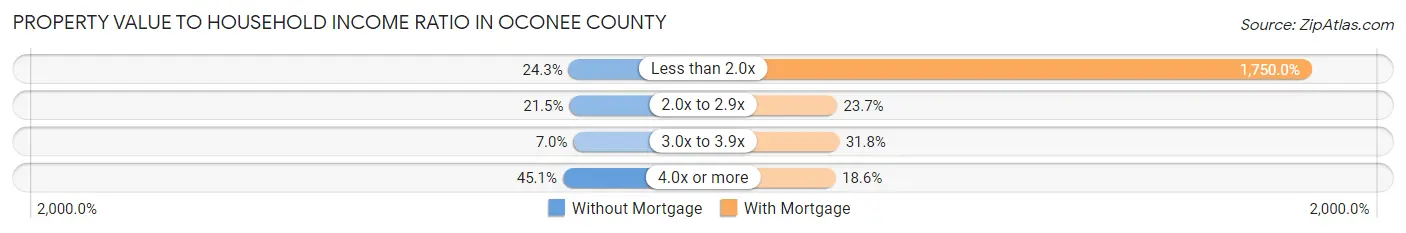
| Value-to-Income Ratio | Without Mortgage | With Mortgage |
| Less than 2.0x | 984 (24.3%) | 138,615 (1,750.0%) |
| 2.0x to 2.9x | 871 (21.5%) | 1,880 (23.7%) |
| 3.0x to 3.9x | 283 (7.0%) | 2,520 (31.8%) |
| 4.0x or more | 1,829 (45.1%) | 1,470 (18.6%) |
| Total | 4,056 (100.0%) | 7,921 (100.0%) |
Real Estate Taxes by Mortgage Status in Oconee County

| Property Taxes | Without Mortgage | With Mortgage |
| Less than $800 | 539 (13.3%) | 16 (0.2%) |
| $800 to $1,499 | 369 (9.1%) | 272 (3.4%) |
| $800 to $1,499 | 3,057 (75.4%) | 473 (6.0%) |
| Total | 4,056 (100.0%) | 7,921 (100.0%) |
Health & Disability in Oconee County
Health Insurance Coverage by Age in Oconee County
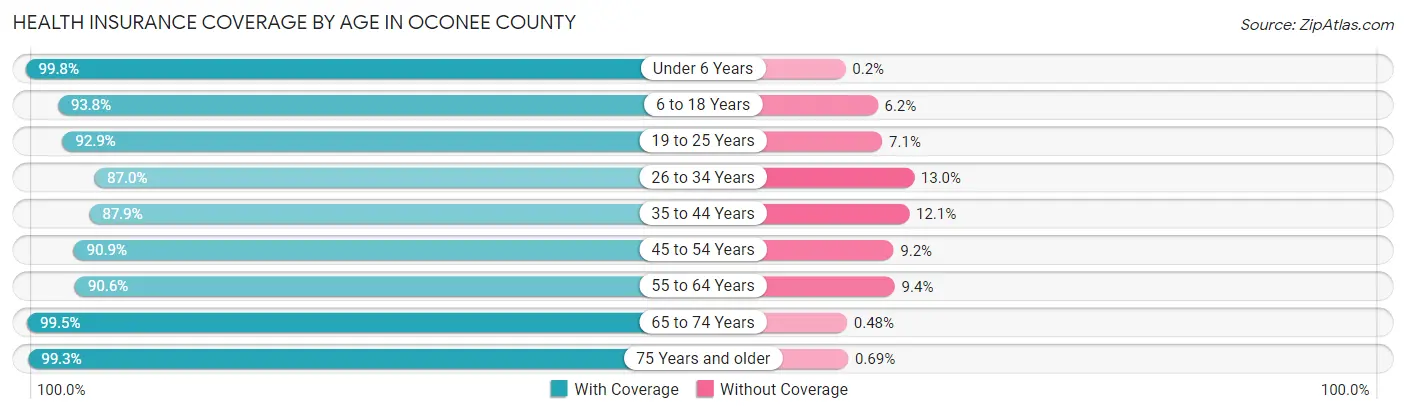
| Age Bracket | With Coverage | Without Coverage |
| Under 6 Years | 2,443 (99.8%) | 5 (0.2%) |
| 6 to 18 Years | 8,642 (93.8%) | 571 (6.2%) |
| 19 to 25 Years | 2,831 (92.9%) | 215 (7.1%) |
| 26 to 34 Years | 2,705 (87.0%) | 403 (13.0%) |
| 35 to 44 Years | 5,047 (87.9%) | 693 (12.1%) |
| 45 to 54 Years | 5,878 (90.8%) | 592 (9.1%) |
| 55 to 64 Years | 4,826 (90.6%) | 500 (9.4%) |
| 65 to 74 Years | 3,941 (99.5%) | 19 (0.5%) |
| 75 Years and older | 2,448 (99.3%) | 17 (0.7%) |
| Total | 38,761 (92.8%) | 3,015 (7.2%) |
Health Insurance Coverage by Citizenship Status in Oconee County

| Citizenship Status | With Coverage | Without Coverage |
| Native Born | 2,443 (99.8%) | 5 (0.2%) |
| Foreign Born, Citizen | 8,642 (93.8%) | 571 (6.2%) |
| Foreign Born, not a Citizen | 2,831 (92.9%) | 215 (7.1%) |
Health Insurance Coverage by Household Income in Oconee County
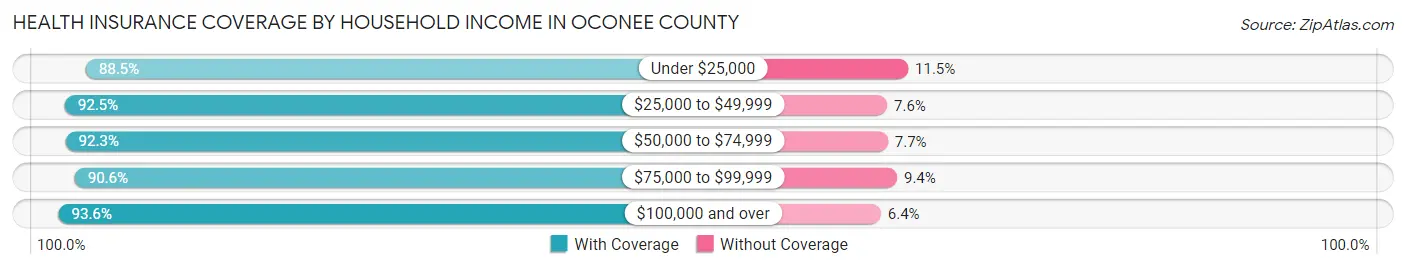
| Household Income | With Coverage | Without Coverage |
| Under $25,000 | 1,587 (88.5%) | 206 (11.5%) |
| $25,000 to $49,999 | 2,328 (92.4%) | 190 (7.5%) |
| $50,000 to $74,999 | 4,859 (92.3%) | 405 (7.7%) |
| $75,000 to $99,999 | 4,717 (90.6%) | 490 (9.4%) |
| $100,000 and over | 25,268 (93.6%) | 1,722 (6.4%) |
Public vs Private Health Insurance Coverage by Age in Oconee County
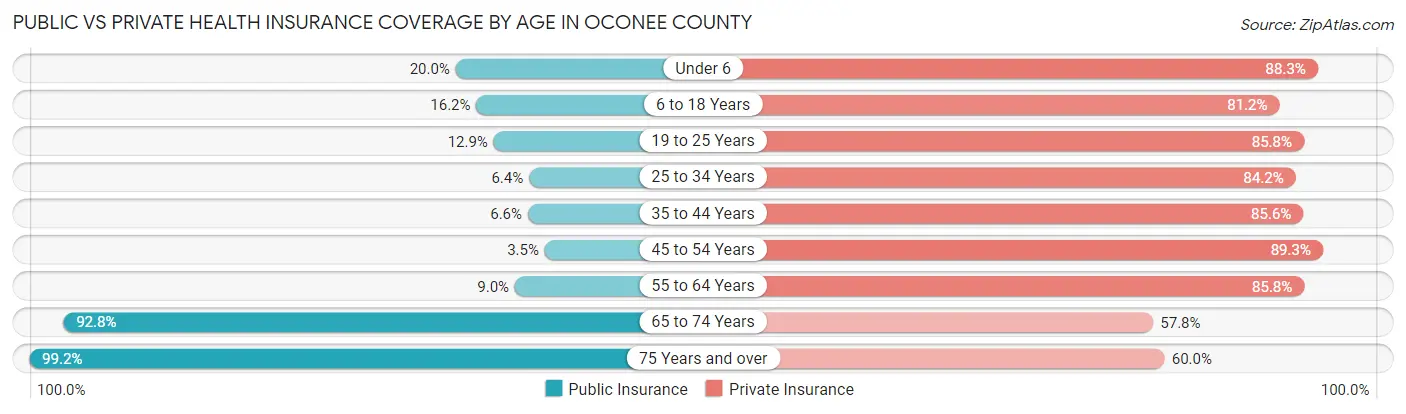
| Age Bracket | Public Insurance | Private Insurance |
| Under 6 | 489 (20.0%) | 2,162 (88.3%) |
| 6 to 18 Years | 1,488 (16.2%) | 7,481 (81.2%) |
| 19 to 25 Years | 394 (12.9%) | 2,612 (85.8%) |
| 25 to 34 Years | 198 (6.4%) | 2,618 (84.2%) |
| 35 to 44 Years | 378 (6.6%) | 4,915 (85.6%) |
| 45 to 54 Years | 223 (3.5%) | 5,775 (89.3%) |
| 55 to 64 Years | 479 (9.0%) | 4,570 (85.8%) |
| 65 to 74 Years | 3,676 (92.8%) | 2,290 (57.8%) |
| 75 Years and over | 2,444 (99.2%) | 1,478 (60.0%) |
| Total | 9,769 (23.4%) | 33,901 (81.1%) |
Disability Status by Sex by Age in Oconee County
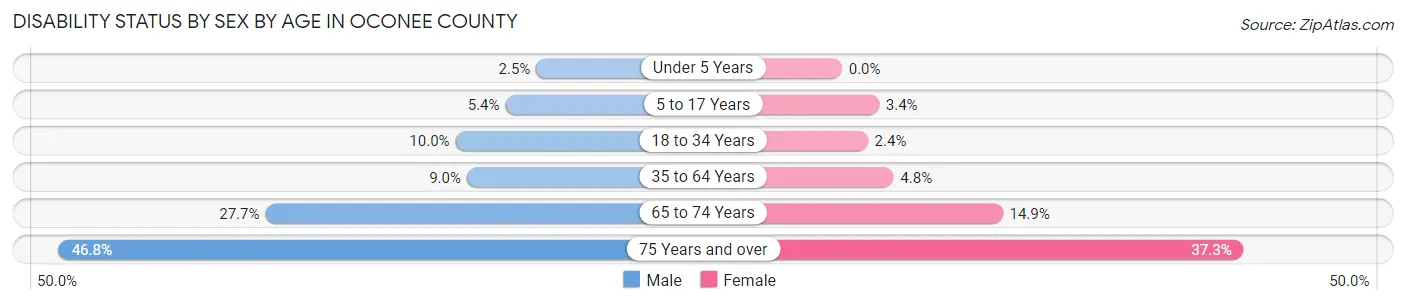
| Age Bracket | Male | Female |
| Under 5 Years | 28 (2.5%) | 0 (0.0%) |
| 5 to 17 Years | 251 (5.4%) | 149 (3.4%) |
| 18 to 34 Years | 338 (10.0%) | 82 (2.4%) |
| 35 to 64 Years | 767 (9.0%) | 430 (4.8%) |
| 65 to 74 Years | 541 (27.7%) | 299 (14.9%) |
| 75 Years and over | 510 (46.8%) | 513 (37.3%) |
Disability Class by Sex by Age in Oconee County
Disability Class: Hearing Difficulty
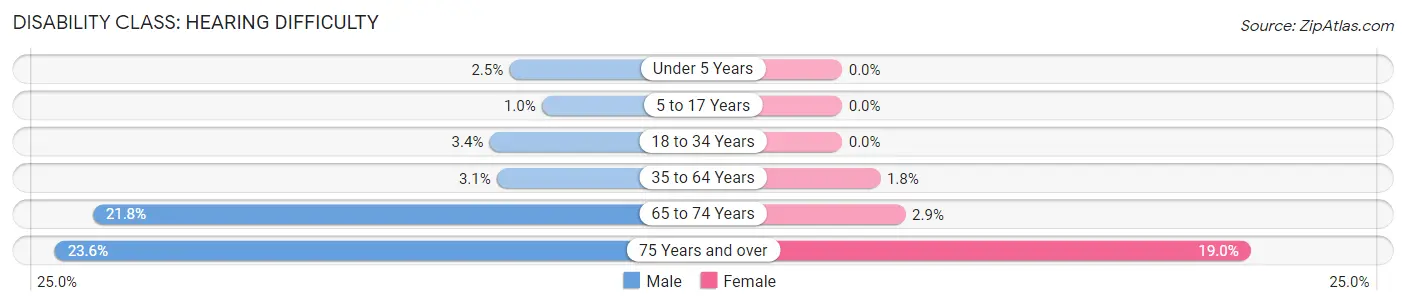
| Age Bracket | Male | Female |
| Under 5 Years | 28 (2.5%) | 0 (0.0%) |
| 5 to 17 Years | 47 (1.0%) | 0 (0.0%) |
| 18 to 34 Years | 116 (3.4%) | 0 (0.0%) |
| 35 to 64 Years | 265 (3.1%) | 159 (1.8%) |
| 65 to 74 Years | 427 (21.8%) | 59 (2.9%) |
| 75 Years and over | 257 (23.6%) | 261 (19.0%) |
Disability Class: Vision Difficulty
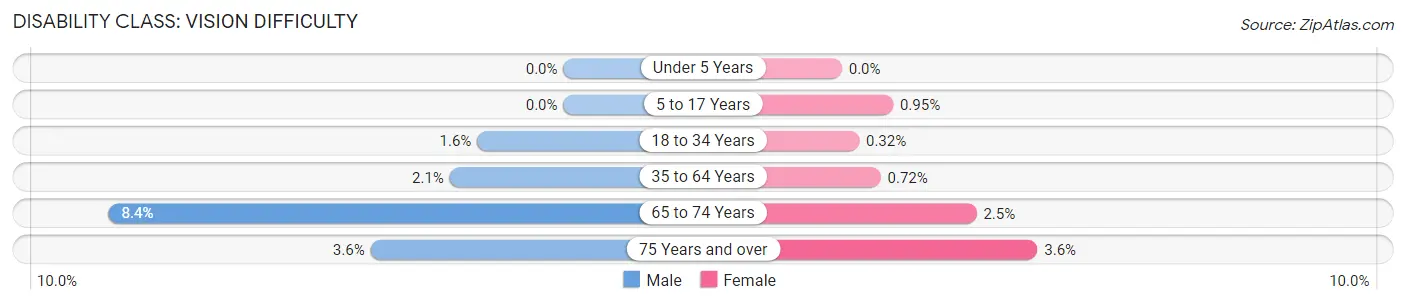
| Age Bracket | Male | Female |
| Under 5 Years | 0 (0.0%) | 0 (0.0%) |
| 5 to 17 Years | 0 (0.0%) | 41 (0.9%) |
| 18 to 34 Years | 54 (1.6%) | 11 (0.3%) |
| 35 to 64 Years | 181 (2.1%) | 65 (0.7%) |
| 65 to 74 Years | 165 (8.4%) | 50 (2.5%) |
| 75 Years and over | 39 (3.6%) | 50 (3.6%) |
Disability Class: Cognitive Difficulty
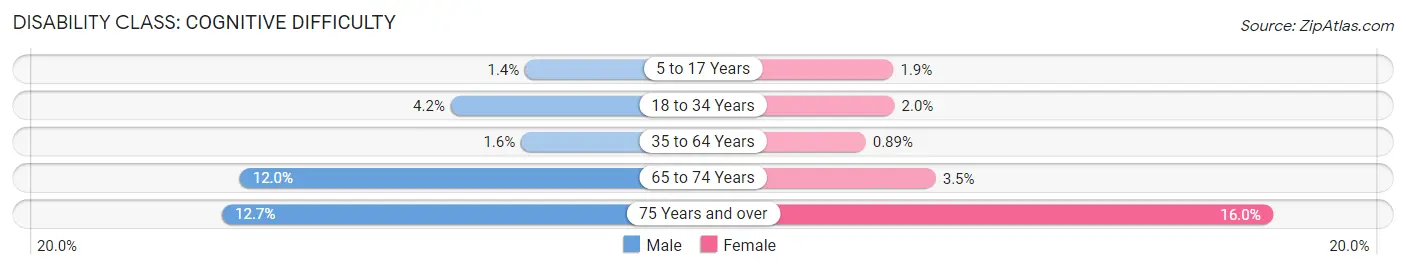
| Age Bracket | Male | Female |
| 5 to 17 Years | 66 (1.4%) | 83 (1.9%) |
| 18 to 34 Years | 141 (4.2%) | 67 (2.0%) |
| 35 to 64 Years | 134 (1.6%) | 80 (0.9%) |
| 65 to 74 Years | 235 (12.0%) | 70 (3.5%) |
| 75 Years and over | 138 (12.7%) | 220 (16.0%) |
Disability Class: Ambulatory Difficulty
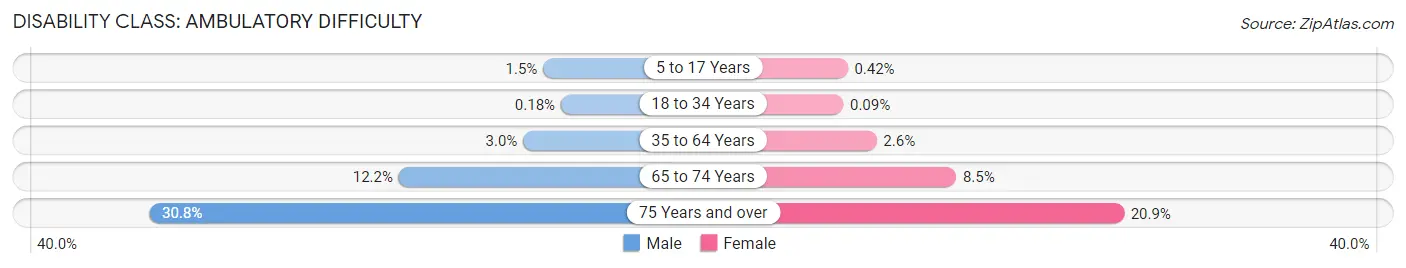
| Age Bracket | Male | Female |
| 5 to 17 Years | 70 (1.5%) | 18 (0.4%) |
| 18 to 34 Years | 6 (0.2%) | 3 (0.1%) |
| 35 to 64 Years | 255 (3.0%) | 231 (2.6%) |
| 65 to 74 Years | 239 (12.2%) | 170 (8.5%) |
| 75 Years and over | 335 (30.8%) | 288 (20.9%) |
Disability Class: Self-Care Difficulty
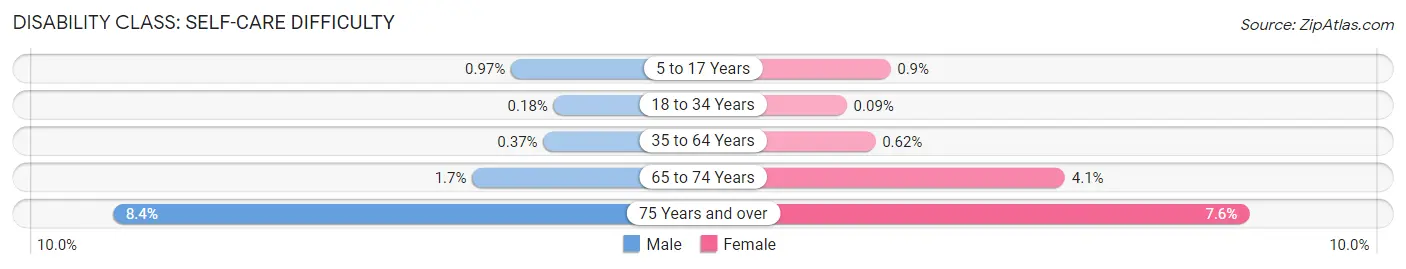
| Age Bracket | Male | Female |
| 5 to 17 Years | 45 (1.0%) | 39 (0.9%) |
| 18 to 34 Years | 6 (0.2%) | 3 (0.1%) |
| 35 to 64 Years | 32 (0.4%) | 56 (0.6%) |
| 65 to 74 Years | 33 (1.7%) | 83 (4.1%) |
| 75 Years and over | 91 (8.4%) | 104 (7.6%) |
Technology Access in Oconee County
Computing Device Access in Oconee County
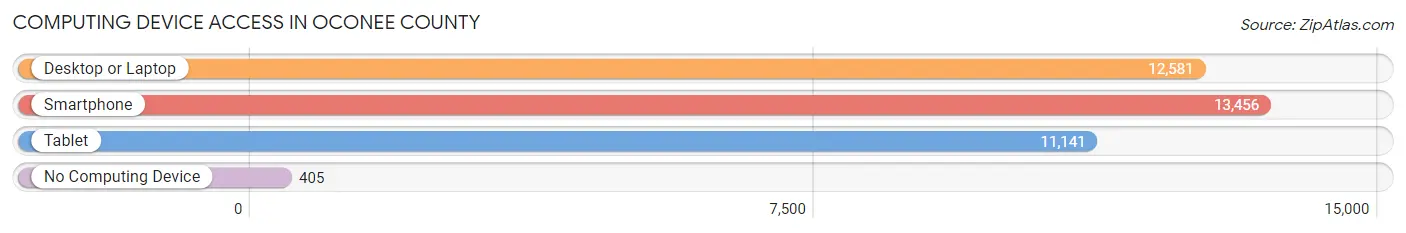
| Device Type | # Households | % Households |
| Desktop or Laptop | 12,581 | 87.8% |
| Smartphone | 13,456 | 93.9% |
| Tablet | 11,141 | 77.7% |
| No Computing Device | 405 | 2.8% |
| Total | 14,330 | 100.0% |
Internet Access in Oconee County
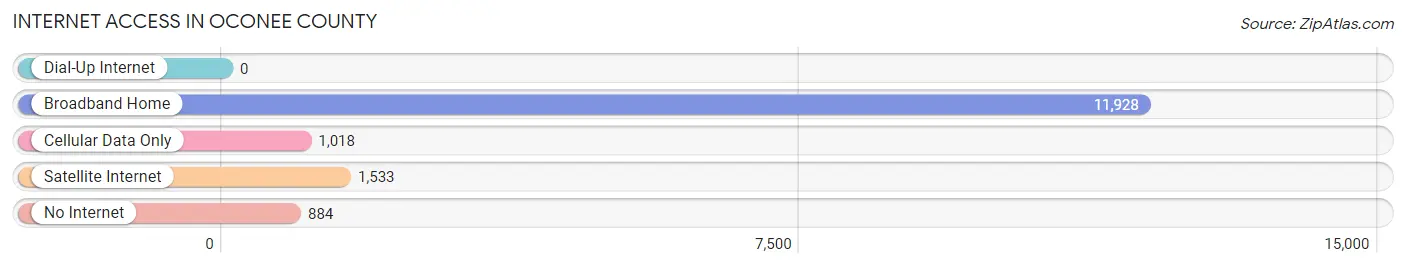
| Internet Type | # Households | % Households |
| Dial-Up Internet | 0 | 0.0% |
| Broadband Home | 11,928 | 83.2% |
| Cellular Data Only | 1,018 | 7.1% |
| Satellite Internet | 1,533 | 10.7% |
| No Internet | 884 | 6.2% |
| Total | 14,330 | 100.0% |
Oconee County Summary
Oconee County, Georgia is located in the northeastern part of the state, in the foothills of the Blue Ridge Mountains. It is bordered by Clarke, Barrow, Walton, and Greene counties. The county seat is Watkinsville, and the county is named after the Oconee River, which flows through the county.
Geography
Oconee County covers an area of approximately 437 square miles, with a population of 32,808 as of the 2010 census. The county is mostly rural, with a few small towns and villages scattered throughout. The terrain is mostly hilly, with some flat areas in the northern part of the county. The highest point in the county is at the summit of Rocky Mountain, at an elevation of 1,890 feet. The county is home to several state parks, including Hard Labor Creek State Park, Watson Mill Bridge State Park, and Victoria Bryant State Park.
Climate
Oconee County has a humid subtropical climate, with hot, humid summers and mild winters. The average annual temperature is around 61°F, with an average high of around 87°F in the summer and an average low of around 35°F in the winter. The average annual precipitation is around 48 inches, with most of it falling in the summer months.
Economy
Oconee County’s economy is largely based on agriculture, with poultry, beef cattle, and dairy farming being the main industries. The county also has a growing tourism industry, with several state parks and recreational areas. The county is also home to several manufacturing companies, including a paper mill and a furniture factory.
Demographics
As of the 2010 census, Oconee County had a population of 32,808, with a population density of 74.7 people per square mile. The racial makeup of the county was 87.3% White, 8.2% African American, 0.5% Native American, 1.2% Asian, 0.1% Pacific Islander, 1.3% from other races, and 1.5% from two or more races. Hispanic or Latino of any race were 3.2% of the population.
The median income for a household in the county was $50,945, and the median income for a family was $60,945. The per capita income for the county was $25,945. About 8.7% of families and 11.2% of the population were below the poverty line, including 15.2% of those under age 18 and 8.2% of those age 65 or over.
Oconee County is a rural county with a diverse economy and population. It is home to several state parks and recreational areas, as well as a growing manufacturing sector. The county has a humid subtropical climate, with hot, humid summers and mild winters. The population is mostly white, with a small African American and Hispanic population. The median income for a household in the county is above the state average, and the poverty rate is below the state average.
Common Questions
What is Per Capita Income in Oconee County?
Per Capita income in Oconee County is $53,848.
What is the Median Family Income in Oconee County?
Median Family Income in Oconee County is $133,014.
What is the Median Household income in Oconee County?
Median Household Income in Oconee County is $116,221.
What is Income or Wage Gap in Oconee County?
Income or Wage Gap in Oconee County is 44.6%.
Women in Oconee County earn 55.4 cents for every dollar earned by a man.
What is Inequality or Gini Index in Oconee County?
Inequality or Gini Index in Oconee County is 0.46.
What is the Total Population of Oconee County?
Total Population of Oconee County is 41,978.
What is the Total Male Population of Oconee County?
Total Male Population of Oconee County is 20,864.
What is the Total Female Population of Oconee County?
Total Female Population of Oconee County is 21,114.
What is the Ratio of Males per 100 Females in Oconee County?
There are 98.82 Males per 100 Females in Oconee County.
What is the Ratio of Females per 100 Males in Oconee County?
There are 101.20 Females per 100 Males in Oconee County.
What is the Median Population Age in Oconee County?
Median Population Age in Oconee County is 41.2 Years.
What is the Average Family Size in Oconee County
Average Family Size in Oconee County is 3.2 People.
What is the Average Household Size in Oconee County
Average Household Size in Oconee County is 2.9 People.
How Large is the Labor Force in Oconee County?
There are 21,326 People in the Labor Forcein in Oconee County.
What is the Percentage of People in the Labor Force in Oconee County?
65.4% of People are in the Labor Force in Oconee County.
What is the Unemployment Rate in Oconee County?
Unemployment Rate in Oconee County is 2.9%.