Murray County, GA Map & Demographics
Murray County Map
Murray County Overview
$27,383
PER CAPITA INCOME
$69,618
AVG FAMILY INCOME
$60,617
AVG HOUSEHOLD INCOME
32.4%
WAGE / INCOME GAP [ % ]
67.6¢/ $1
WAGE / INCOME GAP [ $ ]
$10,943
FAMILY INCOME DEFICIT
0.43
INEQUALITY / GINI INDEX
40,063
TOTAL POPULATION
19,928
MALE POPULATION
20,135
FEMALE POPULATION
98.97
MALES / 100 FEMALES
101.04
FEMALES / 100 MALES
39.7
MEDIAN AGE
3.1
AVG FAMILY SIZE
2.7
AVG HOUSEHOLD SIZE
19,175
LABOR FORCE [ PEOPLE ]
60.7%
PERCENT IN LABOR FORCE
6.7%
UNEMPLOYMENT RATE
Income in Murray County
Income Overview in Murray County
Per Capita Income in Murray County is $27,383, while median incomes of families and households are $69,618 and $60,617 respectively.
| Characteristic | Number | Measure |
| Per Capita Income | 40,063 | $27,383 |
| Median Family Income | 10,939 | $69,618 |
| Mean Family Income | 10,939 | $85,951 |
| Median Household Income | 14,859 | $60,617 |
| Mean Household Income | 14,859 | $74,925 |
| Income Deficit | 10,939 | $10,943 |
| Wage / Income Gap (%) | 40,063 | 32.37% |
| Wage / Income Gap ($) | 40,063 | 67.63¢ per $1 |
| Gini / Inequality Index | 40,063 | 0.43 |
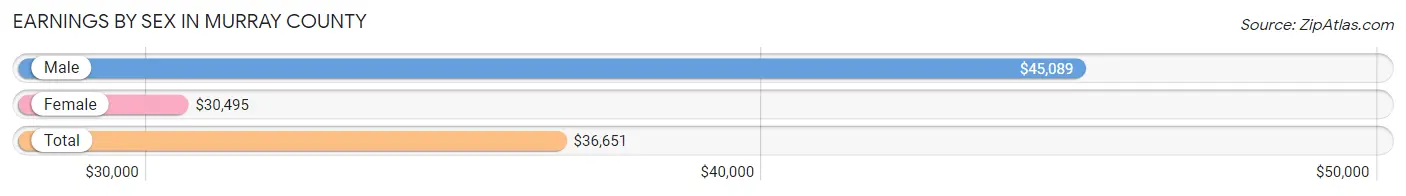
Earnings by Sex in Murray County
Average Earnings in Murray County are $36,651, $45,089 for men and $30,495 for women, a difference of 32.4%.
| Sex | Number | Average Earnings |
| Male | 10,736 (54.6%) | $45,089 |
| Female | 8,912 (45.4%) | $30,495 |
| Total | 19,648 (100.0%) | $36,651 |
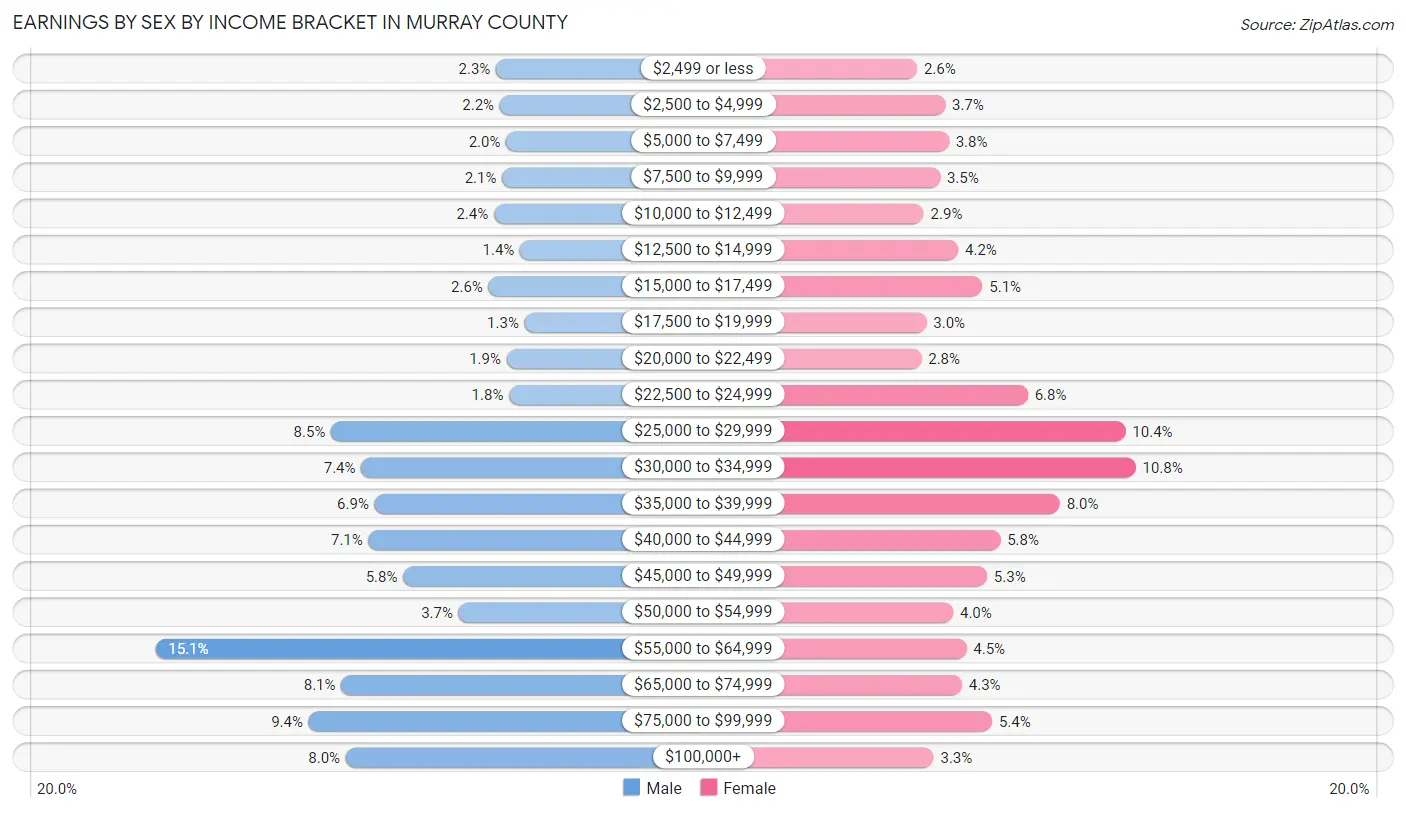
Earnings by Sex by Income Bracket in Murray County
The most common earnings brackets in Murray County are $55,000 to $64,999 for men (1,621 | 15.1%) and $30,000 to $34,999 for women (964 | 10.8%).
| Income | Male | Female |
| $2,499 or less | 250 (2.3%) | 234 (2.6%) |
| $2,500 to $4,999 | 235 (2.2%) | 328 (3.7%) |
| $5,000 to $7,499 | 209 (1.9%) | 340 (3.8%) |
| $7,500 to $9,999 | 225 (2.1%) | 311 (3.5%) |
| $10,000 to $12,499 | 259 (2.4%) | 257 (2.9%) |
| $12,500 to $14,999 | 153 (1.4%) | 372 (4.2%) |
| $15,000 to $17,499 | 280 (2.6%) | 453 (5.1%) |
| $17,500 to $19,999 | 135 (1.3%) | 266 (3.0%) |
| $20,000 to $22,499 | 207 (1.9%) | 249 (2.8%) |
| $22,500 to $24,999 | 198 (1.8%) | 604 (6.8%) |
| $25,000 to $29,999 | 914 (8.5%) | 930 (10.4%) |
| $30,000 to $34,999 | 792 (7.4%) | 964 (10.8%) |
| $35,000 to $39,999 | 739 (6.9%) | 711 (8.0%) |
| $40,000 to $44,999 | 763 (7.1%) | 512 (5.8%) |
| $45,000 to $49,999 | 624 (5.8%) | 468 (5.2%) |
| $50,000 to $54,999 | 400 (3.7%) | 355 (4.0%) |
| $55,000 to $64,999 | 1,621 (15.1%) | 399 (4.5%) |
| $65,000 to $74,999 | 873 (8.1%) | 384 (4.3%) |
| $75,000 to $99,999 | 1,004 (9.3%) | 485 (5.4%) |
| $100,000+ | 855 (8.0%) | 290 (3.3%) |
| Total | 10,736 (100.0%) | 8,912 (100.0%) |
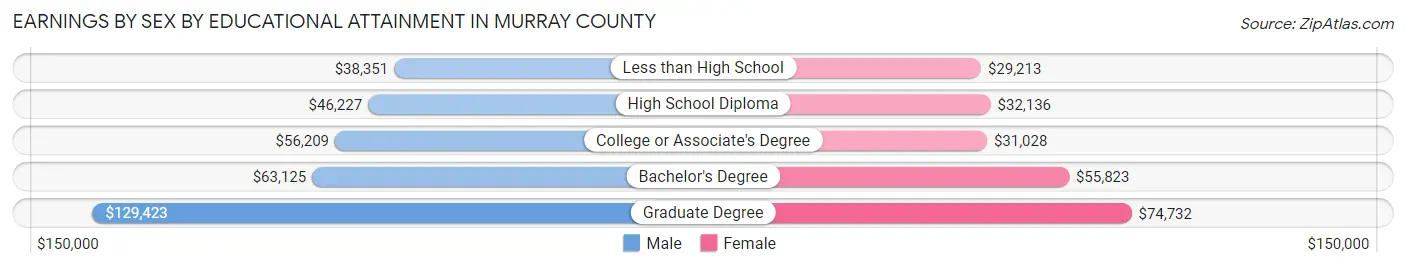
Earnings by Sex by Educational Attainment in Murray County
Average earnings in Murray County are $50,489 for men and $33,491 for women, a difference of 33.7%. Men with an educational attainment of graduate degree enjoy the highest average annual earnings of $129,423, while those with less than high school education earn the least with $38,351. Women with an educational attainment of graduate degree earn the most with the average annual earnings of $74,732, while those with less than high school education have the smallest earnings of $29,213.
| Educational Attainment | Male Income | Female Income |
| Less than High School | $38,351 | $29,213 |
| High School Diploma | $46,227 | $32,136 |
| College or Associate's Degree | $56,209 | $31,028 |
| Bachelor's Degree | $63,125 | $55,823 |
| Graduate Degree | $129,423 | $74,732 |
| Total | $50,489 | $33,491 |
Family Income in Murray County
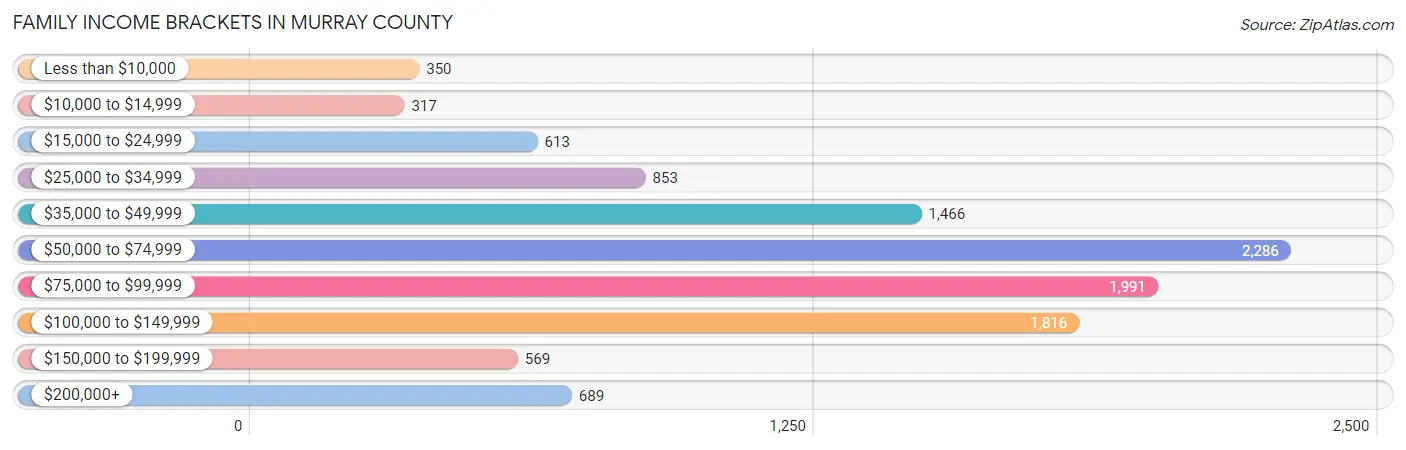
Family Income Brackets in Murray County
According to the Murray County family income data, there are 2,286 families falling into the $50,000 to $74,999 income range, which is the most common income bracket and makes up 20.9% of all families. Conversely, the $10,000 to $14,999 income bracket is the least frequent group with only 317 families (2.9%) belonging to this category.
| Income Bracket | # Families | % Families |
| Less than $10,000 | 350 | 3.2% |
| $10,000 to $14,999 | 317 | 2.9% |
| $15,000 to $24,999 | 613 | 5.6% |
| $25,000 to $34,999 | 853 | 7.8% |
| $35,000 to $49,999 | 1,466 | 13.4% |
| $50,000 to $74,999 | 2,286 | 20.9% |
| $75,000 to $99,999 | 1,991 | 18.2% |
| $100,000 to $149,999 | 1,816 | 16.6% |
| $150,000 to $199,999 | 569 | 5.2% |
| $200,000+ | 689 | 6.3% |
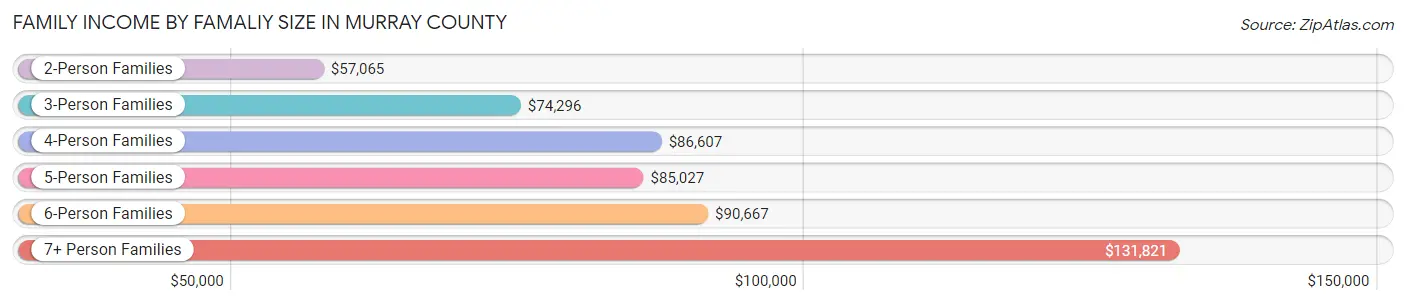
Family Income by Famaliy Size in Murray County
7+ person families (159 | 1.5%) account for the highest median family income in Murray County with $131,821 per family, while 2-person families (4,797 | 43.9%) have the highest median income of $28,532 per family member.
| Income Bracket | # Families | Median Income |
| 2-Person Families | 4,797 (43.9%) | $57,065 |
| 3-Person Families | 2,668 (24.4%) | $74,296 |
| 4-Person Families | 2,132 (19.5%) | $86,607 |
| 5-Person Families | 947 (8.7%) | $85,027 |
| 6-Person Families | 236 (2.2%) | $90,667 |
| 7+ Person Families | 159 (1.5%) | $131,821 |
| Total | 10,939 (100.0%) | $69,618 |
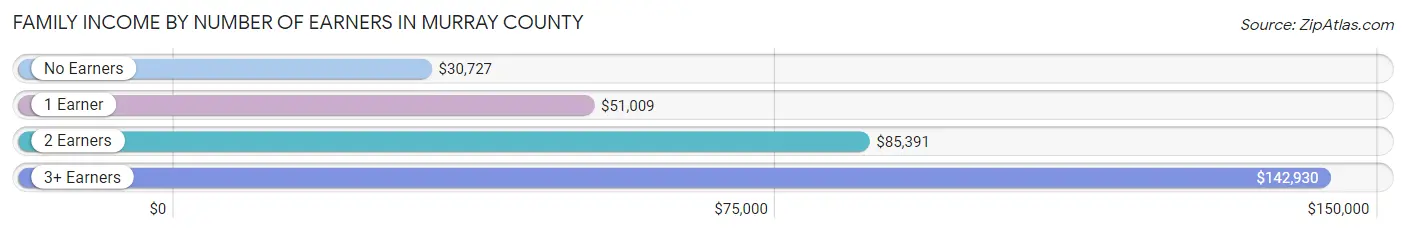
Family Income by Number of Earners in Murray County
The median family income in Murray County is $69,618, with families comprising 3+ earners (1,545) having the highest median family income of $142,930, while families with no earners (1,605) have the lowest median family income of $30,727, accounting for 14.1% and 14.7% of families, respectively.
| Number of Earners | # Families | Median Income |
| No Earners | 1,605 (14.7%) | $30,727 |
| 1 Earner | 3,694 (33.8%) | $51,009 |
| 2 Earners | 4,095 (37.4%) | $85,391 |
| 3+ Earners | 1,545 (14.1%) | $142,930 |
| Total | 10,939 (100.0%) | $69,618 |
Household Income in Murray County
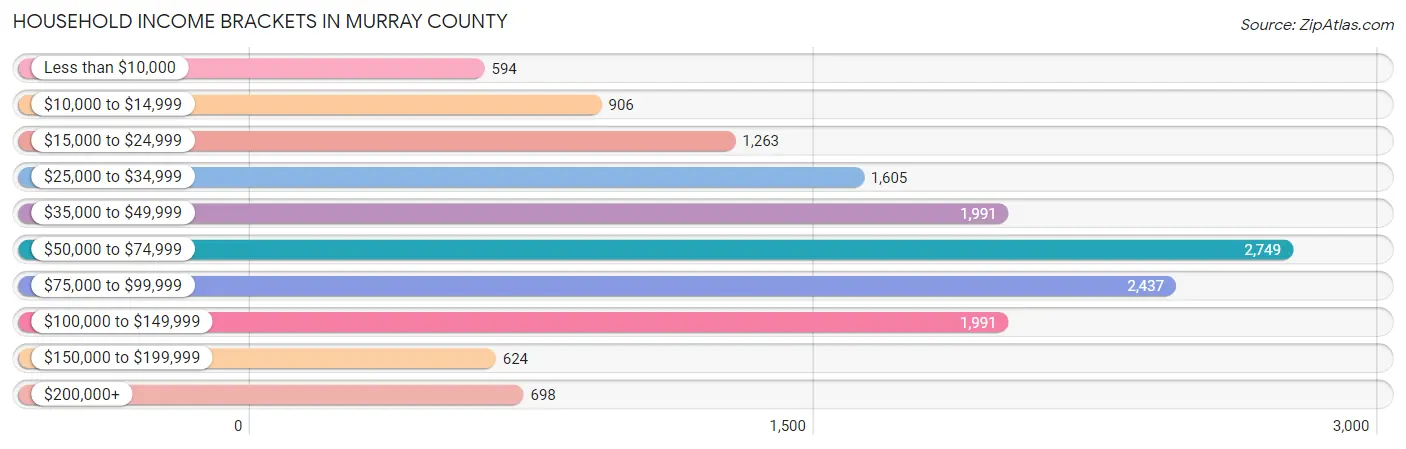
Household Income Brackets in Murray County
With 2,749 households falling in the category, the $50,000 to $74,999 income range is the most frequent in Murray County, accounting for 18.5% of all households. In contrast, only 594 households (4.0%) fall into the less than $10,000 income bracket, making it the least populous group.
| Income Bracket | # Households | % Households |
| Less than $10,000 | 594 | 4.0% |
| $10,000 to $14,999 | 906 | 6.1% |
| $15,000 to $24,999 | 1,263 | 8.5% |
| $25,000 to $34,999 | 1,605 | 10.8% |
| $35,000 to $49,999 | 1,991 | 13.4% |
| $50,000 to $74,999 | 2,749 | 18.5% |
| $75,000 to $99,999 | 2,437 | 16.4% |
| $100,000 to $149,999 | 1,991 | 13.4% |
| $150,000 to $199,999 | 624 | 4.2% |
| $200,000+ | 698 | 4.7% |
Household Income by Householder Age in Murray County
The median household income in Murray County is $60,617, with the highest median household income of $75,932 found in the 25 to 44 years age bracket for the primary householder. A total of 4,613 households (31.0%) fall into this category. Meanwhile, the 65+ years age bracket for the primary householder has the lowest median household income of $32,646, with 3,745 households (25.2%) in this group.
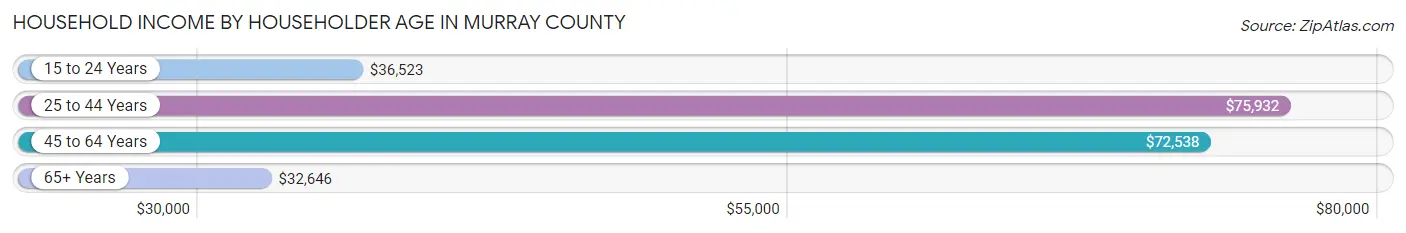
| Income Bracket | # Households | Median Income |
| 15 to 24 Years | 558 (3.8%) | $36,523 |
| 25 to 44 Years | 4,613 (31.0%) | $75,932 |
| 45 to 64 Years | 5,943 (40.0%) | $72,538 |
| 65+ Years | 3,745 (25.2%) | $32,646 |
| Total | 14,859 (100.0%) | $60,617 |
Poverty in Murray County
Income Below Poverty by Sex and Age in Murray County
With 10.8% poverty level for males and 15.3% for females among the residents of Murray County, 12 to 14 year old males and 15 year old females are the most vulnerable to poverty, with 299 males (35.0%) and 178 females (38.5%) in their respective age groups living below the poverty level.
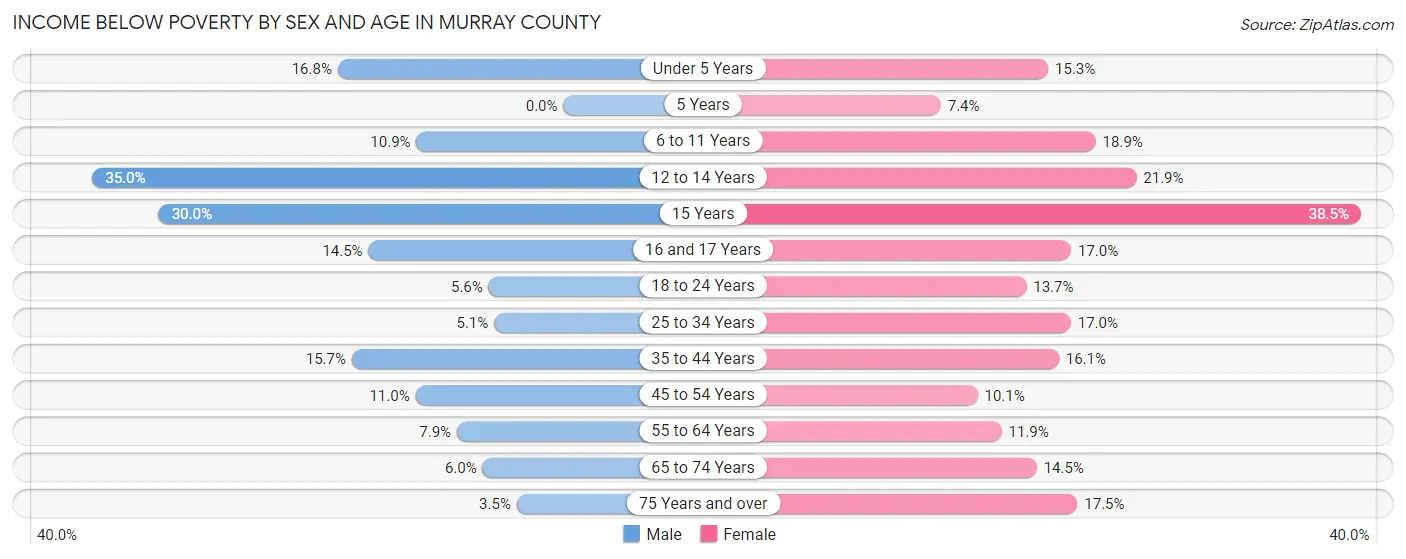
| Age Bracket | Male | Female |
| Under 5 Years | 204 (16.8%) | 170 (15.3%) |
| 5 Years | 0 (0.0%) | 30 (7.3%) |
| 6 to 11 Years | 178 (10.9%) | 273 (18.9%) |
| 12 to 14 Years | 299 (35.0%) | 159 (21.9%) |
| 15 Years | 70 (30.0%) | 178 (38.5%) |
| 16 and 17 Years | 103 (14.5%) | 73 (17.0%) |
| 18 to 24 Years | 98 (5.6%) | 220 (13.7%) |
| 25 to 34 Years | 126 (5.1%) | 455 (17.0%) |
| 35 to 44 Years | 381 (15.7%) | 403 (16.1%) |
| 45 to 54 Years | 304 (11.0%) | 279 (10.1%) |
| 55 to 64 Years | 213 (7.9%) | 315 (11.9%) |
| 65 to 74 Years | 104 (6.0%) | 281 (14.5%) |
| 75 Years and over | 33 (3.5%) | 216 (17.5%) |
| Total | 2,113 (10.8%) | 3,052 (15.3%) |
Income Above Poverty by Sex and Age in Murray County
According to the poverty statistics in Murray County, males aged 5 years and females aged 5 years are the age groups that are most secure financially, with 100.0% of males and 92.6% of females in these age groups living above the poverty line.
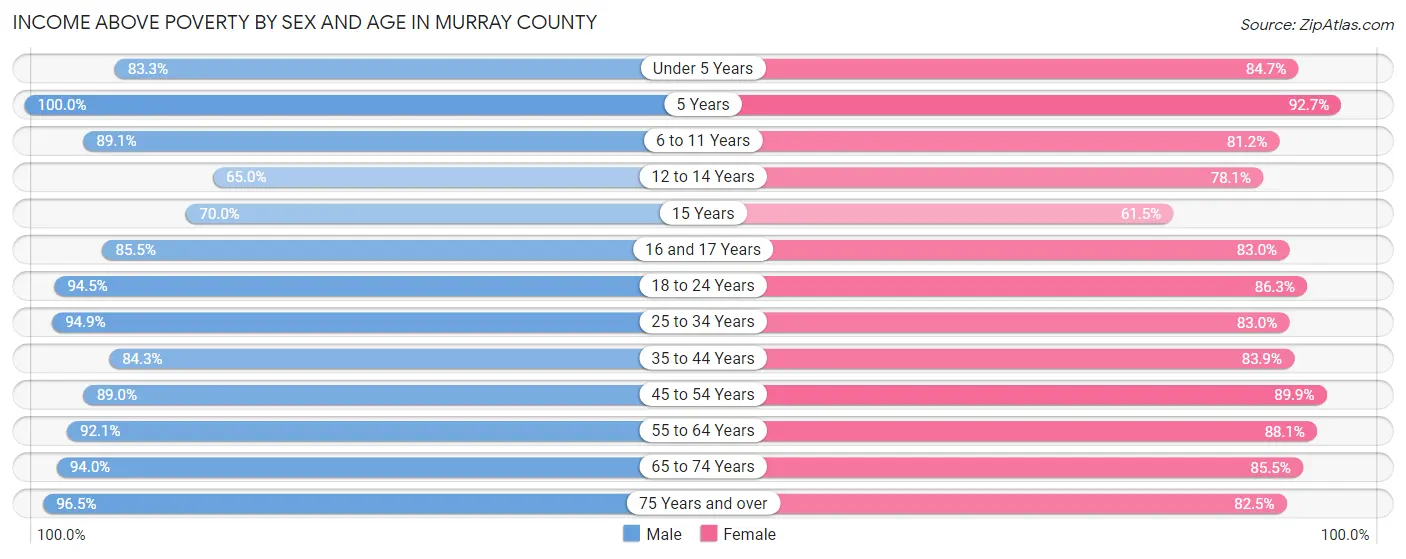
| Age Bracket | Male | Female |
| Under 5 Years | 1,014 (83.3%) | 940 (84.7%) |
| 5 Years | 126 (100.0%) | 378 (92.6%) |
| 6 to 11 Years | 1,453 (89.1%) | 1,175 (81.1%) |
| 12 to 14 Years | 556 (65.0%) | 568 (78.1%) |
| 15 Years | 163 (70.0%) | 284 (61.5%) |
| 16 and 17 Years | 609 (85.5%) | 356 (83.0%) |
| 18 to 24 Years | 1,668 (94.5%) | 1,386 (86.3%) |
| 25 to 34 Years | 2,327 (94.9%) | 2,221 (83.0%) |
| 35 to 44 Years | 2,044 (84.3%) | 2,099 (83.9%) |
| 45 to 54 Years | 2,464 (89.0%) | 2,490 (89.9%) |
| 55 to 64 Years | 2,483 (92.1%) | 2,340 (88.1%) |
| 65 to 74 Years | 1,629 (94.0%) | 1,661 (85.5%) |
| 75 Years and over | 920 (96.5%) | 1,019 (82.5%) |
| Total | 17,456 (89.2%) | 16,917 (84.7%) |
Income Below Poverty Among Married-Couple Families in Murray County
The poverty statistics for married-couple families in Murray County show that 5.8% or 487 of the total 8,333 families live below the poverty line. Families with 5 or more children have the highest poverty rate of 50.0%, comprising of 5 families. On the other hand, families with 1 or 2 children have the lowest poverty rate of 2.6%, which includes 73 families.
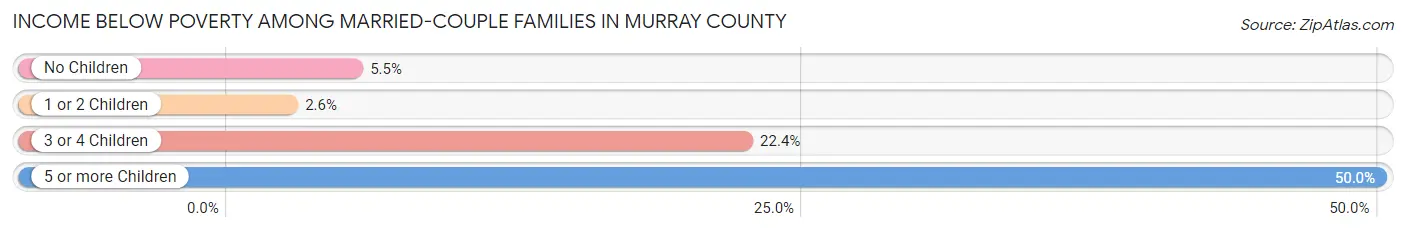
| Children | Above Poverty | Below Poverty |
| No Children | 4,645 (94.6%) | 268 (5.4%) |
| 1 or 2 Children | 2,708 (97.4%) | 73 (2.6%) |
| 3 or 4 Children | 488 (77.6%) | 141 (22.4%) |
| 5 or more Children | 5 (50.0%) | 5 (50.0%) |
| Total | 7,846 (94.2%) | 487 (5.8%) |
Income Below Poverty Among Single-Parent Households in Murray County
According to the poverty data in Murray County, 7.8% or 53 single-father households and 27.9% or 538 single-mother households are living below the poverty line. Among single-father households, those with 1 or 2 children have the highest poverty rate, with 42 households (14.5%) experiencing poverty. Likewise, among single-mother households, those with 3 or 4 children have the highest poverty rate, with 85 households (60.3%) falling below the poverty line.
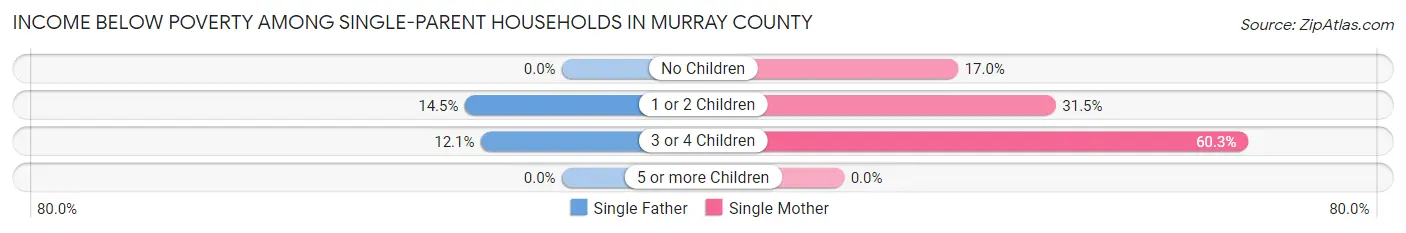
| Children | Single Father | Single Mother |
| No Children | 0 (0.0%) | 130 (17.0%) |
| 1 or 2 Children | 42 (14.5%) | 323 (31.5%) |
| 3 or 4 Children | 11 (12.1%) | 85 (60.3%) |
| 5 or more Children | 0 (0.0%) | 0 (0.0%) |
| Total | 53 (7.8%) | 538 (27.9%) |
Income Below Poverty Among Married-Couple vs Single-Parent Households in Murray County
The poverty data for Murray County shows that 487 of the married-couple family households (5.8%) and 591 of the single-parent households (22.7%) are living below the poverty level. Within the married-couple family households, those with 5 or more children have the highest poverty rate, with 5 households (50.0%) falling below the poverty line. Among the single-parent households, those with 3 or 4 children have the highest poverty rate, with 96 household (41.4%) living below poverty.
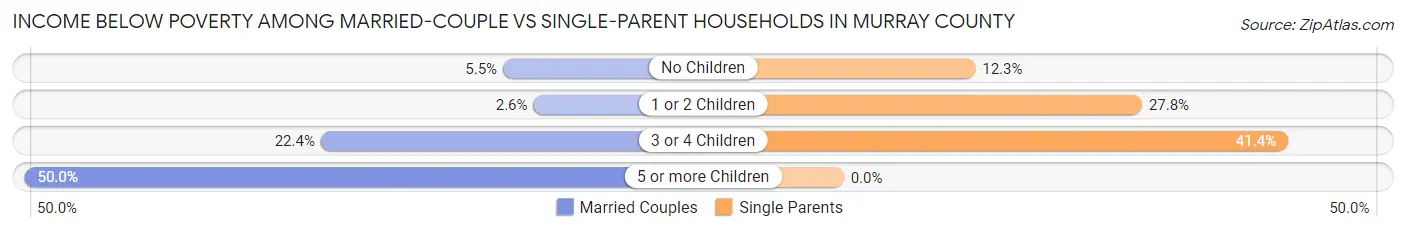
| Children | Married-Couple Families | Single-Parent Households |
| No Children | 268 (5.4%) | 130 (12.3%) |
| 1 or 2 Children | 73 (2.6%) | 365 (27.8%) |
| 3 or 4 Children | 141 (22.4%) | 96 (41.4%) |
| 5 or more Children | 5 (50.0%) | 0 (0.0%) |
| Total | 487 (5.8%) | 591 (22.7%) |
Race in Murray County
The most populous races in Murray County are White / Caucasian (37,135 | 92.7%), Hispanic or Latino (6,369 | 15.9%), and Two or more Races (1,883 | 4.7%).
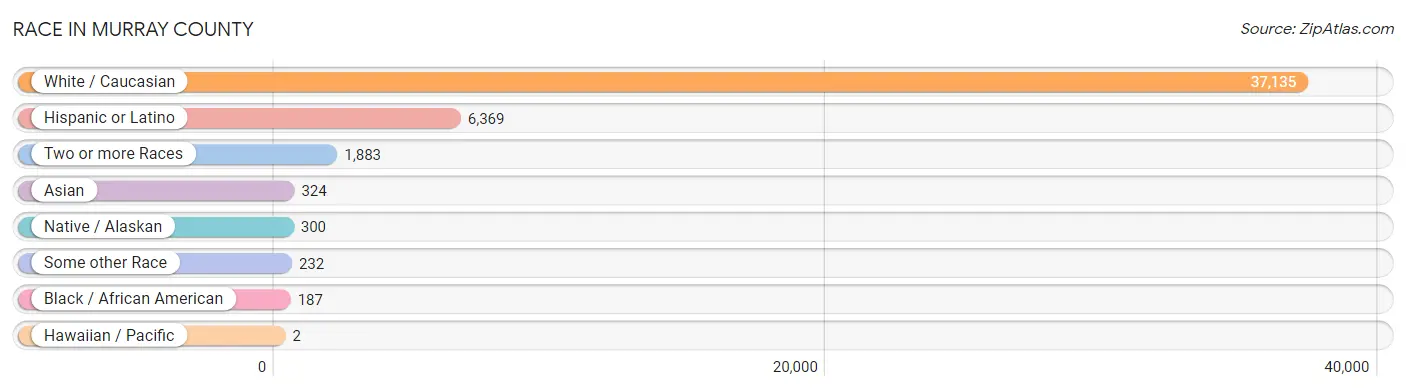
| Race | # Population | % Population |
| Asian | 324 | 0.8% |
| Black / African American | 187 | 0.5% |
| Hawaiian / Pacific | 2 | 0.0% |
| Hispanic or Latino | 6,369 | 15.9% |
| Native / Alaskan | 300 | 0.7% |
| White / Caucasian | 37,135 | 92.7% |
| Two or more Races | 1,883 | 4.7% |
| Some other Race | 232 | 0.6% |
| Total | 40,063 | 100.0% |
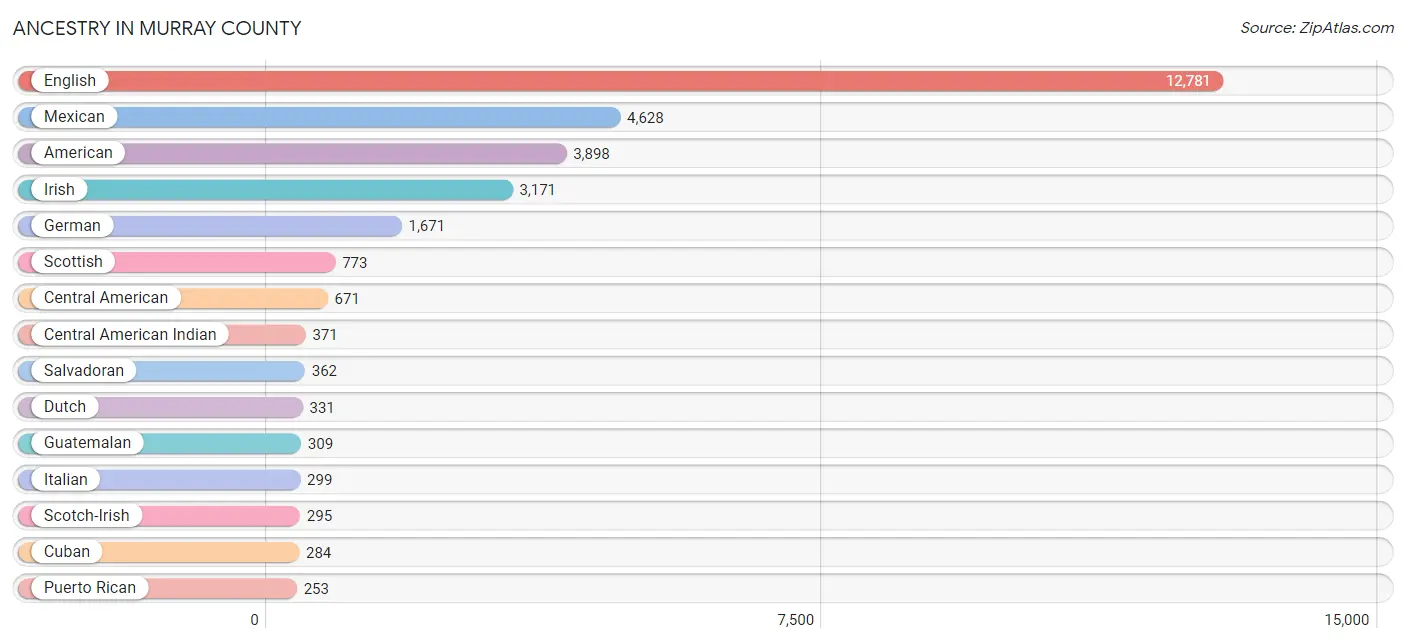
Ancestry in Murray County
The most populous ancestries reported in Murray County are English (12,781 | 31.9%), Mexican (4,628 | 11.6%), American (3,898 | 9.7%), Irish (3,171 | 7.9%), and German (1,671 | 4.2%), together accounting for 65.3% of all Murray County residents.
| Ancestry | # Population | % Population |
| African | 10 | 0.0% |
| American | 3,898 | 9.7% |
| Austrian | 5 | 0.0% |
| British | 193 | 0.5% |
| Cajun | 26 | 0.1% |
| Canadian | 23 | 0.1% |
| Central American | 671 | 1.7% |
| Central American Indian | 371 | 0.9% |
| Cherokee | 175 | 0.4% |
| Cuban | 284 | 0.7% |
| Czech | 7 | 0.0% |
| Danish | 49 | 0.1% |
| Dominican | 14 | 0.0% |
| Dutch | 331 | 0.8% |
| Eastern European | 27 | 0.1% |
| English | 12,781 | 31.9% |
| European | 148 | 0.4% |
| French | 251 | 0.6% |
| German | 1,671 | 4.2% |
| Guamanian / Chamorro | 2 | 0.0% |
| Guatemalan | 309 | 0.8% |
| Irish | 3,171 | 7.9% |
| Italian | 299 | 0.7% |
| Latvian | 6 | 0.0% |
| Mexican | 4,628 | 11.6% |
| Mexican American Indian | 153 | 0.4% |
| Nigerian | 6 | 0.0% |
| Northern European | 16 | 0.0% |
| Norwegian | 41 | 0.1% |
| Okinawan | 51 | 0.1% |
| Peruvian | 152 | 0.4% |
| Polish | 233 | 0.6% |
| Portuguese | 20 | 0.1% |
| Puerto Rican | 253 | 0.6% |
| Puget Sound Salish | 22 | 0.1% |
| Salvadoran | 362 | 0.9% |
| Scandinavian | 55 | 0.1% |
| Scotch-Irish | 295 | 0.7% |
| Scottish | 773 | 1.9% |
| Shoshone | 4 | 0.0% |
| South American | 152 | 0.4% |
| Spaniard | 43 | 0.1% |
| Sri Lankan | 76 | 0.2% |
| Subsaharan African | 10 | 0.0% |
| Swedish | 206 | 0.5% |
| Swiss | 22 | 0.1% |
| Thai | 197 | 0.5% |
| Welsh | 30 | 0.1% |
| Yakama | 22 | 0.1% | View All 49 Rows |
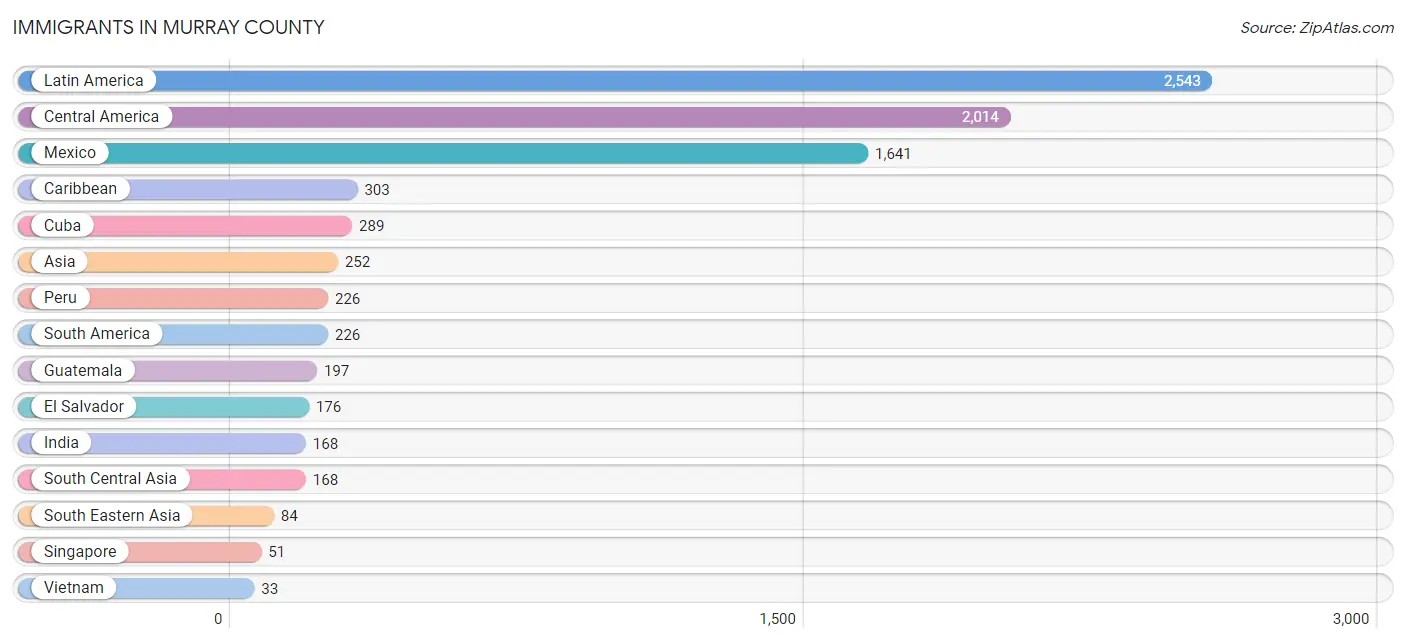
Immigrants in Murray County
The most numerous immigrant groups reported in Murray County came from Latin America (2,543 | 6.4%), Central America (2,014 | 5.0%), Mexico (1,641 | 4.1%), Caribbean (303 | 0.8%), and Cuba (289 | 0.7%), together accounting for 17.0% of all Murray County residents.
| Immigration Origin | # Population | % Population |
| Asia | 252 | 0.6% |
| Australia | 13 | 0.0% |
| Caribbean | 303 | 0.8% |
| Central America | 2,014 | 5.0% |
| Cuba | 289 | 0.7% |
| Dominican Republic | 14 | 0.0% |
| Eastern Europe | 12 | 0.0% |
| El Salvador | 176 | 0.4% |
| Europe | 12 | 0.0% |
| Guatemala | 197 | 0.5% |
| India | 168 | 0.4% |
| Latin America | 2,543 | 6.4% |
| Latvia | 6 | 0.0% |
| Mexico | 1,641 | 4.1% |
| Oceania | 13 | 0.0% |
| Peru | 226 | 0.6% |
| Poland | 6 | 0.0% |
| Singapore | 51 | 0.1% |
| South America | 226 | 0.6% |
| South Central Asia | 168 | 0.4% |
| South Eastern Asia | 84 | 0.2% |
| Vietnam | 33 | 0.1% | View All 22 Rows |
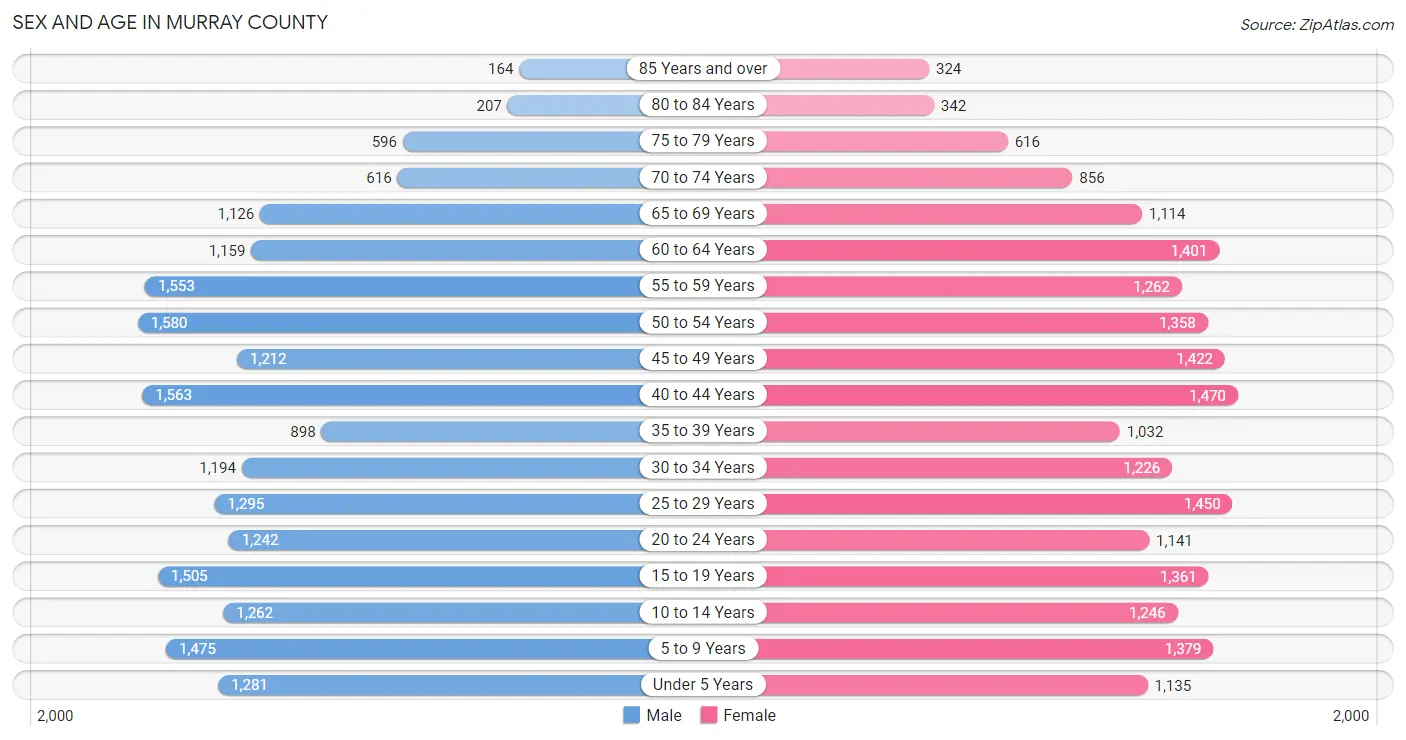
Sex and Age in Murray County
Sex and Age in Murray County
The most populous age groups in Murray County are 50 to 54 Years (1,580 | 7.9%) for men and 40 to 44 Years (1,470 | 7.3%) for women.
| Age Bracket | Male | Female |
| Under 5 Years | 1,281 (6.4%) | 1,135 (5.6%) |
| 5 to 9 Years | 1,475 (7.4%) | 1,379 (6.9%) |
| 10 to 14 Years | 1,262 (6.3%) | 1,246 (6.2%) |
| 15 to 19 Years | 1,505 (7.5%) | 1,361 (6.8%) |
| 20 to 24 Years | 1,242 (6.2%) | 1,141 (5.7%) |
| 25 to 29 Years | 1,295 (6.5%) | 1,450 (7.2%) |
| 30 to 34 Years | 1,194 (6.0%) | 1,226 (6.1%) |
| 35 to 39 Years | 898 (4.5%) | 1,032 (5.1%) |
| 40 to 44 Years | 1,563 (7.8%) | 1,470 (7.3%) |
| 45 to 49 Years | 1,212 (6.1%) | 1,422 (7.1%) |
| 50 to 54 Years | 1,580 (7.9%) | 1,358 (6.7%) |
| 55 to 59 Years | 1,553 (7.8%) | 1,262 (6.3%) |
| 60 to 64 Years | 1,159 (5.8%) | 1,401 (7.0%) |
| 65 to 69 Years | 1,126 (5.7%) | 1,114 (5.5%) |
| 70 to 74 Years | 616 (3.1%) | 856 (4.3%) |
| 75 to 79 Years | 596 (3.0%) | 616 (3.1%) |
| 80 to 84 Years | 207 (1.0%) | 342 (1.7%) |
| 85 Years and over | 164 (0.8%) | 324 (1.6%) |
| Total | 19,928 (100.0%) | 20,135 (100.0%) |
Families and Households in Murray County
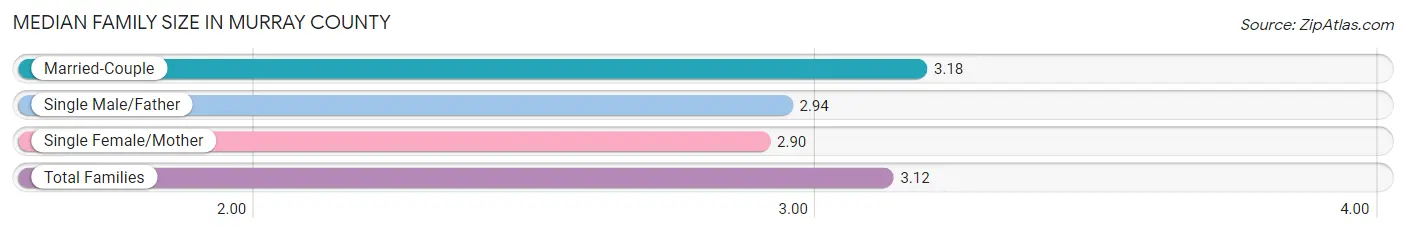
Median Family Size in Murray County
The median family size in Murray County is 3.12 persons per family, with married-couple families (8,333 | 76.2%) accounting for the largest median family size of 3.18 persons per family. On the other hand, single female/mother families (1,930 | 17.6%) represent the smallest median family size with 2.90 persons per family.
| Family Type | # Families | Family Size |
| Married-Couple | 8,333 (76.2%) | 3.18 |
| Single Male/Father | 676 (6.2%) | 2.94 |
| Single Female/Mother | 1,930 (17.6%) | 2.90 |
| Total Families | 10,939 (100.0%) | 3.12 |
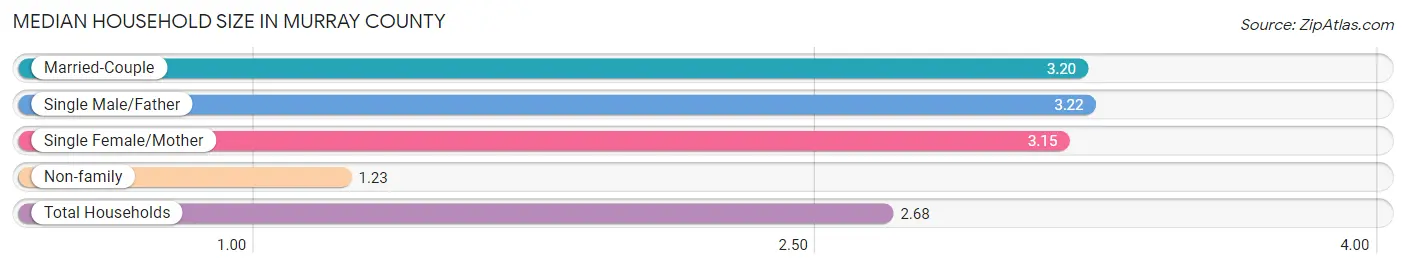
Median Household Size in Murray County
The median household size in Murray County is 2.68 persons per household, with single male/father households (676 | 4.5%) accounting for the largest median household size of 3.22 persons per household. non-family households (3,920 | 26.4%) represent the smallest median household size with 1.23 persons per household.
| Household Type | # Households | Household Size |
| Married-Couple | 8,333 (56.1%) | 3.20 |
| Single Male/Father | 676 (4.5%) | 3.22 |
| Single Female/Mother | 1,930 (13.0%) | 3.15 |
| Non-family | 3,920 (26.4%) | 1.23 |
| Total Households | 14,859 (100.0%) | 2.68 |
Household Size by Marriage Status in Murray County
Out of a total of 14,859 households in Murray County, 10,939 (73.6%) are family households, while 3,920 (26.4%) are nonfamily households. The most numerous type of family households are 2-person households, comprising 4,513, and the most common type of nonfamily households are 1-person households, comprising 3,256.
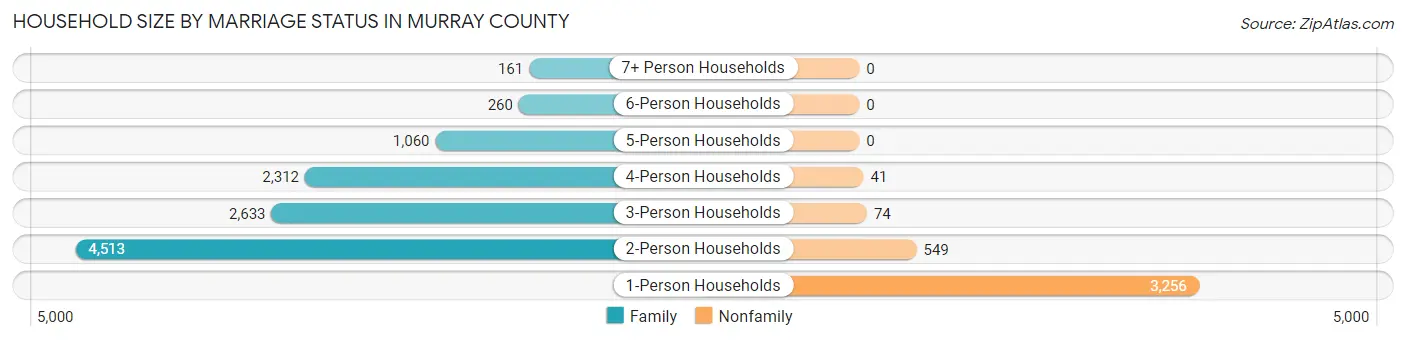
| Household Size | Family Households | Nonfamily Households |
| 1-Person Households | - | 3,256 (21.9%) |
| 2-Person Households | 4,513 (30.4%) | 549 (3.7%) |
| 3-Person Households | 2,633 (17.7%) | 74 (0.5%) |
| 4-Person Households | 2,312 (15.6%) | 41 (0.3%) |
| 5-Person Households | 1,060 (7.1%) | 0 (0.0%) |
| 6-Person Households | 260 (1.8%) | 0 (0.0%) |
| 7+ Person Households | 161 (1.1%) | 0 (0.0%) |
| Total | 10,939 (73.6%) | 3,920 (26.4%) |
Female Fertility in Murray County
Fertility by Age in Murray County
Average fertility rate in Murray County is 55.0 births per 1,000 women. Women in the age bracket of 20 to 34 years have the highest fertility rate with 123.0 births per 1,000 women. Women in the age bracket of 20 to 34 years acount for 92.5% of all women with births.
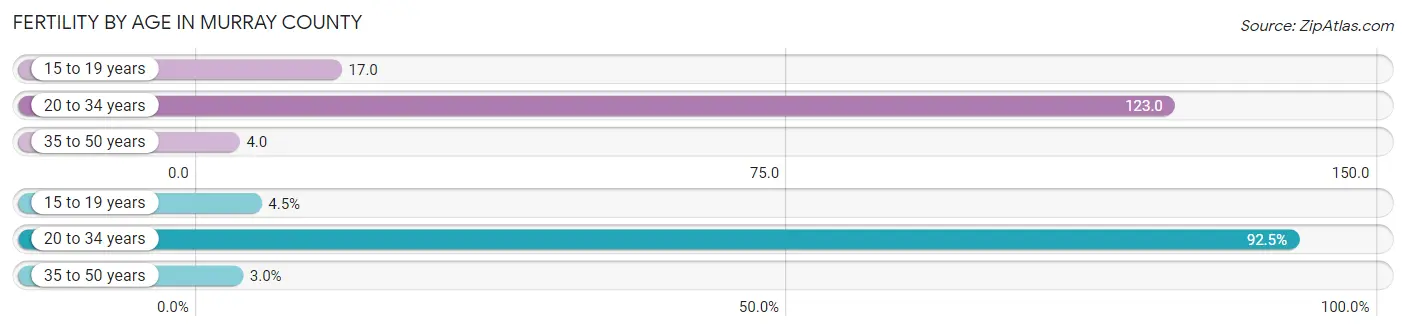
| Age Bracket | Women with Births | Births / 1,000 Women |
| 15 to 19 years | 23 (4.5%) | 17.0 |
| 20 to 34 years | 471 (92.5%) | 123.0 |
| 35 to 50 years | 15 (2.9%) | 4.0 |
| Total | 509 (100.0%) | 55.0 |
Fertility by Age by Marriage Status in Murray County
67.0% of women with births (509) in Murray County are married. The highest percentage of unmarried women with births falls into 15 to 19 years age bracket with 100.0% of them unmarried at the time of birth, while the lowest percentage of unmarried women with births belong to 35 to 50 years age bracket with 0.0% of them unmarried.
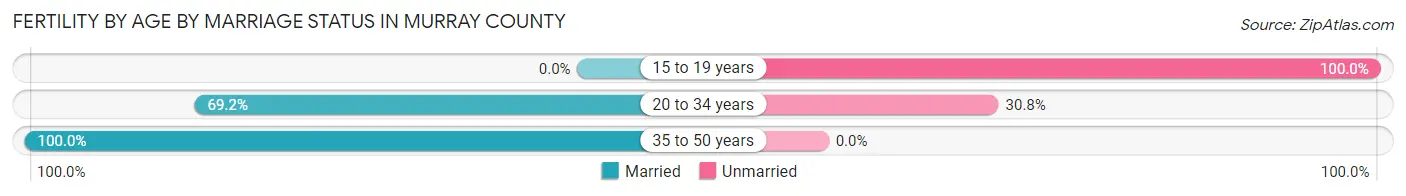
| Age Bracket | Married | Unmarried |
| 15 to 19 years | 0 (0.0%) | 23 (100.0%) |
| 20 to 34 years | 326 (69.2%) | 145 (30.8%) |
| 35 to 50 years | 15 (100.0%) | 0 (0.0%) |
| Total | 341 (67.0%) | 168 (33.0%) |
Fertility by Education in Murray County
Average fertility rate in Murray County is 55.0 births per 1,000 women. Women with the education attainment of graduate degree have the highest fertility rate of 152.0 births per 1,000 women, while women with the education attainment of bachelor's degree have the lowest fertility at 14.0 births per 1,000 women. Women with the education attainment of high school diploma represent 60.7% of all women with births.

| Educational Attainment | Women with Births | Births / 1,000 Women |
| Less than High School | 39 (7.7%) | 19.0 |
| High School Diploma | 309 (60.7%) | 100.0 |
| College or Associate's Degree | 95 (18.7%) | 30.0 |
| Bachelor's Degree | 10 (2.0%) | 14.0 |
| Graduate Degree | 56 (11.0%) | 152.0 |
| Total | 509 (100.0%) | 55.0 |
Fertility by Education by Marriage Status in Murray County
33.0% of women with births in Murray County are unmarried. Women with the educational attainment of bachelor's degree are most likely to be married with 100.0% of them married at childbirth, while women with the educational attainment of less than high school are least likely to be married with 59.0% of them unmarried at childbirth.
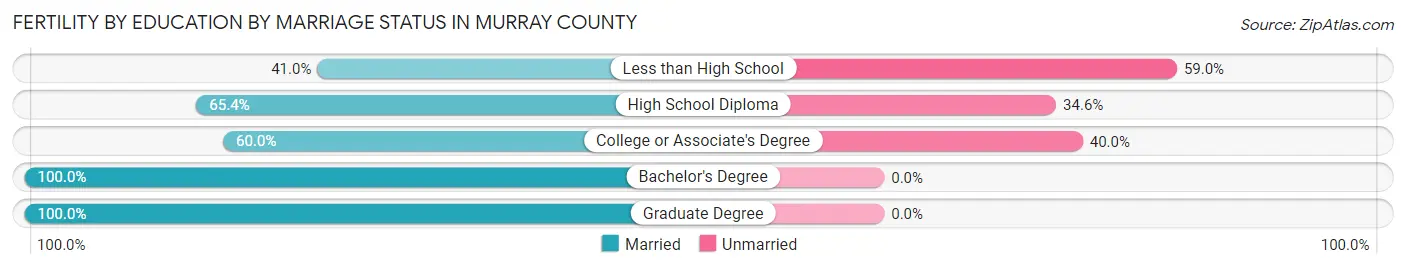
| Educational Attainment | Married | Unmarried |
| Less than High School | 16 (41.0%) | 23 (59.0%) |
| High School Diploma | 202 (65.4%) | 107 (34.6%) |
| College or Associate's Degree | 57 (60.0%) | 38 (40.0%) |
| Bachelor's Degree | 10 (100.0%) | 0 (0.0%) |
| Graduate Degree | 56 (100.0%) | 0 (0.0%) |
| Total | 341 (67.0%) | 168 (33.0%) |
Employment Characteristics in Murray County
Employment by Class of Employer in Murray County
Among the 17,719 employed individuals in Murray County, private company employees (14,483 | 81.7%), local government employees (1,292 | 7.3%), and not-for-profit organizations (622 | 3.5%) make up the most common classes of employment.
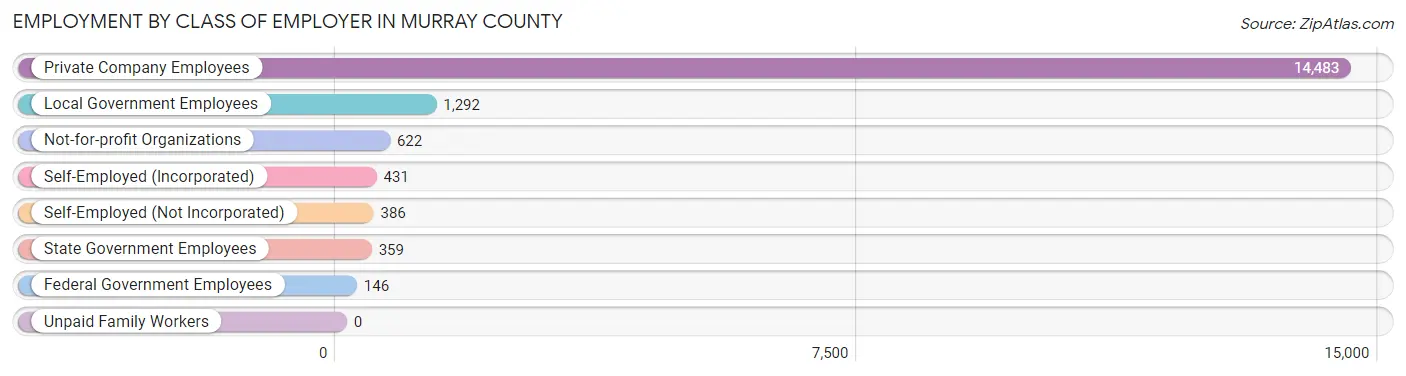
| Employer Class | # Employees | % Employees |
| Private Company Employees | 14,483 | 81.7% |
| Self-Employed (Incorporated) | 431 | 2.4% |
| Self-Employed (Not Incorporated) | 386 | 2.2% |
| Not-for-profit Organizations | 622 | 3.5% |
| Local Government Employees | 1,292 | 7.3% |
| State Government Employees | 359 | 2.0% |
| Federal Government Employees | 146 | 0.8% |
| Unpaid Family Workers | 0 | 0.0% |
| Total | 17,719 | 100.0% |
Employment Status by Age in Murray County
According to the labor force statistics for Murray County, out of the total population over 16 years of age (31,590), 60.7% or 19,175 individuals are in the labor force, with 6.7% or 1,285 of them unemployed. The age group with the highest labor force participation rate is 20 to 24 years, with 83.3% or 1,985 individuals in the labor force. Within the labor force, the 25 to 29 years age range has the highest percentage of unemployed individuals, with 18.1% or 385 of them being unemployed.
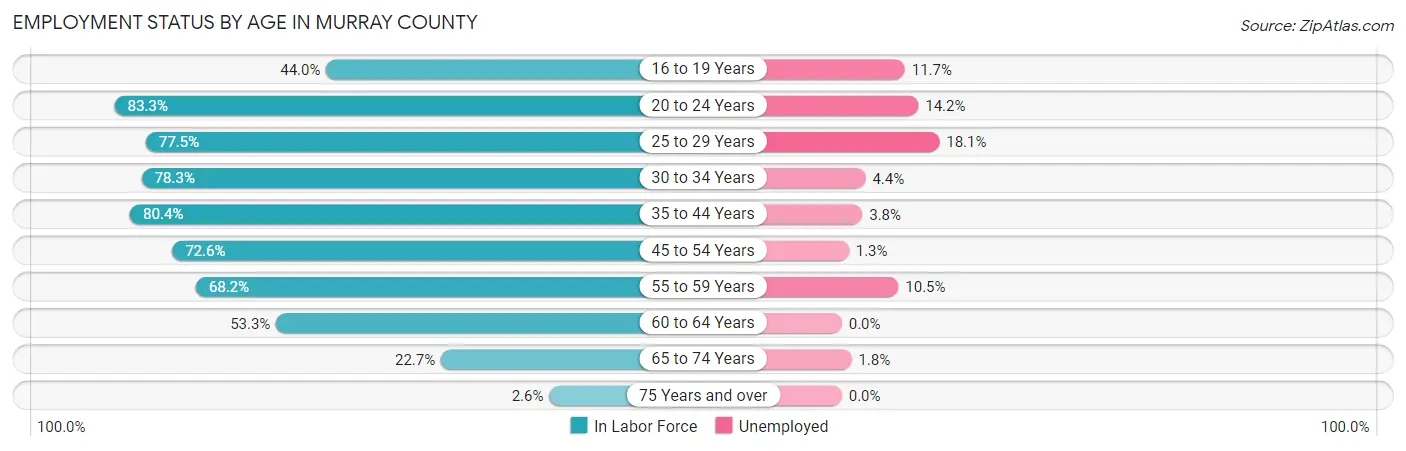
| Age Bracket | In Labor Force | Unemployed |
| 16 to 19 Years | 955 (44.0%) | 112 (11.7%) |
| 20 to 24 Years | 1,985 (83.3%) | 282 (14.2%) |
| 25 to 29 Years | 2,127 (77.5%) | 385 (18.1%) |
| 30 to 34 Years | 1,895 (78.3%) | 83 (4.4%) |
| 35 to 44 Years | 3,990 (80.4%) | 152 (3.8%) |
| 45 to 54 Years | 4,045 (72.6%) | 53 (1.3%) |
| 55 to 59 Years | 1,920 (68.2%) | 202 (10.5%) |
| 60 to 64 Years | 1,364 (53.3%) | 0 (0.0%) |
| 65 to 74 Years | 843 (22.7%) | 15 (1.8%) |
| 75 Years and over | 58 (2.6%) | 0 (0.0%) |
| Total | 19,175 (60.7%) | 1,285 (6.7%) |
Employment Status by Educational Attainment in Murray County
According to labor force statistics for Murray County, 72.8% of individuals (15,343) out of the total population between 25 and 64 years of age (21,075) are in the labor force, with 5.7% or 875 of them being unemployed. The group with the highest labor force participation rate are those with the educational attainment of bachelor's degree or higher, with 85.3% or 2,162 individuals in the labor force. Within the labor force, individuals with college / associate degree education have the highest percentage of unemployment, with 11.7% or 575 of them being unemployed.
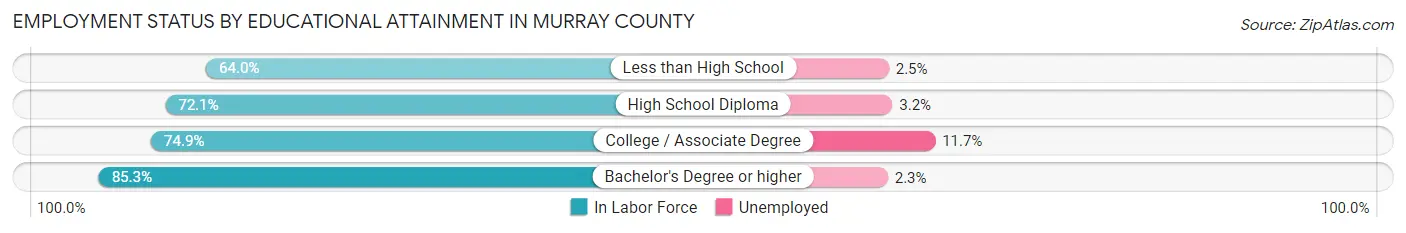
| Educational Attainment | In Labor Force | Unemployed |
| Less than High School | 2,851 (64.0%) | 111 (2.5%) |
| High School Diploma | 5,422 (72.1%) | 241 (3.2%) |
| College / Associate Degree | 4,917 (74.9%) | 768 (11.7%) |
| Bachelor's Degree or higher | 2,162 (85.3%) | 58 (2.3%) |
| Total | 15,343 (72.8%) | 1,201 (5.7%) |
Employment Occupations by Sex in Murray County
Management, Business, Science and Arts Occupations
The most common Management, Business, Science and Arts occupations in Murray County are Management (1,311 | 7.3%), Community & Social Service (1,208 | 6.8%), Education Instruction & Library (855 | 4.8%), Computers, Engineering & Science (562 | 3.1%), and Health Diagnosing & Treating (514 | 2.9%).
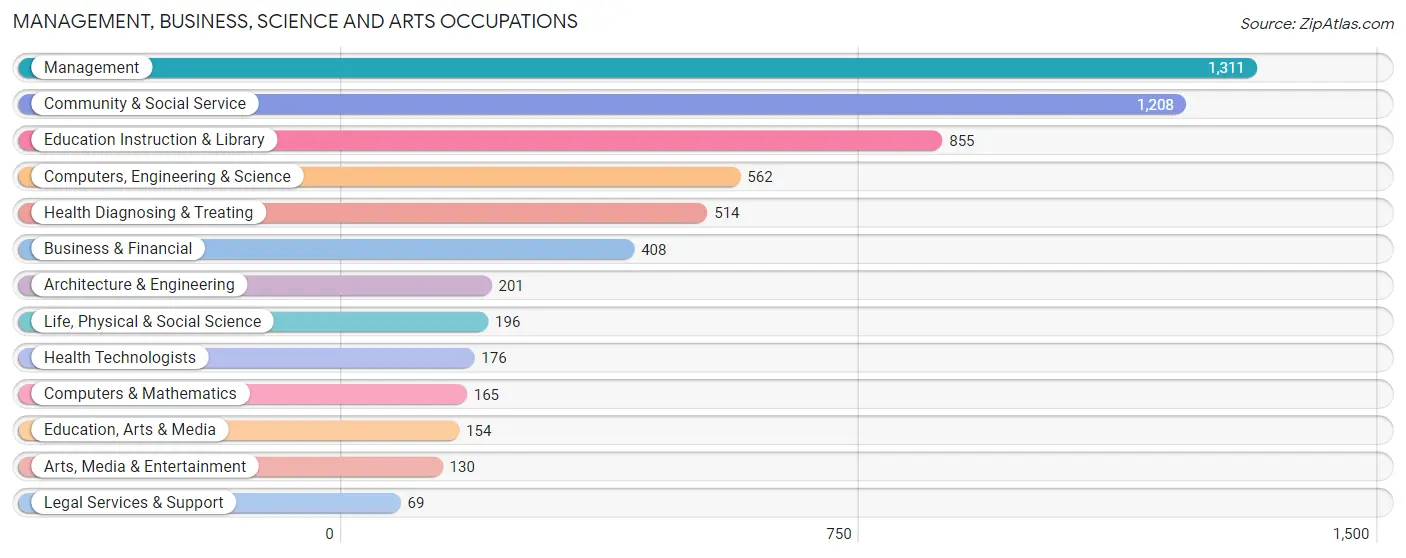
Management, Business, Science and Arts Occupations by Sex
Within the Management, Business, Science and Arts occupations in Murray County, the most male-oriented occupations are Architecture & Engineering (90.0%), Arts, Media & Entertainment (84.6%), and Computers & Mathematics (81.8%), while the most female-oriented occupations are Health Diagnosing & Treating (91.0%), Health Technologists (88.6%), and Legal Services & Support (84.1%).
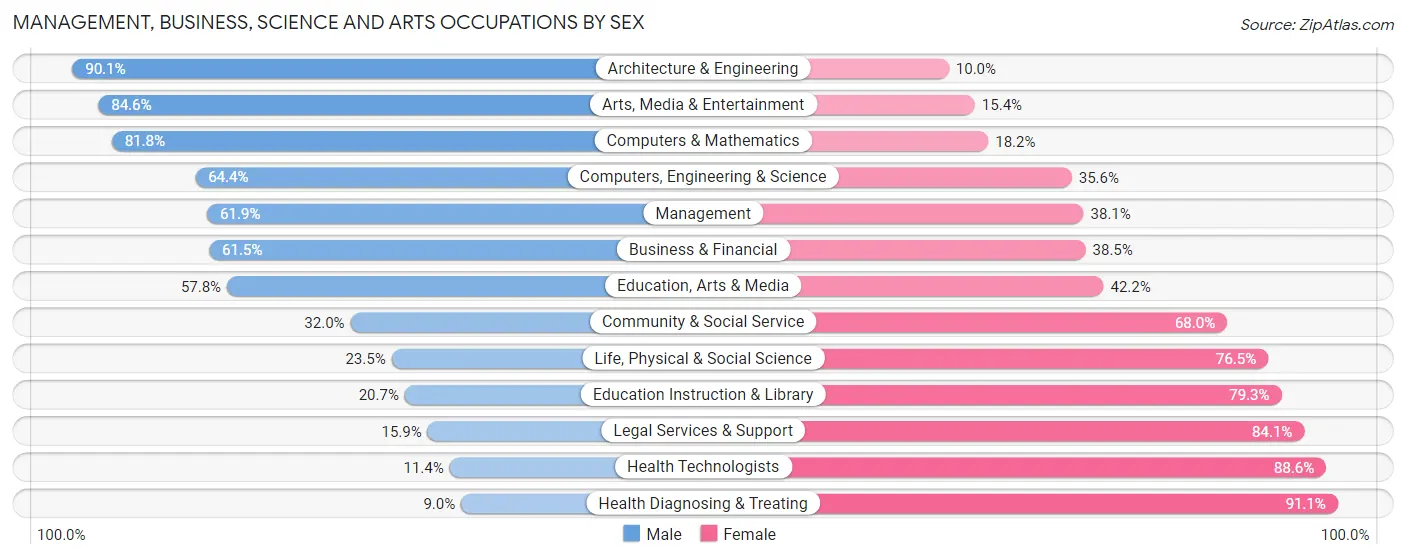
| Occupation | Male | Female |
| Management | 812 (61.9%) | 499 (38.1%) |
| Business & Financial | 251 (61.5%) | 157 (38.5%) |
| Computers, Engineering & Science | 362 (64.4%) | 200 (35.6%) |
| Computers & Mathematics | 135 (81.8%) | 30 (18.2%) |
| Architecture & Engineering | 181 (90.0%) | 20 (10.0%) |
| Life, Physical & Social Science | 46 (23.5%) | 150 (76.5%) |
| Community & Social Service | 387 (32.0%) | 821 (68.0%) |
| Education, Arts & Media | 89 (57.8%) | 65 (42.2%) |
| Legal Services & Support | 11 (15.9%) | 58 (84.1%) |
| Education Instruction & Library | 177 (20.7%) | 678 (79.3%) |
| Arts, Media & Entertainment | 110 (84.6%) | 20 (15.4%) |
| Health Diagnosing & Treating | 46 (8.9%) | 468 (91.0%) |
| Health Technologists | 20 (11.4%) | 156 (88.6%) |
| Total (Category) | 1,858 (46.4%) | 2,145 (53.6%) |
| Total (Overall) | 9,861 (55.1%) | 8,034 (44.9%) |
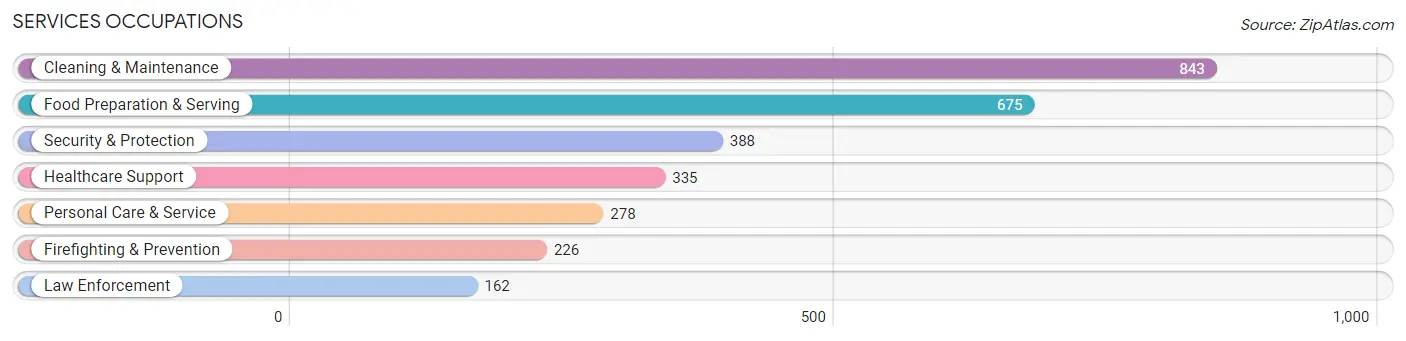
Services Occupations
The most common Services occupations in Murray County are Cleaning & Maintenance (843 | 4.7%), Food Preparation & Serving (675 | 3.8%), Security & Protection (388 | 2.2%), Healthcare Support (335 | 1.9%), and Personal Care & Service (278 | 1.5%).
Services Occupations by Sex
Within the Services occupations in Murray County, the most male-oriented occupations are Firefighting & Prevention (95.6%), Security & Protection (83.5%), and Cleaning & Maintenance (73.1%), while the most female-oriented occupations are Healthcare Support (83.6%), Personal Care & Service (83.5%), and Food Preparation & Serving (82.5%).
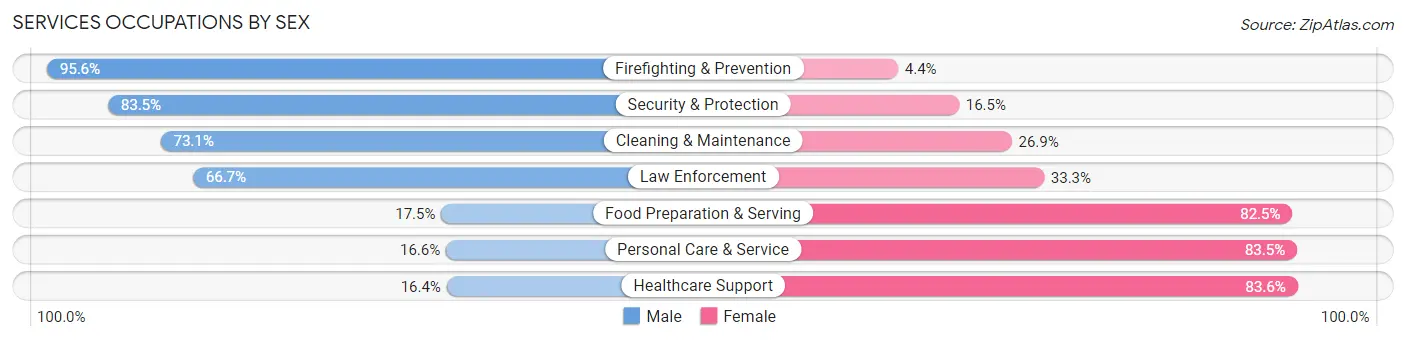
| Occupation | Male | Female |
| Healthcare Support | 55 (16.4%) | 280 (83.6%) |
| Security & Protection | 324 (83.5%) | 64 (16.5%) |
| Firefighting & Prevention | 216 (95.6%) | 10 (4.4%) |
| Law Enforcement | 108 (66.7%) | 54 (33.3%) |
| Food Preparation & Serving | 118 (17.5%) | 557 (82.5%) |
| Cleaning & Maintenance | 616 (73.1%) | 227 (26.9%) |
| Personal Care & Service | 46 (16.6%) | 232 (83.5%) |
| Total (Category) | 1,159 (46.0%) | 1,360 (54.0%) |
| Total (Overall) | 9,861 (55.1%) | 8,034 (44.9%) |
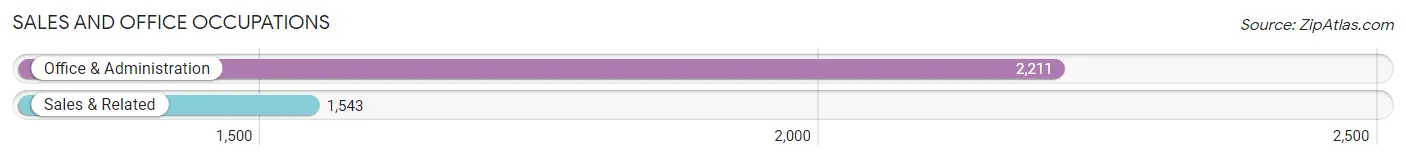
Sales and Office Occupations
The most common Sales and Office occupations in Murray County are Office & Administration (2,211 | 12.4%), and Sales & Related (1,543 | 8.6%).
Sales and Office Occupations by Sex
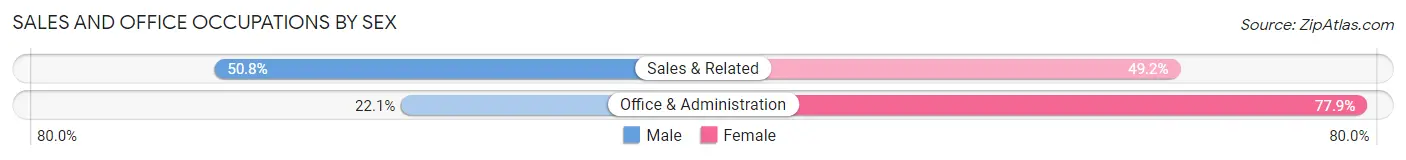
| Occupation | Male | Female |
| Sales & Related | 784 (50.8%) | 759 (49.2%) |
| Office & Administration | 488 (22.1%) | 1,723 (77.9%) |
| Total (Category) | 1,272 (33.9%) | 2,482 (66.1%) |
| Total (Overall) | 9,861 (55.1%) | 8,034 (44.9%) |
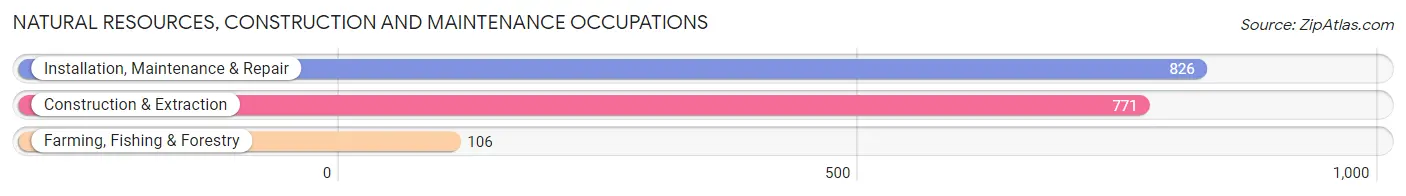
Natural Resources, Construction and Maintenance Occupations
The most common Natural Resources, Construction and Maintenance occupations in Murray County are Installation, Maintenance & Repair (826 | 4.6%), Construction & Extraction (771 | 4.3%), and Farming, Fishing & Forestry (106 | 0.6%).
Natural Resources, Construction and Maintenance Occupations by Sex
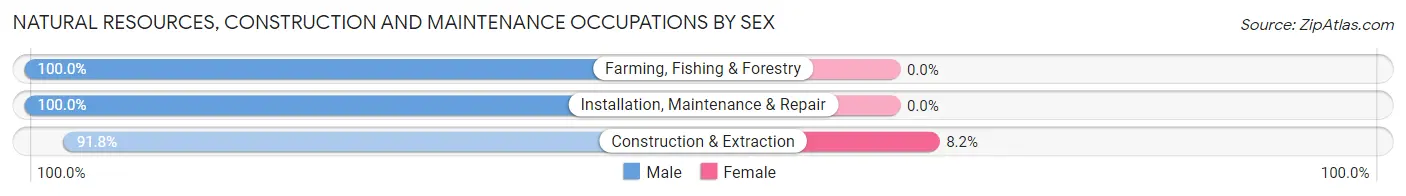
| Occupation | Male | Female |
| Farming, Fishing & Forestry | 106 (100.0%) | 0 (0.0%) |
| Construction & Extraction | 708 (91.8%) | 63 (8.2%) |
| Installation, Maintenance & Repair | 826 (100.0%) | 0 (0.0%) |
| Total (Category) | 1,640 (96.3%) | 63 (3.7%) |
| Total (Overall) | 9,861 (55.1%) | 8,034 (44.9%) |
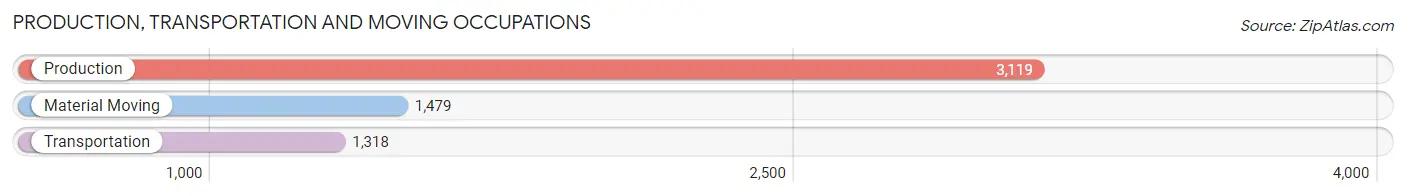
Production, Transportation and Moving Occupations
The most common Production, Transportation and Moving occupations in Murray County are Production (3,119 | 17.4%), Material Moving (1,479 | 8.3%), and Transportation (1,318 | 7.4%).
Production, Transportation and Moving Occupations by Sex
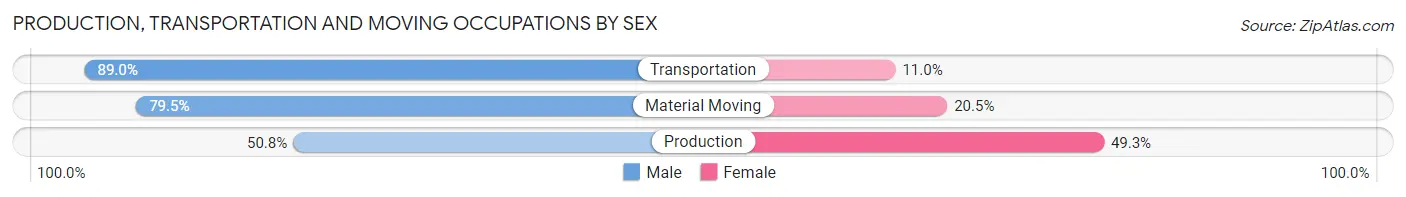
| Occupation | Male | Female |
| Production | 1,583 (50.7%) | 1,536 (49.2%) |
| Transportation | 1,173 (89.0%) | 145 (11.0%) |
| Material Moving | 1,176 (79.5%) | 303 (20.5%) |
| Total (Category) | 3,932 (66.5%) | 1,984 (33.5%) |
| Total (Overall) | 9,861 (55.1%) | 8,034 (44.9%) |
Employment Industries by Sex in Murray County
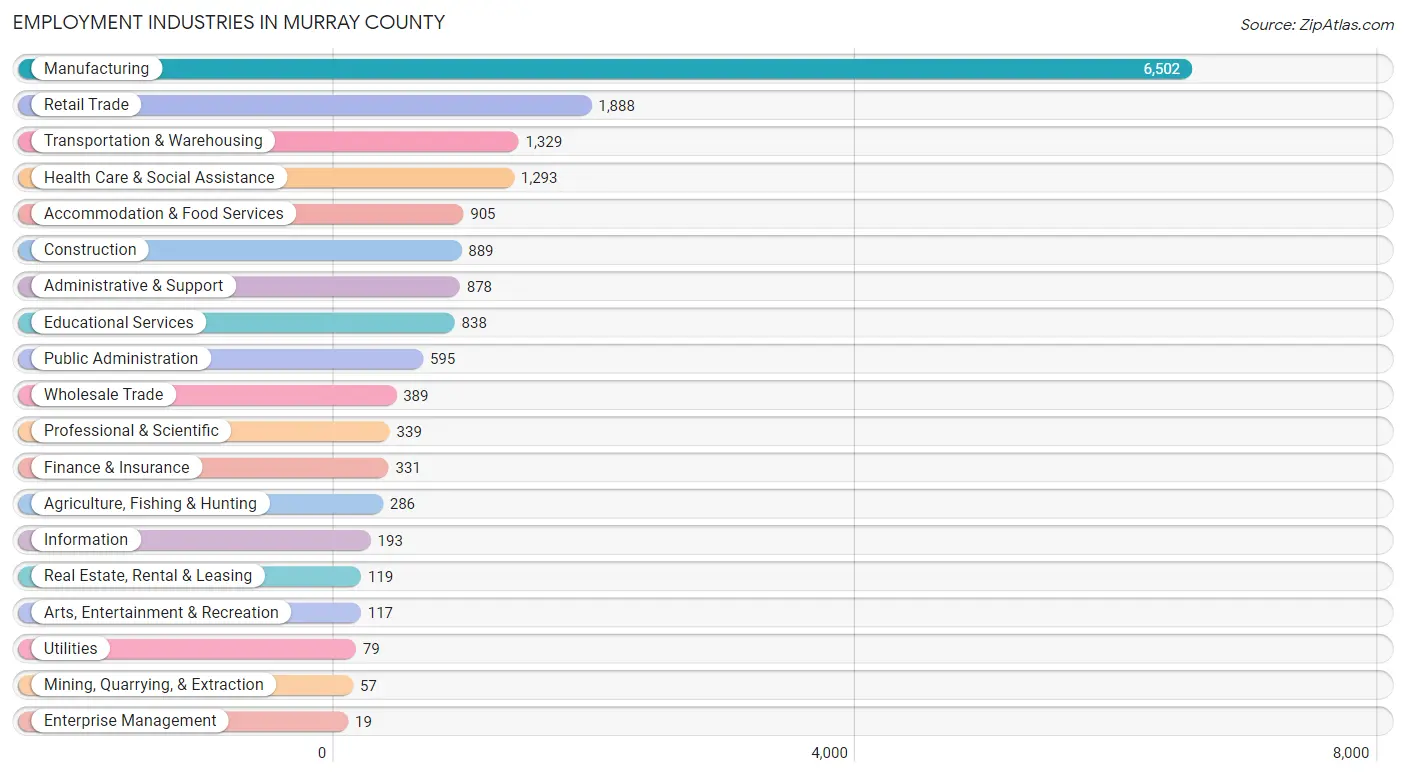
Employment Industries in Murray County
The major employment industries in Murray County include Manufacturing (6,502 | 36.3%), Retail Trade (1,888 | 10.5%), Transportation & Warehousing (1,329 | 7.4%), Health Care & Social Assistance (1,293 | 7.2%), and Accommodation & Food Services (905 | 5.1%).
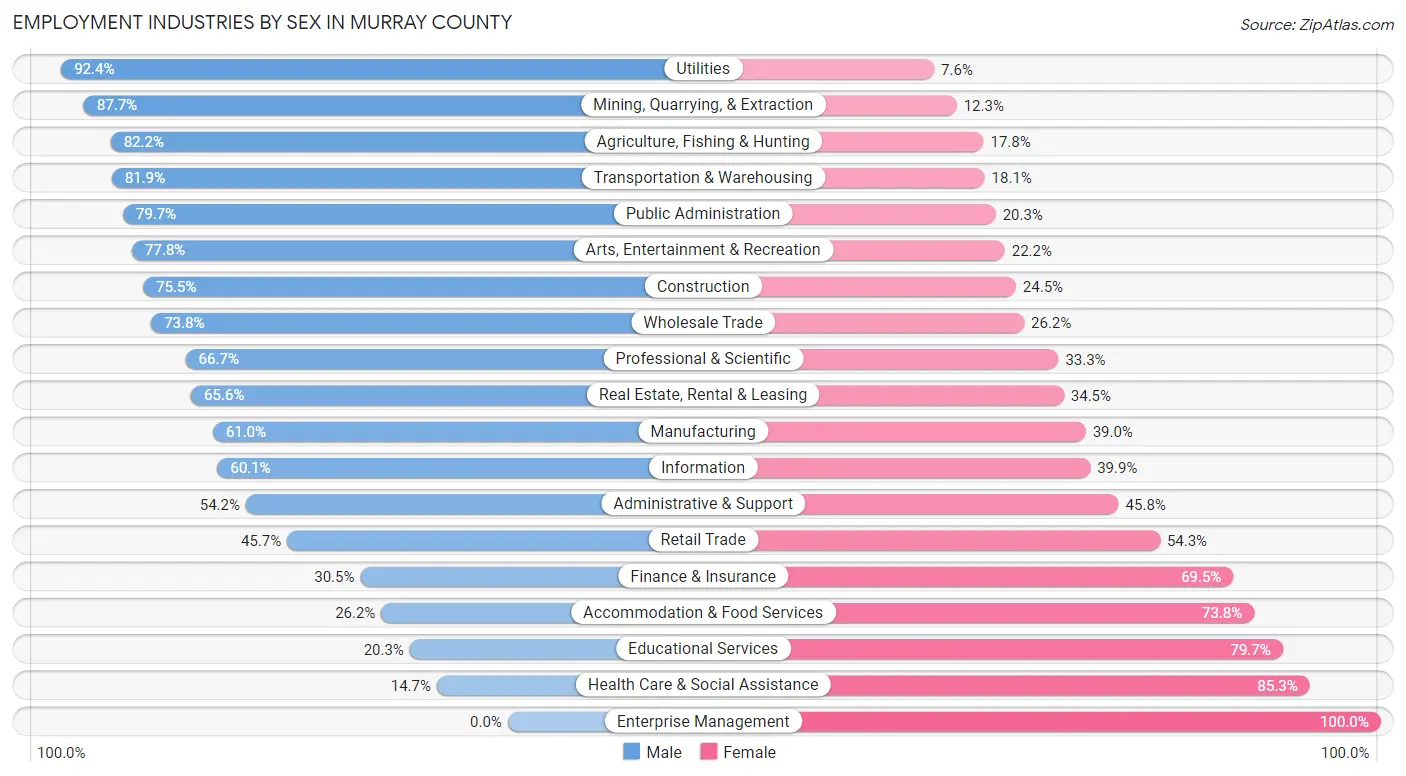
Employment Industries by Sex in Murray County
The Murray County industries that see more men than women are Utilities (92.4%), Mining, Quarrying, & Extraction (87.7%), and Agriculture, Fishing & Hunting (82.2%), whereas the industries that tend to have a higher number of women are Enterprise Management (100.0%), Health Care & Social Assistance (85.3%), and Educational Services (79.7%).
| Industry | Male | Female |
| Agriculture, Fishing & Hunting | 235 (82.2%) | 51 (17.8%) |
| Mining, Quarrying, & Extraction | 50 (87.7%) | 7 (12.3%) |
| Construction | 671 (75.5%) | 218 (24.5%) |
| Manufacturing | 3,968 (61.0%) | 2,534 (39.0%) |
| Wholesale Trade | 287 (73.8%) | 102 (26.2%) |
| Retail Trade | 862 (45.7%) | 1,026 (54.3%) |
| Transportation & Warehousing | 1,089 (81.9%) | 240 (18.1%) |
| Utilities | 73 (92.4%) | 6 (7.6%) |
| Information | 116 (60.1%) | 77 (39.9%) |
| Finance & Insurance | 101 (30.5%) | 230 (69.5%) |
| Real Estate, Rental & Leasing | 78 (65.5%) | 41 (34.4%) |
| Professional & Scientific | 226 (66.7%) | 113 (33.3%) |
| Enterprise Management | 0 (0.0%) | 19 (100.0%) |
| Administrative & Support | 476 (54.2%) | 402 (45.8%) |
| Educational Services | 170 (20.3%) | 668 (79.7%) |
| Health Care & Social Assistance | 190 (14.7%) | 1,103 (85.3%) |
| Arts, Entertainment & Recreation | 91 (77.8%) | 26 (22.2%) |
| Accommodation & Food Services | 237 (26.2%) | 668 (73.8%) |
| Public Administration | 474 (79.7%) | 121 (20.3%) |
| Total | 9,861 (55.1%) | 8,034 (44.9%) |
Education in Murray County
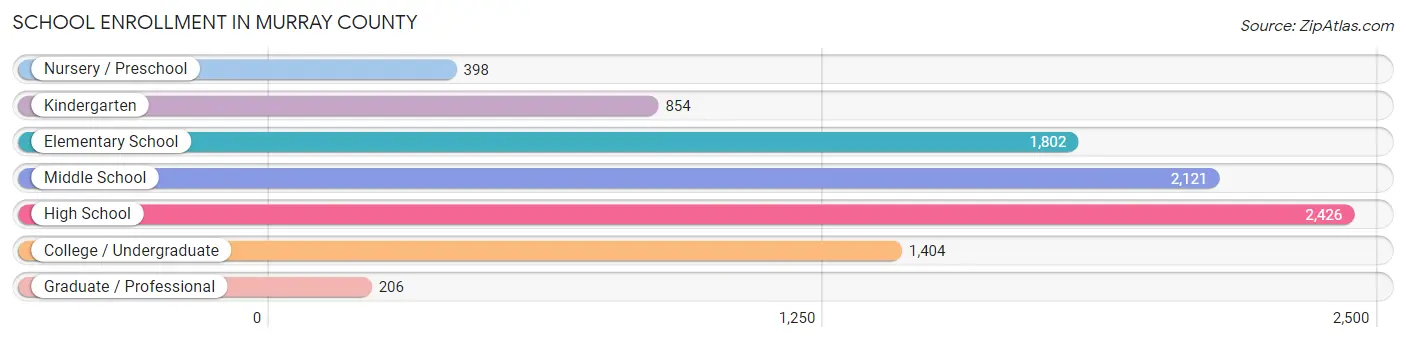
School Enrollment in Murray County
The most common levels of schooling among the 9,211 students in Murray County are high school (2,426 | 26.3%), middle school (2,121 | 23.0%), and elementary school (1,802 | 19.6%).
| School Level | # Students | % Students |
| Nursery / Preschool | 398 | 4.3% |
| Kindergarten | 854 | 9.3% |
| Elementary School | 1,802 | 19.6% |
| Middle School | 2,121 | 23.0% |
| High School | 2,426 | 26.3% |
| College / Undergraduate | 1,404 | 15.2% |
| Graduate / Professional | 206 | 2.2% |
| Total | 9,211 | 100.0% |
School Enrollment by Age by Funding Source in Murray County
Out of a total of 9,211 students who are enrolled in schools in Murray County, 645 (7.0%) attend a private institution, while the remaining 8,566 (93.0%) are enrolled in public schools. The age group of 25 to 34 year olds has the highest likelihood of being enrolled in private schools, with 210 (51.7% in the age bracket) enrolled. Conversely, the age group of 20 to 24 year olds has the lowest likelihood of being enrolled in a private school, with 730 (98.1% in the age bracket) attending a public institution.
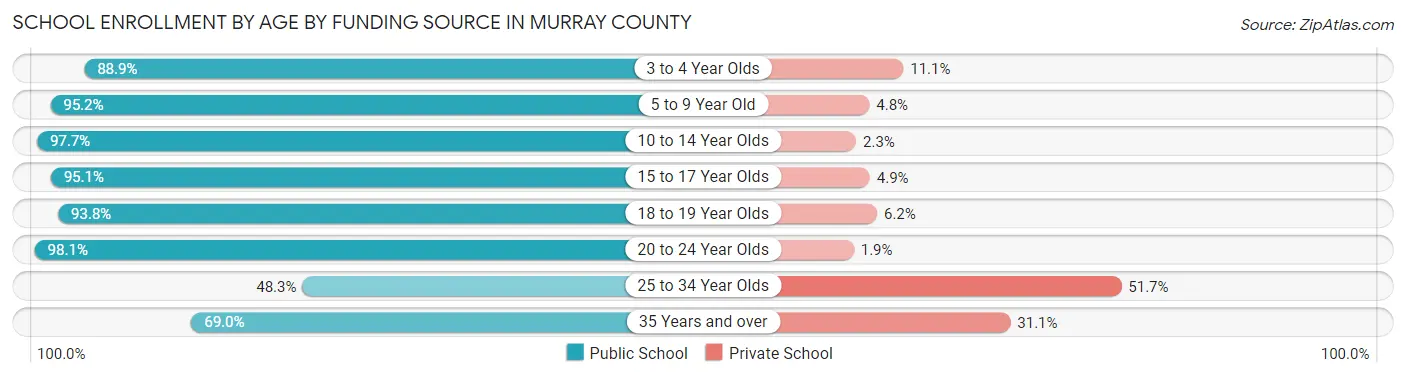
| Age Bracket | Public School | Private School |
| 3 to 4 Year Olds | 256 (88.9%) | 32 (11.1%) |
| 5 to 9 Year Old | 2,564 (95.2%) | 129 (4.8%) |
| 10 to 14 Year Olds | 2,450 (97.7%) | 58 (2.3%) |
| 15 to 17 Year Olds | 1,659 (95.1%) | 85 (4.9%) |
| 18 to 19 Year Olds | 544 (93.8%) | 36 (6.2%) |
| 20 to 24 Year Olds | 730 (98.1%) | 14 (1.9%) |
| 25 to 34 Year Olds | 196 (48.3%) | 210 (51.7%) |
| 35 Years and over | 171 (69.0%) | 77 (31.0%) |
| Total | 8,566 (93.0%) | 645 (7.0%) |
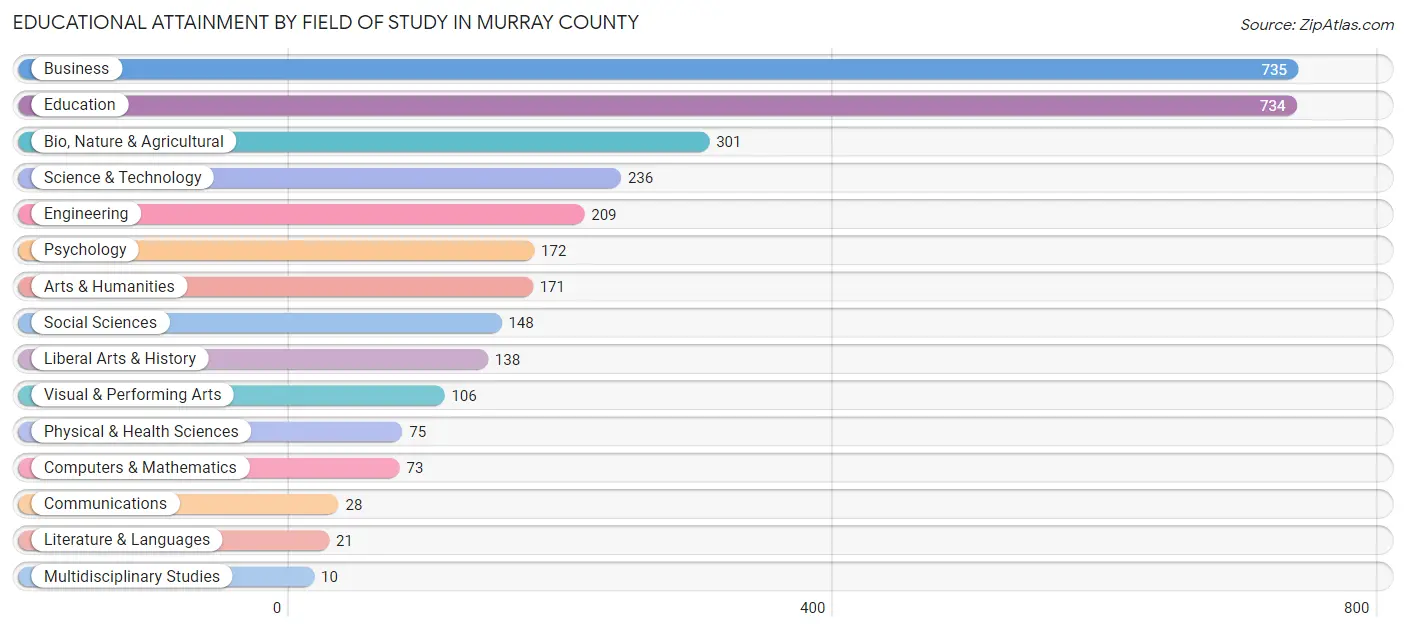
Educational Attainment by Field of Study in Murray County
Business (735 | 23.3%), education (734 | 23.3%), bio, nature & agricultural (301 | 9.5%), science & technology (236 | 7.5%), and engineering (209 | 6.6%) are the most common fields of study among 3,157 individuals in Murray County who have obtained a bachelor's degree or higher.
| Field of Study | # Graduates | % Graduates |
| Computers & Mathematics | 73 | 2.3% |
| Bio, Nature & Agricultural | 301 | 9.5% |
| Physical & Health Sciences | 75 | 2.4% |
| Psychology | 172 | 5.4% |
| Social Sciences | 148 | 4.7% |
| Engineering | 209 | 6.6% |
| Multidisciplinary Studies | 10 | 0.3% |
| Science & Technology | 236 | 7.5% |
| Business | 735 | 23.3% |
| Education | 734 | 23.3% |
| Literature & Languages | 21 | 0.7% |
| Liberal Arts & History | 138 | 4.4% |
| Visual & Performing Arts | 106 | 3.4% |
| Communications | 28 | 0.9% |
| Arts & Humanities | 171 | 5.4% |
| Total | 3,157 | 100.0% |
Transportation & Commute in Murray County
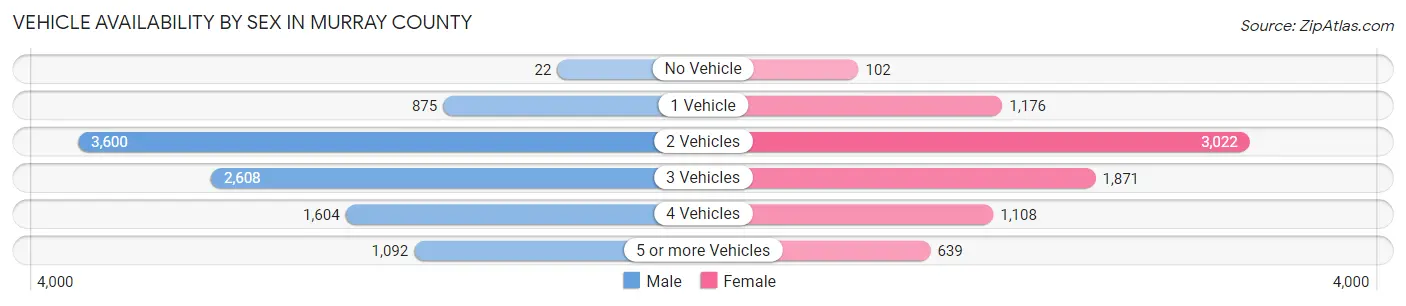
Vehicle Availability by Sex in Murray County
The most prevalent vehicle ownership categories in Murray County are males with 2 vehicles (3,600, accounting for 36.7%) and females with 2 vehicles (3,022, making up 45.5%).
| Vehicles Available | Male | Female |
| No Vehicle | 22 (0.2%) | 102 (1.3%) |
| 1 Vehicle | 875 (8.9%) | 1,176 (14.8%) |
| 2 Vehicles | 3,600 (36.7%) | 3,022 (38.2%) |
| 3 Vehicles | 2,608 (26.6%) | 1,871 (23.6%) |
| 4 Vehicles | 1,604 (16.4%) | 1,108 (14.0%) |
| 5 or more Vehicles | 1,092 (11.1%) | 639 (8.1%) |
| Total | 9,801 (100.0%) | 7,918 (100.0%) |
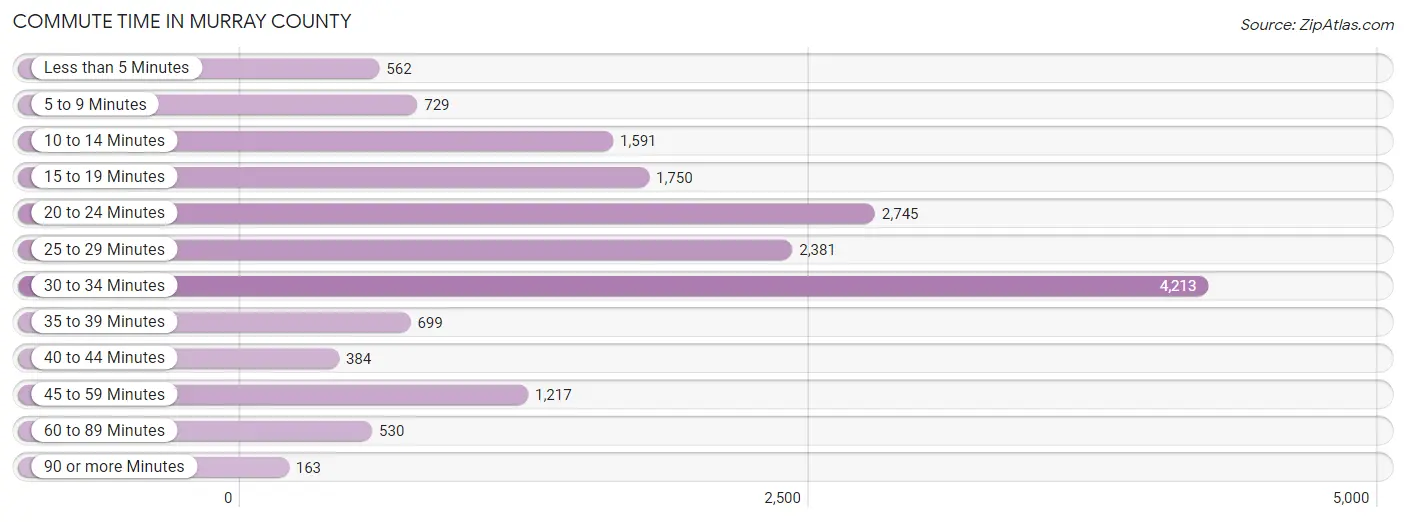
Commute Time in Murray County
The most frequently occuring commute durations in Murray County are 30 to 34 minutes (4,213 commuters, 24.8%), 20 to 24 minutes (2,745 commuters, 16.2%), and 25 to 29 minutes (2,381 commuters, 14.0%).
| Commute Time | # Commuters | % Commuters |
| Less than 5 Minutes | 562 | 3.3% |
| 5 to 9 Minutes | 729 | 4.3% |
| 10 to 14 Minutes | 1,591 | 9.4% |
| 15 to 19 Minutes | 1,750 | 10.3% |
| 20 to 24 Minutes | 2,745 | 16.2% |
| 25 to 29 Minutes | 2,381 | 14.0% |
| 30 to 34 Minutes | 4,213 | 24.8% |
| 35 to 39 Minutes | 699 | 4.1% |
| 40 to 44 Minutes | 384 | 2.3% |
| 45 to 59 Minutes | 1,217 | 7.2% |
| 60 to 89 Minutes | 530 | 3.1% |
| 90 or more Minutes | 163 | 1.0% |
Commute Time by Sex in Murray County
The most common commute times in Murray County are 30 to 34 minutes (2,409 commuters, 25.5%) for males and 30 to 34 minutes (1,804 commuters, 24.0%) for females.
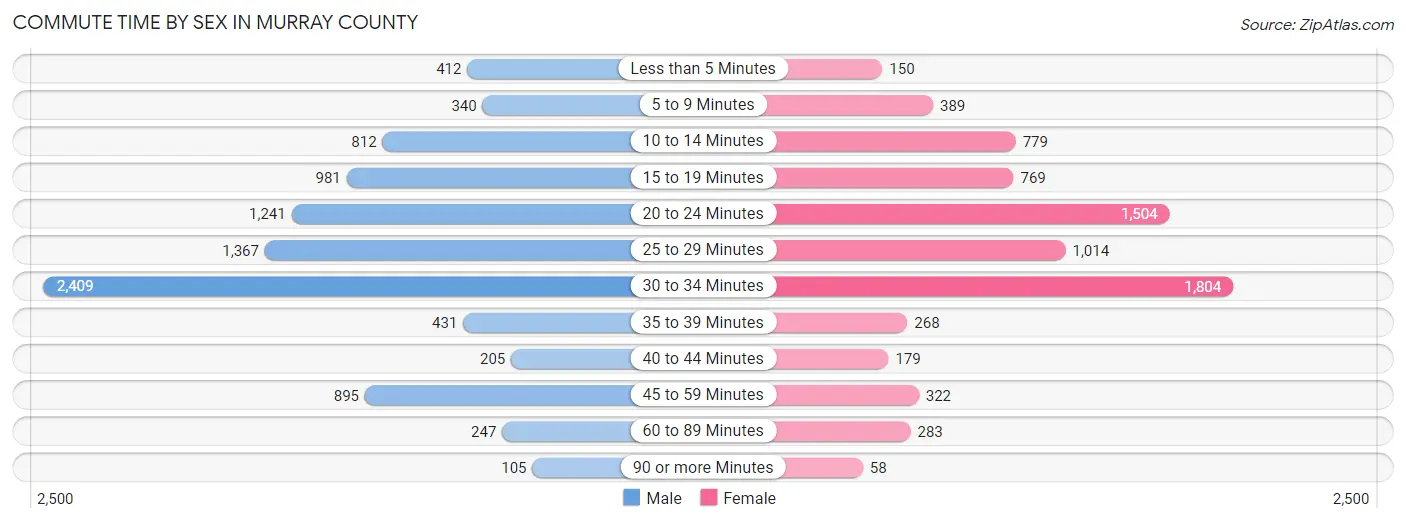
| Commute Time | Male | Female |
| Less than 5 Minutes | 412 (4.4%) | 150 (2.0%) |
| 5 to 9 Minutes | 340 (3.6%) | 389 (5.2%) |
| 10 to 14 Minutes | 812 (8.6%) | 779 (10.4%) |
| 15 to 19 Minutes | 981 (10.4%) | 769 (10.2%) |
| 20 to 24 Minutes | 1,241 (13.1%) | 1,504 (20.0%) |
| 25 to 29 Minutes | 1,367 (14.5%) | 1,014 (13.5%) |
| 30 to 34 Minutes | 2,409 (25.5%) | 1,804 (24.0%) |
| 35 to 39 Minutes | 431 (4.6%) | 268 (3.6%) |
| 40 to 44 Minutes | 205 (2.2%) | 179 (2.4%) |
| 45 to 59 Minutes | 895 (9.5%) | 322 (4.3%) |
| 60 to 89 Minutes | 247 (2.6%) | 283 (3.8%) |
| 90 or more Minutes | 105 (1.1%) | 58 (0.8%) |
Time of Departure to Work by Sex in Murray County
The most frequent times of departure to work in Murray County are 6:00 AM to 6:29 AM (1,808, 19.1%) for males and 7:00 AM to 7:29 AM (1,379, 18.3%) for females.
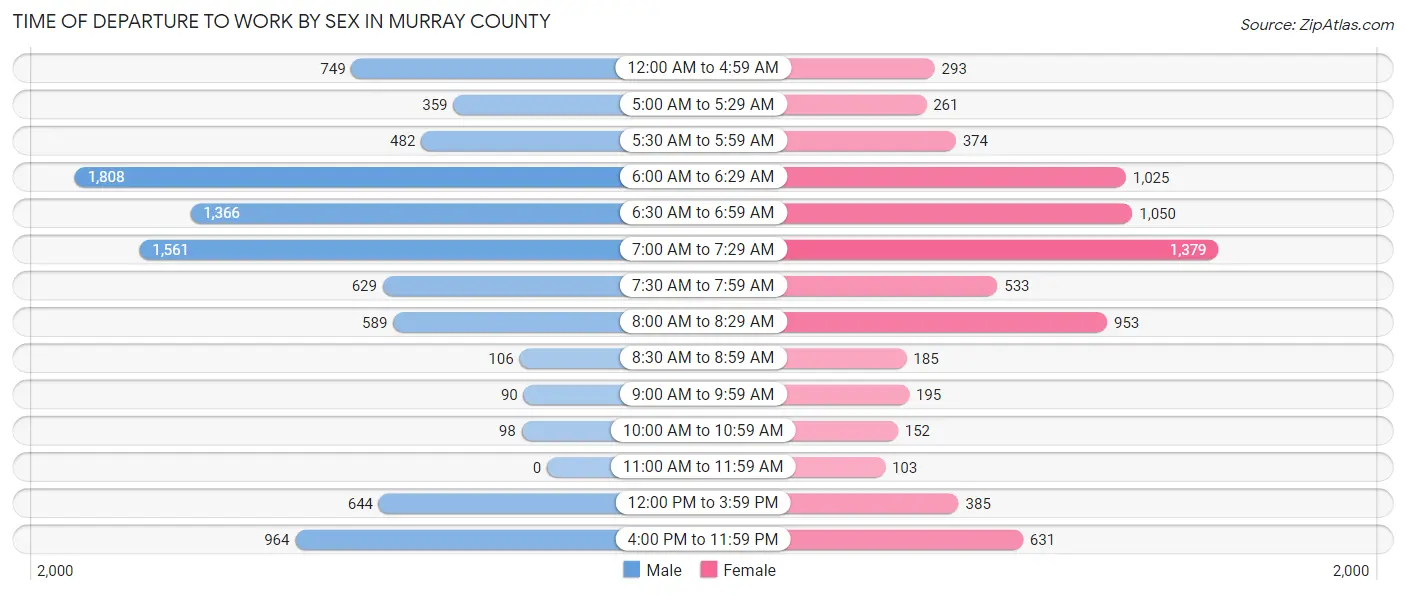
| Time of Departure | Male | Female |
| 12:00 AM to 4:59 AM | 749 (7.9%) | 293 (3.9%) |
| 5:00 AM to 5:29 AM | 359 (3.8%) | 261 (3.5%) |
| 5:30 AM to 5:59 AM | 482 (5.1%) | 374 (5.0%) |
| 6:00 AM to 6:29 AM | 1,808 (19.1%) | 1,025 (13.6%) |
| 6:30 AM to 6:59 AM | 1,366 (14.5%) | 1,050 (14.0%) |
| 7:00 AM to 7:29 AM | 1,561 (16.5%) | 1,379 (18.3%) |
| 7:30 AM to 7:59 AM | 629 (6.7%) | 533 (7.1%) |
| 8:00 AM to 8:29 AM | 589 (6.2%) | 953 (12.7%) |
| 8:30 AM to 8:59 AM | 106 (1.1%) | 185 (2.5%) |
| 9:00 AM to 9:59 AM | 90 (0.9%) | 195 (2.6%) |
| 10:00 AM to 10:59 AM | 98 (1.0%) | 152 (2.0%) |
| 11:00 AM to 11:59 AM | 0 (0.0%) | 103 (1.4%) |
| 12:00 PM to 3:59 PM | 644 (6.8%) | 385 (5.1%) |
| 4:00 PM to 11:59 PM | 964 (10.2%) | 631 (8.4%) |
| Total | 9,445 (100.0%) | 7,519 (100.0%) |
Housing Occupancy in Murray County
Occupancy by Ownership in Murray County
Of the total 14,859 dwellings in Murray County, owner-occupied units account for 10,944 (73.7%), while renter-occupied units make up 3,915 (26.4%).
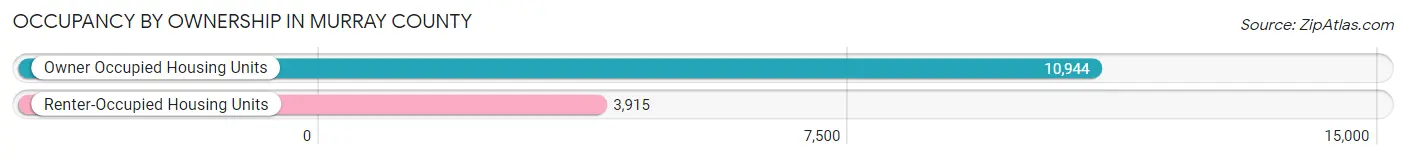
| Occupancy | # Housing Units | % Housing Units |
| Owner Occupied Housing Units | 10,944 | 73.7% |
| Renter-Occupied Housing Units | 3,915 | 26.4% |
| Total Occupied Housing Units | 14,859 | 100.0% |
Occupancy by Household Size in Murray County
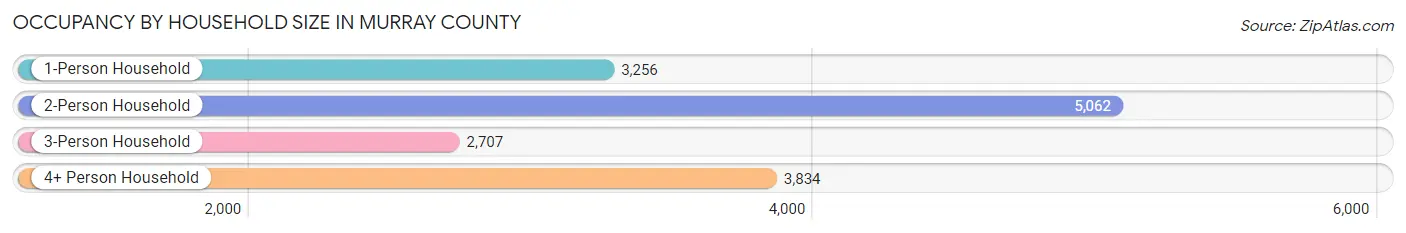
| Household Size | # Housing Units | % Housing Units |
| 1-Person Household | 3,256 | 21.9% |
| 2-Person Household | 5,062 | 34.1% |
| 3-Person Household | 2,707 | 18.2% |
| 4+ Person Household | 3,834 | 25.8% |
| Total Housing Units | 14,859 | 100.0% |
Occupancy by Ownership by Household Size in Murray County
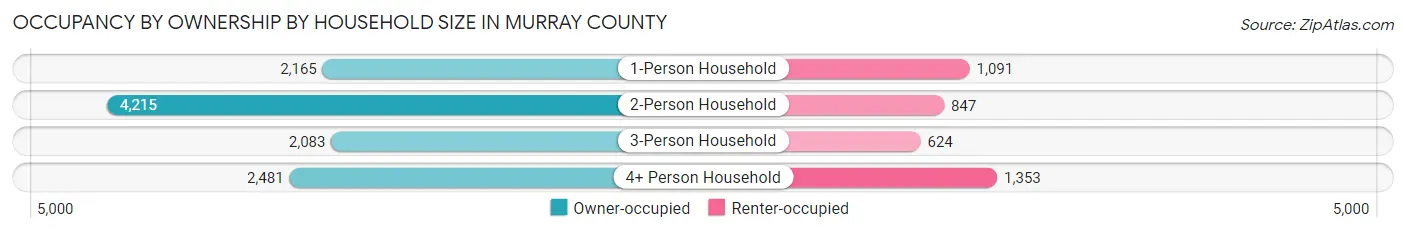
| Household Size | Owner-occupied | Renter-occupied |
| 1-Person Household | 2,165 (66.5%) | 1,091 (33.5%) |
| 2-Person Household | 4,215 (83.3%) | 847 (16.7%) |
| 3-Person Household | 2,083 (76.9%) | 624 (23.1%) |
| 4+ Person Household | 2,481 (64.7%) | 1,353 (35.3%) |
| Total Housing Units | 10,944 (73.7%) | 3,915 (26.4%) |
Occupancy by Educational Attainment in Murray County
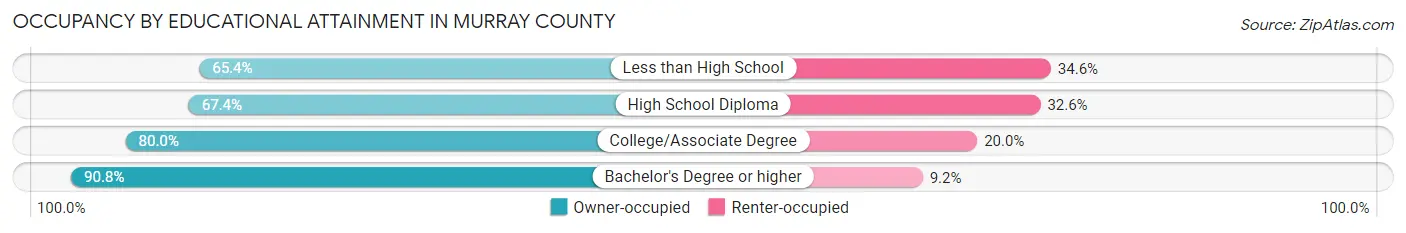
| Household Size | Owner-occupied | Renter-occupied |
| Less than High School | 2,353 (65.4%) | 1,247 (34.6%) |
| High School Diploma | 3,256 (67.4%) | 1,573 (32.6%) |
| College/Associate Degree | 3,713 (80.0%) | 930 (20.0%) |
| Bachelor's Degree or higher | 1,622 (90.8%) | 165 (9.2%) |
Occupancy by Age of Householder in Murray County
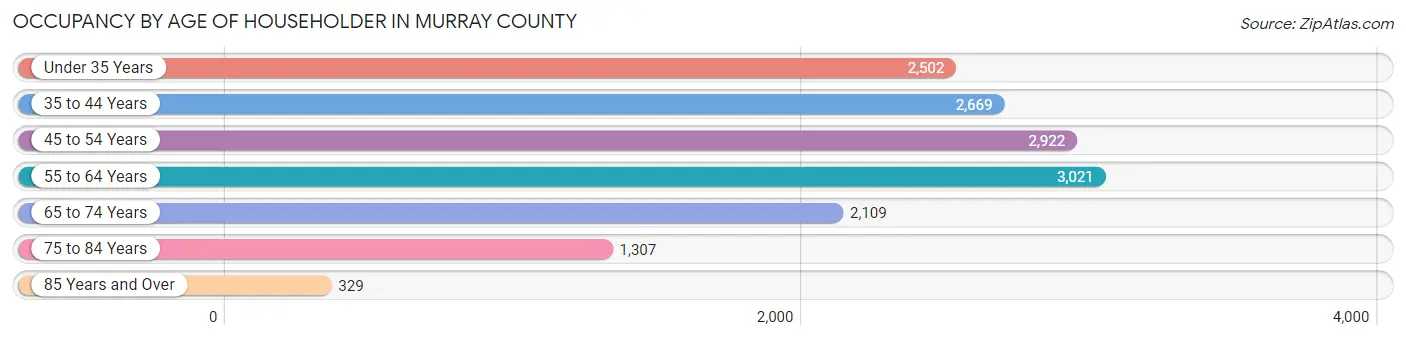
| Age Bracket | # Households | % Households |
| Under 35 Years | 2,502 | 16.8% |
| 35 to 44 Years | 2,669 | 18.0% |
| 45 to 54 Years | 2,922 | 19.7% |
| 55 to 64 Years | 3,021 | 20.3% |
| 65 to 74 Years | 2,109 | 14.2% |
| 75 to 84 Years | 1,307 | 8.8% |
| 85 Years and Over | 329 | 2.2% |
| Total | 14,859 | 100.0% |
Housing Finances in Murray County
Median Income by Occupancy in Murray County
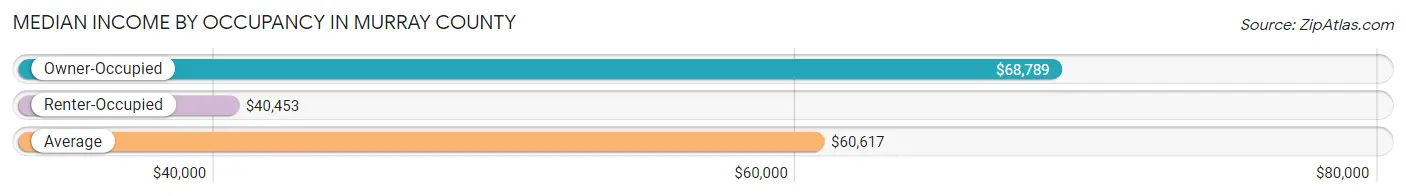
| Occupancy Type | # Households | Median Income |
| Owner-Occupied | 10,944 (73.7%) | $68,789 |
| Renter-Occupied | 3,915 (26.4%) | $40,453 |
| Average | 14,859 (100.0%) | $60,617 |
Occupancy by Householder Income Bracket in Murray County
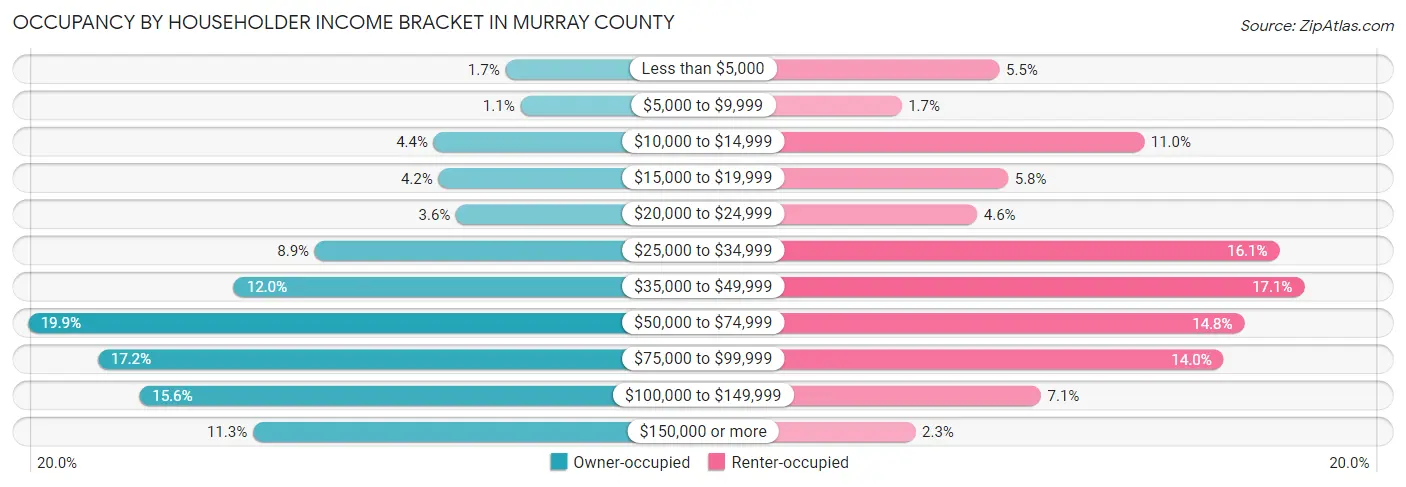
| Income Bracket | Owner-occupied | Renter-occupied |
| Less than $5,000 | 184 (1.7%) | 214 (5.5%) |
| $5,000 to $9,999 | 121 (1.1%) | 68 (1.7%) |
| $10,000 to $14,999 | 483 (4.4%) | 430 (11.0%) |
| $15,000 to $19,999 | 463 (4.2%) | 227 (5.8%) |
| $20,000 to $24,999 | 390 (3.6%) | 181 (4.6%) |
| $25,000 to $34,999 | 978 (8.9%) | 632 (16.1%) |
| $35,000 to $49,999 | 1,317 (12.0%) | 669 (17.1%) |
| $50,000 to $74,999 | 2,176 (19.9%) | 580 (14.8%) |
| $75,000 to $99,999 | 1,884 (17.2%) | 549 (14.0%) |
| $100,000 to $149,999 | 1,711 (15.6%) | 276 (7.0%) |
| $150,000 or more | 1,237 (11.3%) | 89 (2.3%) |
| Total | 10,944 (100.0%) | 3,915 (100.0%) |
Monthly Housing Cost Tiers in Murray County
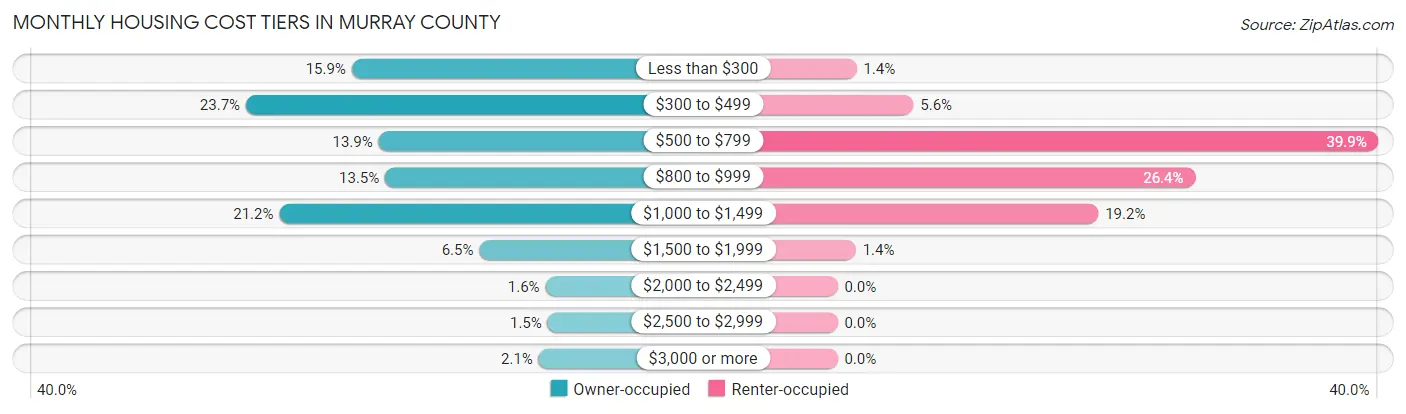
| Monthly Cost | Owner-occupied | Renter-occupied |
| Less than $300 | 1,741 (15.9%) | 55 (1.4%) |
| $300 to $499 | 2,594 (23.7%) | 219 (5.6%) |
| $500 to $799 | 1,525 (13.9%) | 1,560 (39.9%) |
| $800 to $999 | 1,472 (13.5%) | 1,032 (26.4%) |
| $1,000 to $1,499 | 2,325 (21.2%) | 752 (19.2%) |
| $1,500 to $1,999 | 712 (6.5%) | 53 (1.3%) |
| $2,000 to $2,499 | 179 (1.6%) | 0 (0.0%) |
| $2,500 to $2,999 | 162 (1.5%) | 0 (0.0%) |
| $3,000 or more | 234 (2.1%) | 0 (0.0%) |
| Total | 10,944 (100.0%) | 3,915 (100.0%) |
Physical Housing Characteristics in Murray County
Housing Structures in Murray County
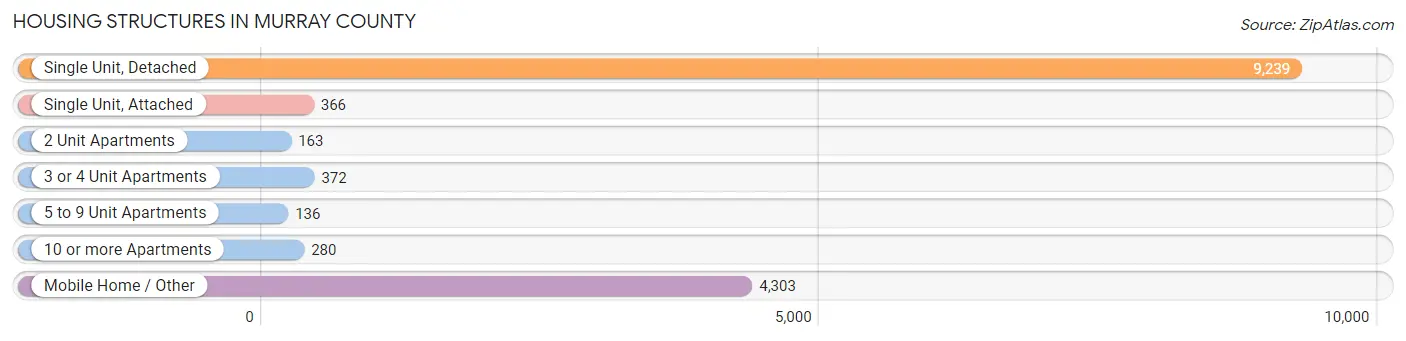
| Structure Type | # Housing Units | % Housing Units |
| Single Unit, Detached | 9,239 | 62.2% |
| Single Unit, Attached | 366 | 2.5% |
| 2 Unit Apartments | 163 | 1.1% |
| 3 or 4 Unit Apartments | 372 | 2.5% |
| 5 to 9 Unit Apartments | 136 | 0.9% |
| 10 or more Apartments | 280 | 1.9% |
| Mobile Home / Other | 4,303 | 29.0% |
| Total | 14,859 | 100.0% |
Housing Structures by Occupancy in Murray County
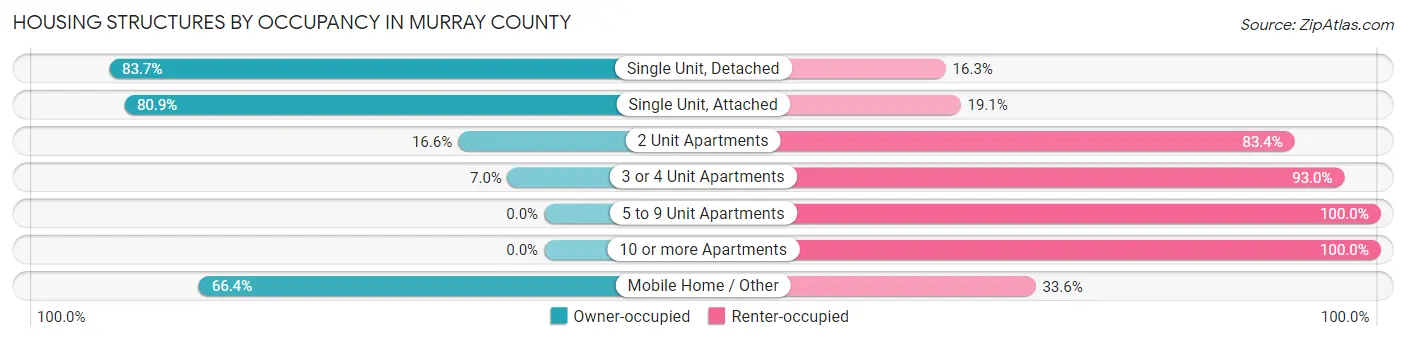
| Structure Type | Owner-occupied | Renter-occupied |
| Single Unit, Detached | 7,736 (83.7%) | 1,503 (16.3%) |
| Single Unit, Attached | 296 (80.9%) | 70 (19.1%) |
| 2 Unit Apartments | 27 (16.6%) | 136 (83.4%) |
| 3 or 4 Unit Apartments | 26 (7.0%) | 346 (93.0%) |
| 5 to 9 Unit Apartments | 0 (0.0%) | 136 (100.0%) |
| 10 or more Apartments | 0 (0.0%) | 280 (100.0%) |
| Mobile Home / Other | 2,859 (66.4%) | 1,444 (33.6%) |
| Total | 10,944 (73.7%) | 3,915 (26.4%) |
Housing Structures by Number of Rooms in Murray County
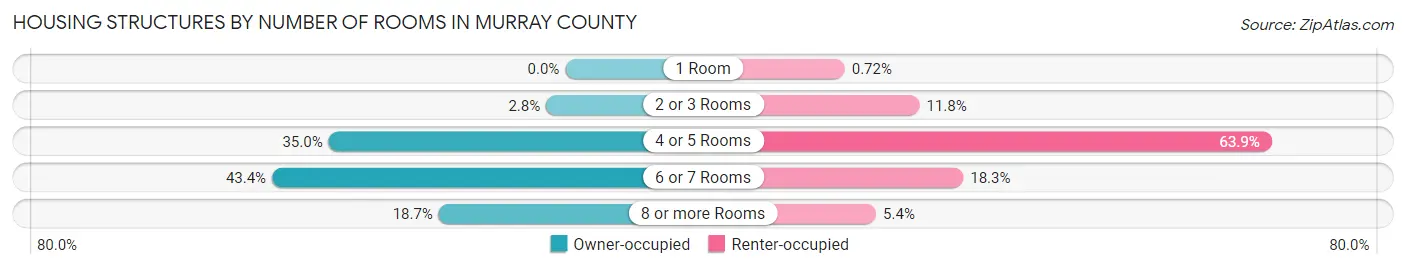
| Number of Rooms | Owner-occupied | Renter-occupied |
| 1 Room | 0 (0.0%) | 28 (0.7%) |
| 2 or 3 Rooms | 311 (2.8%) | 461 (11.8%) |
| 4 or 5 Rooms | 3,834 (35.0%) | 2,501 (63.9%) |
| 6 or 7 Rooms | 4,750 (43.4%) | 715 (18.3%) |
| 8 or more Rooms | 2,049 (18.7%) | 210 (5.4%) |
| Total | 10,944 (100.0%) | 3,915 (100.0%) |
Housing Structure by Heating Type in Murray County
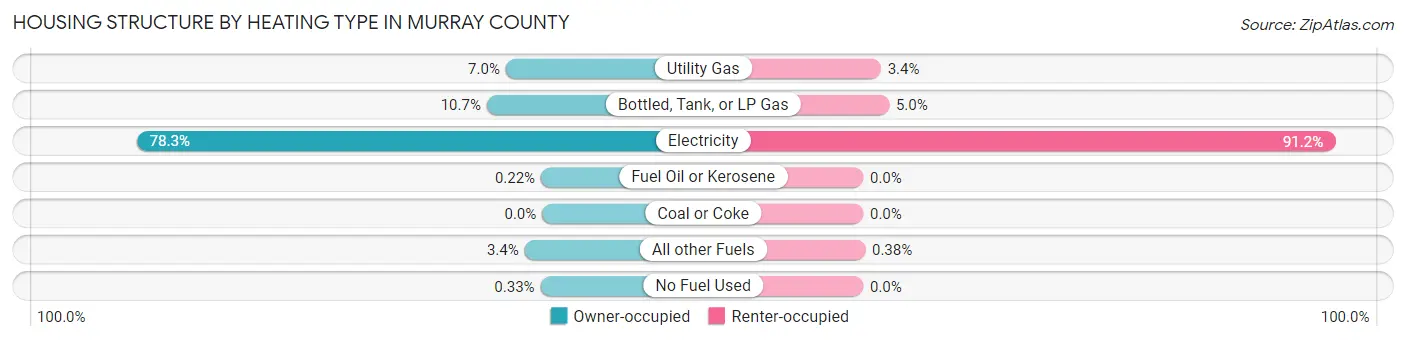
| Heating Type | Owner-occupied | Renter-occupied |
| Utility Gas | 769 (7.0%) | 134 (3.4%) |
| Bottled, Tank, or LP Gas | 1,171 (10.7%) | 196 (5.0%) |
| Electricity | 8,573 (78.3%) | 3,570 (91.2%) |
| Fuel Oil or Kerosene | 24 (0.2%) | 0 (0.0%) |
| Coal or Coke | 0 (0.0%) | 0 (0.0%) |
| All other Fuels | 371 (3.4%) | 15 (0.4%) |
| No Fuel Used | 36 (0.3%) | 0 (0.0%) |
| Total | 10,944 (100.0%) | 3,915 (100.0%) |
Household Vehicle Usage in Murray County
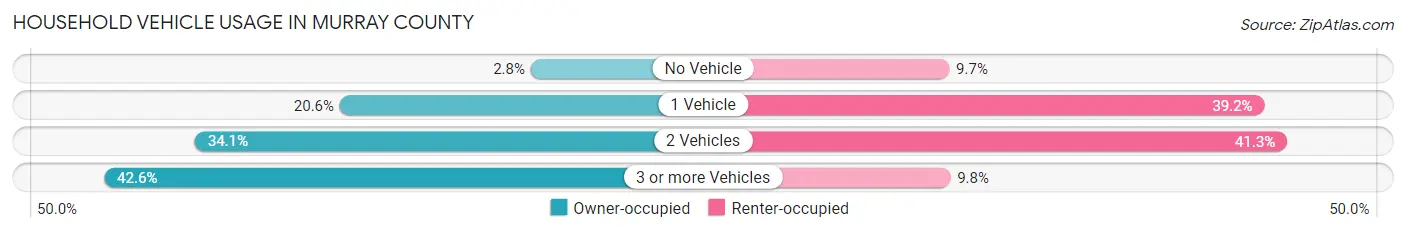
| Vehicles per Household | Owner-occupied | Renter-occupied |
| No Vehicle | 301 (2.8%) | 381 (9.7%) |
| 1 Vehicle | 2,251 (20.6%) | 1,533 (39.2%) |
| 2 Vehicles | 3,733 (34.1%) | 1,616 (41.3%) |
| 3 or more Vehicles | 4,659 (42.6%) | 385 (9.8%) |
| Total | 10,944 (100.0%) | 3,915 (100.0%) |
Real Estate & Mortgages in Murray County
Real Estate and Mortgage Overview in Murray County
| Characteristic | Without Mortgage | With Mortgage |
| Housing Units | 5,498 | 5,446 |
| Median Property Value | $139,100 | $161,900 |
| Median Household Income | $50,567 | $696 |
| Monthly Housing Costs | $388 | $234 |
| Real Estate Taxes | $803 | $138 |
Property Value by Mortgage Status in Murray County
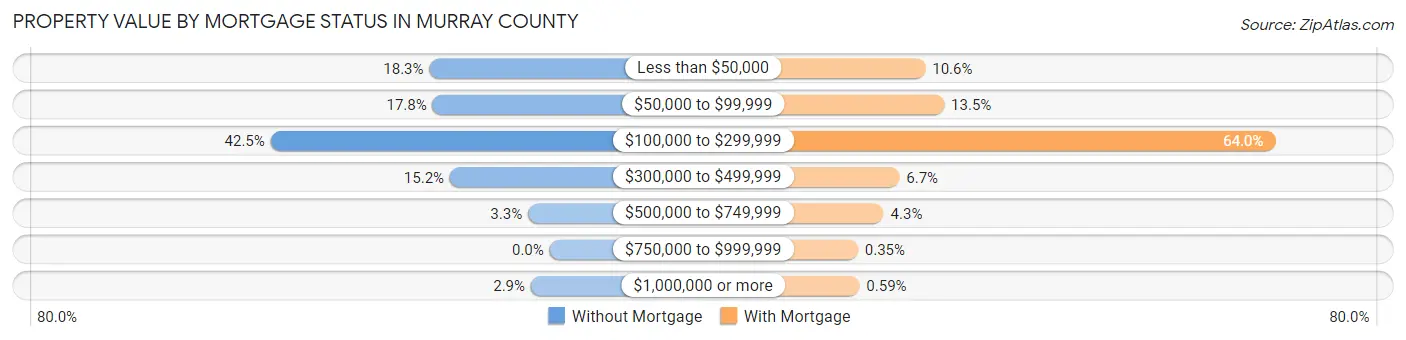
| Property Value | Without Mortgage | With Mortgage |
| Less than $50,000 | 1,007 (18.3%) | 579 (10.6%) |
| $50,000 to $99,999 | 981 (17.8%) | 735 (13.5%) |
| $100,000 to $299,999 | 2,337 (42.5%) | 3,484 (64.0%) |
| $300,000 to $499,999 | 835 (15.2%) | 364 (6.7%) |
| $500,000 to $749,999 | 181 (3.3%) | 233 (4.3%) |
| $750,000 to $999,999 | 0 (0.0%) | 19 (0.4%) |
| $1,000,000 or more | 157 (2.9%) | 32 (0.6%) |
| Total | 5,498 (100.0%) | 5,446 (100.0%) |
Household Income by Mortgage Status in Murray County
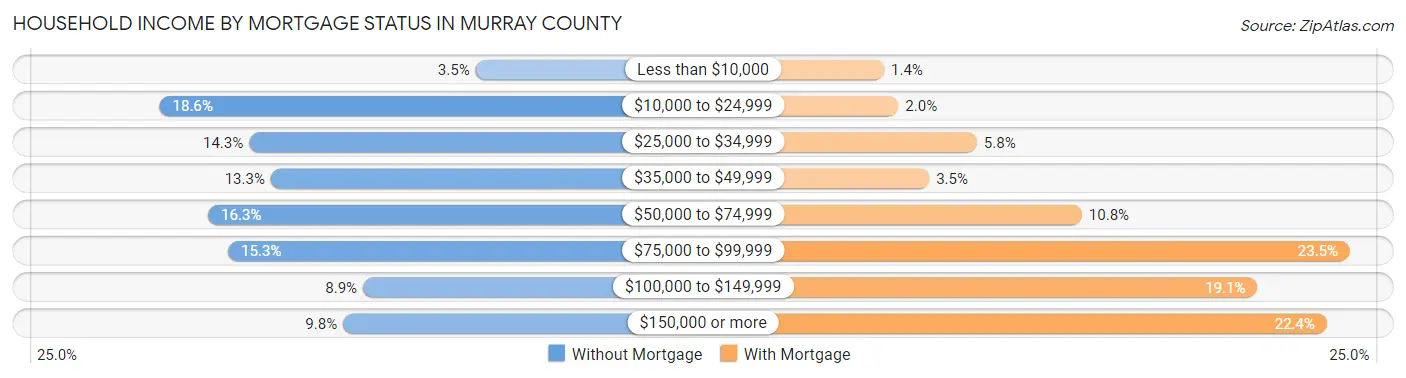
| Household Income | Without Mortgage | With Mortgage |
| Less than $10,000 | 194 (3.5%) | 74 (1.4%) |
| $10,000 to $24,999 | 1,021 (18.6%) | 111 (2.0%) |
| $25,000 to $34,999 | 787 (14.3%) | 315 (5.8%) |
| $35,000 to $49,999 | 730 (13.3%) | 191 (3.5%) |
| $50,000 to $74,999 | 894 (16.3%) | 587 (10.8%) |
| $75,000 to $99,999 | 842 (15.3%) | 1,282 (23.5%) |
| $100,000 to $149,999 | 489 (8.9%) | 1,042 (19.1%) |
| $150,000 or more | 541 (9.8%) | 1,222 (22.4%) |
| Total | 5,498 (100.0%) | 5,446 (100.0%) |
Property Value to Household Income Ratio in Murray County
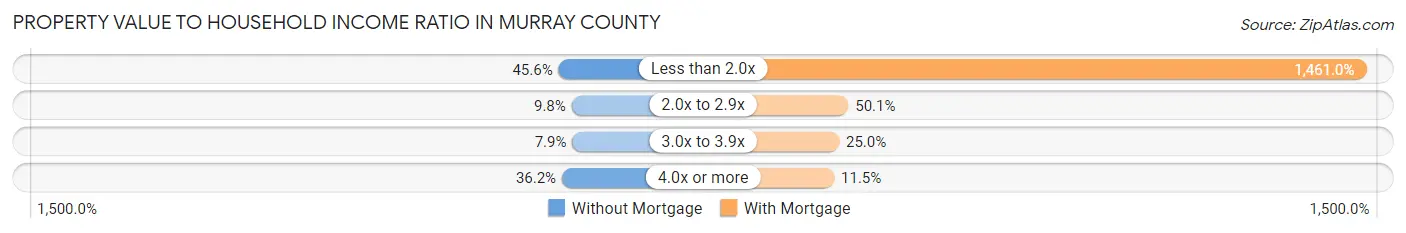
| Value-to-Income Ratio | Without Mortgage | With Mortgage |
| Less than 2.0x | 2,507 (45.6%) | 79,564 (1,461.0%) |
| 2.0x to 2.9x | 537 (9.8%) | 2,730 (50.1%) |
| 3.0x to 3.9x | 433 (7.9%) | 1,359 (24.9%) |
| 4.0x or more | 1,990 (36.2%) | 626 (11.5%) |
| Total | 5,498 (100.0%) | 5,446 (100.0%) |
Real Estate Taxes by Mortgage Status in Murray County
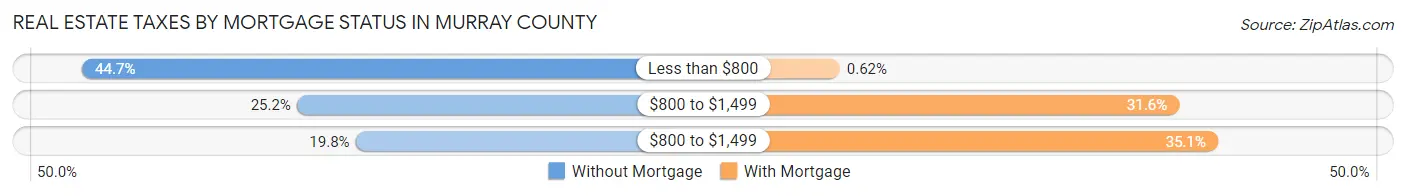
| Property Taxes | Without Mortgage | With Mortgage |
| Less than $800 | 2,460 (44.7%) | 34 (0.6%) |
| $800 to $1,499 | 1,383 (25.2%) | 1,721 (31.6%) |
| $800 to $1,499 | 1,088 (19.8%) | 1,913 (35.1%) |
| Total | 5,498 (100.0%) | 5,446 (100.0%) |
Health & Disability in Murray County
Health Insurance Coverage by Age in Murray County
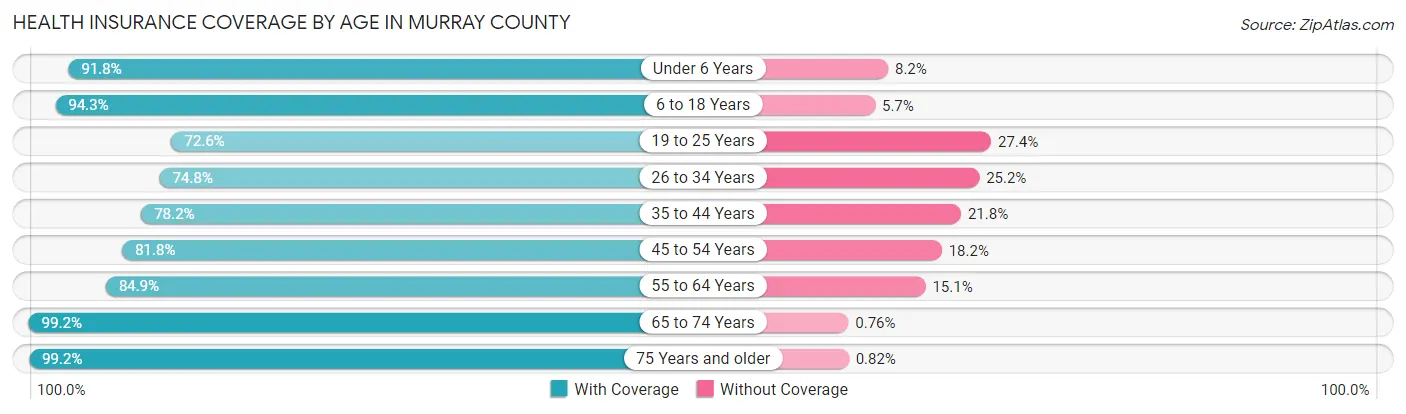
| Age Bracket | With Coverage | Without Coverage |
| Under 6 Years | 2,723 (91.8%) | 242 (8.2%) |
| 6 to 18 Years | 6,909 (94.3%) | 420 (5.7%) |
| 19 to 25 Years | 2,347 (72.6%) | 885 (27.4%) |
| 26 to 34 Years | 3,424 (74.8%) | 1,151 (25.2%) |
| 35 to 44 Years | 3,855 (78.2%) | 1,072 (21.8%) |
| 45 to 54 Years | 4,531 (81.8%) | 1,006 (18.2%) |
| 55 to 64 Years | 4,541 (84.9%) | 810 (15.1%) |
| 65 to 74 Years | 3,647 (99.2%) | 28 (0.8%) |
| 75 Years and older | 2,170 (99.2%) | 18 (0.8%) |
| Total | 34,147 (85.8%) | 5,632 (14.2%) |
Health Insurance Coverage by Citizenship Status in Murray County
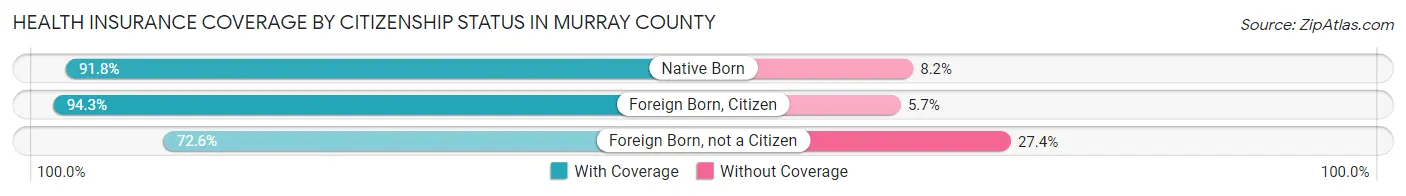
| Citizenship Status | With Coverage | Without Coverage |
| Native Born | 2,723 (91.8%) | 242 (8.2%) |
| Foreign Born, Citizen | 6,909 (94.3%) | 420 (5.7%) |
| Foreign Born, not a Citizen | 2,347 (72.6%) | 885 (27.4%) |
Health Insurance Coverage by Household Income in Murray County
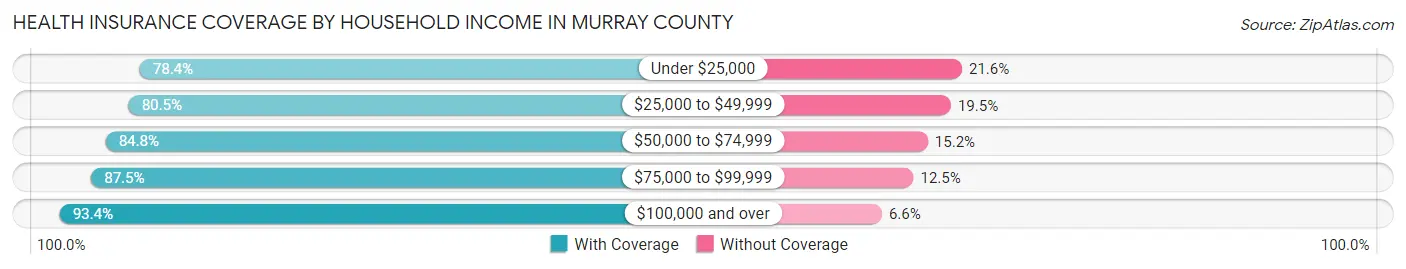
| Household Income | With Coverage | Without Coverage |
| Under $25,000 | 4,231 (78.4%) | 1,166 (21.6%) |
| $25,000 to $49,999 | 6,587 (80.5%) | 1,598 (19.5%) |
| $50,000 to $74,999 | 6,686 (84.8%) | 1,198 (15.2%) |
| $75,000 to $99,999 | 6,804 (87.5%) | 972 (12.5%) |
| $100,000 and over | 9,828 (93.4%) | 693 (6.6%) |
Public vs Private Health Insurance Coverage by Age in Murray County
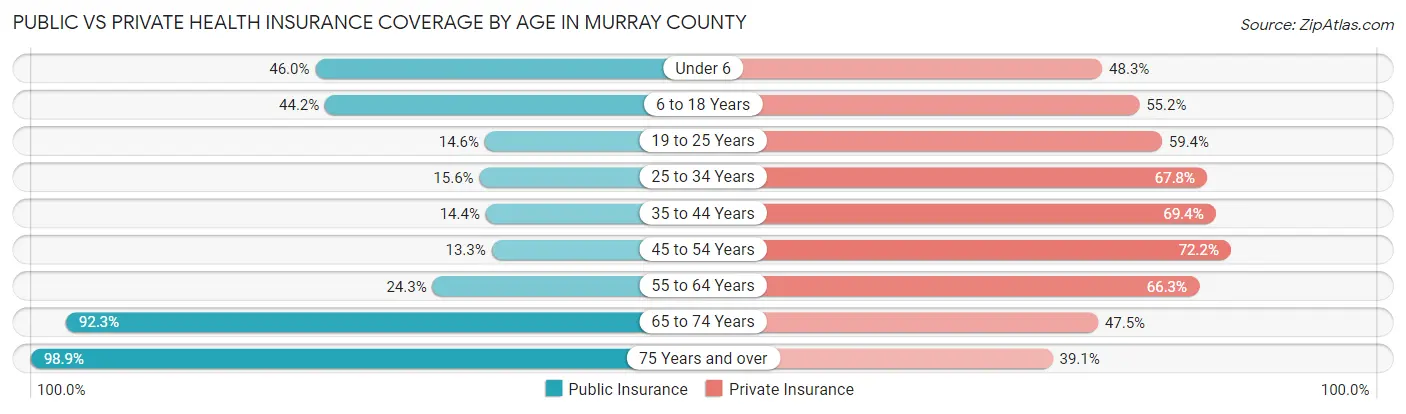
| Age Bracket | Public Insurance | Private Insurance |
| Under 6 | 1,365 (46.0%) | 1,433 (48.3%) |
| 6 to 18 Years | 3,241 (44.2%) | 4,046 (55.2%) |
| 19 to 25 Years | 471 (14.6%) | 1,920 (59.4%) |
| 25 to 34 Years | 713 (15.6%) | 3,100 (67.8%) |
| 35 to 44 Years | 710 (14.4%) | 3,418 (69.4%) |
| 45 to 54 Years | 738 (13.3%) | 3,997 (72.2%) |
| 55 to 64 Years | 1,300 (24.3%) | 3,546 (66.3%) |
| 65 to 74 Years | 3,393 (92.3%) | 1,747 (47.5%) |
| 75 Years and over | 2,163 (98.9%) | 856 (39.1%) |
| Total | 14,094 (35.4%) | 24,063 (60.5%) |
Disability Status by Sex by Age in Murray County
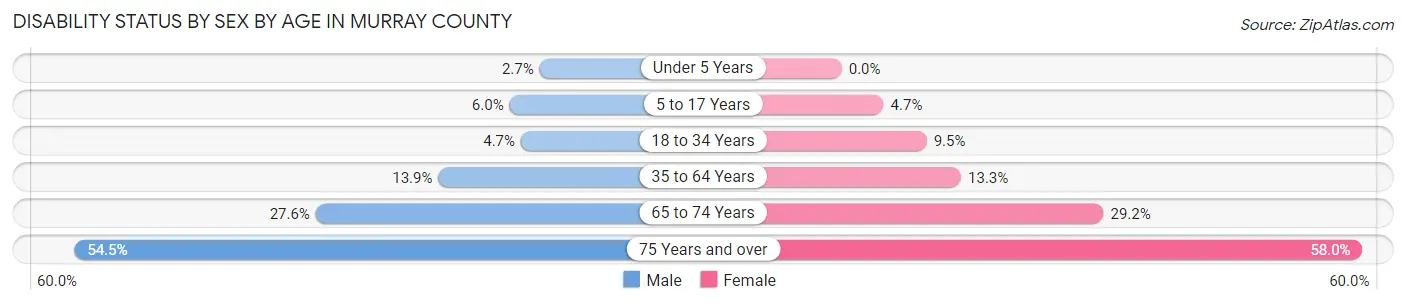
| Age Bracket | Male | Female |
| Under 5 Years | 34 (2.6%) | 0 (0.0%) |
| 5 to 17 Years | 221 (6.0%) | 164 (4.7%) |
| 18 to 34 Years | 199 (4.7%) | 405 (9.5%) |
| 35 to 64 Years | 1,099 (13.9%) | 1,053 (13.3%) |
| 65 to 74 Years | 478 (27.6%) | 566 (29.1%) |
| 75 Years and over | 519 (54.5%) | 716 (58.0%) |
Disability Class by Sex by Age in Murray County
Disability Class: Hearing Difficulty
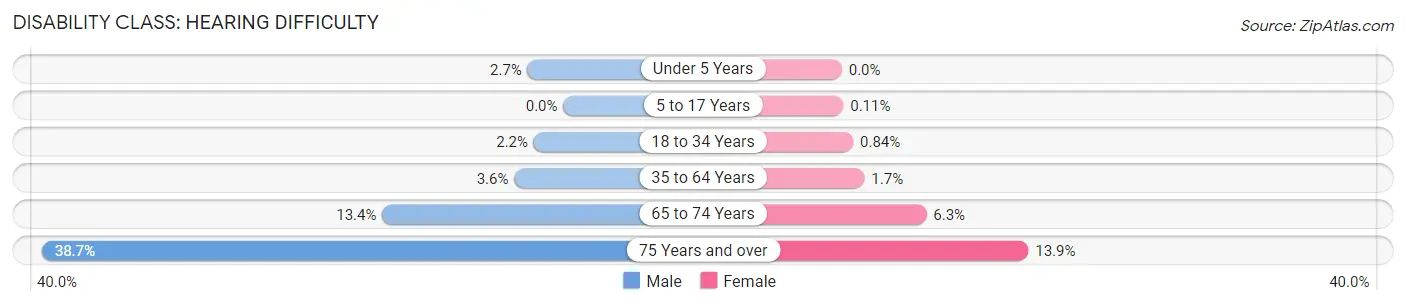
| Age Bracket | Male | Female |
| Under 5 Years | 34 (2.6%) | 0 (0.0%) |
| 5 to 17 Years | 0 (0.0%) | 4 (0.1%) |
| 18 to 34 Years | 92 (2.2%) | 36 (0.8%) |
| 35 to 64 Years | 287 (3.6%) | 133 (1.7%) |
| 65 to 74 Years | 233 (13.4%) | 122 (6.3%) |
| 75 Years and over | 369 (38.7%) | 171 (13.9%) |
Disability Class: Vision Difficulty
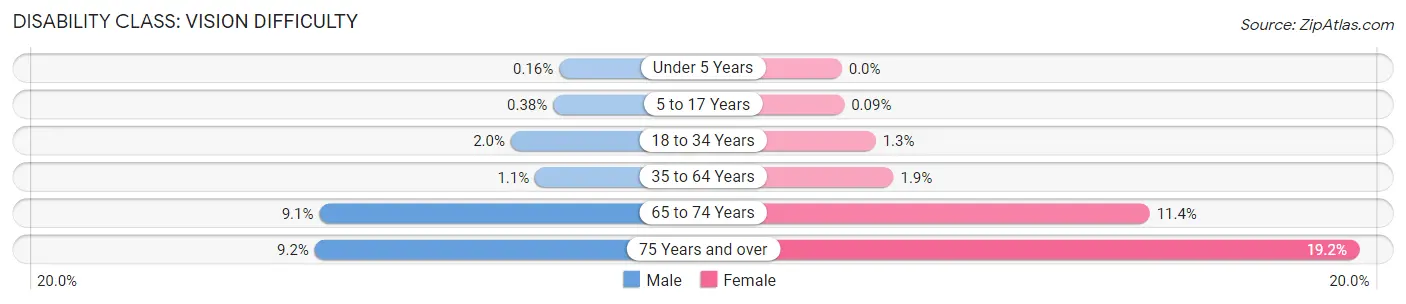
| Age Bracket | Male | Female |
| Under 5 Years | 2 (0.2%) | 0 (0.0%) |
| 5 to 17 Years | 14 (0.4%) | 3 (0.1%) |
| 18 to 34 Years | 82 (1.9%) | 54 (1.3%) |
| 35 to 64 Years | 83 (1.1%) | 152 (1.9%) |
| 65 to 74 Years | 157 (9.1%) | 222 (11.4%) |
| 75 Years and over | 88 (9.2%) | 237 (19.2%) |
Disability Class: Cognitive Difficulty
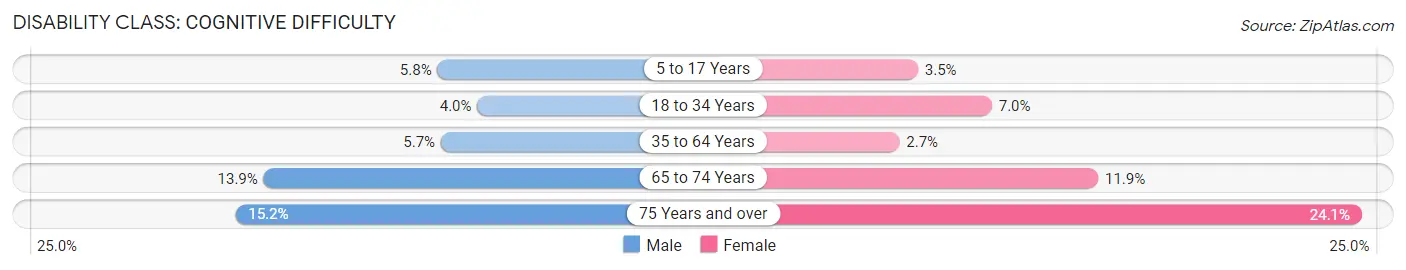
| Age Bracket | Male | Female |
| 5 to 17 Years | 215 (5.8%) | 124 (3.5%) |
| 18 to 34 Years | 168 (4.0%) | 298 (7.0%) |
| 35 to 64 Years | 448 (5.7%) | 212 (2.7%) |
| 65 to 74 Years | 241 (13.9%) | 231 (11.9%) |
| 75 Years and over | 145 (15.2%) | 298 (24.1%) |
Disability Class: Ambulatory Difficulty
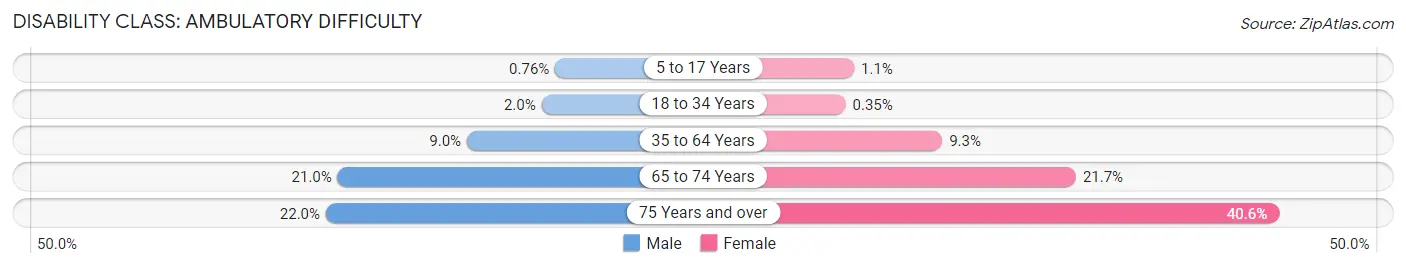
| Age Bracket | Male | Female |
| 5 to 17 Years | 28 (0.8%) | 40 (1.1%) |
| 18 to 34 Years | 85 (2.0%) | 15 (0.4%) |
| 35 to 64 Years | 706 (8.9%) | 739 (9.3%) |
| 65 to 74 Years | 363 (20.9%) | 422 (21.7%) |
| 75 Years and over | 210 (22.0%) | 501 (40.6%) |
Disability Class: Self-Care Difficulty
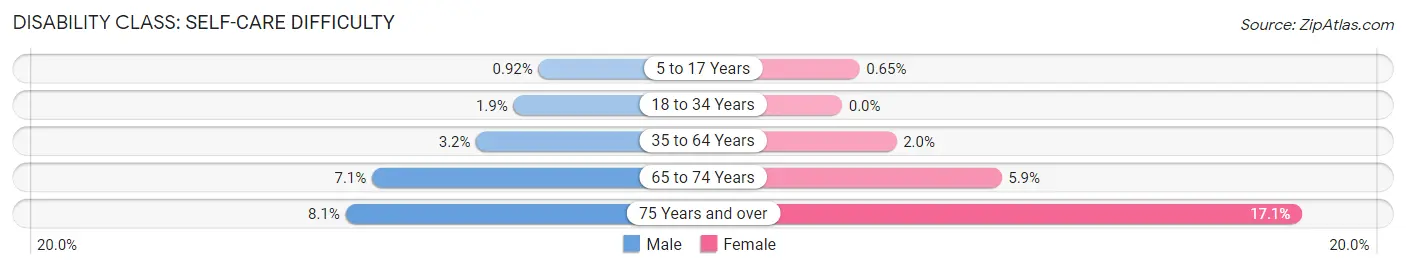
| Age Bracket | Male | Female |
| 5 to 17 Years | 34 (0.9%) | 23 (0.6%) |
| 18 to 34 Years | 78 (1.8%) | 0 (0.0%) |
| 35 to 64 Years | 255 (3.2%) | 160 (2.0%) |
| 65 to 74 Years | 123 (7.1%) | 115 (5.9%) |
| 75 Years and over | 77 (8.1%) | 211 (17.1%) |
Technology Access in Murray County
Computing Device Access in Murray County
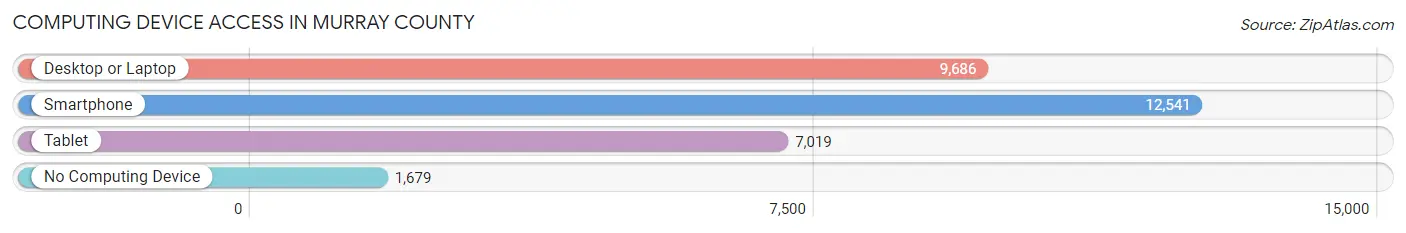
| Device Type | # Households | % Households |
| Desktop or Laptop | 9,686 | 65.2% |
| Smartphone | 12,541 | 84.4% |
| Tablet | 7,019 | 47.2% |
| No Computing Device | 1,679 | 11.3% |
| Total | 14,859 | 100.0% |
Internet Access in Murray County
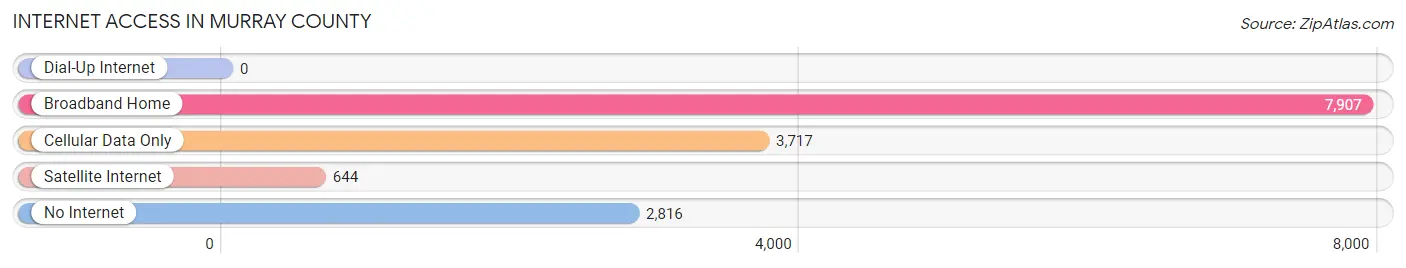
| Internet Type | # Households | % Households |
| Dial-Up Internet | 0 | 0.0% |
| Broadband Home | 7,907 | 53.2% |
| Cellular Data Only | 3,717 | 25.0% |
| Satellite Internet | 644 | 4.3% |
| No Internet | 2,816 | 19.0% |
| Total | 14,859 | 100.0% |
Murray County Summary
Murray County is a county located in the northwestern part of the state of Georgia in the United States. As of the 2010 census, the population was 39,628. The county seat is Chatsworth. The county was created on December 3, 1832, and was named after William Murray, a member of the Georgia House of Representatives.
Geography
Murray County is located in the foothills of the Appalachian Mountains in northwest Georgia. It is bordered by Whitfield County to the north, Gordon County to the east, Floyd County to the south, and Polk County to the west. The county covers an area of approximately 437 square miles. The terrain is mostly hilly, with elevations ranging from 800 to 1,800 feet above sea level. The highest point in the county is Fort Mountain, which rises to an elevation of 2,842 feet. The county is drained by the Conasauga River, which flows through the center of the county.
The county is home to several state parks, including Fort Mountain State Park, Red Clay State Park, and Cloudland Canyon State Park. The county also contains part of the Cohutta Wilderness, a protected area of the Chattahoochee National Forest.
Demographics
As of the 2010 census, there were 39,628 people, 15,845 households, and 11,717 families residing in the county. The population density was 90.3 people per square mile. The racial makeup of the county was 92.3% White, 4.2% Black or African American, 0.3% Native American, 0.4% Asian, 0.1% Pacific Islander, 1.3% from other races, and 1.4% from two or more races. 2.7% of the population were Hispanic or Latino of any race.
The median income for a household in the county was $35,945, and the median income for a family was $43,945. The per capita income for the county was $18,845. About 14.2% of families and 17.7% of the population were below the poverty line, including 24.2% of those under age 18 and 14.2% of those age 65 or over.
Economy
The economy of Murray County is largely based on agriculture and manufacturing. The county is home to several large poultry processing plants, as well as a number of smaller food processing plants. The county is also home to several large industrial parks, which are home to a variety of manufacturing companies.
The county is also home to several tourist attractions, including Fort Mountain State Park, Red Clay State Park, and Cloudland Canyon State Park. These parks attract thousands of visitors each year, providing a boost to the local economy.
Conclusion
Murray County is a rural county located in the northwestern part of the state of Georgia. The county is home to several state parks, as well as a variety of agricultural and manufacturing businesses. The county has a population of 39,628, with a median household income of $35,945. The economy of the county is largely based on agriculture and manufacturing, with tourism providing a boost to the local economy.
Common Questions
What is Per Capita Income in Murray County?
Per Capita income in Murray County is $27,383.
What is the Median Family Income in Murray County?
Median Family Income in Murray County is $69,618.
What is the Median Household income in Murray County?
Median Household Income in Murray County is $60,617.
What is Income or Wage Gap in Murray County?
Income or Wage Gap in Murray County is 32.4%.
Women in Murray County earn 67.6 cents for every dollar earned by a man.
What is Family Income Deficit in Murray County?
Family Income Deficit in Murray County is $10,943.
Families that are below poverty line in Murray County earn $10,943 less on average than the poverty threshold level.
What is Inequality or Gini Index in Murray County?
Inequality or Gini Index in Murray County is 0.43.
What is the Total Population of Murray County?
Total Population of Murray County is 40,063.
What is the Total Male Population of Murray County?
Total Male Population of Murray County is 19,928.
What is the Total Female Population of Murray County?
Total Female Population of Murray County is 20,135.
What is the Ratio of Males per 100 Females in Murray County?
There are 98.97 Males per 100 Females in Murray County.
What is the Ratio of Females per 100 Males in Murray County?
There are 101.04 Females per 100 Males in Murray County.
What is the Median Population Age in Murray County?
Median Population Age in Murray County is 39.7 Years.
What is the Average Family Size in Murray County
Average Family Size in Murray County is 3.1 People.
What is the Average Household Size in Murray County
Average Household Size in Murray County is 2.7 People.
How Large is the Labor Force in Murray County?
There are 19,175 People in the Labor Forcein in Murray County.
What is the Percentage of People in the Labor Force in Murray County?
60.7% of People are in the Labor Force in Murray County.
What is the Unemployment Rate in Murray County?
Unemployment Rate in Murray County is 6.7%.