Meriwether County, GA Map & Demographics
Meriwether County Map
Meriwether County Overview
$25,784
PER CAPITA INCOME
$62,272
AVG FAMILY INCOME
$52,392
AVG HOUSEHOLD INCOME
48.7%
WAGE / INCOME GAP [ % ]
51.3¢/ $1
WAGE / INCOME GAP [ $ ]
$9,822
FAMILY INCOME DEFICIT
0.44
INEQUALITY / GINI INDEX
20,679
TOTAL POPULATION
9,966
MALE POPULATION
10,713
FEMALE POPULATION
93.03
MALES / 100 FEMALES
107.50
FEMALES / 100 MALES
43.6
MEDIAN AGE
3.0
AVG FAMILY SIZE
2.5
AVG HOUSEHOLD SIZE
8,612
LABOR FORCE [ PEOPLE ]
51.2%
PERCENT IN LABOR FORCE
7.1%
UNEMPLOYMENT RATE
Income in Meriwether County
Income Overview in Meriwether County
Per Capita Income in Meriwether County is $25,784, while median incomes of families and households are $62,272 and $52,392 respectively.
| Characteristic | Number | Measure |
| Per Capita Income | 20,679 | $25,784 |
| Median Family Income | 5,789 | $62,272 |
| Mean Family Income | 5,789 | $73,058 |
| Median Household Income | 8,106 | $52,392 |
| Mean Household Income | 8,106 | $62,898 |
| Income Deficit | 5,789 | $9,822 |
| Wage / Income Gap (%) | 20,679 | 48.69% |
| Wage / Income Gap ($) | 20,679 | 51.31¢ per $1 |
| Gini / Inequality Index | 20,679 | 0.44 |
Earnings by Sex in Meriwether County
Average Earnings in Meriwether County are $35,491, $47,563 for men and $24,406 for women, a difference of 48.7%.
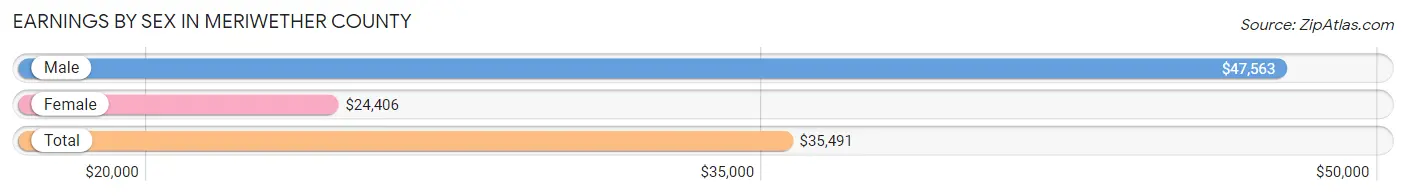
| Sex | Number | Average Earnings |
| Male | 4,679 (53.4%) | $47,563 |
| Female | 4,089 (46.6%) | $24,406 |
| Total | 8,768 (100.0%) | $35,491 |
Earnings by Sex by Income Bracket in Meriwether County
The most common earnings brackets in Meriwether County are $55,000 to $64,999 for men (521 | 11.1%) and $35,000 to $39,999 for women (433 | 10.6%).
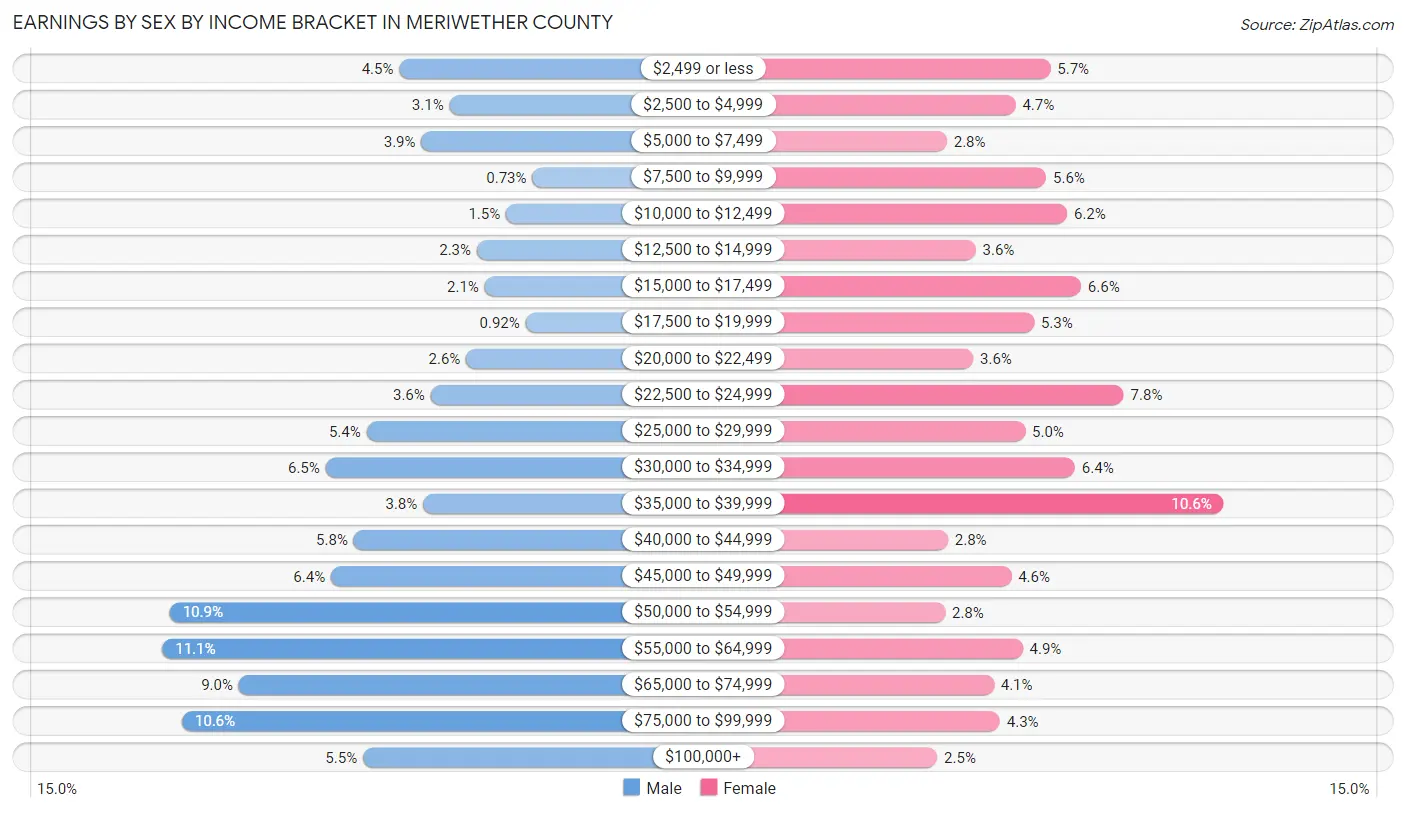
| Income | Male | Female |
| $2,499 or less | 209 (4.5%) | 234 (5.7%) |
| $2,500 to $4,999 | 143 (3.1%) | 194 (4.7%) |
| $5,000 to $7,499 | 180 (3.8%) | 115 (2.8%) |
| $7,500 to $9,999 | 34 (0.7%) | 229 (5.6%) |
| $10,000 to $12,499 | 69 (1.5%) | 253 (6.2%) |
| $12,500 to $14,999 | 107 (2.3%) | 148 (3.6%) |
| $15,000 to $17,499 | 97 (2.1%) | 269 (6.6%) |
| $17,500 to $19,999 | 43 (0.9%) | 215 (5.3%) |
| $20,000 to $22,499 | 121 (2.6%) | 145 (3.5%) |
| $22,500 to $24,999 | 168 (3.6%) | 318 (7.8%) |
| $25,000 to $29,999 | 252 (5.4%) | 205 (5.0%) |
| $30,000 to $34,999 | 306 (6.5%) | 262 (6.4%) |
| $35,000 to $39,999 | 178 (3.8%) | 433 (10.6%) |
| $40,000 to $44,999 | 269 (5.8%) | 116 (2.8%) |
| $45,000 to $49,999 | 299 (6.4%) | 189 (4.6%) |
| $50,000 to $54,999 | 511 (10.9%) | 113 (2.8%) |
| $55,000 to $64,999 | 521 (11.1%) | 202 (4.9%) |
| $65,000 to $74,999 | 420 (9.0%) | 169 (4.1%) |
| $75,000 to $99,999 | 495 (10.6%) | 176 (4.3%) |
| $100,000+ | 257 (5.5%) | 104 (2.5%) |
| Total | 4,679 (100.0%) | 4,089 (100.0%) |
Earnings by Sex by Educational Attainment in Meriwether County
Average earnings in Meriwether County are $49,640 for men and $28,354 for women, a difference of 42.9%. Men with an educational attainment of less than high school enjoy the highest average annual earnings of $57,757, while those with high school diploma education earn the least with $45,328. Women with an educational attainment of graduate degree earn the most with the average annual earnings of $80,162, while those with less than high school education have the smallest earnings of $21,331.
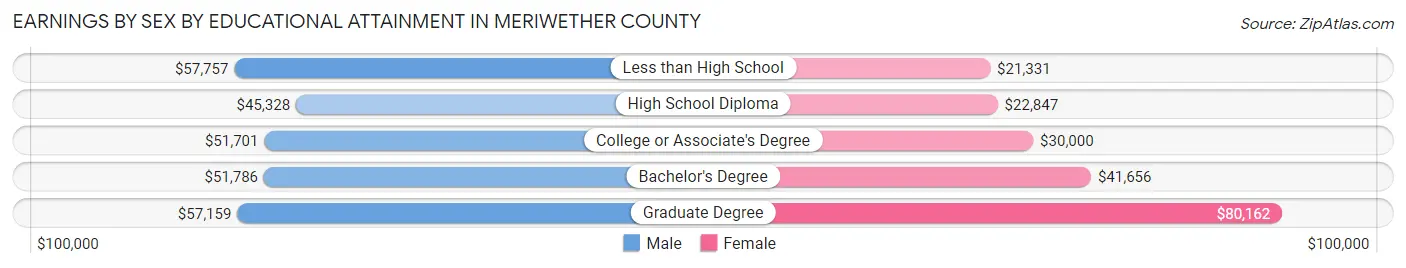
| Educational Attainment | Male Income | Female Income |
| Less than High School | $57,757 | $21,331 |
| High School Diploma | $45,328 | $22,847 |
| College or Associate's Degree | $51,701 | $30,000 |
| Bachelor's Degree | $51,786 | $41,656 |
| Graduate Degree | $57,159 | $80,162 |
| Total | $49,640 | $28,354 |
Family Income in Meriwether County
Family Income Brackets in Meriwether County
According to the Meriwether County family income data, there are 1,557 families falling into the $50,000 to $74,999 income range, which is the most common income bracket and makes up 26.9% of all families. Conversely, the $200,000+ income bracket is the least frequent group with only 122 families (2.1%) belonging to this category.
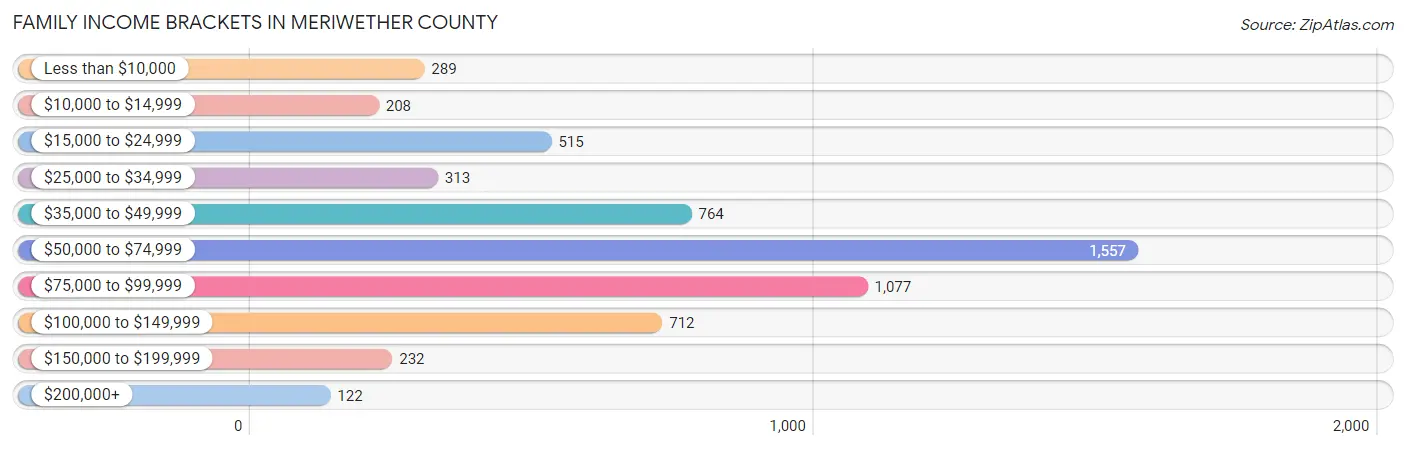
| Income Bracket | # Families | % Families |
| Less than $10,000 | 289 | 5.0% |
| $10,000 to $14,999 | 208 | 3.6% |
| $15,000 to $24,999 | 515 | 8.9% |
| $25,000 to $34,999 | 313 | 5.4% |
| $35,000 to $49,999 | 764 | 13.2% |
| $50,000 to $74,999 | 1,557 | 26.9% |
| $75,000 to $99,999 | 1,077 | 18.6% |
| $100,000 to $149,999 | 712 | 12.3% |
| $150,000 to $199,999 | 232 | 4.0% |
| $200,000+ | 122 | 2.1% |
Family Income by Famaliy Size in Meriwether County
5-person families (801 | 13.8%) account for the highest median family income in Meriwether County with $73,078 per family, while 2-person families (2,400 | 41.5%) have the highest median income of $29,922 per family member.
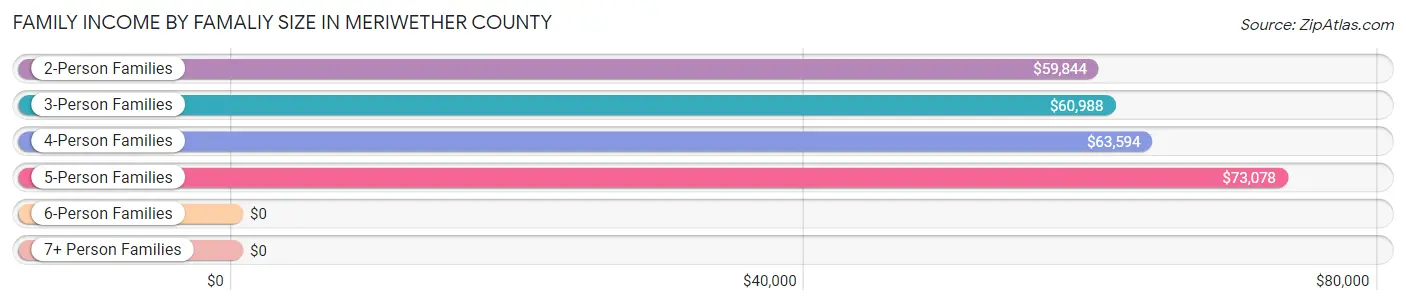
| Income Bracket | # Families | Median Income |
| 2-Person Families | 2,400 (41.5%) | $59,844 |
| 3-Person Families | 1,785 (30.8%) | $60,988 |
| 4-Person Families | 530 (9.2%) | $63,594 |
| 5-Person Families | 801 (13.8%) | $73,078 |
| 6-Person Families | 195 (3.4%) | $0 |
| 7+ Person Families | 78 (1.3%) | $0 |
| Total | 5,789 (100.0%) | $62,272 |
Family Income by Number of Earners in Meriwether County
The median family income in Meriwether County is $62,272, with families comprising 3+ earners (506) having the highest median family income of $116,250, while families with no earners (1,136) have the lowest median family income of $32,202, accounting for 8.7% and 19.6% of families, respectively.
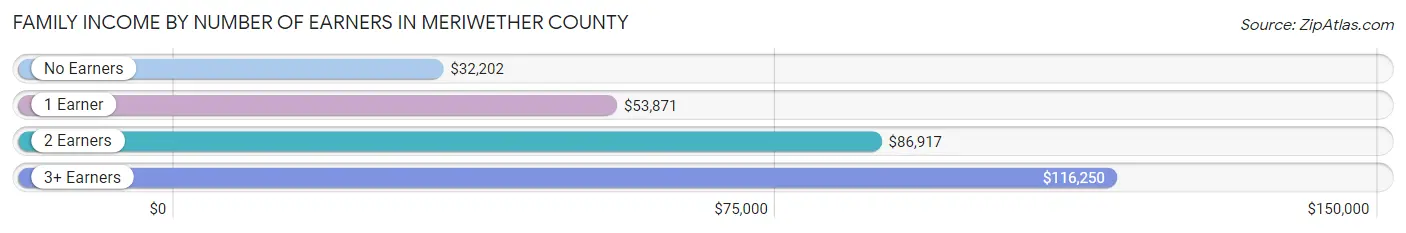
| Number of Earners | # Families | Median Income |
| No Earners | 1,136 (19.6%) | $32,202 |
| 1 Earner | 2,528 (43.7%) | $53,871 |
| 2 Earners | 1,619 (28.0%) | $86,917 |
| 3+ Earners | 506 (8.7%) | $116,250 |
| Total | 5,789 (100.0%) | $62,272 |
Household Income in Meriwether County
Household Income Brackets in Meriwether County
With 1,881 households falling in the category, the $50,000 to $74,999 income range is the most frequent in Meriwether County, accounting for 23.2% of all households. In contrast, only 162 households (2.0%) fall into the $200,000+ income bracket, making it the least populous group.
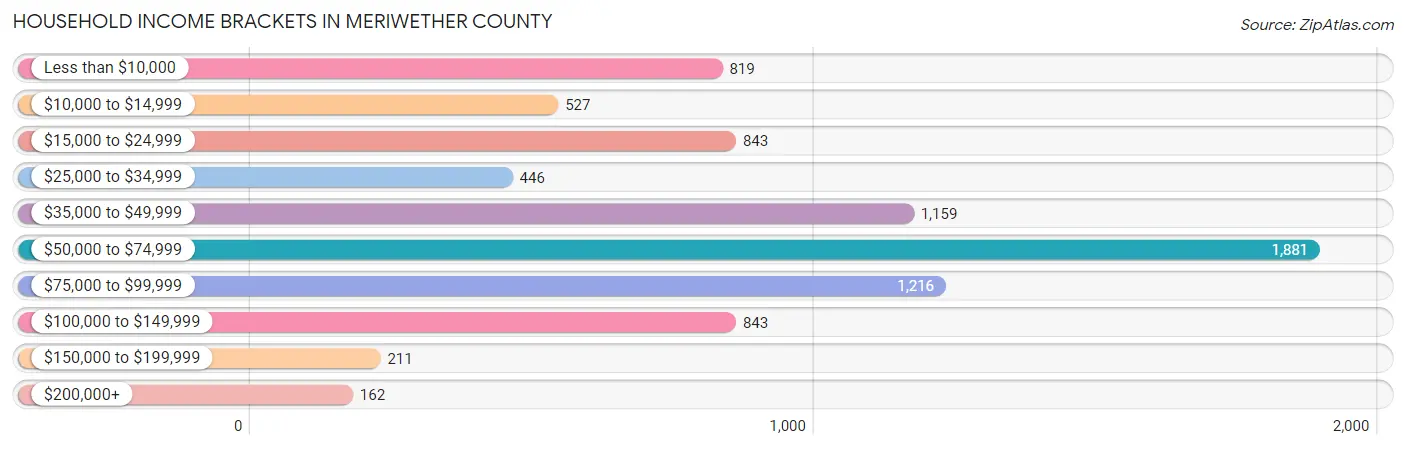
| Income Bracket | # Households | % Households |
| Less than $10,000 | 819 | 10.1% |
| $10,000 to $14,999 | 527 | 6.5% |
| $15,000 to $24,999 | 843 | 10.4% |
| $25,000 to $34,999 | 446 | 5.5% |
| $35,000 to $49,999 | 1,159 | 14.3% |
| $50,000 to $74,999 | 1,881 | 23.2% |
| $75,000 to $99,999 | 1,216 | 15.0% |
| $100,000 to $149,999 | 843 | 10.4% |
| $150,000 to $199,999 | 211 | 2.6% |
| $200,000+ | 162 | 2.0% |
Household Income by Householder Age in Meriwether County
The median household income in Meriwether County is $52,392, with the highest median household income of $59,524 found in the 45 to 64 years age bracket for the primary householder. A total of 3,036 households (37.4%) fall into this category. Meanwhile, the 15 to 24 years age bracket for the primary householder has the lowest median household income of $39,479, with 110 households (1.4%) in this group.
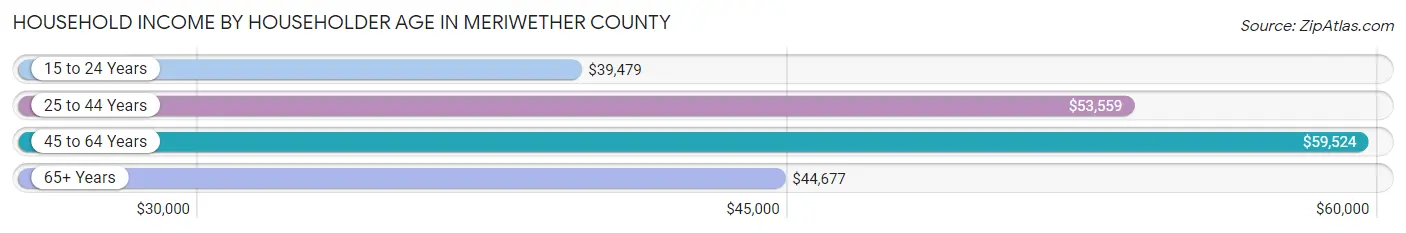
| Income Bracket | # Households | Median Income |
| 15 to 24 Years | 110 (1.4%) | $39,479 |
| 25 to 44 Years | 2,161 (26.7%) | $53,559 |
| 45 to 64 Years | 3,036 (37.4%) | $59,524 |
| 65+ Years | 2,799 (34.5%) | $44,677 |
| Total | 8,106 (100.0%) | $52,392 |
Poverty in Meriwether County
Income Below Poverty by Sex and Age in Meriwether County
With 19.1% poverty level for males and 25.0% for females among the residents of Meriwether County, 16 and 17 year old males and 6 to 11 year old females are the most vulnerable to poverty, with 81 males (39.9%) and 372 females (44.5%) in their respective age groups living below the poverty level.
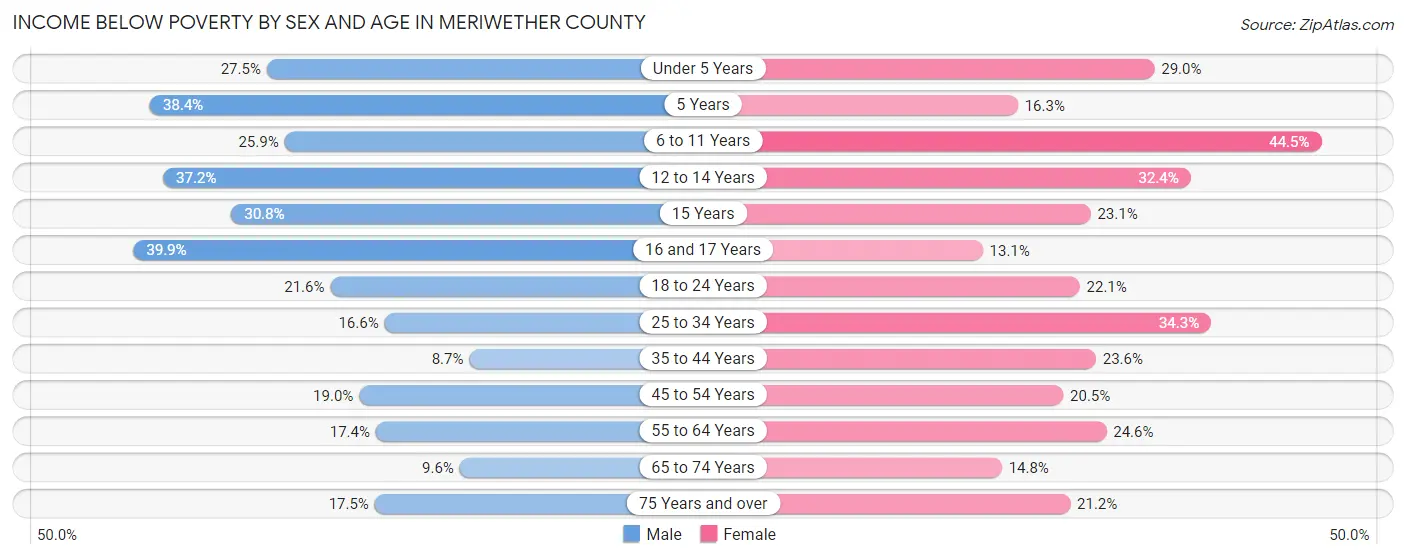
| Age Bracket | Male | Female |
| Under 5 Years | 166 (27.5%) | 156 (29.0%) |
| 5 Years | 33 (38.4%) | 8 (16.3%) |
| 6 to 11 Years | 161 (25.9%) | 372 (44.5%) |
| 12 to 14 Years | 185 (37.1%) | 101 (32.4%) |
| 15 Years | 53 (30.8%) | 18 (23.1%) |
| 16 and 17 Years | 81 (39.9%) | 40 (13.1%) |
| 18 to 24 Years | 170 (21.6%) | 164 (22.1%) |
| 25 to 34 Years | 195 (16.6%) | 431 (34.3%) |
| 35 to 44 Years | 90 (8.7%) | 310 (23.6%) |
| 45 to 54 Years | 246 (19.0%) | 265 (20.5%) |
| 55 to 64 Years | 266 (17.4%) | 382 (24.5%) |
| 65 to 74 Years | 112 (9.6%) | 204 (14.8%) |
| 75 Years and over | 125 (17.5%) | 206 (21.2%) |
| Total | 1,883 (19.1%) | 2,657 (25.0%) |
Income Above Poverty by Sex and Age in Meriwether County
According to the poverty statistics in Meriwether County, males aged 35 to 44 years and females aged 16 and 17 years are the age groups that are most secure financially, with 91.3% of males and 86.9% of females in these age groups living above the poverty line.
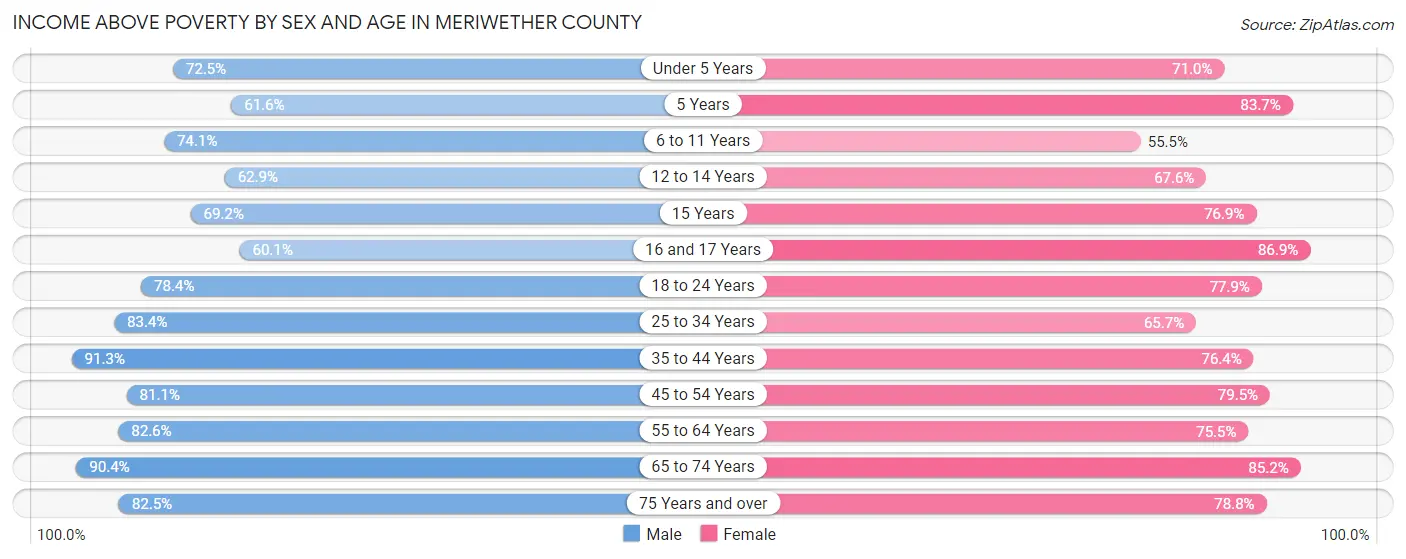
| Age Bracket | Male | Female |
| Under 5 Years | 437 (72.5%) | 382 (71.0%) |
| 5 Years | 53 (61.6%) | 41 (83.7%) |
| 6 to 11 Years | 461 (74.1%) | 464 (55.5%) |
| 12 to 14 Years | 313 (62.8%) | 211 (67.6%) |
| 15 Years | 119 (69.2%) | 60 (76.9%) |
| 16 and 17 Years | 122 (60.1%) | 266 (86.9%) |
| 18 to 24 Years | 616 (78.4%) | 579 (77.9%) |
| 25 to 34 Years | 980 (83.4%) | 827 (65.7%) |
| 35 to 44 Years | 941 (91.3%) | 1,005 (76.4%) |
| 45 to 54 Years | 1,052 (81.0%) | 1,025 (79.5%) |
| 55 to 64 Years | 1,262 (82.6%) | 1,174 (75.4%) |
| 65 to 74 Years | 1,052 (90.4%) | 1,171 (85.2%) |
| 75 Years and over | 589 (82.5%) | 766 (78.8%) |
| Total | 7,997 (80.9%) | 7,971 (75.0%) |
Income Below Poverty Among Married-Couple Families in Meriwether County
The poverty statistics for married-couple families in Meriwether County show that 5.0% or 173 of the total 3,494 families live below the poverty line. Families with 3 or 4 children have the highest poverty rate of 10.6%, comprising of 44 families. On the other hand, families with no children have the lowest poverty rate of 3.9%, which includes 87 families.
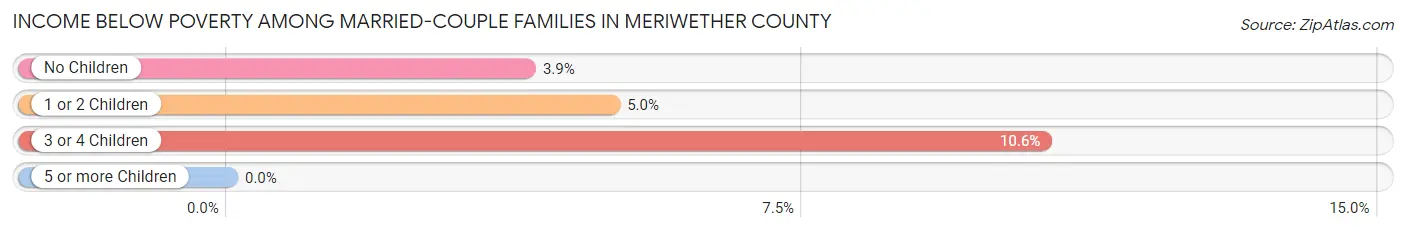
| Children | Above Poverty | Below Poverty |
| No Children | 2,151 (96.1%) | 87 (3.9%) |
| 1 or 2 Children | 800 (95.0%) | 42 (5.0%) |
| 3 or 4 Children | 370 (89.4%) | 44 (10.6%) |
| 5 or more Children | 0 (0.0%) | 0 (0.0%) |
| Total | 3,321 (95.1%) | 173 (5.0%) |
Income Below Poverty Among Single-Parent Households in Meriwether County
According to the poverty data in Meriwether County, 15.8% or 87 single-father households and 42.6% or 742 single-mother households are living below the poverty line. Among single-father households, those with no children have the highest poverty rate, with 56 households (21.8%) experiencing poverty. Likewise, among single-mother households, those with 5 or more children have the highest poverty rate, with 4 households (100.0%) falling below the poverty line.
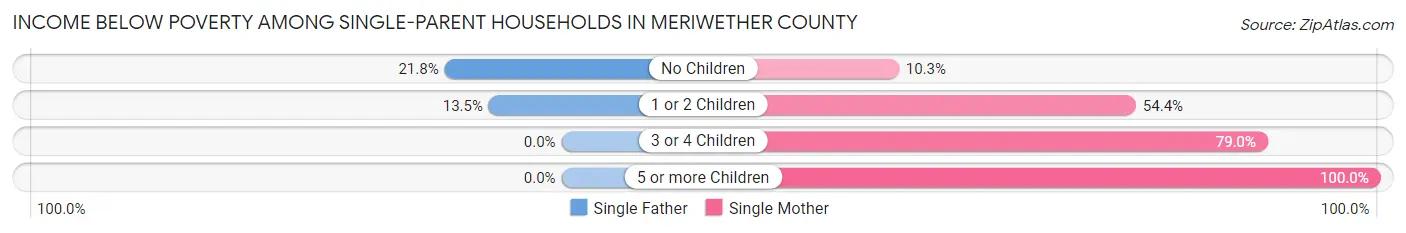
| Children | Single Father | Single Mother |
| No Children | 56 (21.8%) | 61 (10.3%) |
| 1 or 2 Children | 31 (13.5%) | 504 (54.4%) |
| 3 or 4 Children | 0 (0.0%) | 173 (79.0%) |
| 5 or more Children | 0 (0.0%) | 4 (100.0%) |
| Total | 87 (15.8%) | 742 (42.6%) |
Income Below Poverty Among Married-Couple vs Single-Parent Households in Meriwether County
The poverty data for Meriwether County shows that 173 of the married-couple family households (5.0%) and 829 of the single-parent households (36.1%) are living below the poverty level. Within the married-couple family households, those with 3 or 4 children have the highest poverty rate, with 44 households (10.6%) falling below the poverty line. Among the single-parent households, those with 3 or 4 children have the highest poverty rate, with 173 household (63.1%) living below poverty.
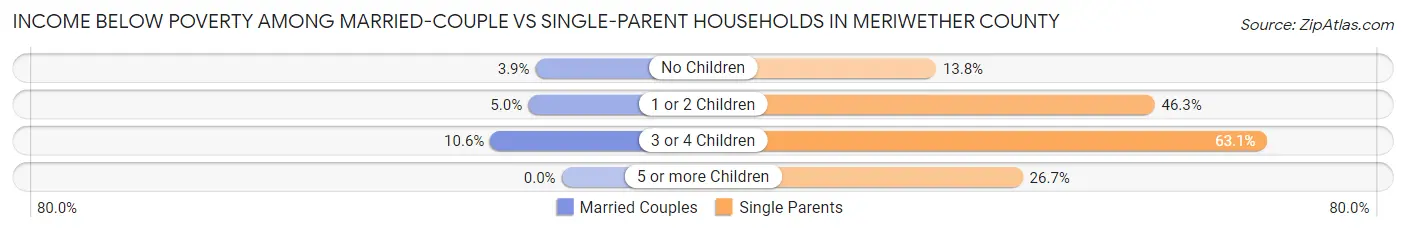
| Children | Married-Couple Families | Single-Parent Households |
| No Children | 87 (3.9%) | 117 (13.8%) |
| 1 or 2 Children | 42 (5.0%) | 535 (46.3%) |
| 3 or 4 Children | 44 (10.6%) | 173 (63.1%) |
| 5 or more Children | 0 (0.0%) | 4 (26.7%) |
| Total | 173 (5.0%) | 829 (36.1%) |
Race in Meriwether County
The most populous races in Meriwether County are White / Caucasian (11,922 | 57.7%), Black / African American (7,934 | 38.4%), and Hispanic or Latino (559 | 2.7%).
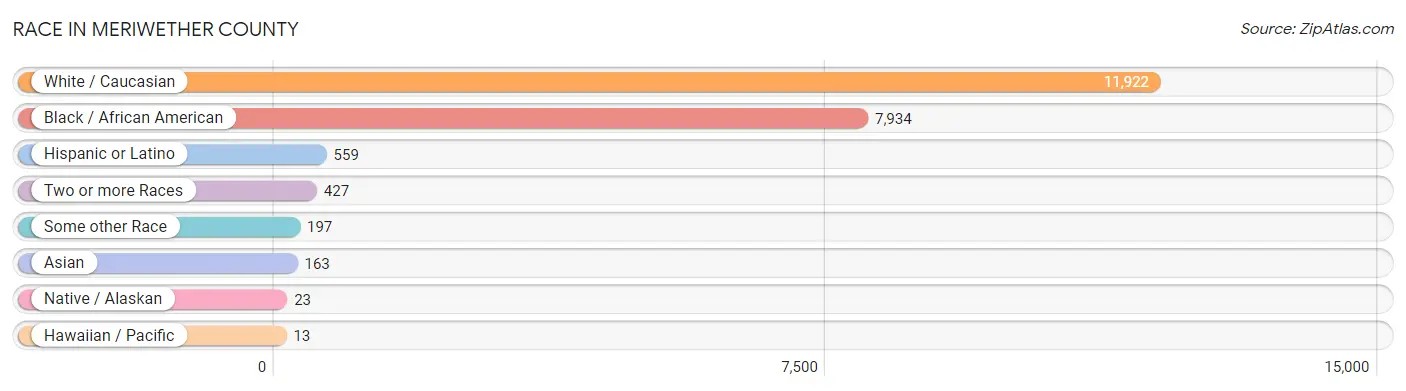
| Race | # Population | % Population |
| Asian | 163 | 0.8% |
| Black / African American | 7,934 | 38.4% |
| Hawaiian / Pacific | 13 | 0.1% |
| Hispanic or Latino | 559 | 2.7% |
| Native / Alaskan | 23 | 0.1% |
| White / Caucasian | 11,922 | 57.7% |
| Two or more Races | 427 | 2.1% |
| Some other Race | 197 | 0.9% |
| Total | 20,679 | 100.0% |
Ancestry in Meriwether County
The most populous ancestries reported in Meriwether County are American (2,241 | 10.8%), English (1,417 | 6.9%), Irish (1,216 | 5.9%), German (825 | 4.0%), and European (692 | 3.4%), together accounting for 30.9% of all Meriwether County residents.
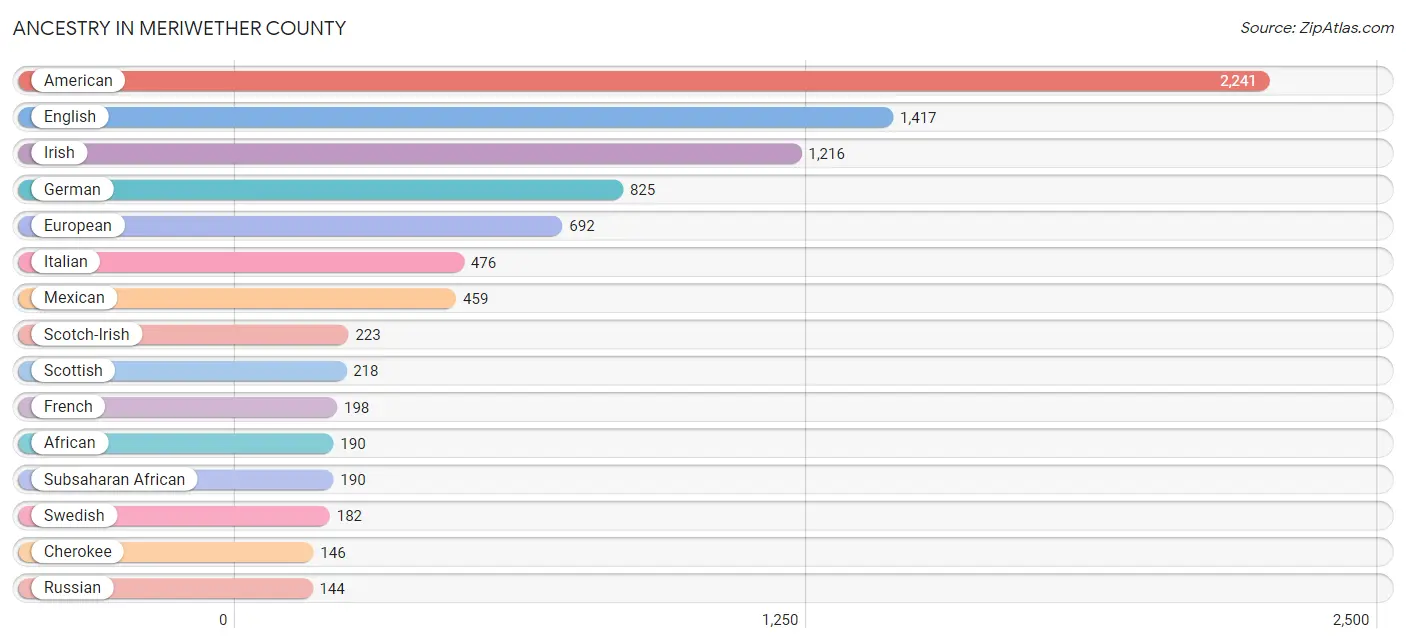
| Ancestry | # Population | % Population |
| African | 190 | 0.9% |
| American | 2,241 | 10.8% |
| Arab | 5 | 0.0% |
| Austrian | 3 | 0.0% |
| Belgian | 11 | 0.1% |
| British | 24 | 0.1% |
| Burmese | 98 | 0.5% |
| Central American | 9 | 0.0% |
| Cherokee | 146 | 0.7% |
| Choctaw | 22 | 0.1% |
| Creek | 2 | 0.0% |
| Croatian | 5 | 0.0% |
| Czechoslovakian | 3 | 0.0% |
| Danish | 18 | 0.1% |
| Dutch | 78 | 0.4% |
| Eastern European | 48 | 0.2% |
| English | 1,417 | 6.9% |
| European | 692 | 3.4% |
| Finnish | 3 | 0.0% |
| French | 198 | 1.0% |
| French Canadian | 18 | 0.1% |
| German | 825 | 4.0% |
| Greek | 3 | 0.0% |
| Honduran | 9 | 0.0% |
| Irish | 1,216 | 5.9% |
| Italian | 476 | 2.3% |
| Korean | 58 | 0.3% |
| Menominee | 2 | 0.0% |
| Mexican | 459 | 2.2% |
| Native Hawaiian | 34 | 0.2% |
| Northern European | 24 | 0.1% |
| Norwegian | 76 | 0.4% |
| Pakistani | 11 | 0.1% |
| Pennsylvania German | 2 | 0.0% |
| Polish | 66 | 0.3% |
| Portuguese | 44 | 0.2% |
| Puerto Rican | 54 | 0.3% |
| Russian | 144 | 0.7% |
| Samoan | 1 | 0.0% |
| Scandinavian | 69 | 0.3% |
| Scotch-Irish | 223 | 1.1% |
| Scottish | 218 | 1.1% |
| Spaniard | 30 | 0.2% |
| Spanish | 6 | 0.0% |
| Subsaharan African | 190 | 0.9% |
| Swedish | 182 | 0.9% |
| Syrian | 2 | 0.0% |
| Thai | 11 | 0.1% |
| Welsh | 1 | 0.0% | View All 49 Rows |
Immigrants in Meriwether County
The most numerous immigrant groups reported in Meriwether County came from Asia (133 | 0.6%), South Eastern Asia (69 | 0.3%), Philippines (58 | 0.3%), Eastern Asia (57 | 0.3%), and Korea (57 | 0.3%), together accounting for 1.8% of all Meriwether County residents.
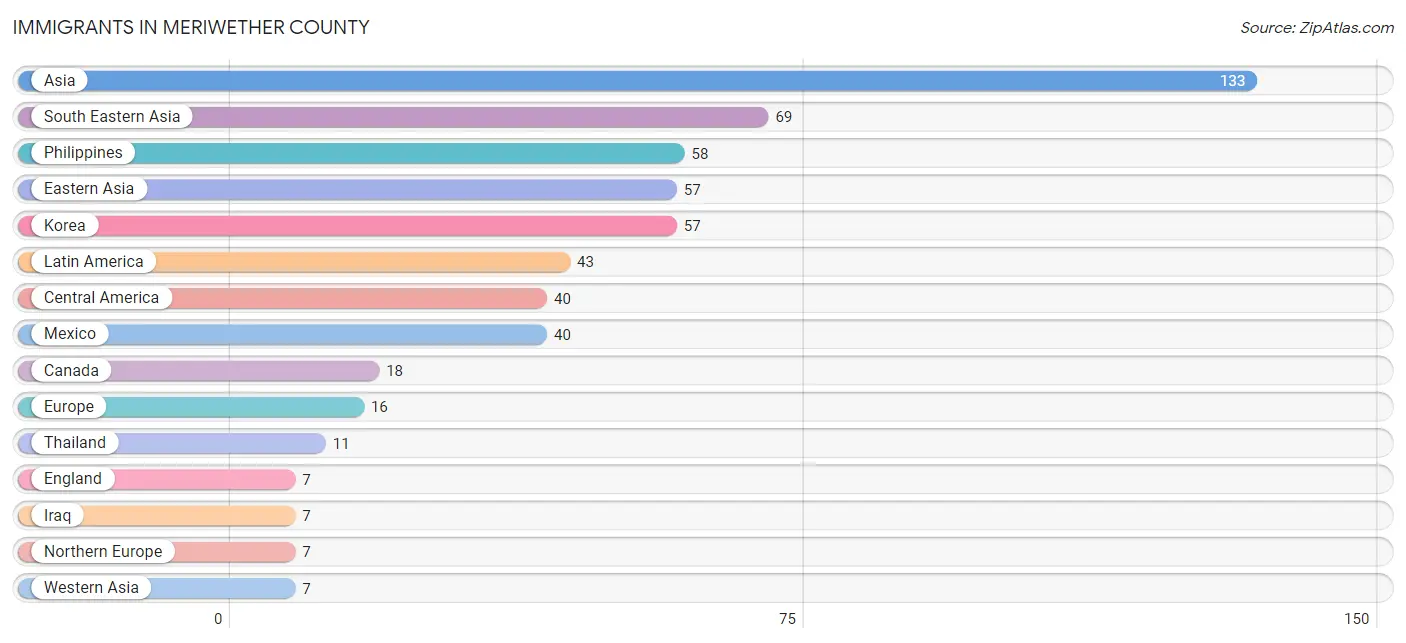
| Immigration Origin | # Population | % Population |
| Asia | 133 | 0.6% |
| Canada | 18 | 0.1% |
| Central America | 40 | 0.2% |
| Eastern Asia | 57 | 0.3% |
| Eastern Europe | 3 | 0.0% |
| England | 7 | 0.0% |
| Europe | 16 | 0.1% |
| France | 6 | 0.0% |
| Guyana | 3 | 0.0% |
| Iraq | 7 | 0.0% |
| Korea | 57 | 0.3% |
| Latin America | 43 | 0.2% |
| Mexico | 40 | 0.2% |
| Northern Europe | 7 | 0.0% |
| Philippines | 58 | 0.3% |
| Poland | 3 | 0.0% |
| South America | 3 | 0.0% |
| South Eastern Asia | 69 | 0.3% |
| Thailand | 11 | 0.1% |
| Western Asia | 7 | 0.0% |
| Western Europe | 6 | 0.0% | View All 21 Rows |
Sex and Age in Meriwether County
Sex and Age in Meriwether County
The most populous age groups in Meriwether County are 55 to 59 Years (900 | 9.0%) for men and 55 to 59 Years (888 | 8.3%) for women.
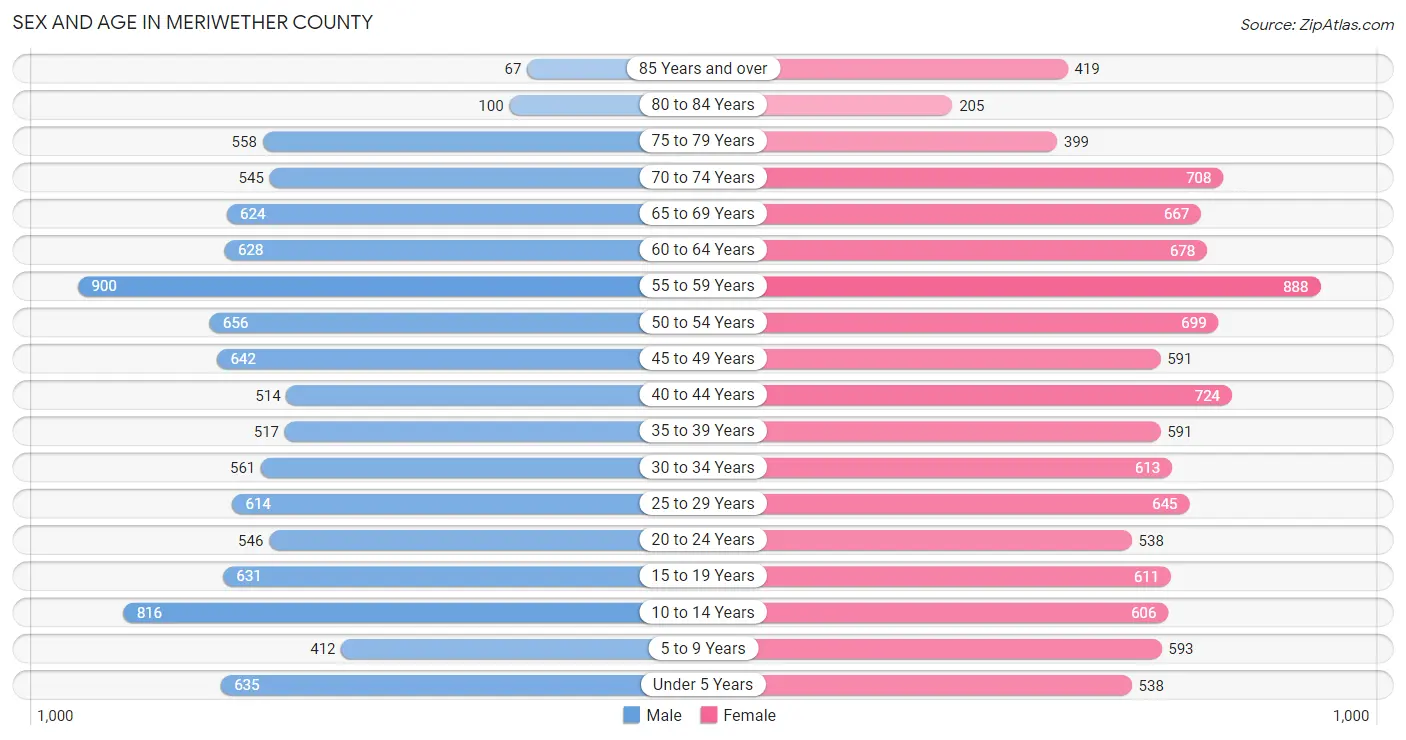
| Age Bracket | Male | Female |
| Under 5 Years | 635 (6.4%) | 538 (5.0%) |
| 5 to 9 Years | 412 (4.1%) | 593 (5.5%) |
| 10 to 14 Years | 816 (8.2%) | 606 (5.7%) |
| 15 to 19 Years | 631 (6.3%) | 611 (5.7%) |
| 20 to 24 Years | 546 (5.5%) | 538 (5.0%) |
| 25 to 29 Years | 614 (6.2%) | 645 (6.0%) |
| 30 to 34 Years | 561 (5.6%) | 613 (5.7%) |
| 35 to 39 Years | 517 (5.2%) | 591 (5.5%) |
| 40 to 44 Years | 514 (5.2%) | 724 (6.8%) |
| 45 to 49 Years | 642 (6.4%) | 591 (5.5%) |
| 50 to 54 Years | 656 (6.6%) | 699 (6.5%) |
| 55 to 59 Years | 900 (9.0%) | 888 (8.3%) |
| 60 to 64 Years | 628 (6.3%) | 678 (6.3%) |
| 65 to 69 Years | 624 (6.3%) | 667 (6.2%) |
| 70 to 74 Years | 545 (5.5%) | 708 (6.6%) |
| 75 to 79 Years | 558 (5.6%) | 399 (3.7%) |
| 80 to 84 Years | 100 (1.0%) | 205 (1.9%) |
| 85 Years and over | 67 (0.7%) | 419 (3.9%) |
| Total | 9,966 (100.0%) | 10,713 (100.0%) |
Families and Households in Meriwether County
Median Family Size in Meriwether County
The median family size in Meriwether County is 3.01 persons per family, with single female/mother families (1,743 | 30.1%) accounting for the largest median family size of 3.31 persons per family. On the other hand, married-couple families (3,494 | 60.4%) represent the smallest median family size with 2.86 persons per family.
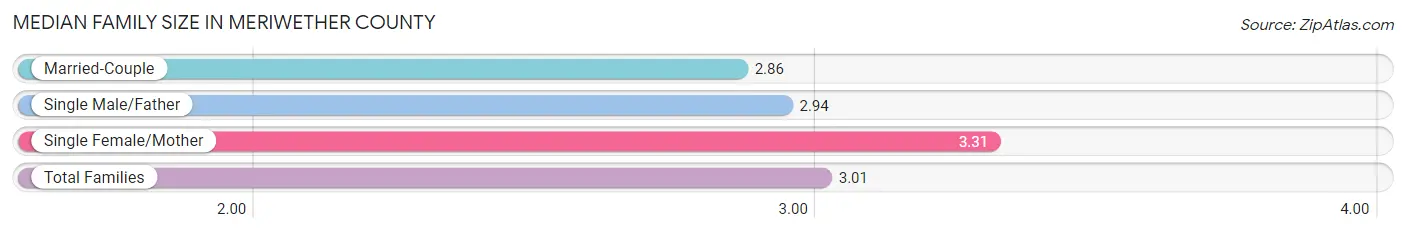
| Family Type | # Families | Family Size |
| Married-Couple | 3,494 (60.4%) | 2.86 |
| Single Male/Father | 552 (9.5%) | 2.94 |
| Single Female/Mother | 1,743 (30.1%) | 3.31 |
| Total Families | 5,789 (100.0%) | 3.01 |
Median Household Size in Meriwether County
The median household size in Meriwether County is 2.52 persons per household, with single female/mother households (1,743 | 21.5%) accounting for the largest median household size of 3.44 persons per household. non-family households (2,317 | 28.6%) represent the smallest median household size with 1.10 persons per household.
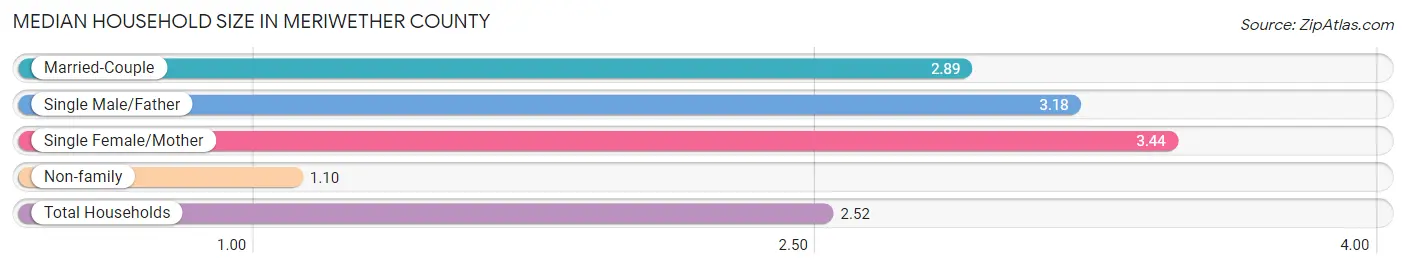
| Household Type | # Households | Household Size |
| Married-Couple | 3,494 (43.1%) | 2.89 |
| Single Male/Father | 552 (6.8%) | 3.18 |
| Single Female/Mother | 1,743 (21.5%) | 3.44 |
| Non-family | 2,317 (28.6%) | 1.10 |
| Total Households | 8,106 (100.0%) | 2.52 |
Household Size by Marriage Status in Meriwether County
Out of a total of 8,106 households in Meriwether County, 5,789 (71.4%) are family households, while 2,317 (28.6%) are nonfamily households. The most numerous type of family households are 2-person households, comprising 2,362, and the most common type of nonfamily households are 1-person households, comprising 2,105.
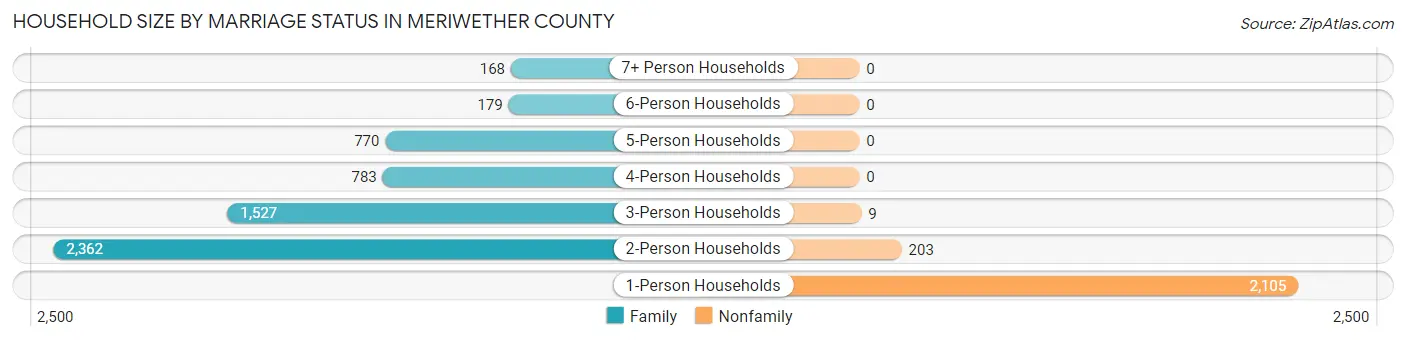
| Household Size | Family Households | Nonfamily Households |
| 1-Person Households | - | 2,105 (26.0%) |
| 2-Person Households | 2,362 (29.1%) | 203 (2.5%) |
| 3-Person Households | 1,527 (18.8%) | 9 (0.1%) |
| 4-Person Households | 783 (9.7%) | 0 (0.0%) |
| 5-Person Households | 770 (9.5%) | 0 (0.0%) |
| 6-Person Households | 179 (2.2%) | 0 (0.0%) |
| 7+ Person Households | 168 (2.1%) | 0 (0.0%) |
| Total | 5,789 (71.4%) | 2,317 (28.6%) |
Female Fertility in Meriwether County
Fertility by Age in Meriwether County
Average fertility rate in Meriwether County is 97.0 births per 1,000 women. Women in the age bracket of 20 to 34 years have the highest fertility rate with 169.0 births per 1,000 women. Women in the age bracket of 20 to 34 years acount for 71.6% of all women with births.
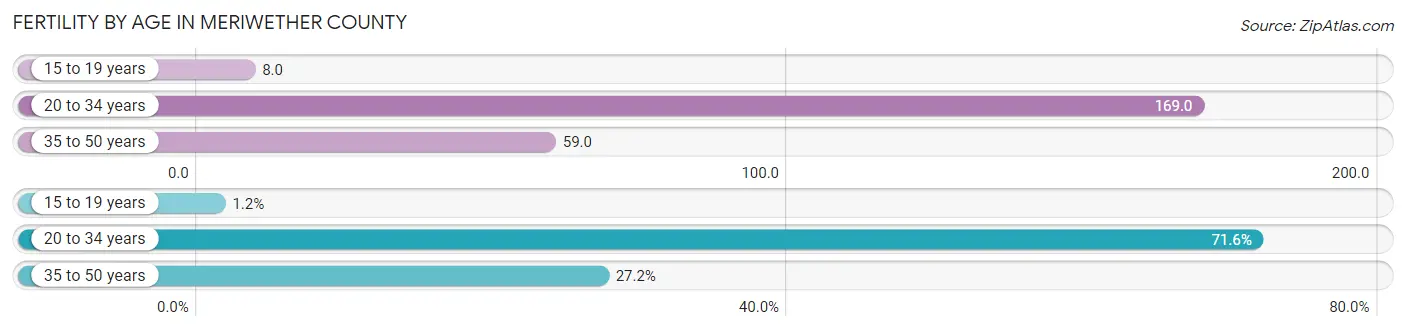
| Age Bracket | Women with Births | Births / 1,000 Women |
| 15 to 19 years | 5 (1.2%) | 8.0 |
| 20 to 34 years | 303 (71.6%) | 169.0 |
| 35 to 50 years | 115 (27.2%) | 59.0 |
| Total | 423 (100.0%) | 97.0 |
Fertility by Age by Marriage Status in Meriwether County
16.1% of women with births (423) in Meriwether County are married. The highest percentage of unmarried women with births falls into 15 to 19 years age bracket with 100.0% of them unmarried at the time of birth, while the lowest percentage of unmarried women with births belong to 20 to 34 years age bracket with 79.9% of them unmarried.
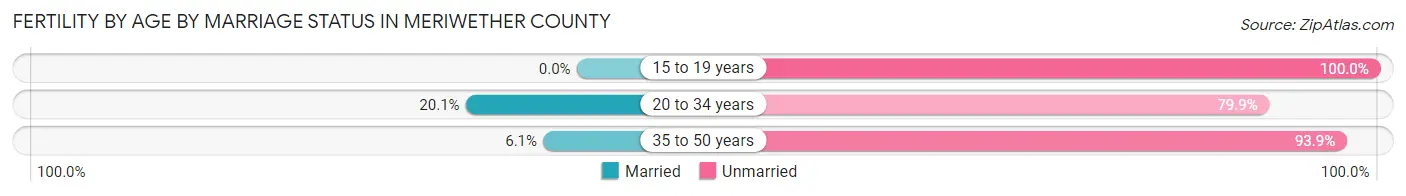
| Age Bracket | Married | Unmarried |
| 15 to 19 years | 0 (0.0%) | 5 (100.0%) |
| 20 to 34 years | 61 (20.1%) | 242 (79.9%) |
| 35 to 50 years | 7 (6.1%) | 108 (93.9%) |
| Total | 68 (16.1%) | 355 (83.9%) |
Fertility by Education in Meriwether County
Average fertility rate in Meriwether County is 97.0 births per 1,000 women. Women with the education attainment of bachelor's degree have the highest fertility rate of 171.0 births per 1,000 women, while women with the education attainment of graduate degree have the lowest fertility at 76.0 births per 1,000 women. Women with the education attainment of high school diploma represent 45.4% of all women with births.
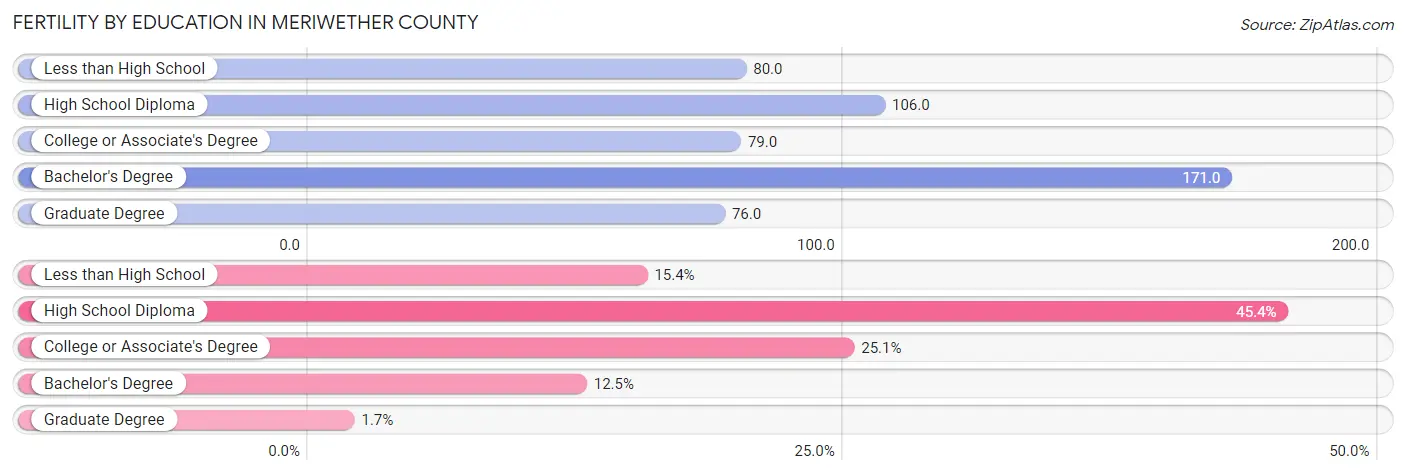
| Educational Attainment | Women with Births | Births / 1,000 Women |
| Less than High School | 65 (15.4%) | 80.0 |
| High School Diploma | 192 (45.4%) | 106.0 |
| College or Associate's Degree | 106 (25.1%) | 79.0 |
| Bachelor's Degree | 53 (12.5%) | 171.0 |
| Graduate Degree | 7 (1.7%) | 76.0 |
| Total | 423 (100.0%) | 97.0 |
Fertility by Education by Marriage Status in Meriwether County
83.9% of women with births in Meriwether County are unmarried. Women with the educational attainment of graduate degree are most likely to be married with 100.0% of them married at childbirth, while women with the educational attainment of less than high school are least likely to be married with 100.0% of them unmarried at childbirth.
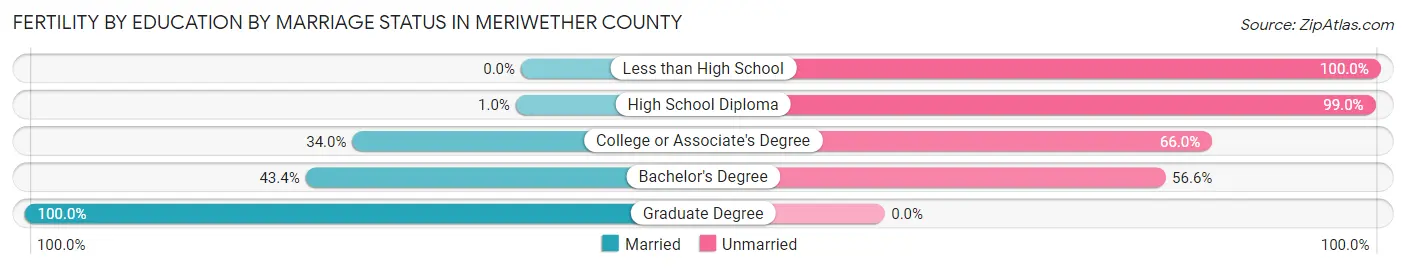
| Educational Attainment | Married | Unmarried |
| Less than High School | 0 (0.0%) | 65 (100.0%) |
| High School Diploma | 2 (1.0%) | 190 (99.0%) |
| College or Associate's Degree | 36 (34.0%) | 70 (66.0%) |
| Bachelor's Degree | 23 (43.4%) | 30 (56.6%) |
| Graduate Degree | 7 (100.0%) | 0 (0.0%) |
| Total | 68 (16.1%) | 355 (83.9%) |
Employment Characteristics in Meriwether County
Employment by Class of Employer in Meriwether County
Among the 7,732 employed individuals in Meriwether County, private company employees (5,595 | 72.4%), local government employees (749 | 9.7%), and state government employees (404 | 5.2%) make up the most common classes of employment.
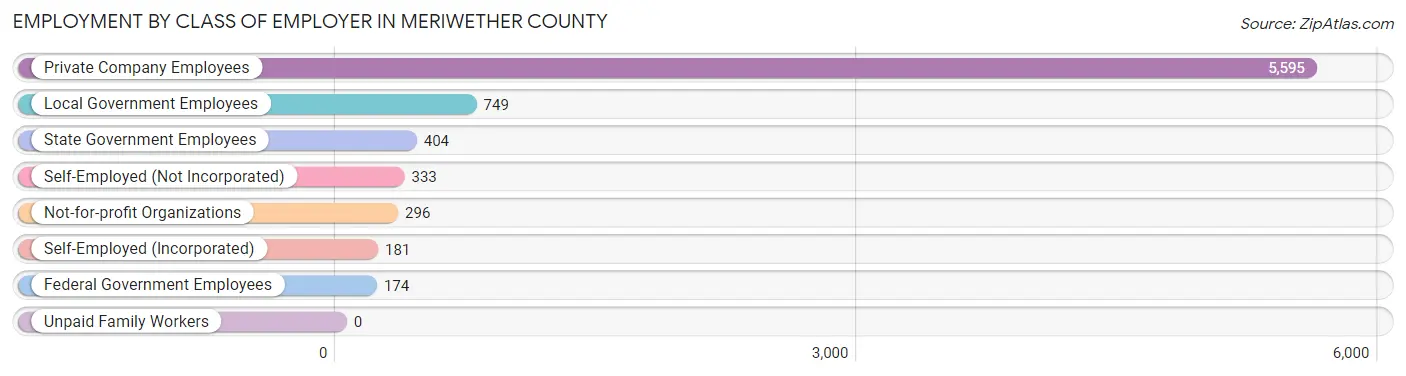
| Employer Class | # Employees | % Employees |
| Private Company Employees | 5,595 | 72.4% |
| Self-Employed (Incorporated) | 181 | 2.3% |
| Self-Employed (Not Incorporated) | 333 | 4.3% |
| Not-for-profit Organizations | 296 | 3.8% |
| Local Government Employees | 749 | 9.7% |
| State Government Employees | 404 | 5.2% |
| Federal Government Employees | 174 | 2.2% |
| Unpaid Family Workers | 0 | 0.0% |
| Total | 7,732 | 100.0% |
Employment Status by Age in Meriwether County
According to the labor force statistics for Meriwether County, out of the total population over 16 years of age (16,820), 51.2% or 8,612 individuals are in the labor force, with 7.1% or 611 of them unemployed. The age group with the highest labor force participation rate is 35 to 44 years, with 84.4% or 1,980 individuals in the labor force. Within the labor force, the 16 to 19 years age range has the highest percentage of unemployed individuals, with 18.2% or 66 of them being unemployed.
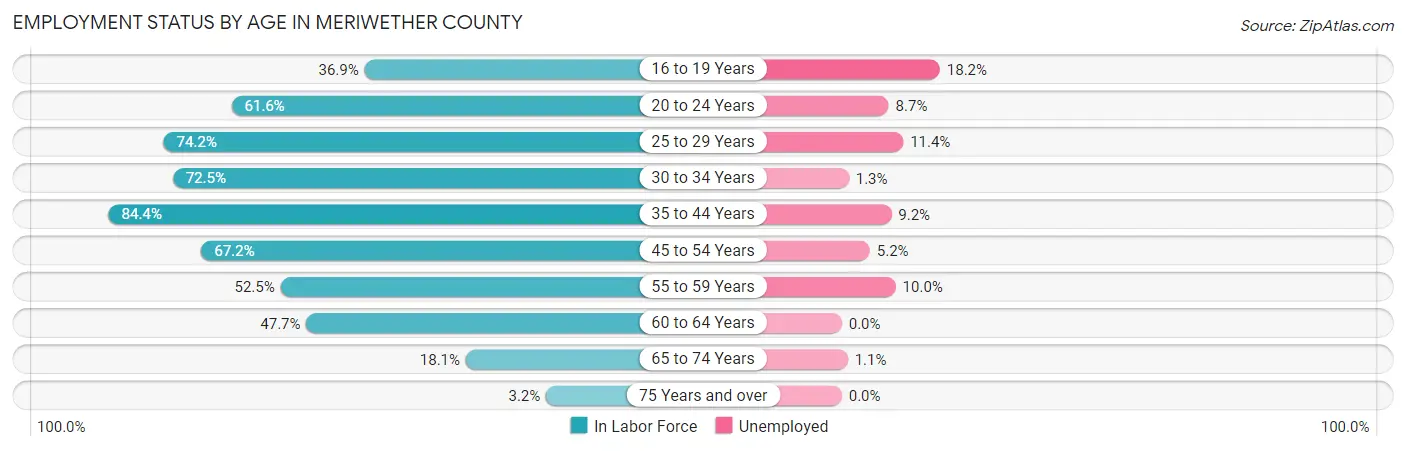
| Age Bracket | In Labor Force | Unemployed |
| 16 to 19 Years | 363 (36.9%) | 66 (18.2%) |
| 20 to 24 Years | 668 (61.6%) | 58 (8.7%) |
| 25 to 29 Years | 934 (74.2%) | 106 (11.4%) |
| 30 to 34 Years | 851 (72.5%) | 11 (1.3%) |
| 35 to 44 Years | 1,980 (84.4%) | 182 (9.2%) |
| 45 to 54 Years | 1,739 (67.2%) | 90 (5.2%) |
| 55 to 59 Years | 939 (52.5%) | 94 (10.0%) |
| 60 to 64 Years | 623 (47.7%) | 0 (0.0%) |
| 65 to 74 Years | 460 (18.1%) | 5 (1.1%) |
| 75 Years and over | 56 (3.2%) | 0 (0.0%) |
| Total | 8,612 (51.2%) | 611 (7.1%) |
Employment Status by Educational Attainment in Meriwether County
According to labor force statistics for Meriwether County, 67.5% of individuals (7,061) out of the total population between 25 and 64 years of age (10,461) are in the labor force, with 6.9% or 487 of them being unemployed. The group with the highest labor force participation rate are those with the educational attainment of bachelor's degree or higher, with 78.7% or 918 individuals in the labor force. Within the labor force, individuals with less than high school education have the highest percentage of unemployment, with 7.7% or 73 of them being unemployed.
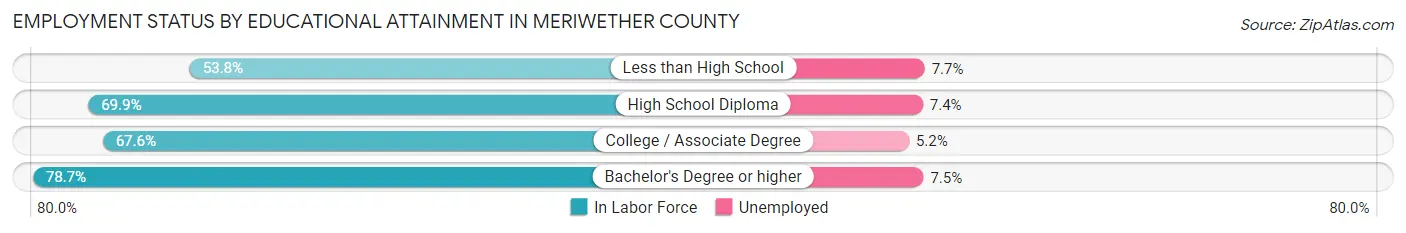
| Educational Attainment | In Labor Force | Unemployed |
| Less than High School | 943 (53.8%) | 135 (7.7%) |
| High School Diploma | 3,198 (69.9%) | 339 (7.4%) |
| College / Associate Degree | 2,006 (67.6%) | 154 (5.2%) |
| Bachelor's Degree or higher | 918 (78.7%) | 88 (7.5%) |
| Total | 7,061 (67.5%) | 722 (6.9%) |
Employment Occupations by Sex in Meriwether County
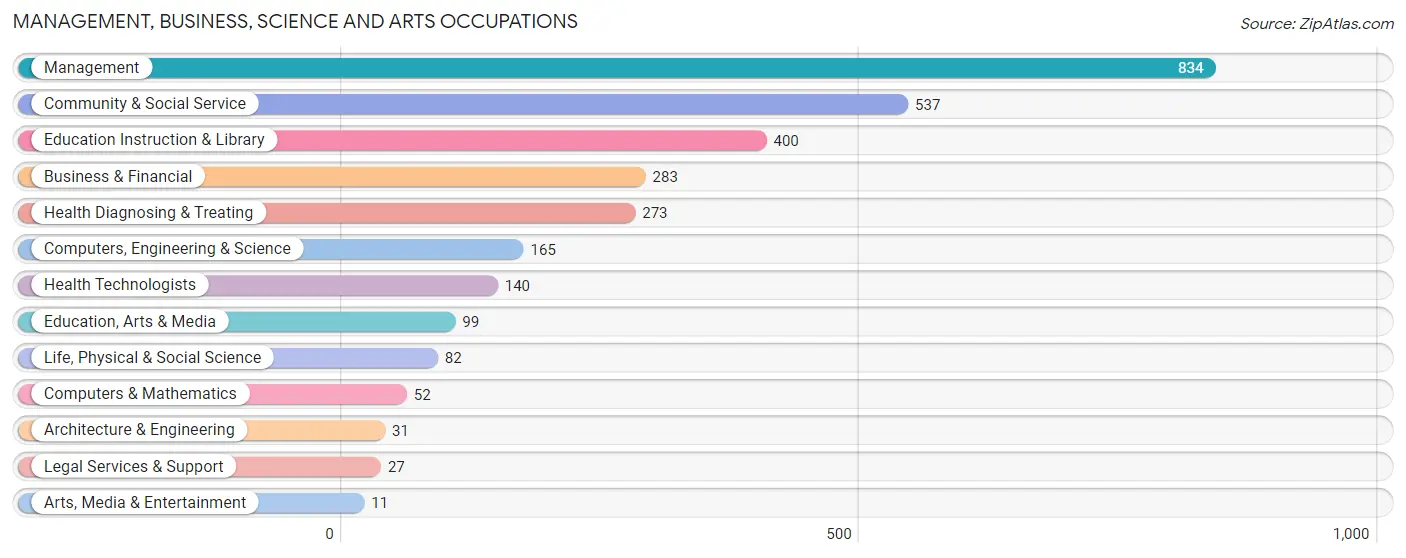
Management, Business, Science and Arts Occupations
The most common Management, Business, Science and Arts occupations in Meriwether County are Management (834 | 10.4%), Community & Social Service (537 | 6.7%), Education Instruction & Library (400 | 5.0%), Business & Financial (283 | 3.5%), and Health Diagnosing & Treating (273 | 3.4%).
Management, Business, Science and Arts Occupations by Sex
Within the Management, Business, Science and Arts occupations in Meriwether County, the most male-oriented occupations are Arts, Media & Entertainment (100.0%), Life, Physical & Social Science (93.9%), and Computers & Mathematics (84.6%), while the most female-oriented occupations are Education Instruction & Library (90.2%), Community & Social Service (76.0%), and Health Technologists (69.3%).
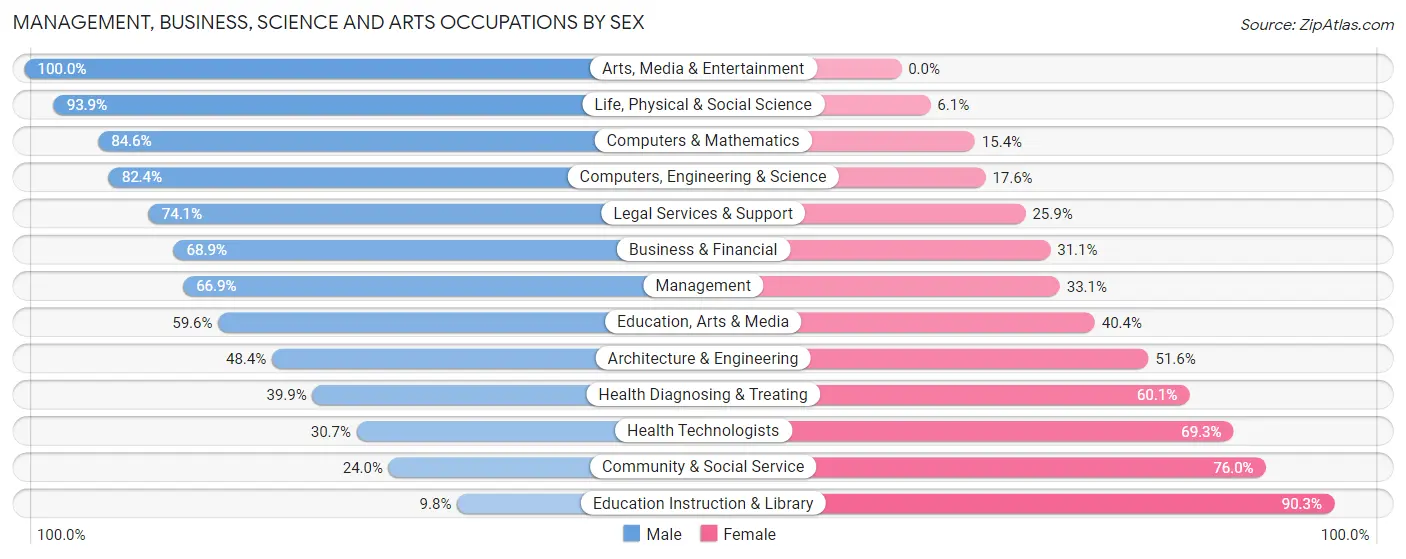
| Occupation | Male | Female |
| Management | 558 (66.9%) | 276 (33.1%) |
| Business & Financial | 195 (68.9%) | 88 (31.1%) |
| Computers, Engineering & Science | 136 (82.4%) | 29 (17.6%) |
| Computers & Mathematics | 44 (84.6%) | 8 (15.4%) |
| Architecture & Engineering | 15 (48.4%) | 16 (51.6%) |
| Life, Physical & Social Science | 77 (93.9%) | 5 (6.1%) |
| Community & Social Service | 129 (24.0%) | 408 (76.0%) |
| Education, Arts & Media | 59 (59.6%) | 40 (40.4%) |
| Legal Services & Support | 20 (74.1%) | 7 (25.9%) |
| Education Instruction & Library | 39 (9.8%) | 361 (90.2%) |
| Arts, Media & Entertainment | 11 (100.0%) | 0 (0.0%) |
| Health Diagnosing & Treating | 109 (39.9%) | 164 (60.1%) |
| Health Technologists | 43 (30.7%) | 97 (69.3%) |
| Total (Category) | 1,127 (53.9%) | 965 (46.1%) |
| Total (Overall) | 4,284 (53.6%) | 3,713 (46.4%) |
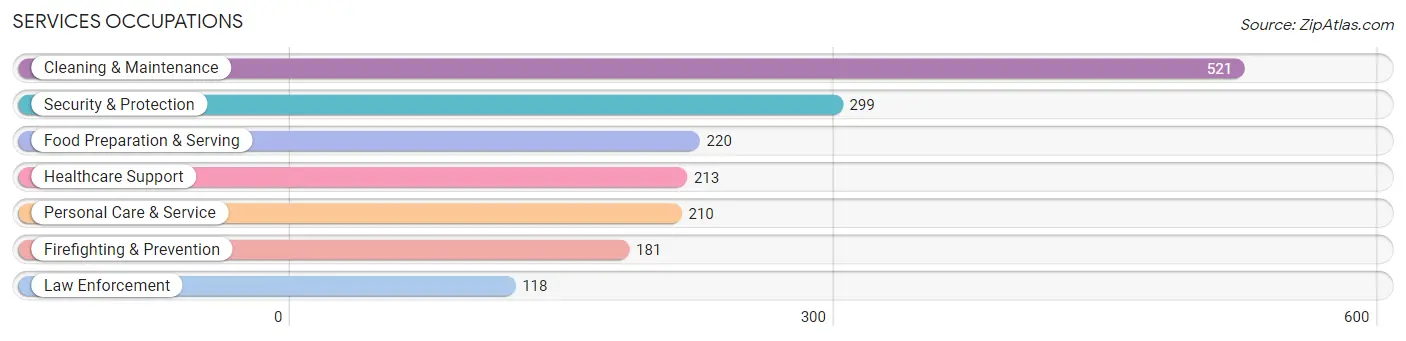
Services Occupations
The most common Services occupations in Meriwether County are Cleaning & Maintenance (521 | 6.5%), Security & Protection (299 | 3.7%), Food Preparation & Serving (220 | 2.8%), Healthcare Support (213 | 2.7%), and Personal Care & Service (210 | 2.6%).
Services Occupations by Sex
Within the Services occupations in Meriwether County, the most male-oriented occupations are Law Enforcement (86.4%), Security & Protection (73.9%), and Firefighting & Prevention (65.7%), while the most female-oriented occupations are Healthcare Support (100.0%), Food Preparation & Serving (86.8%), and Personal Care & Service (75.2%).
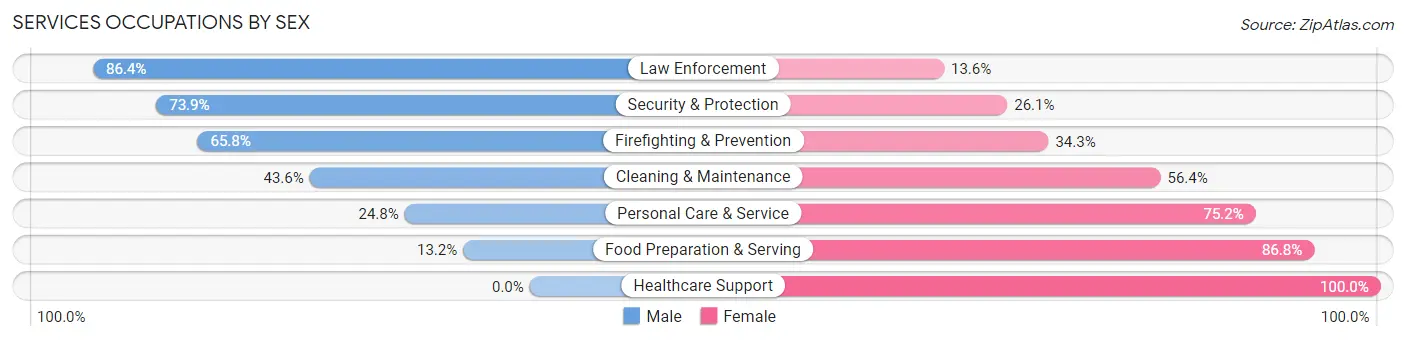
| Occupation | Male | Female |
| Healthcare Support | 0 (0.0%) | 213 (100.0%) |
| Security & Protection | 221 (73.9%) | 78 (26.1%) |
| Firefighting & Prevention | 119 (65.7%) | 62 (34.3%) |
| Law Enforcement | 102 (86.4%) | 16 (13.6%) |
| Food Preparation & Serving | 29 (13.2%) | 191 (86.8%) |
| Cleaning & Maintenance | 227 (43.6%) | 294 (56.4%) |
| Personal Care & Service | 52 (24.8%) | 158 (75.2%) |
| Total (Category) | 529 (36.2%) | 934 (63.8%) |
| Total (Overall) | 4,284 (53.6%) | 3,713 (46.4%) |
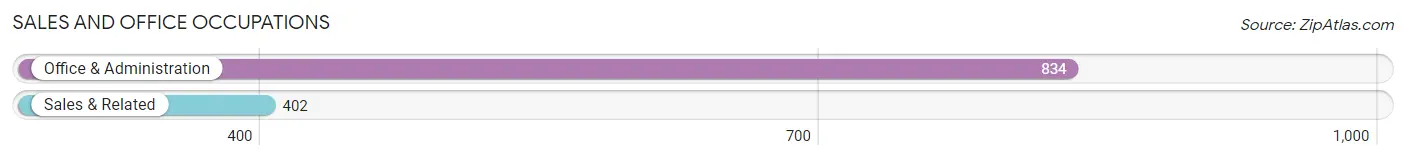
Sales and Office Occupations
The most common Sales and Office occupations in Meriwether County are Office & Administration (834 | 10.4%), and Sales & Related (402 | 5.0%).
Sales and Office Occupations by Sex
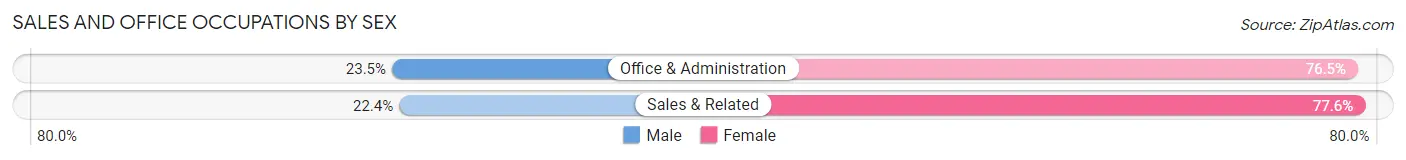
| Occupation | Male | Female |
| Sales & Related | 90 (22.4%) | 312 (77.6%) |
| Office & Administration | 196 (23.5%) | 638 (76.5%) |
| Total (Category) | 286 (23.1%) | 950 (76.9%) |
| Total (Overall) | 4,284 (53.6%) | 3,713 (46.4%) |
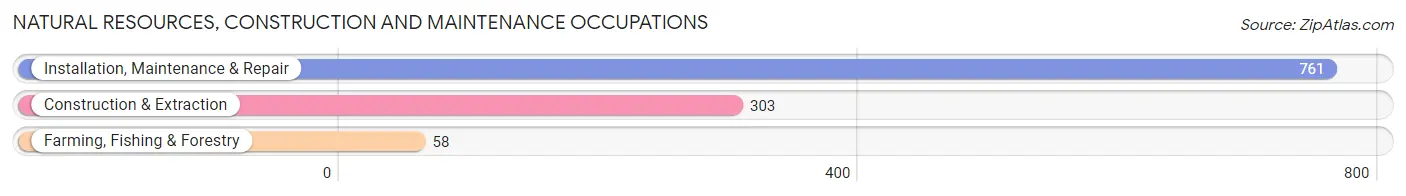
Natural Resources, Construction and Maintenance Occupations
The most common Natural Resources, Construction and Maintenance occupations in Meriwether County are Installation, Maintenance & Repair (761 | 9.5%), Construction & Extraction (303 | 3.8%), and Farming, Fishing & Forestry (58 | 0.7%).
Natural Resources, Construction and Maintenance Occupations by Sex
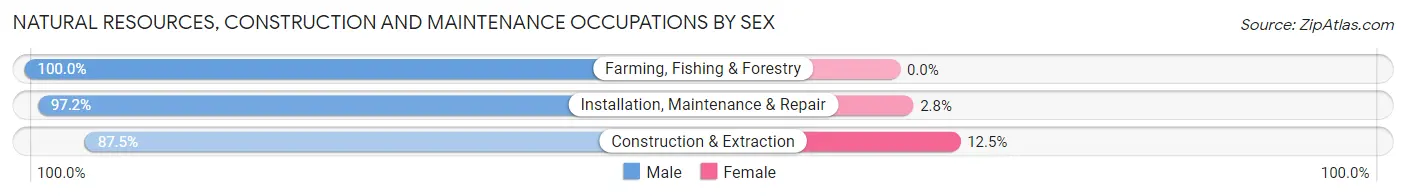
| Occupation | Male | Female |
| Farming, Fishing & Forestry | 58 (100.0%) | 0 (0.0%) |
| Construction & Extraction | 265 (87.5%) | 38 (12.5%) |
| Installation, Maintenance & Repair | 740 (97.2%) | 21 (2.8%) |
| Total (Category) | 1,063 (94.7%) | 59 (5.3%) |
| Total (Overall) | 4,284 (53.6%) | 3,713 (46.4%) |
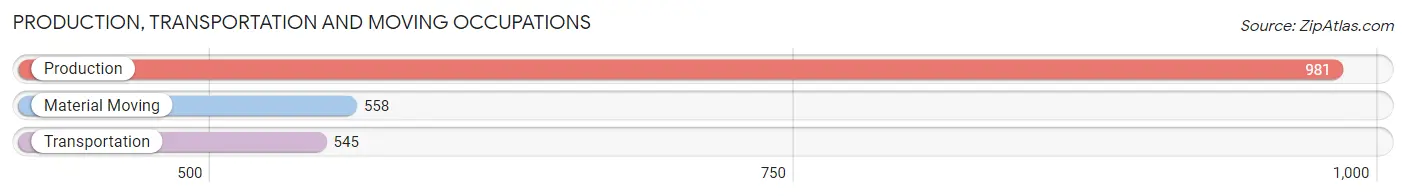
Production, Transportation and Moving Occupations
The most common Production, Transportation and Moving occupations in Meriwether County are Production (981 | 12.3%), Material Moving (558 | 7.0%), and Transportation (545 | 6.8%).
Production, Transportation and Moving Occupations by Sex
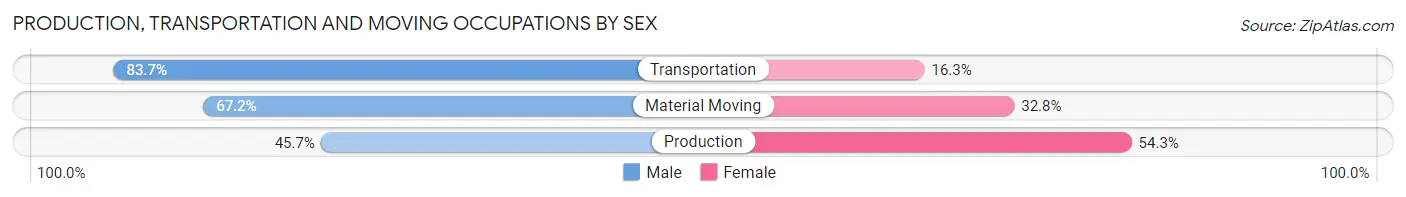
| Occupation | Male | Female |
| Production | 448 (45.7%) | 533 (54.3%) |
| Transportation | 456 (83.7%) | 89 (16.3%) |
| Material Moving | 375 (67.2%) | 183 (32.8%) |
| Total (Category) | 1,279 (61.4%) | 805 (38.6%) |
| Total (Overall) | 4,284 (53.6%) | 3,713 (46.4%) |
Employment Industries by Sex in Meriwether County
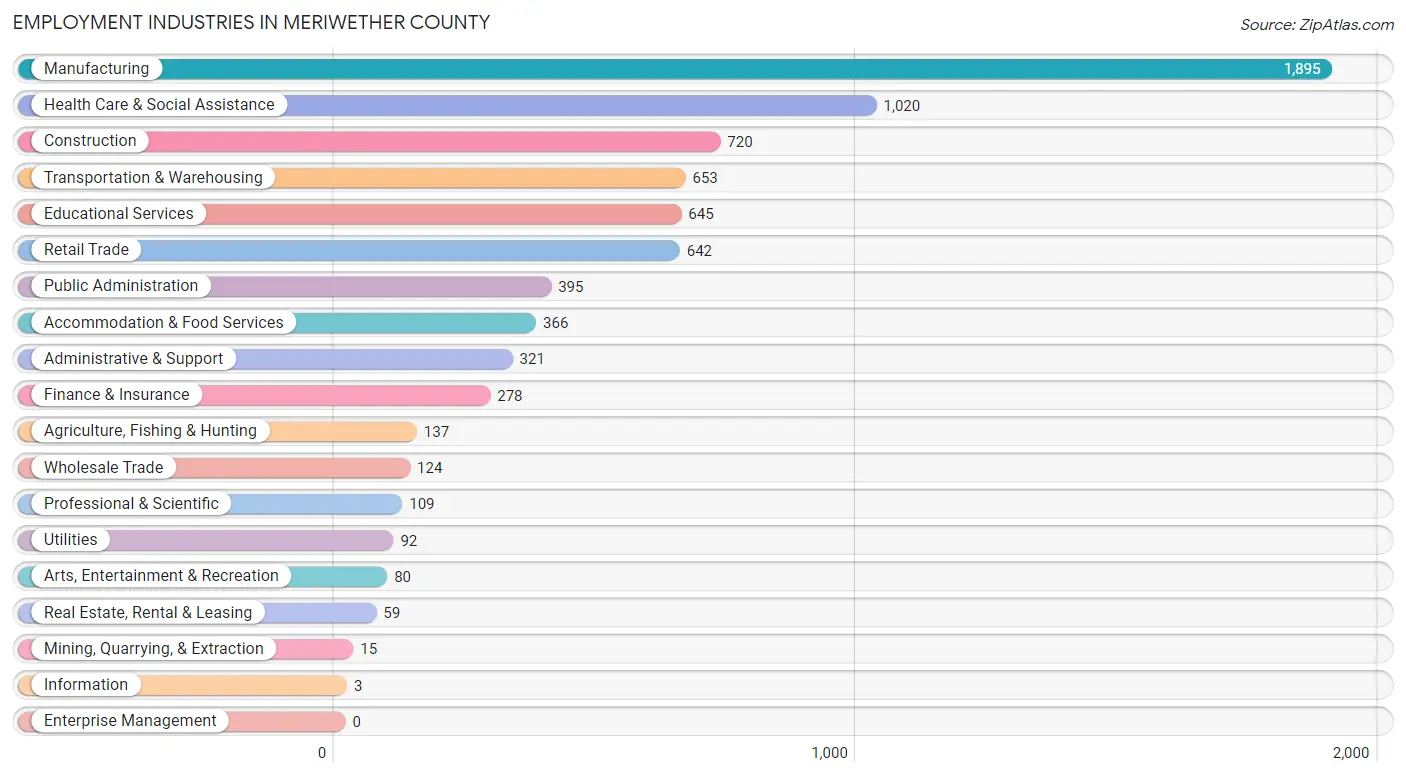
Employment Industries in Meriwether County
The major employment industries in Meriwether County include Manufacturing (1,895 | 23.7%), Health Care & Social Assistance (1,020 | 12.8%), Construction (720 | 9.0%), Transportation & Warehousing (653 | 8.2%), and Educational Services (645 | 8.1%).
Employment Industries by Sex in Meriwether County
The Meriwether County industries that see more men than women are Mining, Quarrying, & Extraction (100.0%), Information (100.0%), and Utilities (97.8%), whereas the industries that tend to have a higher number of women are Arts, Entertainment & Recreation (97.5%), Educational Services (89.9%), and Accommodation & Food Services (87.7%).
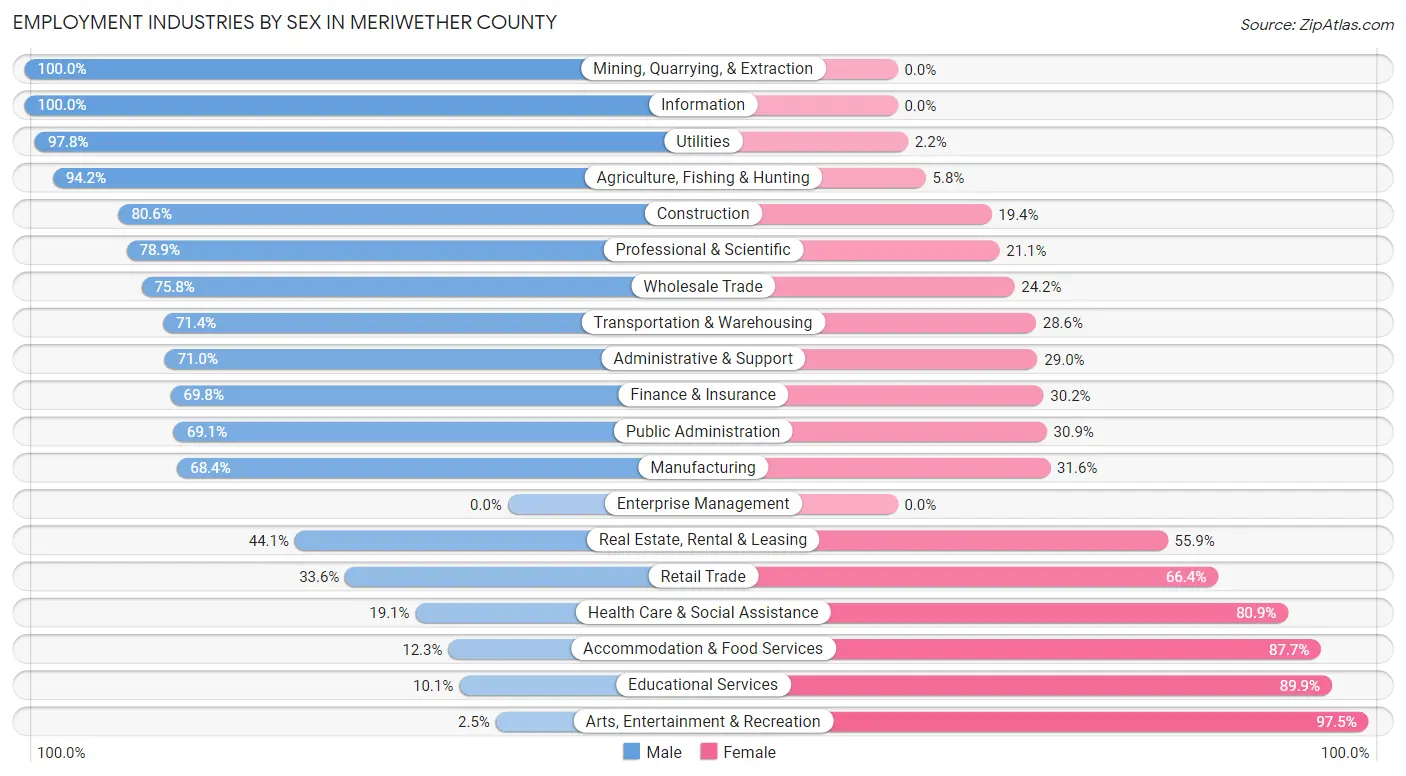
| Industry | Male | Female |
| Agriculture, Fishing & Hunting | 129 (94.2%) | 8 (5.8%) |
| Mining, Quarrying, & Extraction | 15 (100.0%) | 0 (0.0%) |
| Construction | 580 (80.6%) | 140 (19.4%) |
| Manufacturing | 1,296 (68.4%) | 599 (31.6%) |
| Wholesale Trade | 94 (75.8%) | 30 (24.2%) |
| Retail Trade | 216 (33.6%) | 426 (66.4%) |
| Transportation & Warehousing | 466 (71.4%) | 187 (28.6%) |
| Utilities | 90 (97.8%) | 2 (2.2%) |
| Information | 3 (100.0%) | 0 (0.0%) |
| Finance & Insurance | 194 (69.8%) | 84 (30.2%) |
| Real Estate, Rental & Leasing | 26 (44.1%) | 33 (55.9%) |
| Professional & Scientific | 86 (78.9%) | 23 (21.1%) |
| Enterprise Management | 0 (0.0%) | 0 (0.0%) |
| Administrative & Support | 228 (71.0%) | 93 (29.0%) |
| Educational Services | 65 (10.1%) | 580 (89.9%) |
| Health Care & Social Assistance | 195 (19.1%) | 825 (80.9%) |
| Arts, Entertainment & Recreation | 2 (2.5%) | 78 (97.5%) |
| Accommodation & Food Services | 45 (12.3%) | 321 (87.7%) |
| Public Administration | 273 (69.1%) | 122 (30.9%) |
| Total | 4,284 (53.6%) | 3,713 (46.4%) |
Education in Meriwether County
School Enrollment in Meriwether County
The most common levels of schooling among the 4,045 students in Meriwether County are middle school (1,098 | 27.1%), high school (983 | 24.3%), and elementary school (742 | 18.3%).
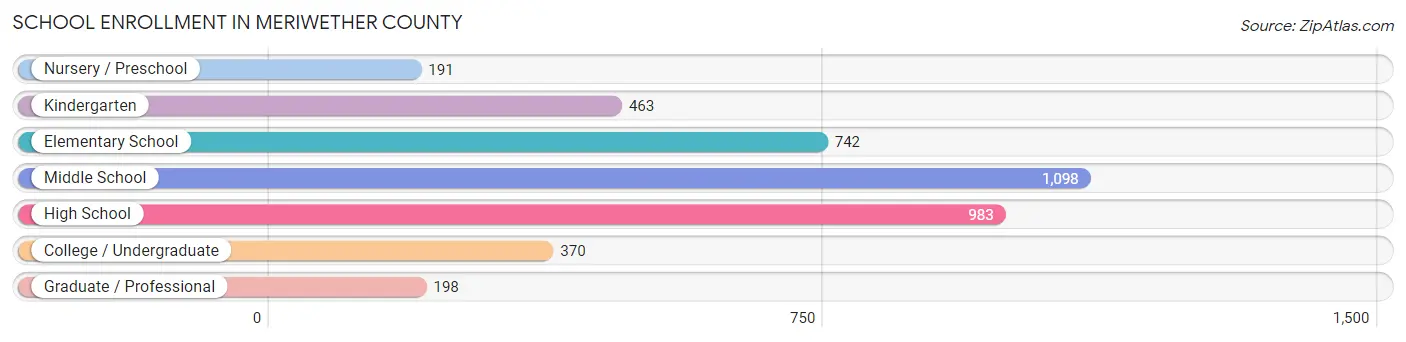
| School Level | # Students | % Students |
| Nursery / Preschool | 191 | 4.7% |
| Kindergarten | 463 | 11.5% |
| Elementary School | 742 | 18.3% |
| Middle School | 1,098 | 27.1% |
| High School | 983 | 24.3% |
| College / Undergraduate | 370 | 9.1% |
| Graduate / Professional | 198 | 4.9% |
| Total | 4,045 | 100.0% |
School Enrollment by Age by Funding Source in Meriwether County
Out of a total of 4,045 students who are enrolled in schools in Meriwether County, 498 (12.3%) attend a private institution, while the remaining 3,547 (87.7%) are enrolled in public schools. The age group of 20 to 24 year olds has the highest likelihood of being enrolled in private schools, with 195 (58.6% in the age bracket) enrolled. Conversely, the age group of 18 to 19 year olds has the lowest likelihood of being enrolled in a private school, with 231 (94.3% in the age bracket) attending a public institution.
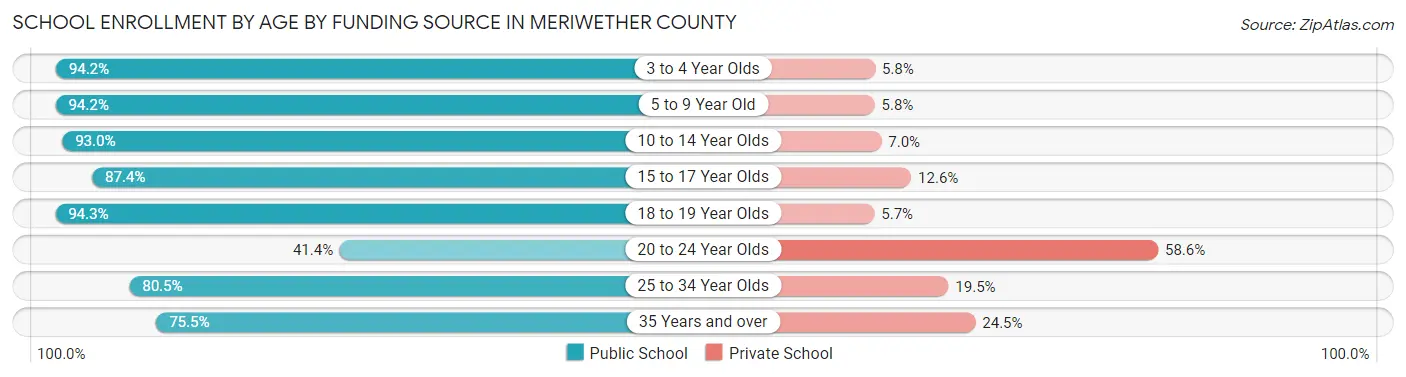
| Age Bracket | Public School | Private School |
| 3 to 4 Year Olds | 210 (94.2%) | 13 (5.8%) |
| 5 to 9 Year Old | 917 (94.2%) | 56 (5.8%) |
| 10 to 14 Year Olds | 1,298 (93.0%) | 98 (7.0%) |
| 15 to 17 Year Olds | 647 (87.4%) | 93 (12.6%) |
| 18 to 19 Year Olds | 231 (94.3%) | 14 (5.7%) |
| 20 to 24 Year Olds | 138 (41.4%) | 195 (58.6%) |
| 25 to 34 Year Olds | 66 (80.5%) | 16 (19.5%) |
| 35 Years and over | 40 (75.5%) | 13 (24.5%) |
| Total | 3,547 (87.7%) | 498 (12.3%) |
Educational Attainment by Field of Study in Meriwether County
Business (496 | 24.4%), education (338 | 16.6%), science & technology (251 | 12.3%), arts & humanities (187 | 9.2%), and bio, nature & agricultural (155 | 7.6%) are the most common fields of study among 2,034 individuals in Meriwether County who have obtained a bachelor's degree or higher.
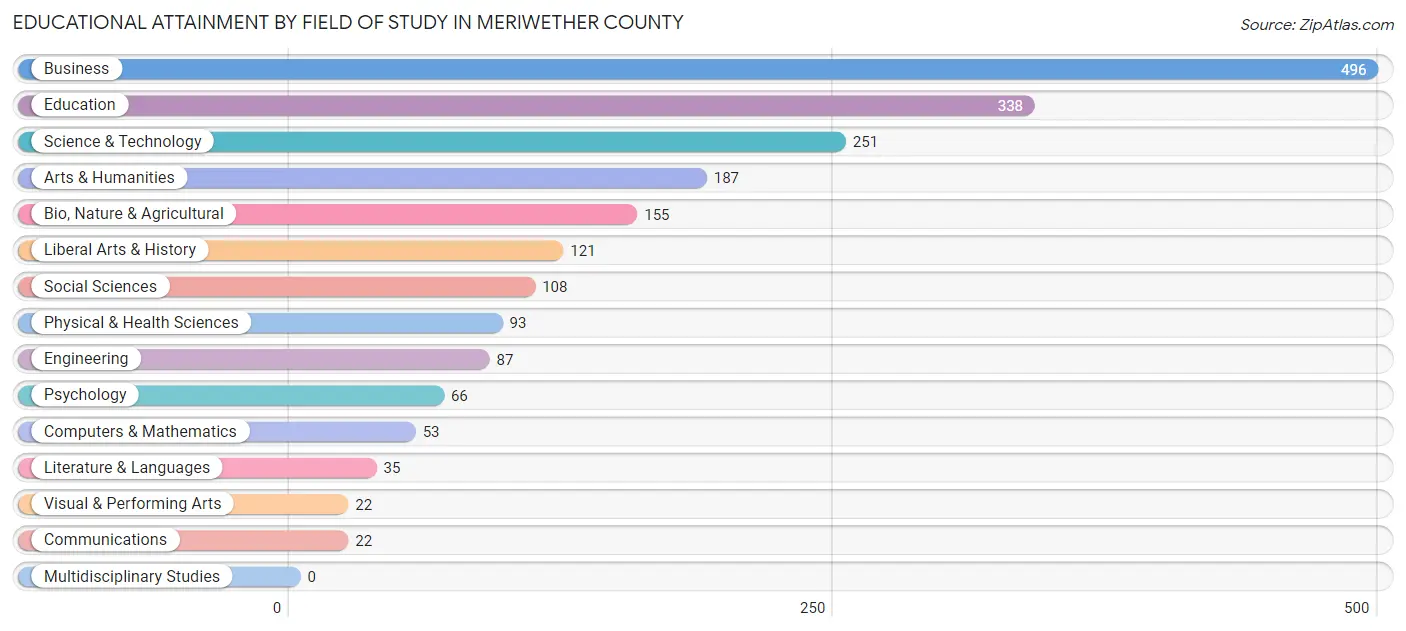
| Field of Study | # Graduates | % Graduates |
| Computers & Mathematics | 53 | 2.6% |
| Bio, Nature & Agricultural | 155 | 7.6% |
| Physical & Health Sciences | 93 | 4.6% |
| Psychology | 66 | 3.2% |
| Social Sciences | 108 | 5.3% |
| Engineering | 87 | 4.3% |
| Multidisciplinary Studies | 0 | 0.0% |
| Science & Technology | 251 | 12.3% |
| Business | 496 | 24.4% |
| Education | 338 | 16.6% |
| Literature & Languages | 35 | 1.7% |
| Liberal Arts & History | 121 | 5.9% |
| Visual & Performing Arts | 22 | 1.1% |
| Communications | 22 | 1.1% |
| Arts & Humanities | 187 | 9.2% |
| Total | 2,034 | 100.0% |
Transportation & Commute in Meriwether County
Vehicle Availability by Sex in Meriwether County
The most prevalent vehicle ownership categories in Meriwether County are males with 2 vehicles (1,416, accounting for 34.8%) and females with 2 vehicles (1,158, making up 38.7%).
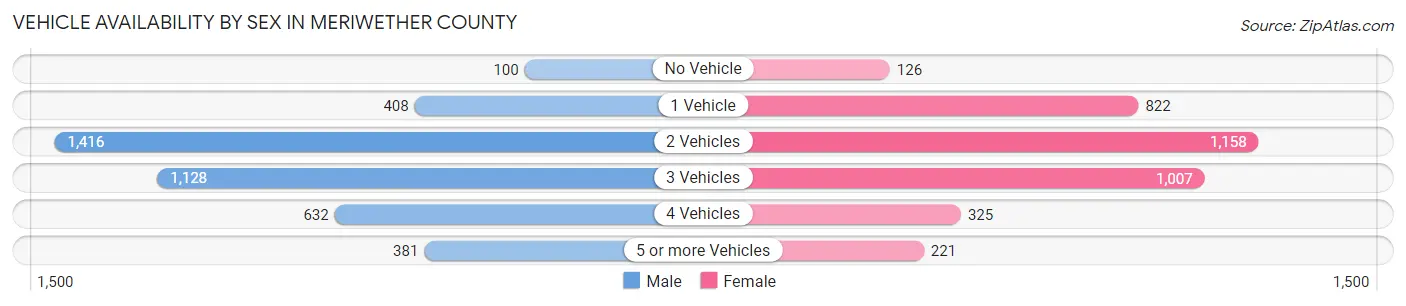
| Vehicles Available | Male | Female |
| No Vehicle | 100 (2.5%) | 126 (3.4%) |
| 1 Vehicle | 408 (10.0%) | 822 (22.5%) |
| 2 Vehicles | 1,416 (34.8%) | 1,158 (31.7%) |
| 3 Vehicles | 1,128 (27.8%) | 1,007 (27.5%) |
| 4 Vehicles | 632 (15.5%) | 325 (8.9%) |
| 5 or more Vehicles | 381 (9.4%) | 221 (6.0%) |
| Total | 4,065 (100.0%) | 3,659 (100.0%) |
Commute Time in Meriwether County
The most frequently occuring commute durations in Meriwether County are 30 to 34 minutes (1,515 commuters, 20.3%), 45 to 59 minutes (1,415 commuters, 18.9%), and 60 to 89 minutes (781 commuters, 10.4%).
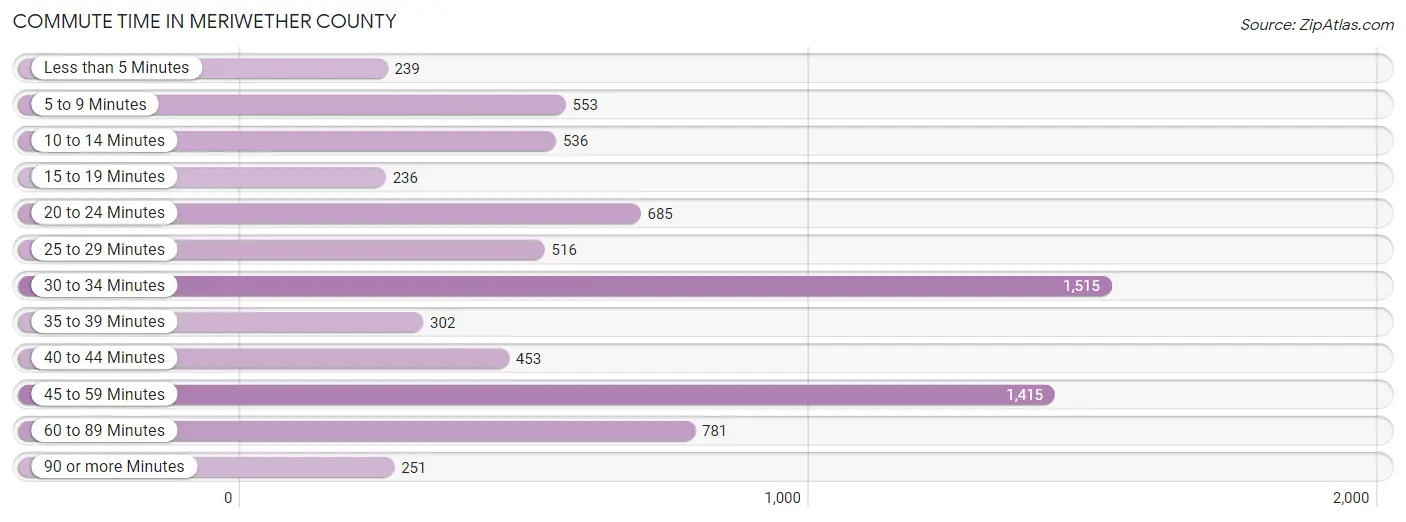
| Commute Time | # Commuters | % Commuters |
| Less than 5 Minutes | 239 | 3.2% |
| 5 to 9 Minutes | 553 | 7.4% |
| 10 to 14 Minutes | 536 | 7.2% |
| 15 to 19 Minutes | 236 | 3.2% |
| 20 to 24 Minutes | 685 | 9.2% |
| 25 to 29 Minutes | 516 | 6.9% |
| 30 to 34 Minutes | 1,515 | 20.3% |
| 35 to 39 Minutes | 302 | 4.0% |
| 40 to 44 Minutes | 453 | 6.0% |
| 45 to 59 Minutes | 1,415 | 18.9% |
| 60 to 89 Minutes | 781 | 10.4% |
| 90 or more Minutes | 251 | 3.4% |
Commute Time by Sex in Meriwether County
The most common commute times in Meriwether County are 45 to 59 minutes (745 commuters, 19.1%) for males and 30 to 34 minutes (872 commuters, 24.3%) for females.
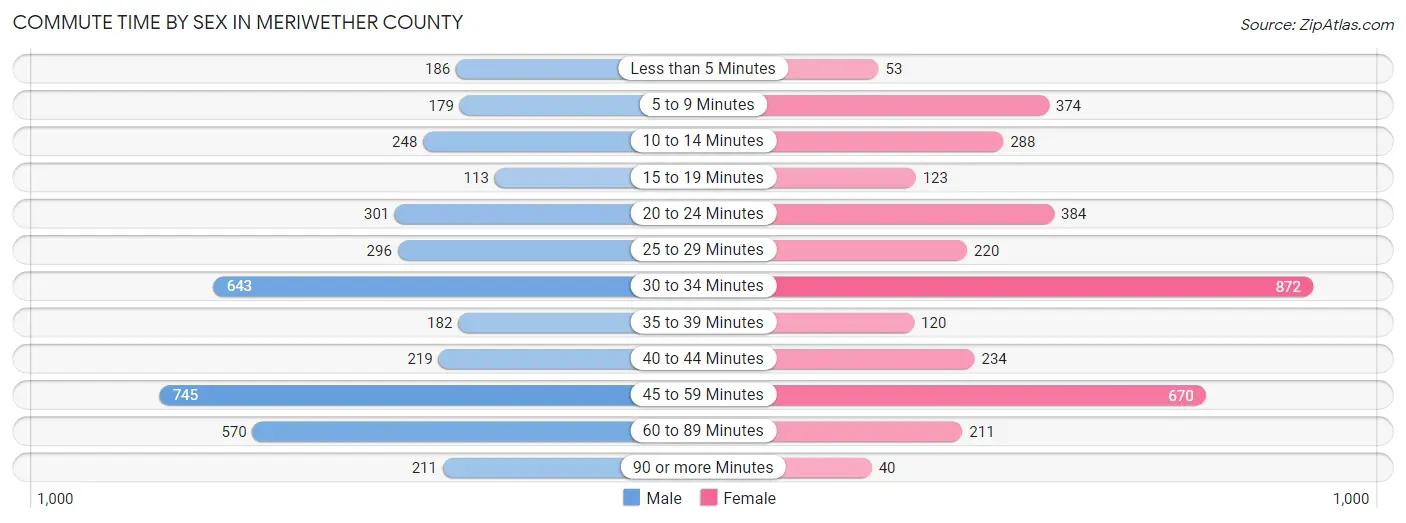
| Commute Time | Male | Female |
| Less than 5 Minutes | 186 (4.8%) | 53 (1.5%) |
| 5 to 9 Minutes | 179 (4.6%) | 374 (10.4%) |
| 10 to 14 Minutes | 248 (6.4%) | 288 (8.0%) |
| 15 to 19 Minutes | 113 (2.9%) | 123 (3.4%) |
| 20 to 24 Minutes | 301 (7.7%) | 384 (10.7%) |
| 25 to 29 Minutes | 296 (7.6%) | 220 (6.1%) |
| 30 to 34 Minutes | 643 (16.5%) | 872 (24.3%) |
| 35 to 39 Minutes | 182 (4.7%) | 120 (3.3%) |
| 40 to 44 Minutes | 219 (5.6%) | 234 (6.5%) |
| 45 to 59 Minutes | 745 (19.1%) | 670 (18.7%) |
| 60 to 89 Minutes | 570 (14.6%) | 211 (5.9%) |
| 90 or more Minutes | 211 (5.4%) | 40 (1.1%) |
Time of Departure to Work by Sex in Meriwether County
The most frequent times of departure to work in Meriwether County are 6:00 AM to 6:29 AM (559, 14.4%) for males and 7:00 AM to 7:29 AM (725, 20.2%) for females.
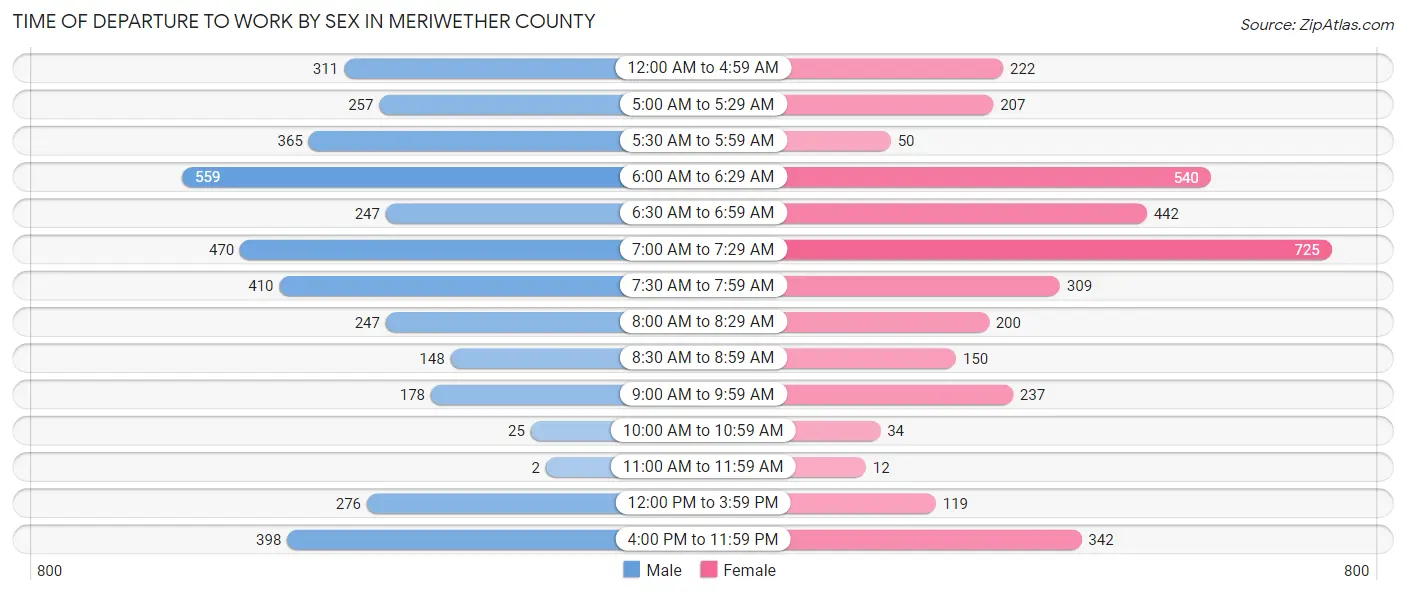
| Time of Departure | Male | Female |
| 12:00 AM to 4:59 AM | 311 (8.0%) | 222 (6.2%) |
| 5:00 AM to 5:29 AM | 257 (6.6%) | 207 (5.8%) |
| 5:30 AM to 5:59 AM | 365 (9.4%) | 50 (1.4%) |
| 6:00 AM to 6:29 AM | 559 (14.4%) | 540 (15.0%) |
| 6:30 AM to 6:59 AM | 247 (6.3%) | 442 (12.3%) |
| 7:00 AM to 7:29 AM | 470 (12.1%) | 725 (20.2%) |
| 7:30 AM to 7:59 AM | 410 (10.5%) | 309 (8.6%) |
| 8:00 AM to 8:29 AM | 247 (6.3%) | 200 (5.6%) |
| 8:30 AM to 8:59 AM | 148 (3.8%) | 150 (4.2%) |
| 9:00 AM to 9:59 AM | 178 (4.6%) | 237 (6.6%) |
| 10:00 AM to 10:59 AM | 25 (0.6%) | 34 (0.9%) |
| 11:00 AM to 11:59 AM | 2 (0.1%) | 12 (0.3%) |
| 12:00 PM to 3:59 PM | 276 (7.1%) | 119 (3.3%) |
| 4:00 PM to 11:59 PM | 398 (10.2%) | 342 (9.5%) |
| Total | 3,893 (100.0%) | 3,589 (100.0%) |
Housing Occupancy in Meriwether County
Occupancy by Ownership in Meriwether County
Of the total 8,106 dwellings in Meriwether County, owner-occupied units account for 5,426 (66.9%), while renter-occupied units make up 2,680 (33.1%).
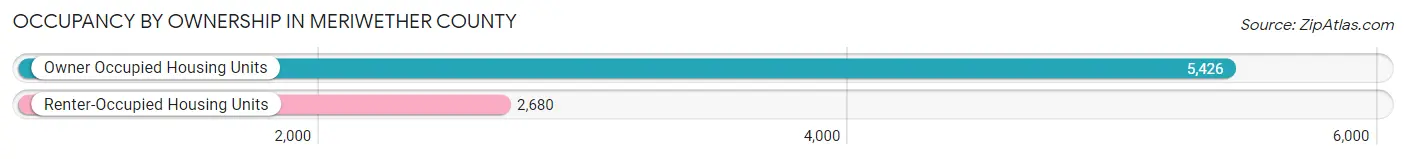
| Occupancy | # Housing Units | % Housing Units |
| Owner Occupied Housing Units | 5,426 | 66.9% |
| Renter-Occupied Housing Units | 2,680 | 33.1% |
| Total Occupied Housing Units | 8,106 | 100.0% |
Occupancy by Household Size in Meriwether County
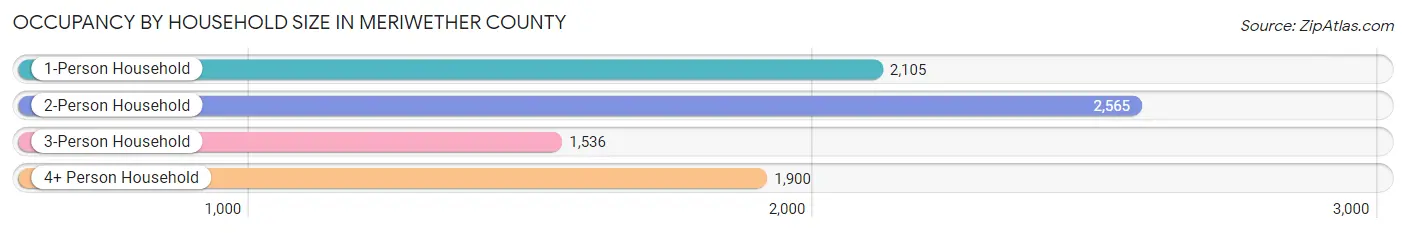
| Household Size | # Housing Units | % Housing Units |
| 1-Person Household | 2,105 | 26.0% |
| 2-Person Household | 2,565 | 31.6% |
| 3-Person Household | 1,536 | 19.0% |
| 4+ Person Household | 1,900 | 23.4% |
| Total Housing Units | 8,106 | 100.0% |
Occupancy by Ownership by Household Size in Meriwether County
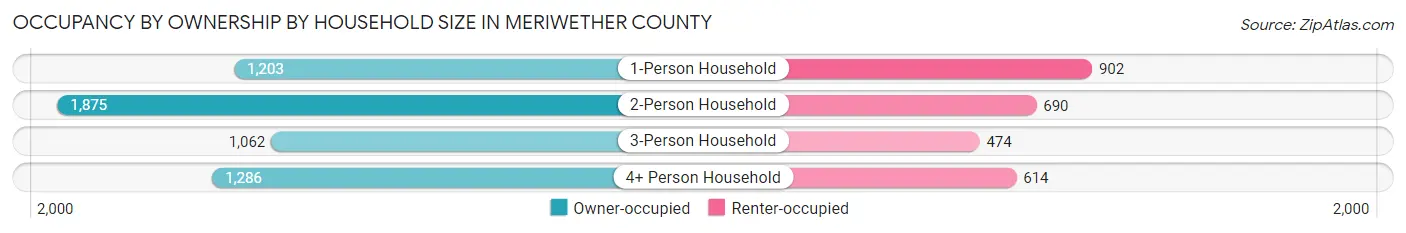
| Household Size | Owner-occupied | Renter-occupied |
| 1-Person Household | 1,203 (57.2%) | 902 (42.8%) |
| 2-Person Household | 1,875 (73.1%) | 690 (26.9%) |
| 3-Person Household | 1,062 (69.1%) | 474 (30.9%) |
| 4+ Person Household | 1,286 (67.7%) | 614 (32.3%) |
| Total Housing Units | 5,426 (66.9%) | 2,680 (33.1%) |
Occupancy by Educational Attainment in Meriwether County
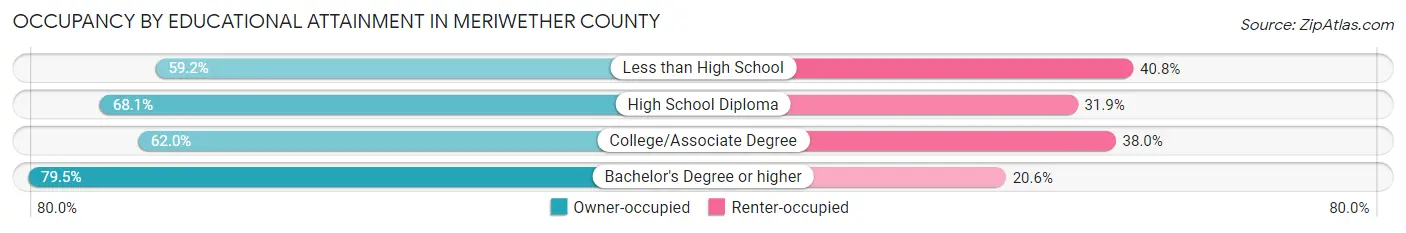
| Household Size | Owner-occupied | Renter-occupied |
| Less than High School | 635 (59.2%) | 437 (40.8%) |
| High School Diploma | 2,332 (68.1%) | 1,094 (31.9%) |
| College/Associate Degree | 1,450 (62.0%) | 888 (38.0%) |
| Bachelor's Degree or higher | 1,009 (79.4%) | 261 (20.5%) |
Occupancy by Age of Householder in Meriwether County
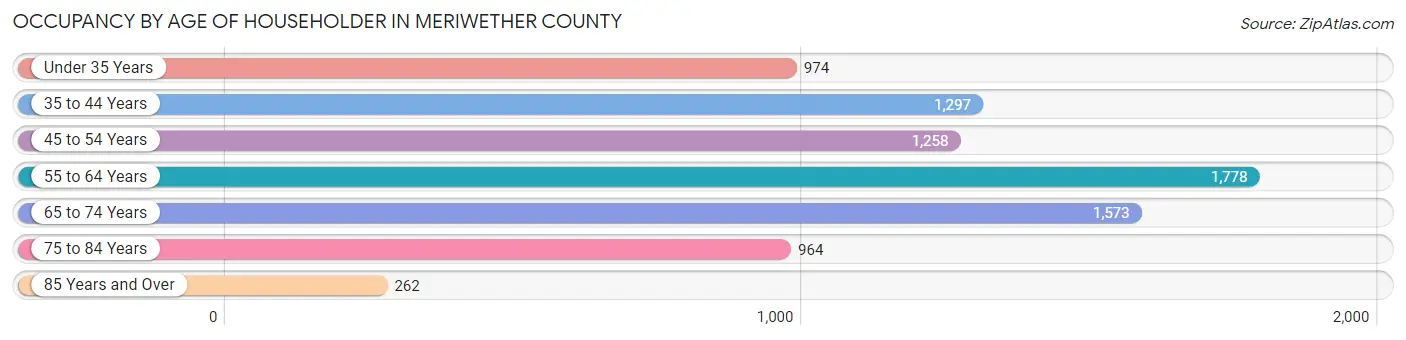
| Age Bracket | # Households | % Households |
| Under 35 Years | 974 | 12.0% |
| 35 to 44 Years | 1,297 | 16.0% |
| 45 to 54 Years | 1,258 | 15.5% |
| 55 to 64 Years | 1,778 | 21.9% |
| 65 to 74 Years | 1,573 | 19.4% |
| 75 to 84 Years | 964 | 11.9% |
| 85 Years and Over | 262 | 3.2% |
| Total | 8,106 | 100.0% |
Housing Finances in Meriwether County
Median Income by Occupancy in Meriwether County
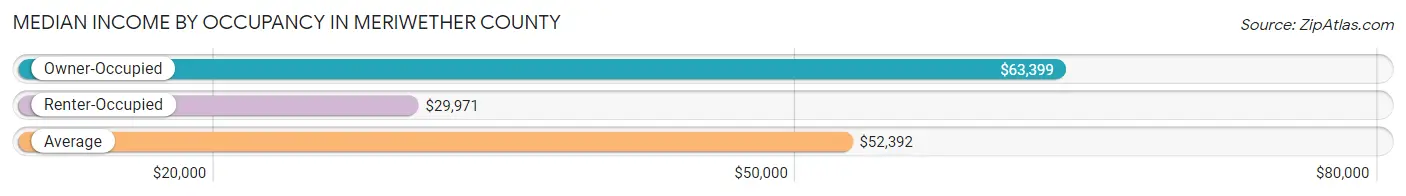
| Occupancy Type | # Households | Median Income |
| Owner-Occupied | 5,426 (66.9%) | $63,399 |
| Renter-Occupied | 2,680 (33.1%) | $29,971 |
| Average | 8,106 (100.0%) | $52,392 |
Occupancy by Householder Income Bracket in Meriwether County
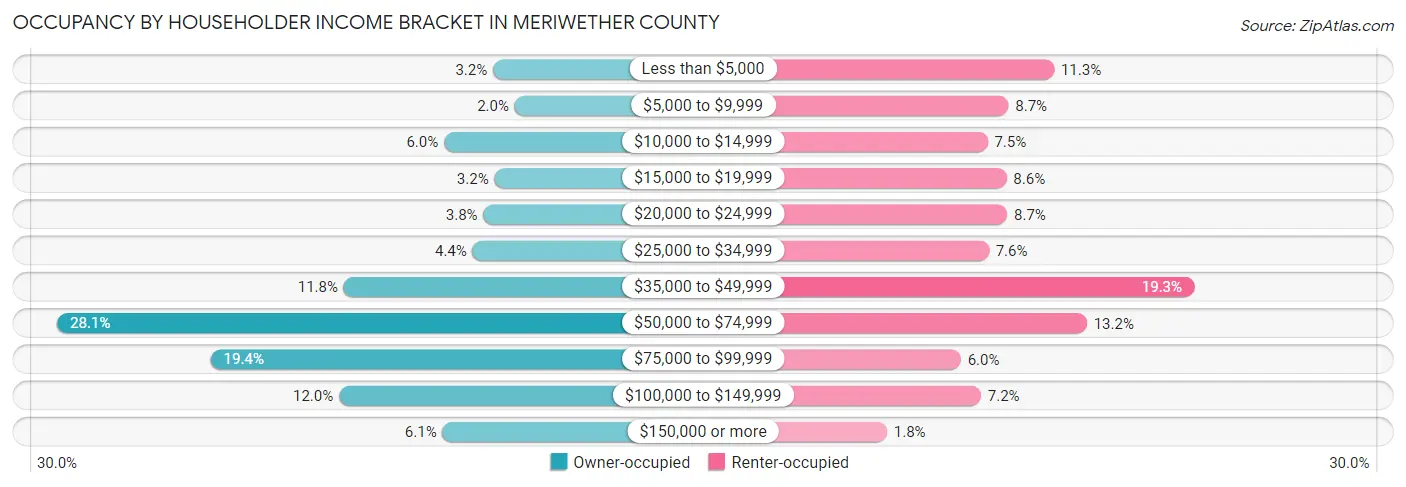
| Income Bracket | Owner-occupied | Renter-occupied |
| Less than $5,000 | 175 (3.2%) | 304 (11.3%) |
| $5,000 to $9,999 | 108 (2.0%) | 234 (8.7%) |
| $10,000 to $14,999 | 327 (6.0%) | 202 (7.5%) |
| $15,000 to $19,999 | 171 (3.2%) | 231 (8.6%) |
| $20,000 to $24,999 | 205 (3.8%) | 232 (8.7%) |
| $25,000 to $34,999 | 239 (4.4%) | 204 (7.6%) |
| $35,000 to $49,999 | 638 (11.8%) | 518 (19.3%) |
| $50,000 to $74,999 | 1,527 (28.1%) | 354 (13.2%) |
| $75,000 to $99,999 | 1,051 (19.4%) | 161 (6.0%) |
| $100,000 to $149,999 | 653 (12.0%) | 192 (7.2%) |
| $150,000 or more | 332 (6.1%) | 48 (1.8%) |
| Total | 5,426 (100.0%) | 2,680 (100.0%) |
Monthly Housing Cost Tiers in Meriwether County
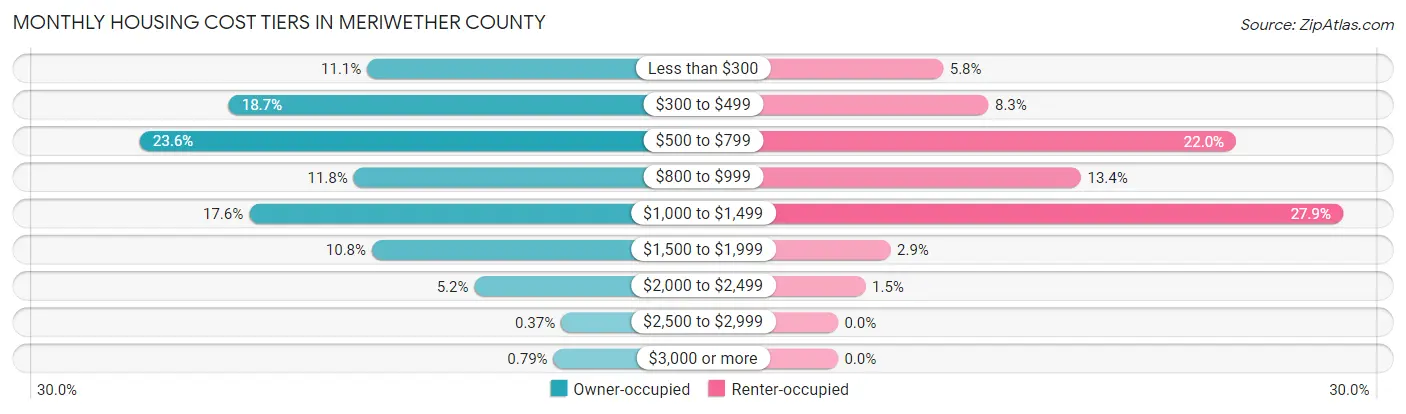
| Monthly Cost | Owner-occupied | Renter-occupied |
| Less than $300 | 601 (11.1%) | 156 (5.8%) |
| $300 to $499 | 1,016 (18.7%) | 223 (8.3%) |
| $500 to $799 | 1,282 (23.6%) | 590 (22.0%) |
| $800 to $999 | 642 (11.8%) | 360 (13.4%) |
| $1,000 to $1,499 | 955 (17.6%) | 748 (27.9%) |
| $1,500 to $1,999 | 587 (10.8%) | 78 (2.9%) |
| $2,000 to $2,499 | 280 (5.2%) | 41 (1.5%) |
| $2,500 to $2,999 | 20 (0.4%) | 0 (0.0%) |
| $3,000 or more | 43 (0.8%) | 0 (0.0%) |
| Total | 5,426 (100.0%) | 2,680 (100.0%) |
Physical Housing Characteristics in Meriwether County
Housing Structures in Meriwether County
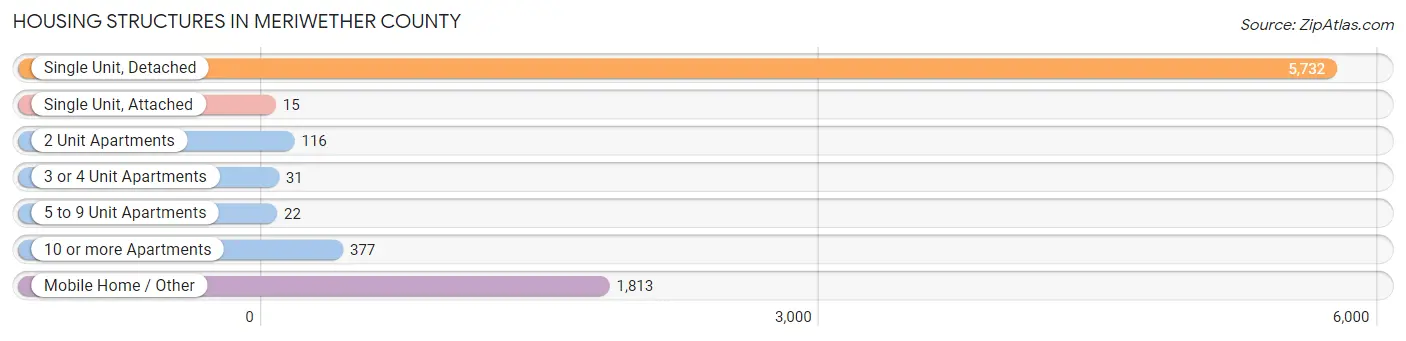
| Structure Type | # Housing Units | % Housing Units |
| Single Unit, Detached | 5,732 | 70.7% |
| Single Unit, Attached | 15 | 0.2% |
| 2 Unit Apartments | 116 | 1.4% |
| 3 or 4 Unit Apartments | 31 | 0.4% |
| 5 to 9 Unit Apartments | 22 | 0.3% |
| 10 or more Apartments | 377 | 4.6% |
| Mobile Home / Other | 1,813 | 22.4% |
| Total | 8,106 | 100.0% |
Housing Structures by Occupancy in Meriwether County
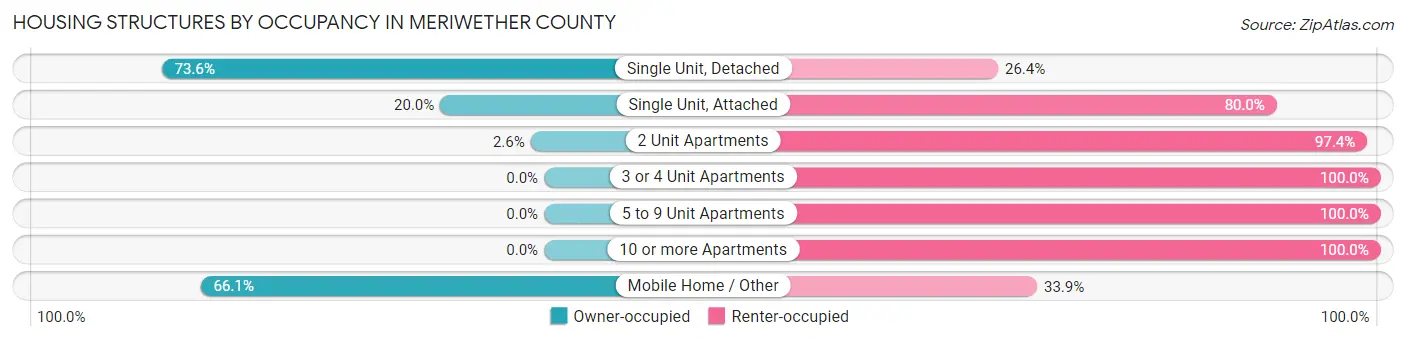
| Structure Type | Owner-occupied | Renter-occupied |
| Single Unit, Detached | 4,221 (73.6%) | 1,511 (26.4%) |
| Single Unit, Attached | 3 (20.0%) | 12 (80.0%) |
| 2 Unit Apartments | 3 (2.6%) | 113 (97.4%) |
| 3 or 4 Unit Apartments | 0 (0.0%) | 31 (100.0%) |
| 5 to 9 Unit Apartments | 0 (0.0%) | 22 (100.0%) |
| 10 or more Apartments | 0 (0.0%) | 377 (100.0%) |
| Mobile Home / Other | 1,199 (66.1%) | 614 (33.9%) |
| Total | 5,426 (66.9%) | 2,680 (33.1%) |
Housing Structures by Number of Rooms in Meriwether County
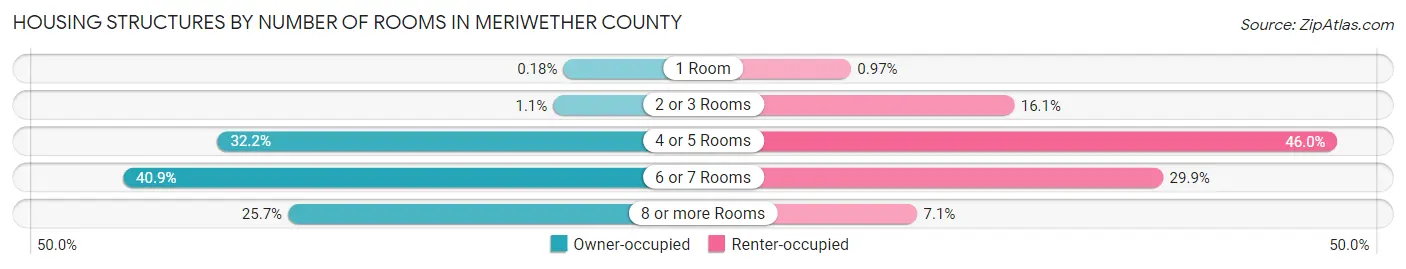
| Number of Rooms | Owner-occupied | Renter-occupied |
| 1 Room | 10 (0.2%) | 26 (1.0%) |
| 2 or 3 Rooms | 61 (1.1%) | 431 (16.1%) |
| 4 or 5 Rooms | 1,745 (32.2%) | 1,233 (46.0%) |
| 6 or 7 Rooms | 2,218 (40.9%) | 800 (29.8%) |
| 8 or more Rooms | 1,392 (25.7%) | 190 (7.1%) |
| Total | 5,426 (100.0%) | 2,680 (100.0%) |
Housing Structure by Heating Type in Meriwether County
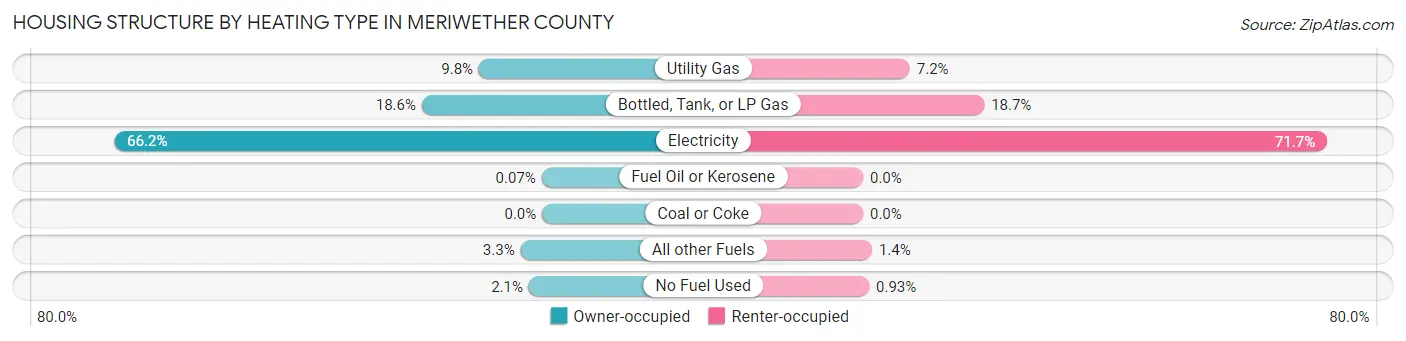
| Heating Type | Owner-occupied | Renter-occupied |
| Utility Gas | 530 (9.8%) | 194 (7.2%) |
| Bottled, Tank, or LP Gas | 1,009 (18.6%) | 502 (18.7%) |
| Electricity | 3,590 (66.2%) | 1,922 (71.7%) |
| Fuel Oil or Kerosene | 4 (0.1%) | 0 (0.0%) |
| Coal or Coke | 0 (0.0%) | 0 (0.0%) |
| All other Fuels | 181 (3.3%) | 37 (1.4%) |
| No Fuel Used | 112 (2.1%) | 25 (0.9%) |
| Total | 5,426 (100.0%) | 2,680 (100.0%) |
Household Vehicle Usage in Meriwether County
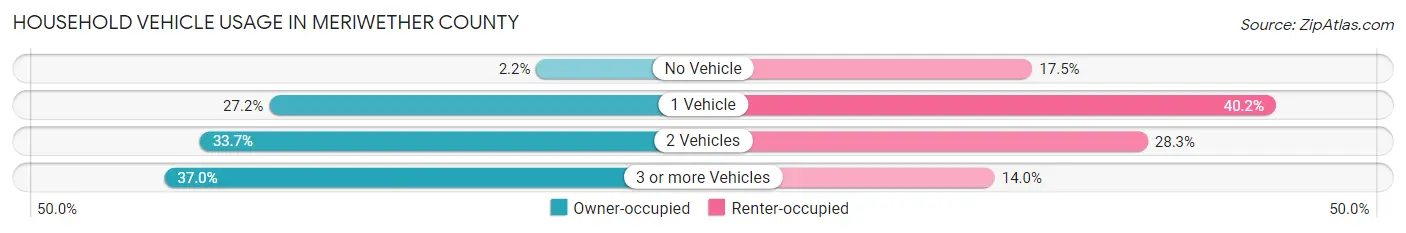
| Vehicles per Household | Owner-occupied | Renter-occupied |
| No Vehicle | 121 (2.2%) | 469 (17.5%) |
| 1 Vehicle | 1,474 (27.2%) | 1,078 (40.2%) |
| 2 Vehicles | 1,826 (33.7%) | 758 (28.3%) |
| 3 or more Vehicles | 2,005 (36.9%) | 375 (14.0%) |
| Total | 5,426 (100.0%) | 2,680 (100.0%) |
Real Estate & Mortgages in Meriwether County
Real Estate and Mortgage Overview in Meriwether County
| Characteristic | Without Mortgage | With Mortgage |
| Housing Units | 3,106 | 2,320 |
| Median Property Value | $109,000 | $158,900 |
| Median Household Income | $52,638 | $123 |
| Monthly Housing Costs | $493 | $43 |
| Real Estate Taxes | $1,034 | $61 |
Property Value by Mortgage Status in Meriwether County
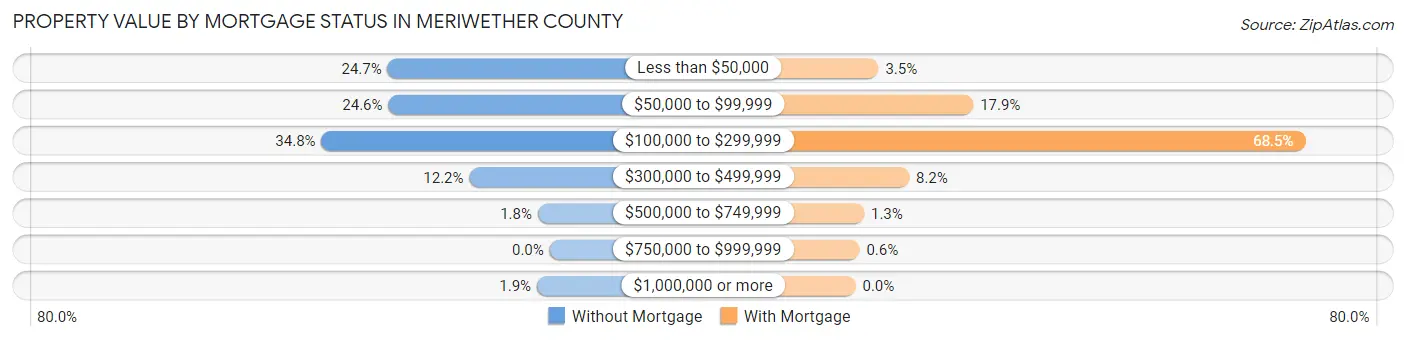
| Property Value | Without Mortgage | With Mortgage |
| Less than $50,000 | 767 (24.7%) | 81 (3.5%) |
| $50,000 to $99,999 | 763 (24.6%) | 416 (17.9%) |
| $100,000 to $299,999 | 1,080 (34.8%) | 1,590 (68.5%) |
| $300,000 to $499,999 | 380 (12.2%) | 189 (8.2%) |
| $500,000 to $749,999 | 56 (1.8%) | 30 (1.3%) |
| $750,000 to $999,999 | 0 (0.0%) | 14 (0.6%) |
| $1,000,000 or more | 60 (1.9%) | 0 (0.0%) |
| Total | 3,106 (100.0%) | 2,320 (100.0%) |
Household Income by Mortgage Status in Meriwether County
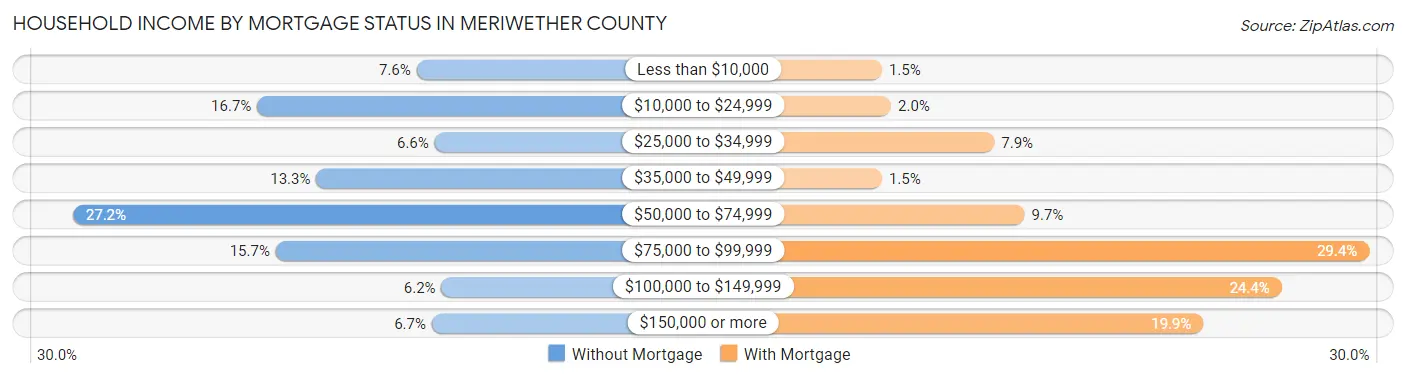
| Household Income | Without Mortgage | With Mortgage |
| Less than $10,000 | 236 (7.6%) | 35 (1.5%) |
| $10,000 to $24,999 | 519 (16.7%) | 47 (2.0%) |
| $25,000 to $34,999 | 204 (6.6%) | 184 (7.9%) |
| $35,000 to $49,999 | 414 (13.3%) | 35 (1.5%) |
| $50,000 to $74,999 | 846 (27.2%) | 224 (9.7%) |
| $75,000 to $99,999 | 486 (15.7%) | 681 (29.3%) |
| $100,000 to $149,999 | 192 (6.2%) | 565 (24.3%) |
| $150,000 or more | 209 (6.7%) | 461 (19.9%) |
| Total | 3,106 (100.0%) | 2,320 (100.0%) |
Property Value to Household Income Ratio in Meriwether County
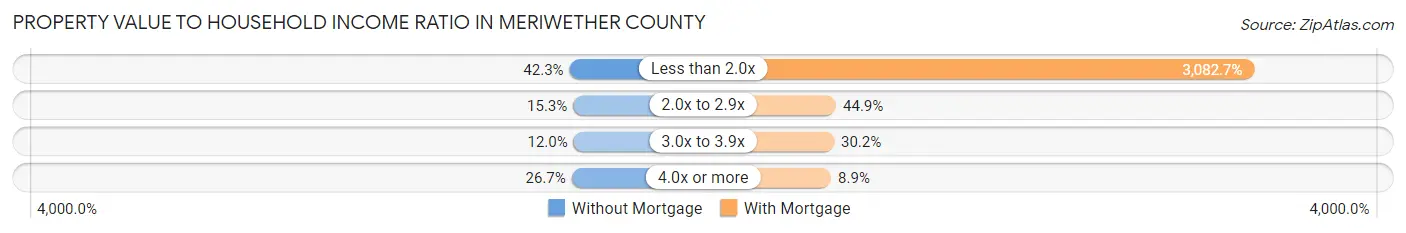
| Value-to-Income Ratio | Without Mortgage | With Mortgage |
| Less than 2.0x | 1,315 (42.3%) | 71,518 (3,082.7%) |
| 2.0x to 2.9x | 476 (15.3%) | 1,042 (44.9%) |
| 3.0x to 3.9x | 374 (12.0%) | 700 (30.2%) |
| 4.0x or more | 829 (26.7%) | 207 (8.9%) |
| Total | 3,106 (100.0%) | 2,320 (100.0%) |
Real Estate Taxes by Mortgage Status in Meriwether County
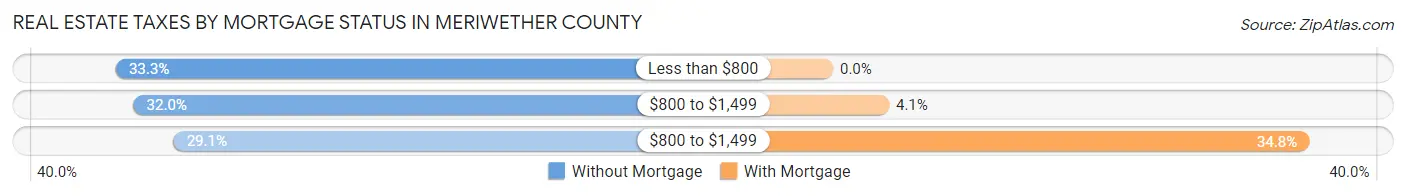
| Property Taxes | Without Mortgage | With Mortgage |
| Less than $800 | 1,035 (33.3%) | 0 (0.0%) |
| $800 to $1,499 | 995 (32.0%) | 95 (4.1%) |
| $800 to $1,499 | 904 (29.1%) | 807 (34.8%) |
| Total | 3,106 (100.0%) | 2,320 (100.0%) |
Health & Disability in Meriwether County
Health Insurance Coverage by Age in Meriwether County
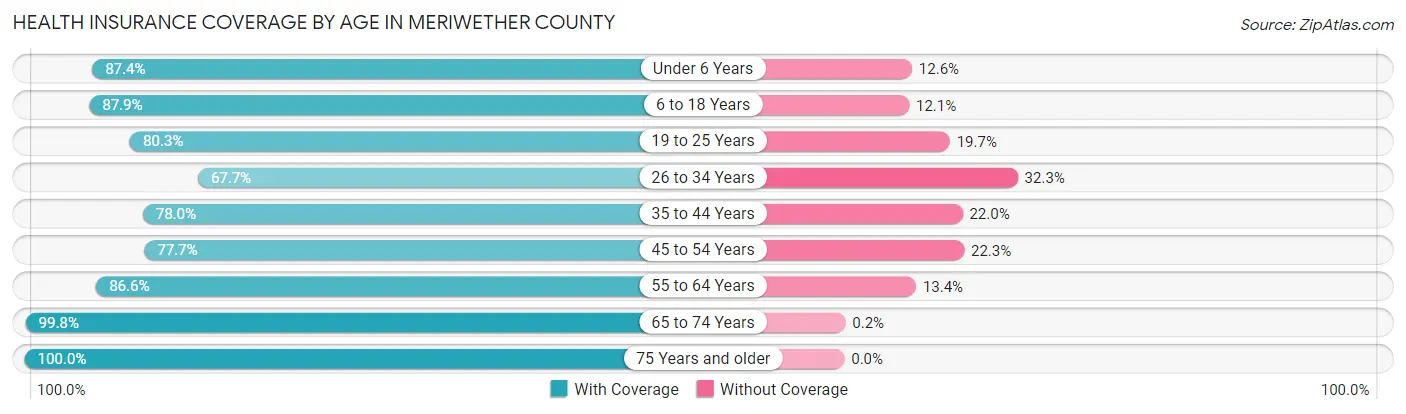
| Age Bracket | With Coverage | Without Coverage |
| Under 6 Years | 1,143 (87.4%) | 165 (12.6%) |
| 6 to 18 Years | 2,922 (87.9%) | 401 (12.1%) |
| 19 to 25 Years | 1,124 (80.3%) | 275 (19.7%) |
| 26 to 34 Years | 1,545 (67.7%) | 738 (32.3%) |
| 35 to 44 Years | 1,829 (78.0%) | 517 (22.0%) |
| 45 to 54 Years | 2,010 (77.7%) | 578 (22.3%) |
| 55 to 64 Years | 2,672 (86.6%) | 412 (13.4%) |
| 65 to 74 Years | 2,534 (99.8%) | 5 (0.2%) |
| 75 Years and older | 1,686 (100.0%) | 0 (0.0%) |
| Total | 17,465 (85.0%) | 3,091 (15.0%) |
Health Insurance Coverage by Citizenship Status in Meriwether County
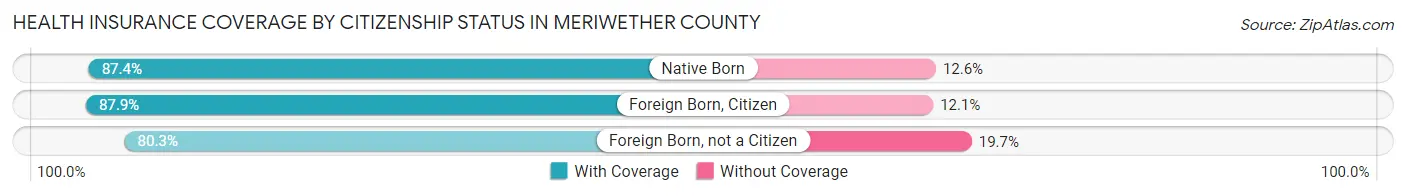
| Citizenship Status | With Coverage | Without Coverage |
| Native Born | 1,143 (87.4%) | 165 (12.6%) |
| Foreign Born, Citizen | 2,922 (87.9%) | 401 (12.1%) |
| Foreign Born, not a Citizen | 1,124 (80.3%) | 275 (19.7%) |
Health Insurance Coverage by Household Income in Meriwether County
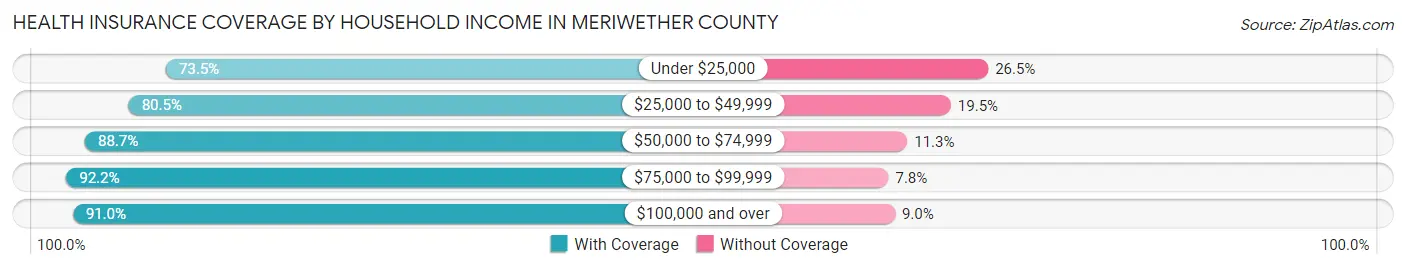
| Household Income | With Coverage | Without Coverage |
| Under $25,000 | 3,078 (73.5%) | 1,109 (26.5%) |
| $25,000 to $49,999 | 3,161 (80.5%) | 766 (19.5%) |
| $50,000 to $74,999 | 4,266 (88.7%) | 545 (11.3%) |
| $75,000 to $99,999 | 3,090 (92.2%) | 262 (7.8%) |
| $100,000 and over | 3,738 (91.0%) | 371 (9.0%) |
Public vs Private Health Insurance Coverage by Age in Meriwether County
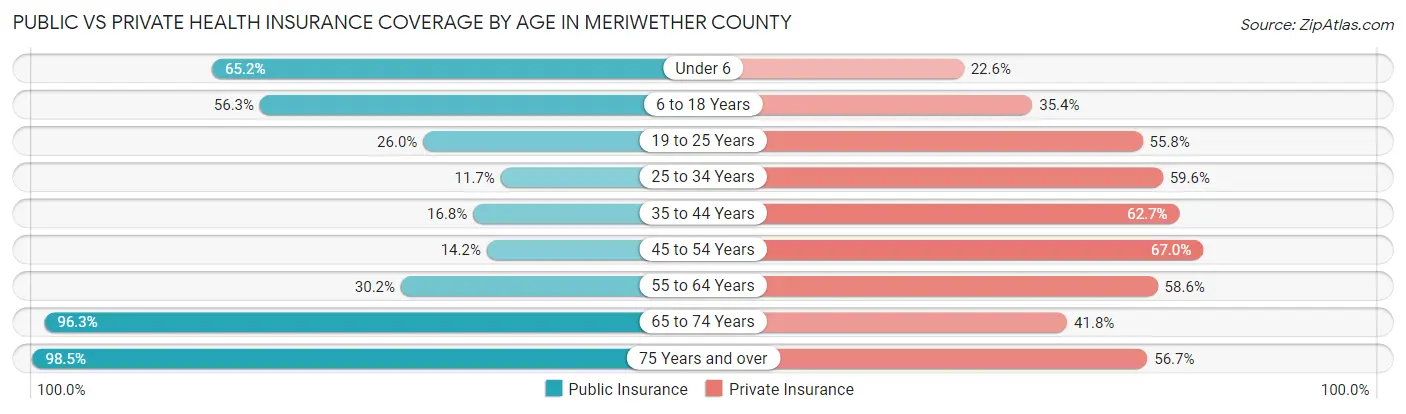
| Age Bracket | Public Insurance | Private Insurance |
| Under 6 | 853 (65.2%) | 296 (22.6%) |
| 6 to 18 Years | 1,872 (56.3%) | 1,175 (35.4%) |
| 19 to 25 Years | 364 (26.0%) | 781 (55.8%) |
| 25 to 34 Years | 266 (11.7%) | 1,360 (59.6%) |
| 35 to 44 Years | 393 (16.8%) | 1,470 (62.7%) |
| 45 to 54 Years | 368 (14.2%) | 1,735 (67.0%) |
| 55 to 64 Years | 930 (30.2%) | 1,808 (58.6%) |
| 65 to 74 Years | 2,446 (96.3%) | 1,062 (41.8%) |
| 75 Years and over | 1,661 (98.5%) | 956 (56.7%) |
| Total | 9,153 (44.5%) | 10,643 (51.8%) |
Disability Status by Sex by Age in Meriwether County
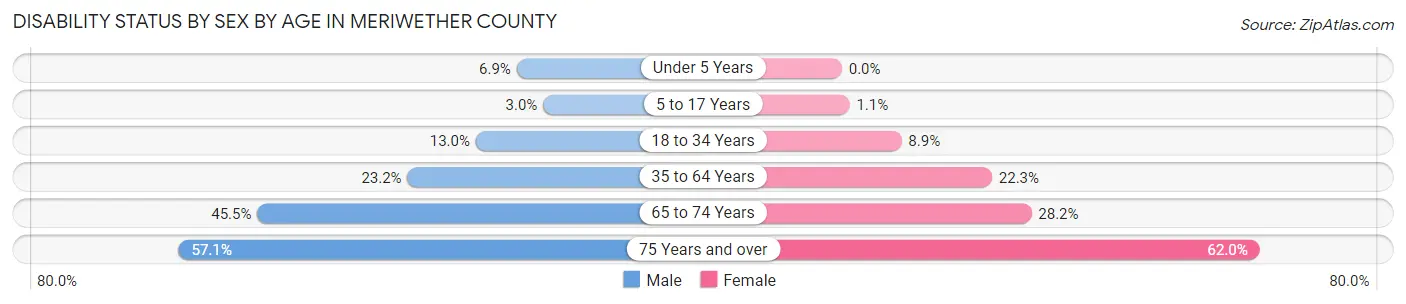
| Age Bracket | Male | Female |
| Under 5 Years | 44 (6.9%) | 0 (0.0%) |
| 5 to 17 Years | 48 (3.0%) | 18 (1.1%) |
| 18 to 34 Years | 255 (13.0%) | 177 (8.8%) |
| 35 to 64 Years | 893 (23.2%) | 927 (22.3%) |
| 65 to 74 Years | 529 (45.5%) | 387 (28.1%) |
| 75 Years and over | 408 (57.1%) | 603 (62.0%) |
Disability Class by Sex by Age in Meriwether County
Disability Class: Hearing Difficulty
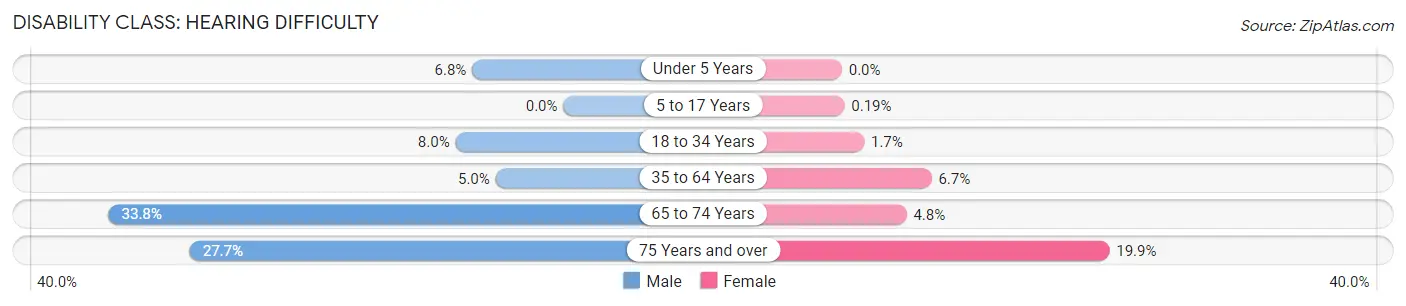
| Age Bracket | Male | Female |
| Under 5 Years | 43 (6.8%) | 0 (0.0%) |
| 5 to 17 Years | 0 (0.0%) | 3 (0.2%) |
| 18 to 34 Years | 157 (8.0%) | 33 (1.7%) |
| 35 to 64 Years | 194 (5.0%) | 277 (6.7%) |
| 65 to 74 Years | 393 (33.8%) | 66 (4.8%) |
| 75 Years and over | 198 (27.7%) | 193 (19.9%) |
Disability Class: Vision Difficulty
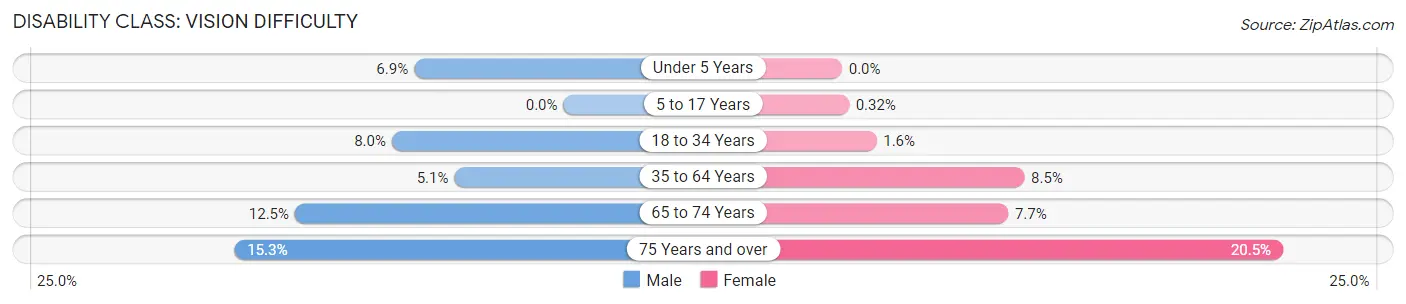
| Age Bracket | Male | Female |
| Under 5 Years | 44 (6.9%) | 0 (0.0%) |
| 5 to 17 Years | 0 (0.0%) | 5 (0.3%) |
| 18 to 34 Years | 156 (8.0%) | 32 (1.6%) |
| 35 to 64 Years | 195 (5.1%) | 352 (8.5%) |
| 65 to 74 Years | 145 (12.5%) | 106 (7.7%) |
| 75 Years and over | 109 (15.3%) | 199 (20.5%) |
Disability Class: Cognitive Difficulty
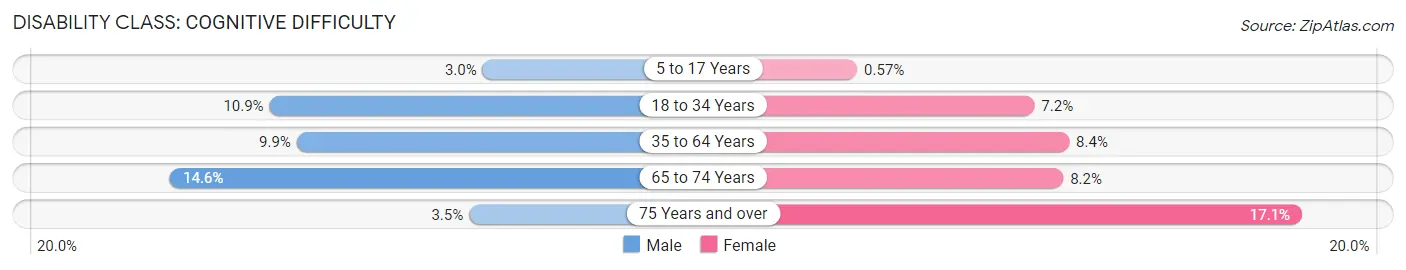
| Age Bracket | Male | Female |
| 5 to 17 Years | 48 (3.0%) | 9 (0.6%) |
| 18 to 34 Years | 214 (10.9%) | 143 (7.1%) |
| 35 to 64 Years | 382 (9.9%) | 351 (8.4%) |
| 65 to 74 Years | 170 (14.6%) | 113 (8.2%) |
| 75 Years and over | 25 (3.5%) | 166 (17.1%) |
Disability Class: Ambulatory Difficulty
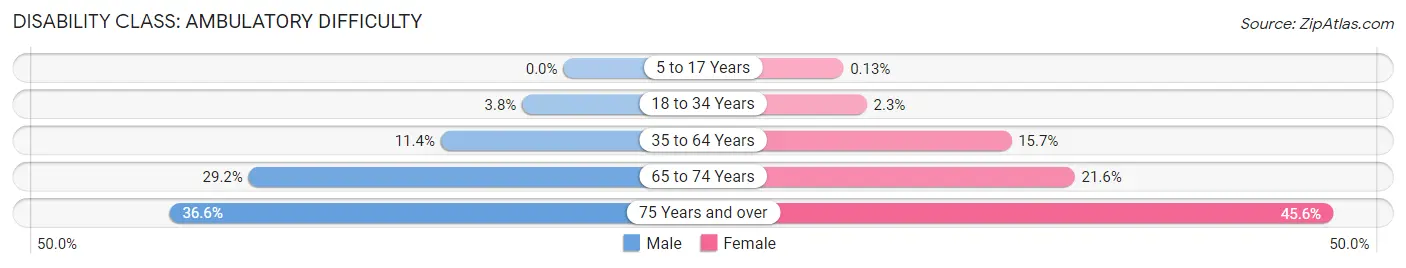
| Age Bracket | Male | Female |
| 5 to 17 Years | 0 (0.0%) | 2 (0.1%) |
| 18 to 34 Years | 75 (3.8%) | 46 (2.3%) |
| 35 to 64 Years | 439 (11.4%) | 654 (15.7%) |
| 65 to 74 Years | 340 (29.2%) | 297 (21.6%) |
| 75 Years and over | 261 (36.5%) | 443 (45.6%) |
Disability Class: Self-Care Difficulty
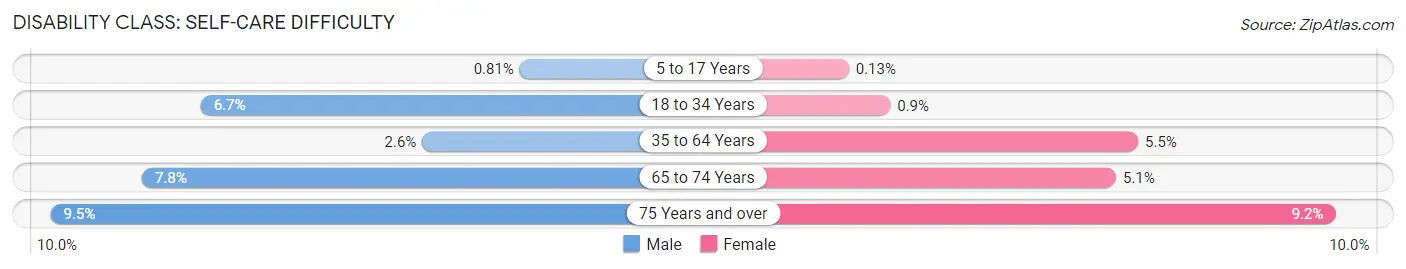
| Age Bracket | Male | Female |
| 5 to 17 Years | 13 (0.8%) | 2 (0.1%) |
| 18 to 34 Years | 132 (6.7%) | 18 (0.9%) |
| 35 to 64 Years | 101 (2.6%) | 229 (5.5%) |
| 65 to 74 Years | 91 (7.8%) | 70 (5.1%) |
| 75 Years and over | 68 (9.5%) | 89 (9.2%) |
Technology Access in Meriwether County
Computing Device Access in Meriwether County
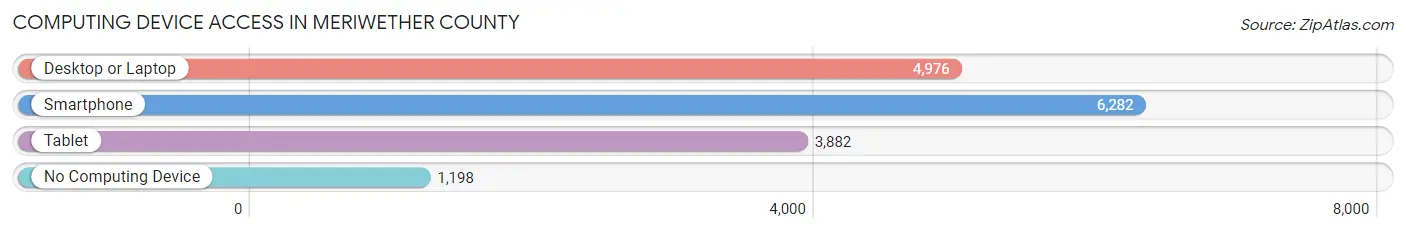
| Device Type | # Households | % Households |
| Desktop or Laptop | 4,976 | 61.4% |
| Smartphone | 6,282 | 77.5% |
| Tablet | 3,882 | 47.9% |
| No Computing Device | 1,198 | 14.8% |
| Total | 8,106 | 100.0% |
Internet Access in Meriwether County
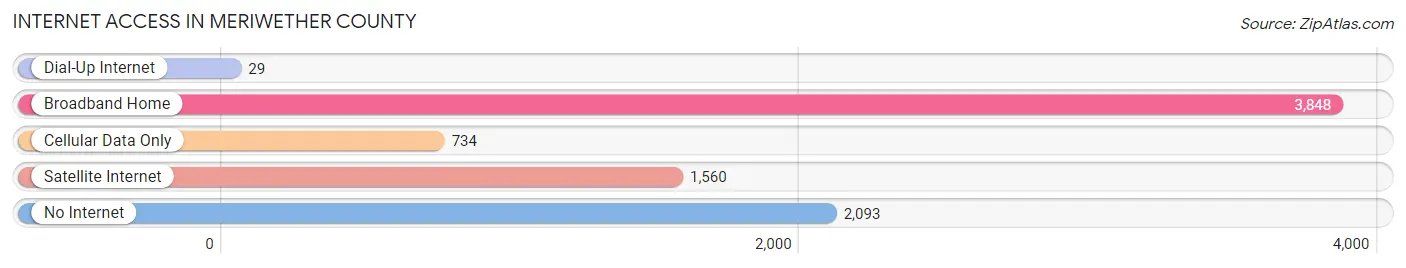
| Internet Type | # Households | % Households |
| Dial-Up Internet | 29 | 0.4% |
| Broadband Home | 3,848 | 47.5% |
| Cellular Data Only | 734 | 9.1% |
| Satellite Internet | 1,560 | 19.3% |
| No Internet | 2,093 | 25.8% |
| Total | 8,106 | 100.0% |
Meriwether County Summary
Meriwether County is located in the west-central part of the state of Georgia, in the United States. It is part of the Atlanta metropolitan area and is bordered by Coweta, Troup, Harris, Talbot, and Pike counties. The county seat is Greenville, and the county has a total area of 441 square miles.
History
Meriwether County was created in 1827 from parts of Troup, Coweta, and Pike counties. It was named for David Meriwether, a Revolutionary War hero and a member of the Georgia General Assembly. The county was originally divided into two townships, Greenville and Manchester.
The county was home to several Native American tribes, including the Creek, Cherokee, and Choctaw. The first European settlers arrived in the area in the late 1700s, and the county was officially established in 1827.
The county was home to several prominent figures in the Civil War, including Confederate General William J. Hardee and Union General William T. Sherman. The county was also the site of several battles, including the Battle of Brown's Mill in 1864.
Geography
Meriwether County is located in the west-central part of the state of Georgia. It is bordered by Coweta, Troup, Harris, Talbot, and Pike counties. The county has a total area of 441 square miles, of which 437 square miles is land and 4 square miles is water.
The county is located in the Piedmont region of Georgia, and is characterized by rolling hills and forests. The Flint River runs through the county, and there are several small lakes and ponds. The county is home to several state parks, including F.D. Roosevelt State Park and High Falls State Park.
Economy
The economy of Meriwether County is largely based on agriculture and manufacturing. The county is home to several large poultry farms, as well as several smaller farms that produce corn, soybeans, cotton, and other crops. The county is also home to several manufacturing plants, including a paper mill and a furniture factory.
The county is home to several large employers, including the Meriwether County School System, the Meriwether County Hospital, and the Meriwether County Sheriff's Office. The county is also home to several small businesses, including restaurants, retail stores, and service providers.
Demographics
As of the 2010 census, the population of Meriwether County was 21,992. The population was 53.2% White, 41.2% African American, 0.7% Native American, 0.7% Asian, 0.1% Pacific Islander, 2.2% from other races, and 2.0% from two or more races. Hispanic or Latino of any race were 4.3% of the population.
The median income for a household in the county was $37,945, and the median income for a family was $45,945. The per capita income for the county was $18,945. About 17.2% of the population was below the poverty line.
Meriwether County is served by the Meriwether County School System, which consists of seven elementary schools, two middle schools, and two high schools. The county is also home to several private schools, including the Meriwether Academy and the Meriwether Christian Academy.
Common Questions
What is Per Capita Income in Meriwether County?
Per Capita income in Meriwether County is $25,784.
What is the Median Family Income in Meriwether County?
Median Family Income in Meriwether County is $62,272.
What is the Median Household income in Meriwether County?
Median Household Income in Meriwether County is $52,392.
What is Income or Wage Gap in Meriwether County?
Income or Wage Gap in Meriwether County is 48.7%.
Women in Meriwether County earn 51.3 cents for every dollar earned by a man.
What is Family Income Deficit in Meriwether County?
Family Income Deficit in Meriwether County is $9,822.
Families that are below poverty line in Meriwether County earn $9,822 less on average than the poverty threshold level.
What is Inequality or Gini Index in Meriwether County?
Inequality or Gini Index in Meriwether County is 0.44.
What is the Total Population of Meriwether County?
Total Population of Meriwether County is 20,679.
What is the Total Male Population of Meriwether County?
Total Male Population of Meriwether County is 9,966.
What is the Total Female Population of Meriwether County?
Total Female Population of Meriwether County is 10,713.
What is the Ratio of Males per 100 Females in Meriwether County?
There are 93.03 Males per 100 Females in Meriwether County.
What is the Ratio of Females per 100 Males in Meriwether County?
There are 107.50 Females per 100 Males in Meriwether County.
What is the Median Population Age in Meriwether County?
Median Population Age in Meriwether County is 43.6 Years.
What is the Average Family Size in Meriwether County
Average Family Size in Meriwether County is 3.0 People.
What is the Average Household Size in Meriwether County
Average Household Size in Meriwether County is 2.5 People.
How Large is the Labor Force in Meriwether County?
There are 8,612 People in the Labor Forcein in Meriwether County.
What is the Percentage of People in the Labor Force in Meriwether County?
51.2% of People are in the Labor Force in Meriwether County.
What is the Unemployment Rate in Meriwether County?
Unemployment Rate in Meriwether County is 7.1%.