Marion County, GA Map & Demographics
Marion County Map
Marion County Overview
$24,727
PER CAPITA INCOME
$64,722
AVG FAMILY INCOME
$48,836
AVG HOUSEHOLD INCOME
19.9%
WAGE / INCOME GAP [ % ]
80.1¢/ $1
WAGE / INCOME GAP [ $ ]
0.42
INEQUALITY / GINI INDEX
7,508
TOTAL POPULATION
3,680
MALE POPULATION
3,828
FEMALE POPULATION
96.13
MALES / 100 FEMALES
104.02
FEMALES / 100 MALES
43.8
MEDIAN AGE
3.1
AVG FAMILY SIZE
2.6
AVG HOUSEHOLD SIZE
2,991
LABOR FORCE [ PEOPLE ]
49.1%
PERCENT IN LABOR FORCE
5.4%
UNEMPLOYMENT RATE
Income in Marion County
Income Overview in Marion County
Per Capita Income in Marion County is $24,727, while median incomes of families and households are $64,722 and $48,836 respectively.
| Characteristic | Number | Measure |
| Per Capita Income | 7,508 | $24,727 |
| Median Family Income | 2,024 | $64,722 |
| Mean Family Income | 2,024 | $72,348 |
| Median Household Income | 2,872 | $48,836 |
| Mean Household Income | 2,872 | $61,169 |
| Income Deficit | 2,024 | $0 |
| Wage / Income Gap (%) | 7,508 | 19.86% |
| Wage / Income Gap ($) | 7,508 | 80.14¢ per $1 |
| Gini / Inequality Index | 7,508 | 0.42 |
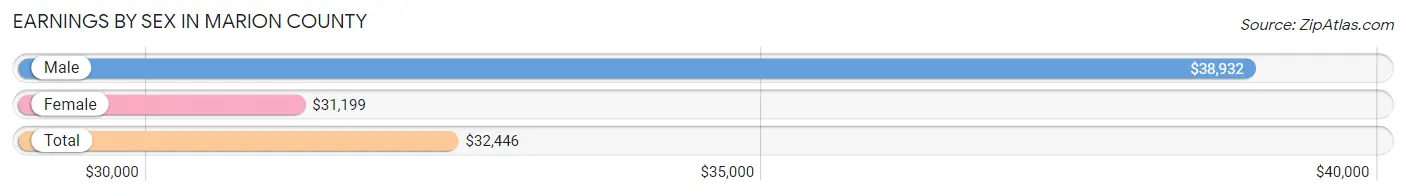
Earnings by Sex in Marion County
Average Earnings in Marion County are $32,446, $38,932 for men and $31,199 for women, a difference of 19.9%.
| Sex | Number | Average Earnings |
| Male | 1,719 (55.2%) | $38,932 |
| Female | 1,395 (44.8%) | $31,199 |
| Total | 3,114 (100.0%) | $32,446 |
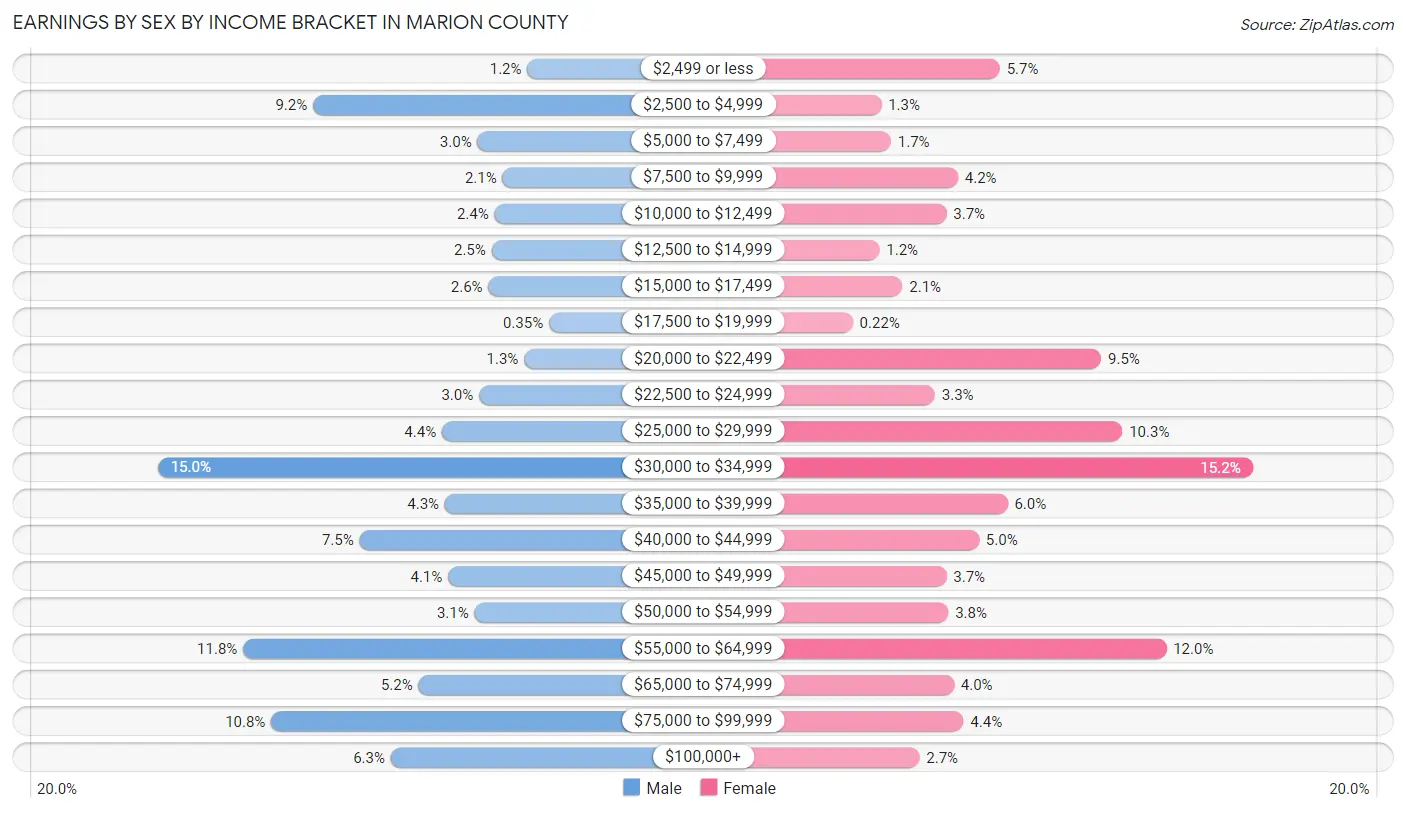
Earnings by Sex by Income Bracket in Marion County
The most common earnings brackets in Marion County are $30,000 to $34,999 for men (258 | 15.0%) and $30,000 to $34,999 for women (212 | 15.2%).
| Income | Male | Female |
| $2,499 or less | 20 (1.2%) | 80 (5.7%) |
| $2,500 to $4,999 | 158 (9.2%) | 18 (1.3%) |
| $5,000 to $7,499 | 52 (3.0%) | 23 (1.7%) |
| $7,500 to $9,999 | 36 (2.1%) | 58 (4.2%) |
| $10,000 to $12,499 | 41 (2.4%) | 52 (3.7%) |
| $12,500 to $14,999 | 43 (2.5%) | 17 (1.2%) |
| $15,000 to $17,499 | 45 (2.6%) | 29 (2.1%) |
| $17,500 to $19,999 | 6 (0.4%) | 3 (0.2%) |
| $20,000 to $22,499 | 22 (1.3%) | 133 (9.5%) |
| $22,500 to $24,999 | 51 (3.0%) | 46 (3.3%) |
| $25,000 to $29,999 | 75 (4.4%) | 144 (10.3%) |
| $30,000 to $34,999 | 258 (15.0%) | 212 (15.2%) |
| $35,000 to $39,999 | 73 (4.3%) | 84 (6.0%) |
| $40,000 to $44,999 | 128 (7.4%) | 69 (5.0%) |
| $45,000 to $49,999 | 71 (4.1%) | 52 (3.7%) |
| $50,000 to $54,999 | 54 (3.1%) | 53 (3.8%) |
| $55,000 to $64,999 | 203 (11.8%) | 167 (12.0%) |
| $65,000 to $74,999 | 90 (5.2%) | 56 (4.0%) |
| $75,000 to $99,999 | 185 (10.8%) | 61 (4.4%) |
| $100,000+ | 108 (6.3%) | 38 (2.7%) |
| Total | 1,719 (100.0%) | 1,395 (100.0%) |
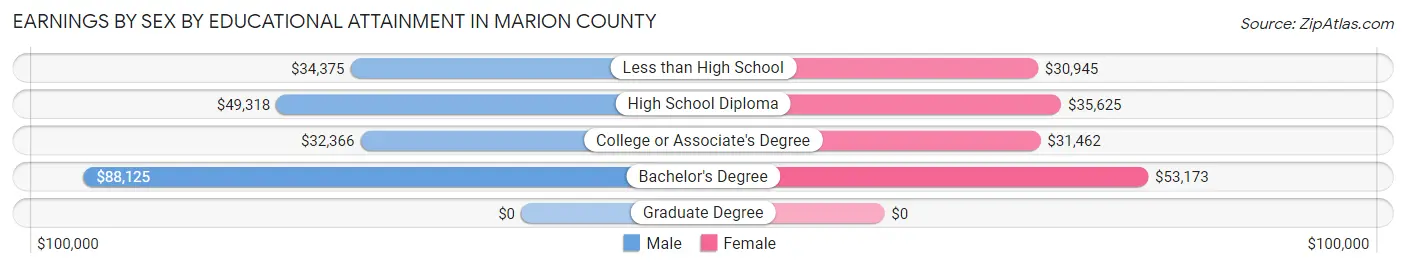
Earnings by Sex by Educational Attainment in Marion County
Average earnings in Marion County are $40,933 for men and $32,171 for women, a difference of 21.4%. Men with an educational attainment of bachelor's degree enjoy the highest average annual earnings of $88,125, while those with college or associate's degree education earn the least with $32,366. Women with an educational attainment of bachelor's degree earn the most with the average annual earnings of $53,173, while those with less than high school education have the smallest earnings of $30,945.
| Educational Attainment | Male Income | Female Income |
| Less than High School | $34,375 | $30,945 |
| High School Diploma | $49,318 | $35,625 |
| College or Associate's Degree | $32,366 | $31,462 |
| Bachelor's Degree | $88,125 | $53,173 |
| Graduate Degree | - | - |
| Total | $40,933 | $32,171 |
Family Income in Marion County
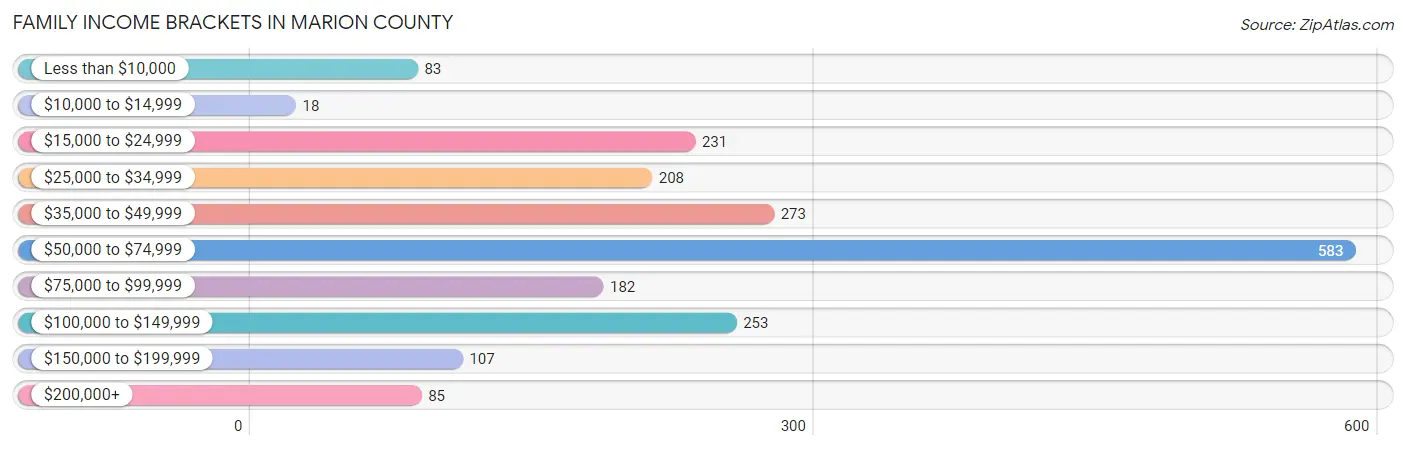
Family Income Brackets in Marion County
According to the Marion County family income data, there are 583 families falling into the $50,000 to $74,999 income range, which is the most common income bracket and makes up 28.8% of all families. Conversely, the $10,000 to $14,999 income bracket is the least frequent group with only 18 families (0.9%) belonging to this category.
| Income Bracket | # Families | % Families |
| Less than $10,000 | 83 | 4.1% |
| $10,000 to $14,999 | 18 | 0.9% |
| $15,000 to $24,999 | 231 | 11.4% |
| $25,000 to $34,999 | 208 | 10.3% |
| $35,000 to $49,999 | 273 | 13.5% |
| $50,000 to $74,999 | 583 | 28.8% |
| $75,000 to $99,999 | 182 | 9.0% |
| $100,000 to $149,999 | 253 | 12.5% |
| $150,000 to $199,999 | 107 | 5.3% |
| $200,000+ | 85 | 4.2% |
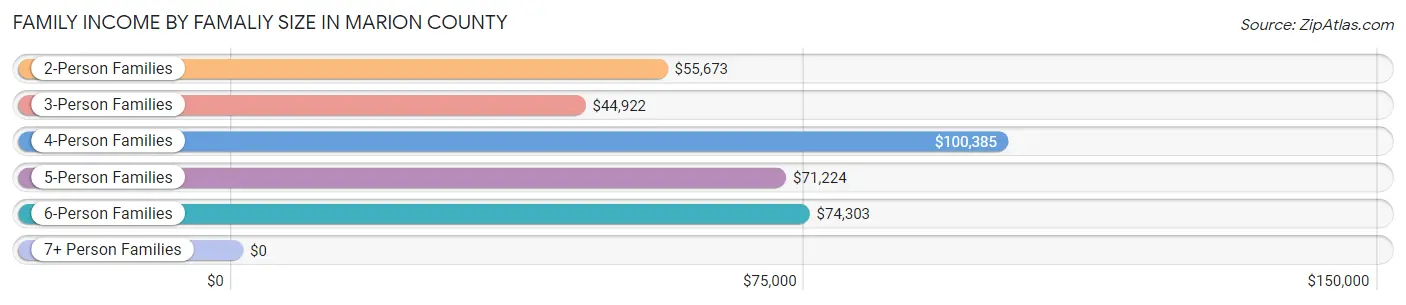
Family Income by Famaliy Size in Marion County
4-person families (314 | 15.5%) account for the highest median family income in Marion County with $100,385 per family, while 2-person families (1,033 | 51.0%) have the highest median income of $27,836 per family member.
| Income Bracket | # Families | Median Income |
| 2-Person Families | 1,033 (51.0%) | $55,673 |
| 3-Person Families | 395 (19.5%) | $44,922 |
| 4-Person Families | 314 (15.5%) | $100,385 |
| 5-Person Families | 146 (7.2%) | $71,224 |
| 6-Person Families | 115 (5.7%) | $74,303 |
| 7+ Person Families | 21 (1.0%) | $0 |
| Total | 2,024 (100.0%) | $64,722 |
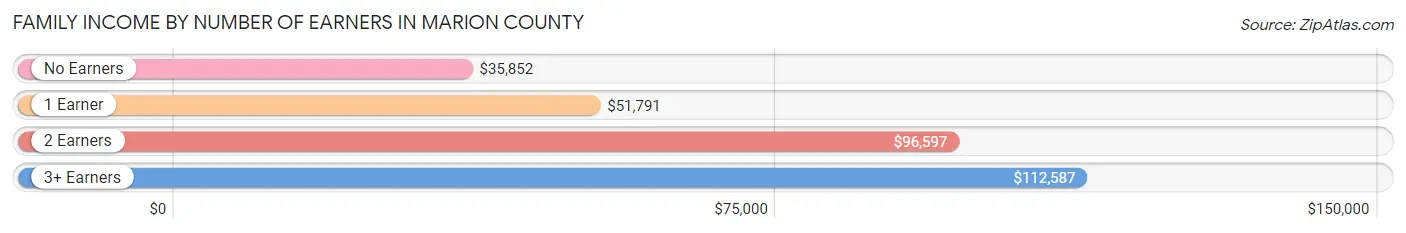
Family Income by Number of Earners in Marion County
The median family income in Marion County is $64,722, with families comprising 3+ earners (191) having the highest median family income of $112,587, while families with no earners (579) have the lowest median family income of $35,852, accounting for 9.4% and 28.6% of families, respectively.
| Number of Earners | # Families | Median Income |
| No Earners | 579 (28.6%) | $35,852 |
| 1 Earner | 701 (34.6%) | $51,791 |
| 2 Earners | 553 (27.3%) | $96,597 |
| 3+ Earners | 191 (9.4%) | $112,587 |
| Total | 2,024 (100.0%) | $64,722 |
Household Income in Marion County
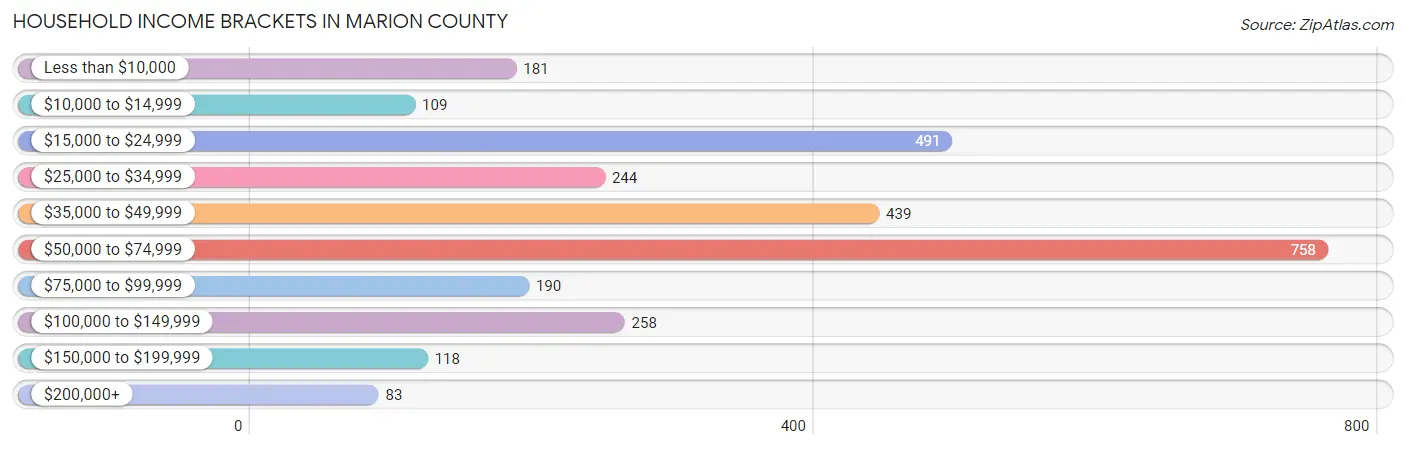
Household Income Brackets in Marion County
With 758 households falling in the category, the $50,000 to $74,999 income range is the most frequent in Marion County, accounting for 26.4% of all households. In contrast, only 83 households (2.9%) fall into the $200,000+ income bracket, making it the least populous group.
| Income Bracket | # Households | % Households |
| Less than $10,000 | 181 | 6.3% |
| $10,000 to $14,999 | 109 | 3.8% |
| $15,000 to $24,999 | 491 | 17.1% |
| $25,000 to $34,999 | 244 | 8.5% |
| $35,000 to $49,999 | 439 | 15.3% |
| $50,000 to $74,999 | 758 | 26.4% |
| $75,000 to $99,999 | 190 | 6.6% |
| $100,000 to $149,999 | 258 | 9.0% |
| $150,000 to $199,999 | 118 | 4.1% |
| $200,000+ | 83 | 2.9% |
Household Income by Householder Age in Marion County
The median household income in Marion County is $48,836, with the highest median household income of $60,633 found in the 25 to 44 years age bracket for the primary householder. A total of 715 households (24.9%) fall into this category. Meanwhile, the 15 to 24 years age bracket for the primary householder has the lowest median household income of $21,063, with 73 households (2.5%) in this group.
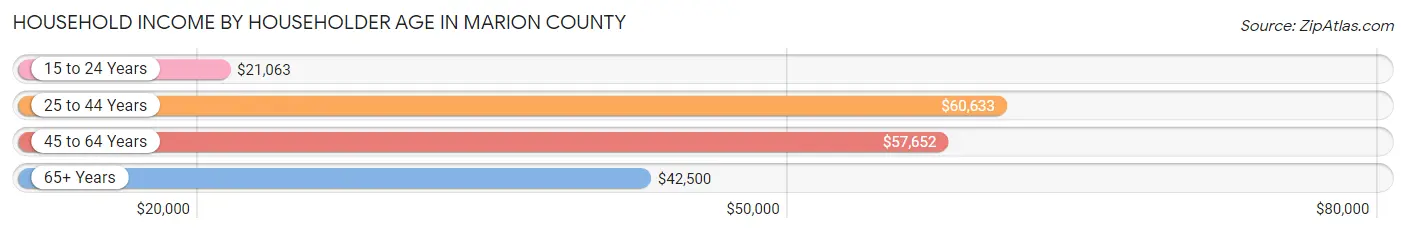
| Income Bracket | # Households | Median Income |
| 15 to 24 Years | 73 (2.5%) | $21,063 |
| 25 to 44 Years | 715 (24.9%) | $60,633 |
| 45 to 64 Years | 1,140 (39.7%) | $57,652 |
| 65+ Years | 944 (32.9%) | $42,500 |
| Total | 2,872 (100.0%) | $48,836 |
Poverty in Marion County
Income Below Poverty by Sex and Age in Marion County
With 9.5% poverty level for males and 15.1% for females among the residents of Marion County, under 5 year old males and 18 to 24 year old females are the most vulnerable to poverty, with 77 males (56.6%) and 155 females (47.1%) in their respective age groups living below the poverty level.
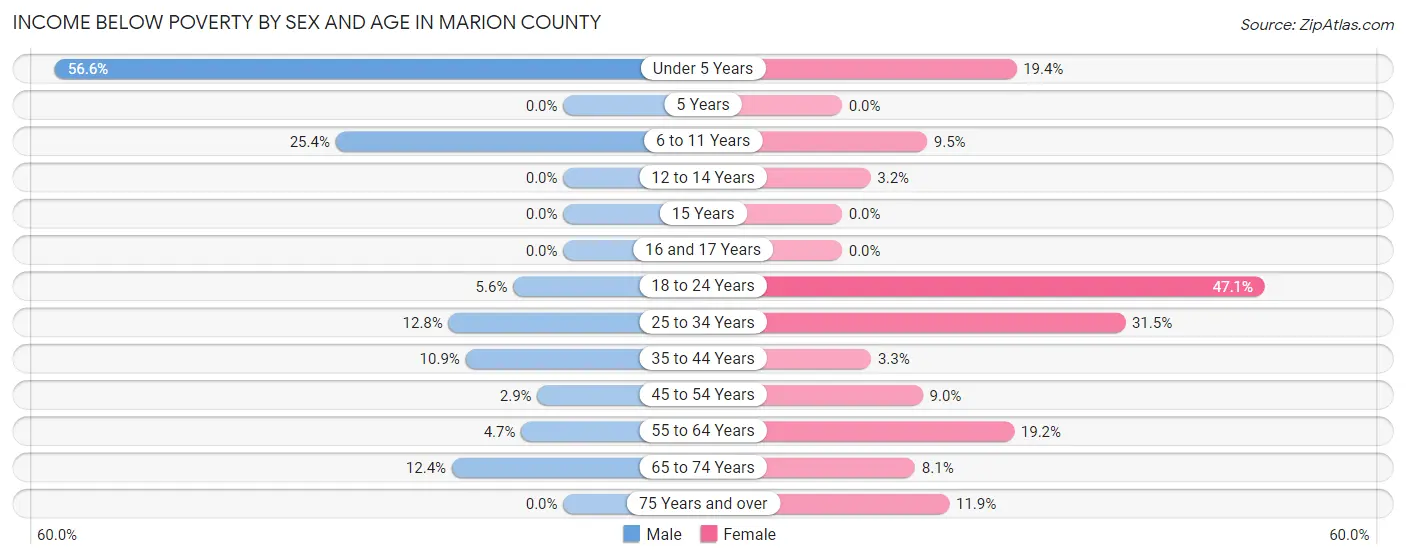
| Age Bracket | Male | Female |
| Under 5 Years | 77 (56.6%) | 40 (19.4%) |
| 5 Years | 0 (0.0%) | 0 (0.0%) |
| 6 to 11 Years | 54 (25.4%) | 34 (9.5%) |
| 12 to 14 Years | 0 (0.0%) | 5 (3.2%) |
| 15 Years | 0 (0.0%) | 0 (0.0%) |
| 16 and 17 Years | 0 (0.0%) | 0 (0.0%) |
| 18 to 24 Years | 14 (5.6%) | 155 (47.1%) |
| 25 to 34 Years | 63 (12.8%) | 82 (31.5%) |
| 35 to 44 Years | 41 (10.9%) | 17 (3.3%) |
| 45 to 54 Years | 13 (2.9%) | 37 (9.0%) |
| 55 to 64 Years | 28 (4.7%) | 123 (19.2%) |
| 65 to 74 Years | 54 (12.4%) | 39 (8.1%) |
| 75 Years and over | 0 (0.0%) | 40 (11.9%) |
| Total | 344 (9.5%) | 572 (15.1%) |
Income Above Poverty by Sex and Age in Marion County
According to the poverty statistics in Marion County, males aged 5 years and females aged 5 years are the age groups that are most secure financially, with 100.0% of males and 100.0% of females in these age groups living above the poverty line.
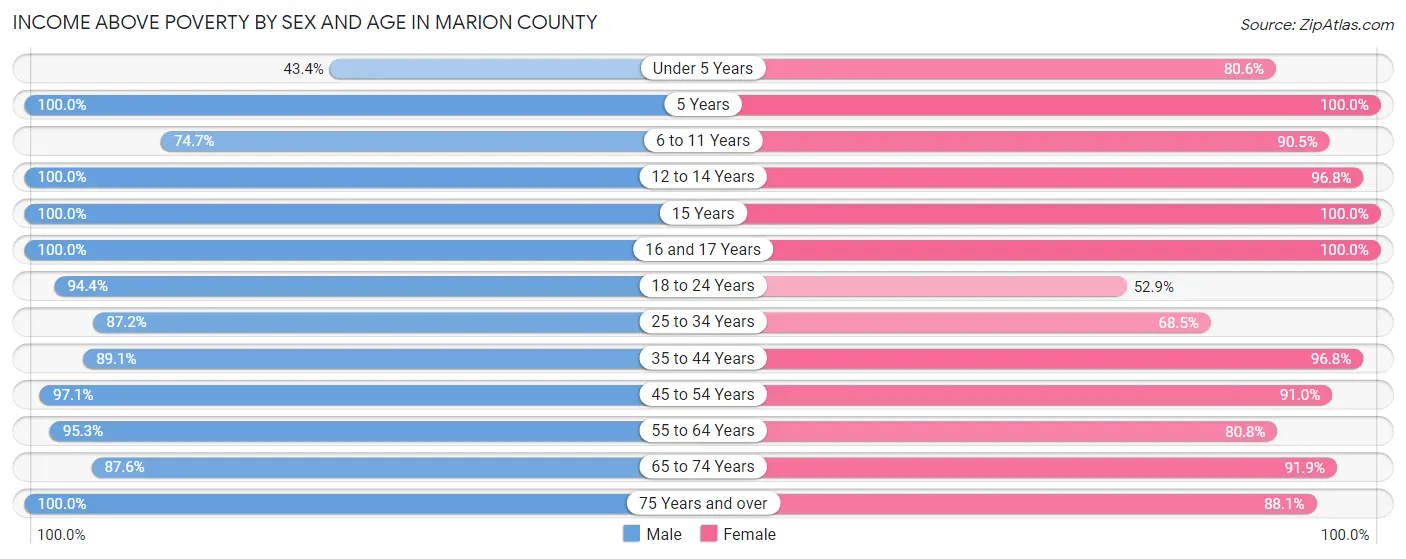
| Age Bracket | Male | Female |
| Under 5 Years | 59 (43.4%) | 166 (80.6%) |
| 5 Years | 89 (100.0%) | 16 (100.0%) |
| 6 to 11 Years | 159 (74.7%) | 325 (90.5%) |
| 12 to 14 Years | 157 (100.0%) | 152 (96.8%) |
| 15 Years | 55 (100.0%) | 13 (100.0%) |
| 16 and 17 Years | 72 (100.0%) | 47 (100.0%) |
| 18 to 24 Years | 237 (94.4%) | 174 (52.9%) |
| 25 to 34 Years | 430 (87.2%) | 178 (68.5%) |
| 35 to 44 Years | 336 (89.1%) | 506 (96.8%) |
| 45 to 54 Years | 437 (97.1%) | 374 (91.0%) |
| 55 to 64 Years | 570 (95.3%) | 519 (80.8%) |
| 65 to 74 Years | 381 (87.6%) | 440 (91.9%) |
| 75 Years and over | 294 (100.0%) | 295 (88.1%) |
| Total | 3,276 (90.5%) | 3,205 (84.9%) |
Income Below Poverty Among Married-Couple Families in Marion County
The poverty statistics for married-couple families in Marion County show that 2.0% or 28 of the total 1,422 families live below the poverty line. Families with no children have the highest poverty rate of 3.1%, comprising of 28 families. On the other hand, families with 1 or 2 children have the lowest poverty rate of 0.0%, which includes 0 families.
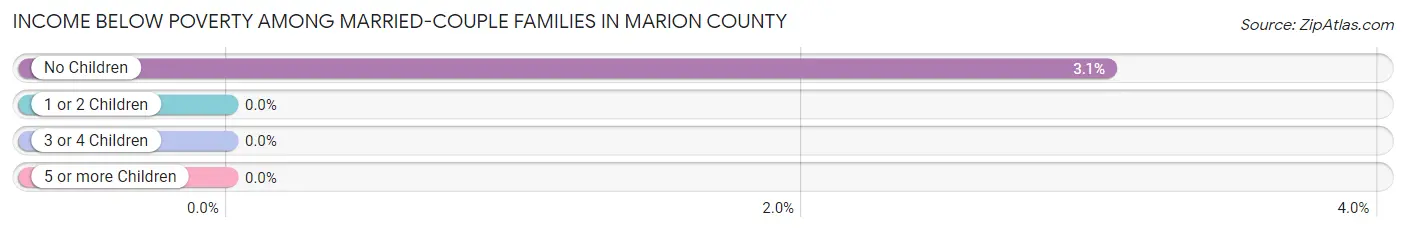
| Children | Above Poverty | Below Poverty |
| No Children | 888 (96.9%) | 28 (3.1%) |
| 1 or 2 Children | 397 (100.0%) | 0 (0.0%) |
| 3 or 4 Children | 98 (100.0%) | 0 (0.0%) |
| 5 or more Children | 11 (100.0%) | 0 (0.0%) |
| Total | 1,394 (98.0%) | 28 (2.0%) |
Income Below Poverty Among Single-Parent Households in Marion County
According to the poverty data in Marion County, 5.7% or 7 single-father households and 30.1% or 144 single-mother households are living below the poverty line. Among single-father households, those with no children have the highest poverty rate, with 7 households (7.7%) experiencing poverty. Likewise, among single-mother households, those with 3 or 4 children have the highest poverty rate, with 41 households (100.0%) falling below the poverty line.
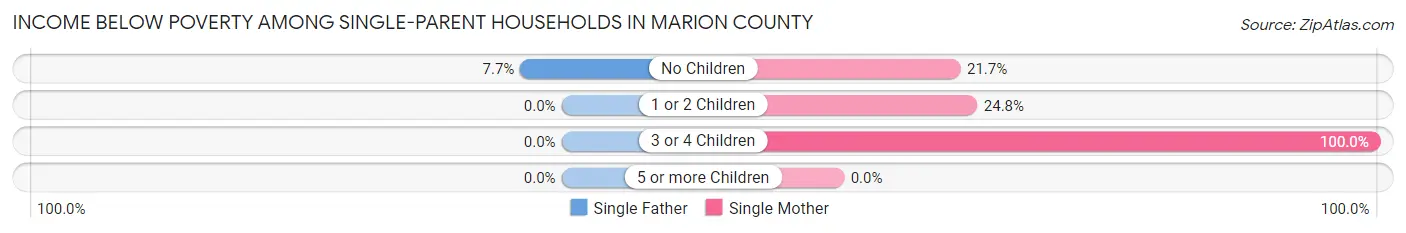
| Children | Single Father | Single Mother |
| No Children | 7 (7.7%) | 39 (21.7%) |
| 1 or 2 Children | 0 (0.0%) | 64 (24.8%) |
| 3 or 4 Children | 0 (0.0%) | 41 (100.0%) |
| 5 or more Children | 0 (0.0%) | 0 (0.0%) |
| Total | 7 (5.7%) | 144 (30.1%) |
Income Below Poverty Among Married-Couple vs Single-Parent Households in Marion County
The poverty data for Marion County shows that 28 of the married-couple family households (2.0%) and 151 of the single-parent households (25.1%) are living below the poverty level. Within the married-couple family households, those with no children have the highest poverty rate, with 28 households (3.1%) falling below the poverty line. Among the single-parent households, those with 3 or 4 children have the highest poverty rate, with 41 household (74.6%) living below poverty.
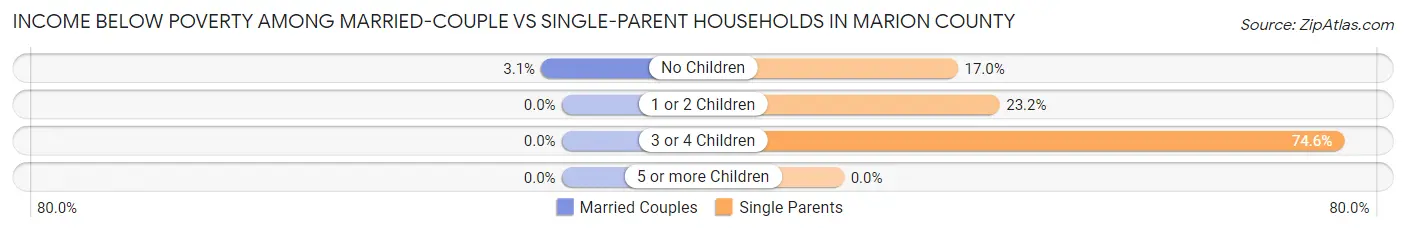
| Children | Married-Couple Families | Single-Parent Households |
| No Children | 28 (3.1%) | 46 (17.0%) |
| 1 or 2 Children | 0 (0.0%) | 64 (23.2%) |
| 3 or 4 Children | 0 (0.0%) | 41 (74.6%) |
| 5 or more Children | 0 (0.0%) | 0 (0.0%) |
| Total | 28 (2.0%) | 151 (25.1%) |
Race in Marion County
The most populous races in Marion County are White / Caucasian (4,474 | 59.6%), Black / African American (2,234 | 29.7%), and Hispanic or Latino (622 | 8.3%).
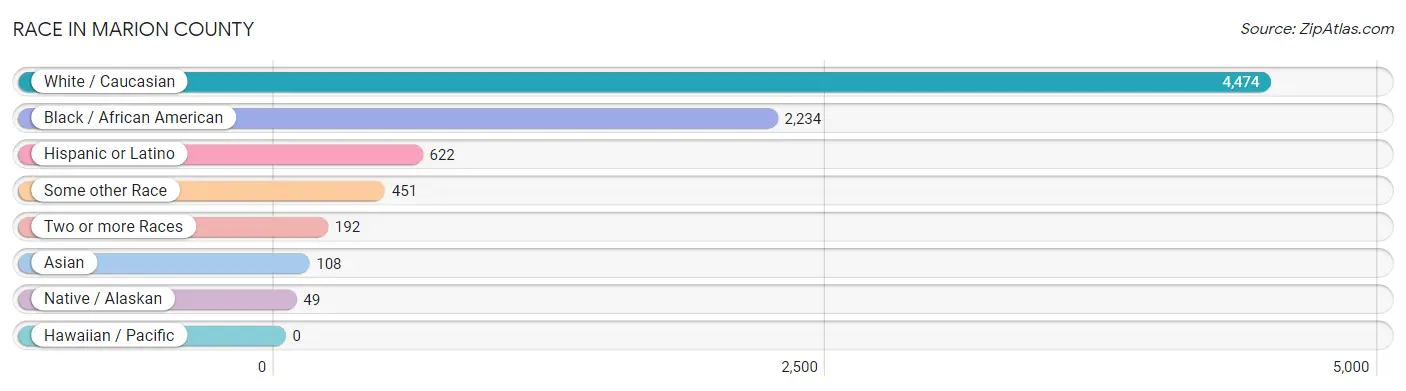
| Race | # Population | % Population |
| Asian | 108 | 1.4% |
| Black / African American | 2,234 | 29.7% |
| Hawaiian / Pacific | 0 | 0.0% |
| Hispanic or Latino | 622 | 8.3% |
| Native / Alaskan | 49 | 0.6% |
| White / Caucasian | 4,474 | 59.6% |
| Two or more Races | 192 | 2.6% |
| Some other Race | 451 | 6.0% |
| Total | 7,508 | 100.0% |
Ancestry in Marion County
The most populous ancestries reported in Marion County are American (1,012 | 13.5%), English (547 | 7.3%), Irish (431 | 5.7%), Central American (276 | 3.7%), and Guatemalan (258 | 3.4%), together accounting for 33.6% of all Marion County residents.
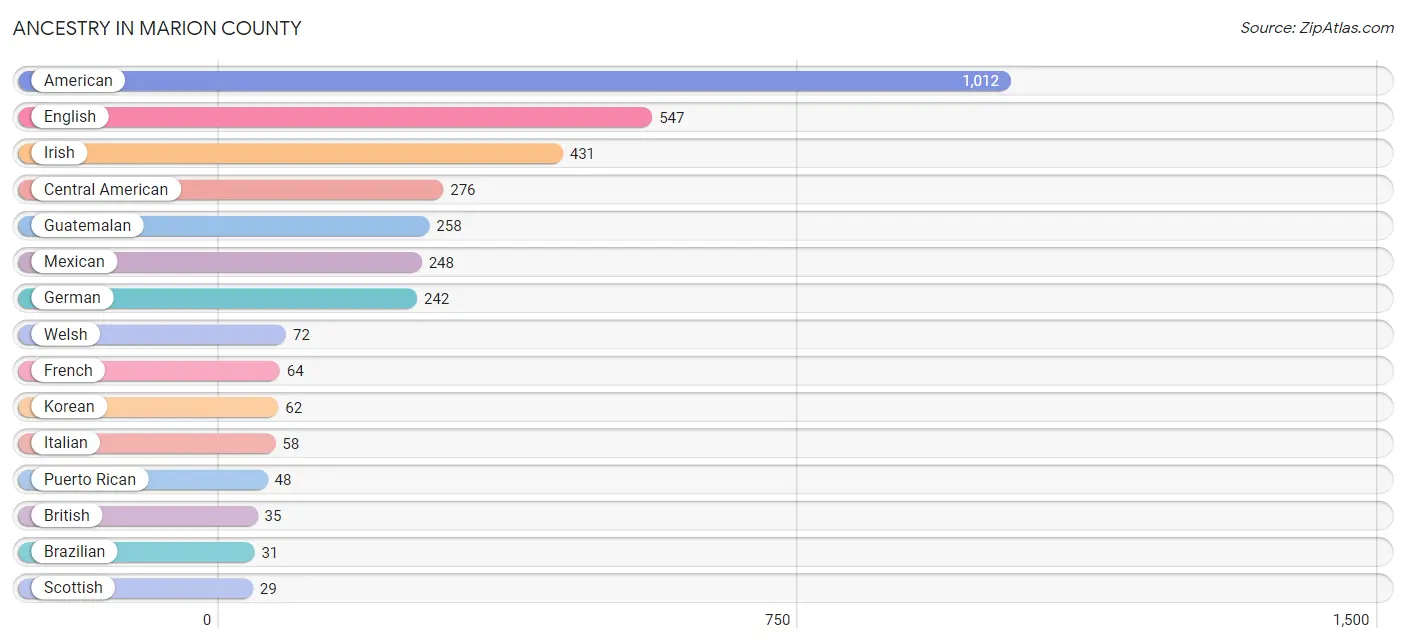
| Ancestry | # Population | % Population |
| American | 1,012 | 13.5% |
| Arab | 7 | 0.1% |
| Arapaho | 11 | 0.2% |
| Armenian | 7 | 0.1% |
| Belgian | 4 | 0.1% |
| Blackfeet | 1 | 0.0% |
| Brazilian | 31 | 0.4% |
| British | 35 | 0.5% |
| Burmese | 11 | 0.2% |
| Canadian | 7 | 0.1% |
| Central American | 276 | 3.7% |
| Central American Indian | 25 | 0.3% |
| Cherokee | 14 | 0.2% |
| Chilean | 21 | 0.3% |
| Cuban | 4 | 0.1% |
| Czech | 21 | 0.3% |
| Dutch | 5 | 0.1% |
| Eastern European | 5 | 0.1% |
| Egyptian | 2 | 0.0% |
| English | 547 | 7.3% |
| European | 10 | 0.1% |
| Finnish | 4 | 0.1% |
| French | 64 | 0.9% |
| German | 242 | 3.2% |
| Greek | 21 | 0.3% |
| Guatemalan | 258 | 3.4% |
| Hungarian | 7 | 0.1% |
| Irish | 431 | 5.7% |
| Italian | 58 | 0.8% |
| Korean | 62 | 0.8% |
| Lebanese | 5 | 0.1% |
| Mexican | 248 | 3.3% |
| Northern European | 5 | 0.1% |
| Polish | 8 | 0.1% |
| Puerto Rican | 48 | 0.6% |
| Salvadoran | 18 | 0.2% |
| Scandinavian | 7 | 0.1% |
| Scotch-Irish | 6 | 0.1% |
| Scottish | 29 | 0.4% |
| Slovene | 9 | 0.1% |
| South American | 21 | 0.3% |
| Swedish | 10 | 0.1% |
| Welsh | 72 | 1.0% | View All 43 Rows |
Immigrants in Marion County
The most numerous immigrant groups reported in Marion County came from Latin America (347 | 4.6%), Central America (324 | 4.3%), Mexico (173 | 2.3%), Guatemala (112 | 1.5%), and Asia (62 | 0.8%), together accounting for 13.6% of all Marion County residents.
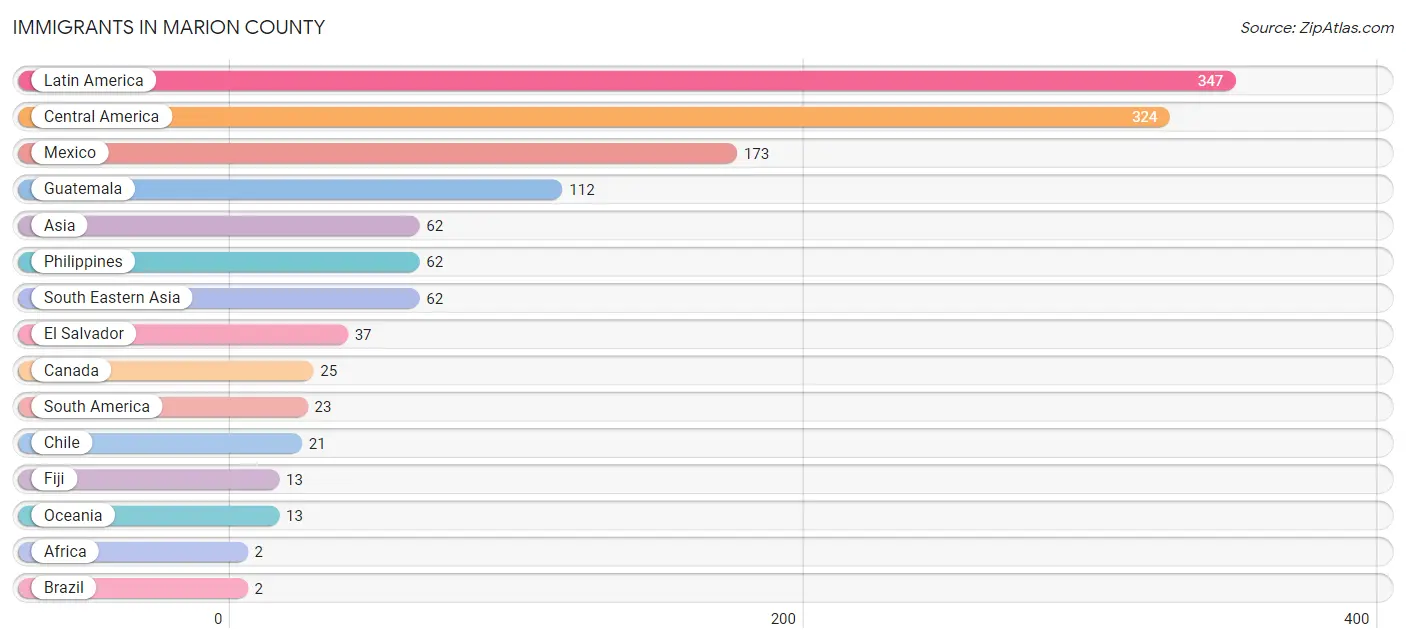
| Immigration Origin | # Population | % Population |
| Africa | 2 | 0.0% |
| Asia | 62 | 0.8% |
| Brazil | 2 | 0.0% |
| Canada | 25 | 0.3% |
| Central America | 324 | 4.3% |
| Chile | 21 | 0.3% |
| Egypt | 2 | 0.0% |
| El Salvador | 37 | 0.5% |
| Fiji | 13 | 0.2% |
| Guatemala | 112 | 1.5% |
| Latin America | 347 | 4.6% |
| Mexico | 173 | 2.3% |
| Northern Africa | 2 | 0.0% |
| Oceania | 13 | 0.2% |
| Panama | 2 | 0.0% |
| Philippines | 62 | 0.8% |
| South America | 23 | 0.3% |
| South Eastern Asia | 62 | 0.8% | View All 18 Rows |
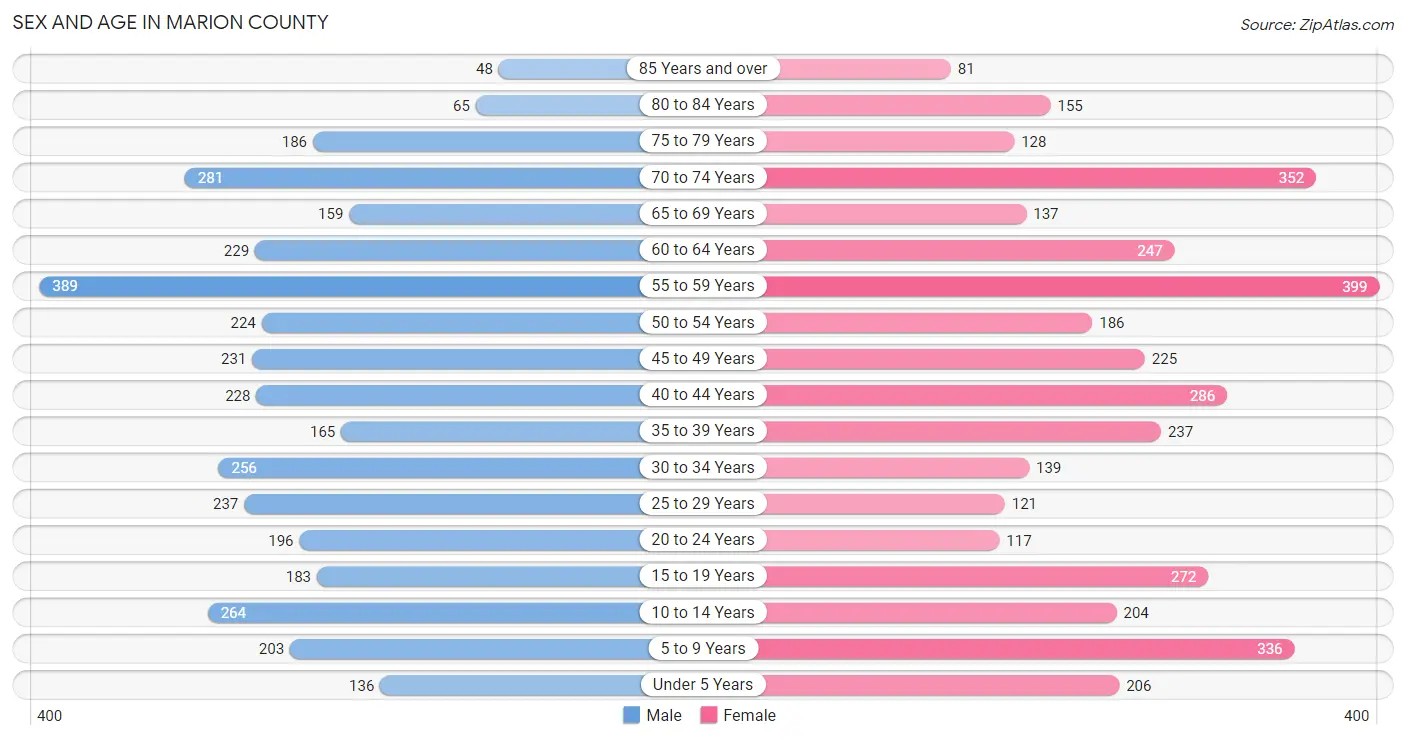
Sex and Age in Marion County
Sex and Age in Marion County
The most populous age groups in Marion County are 55 to 59 Years (389 | 10.6%) for men and 55 to 59 Years (399 | 10.4%) for women.
| Age Bracket | Male | Female |
| Under 5 Years | 136 (3.7%) | 206 (5.4%) |
| 5 to 9 Years | 203 (5.5%) | 336 (8.8%) |
| 10 to 14 Years | 264 (7.2%) | 204 (5.3%) |
| 15 to 19 Years | 183 (5.0%) | 272 (7.1%) |
| 20 to 24 Years | 196 (5.3%) | 117 (3.1%) |
| 25 to 29 Years | 237 (6.4%) | 121 (3.2%) |
| 30 to 34 Years | 256 (7.0%) | 139 (3.6%) |
| 35 to 39 Years | 165 (4.5%) | 237 (6.2%) |
| 40 to 44 Years | 228 (6.2%) | 286 (7.5%) |
| 45 to 49 Years | 231 (6.3%) | 225 (5.9%) |
| 50 to 54 Years | 224 (6.1%) | 186 (4.9%) |
| 55 to 59 Years | 389 (10.6%) | 399 (10.4%) |
| 60 to 64 Years | 229 (6.2%) | 247 (6.5%) |
| 65 to 69 Years | 159 (4.3%) | 137 (3.6%) |
| 70 to 74 Years | 281 (7.6%) | 352 (9.2%) |
| 75 to 79 Years | 186 (5.1%) | 128 (3.3%) |
| 80 to 84 Years | 65 (1.8%) | 155 (4.1%) |
| 85 Years and over | 48 (1.3%) | 81 (2.1%) |
| Total | 3,680 (100.0%) | 3,828 (100.0%) |
Families and Households in Marion County
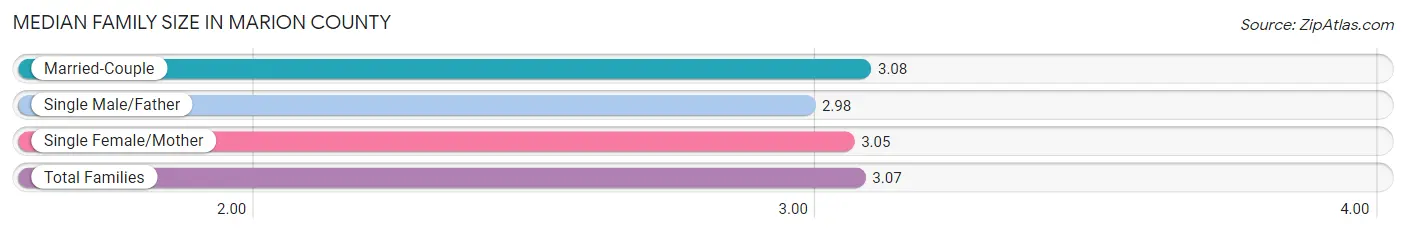
Median Family Size in Marion County
The median family size in Marion County is 3.07 persons per family, with married-couple families (1,422 | 70.3%) accounting for the largest median family size of 3.08 persons per family. On the other hand, single male/father families (123 | 6.1%) represent the smallest median family size with 2.98 persons per family.
| Family Type | # Families | Family Size |
| Married-Couple | 1,422 (70.3%) | 3.08 |
| Single Male/Father | 123 (6.1%) | 2.98 |
| Single Female/Mother | 479 (23.7%) | 3.05 |
| Total Families | 2,024 (100.0%) | 3.07 |
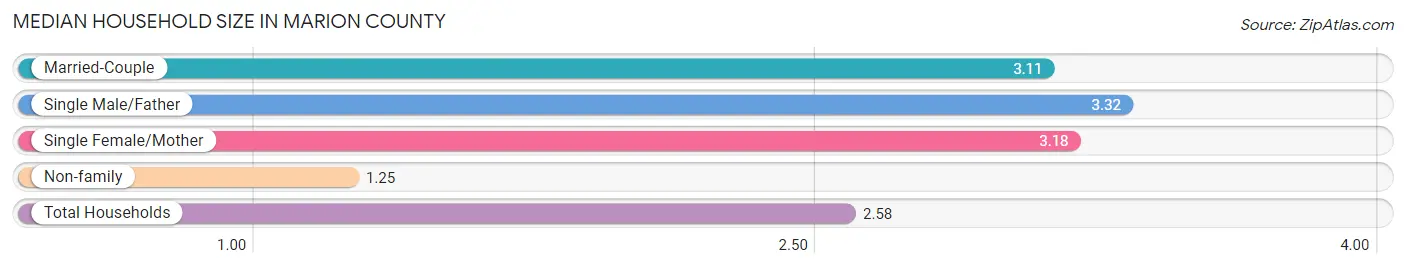
Median Household Size in Marion County
The median household size in Marion County is 2.58 persons per household, with single male/father households (123 | 4.3%) accounting for the largest median household size of 3.32 persons per household. non-family households (848 | 29.5%) represent the smallest median household size with 1.25 persons per household.
| Household Type | # Households | Household Size |
| Married-Couple | 1,422 (49.5%) | 3.11 |
| Single Male/Father | 123 (4.3%) | 3.32 |
| Single Female/Mother | 479 (16.7%) | 3.18 |
| Non-family | 848 (29.5%) | 1.25 |
| Total Households | 2,872 (100.0%) | 2.58 |
Household Size by Marriage Status in Marion County
Out of a total of 2,872 households in Marion County, 2,024 (70.5%) are family households, while 848 (29.5%) are nonfamily households. The most numerous type of family households are 2-person households, comprising 967, and the most common type of nonfamily households are 1-person households, comprising 760.
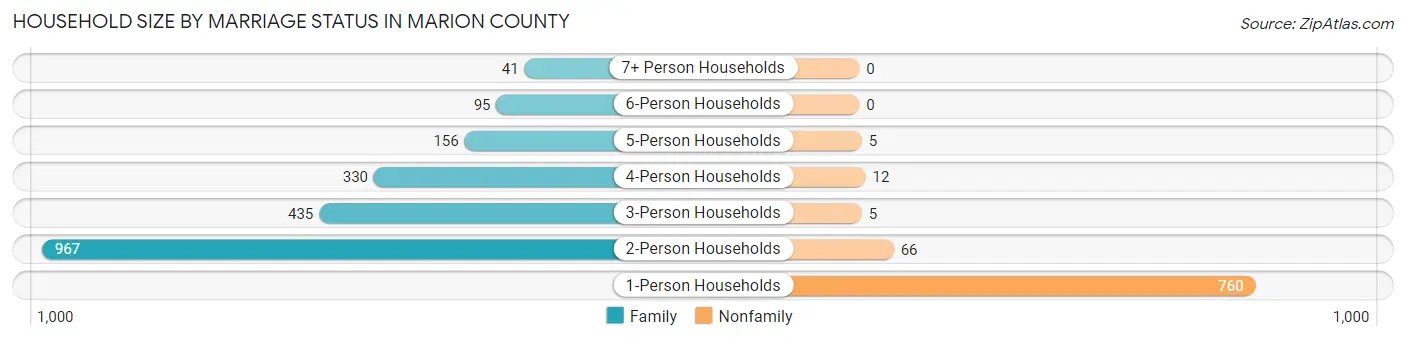
| Household Size | Family Households | Nonfamily Households |
| 1-Person Households | - | 760 (26.5%) |
| 2-Person Households | 967 (33.7%) | 66 (2.3%) |
| 3-Person Households | 435 (15.1%) | 5 (0.2%) |
| 4-Person Households | 330 (11.5%) | 12 (0.4%) |
| 5-Person Households | 156 (5.4%) | 5 (0.2%) |
| 6-Person Households | 95 (3.3%) | 0 (0.0%) |
| 7+ Person Households | 41 (1.4%) | 0 (0.0%) |
| Total | 2,024 (70.5%) | 848 (29.5%) |
Female Fertility in Marion County
Fertility by Age in Marion County
Average fertility rate in Marion County is 87.0 births per 1,000 women. Women in the age bracket of 20 to 34 years have the highest fertility rate with 156.0 births per 1,000 women. Women in the age bracket of 20 to 34 years acount for 48.4% of all women with births.
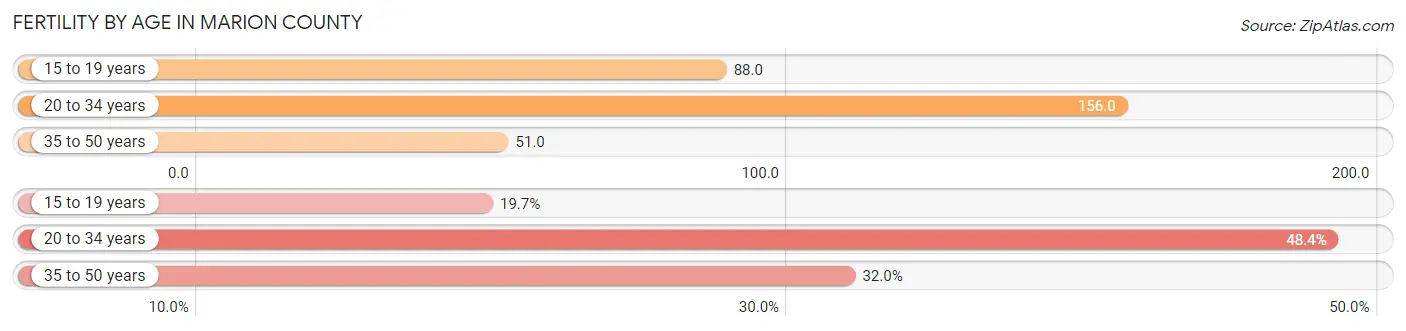
| Age Bracket | Women with Births | Births / 1,000 Women |
| 15 to 19 years | 24 (19.7%) | 88.0 |
| 20 to 34 years | 59 (48.4%) | 156.0 |
| 35 to 50 years | 39 (32.0%) | 51.0 |
| Total | 122 (100.0%) | 87.0 |
Fertility by Age by Marriage Status in Marion County
9.0% of women with births (122) in Marion County are married. The highest percentage of unmarried women with births falls into 15 to 19 years age bracket with 100.0% of them unmarried at the time of birth, while the lowest percentage of unmarried women with births belong to 20 to 34 years age bracket with 81.4% of them unmarried.
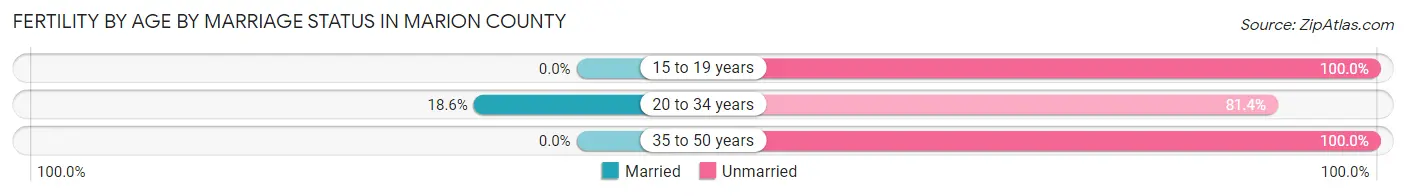
| Age Bracket | Married | Unmarried |
| 15 to 19 years | 0 (0.0%) | 24 (100.0%) |
| 20 to 34 years | 11 (18.6%) | 48 (81.4%) |
| 35 to 50 years | 0 (0.0%) | 39 (100.0%) |
| Total | 11 (9.0%) | 111 (91.0%) |
Fertility by Education in Marion County
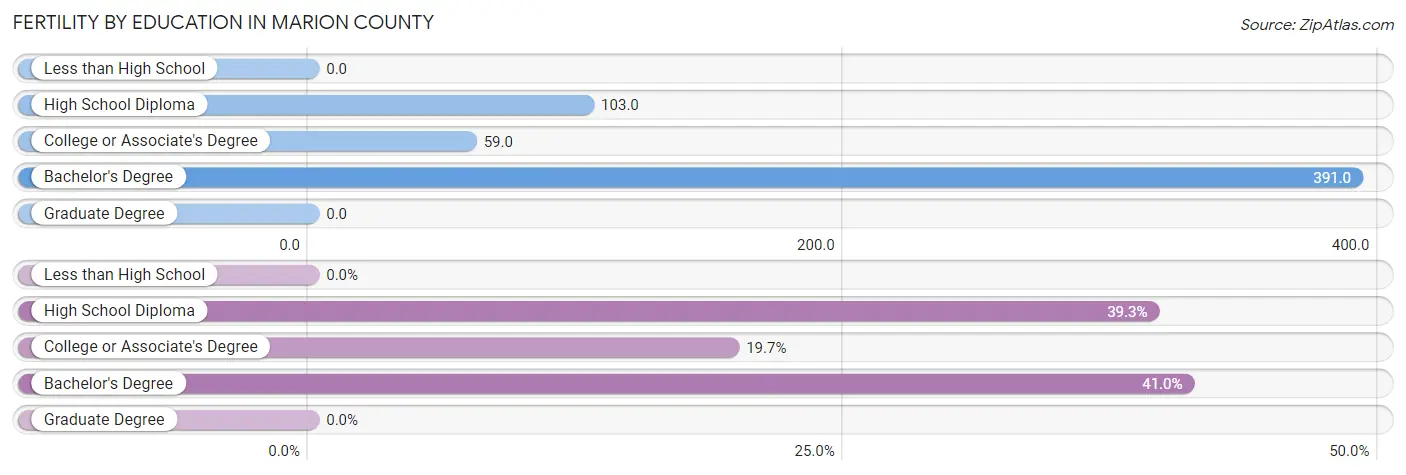
| Educational Attainment | Women with Births | Births / 1,000 Women |
| Less than High School | 0 (0.0%) | 0.0 |
| High School Diploma | 48 (39.3%) | 103.0 |
| College or Associate's Degree | 24 (19.7%) | 59.0 |
| Bachelor's Degree | 50 (41.0%) | 391.0 |
| Graduate Degree | 0 (0.0%) | 0.0 |
| Total | 122 (100.0%) | 87.0 |
Fertility by Education by Marriage Status in Marion County
91.0% of women with births in Marion County are unmarried. Women with the educational attainment of bachelor's degree are most likely to be married with 22.0% of them married at childbirth, while women with the educational attainment of high school diploma are least likely to be married with 100.0% of them unmarried at childbirth.
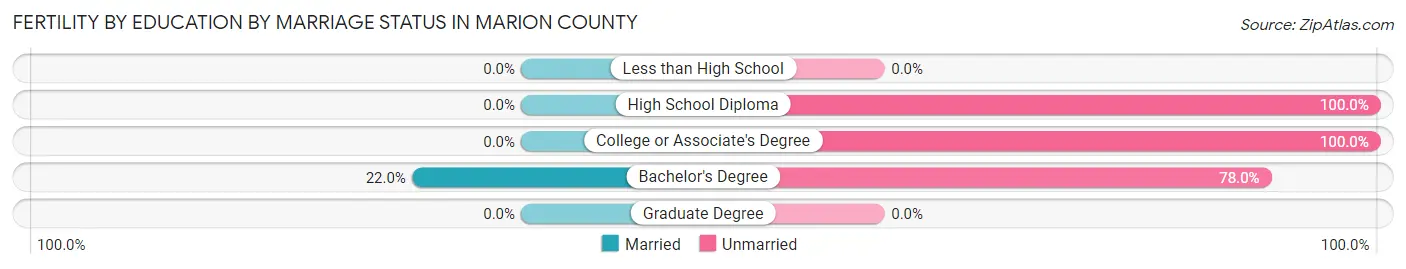
| Educational Attainment | Married | Unmarried |
| Less than High School | 0 (0.0%) | 0 (0.0%) |
| High School Diploma | 0 (0.0%) | 48 (100.0%) |
| College or Associate's Degree | 0 (0.0%) | 24 (100.0%) |
| Bachelor's Degree | 11 (22.0%) | 39 (78.0%) |
| Graduate Degree | 0 (0.0%) | 0 (0.0%) |
| Total | 11 (9.0%) | 111 (91.0%) |
Employment Characteristics in Marion County
Employment by Class of Employer in Marion County
Among the 2,806 employed individuals in Marion County, private company employees (2,065 | 73.6%), local government employees (199 | 7.1%), and self-employed (not incorporated) (190 | 6.8%) make up the most common classes of employment.
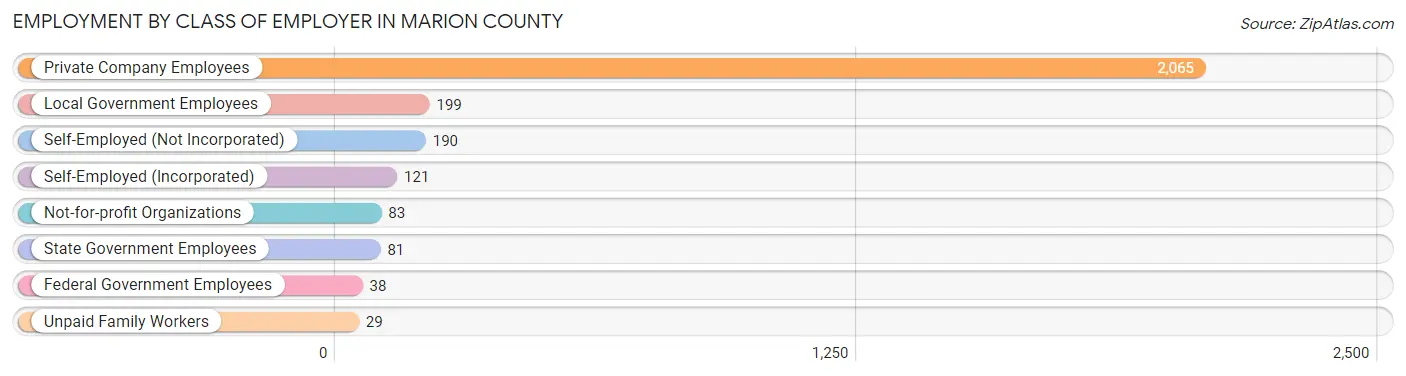
| Employer Class | # Employees | % Employees |
| Private Company Employees | 2,065 | 73.6% |
| Self-Employed (Incorporated) | 121 | 4.3% |
| Self-Employed (Not Incorporated) | 190 | 6.8% |
| Not-for-profit Organizations | 83 | 3.0% |
| Local Government Employees | 199 | 7.1% |
| State Government Employees | 81 | 2.9% |
| Federal Government Employees | 38 | 1.3% |
| Unpaid Family Workers | 29 | 1.0% |
| Total | 2,806 | 100.0% |
Employment Status by Age in Marion County
According to the labor force statistics for Marion County, out of the total population over 16 years of age (6,091), 49.1% or 2,991 individuals are in the labor force, with 5.4% or 162 of them unemployed. The age group with the highest labor force participation rate is 25 to 29 years, with 85.5% or 306 individuals in the labor force. Within the labor force, the 16 to 19 years age range has the highest percentage of unemployed individuals, with 28.2% or 35 of them being unemployed.
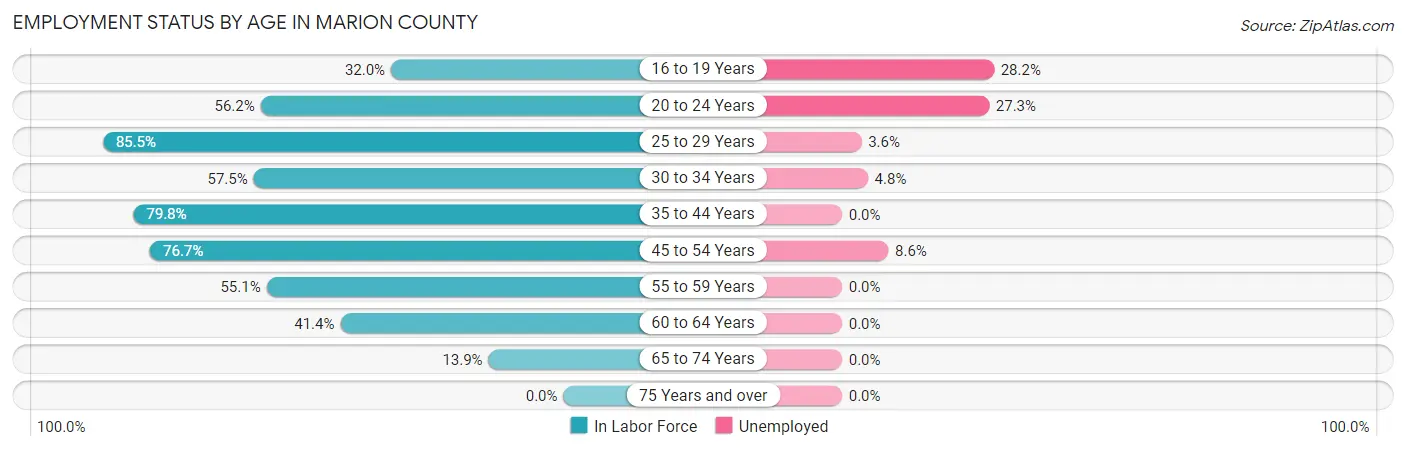
| Age Bracket | In Labor Force | Unemployed |
| 16 to 19 Years | 124 (32.0%) | 35 (28.2%) |
| 20 to 24 Years | 176 (56.2%) | 48 (27.3%) |
| 25 to 29 Years | 306 (85.5%) | 11 (3.6%) |
| 30 to 34 Years | 227 (57.5%) | 11 (4.8%) |
| 35 to 44 Years | 731 (79.8%) | 0 (0.0%) |
| 45 to 54 Years | 664 (76.7%) | 57 (8.6%) |
| 55 to 59 Years | 434 (55.1%) | 0 (0.0%) |
| 60 to 64 Years | 197 (41.4%) | 0 (0.0%) |
| 65 to 74 Years | 129 (13.9%) | 0 (0.0%) |
| 75 Years and over | 0 (0.0%) | 0 (0.0%) |
| Total | 2,991 (49.1%) | 162 (5.4%) |
Employment Status by Educational Attainment in Marion County
According to labor force statistics for Marion County, 67.4% of individuals (2,561) out of the total population between 25 and 64 years of age (3,799) are in the labor force, with 3.1% or 79 of them being unemployed. The group with the highest labor force participation rate are those with the educational attainment of bachelor's degree or higher, with 83.8% or 382 individuals in the labor force. Within the labor force, individuals with high school diploma education have the highest percentage of unemployment, with 6.3% or 52 of them being unemployed.
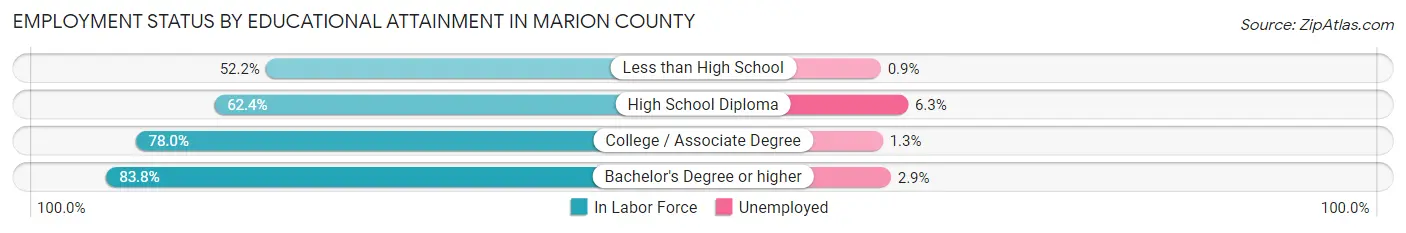
| Educational Attainment | In Labor Force | Unemployed |
| Less than High School | 453 (52.2%) | 8 (0.9%) |
| High School Diploma | 831 (62.4%) | 84 (6.3%) |
| College / Associate Degree | 893 (78.0%) | 15 (1.3%) |
| Bachelor's Degree or higher | 382 (83.8%) | 13 (2.9%) |
| Total | 2,561 (67.4%) | 118 (3.1%) |
Employment Occupations by Sex in Marion County
Management, Business, Science and Arts Occupations
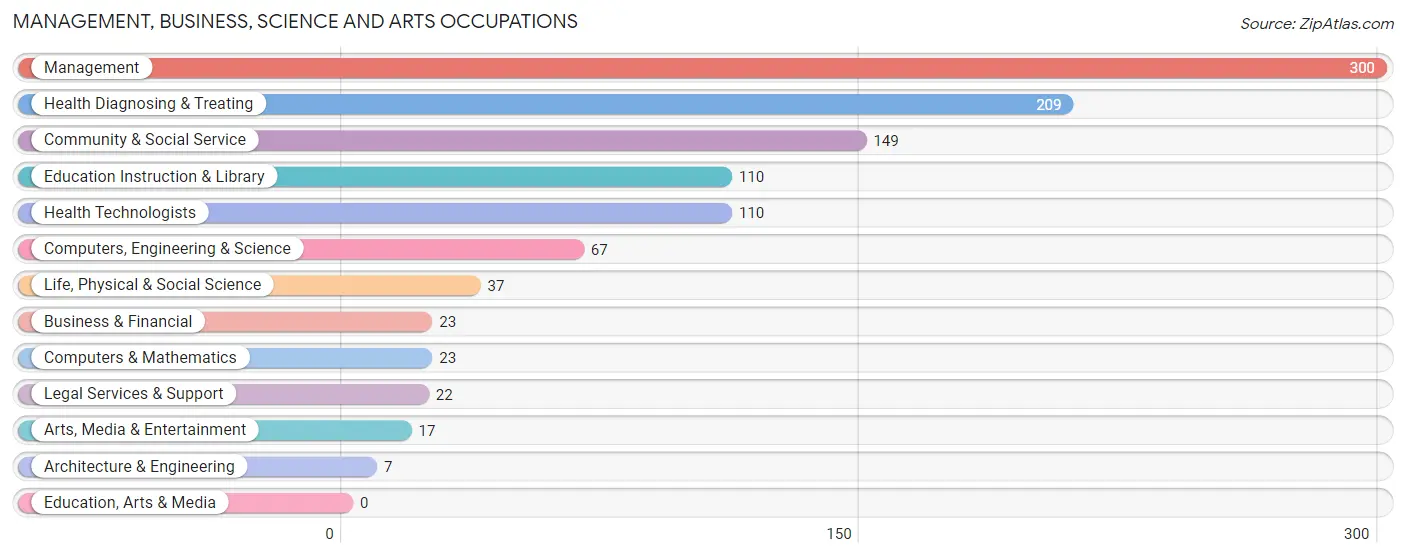
The most common Management, Business, Science and Arts occupations in Marion County are Management (300 | 10.6%), Health Diagnosing & Treating (209 | 7.4%), Community & Social Service (149 | 5.3%), Education Instruction & Library (110 | 3.9%), and Health Technologists (110 | 3.9%).
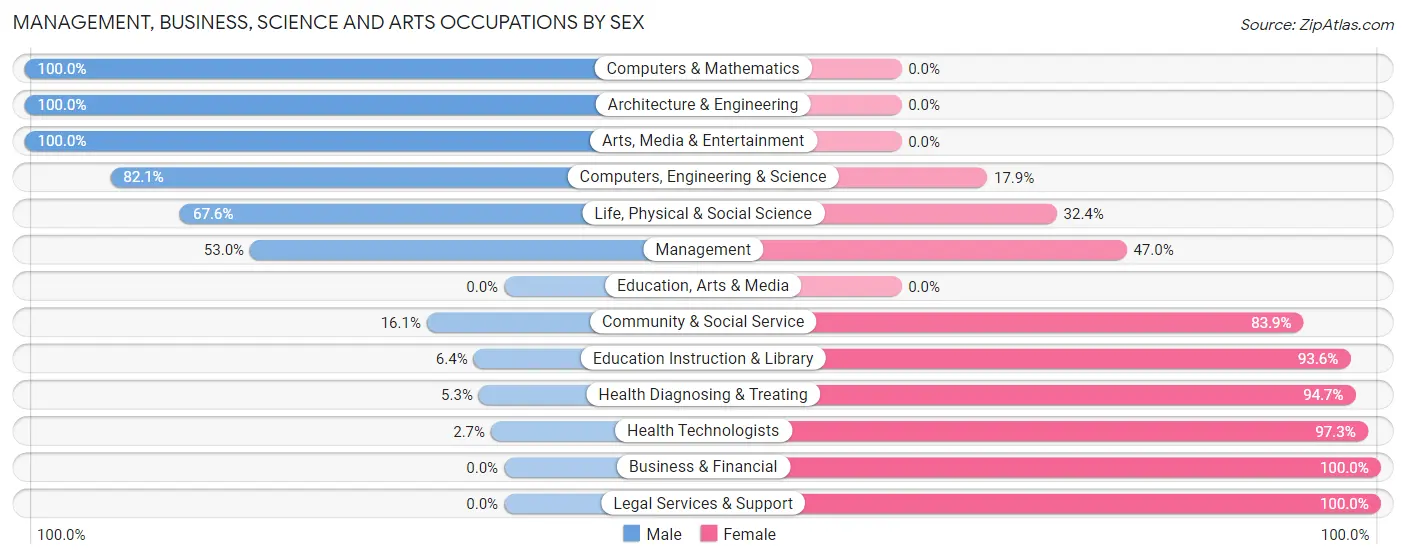
Management, Business, Science and Arts Occupations by Sex
Within the Management, Business, Science and Arts occupations in Marion County, the most male-oriented occupations are Computers & Mathematics (100.0%), Architecture & Engineering (100.0%), and Arts, Media & Entertainment (100.0%), while the most female-oriented occupations are Business & Financial (100.0%), Legal Services & Support (100.0%), and Health Technologists (97.3%).
| Occupation | Male | Female |
| Management | 159 (53.0%) | 141 (47.0%) |
| Business & Financial | 0 (0.0%) | 23 (100.0%) |
| Computers, Engineering & Science | 55 (82.1%) | 12 (17.9%) |
| Computers & Mathematics | 23 (100.0%) | 0 (0.0%) |
| Architecture & Engineering | 7 (100.0%) | 0 (0.0%) |
| Life, Physical & Social Science | 25 (67.6%) | 12 (32.4%) |
| Community & Social Service | 24 (16.1%) | 125 (83.9%) |
| Education, Arts & Media | 0 (0.0%) | 0 (0.0%) |
| Legal Services & Support | 0 (0.0%) | 22 (100.0%) |
| Education Instruction & Library | 7 (6.4%) | 103 (93.6%) |
| Arts, Media & Entertainment | 17 (100.0%) | 0 (0.0%) |
| Health Diagnosing & Treating | 11 (5.3%) | 198 (94.7%) |
| Health Technologists | 3 (2.7%) | 107 (97.3%) |
| Total (Category) | 249 (33.3%) | 499 (66.7%) |
| Total (Overall) | 1,493 (52.8%) | 1,333 (47.2%) |
Services Occupations
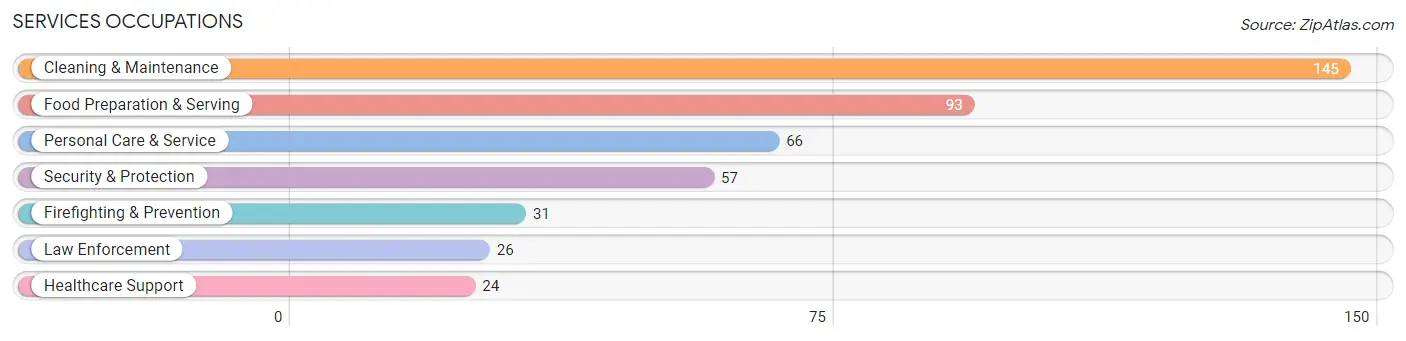
The most common Services occupations in Marion County are Cleaning & Maintenance (145 | 5.1%), Food Preparation & Serving (93 | 3.3%), Personal Care & Service (66 | 2.3%), Security & Protection (57 | 2.0%), and Firefighting & Prevention (31 | 1.1%).
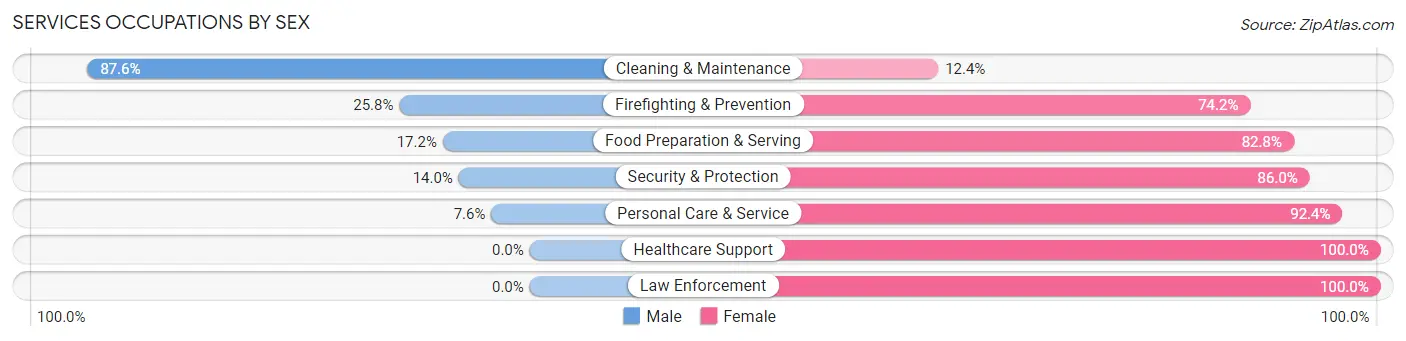
Services Occupations by Sex
Within the Services occupations in Marion County, the most male-oriented occupations are Cleaning & Maintenance (87.6%), Firefighting & Prevention (25.8%), and Food Preparation & Serving (17.2%), while the most female-oriented occupations are Healthcare Support (100.0%), Law Enforcement (100.0%), and Personal Care & Service (92.4%).
| Occupation | Male | Female |
| Healthcare Support | 0 (0.0%) | 24 (100.0%) |
| Security & Protection | 8 (14.0%) | 49 (86.0%) |
| Firefighting & Prevention | 8 (25.8%) | 23 (74.2%) |
| Law Enforcement | 0 (0.0%) | 26 (100.0%) |
| Food Preparation & Serving | 16 (17.2%) | 77 (82.8%) |
| Cleaning & Maintenance | 127 (87.6%) | 18 (12.4%) |
| Personal Care & Service | 5 (7.6%) | 61 (92.4%) |
| Total (Category) | 156 (40.5%) | 229 (59.5%) |
| Total (Overall) | 1,493 (52.8%) | 1,333 (47.2%) |
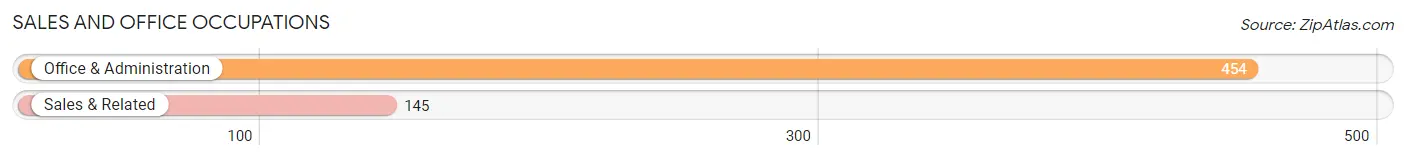
Sales and Office Occupations
The most common Sales and Office occupations in Marion County are Office & Administration (454 | 16.1%), and Sales & Related (145 | 5.1%).
Sales and Office Occupations by Sex
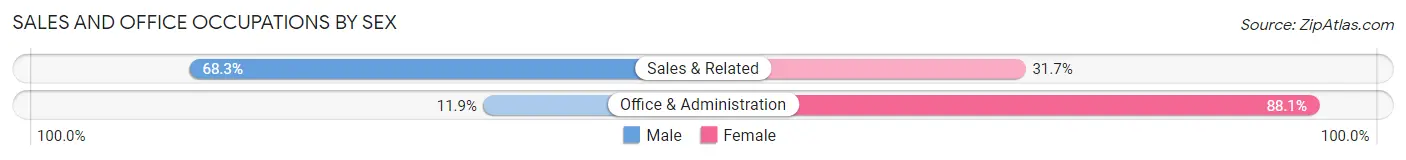
| Occupation | Male | Female |
| Sales & Related | 99 (68.3%) | 46 (31.7%) |
| Office & Administration | 54 (11.9%) | 400 (88.1%) |
| Total (Category) | 153 (25.5%) | 446 (74.5%) |
| Total (Overall) | 1,493 (52.8%) | 1,333 (47.2%) |
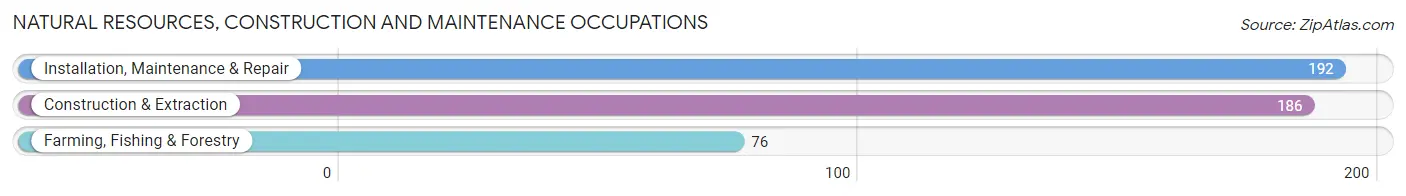
Natural Resources, Construction and Maintenance Occupations
The most common Natural Resources, Construction and Maintenance occupations in Marion County are Installation, Maintenance & Repair (192 | 6.8%), Construction & Extraction (186 | 6.6%), and Farming, Fishing & Forestry (76 | 2.7%).
Natural Resources, Construction and Maintenance Occupations by Sex
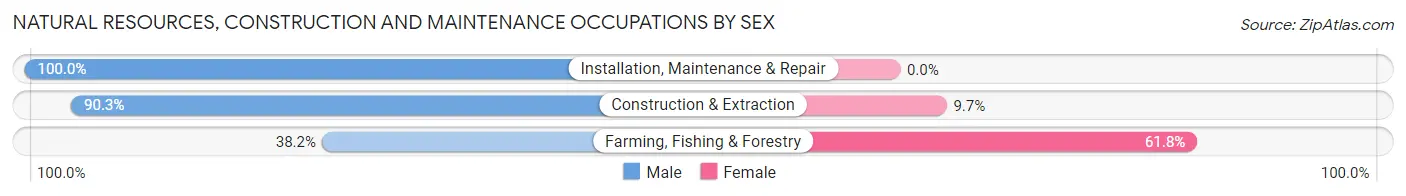
| Occupation | Male | Female |
| Farming, Fishing & Forestry | 29 (38.2%) | 47 (61.8%) |
| Construction & Extraction | 168 (90.3%) | 18 (9.7%) |
| Installation, Maintenance & Repair | 192 (100.0%) | 0 (0.0%) |
| Total (Category) | 389 (85.7%) | 65 (14.3%) |
| Total (Overall) | 1,493 (52.8%) | 1,333 (47.2%) |
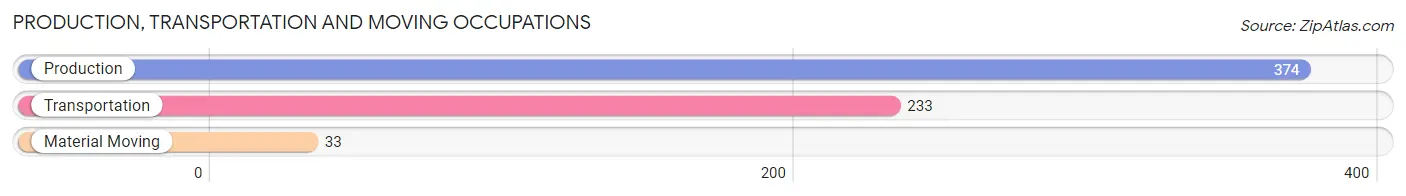
Production, Transportation and Moving Occupations
The most common Production, Transportation and Moving occupations in Marion County are Production (374 | 13.2%), Transportation (233 | 8.2%), and Material Moving (33 | 1.2%).
Production, Transportation and Moving Occupations by Sex
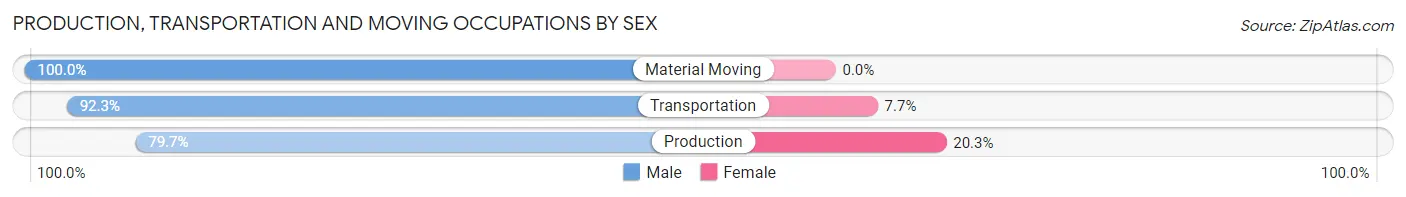
| Occupation | Male | Female |
| Production | 298 (79.7%) | 76 (20.3%) |
| Transportation | 215 (92.3%) | 18 (7.7%) |
| Material Moving | 33 (100.0%) | 0 (0.0%) |
| Total (Category) | 546 (85.3%) | 94 (14.7%) |
| Total (Overall) | 1,493 (52.8%) | 1,333 (47.2%) |
Employment Industries by Sex in Marion County
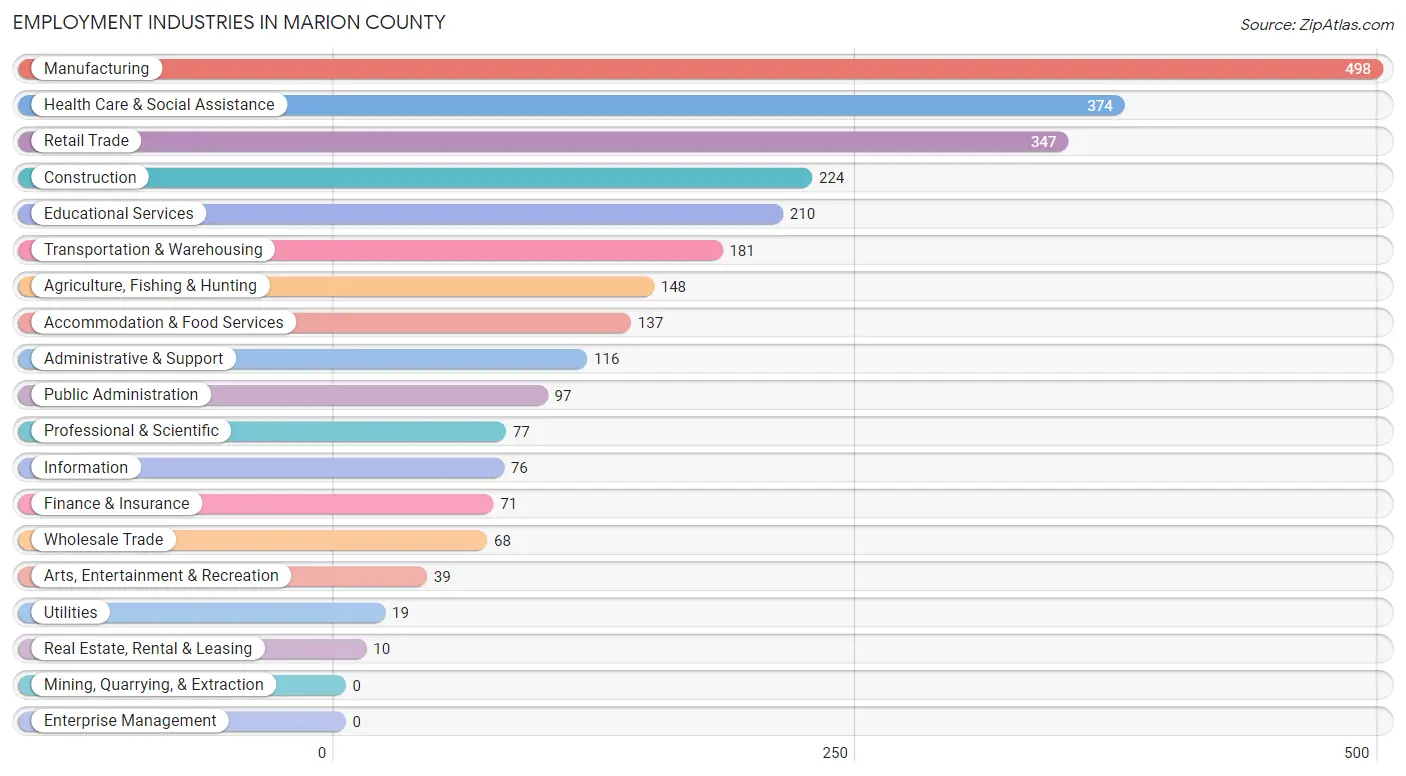
Employment Industries in Marion County
The major employment industries in Marion County include Manufacturing (498 | 17.6%), Health Care & Social Assistance (374 | 13.2%), Retail Trade (347 | 12.3%), Construction (224 | 7.9%), and Educational Services (210 | 7.4%).
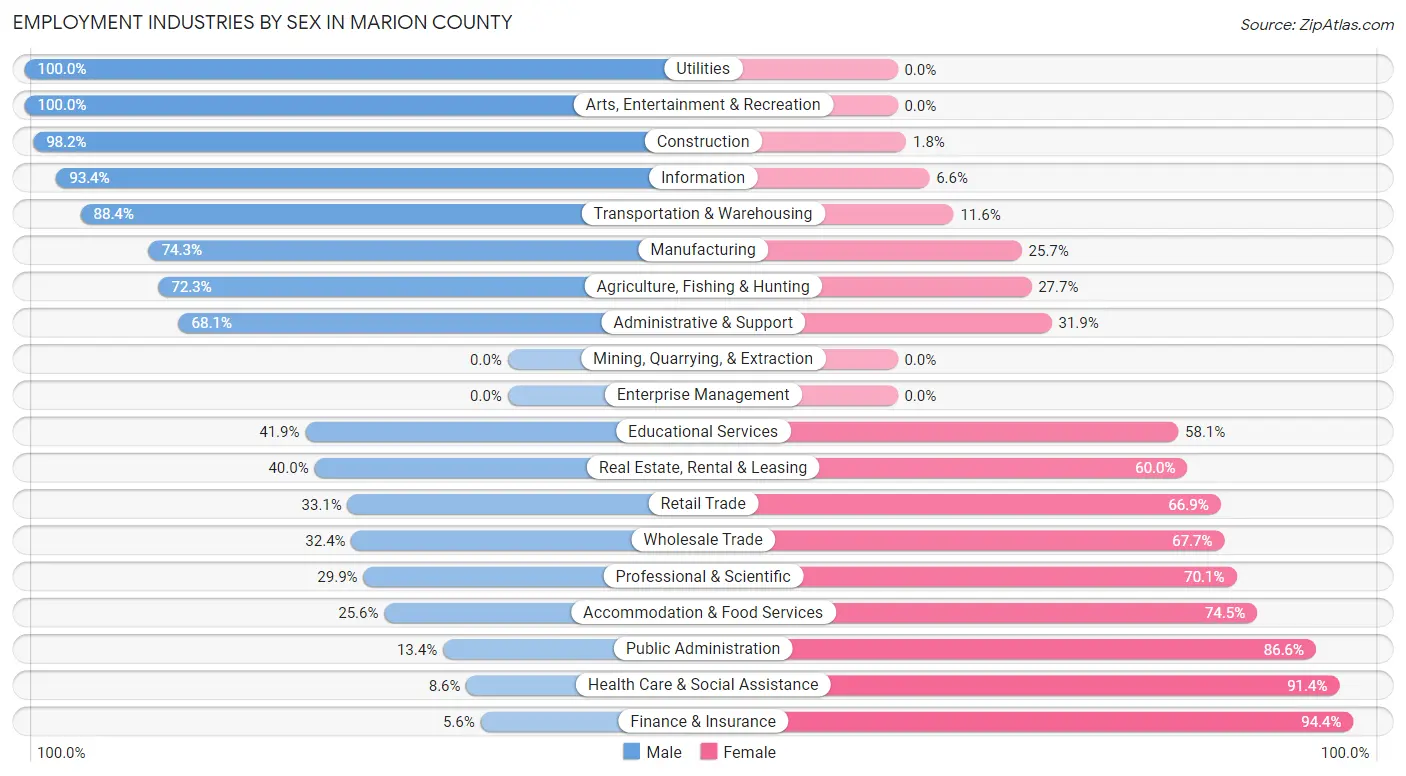
Employment Industries by Sex in Marion County
The Marion County industries that see more men than women are Utilities (100.0%), Arts, Entertainment & Recreation (100.0%), and Construction (98.2%), whereas the industries that tend to have a higher number of women are Finance & Insurance (94.4%), Health Care & Social Assistance (91.4%), and Public Administration (86.6%).
| Industry | Male | Female |
| Agriculture, Fishing & Hunting | 107 (72.3%) | 41 (27.7%) |
| Mining, Quarrying, & Extraction | 0 (0.0%) | 0 (0.0%) |
| Construction | 220 (98.2%) | 4 (1.8%) |
| Manufacturing | 370 (74.3%) | 128 (25.7%) |
| Wholesale Trade | 22 (32.4%) | 46 (67.6%) |
| Retail Trade | 115 (33.1%) | 232 (66.9%) |
| Transportation & Warehousing | 160 (88.4%) | 21 (11.6%) |
| Utilities | 19 (100.0%) | 0 (0.0%) |
| Information | 71 (93.4%) | 5 (6.6%) |
| Finance & Insurance | 4 (5.6%) | 67 (94.4%) |
| Real Estate, Rental & Leasing | 4 (40.0%) | 6 (60.0%) |
| Professional & Scientific | 23 (29.9%) | 54 (70.1%) |
| Enterprise Management | 0 (0.0%) | 0 (0.0%) |
| Administrative & Support | 79 (68.1%) | 37 (31.9%) |
| Educational Services | 88 (41.9%) | 122 (58.1%) |
| Health Care & Social Assistance | 32 (8.6%) | 342 (91.4%) |
| Arts, Entertainment & Recreation | 39 (100.0%) | 0 (0.0%) |
| Accommodation & Food Services | 35 (25.6%) | 102 (74.5%) |
| Public Administration | 13 (13.4%) | 84 (86.6%) |
| Total | 1,493 (52.8%) | 1,333 (47.2%) |
Education in Marion County
School Enrollment in Marion County
The most common levels of schooling among the 1,527 students in Marion County are middle school (392 | 25.7%), elementary school (391 | 25.6%), and high school (350 | 22.9%).
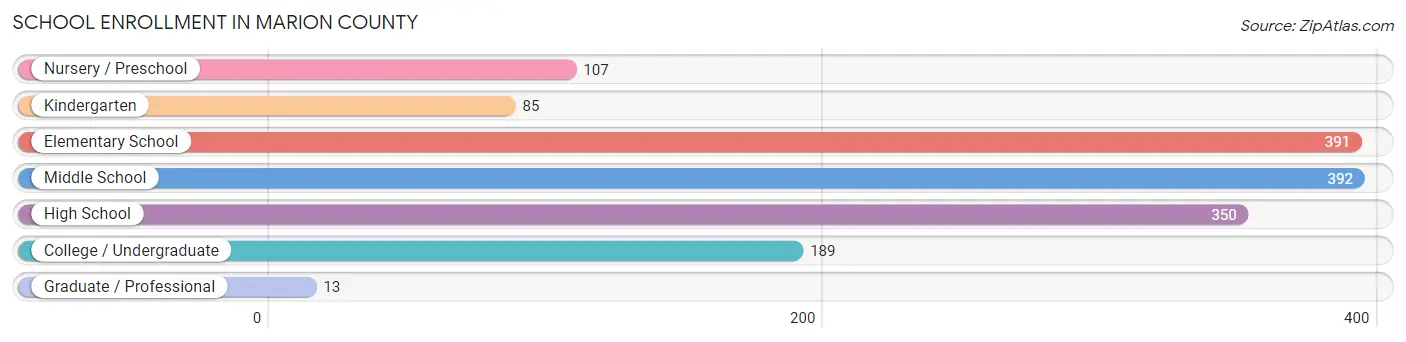
| School Level | # Students | % Students |
| Nursery / Preschool | 107 | 7.0% |
| Kindergarten | 85 | 5.6% |
| Elementary School | 391 | 25.6% |
| Middle School | 392 | 25.7% |
| High School | 350 | 22.9% |
| College / Undergraduate | 189 | 12.4% |
| Graduate / Professional | 13 | 0.9% |
| Total | 1,527 | 100.0% |
School Enrollment by Age by Funding Source in Marion County
Out of a total of 1,527 students who are enrolled in schools in Marion County, 192 (12.6%) attend a private institution, while the remaining 1,335 (87.4%) are enrolled in public schools. The age group of 3 to 4 year olds has the highest likelihood of being enrolled in private schools, with 21 (30.9% in the age bracket) enrolled. Conversely, the age group of 18 to 19 year olds has the lowest likelihood of being enrolled in a private school, with 173 (100.0% in the age bracket) attending a public institution.
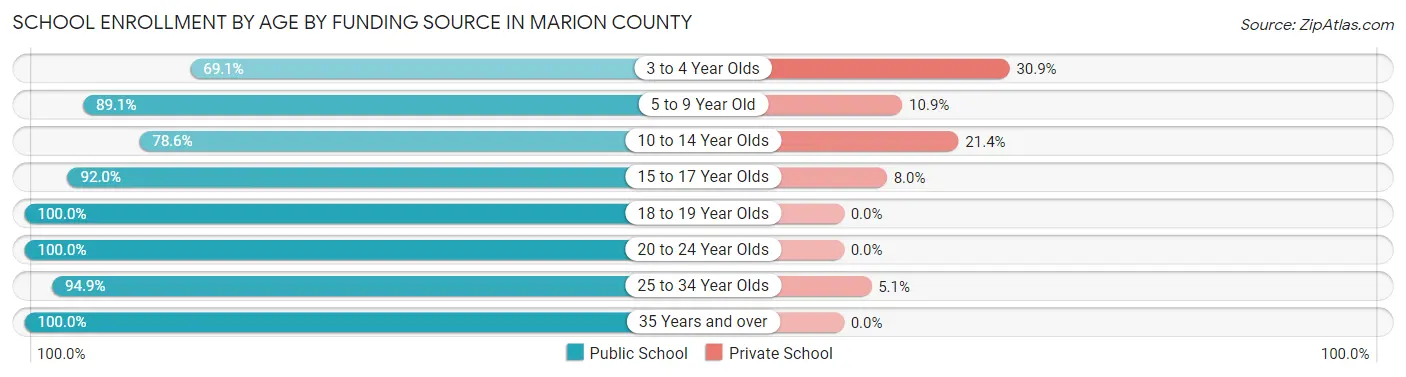
| Age Bracket | Public School | Private School |
| 3 to 4 Year Olds | 47 (69.1%) | 21 (30.9%) |
| 5 to 9 Year Old | 450 (89.1%) | 55 (10.9%) |
| 10 to 14 Year Olds | 368 (78.6%) | 100 (21.4%) |
| 15 to 17 Year Olds | 172 (92.0%) | 15 (8.0%) |
| 18 to 19 Year Olds | 173 (100.0%) | 0 (0.0%) |
| 20 to 24 Year Olds | 79 (100.0%) | 0 (0.0%) |
| 25 to 34 Year Olds | 37 (94.9%) | 2 (5.1%) |
| 35 Years and over | 8 (100.0%) | 0 (0.0%) |
| Total | 1,335 (87.4%) | 192 (12.6%) |
Educational Attainment by Field of Study in Marion County
Business (221 | 31.2%), science & technology (127 | 17.9%), education (64 | 9.0%), liberal arts & history (64 | 9.0%), and psychology (62 | 8.8%) are the most common fields of study among 708 individuals in Marion County who have obtained a bachelor's degree or higher.
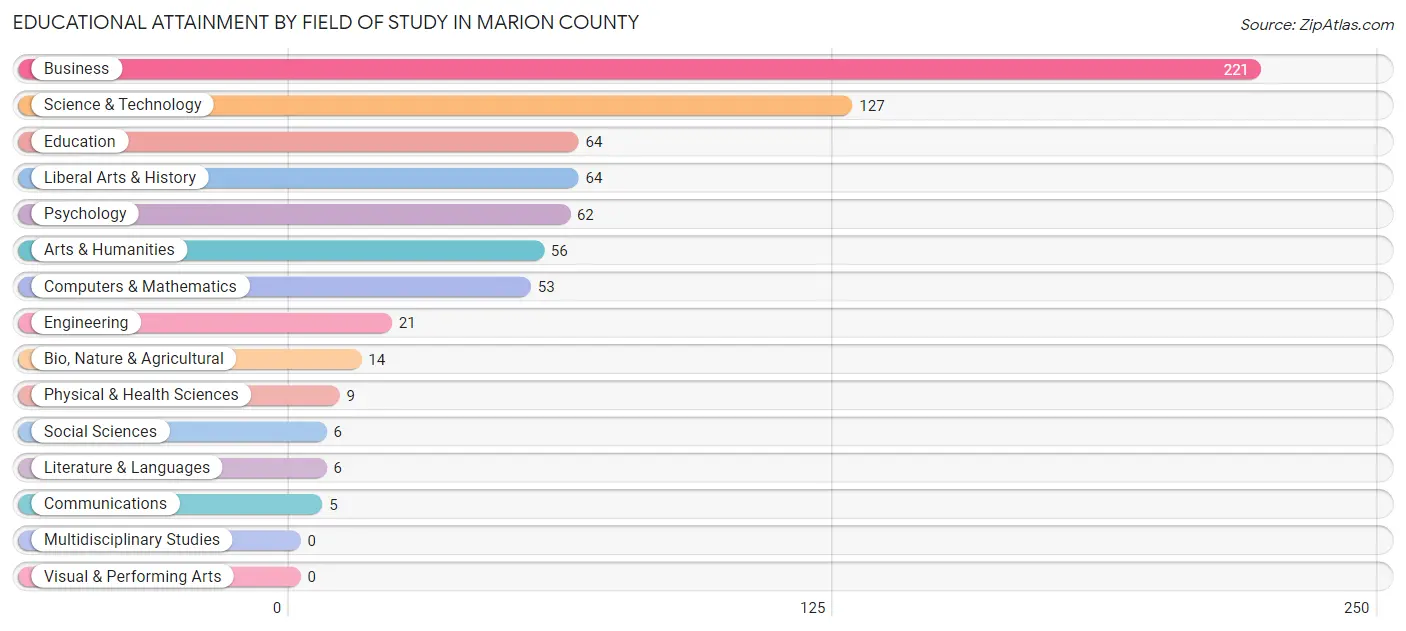
| Field of Study | # Graduates | % Graduates |
| Computers & Mathematics | 53 | 7.5% |
| Bio, Nature & Agricultural | 14 | 2.0% |
| Physical & Health Sciences | 9 | 1.3% |
| Psychology | 62 | 8.8% |
| Social Sciences | 6 | 0.9% |
| Engineering | 21 | 3.0% |
| Multidisciplinary Studies | 0 | 0.0% |
| Science & Technology | 127 | 17.9% |
| Business | 221 | 31.2% |
| Education | 64 | 9.0% |
| Literature & Languages | 6 | 0.9% |
| Liberal Arts & History | 64 | 9.0% |
| Visual & Performing Arts | 0 | 0.0% |
| Communications | 5 | 0.7% |
| Arts & Humanities | 56 | 7.9% |
| Total | 708 | 100.0% |
Transportation & Commute in Marion County
Vehicle Availability by Sex in Marion County
The most prevalent vehicle ownership categories in Marion County are males with 2 vehicles (613, accounting for 41.3%) and females with 2 vehicles (332, making up 46.4%).
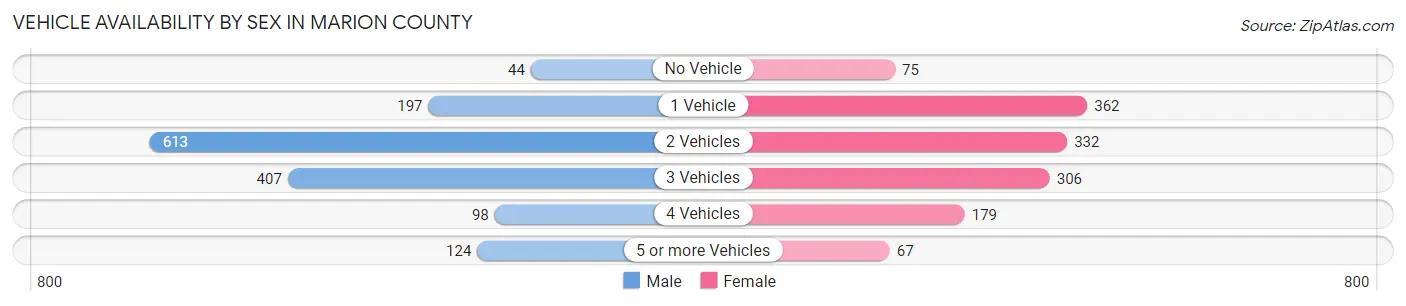
| Vehicles Available | Male | Female |
| No Vehicle | 44 (3.0%) | 75 (5.7%) |
| 1 Vehicle | 197 (13.3%) | 362 (27.4%) |
| 2 Vehicles | 613 (41.3%) | 332 (25.1%) |
| 3 Vehicles | 407 (27.4%) | 306 (23.2%) |
| 4 Vehicles | 98 (6.6%) | 179 (13.6%) |
| 5 or more Vehicles | 124 (8.4%) | 67 (5.1%) |
| Total | 1,483 (100.0%) | 1,321 (100.0%) |
Commute Time in Marion County
The most frequently occuring commute durations in Marion County are 45 to 59 minutes (794 commuters, 30.0%), 15 to 19 minutes (280 commuters, 10.6%), and 5 to 9 minutes (254 commuters, 9.6%).
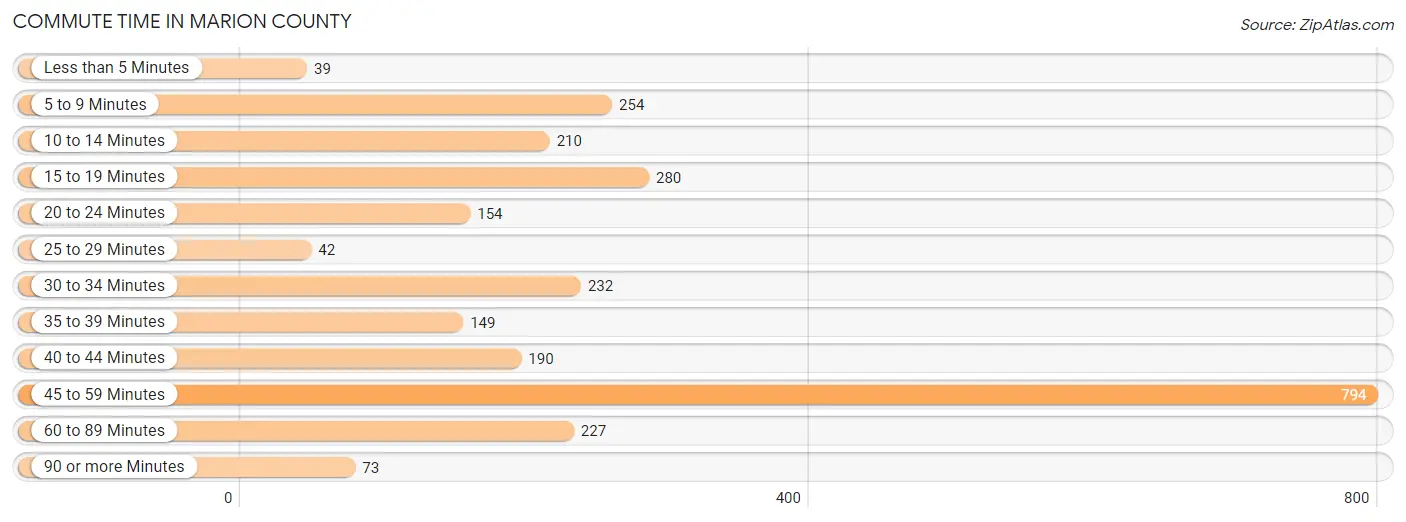
| Commute Time | # Commuters | % Commuters |
| Less than 5 Minutes | 39 | 1.5% |
| 5 to 9 Minutes | 254 | 9.6% |
| 10 to 14 Minutes | 210 | 7.9% |
| 15 to 19 Minutes | 280 | 10.6% |
| 20 to 24 Minutes | 154 | 5.8% |
| 25 to 29 Minutes | 42 | 1.6% |
| 30 to 34 Minutes | 232 | 8.8% |
| 35 to 39 Minutes | 149 | 5.6% |
| 40 to 44 Minutes | 190 | 7.2% |
| 45 to 59 Minutes | 794 | 30.0% |
| 60 to 89 Minutes | 227 | 8.6% |
| 90 or more Minutes | 73 | 2.8% |
Commute Time by Sex in Marion County
The most common commute times in Marion County are 45 to 59 minutes (416 commuters, 29.2%) for males and 45 to 59 minutes (378 commuters, 31.0%) for females.
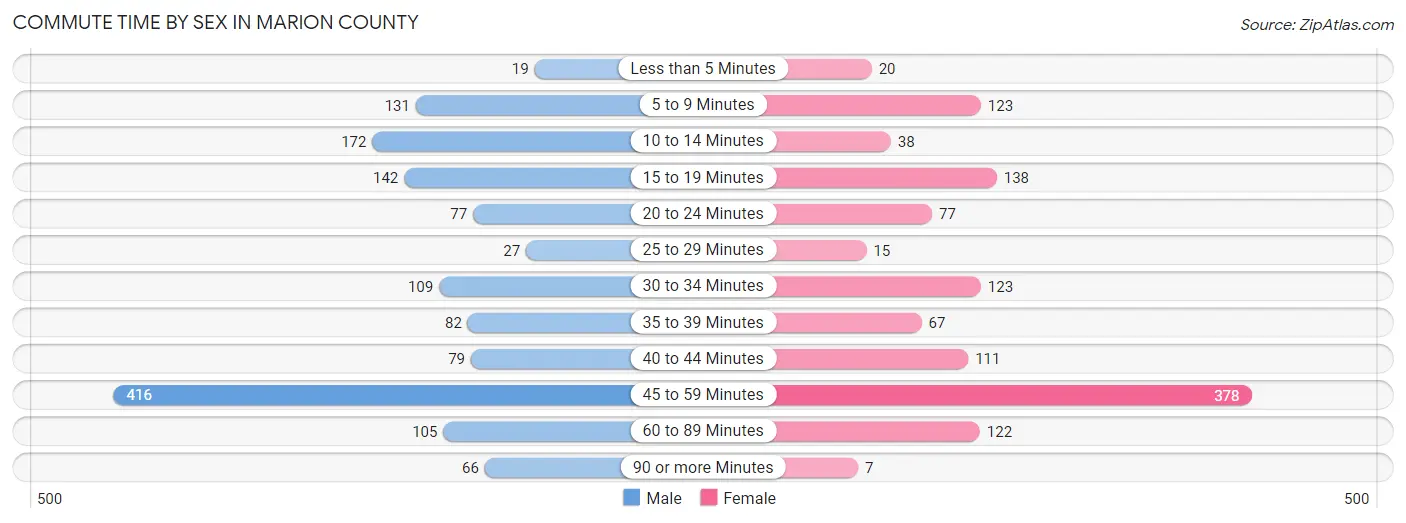
| Commute Time | Male | Female |
| Less than 5 Minutes | 19 (1.3%) | 20 (1.6%) |
| 5 to 9 Minutes | 131 (9.2%) | 123 (10.1%) |
| 10 to 14 Minutes | 172 (12.1%) | 38 (3.1%) |
| 15 to 19 Minutes | 142 (10.0%) | 138 (11.3%) |
| 20 to 24 Minutes | 77 (5.4%) | 77 (6.3%) |
| 25 to 29 Minutes | 27 (1.9%) | 15 (1.2%) |
| 30 to 34 Minutes | 109 (7.6%) | 123 (10.1%) |
| 35 to 39 Minutes | 82 (5.8%) | 67 (5.5%) |
| 40 to 44 Minutes | 79 (5.5%) | 111 (9.1%) |
| 45 to 59 Minutes | 416 (29.2%) | 378 (31.0%) |
| 60 to 89 Minutes | 105 (7.4%) | 122 (10.0%) |
| 90 or more Minutes | 66 (4.6%) | 7 (0.6%) |
Time of Departure to Work by Sex in Marion County
The most frequent times of departure to work in Marion County are 7:00 AM to 7:29 AM (371, 26.0%) for males and 7:00 AM to 7:29 AM (337, 27.7%) for females.
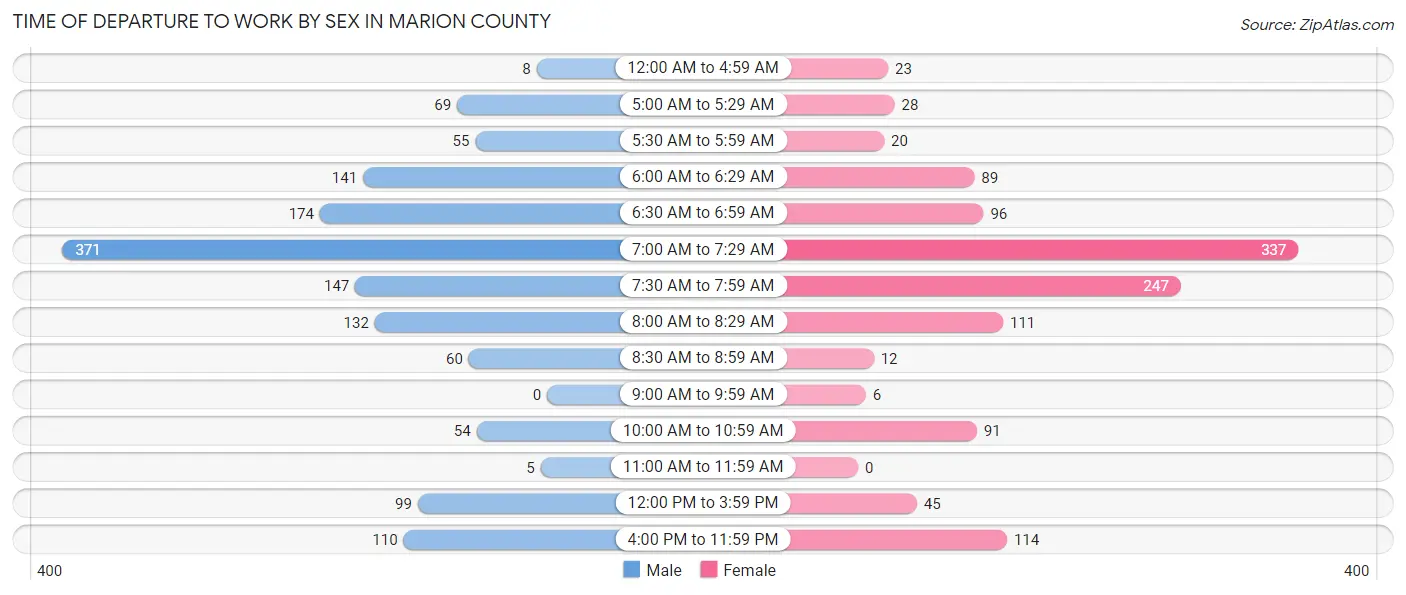
| Time of Departure | Male | Female |
| 12:00 AM to 4:59 AM | 8 (0.6%) | 23 (1.9%) |
| 5:00 AM to 5:29 AM | 69 (4.8%) | 28 (2.3%) |
| 5:30 AM to 5:59 AM | 55 (3.9%) | 20 (1.6%) |
| 6:00 AM to 6:29 AM | 141 (9.9%) | 89 (7.3%) |
| 6:30 AM to 6:59 AM | 174 (12.2%) | 96 (7.9%) |
| 7:00 AM to 7:29 AM | 371 (26.0%) | 337 (27.7%) |
| 7:30 AM to 7:59 AM | 147 (10.3%) | 247 (20.3%) |
| 8:00 AM to 8:29 AM | 132 (9.3%) | 111 (9.1%) |
| 8:30 AM to 8:59 AM | 60 (4.2%) | 12 (1.0%) |
| 9:00 AM to 9:59 AM | 0 (0.0%) | 6 (0.5%) |
| 10:00 AM to 10:59 AM | 54 (3.8%) | 91 (7.5%) |
| 11:00 AM to 11:59 AM | 5 (0.4%) | 0 (0.0%) |
| 12:00 PM to 3:59 PM | 99 (7.0%) | 45 (3.7%) |
| 4:00 PM to 11:59 PM | 110 (7.7%) | 114 (9.3%) |
| Total | 1,425 (100.0%) | 1,219 (100.0%) |
Housing Occupancy in Marion County
Occupancy by Ownership in Marion County
Of the total 2,872 dwellings in Marion County, owner-occupied units account for 2,209 (76.9%), while renter-occupied units make up 663 (23.1%).
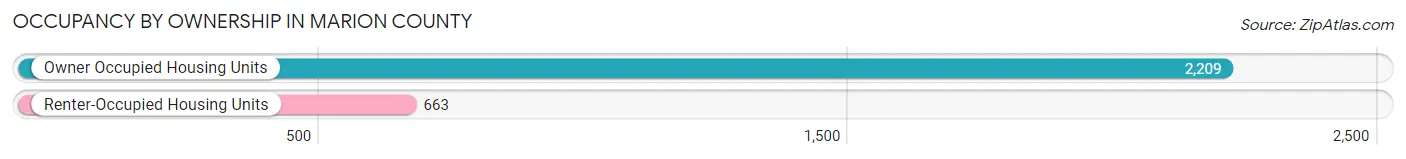
| Occupancy | # Housing Units | % Housing Units |
| Owner Occupied Housing Units | 2,209 | 76.9% |
| Renter-Occupied Housing Units | 663 | 23.1% |
| Total Occupied Housing Units | 2,872 | 100.0% |
Occupancy by Household Size in Marion County
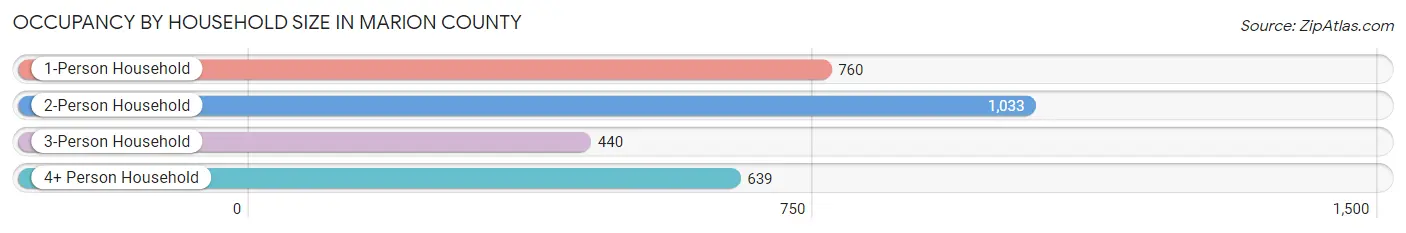
| Household Size | # Housing Units | % Housing Units |
| 1-Person Household | 760 | 26.5% |
| 2-Person Household | 1,033 | 36.0% |
| 3-Person Household | 440 | 15.3% |
| 4+ Person Household | 639 | 22.3% |
| Total Housing Units | 2,872 | 100.0% |
Occupancy by Ownership by Household Size in Marion County
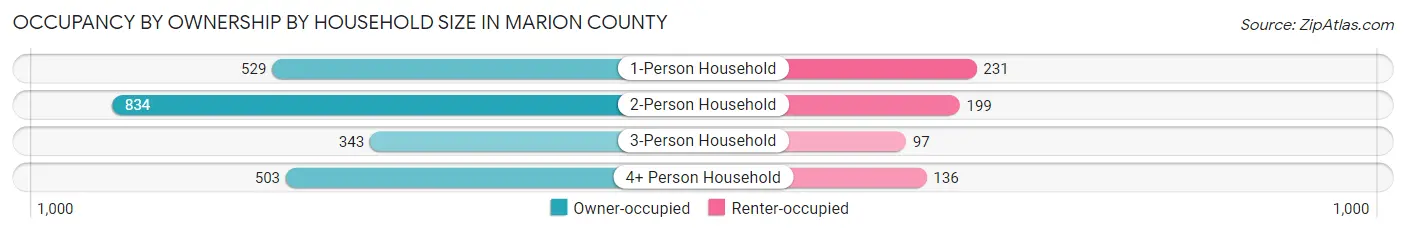
| Household Size | Owner-occupied | Renter-occupied |
| 1-Person Household | 529 (69.6%) | 231 (30.4%) |
| 2-Person Household | 834 (80.7%) | 199 (19.3%) |
| 3-Person Household | 343 (77.9%) | 97 (22.1%) |
| 4+ Person Household | 503 (78.7%) | 136 (21.3%) |
| Total Housing Units | 2,209 (76.9%) | 663 (23.1%) |
Occupancy by Educational Attainment in Marion County
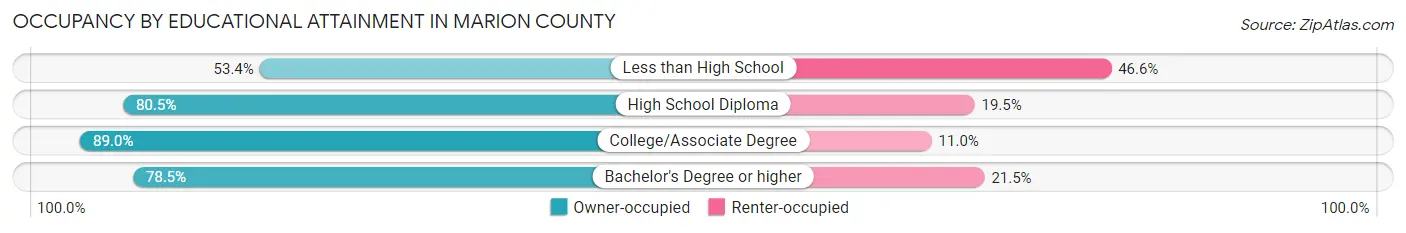
| Household Size | Owner-occupied | Renter-occupied |
| Less than High School | 322 (53.4%) | 281 (46.6%) |
| High School Diploma | 916 (80.5%) | 222 (19.5%) |
| College/Associate Degree | 704 (89.0%) | 87 (11.0%) |
| Bachelor's Degree or higher | 267 (78.5%) | 73 (21.5%) |
Occupancy by Age of Householder in Marion County
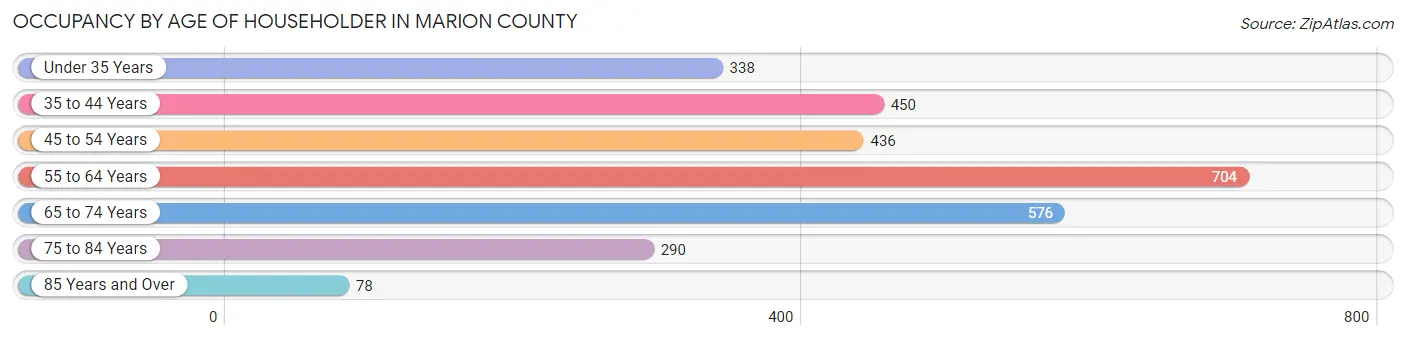
| Age Bracket | # Households | % Households |
| Under 35 Years | 338 | 11.8% |
| 35 to 44 Years | 450 | 15.7% |
| 45 to 54 Years | 436 | 15.2% |
| 55 to 64 Years | 704 | 24.5% |
| 65 to 74 Years | 576 | 20.1% |
| 75 to 84 Years | 290 | 10.1% |
| 85 Years and Over | 78 | 2.7% |
| Total | 2,872 | 100.0% |
Housing Finances in Marion County
Median Income by Occupancy in Marion County
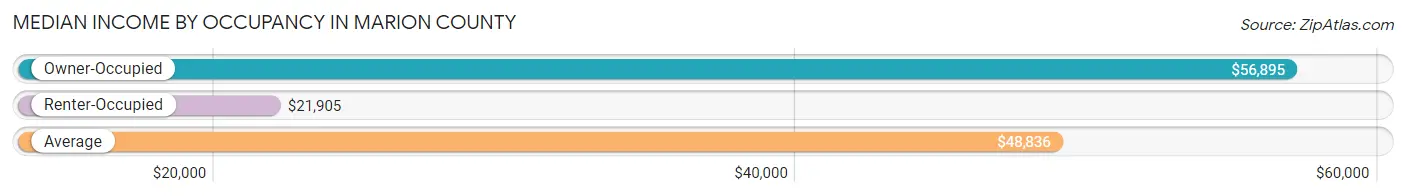
| Occupancy Type | # Households | Median Income |
| Owner-Occupied | 2,209 (76.9%) | $56,895 |
| Renter-Occupied | 663 (23.1%) | $21,905 |
| Average | 2,872 (100.0%) | $48,836 |
Occupancy by Householder Income Bracket in Marion County
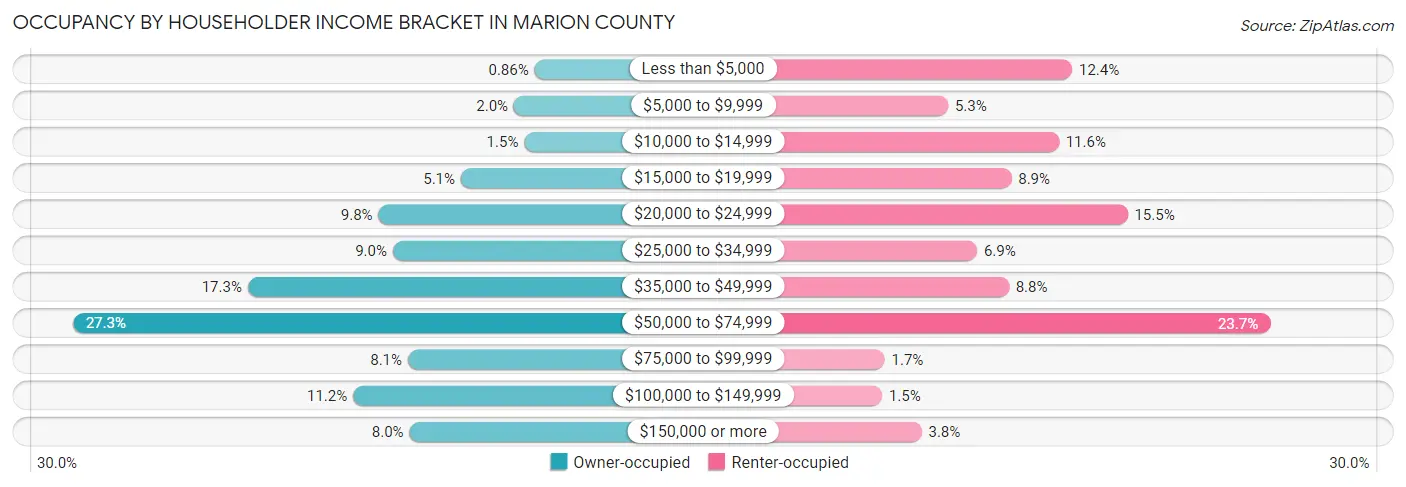
| Income Bracket | Owner-occupied | Renter-occupied |
| Less than $5,000 | 19 (0.9%) | 82 (12.4%) |
| $5,000 to $9,999 | 45 (2.0%) | 35 (5.3%) |
| $10,000 to $14,999 | 32 (1.5%) | 77 (11.6%) |
| $15,000 to $19,999 | 112 (5.1%) | 59 (8.9%) |
| $20,000 to $24,999 | 216 (9.8%) | 103 (15.5%) |
| $25,000 to $34,999 | 198 (9.0%) | 46 (6.9%) |
| $35,000 to $49,999 | 381 (17.2%) | 58 (8.7%) |
| $50,000 to $74,999 | 602 (27.3%) | 157 (23.7%) |
| $75,000 to $99,999 | 179 (8.1%) | 11 (1.7%) |
| $100,000 to $149,999 | 248 (11.2%) | 10 (1.5%) |
| $150,000 or more | 177 (8.0%) | 25 (3.8%) |
| Total | 2,209 (100.0%) | 663 (100.0%) |
Monthly Housing Cost Tiers in Marion County
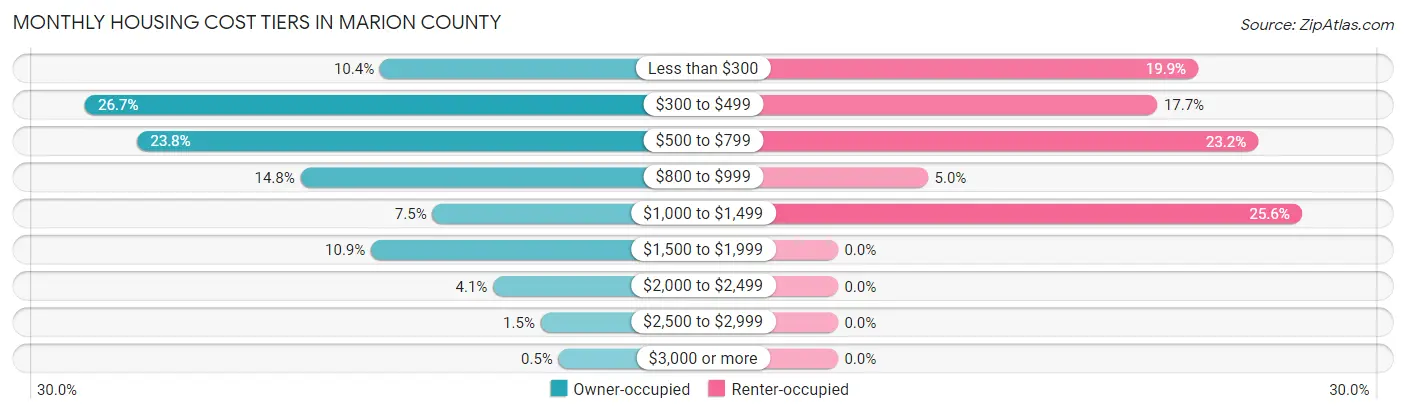
| Monthly Cost | Owner-occupied | Renter-occupied |
| Less than $300 | 229 (10.4%) | 132 (19.9%) |
| $300 to $499 | 589 (26.7%) | 117 (17.6%) |
| $500 to $799 | 525 (23.8%) | 154 (23.2%) |
| $800 to $999 | 326 (14.8%) | 33 (5.0%) |
| $1,000 to $1,499 | 165 (7.5%) | 170 (25.6%) |
| $1,500 to $1,999 | 240 (10.9%) | 0 (0.0%) |
| $2,000 to $2,499 | 91 (4.1%) | 0 (0.0%) |
| $2,500 to $2,999 | 33 (1.5%) | 0 (0.0%) |
| $3,000 or more | 11 (0.5%) | 0 (0.0%) |
| Total | 2,209 (100.0%) | 663 (100.0%) |
Physical Housing Characteristics in Marion County
Housing Structures in Marion County
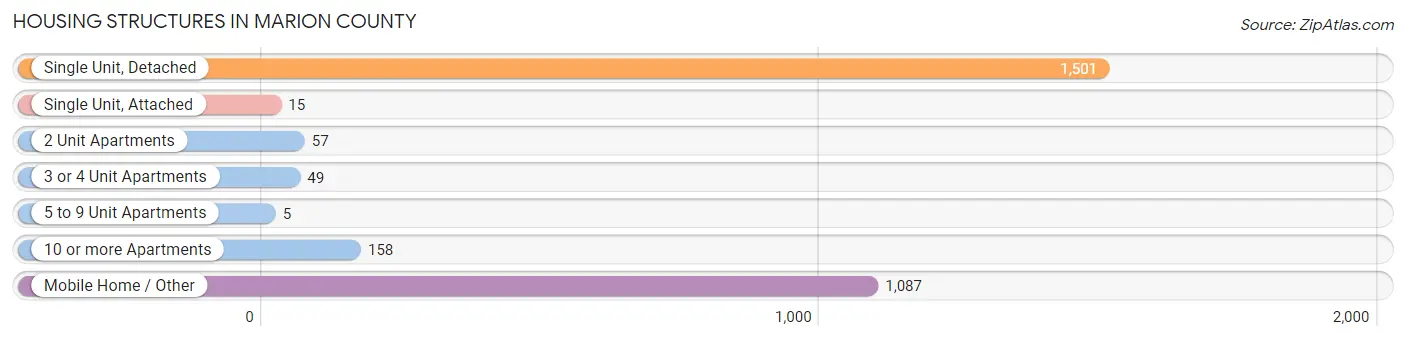
| Structure Type | # Housing Units | % Housing Units |
| Single Unit, Detached | 1,501 | 52.3% |
| Single Unit, Attached | 15 | 0.5% |
| 2 Unit Apartments | 57 | 2.0% |
| 3 or 4 Unit Apartments | 49 | 1.7% |
| 5 to 9 Unit Apartments | 5 | 0.2% |
| 10 or more Apartments | 158 | 5.5% |
| Mobile Home / Other | 1,087 | 37.9% |
| Total | 2,872 | 100.0% |
Housing Structures by Occupancy in Marion County
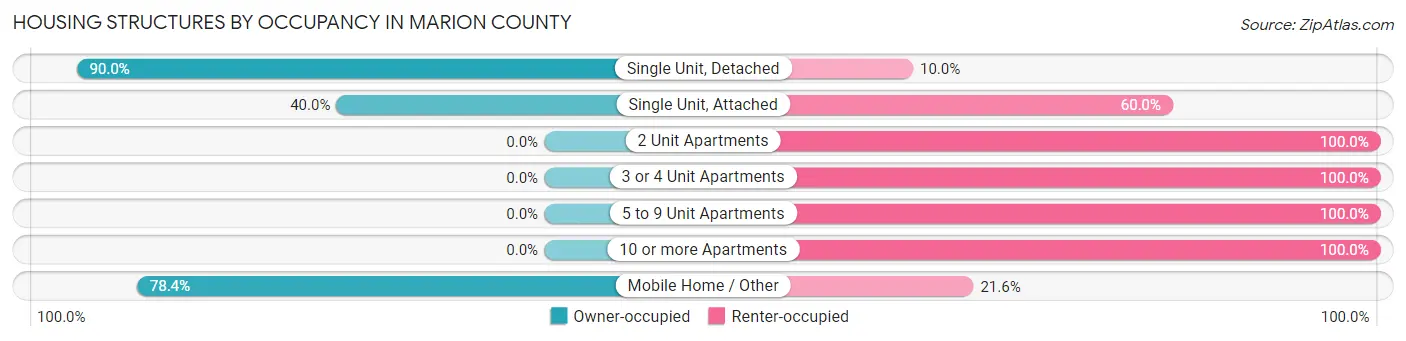
| Structure Type | Owner-occupied | Renter-occupied |
| Single Unit, Detached | 1,351 (90.0%) | 150 (10.0%) |
| Single Unit, Attached | 6 (40.0%) | 9 (60.0%) |
| 2 Unit Apartments | 0 (0.0%) | 57 (100.0%) |
| 3 or 4 Unit Apartments | 0 (0.0%) | 49 (100.0%) |
| 5 to 9 Unit Apartments | 0 (0.0%) | 5 (100.0%) |
| 10 or more Apartments | 0 (0.0%) | 158 (100.0%) |
| Mobile Home / Other | 852 (78.4%) | 235 (21.6%) |
| Total | 2,209 (76.9%) | 663 (23.1%) |
Housing Structures by Number of Rooms in Marion County
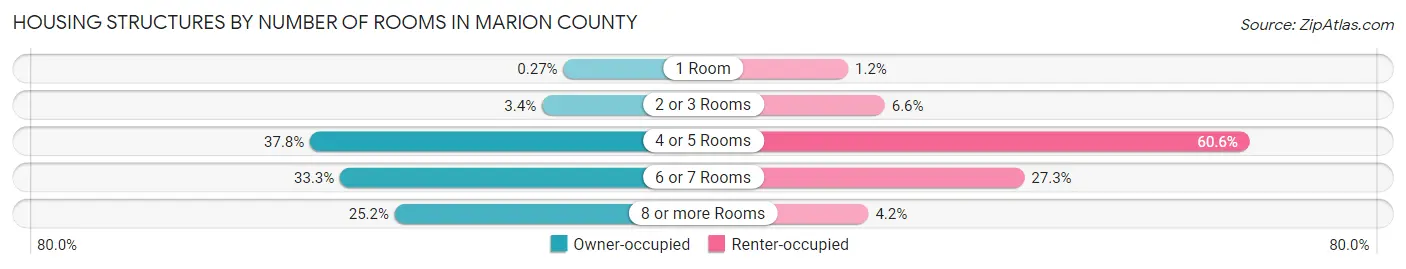
| Number of Rooms | Owner-occupied | Renter-occupied |
| 1 Room | 6 (0.3%) | 8 (1.2%) |
| 2 or 3 Rooms | 76 (3.4%) | 44 (6.6%) |
| 4 or 5 Rooms | 834 (37.8%) | 402 (60.6%) |
| 6 or 7 Rooms | 736 (33.3%) | 181 (27.3%) |
| 8 or more Rooms | 557 (25.2%) | 28 (4.2%) |
| Total | 2,209 (100.0%) | 663 (100.0%) |
Housing Structure by Heating Type in Marion County
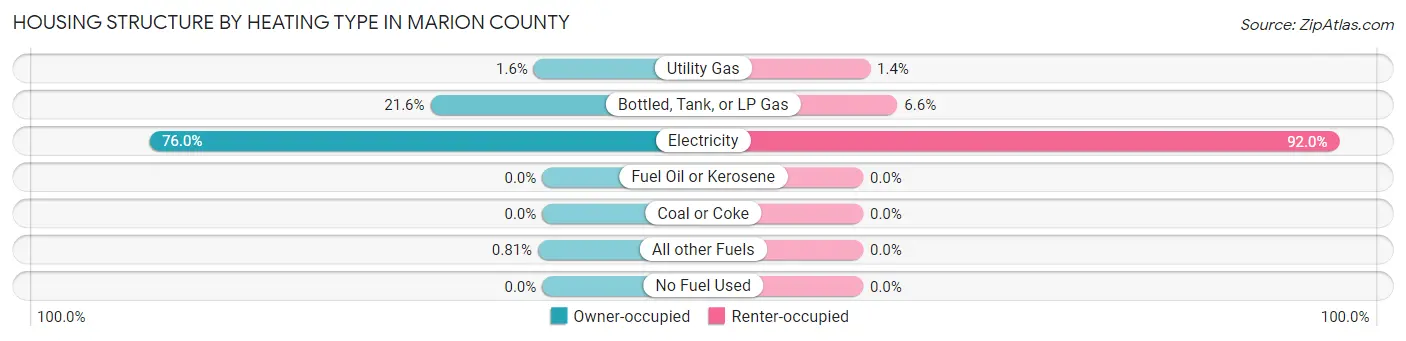
| Heating Type | Owner-occupied | Renter-occupied |
| Utility Gas | 36 (1.6%) | 9 (1.4%) |
| Bottled, Tank, or LP Gas | 477 (21.6%) | 44 (6.6%) |
| Electricity | 1,678 (76.0%) | 610 (92.0%) |
| Fuel Oil or Kerosene | 0 (0.0%) | 0 (0.0%) |
| Coal or Coke | 0 (0.0%) | 0 (0.0%) |
| All other Fuels | 18 (0.8%) | 0 (0.0%) |
| No Fuel Used | 0 (0.0%) | 0 (0.0%) |
| Total | 2,209 (100.0%) | 663 (100.0%) |
Household Vehicle Usage in Marion County
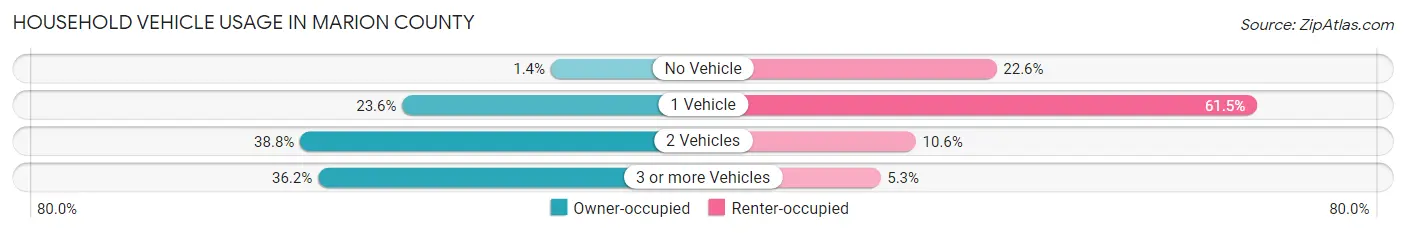
| Vehicles per Household | Owner-occupied | Renter-occupied |
| No Vehicle | 31 (1.4%) | 150 (22.6%) |
| 1 Vehicle | 521 (23.6%) | 408 (61.5%) |
| 2 Vehicles | 858 (38.8%) | 70 (10.6%) |
| 3 or more Vehicles | 799 (36.2%) | 35 (5.3%) |
| Total | 2,209 (100.0%) | 663 (100.0%) |
Real Estate & Mortgages in Marion County
Real Estate and Mortgage Overview in Marion County
| Characteristic | Without Mortgage | With Mortgage |
| Housing Units | 1,215 | 994 |
| Median Property Value | $92,400 | $196,900 |
| Median Household Income | $43,082 | $144 |
| Monthly Housing Costs | $405 | $11 |
| Real Estate Taxes | $656 | $41 |
Property Value by Mortgage Status in Marion County
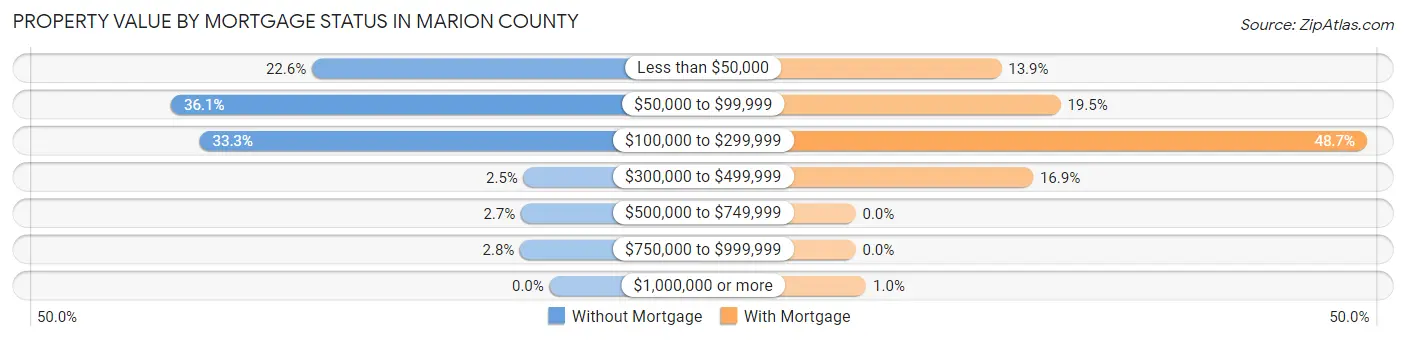
| Property Value | Without Mortgage | With Mortgage |
| Less than $50,000 | 275 (22.6%) | 138 (13.9%) |
| $50,000 to $99,999 | 438 (36.0%) | 194 (19.5%) |
| $100,000 to $299,999 | 405 (33.3%) | 484 (48.7%) |
| $300,000 to $499,999 | 30 (2.5%) | 168 (16.9%) |
| $500,000 to $749,999 | 33 (2.7%) | 0 (0.0%) |
| $750,000 to $999,999 | 34 (2.8%) | 0 (0.0%) |
| $1,000,000 or more | 0 (0.0%) | 10 (1.0%) |
| Total | 1,215 (100.0%) | 994 (100.0%) |
Household Income by Mortgage Status in Marion County
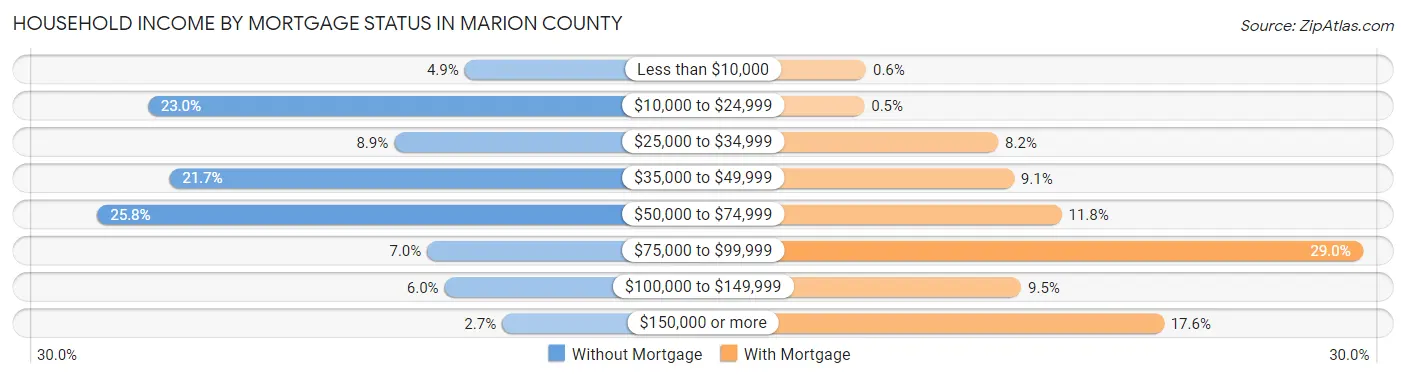
| Household Income | Without Mortgage | With Mortgage |
| Less than $10,000 | 59 (4.9%) | 6 (0.6%) |
| $10,000 to $24,999 | 279 (23.0%) | 5 (0.5%) |
| $25,000 to $34,999 | 108 (8.9%) | 81 (8.2%) |
| $35,000 to $49,999 | 264 (21.7%) | 90 (9.0%) |
| $50,000 to $74,999 | 314 (25.8%) | 117 (11.8%) |
| $75,000 to $99,999 | 85 (7.0%) | 288 (29.0%) |
| $100,000 to $149,999 | 73 (6.0%) | 94 (9.5%) |
| $150,000 or more | 33 (2.7%) | 175 (17.6%) |
| Total | 1,215 (100.0%) | 994 (100.0%) |
Property Value to Household Income Ratio in Marion County
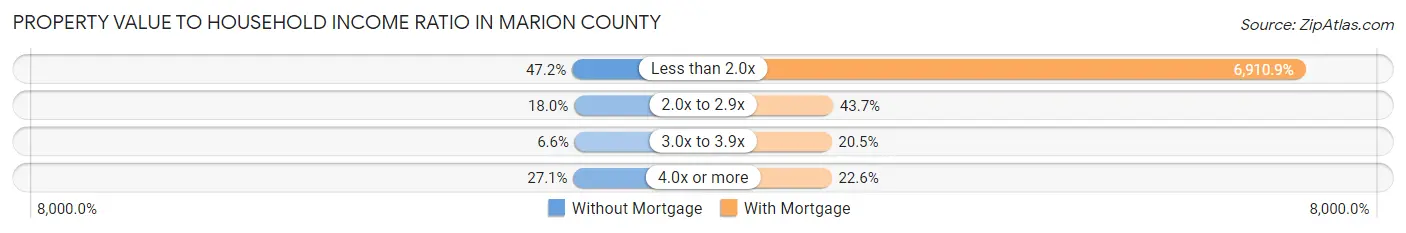
| Value-to-Income Ratio | Without Mortgage | With Mortgage |
| Less than 2.0x | 573 (47.2%) | 68,694 (6,910.9%) |
| 2.0x to 2.9x | 219 (18.0%) | 434 (43.7%) |
| 3.0x to 3.9x | 80 (6.6%) | 204 (20.5%) |
| 4.0x or more | 329 (27.1%) | 225 (22.6%) |
| Total | 1,215 (100.0%) | 994 (100.0%) |
Real Estate Taxes by Mortgage Status in Marion County
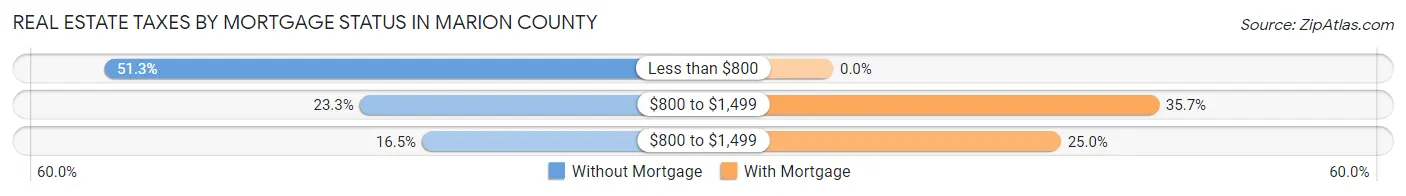
| Property Taxes | Without Mortgage | With Mortgage |
| Less than $800 | 623 (51.3%) | 0 (0.0%) |
| $800 to $1,499 | 283 (23.3%) | 355 (35.7%) |
| $800 to $1,499 | 200 (16.5%) | 248 (24.9%) |
| Total | 1,215 (100.0%) | 994 (100.0%) |
Health & Disability in Marion County
Health Insurance Coverage by Age in Marion County
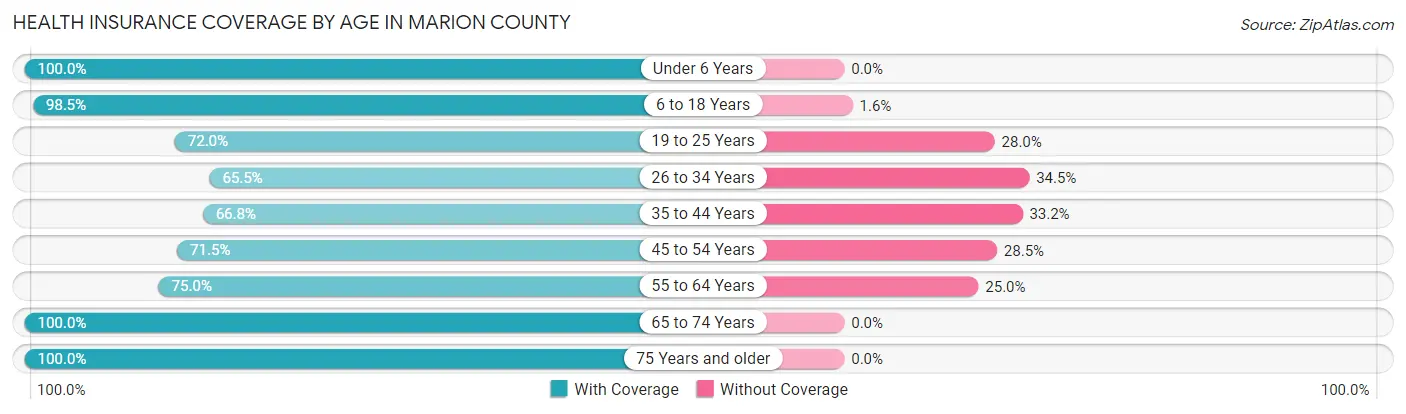
| Age Bracket | With Coverage | Without Coverage |
| Under 6 Years | 447 (100.0%) | 0 (0.0%) |
| 6 to 18 Years | 1,205 (98.5%) | 19 (1.5%) |
| 19 to 25 Years | 380 (72.0%) | 148 (28.0%) |
| 26 to 34 Years | 439 (65.5%) | 231 (34.5%) |
| 35 to 44 Years | 601 (66.8%) | 299 (33.2%) |
| 45 to 54 Years | 616 (71.5%) | 245 (28.5%) |
| 55 to 64 Years | 930 (75.0%) | 310 (25.0%) |
| 65 to 74 Years | 914 (100.0%) | 0 (0.0%) |
| 75 Years and older | 629 (100.0%) | 0 (0.0%) |
| Total | 6,161 (83.1%) | 1,252 (16.9%) |
Health Insurance Coverage by Citizenship Status in Marion County
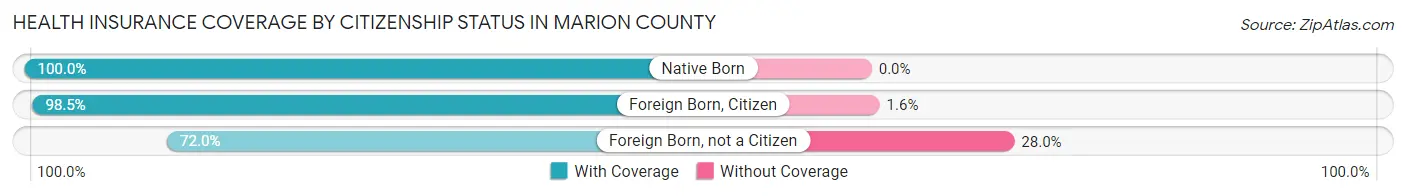
| Citizenship Status | With Coverage | Without Coverage |
| Native Born | 447 (100.0%) | 0 (0.0%) |
| Foreign Born, Citizen | 1,205 (98.5%) | 19 (1.5%) |
| Foreign Born, not a Citizen | 380 (72.0%) | 148 (28.0%) |
Health Insurance Coverage by Household Income in Marion County
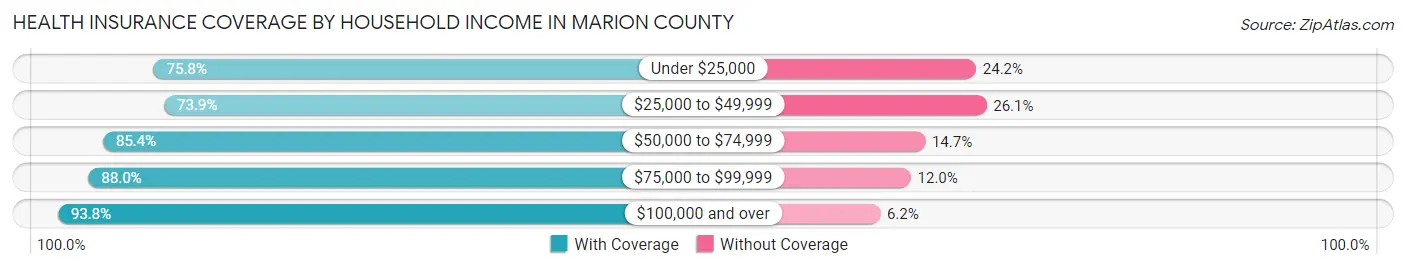
| Household Income | With Coverage | Without Coverage |
| Under $25,000 | 1,088 (75.8%) | 347 (24.2%) |
| $25,000 to $49,999 | 1,187 (73.9%) | 420 (26.1%) |
| $50,000 to $74,999 | 1,771 (85.4%) | 304 (14.6%) |
| $75,000 to $99,999 | 589 (88.0%) | 80 (12.0%) |
| $100,000 and over | 1,524 (93.8%) | 101 (6.2%) |
Public vs Private Health Insurance Coverage by Age in Marion County
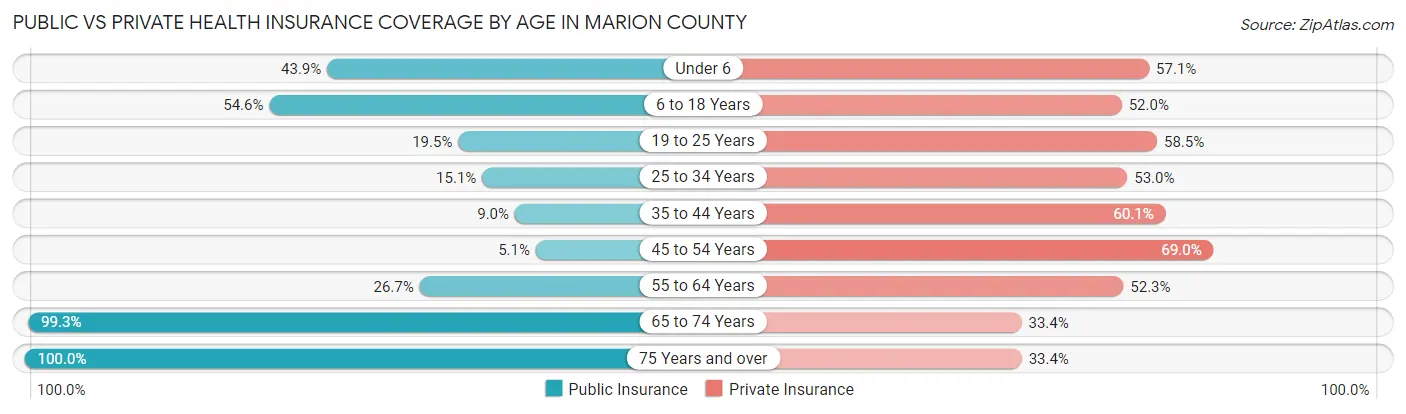
| Age Bracket | Public Insurance | Private Insurance |
| Under 6 | 196 (43.9%) | 255 (57.1%) |
| 6 to 18 Years | 668 (54.6%) | 636 (52.0%) |
| 19 to 25 Years | 103 (19.5%) | 309 (58.5%) |
| 25 to 34 Years | 101 (15.1%) | 355 (53.0%) |
| 35 to 44 Years | 81 (9.0%) | 541 (60.1%) |
| 45 to 54 Years | 44 (5.1%) | 594 (69.0%) |
| 55 to 64 Years | 331 (26.7%) | 648 (52.3%) |
| 65 to 74 Years | 908 (99.3%) | 305 (33.4%) |
| 75 Years and over | 629 (100.0%) | 210 (33.4%) |
| Total | 3,061 (41.3%) | 3,853 (52.0%) |
Disability Status by Sex by Age in Marion County
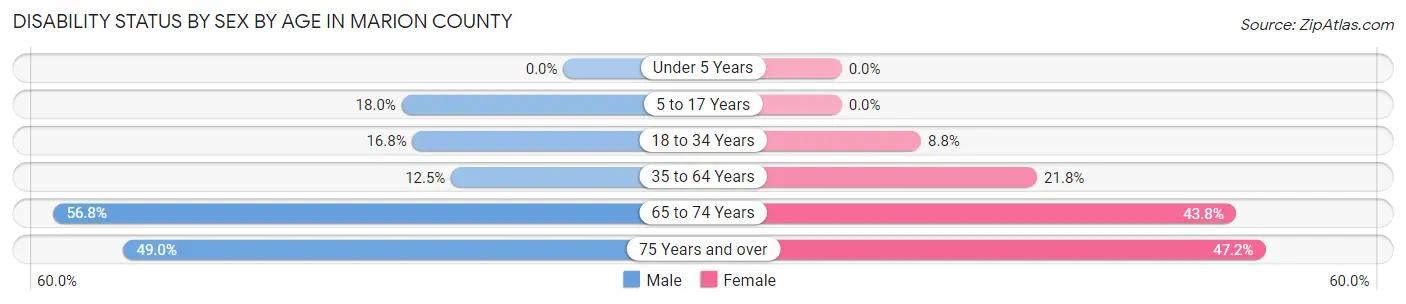
| Age Bracket | Male | Female |
| Under 5 Years | 0 (0.0%) | 0 (0.0%) |
| 5 to 17 Years | 107 (18.0%) | 0 (0.0%) |
| 18 to 34 Years | 125 (16.8%) | 52 (8.8%) |
| 35 to 64 Years | 178 (12.5%) | 343 (21.8%) |
| 65 to 74 Years | 247 (56.8%) | 210 (43.8%) |
| 75 Years and over | 144 (49.0%) | 158 (47.2%) |
Disability Class by Sex by Age in Marion County
Disability Class: Hearing Difficulty
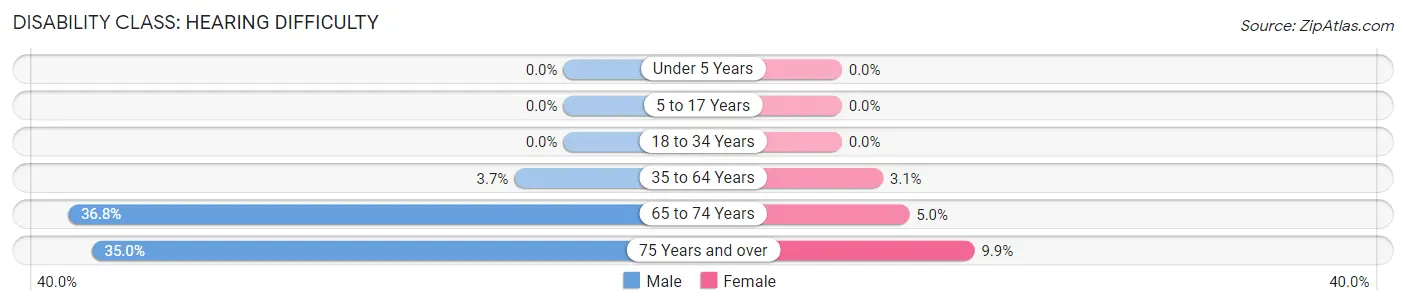
| Age Bracket | Male | Female |
| Under 5 Years | 0 (0.0%) | 0 (0.0%) |
| 5 to 17 Years | 0 (0.0%) | 0 (0.0%) |
| 18 to 34 Years | 0 (0.0%) | 0 (0.0%) |
| 35 to 64 Years | 52 (3.6%) | 48 (3.0%) |
| 65 to 74 Years | 160 (36.8%) | 24 (5.0%) |
| 75 Years and over | 103 (35.0%) | 33 (9.9%) |
Disability Class: Vision Difficulty
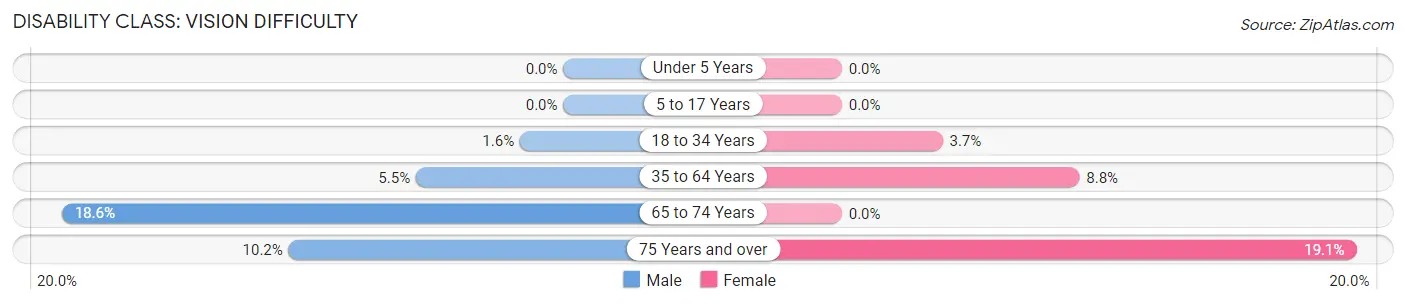
| Age Bracket | Male | Female |
| Under 5 Years | 0 (0.0%) | 0 (0.0%) |
| 5 to 17 Years | 0 (0.0%) | 0 (0.0%) |
| 18 to 34 Years | 12 (1.6%) | 22 (3.7%) |
| 35 to 64 Years | 78 (5.5%) | 139 (8.8%) |
| 65 to 74 Years | 81 (18.6%) | 0 (0.0%) |
| 75 Years and over | 30 (10.2%) | 64 (19.1%) |
Disability Class: Cognitive Difficulty
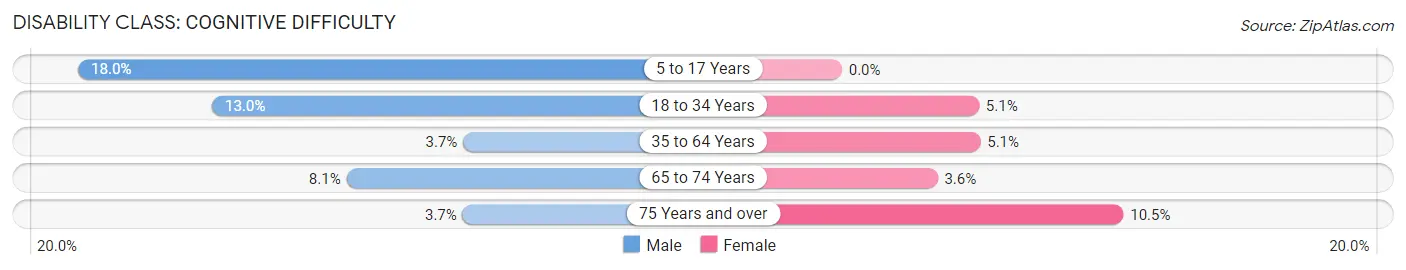
| Age Bracket | Male | Female |
| 5 to 17 Years | 107 (18.0%) | 0 (0.0%) |
| 18 to 34 Years | 97 (13.0%) | 30 (5.1%) |
| 35 to 64 Years | 53 (3.7%) | 81 (5.1%) |
| 65 to 74 Years | 35 (8.1%) | 17 (3.5%) |
| 75 Years and over | 11 (3.7%) | 35 (10.4%) |
Disability Class: Ambulatory Difficulty
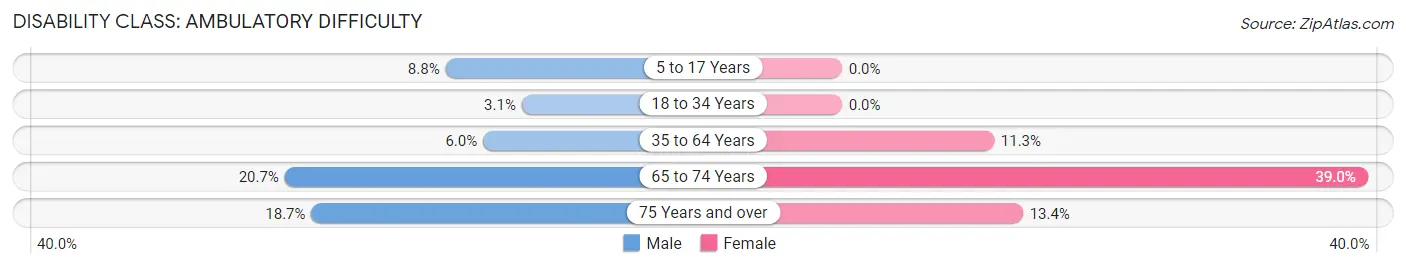
| Age Bracket | Male | Female |
| 5 to 17 Years | 52 (8.7%) | 0 (0.0%) |
| 18 to 34 Years | 23 (3.1%) | 0 (0.0%) |
| 35 to 64 Years | 85 (6.0%) | 178 (11.3%) |
| 65 to 74 Years | 90 (20.7%) | 187 (39.0%) |
| 75 Years and over | 55 (18.7%) | 45 (13.4%) |
Disability Class: Self-Care Difficulty
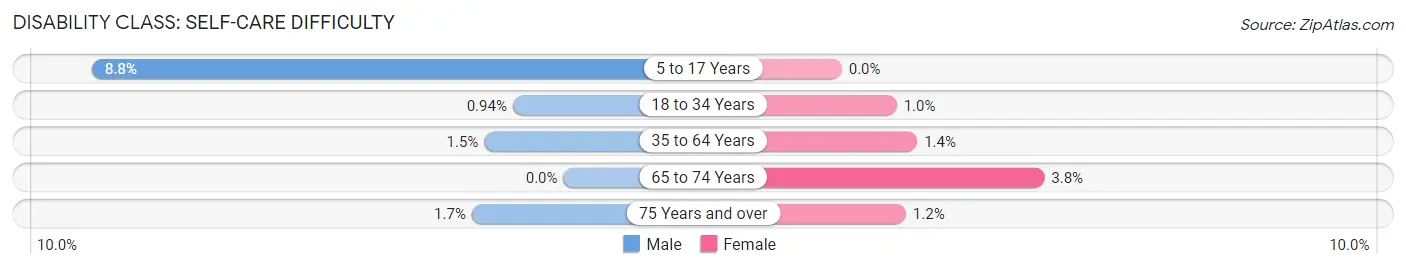
| Age Bracket | Male | Female |
| 5 to 17 Years | 52 (8.7%) | 0 (0.0%) |
| 18 to 34 Years | 7 (0.9%) | 6 (1.0%) |
| 35 to 64 Years | 21 (1.5%) | 22 (1.4%) |
| 65 to 74 Years | 0 (0.0%) | 18 (3.8%) |
| 75 Years and over | 5 (1.7%) | 4 (1.2%) |
Technology Access in Marion County
Computing Device Access in Marion County
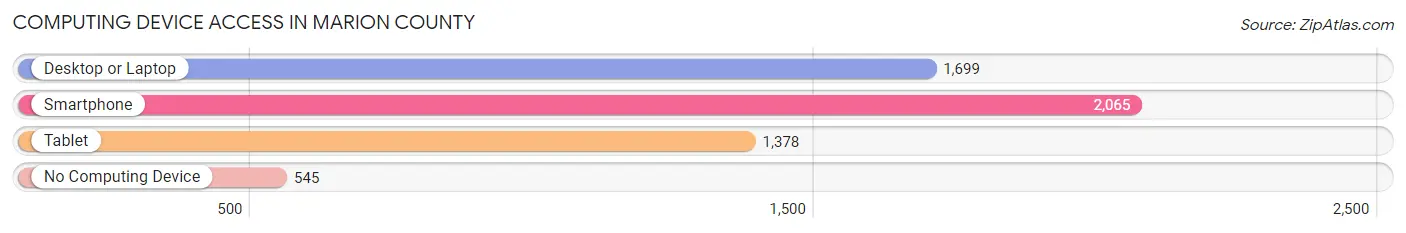
| Device Type | # Households | % Households |
| Desktop or Laptop | 1,699 | 59.2% |
| Smartphone | 2,065 | 71.9% |
| Tablet | 1,378 | 48.0% |
| No Computing Device | 545 | 19.0% |
| Total | 2,872 | 100.0% |
Internet Access in Marion County
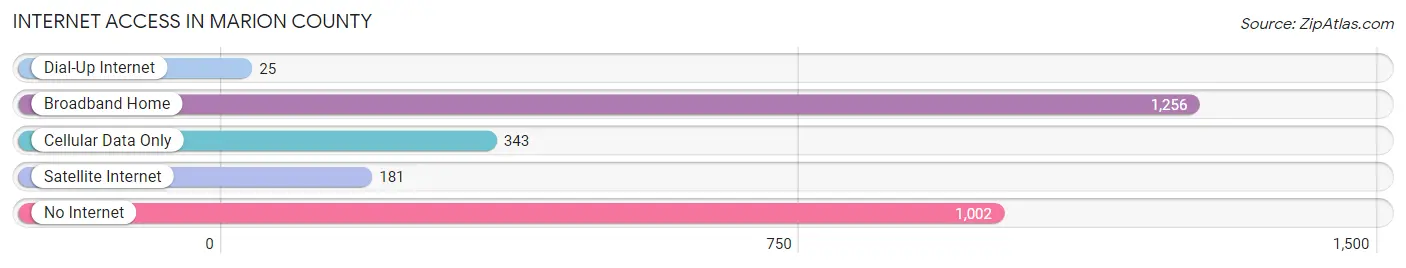
| Internet Type | # Households | % Households |
| Dial-Up Internet | 25 | 0.9% |
| Broadband Home | 1,256 | 43.7% |
| Cellular Data Only | 343 | 11.9% |
| Satellite Internet | 181 | 6.3% |
| No Internet | 1,002 | 34.9% |
| Total | 2,872 | 100.0% |
Marion County Summary
Marion County, Georgia is located in the northwest corner of the state, bordered by Chattahoochee County to the north, Muscogee County to the east, Talbot County to the south, and Taylor County to the west. The county seat is Buena Vista, and the county is part of the Columbus, Georgia metropolitan area. As of the 2010 census, the population of Marion County was 8,945, making it the second least populous county in Georgia.
Geography
Marion County is located in the upper Piedmont region of Georgia, with an elevation ranging from 500 to 800 feet above sea level. The county is mostly flat, with rolling hills in the northern and western parts. The Flint River forms the northern border of the county, and the Chattahoochee River forms the eastern border. The county is mostly covered in pine and hardwood forests, with some agricultural land in the southern and eastern parts.
History
Marion County was created in 1827 from parts of Muscogee and Talbot counties. It was named for General Francis Marion, a Revolutionary War hero. The county seat was originally located in the town of Marion, but was moved to Buena Vista in 1832.
In the early 19th century, Marion County was home to several large plantations, and the county was heavily dependent on slave labor. After the Civil War, the county's economy shifted to small-scale farming and timber production. In the late 19th century, the county was home to several sawmills and gristmills.
In the early 20th century, the county's economy shifted to manufacturing, with several textile mills and furniture factories opening in the county. The county also became a popular tourist destination, with several resorts and campgrounds opening in the area.
Economy
Marion County's economy is largely based on agriculture and manufacturing. The county is home to several large farms, which produce cotton, corn, soybeans, and other crops. The county is also home to several manufacturing companies, including a furniture factory, a textile mill, and a paper mill.
The county is also home to several tourist attractions, including the historic Buena Vista Hotel, the Marion County Museum, and the Marion County Historical Society.
Demographics
As of the 2010 census, the population of Marion County was 8,945, with a population density of 28.3 people per square mile. The racial makeup of the county was 79.2% White, 18.2% African American, 0.3% Native American, 0.3% Asian, 0.1% Pacific Islander, 0.7% from other races, and 1.3% from two or more races. Hispanic or Latino of any race were 2.2% of the population.
The median income for a household in the county was $30,945, and the median income for a family was $37,917. The per capita income for the county was $15,945. About 17.2% of families and 21.2% of the population were below the poverty line, including 28.2% of those under age 18 and 16.2% of those age 65 or over.
Common Questions
What is Per Capita Income in Marion County?
Per Capita income in Marion County is $24,727.
What is the Median Family Income in Marion County?
Median Family Income in Marion County is $64,722.
What is the Median Household income in Marion County?
Median Household Income in Marion County is $48,836.
What is Income or Wage Gap in Marion County?
Income or Wage Gap in Marion County is 19.9%.
Women in Marion County earn 80.1 cents for every dollar earned by a man.
What is Inequality or Gini Index in Marion County?
Inequality or Gini Index in Marion County is 0.42.
What is the Total Population of Marion County?
Total Population of Marion County is 7,508.
What is the Total Male Population of Marion County?
Total Male Population of Marion County is 3,680.
What is the Total Female Population of Marion County?
Total Female Population of Marion County is 3,828.
What is the Ratio of Males per 100 Females in Marion County?
There are 96.13 Males per 100 Females in Marion County.
What is the Ratio of Females per 100 Males in Marion County?
There are 104.02 Females per 100 Males in Marion County.
What is the Median Population Age in Marion County?
Median Population Age in Marion County is 43.8 Years.
What is the Average Family Size in Marion County
Average Family Size in Marion County is 3.1 People.
What is the Average Household Size in Marion County
Average Household Size in Marion County is 2.6 People.
How Large is the Labor Force in Marion County?
There are 2,991 People in the Labor Forcein in Marion County.
What is the Percentage of People in the Labor Force in Marion County?
49.1% of People are in the Labor Force in Marion County.
What is the Unemployment Rate in Marion County?
Unemployment Rate in Marion County is 5.4%.