Lee County, GA Map & Demographics
Lee County Overview
$34,074
PER CAPITA INCOME
$94,150
AVG FAMILY INCOME
$83,632
AVG HOUSEHOLD INCOME
35.3%
WAGE / INCOME GAP [ % ]
64.7¢/ $1
WAGE / INCOME GAP [ $ ]
$12,611
FAMILY INCOME DEFICIT
0.37
INEQUALITY / GINI INDEX
32,968
TOTAL POPULATION
16,560
MALE POPULATION
16,408
FEMALE POPULATION
100.93
MALES / 100 FEMALES
99.08
FEMALES / 100 MALES
37.0
MEDIAN AGE
3.0
AVG FAMILY SIZE
2.7
AVG HOUSEHOLD SIZE
16,770
LABOR FORCE [ PEOPLE ]
65.7%
PERCENT IN LABOR FORCE
4.4%
UNEMPLOYMENT RATE
Lee County Area Codes
Income in Lee County
Income Overview in Lee County
Per Capita Income in Lee County is $34,074, while median incomes of families and households are $94,150 and $83,632 respectively.
| Characteristic | Number | Measure |
| Per Capita Income | 32,968 | $34,074 |
| Median Family Income | 9,356 | $94,150 |
| Mean Family Income | 9,356 | $104,734 |
| Median Household Income | 11,806 | $83,632 |
| Mean Household Income | 11,806 | $95,557 |
| Income Deficit | 9,356 | $12,611 |
| Wage / Income Gap (%) | 32,968 | 35.30% |
| Wage / Income Gap ($) | 32,968 | 64.70¢ per $1 |
| Gini / Inequality Index | 32,968 | 0.37 |
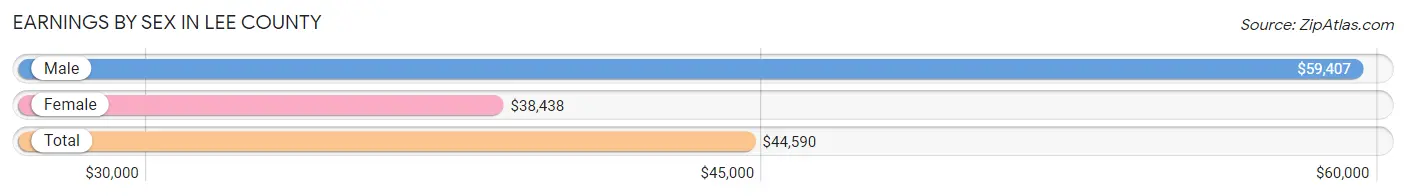
Earnings by Sex in Lee County
Average Earnings in Lee County are $44,590, $59,407 for men and $38,438 for women, a difference of 35.3%.
| Sex | Number | Average Earnings |
| Male | 8,652 (50.7%) | $59,407 |
| Female | 8,398 (49.3%) | $38,438 |
| Total | 17,050 (100.0%) | $44,590 |
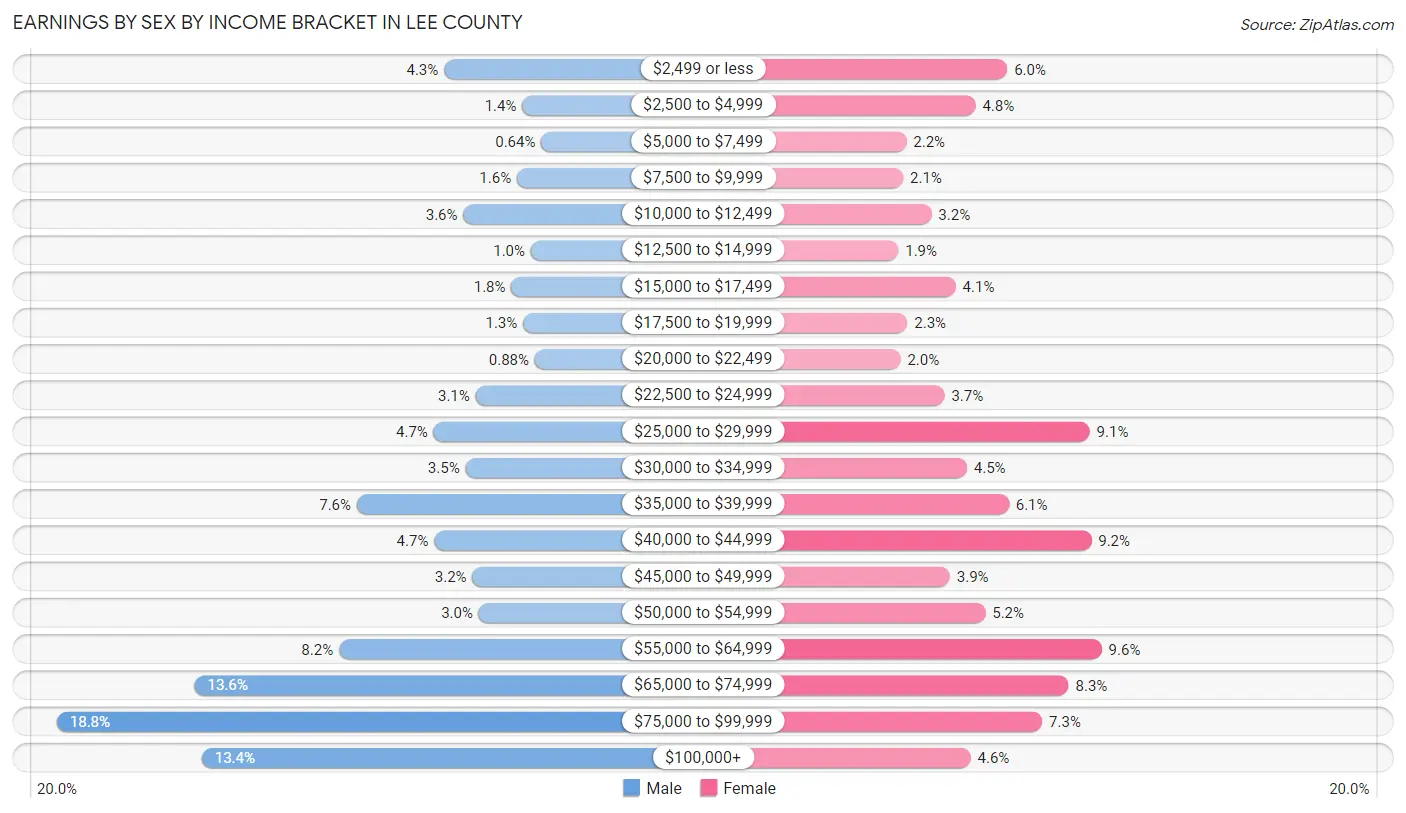
Earnings by Sex by Income Bracket in Lee County
The most common earnings brackets in Lee County are $75,000 to $99,999 for men (1,626 | 18.8%) and $55,000 to $64,999 for women (802 | 9.6%).
| Income | Male | Female |
| $2,499 or less | 370 (4.3%) | 505 (6.0%) |
| $2,500 to $4,999 | 117 (1.3%) | 405 (4.8%) |
| $5,000 to $7,499 | 55 (0.6%) | 187 (2.2%) |
| $7,500 to $9,999 | 134 (1.5%) | 177 (2.1%) |
| $10,000 to $12,499 | 308 (3.6%) | 266 (3.2%) |
| $12,500 to $14,999 | 89 (1.0%) | 162 (1.9%) |
| $15,000 to $17,499 | 152 (1.8%) | 343 (4.1%) |
| $17,500 to $19,999 | 114 (1.3%) | 191 (2.3%) |
| $20,000 to $22,499 | 76 (0.9%) | 169 (2.0%) |
| $22,500 to $24,999 | 268 (3.1%) | 307 (3.7%) |
| $25,000 to $29,999 | 404 (4.7%) | 764 (9.1%) |
| $30,000 to $34,999 | 301 (3.5%) | 378 (4.5%) |
| $35,000 to $39,999 | 653 (7.5%) | 510 (6.1%) |
| $40,000 to $44,999 | 402 (4.6%) | 769 (9.2%) |
| $45,000 to $49,999 | 279 (3.2%) | 324 (3.9%) |
| $50,000 to $54,999 | 258 (3.0%) | 436 (5.2%) |
| $55,000 to $64,999 | 711 (8.2%) | 802 (9.6%) |
| $65,000 to $74,999 | 1,179 (13.6%) | 698 (8.3%) |
| $75,000 to $99,999 | 1,626 (18.8%) | 615 (7.3%) |
| $100,000+ | 1,156 (13.4%) | 390 (4.6%) |
| Total | 8,652 (100.0%) | 8,398 (100.0%) |
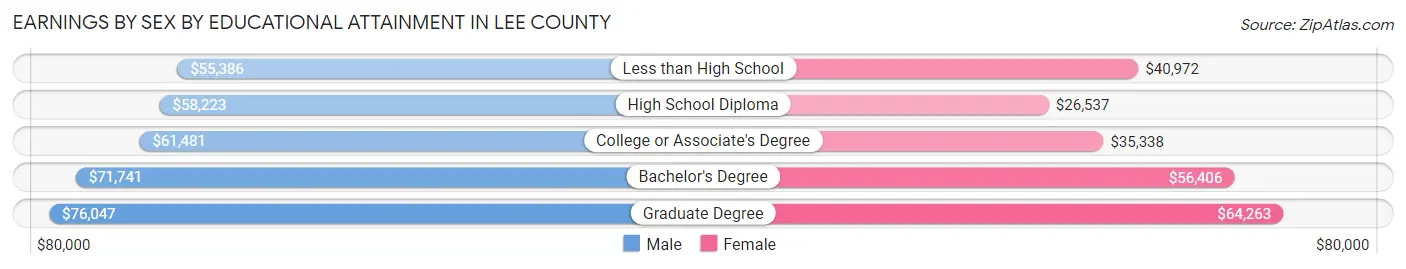
Earnings by Sex by Educational Attainment in Lee County
Average earnings in Lee County are $65,382 for men and $42,394 for women, a difference of 35.2%. Men with an educational attainment of graduate degree enjoy the highest average annual earnings of $76,047, while those with less than high school education earn the least with $55,386. Women with an educational attainment of graduate degree earn the most with the average annual earnings of $64,263, while those with high school diploma education have the smallest earnings of $26,537.
| Educational Attainment | Male Income | Female Income |
| Less than High School | $55,386 | $40,972 |
| High School Diploma | $58,223 | $26,537 |
| College or Associate's Degree | $61,481 | $35,338 |
| Bachelor's Degree | $71,741 | $56,406 |
| Graduate Degree | $76,047 | $64,263 |
| Total | $65,382 | $42,394 |
Family Income in Lee County
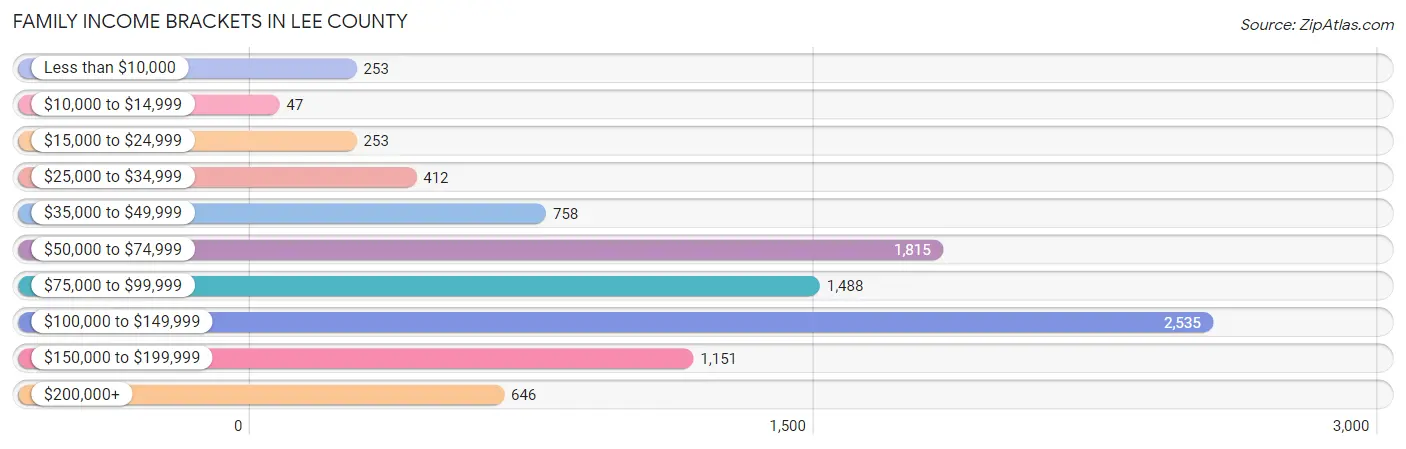
Family Income Brackets in Lee County
According to the Lee County family income data, there are 2,535 families falling into the $100,000 to $149,999 income range, which is the most common income bracket and makes up 27.1% of all families. Conversely, the $10,000 to $14,999 income bracket is the least frequent group with only 47 families (0.5%) belonging to this category.
| Income Bracket | # Families | % Families |
| Less than $10,000 | 253 | 2.7% |
| $10,000 to $14,999 | 47 | 0.5% |
| $15,000 to $24,999 | 253 | 2.7% |
| $25,000 to $34,999 | 412 | 4.4% |
| $35,000 to $49,999 | 758 | 8.1% |
| $50,000 to $74,999 | 1,815 | 19.4% |
| $75,000 to $99,999 | 1,488 | 15.9% |
| $100,000 to $149,999 | 2,535 | 27.1% |
| $150,000 to $199,999 | 1,151 | 12.3% |
| $200,000+ | 646 | 6.9% |
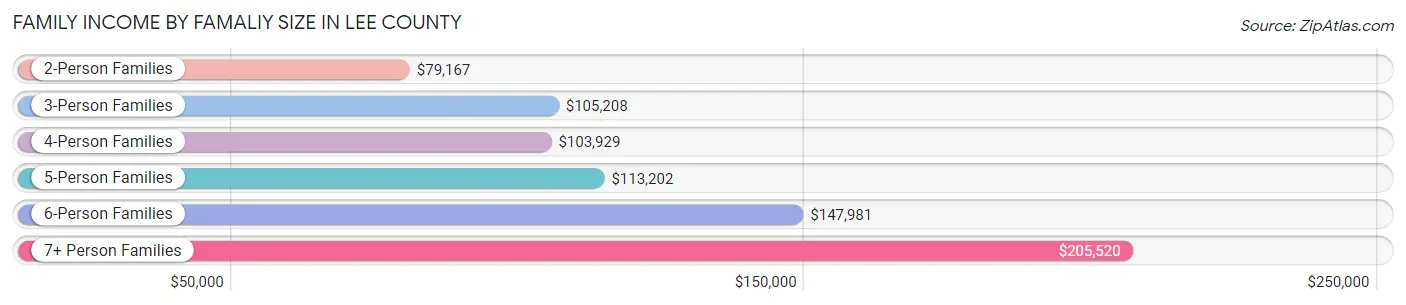
Family Income by Famaliy Size in Lee County
7+ person families (235 | 2.5%) account for the highest median family income in Lee County with $205,520 per family, while 2-person families (4,114 | 44.0%) have the highest median income of $39,584 per family member.
| Income Bracket | # Families | Median Income |
| 2-Person Families | 4,114 (44.0%) | $79,167 |
| 3-Person Families | 2,033 (21.7%) | $105,208 |
| 4-Person Families | 1,758 (18.8%) | $103,929 |
| 5-Person Families | 1,040 (11.1%) | $113,202 |
| 6-Person Families | 176 (1.9%) | $147,981 |
| 7+ Person Families | 235 (2.5%) | $205,520 |
| Total | 9,356 (100.0%) | $94,150 |
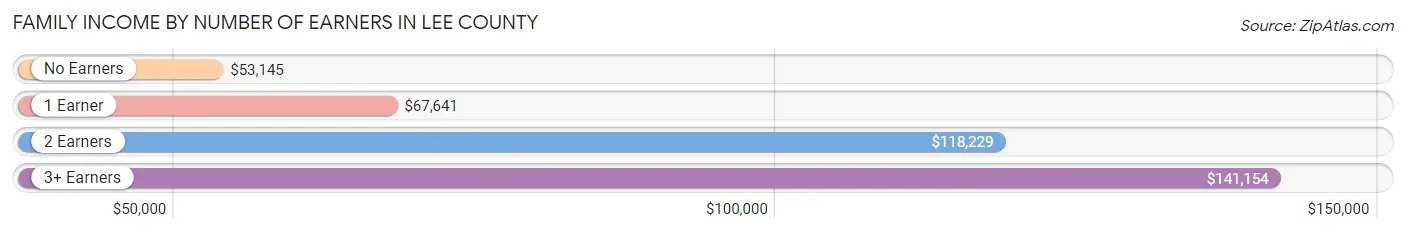
Family Income by Number of Earners in Lee County
The median family income in Lee County is $94,150, with families comprising 3+ earners (1,056) having the highest median family income of $141,154, while families with no earners (1,088) have the lowest median family income of $53,145, accounting for 11.3% and 11.6% of families, respectively.
| Number of Earners | # Families | Median Income |
| No Earners | 1,088 (11.6%) | $53,145 |
| 1 Earner | 3,377 (36.1%) | $67,641 |
| 2 Earners | 3,835 (41.0%) | $118,229 |
| 3+ Earners | 1,056 (11.3%) | $141,154 |
| Total | 9,356 (100.0%) | $94,150 |
Household Income in Lee County
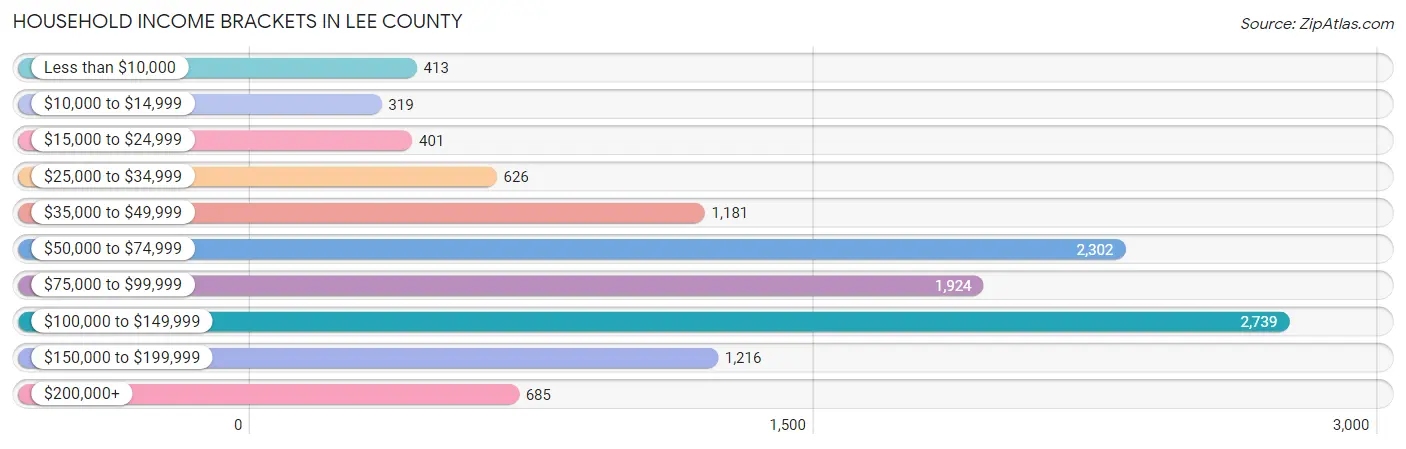
Household Income Brackets in Lee County
With 2,739 households falling in the category, the $100,000 to $149,999 income range is the most frequent in Lee County, accounting for 23.2% of all households. In contrast, only 319 households (2.7%) fall into the $10,000 to $14,999 income bracket, making it the least populous group.
| Income Bracket | # Households | % Households |
| Less than $10,000 | 413 | 3.5% |
| $10,000 to $14,999 | 319 | 2.7% |
| $15,000 to $24,999 | 401 | 3.4% |
| $25,000 to $34,999 | 626 | 5.3% |
| $35,000 to $49,999 | 1,181 | 10.0% |
| $50,000 to $74,999 | 2,302 | 19.5% |
| $75,000 to $99,999 | 1,924 | 16.3% |
| $100,000 to $149,999 | 2,739 | 23.2% |
| $150,000 to $199,999 | 1,216 | 10.3% |
| $200,000+ | 685 | 5.8% |
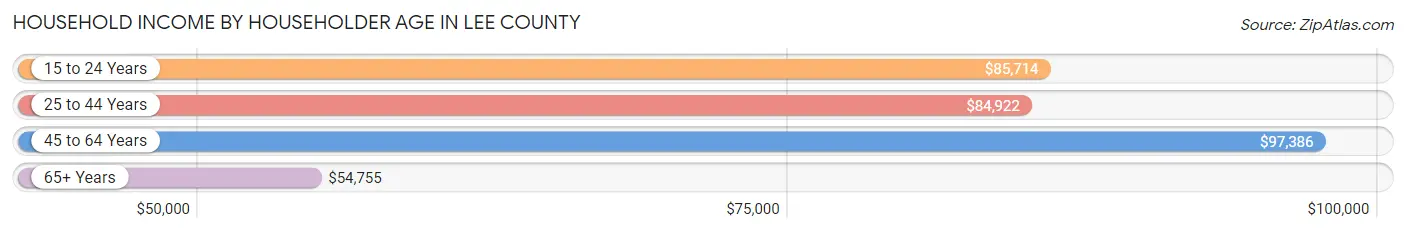
Household Income by Householder Age in Lee County
The median household income in Lee County is $83,632, with the highest median household income of $97,386 found in the 45 to 64 years age bracket for the primary householder. A total of 4,751 households (40.2%) fall into this category. Meanwhile, the 65+ years age bracket for the primary householder has the lowest median household income of $54,755, with 2,508 households (21.2%) in this group.
| Income Bracket | # Households | Median Income |
| 15 to 24 Years | 386 (3.3%) | $85,714 |
| 25 to 44 Years | 4,161 (35.2%) | $84,922 |
| 45 to 64 Years | 4,751 (40.2%) | $97,386 |
| 65+ Years | 2,508 (21.2%) | $54,755 |
| Total | 11,806 (100.0%) | $83,632 |
Poverty in Lee County
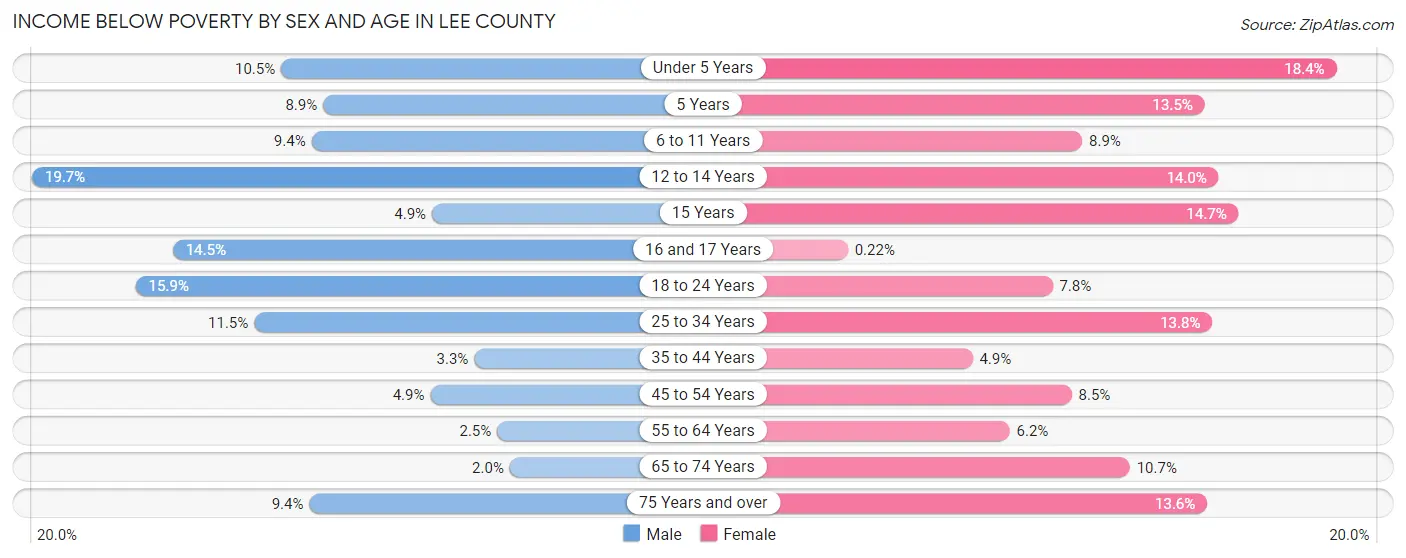
Income Below Poverty by Sex and Age in Lee County
With 8.1% poverty level for males and 9.5% for females among the residents of Lee County, 12 to 14 year old males and under 5 year old females are the most vulnerable to poverty, with 161 males (19.7%) and 221 females (18.4%) in their respective age groups living below the poverty level.
| Age Bracket | Male | Female |
| Under 5 Years | 89 (10.5%) | 221 (18.4%) |
| 5 Years | 33 (8.9%) | 26 (13.5%) |
| 6 to 11 Years | 123 (9.3%) | 121 (8.9%) |
| 12 to 14 Years | 161 (19.7%) | 74 (14.0%) |
| 15 Years | 18 (4.9%) | 19 (14.7%) |
| 16 and 17 Years | 105 (14.5%) | 1 (0.2%) |
| 18 to 24 Years | 243 (15.9%) | 114 (7.8%) |
| 25 to 34 Years | 195 (11.5%) | 264 (13.8%) |
| 35 to 44 Years | 68 (3.3%) | 115 (4.9%) |
| 45 to 54 Years | 108 (4.9%) | 196 (8.5%) |
| 55 to 64 Years | 44 (2.5%) | 117 (6.2%) |
| 65 to 74 Years | 27 (2.0%) | 157 (10.7%) |
| 75 Years and over | 56 (9.4%) | 107 (13.6%) |
| Total | 1,270 (8.1%) | 1,532 (9.5%) |
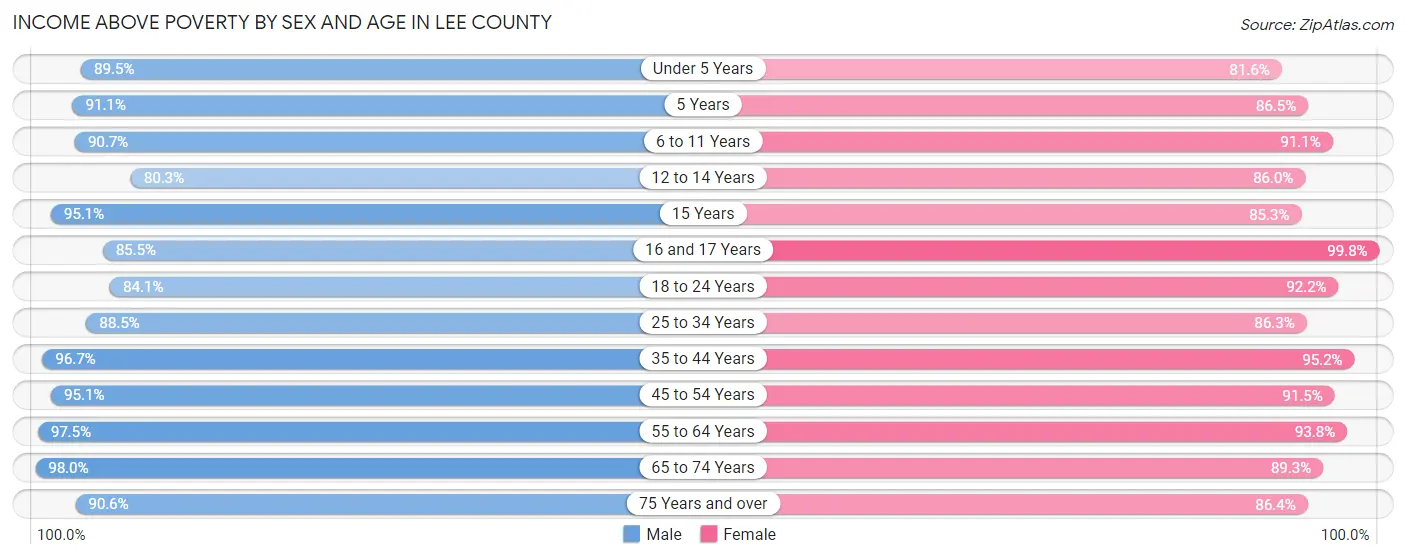
Income Above Poverty by Sex and Age in Lee County
According to the poverty statistics in Lee County, males aged 65 to 74 years and females aged 16 and 17 years are the age groups that are most secure financially, with 98.0% of males and 99.8% of females in these age groups living above the poverty line.
| Age Bracket | Male | Female |
| Under 5 Years | 760 (89.5%) | 983 (81.6%) |
| 5 Years | 337 (91.1%) | 167 (86.5%) |
| 6 to 11 Years | 1,192 (90.6%) | 1,236 (91.1%) |
| 12 to 14 Years | 655 (80.3%) | 455 (86.0%) |
| 15 Years | 351 (95.1%) | 110 (85.3%) |
| 16 and 17 Years | 619 (85.5%) | 460 (99.8%) |
| 18 to 24 Years | 1,287 (84.1%) | 1,343 (92.2%) |
| 25 to 34 Years | 1,504 (88.5%) | 1,656 (86.3%) |
| 35 to 44 Years | 1,985 (96.7%) | 2,257 (95.2%) |
| 45 to 54 Years | 2,077 (95.1%) | 2,102 (91.5%) |
| 55 to 64 Years | 1,743 (97.5%) | 1,762 (93.8%) |
| 65 to 74 Years | 1,329 (98.0%) | 1,312 (89.3%) |
| 75 Years and over | 538 (90.6%) | 682 (86.4%) |
| Total | 14,377 (91.9%) | 14,525 (90.5%) |
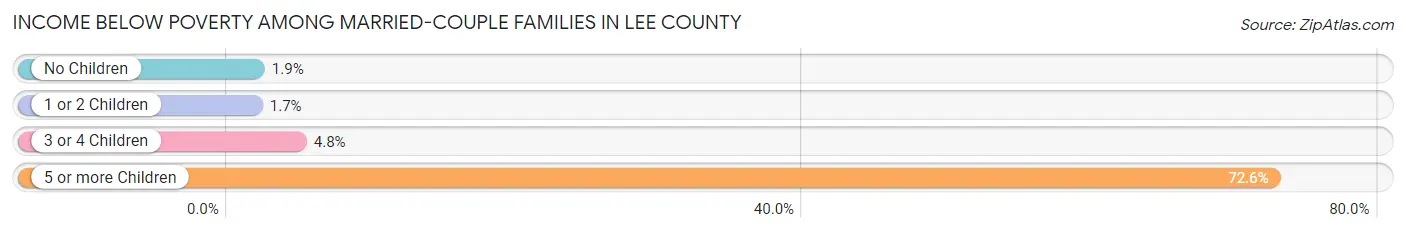
Income Below Poverty Among Married-Couple Families in Lee County
The poverty statistics for married-couple families in Lee County show that 2.8% or 208 of the total 7,344 families live below the poverty line. Families with 5 or more children have the highest poverty rate of 72.6%, comprising of 53 families. On the other hand, families with 1 or 2 children have the lowest poverty rate of 1.7%, which includes 45 families.
| Children | Above Poverty | Below Poverty |
| No Children | 3,826 (98.1%) | 73 (1.9%) |
| 1 or 2 Children | 2,555 (98.3%) | 45 (1.7%) |
| 3 or 4 Children | 735 (95.2%) | 37 (4.8%) |
| 5 or more Children | 20 (27.4%) | 53 (72.6%) |
| Total | 7,136 (97.2%) | 208 (2.8%) |
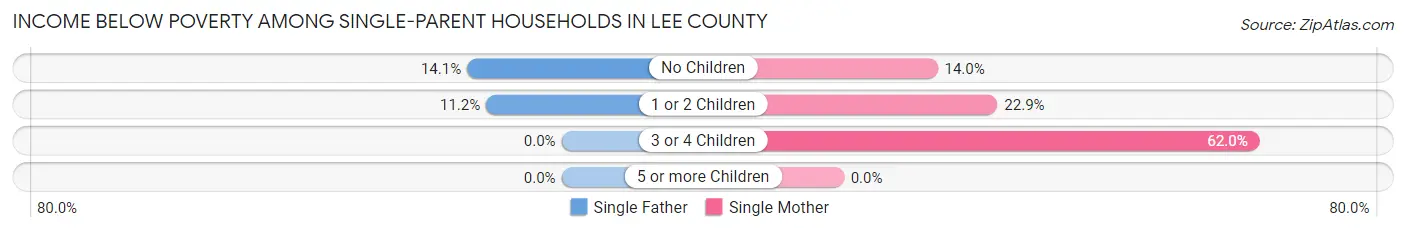
Income Below Poverty Among Single-Parent Households in Lee County
According to the poverty data in Lee County, 12.2% or 57 single-father households and 24.4% or 377 single-mother households are living below the poverty line. Among single-father households, those with no children have the highest poverty rate, with 29 households (14.1%) experiencing poverty. Likewise, among single-mother households, those with 3 or 4 children have the highest poverty rate, with 101 households (62.0%) falling below the poverty line.
| Children | Single Father | Single Mother |
| No Children | 29 (14.1%) | 60 (14.0%) |
| 1 or 2 Children | 28 (11.2%) | 216 (22.9%) |
| 3 or 4 Children | 0 (0.0%) | 101 (62.0%) |
| 5 or more Children | 0 (0.0%) | 0 (0.0%) |
| Total | 57 (12.2%) | 377 (24.4%) |
Income Below Poverty Among Married-Couple vs Single-Parent Households in Lee County
The poverty data for Lee County shows that 208 of the married-couple family households (2.8%) and 434 of the single-parent households (21.6%) are living below the poverty level. Within the married-couple family households, those with 5 or more children have the highest poverty rate, with 53 households (72.6%) falling below the poverty line. Among the single-parent households, those with 3 or 4 children have the highest poverty rate, with 101 household (57.7%) living below poverty.
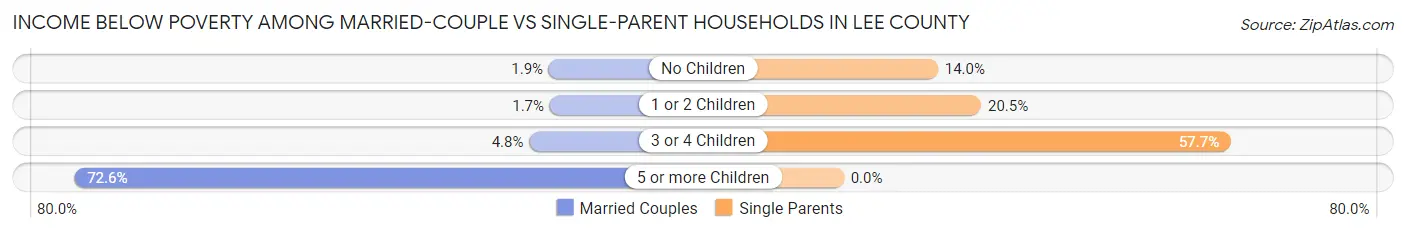
| Children | Married-Couple Families | Single-Parent Households |
| No Children | 73 (1.9%) | 89 (14.0%) |
| 1 or 2 Children | 45 (1.7%) | 244 (20.5%) |
| 3 or 4 Children | 37 (4.8%) | 101 (57.7%) |
| 5 or more Children | 53 (72.6%) | 0 (0.0%) |
| Total | 208 (2.8%) | 434 (21.6%) |
Race in Lee County
The most populous races in Lee County are White / Caucasian (22,816 | 69.2%), Black / African American (7,825 | 23.7%), and Hispanic or Latino (1,082 | 3.3%).
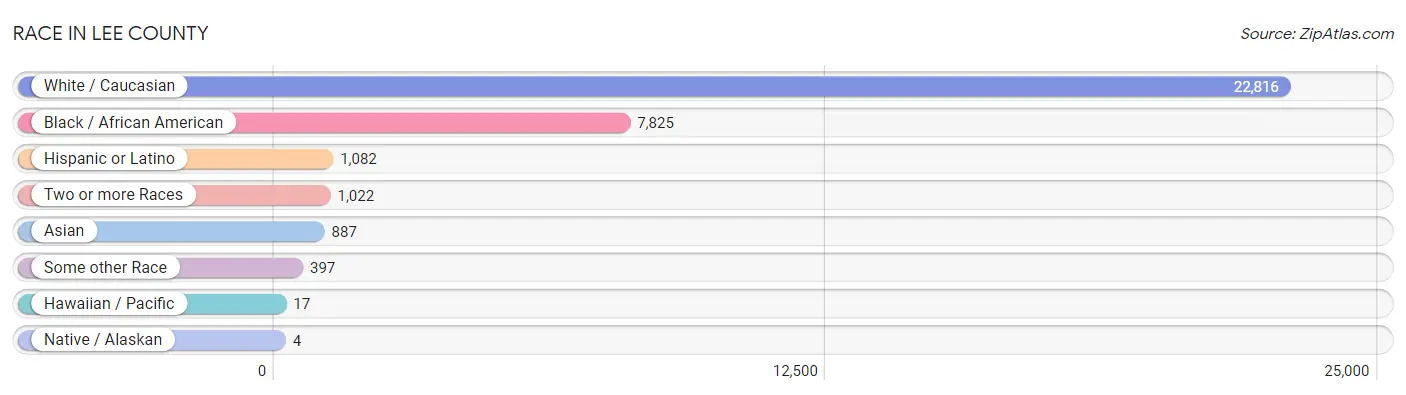
| Race | # Population | % Population |
| Asian | 887 | 2.7% |
| Black / African American | 7,825 | 23.7% |
| Hawaiian / Pacific | 17 | 0.1% |
| Hispanic or Latino | 1,082 | 3.3% |
| Native / Alaskan | 4 | 0.0% |
| White / Caucasian | 22,816 | 69.2% |
| Two or more Races | 1,022 | 3.1% |
| Some other Race | 397 | 1.2% |
| Total | 32,968 | 100.0% |
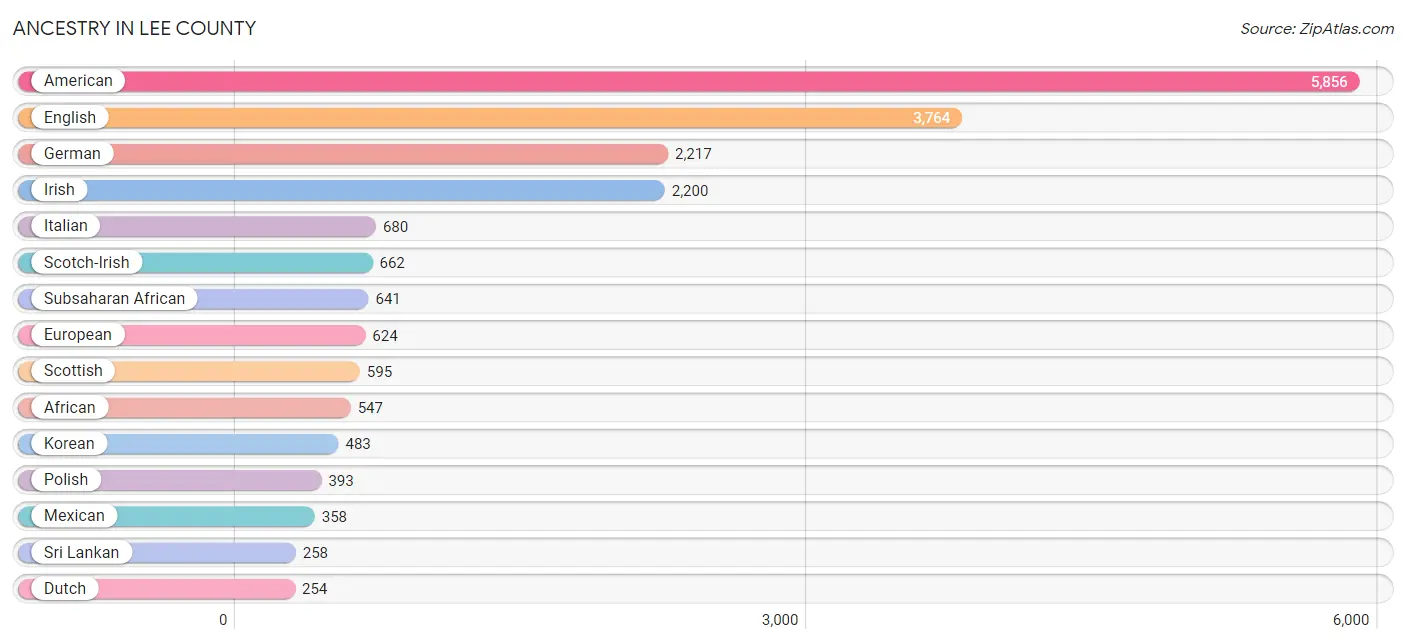
Ancestry in Lee County
The most populous ancestries reported in Lee County are American (5,856 | 17.8%), English (3,764 | 11.4%), German (2,217 | 6.7%), Irish (2,200 | 6.7%), and Italian (680 | 2.1%), together accounting for 44.6% of all Lee County residents.
| Ancestry | # Population | % Population |
| African | 547 | 1.7% |
| American | 5,856 | 17.8% |
| Argentinean | 17 | 0.1% |
| Australian | 10 | 0.0% |
| Bhutanese | 22 | 0.1% |
| Blackfeet | 12 | 0.0% |
| British | 205 | 0.6% |
| British West Indian | 45 | 0.1% |
| Burmese | 43 | 0.1% |
| Canadian | 18 | 0.1% |
| Central American | 157 | 0.5% |
| Cherokee | 97 | 0.3% |
| Colombian | 23 | 0.1% |
| Creek | 21 | 0.1% |
| Cuban | 8 | 0.0% |
| Danish | 5 | 0.0% |
| Dominican | 25 | 0.1% |
| Dutch | 254 | 0.8% |
| Eastern European | 138 | 0.4% |
| English | 3,764 | 11.4% |
| Ethiopian | 94 | 0.3% |
| European | 624 | 1.9% |
| French | 213 | 0.6% |
| French Canadian | 22 | 0.1% |
| German | 2,217 | 6.7% |
| Greek | 83 | 0.3% |
| Guamanian / Chamorro | 37 | 0.1% |
| Honduran | 104 | 0.3% |
| Hungarian | 21 | 0.1% |
| Indian (Asian) | 10 | 0.0% |
| Irish | 2,200 | 6.7% |
| Iroquois | 11 | 0.0% |
| Italian | 680 | 2.1% |
| Korean | 483 | 1.5% |
| Lithuanian | 18 | 0.1% |
| Mexican | 358 | 1.1% |
| Native Hawaiian | 10 | 0.0% |
| Norwegian | 53 | 0.2% |
| Pakistani | 40 | 0.1% |
| Panamanian | 21 | 0.1% |
| Polish | 393 | 1.2% |
| Portuguese | 14 | 0.0% |
| Puerto Rican | 139 | 0.4% |
| Romanian | 162 | 0.5% |
| Russian | 42 | 0.1% |
| Salvadoran | 32 | 0.1% |
| Scandinavian | 84 | 0.3% |
| Scotch-Irish | 662 | 2.0% |
| Scottish | 595 | 1.8% |
| Slavic | 21 | 0.1% |
| Slovene | 39 | 0.1% |
| South American | 40 | 0.1% |
| Spaniard | 37 | 0.1% |
| Spanish | 254 | 0.8% |
| Sri Lankan | 258 | 0.8% |
| Subsaharan African | 641 | 1.9% |
| Swedish | 201 | 0.6% |
| Swiss | 82 | 0.3% |
| Thai | 162 | 0.5% |
| Ukrainian | 21 | 0.1% |
| Welsh | 57 | 0.2% |
| West Indian | 45 | 0.1% | View All 62 Rows |
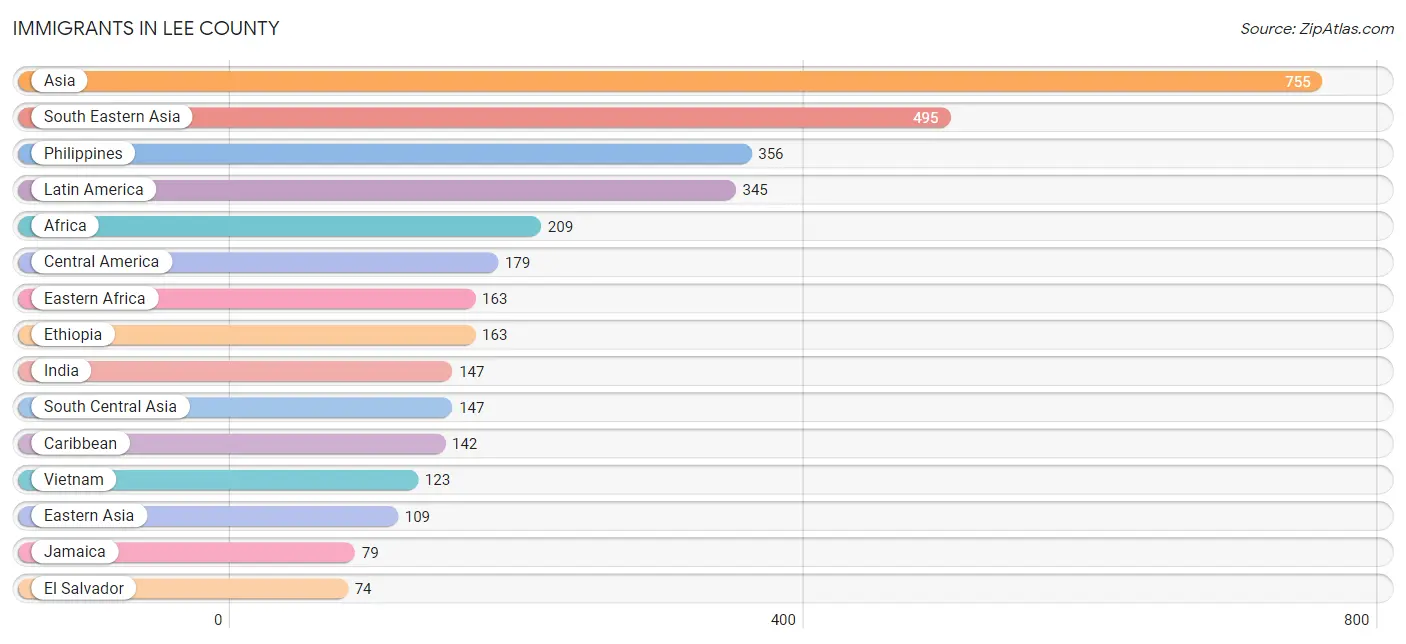
Immigrants in Lee County
The most numerous immigrant groups reported in Lee County came from Asia (755 | 2.3%), South Eastern Asia (495 | 1.5%), Philippines (356 | 1.1%), Latin America (345 | 1.1%), and Africa (209 | 0.6%), together accounting for 6.6% of all Lee County residents.
| Immigration Origin | # Population | % Population |
| Africa | 209 | 0.6% |
| Argentina | 17 | 0.1% |
| Asia | 755 | 2.3% |
| Australia | 10 | 0.0% |
| Cambodia | 16 | 0.1% |
| Canada | 16 | 0.1% |
| Caribbean | 142 | 0.4% |
| Central America | 179 | 0.5% |
| China | 10 | 0.0% |
| Colombia | 7 | 0.0% |
| Dominican Republic | 18 | 0.1% |
| Eastern Africa | 163 | 0.5% |
| Eastern Asia | 109 | 0.3% |
| Eastern Europe | 39 | 0.1% |
| El Salvador | 74 | 0.2% |
| Ethiopia | 163 | 0.5% |
| Europe | 67 | 0.2% |
| Germany | 17 | 0.1% |
| Ghana | 36 | 0.1% |
| Greece | 11 | 0.0% |
| Guatemala | 23 | 0.1% |
| Honduras | 23 | 0.1% |
| Hungary | 15 | 0.1% |
| India | 147 | 0.4% |
| Iraq | 4 | 0.0% |
| Jamaica | 79 | 0.2% |
| Japan | 39 | 0.1% |
| Korea | 60 | 0.2% |
| Latin America | 345 | 1.1% |
| Liberia | 10 | 0.0% |
| Mexico | 59 | 0.2% |
| Oceania | 10 | 0.0% |
| Philippines | 356 | 1.1% |
| Romania | 24 | 0.1% |
| South America | 24 | 0.1% |
| South Central Asia | 147 | 0.4% |
| South Eastern Asia | 495 | 1.5% |
| Southern Europe | 11 | 0.0% |
| Vietnam | 123 | 0.4% |
| Western Africa | 46 | 0.1% |
| Western Asia | 4 | 0.0% |
| Western Europe | 17 | 0.1% | View All 42 Rows |
Sex and Age in Lee County
Sex and Age in Lee County
The most populous age groups in Lee County are 15 to 19 Years (1,607 | 9.7%) for men and 35 to 39 Years (1,588 | 9.7%) for women.
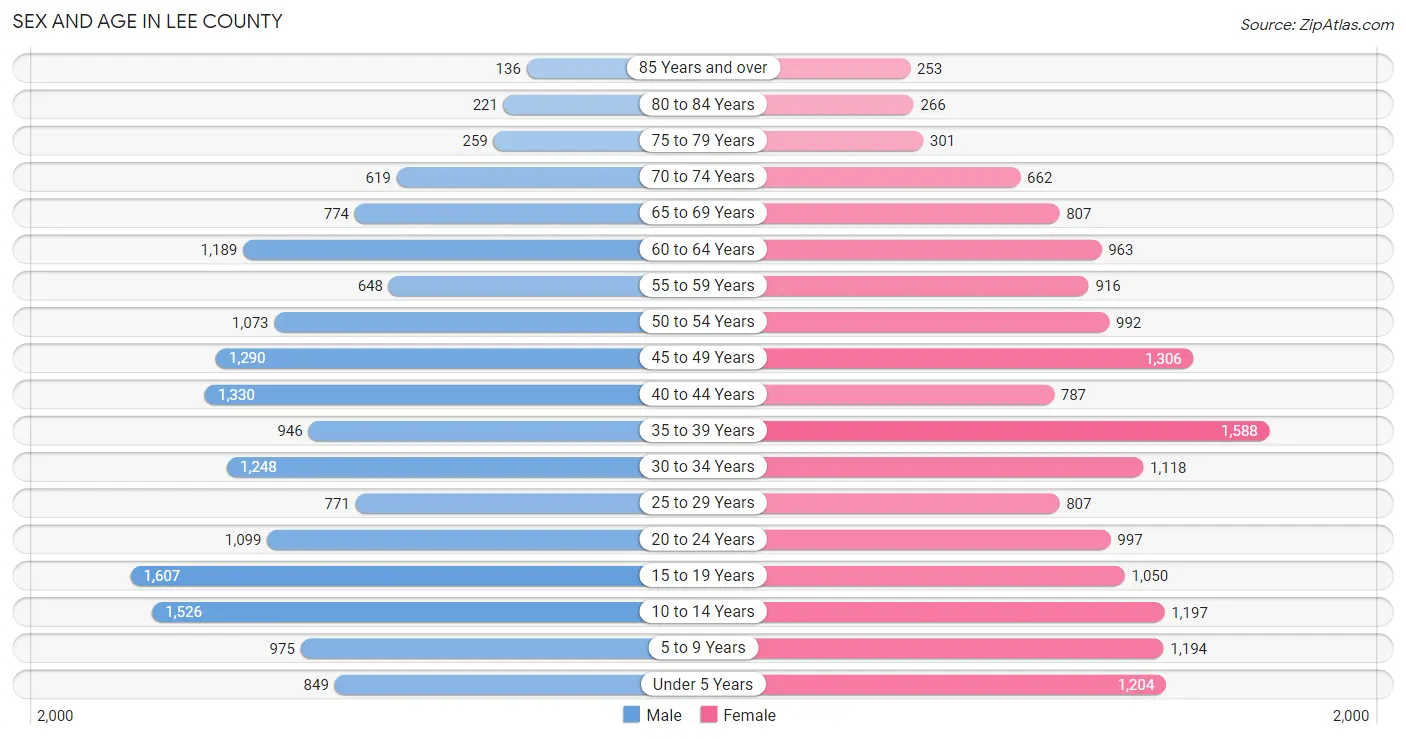
| Age Bracket | Male | Female |
| Under 5 Years | 849 (5.1%) | 1,204 (7.3%) |
| 5 to 9 Years | 975 (5.9%) | 1,194 (7.3%) |
| 10 to 14 Years | 1,526 (9.2%) | 1,197 (7.3%) |
| 15 to 19 Years | 1,607 (9.7%) | 1,050 (6.4%) |
| 20 to 24 Years | 1,099 (6.6%) | 997 (6.1%) |
| 25 to 29 Years | 771 (4.7%) | 807 (4.9%) |
| 30 to 34 Years | 1,248 (7.5%) | 1,118 (6.8%) |
| 35 to 39 Years | 946 (5.7%) | 1,588 (9.7%) |
| 40 to 44 Years | 1,330 (8.0%) | 787 (4.8%) |
| 45 to 49 Years | 1,290 (7.8%) | 1,306 (8.0%) |
| 50 to 54 Years | 1,073 (6.5%) | 992 (6.0%) |
| 55 to 59 Years | 648 (3.9%) | 916 (5.6%) |
| 60 to 64 Years | 1,189 (7.2%) | 963 (5.9%) |
| 65 to 69 Years | 774 (4.7%) | 807 (4.9%) |
| 70 to 74 Years | 619 (3.7%) | 662 (4.0%) |
| 75 to 79 Years | 259 (1.6%) | 301 (1.8%) |
| 80 to 84 Years | 221 (1.3%) | 266 (1.6%) |
| 85 Years and over | 136 (0.8%) | 253 (1.5%) |
| Total | 16,560 (100.0%) | 16,408 (100.0%) |
Families and Households in Lee County
Median Family Size in Lee County
The median family size in Lee County is 3.04 persons per family, with married-couple families (7,344 | 78.5%) accounting for the largest median family size of 3.11 persons per family. On the other hand, single male/father families (467 | 5.0%) represent the smallest median family size with 2.21 persons per family.
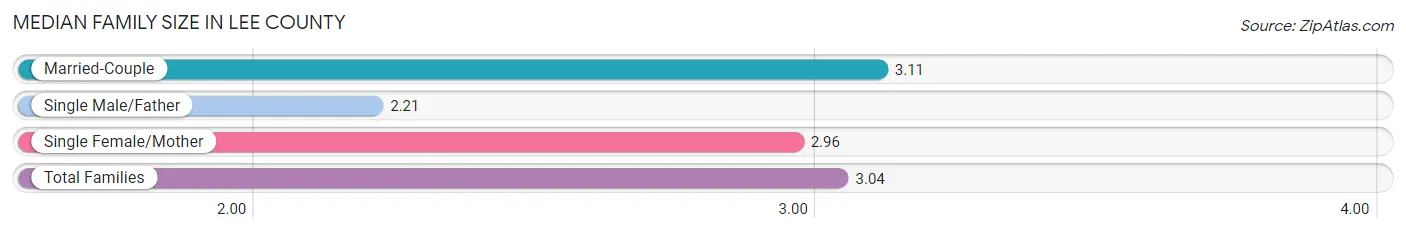
| Family Type | # Families | Family Size |
| Married-Couple | 7,344 (78.5%) | 3.11 |
| Single Male/Father | 467 (5.0%) | 2.21 |
| Single Female/Mother | 1,545 (16.5%) | 2.96 |
| Total Families | 9,356 (100.0%) | 3.04 |
Median Household Size in Lee County
The median household size in Lee County is 2.71 persons per household, with married-couple households (7,344 | 62.2%) accounting for the largest median household size of 3.16 persons per household. non-family households (2,450 | 20.7%) represent the smallest median household size with 1.16 persons per household.
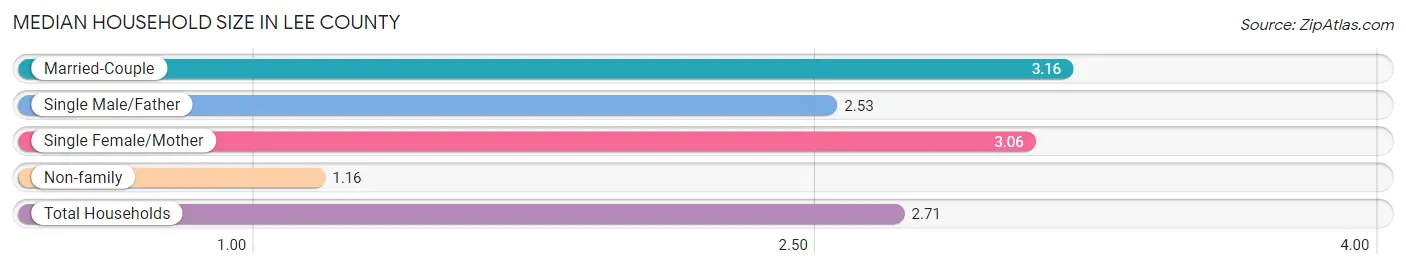
| Household Type | # Households | Household Size |
| Married-Couple | 7,344 (62.2%) | 3.16 |
| Single Male/Father | 467 (4.0%) | 2.53 |
| Single Female/Mother | 1,545 (13.1%) | 3.06 |
| Non-family | 2,450 (20.7%) | 1.16 |
| Total Households | 11,806 (100.0%) | 2.71 |
Household Size by Marriage Status in Lee County
Out of a total of 11,806 households in Lee County, 9,356 (79.2%) are family households, while 2,450 (20.7%) are nonfamily households. The most numerous type of family households are 2-person households, comprising 3,937, and the most common type of nonfamily households are 1-person households, comprising 2,112.
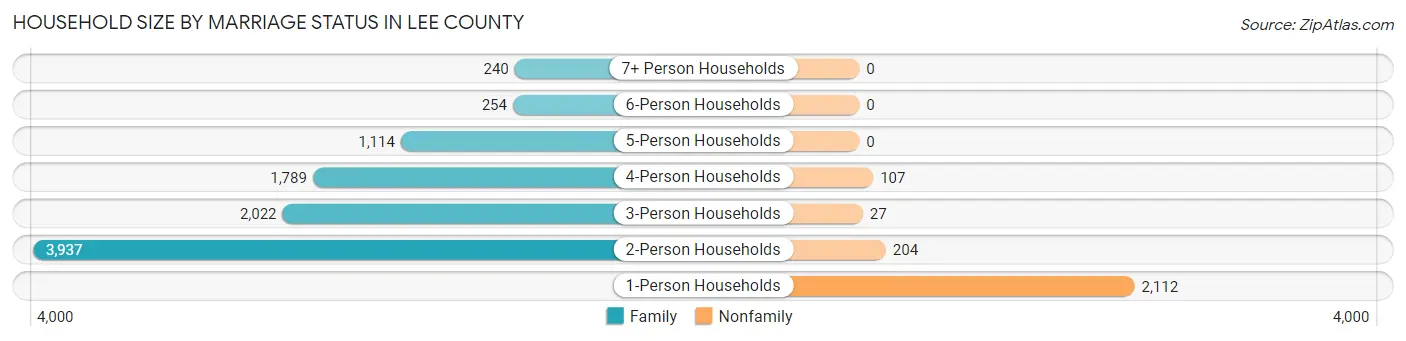
| Household Size | Family Households | Nonfamily Households |
| 1-Person Households | - | 2,112 (17.9%) |
| 2-Person Households | 3,937 (33.4%) | 204 (1.7%) |
| 3-Person Households | 2,022 (17.1%) | 27 (0.2%) |
| 4-Person Households | 1,789 (15.1%) | 107 (0.9%) |
| 5-Person Households | 1,114 (9.4%) | 0 (0.0%) |
| 6-Person Households | 254 (2.1%) | 0 (0.0%) |
| 7+ Person Households | 240 (2.0%) | 0 (0.0%) |
| Total | 9,356 (79.2%) | 2,450 (20.7%) |
Female Fertility in Lee County
Fertility by Age in Lee County
Average fertility rate in Lee County is 64.0 births per 1,000 women. Women in the age bracket of 20 to 34 years have the highest fertility rate with 141.0 births per 1,000 women. Women in the age bracket of 20 to 34 years acount for 82.4% of all women with births.
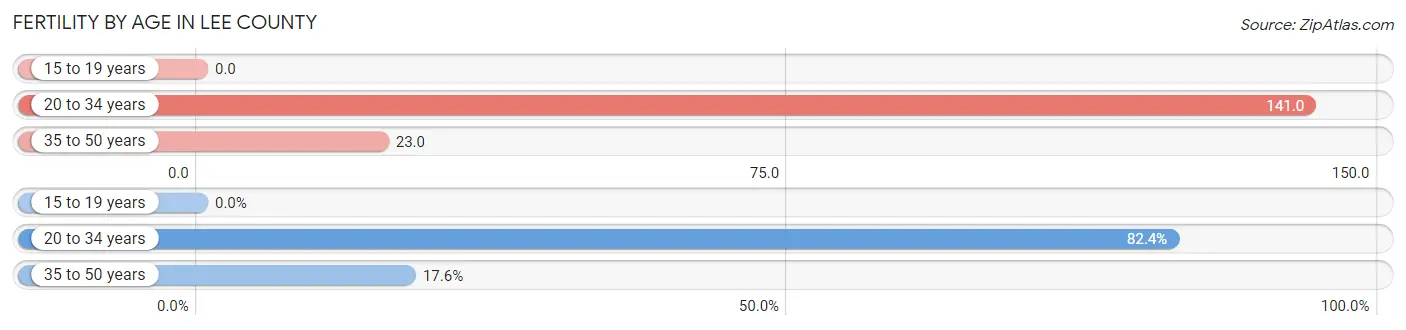
| Age Bracket | Women with Births | Births / 1,000 Women |
| 15 to 19 years | 0 (0.0%) | 0.0 |
| 20 to 34 years | 411 (82.4%) | 141.0 |
| 35 to 50 years | 88 (17.6%) | 23.0 |
| Total | 499 (100.0%) | 64.0 |
Fertility by Age by Marriage Status in Lee County
93.6% of women with births (499) in Lee County are married. The highest percentage of unmarried women with births falls into 35 to 50 years age bracket with 9.1% of them unmarried at the time of birth, while the lowest percentage of unmarried women with births belong to 20 to 34 years age bracket with 5.8% of them unmarried.
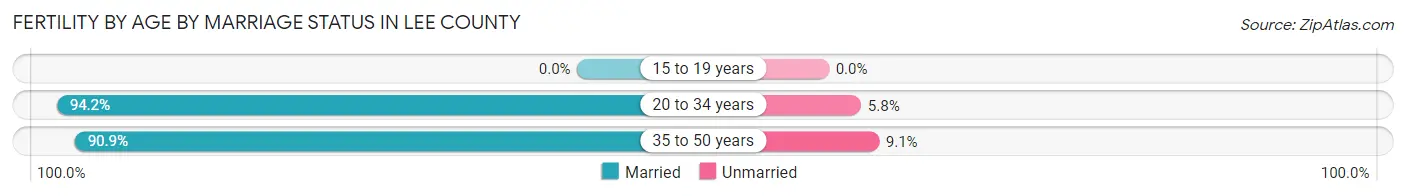
| Age Bracket | Married | Unmarried |
| 15 to 19 years | 0 (0.0%) | 0 (0.0%) |
| 20 to 34 years | 387 (94.2%) | 24 (5.8%) |
| 35 to 50 years | 80 (90.9%) | 8 (9.1%) |
| Total | 467 (93.6%) | 32 (6.4%) |
Fertility by Education in Lee County
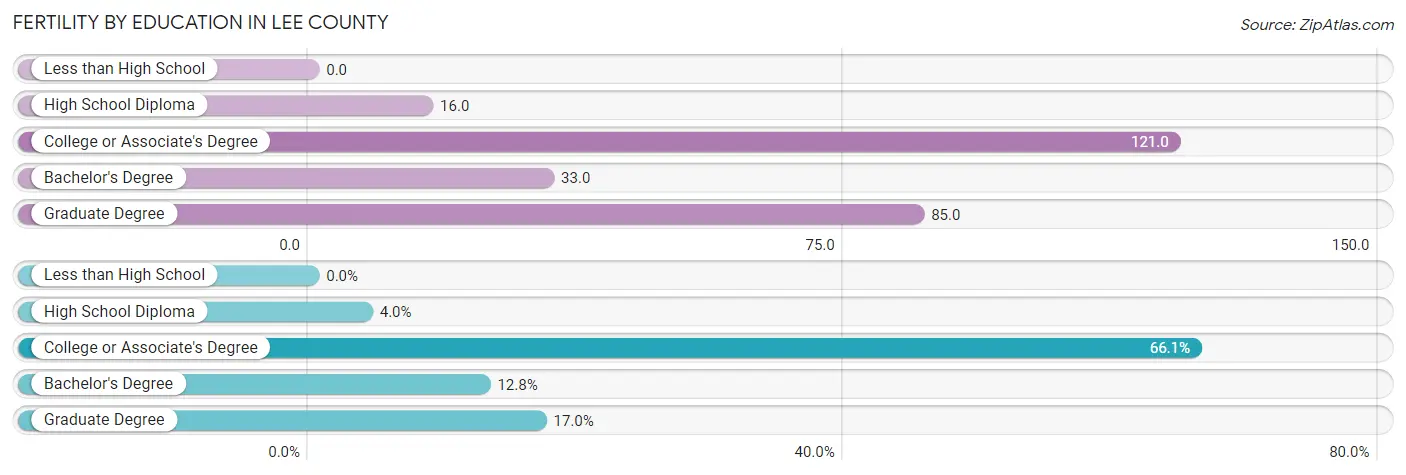
| Educational Attainment | Women with Births | Births / 1,000 Women |
| Less than High School | 0 (0.0%) | 0.0 |
| High School Diploma | 20 (4.0%) | 16.0 |
| College or Associate's Degree | 330 (66.1%) | 121.0 |
| Bachelor's Degree | 64 (12.8%) | 33.0 |
| Graduate Degree | 85 (17.0%) | 85.0 |
| Total | 499 (100.0%) | 64.0 |
Fertility by Education by Marriage Status in Lee County
6.4% of women with births in Lee County are unmarried. Women with the educational attainment of bachelor's degree are most likely to be married with 100.0% of them married at childbirth, while women with the educational attainment of high school diploma are least likely to be married with 35.0% of them unmarried at childbirth.
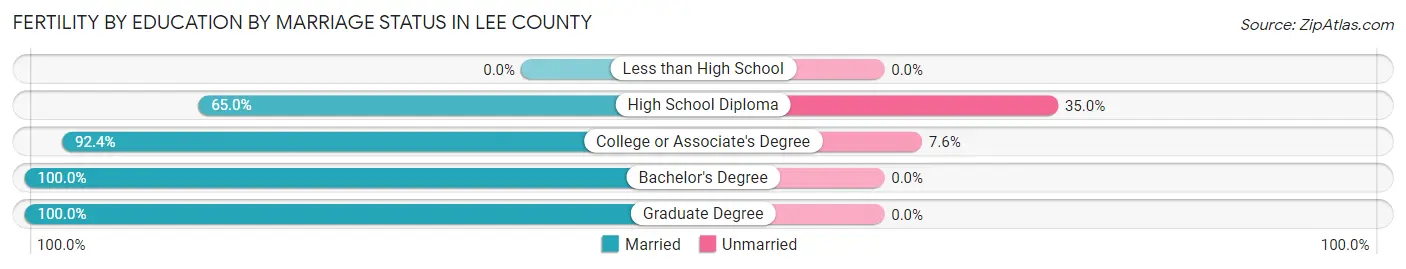
| Educational Attainment | Married | Unmarried |
| Less than High School | 0 (0.0%) | 0 (0.0%) |
| High School Diploma | 13 (65.0%) | 7 (35.0%) |
| College or Associate's Degree | 305 (92.4%) | 25 (7.6%) |
| Bachelor's Degree | 64 (100.0%) | 0 (0.0%) |
| Graduate Degree | 85 (100.0%) | 0 (0.0%) |
| Total | 467 (93.6%) | 32 (6.4%) |
Employment Characteristics in Lee County
Employment by Class of Employer in Lee County
Among the 15,619 employed individuals in Lee County, private company employees (9,269 | 59.3%), local government employees (1,805 | 11.6%), and not-for-profit organizations (1,599 | 10.2%) make up the most common classes of employment.
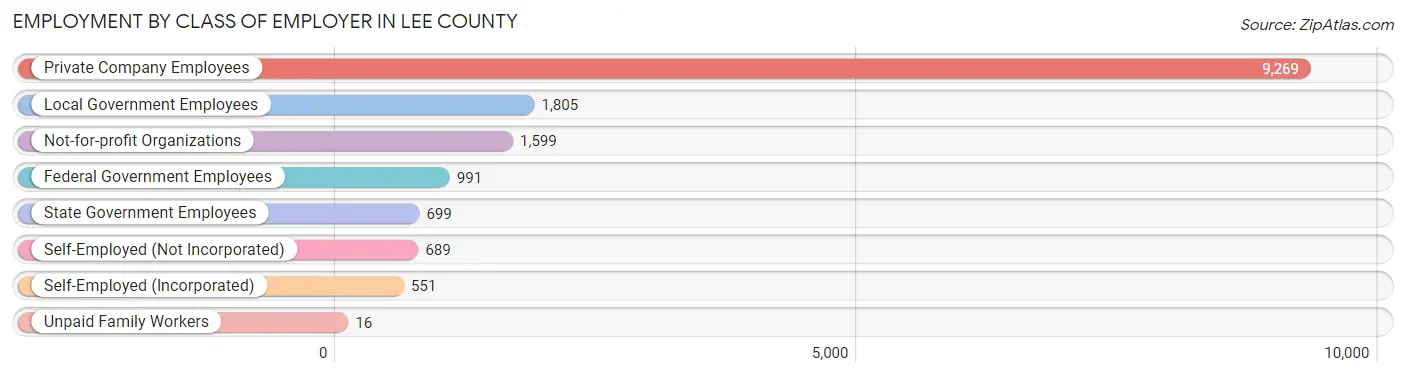
| Employer Class | # Employees | % Employees |
| Private Company Employees | 9,269 | 59.3% |
| Self-Employed (Incorporated) | 551 | 3.5% |
| Self-Employed (Not Incorporated) | 689 | 4.4% |
| Not-for-profit Organizations | 1,599 | 10.2% |
| Local Government Employees | 1,805 | 11.6% |
| State Government Employees | 699 | 4.5% |
| Federal Government Employees | 991 | 6.3% |
| Unpaid Family Workers | 16 | 0.1% |
| Total | 15,619 | 100.0% |
Employment Status by Age in Lee County
According to the labor force statistics for Lee County, out of the total population over 16 years of age (25,525), 65.7% or 16,770 individuals are in the labor force, with 4.4% or 738 of them unemployed. The age group with the highest labor force participation rate is 45 to 54 years, with 86.4% or 4,027 individuals in the labor force. Within the labor force, the 20 to 24 years age range has the highest percentage of unemployed individuals, with 12.9% or 216 of them being unemployed.
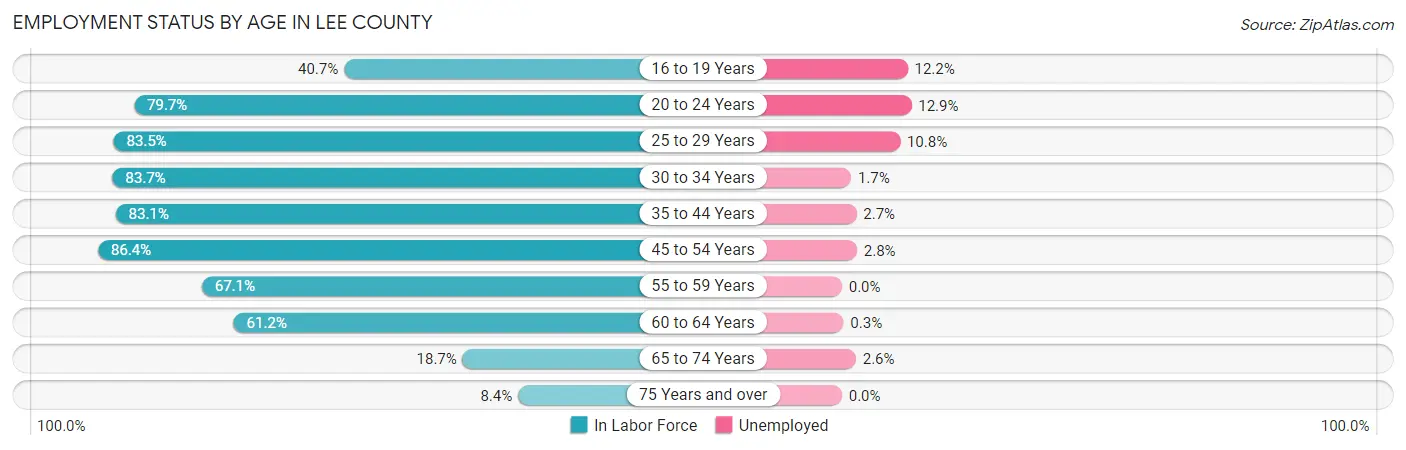
| Age Bracket | In Labor Force | Unemployed |
| 16 to 19 Years | 879 (40.7%) | 107 (12.2%) |
| 20 to 24 Years | 1,671 (79.7%) | 216 (12.9%) |
| 25 to 29 Years | 1,318 (83.5%) | 142 (10.8%) |
| 30 to 34 Years | 1,980 (83.7%) | 34 (1.7%) |
| 35 to 44 Years | 3,865 (83.1%) | 104 (2.7%) |
| 45 to 54 Years | 4,027 (86.4%) | 113 (2.8%) |
| 55 to 59 Years | 1,049 (67.1%) | 0 (0.0%) |
| 60 to 64 Years | 1,317 (61.2%) | 4 (0.3%) |
| 65 to 74 Years | 535 (18.7%) | 14 (2.6%) |
| 75 Years and over | 121 (8.4%) | 0 (0.0%) |
| Total | 16,770 (65.7%) | 738 (4.4%) |
Employment Status by Educational Attainment in Lee County
According to labor force statistics for Lee County, 79.9% of individuals (13,561) out of the total population between 25 and 64 years of age (16,972) are in the labor force, with 2.9% or 393 of them being unemployed. The group with the highest labor force participation rate are those with the educational attainment of bachelor's degree or higher, with 89.2% or 5,291 individuals in the labor force. Within the labor force, individuals with less than high school education have the highest percentage of unemployment, with 20.2% or 150 of them being unemployed.
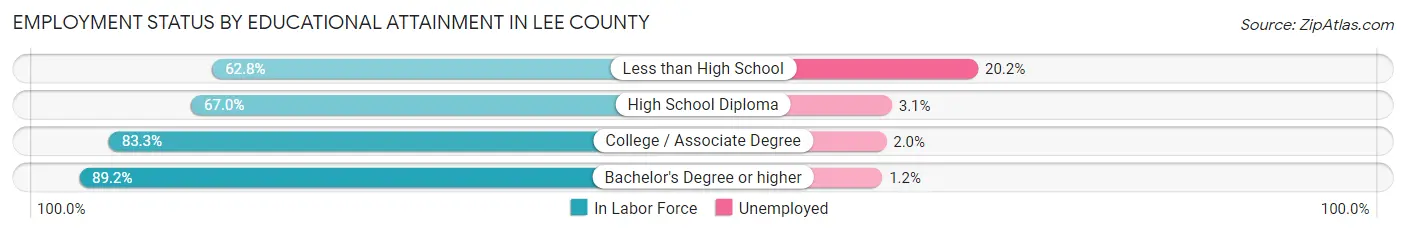
| Educational Attainment | In Labor Force | Unemployed |
| Less than High School | 741 (62.8%) | 238 (20.2%) |
| High School Diploma | 2,821 (67.0%) | 131 (3.1%) |
| College / Associate Degree | 4,706 (83.3%) | 113 (2.0%) |
| Bachelor's Degree or higher | 5,291 (89.2%) | 71 (1.2%) |
| Total | 13,561 (79.9%) | 492 (2.9%) |
Employment Occupations by Sex in Lee County
Management, Business, Science and Arts Occupations
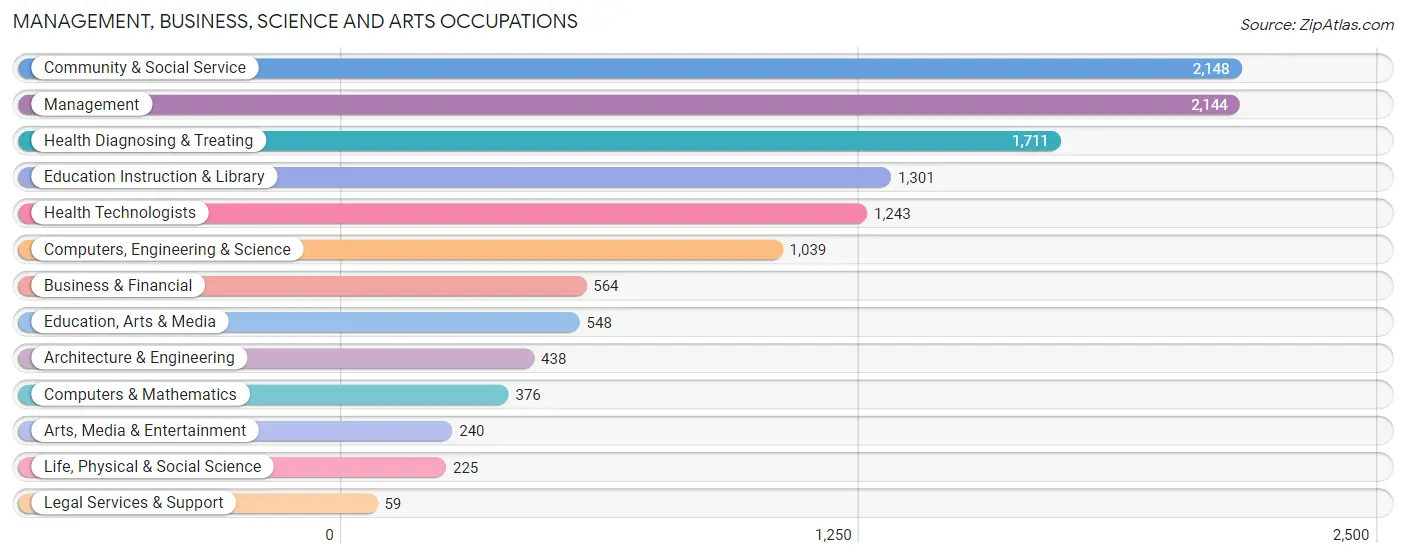
The most common Management, Business, Science and Arts occupations in Lee County are Community & Social Service (2,148 | 13.5%), Management (2,144 | 13.5%), Health Diagnosing & Treating (1,711 | 10.8%), Education Instruction & Library (1,301 | 8.2%), and Health Technologists (1,243 | 7.8%).
Management, Business, Science and Arts Occupations by Sex
Within the Management, Business, Science and Arts occupations in Lee County, the most male-oriented occupations are Computers & Mathematics (92.0%), Computers, Engineering & Science (74.1%), and Architecture & Engineering (69.0%), while the most female-oriented occupations are Legal Services & Support (100.0%), Education Instruction & Library (78.2%), and Community & Social Service (75.9%).
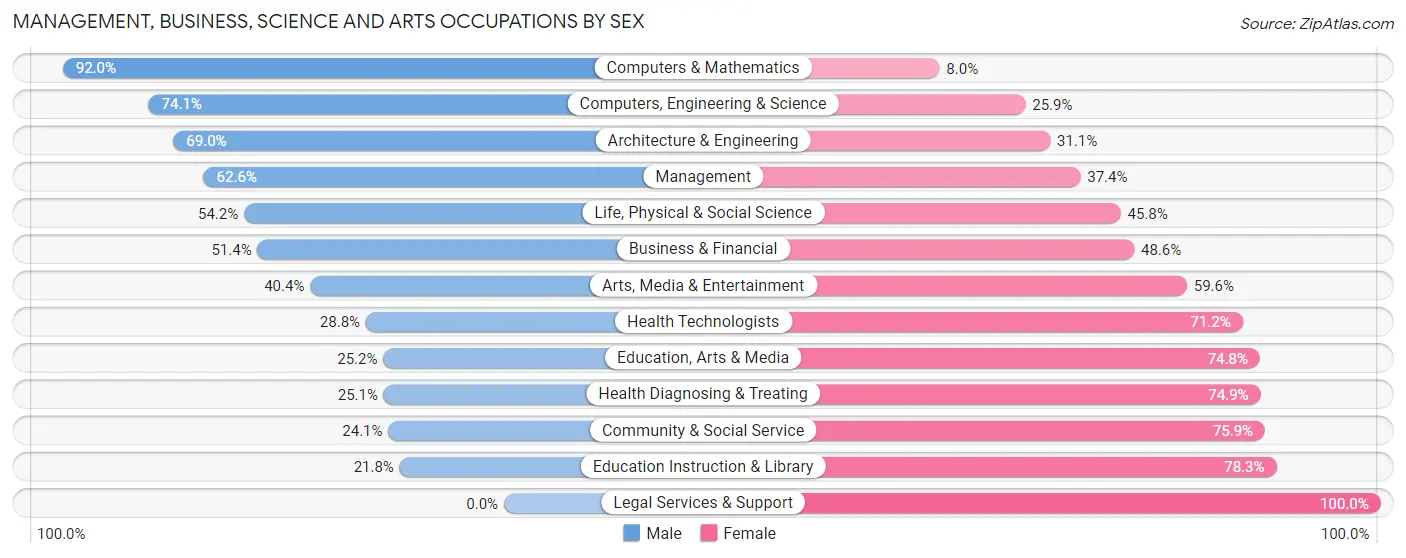
| Occupation | Male | Female |
| Management | 1,343 (62.6%) | 801 (37.4%) |
| Business & Financial | 290 (51.4%) | 274 (48.6%) |
| Computers, Engineering & Science | 770 (74.1%) | 269 (25.9%) |
| Computers & Mathematics | 346 (92.0%) | 30 (8.0%) |
| Architecture & Engineering | 302 (69.0%) | 136 (31.0%) |
| Life, Physical & Social Science | 122 (54.2%) | 103 (45.8%) |
| Community & Social Service | 518 (24.1%) | 1,630 (75.9%) |
| Education, Arts & Media | 138 (25.2%) | 410 (74.8%) |
| Legal Services & Support | 0 (0.0%) | 59 (100.0%) |
| Education Instruction & Library | 283 (21.7%) | 1,018 (78.2%) |
| Arts, Media & Entertainment | 97 (40.4%) | 143 (59.6%) |
| Health Diagnosing & Treating | 429 (25.1%) | 1,282 (74.9%) |
| Health Technologists | 358 (28.8%) | 885 (71.2%) |
| Total (Category) | 3,350 (44.0%) | 4,256 (56.0%) |
| Total (Overall) | 7,992 (50.3%) | 7,888 (49.7%) |
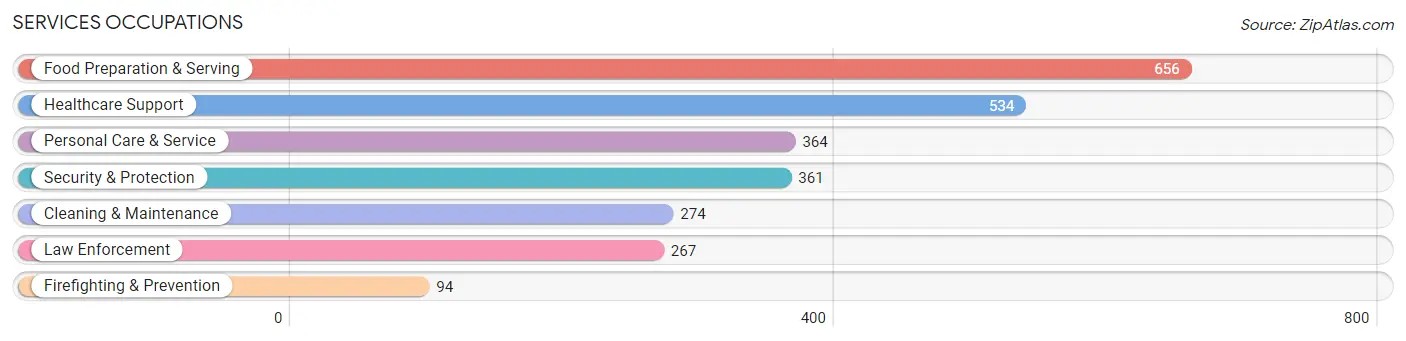
Services Occupations
The most common Services occupations in Lee County are Food Preparation & Serving (656 | 4.1%), Healthcare Support (534 | 3.4%), Personal Care & Service (364 | 2.3%), Security & Protection (361 | 2.3%), and Cleaning & Maintenance (274 | 1.7%).
Services Occupations by Sex
Within the Services occupations in Lee County, the most male-oriented occupations are Law Enforcement (98.5%), Security & Protection (95.6%), and Firefighting & Prevention (87.2%), while the most female-oriented occupations are Healthcare Support (86.7%), Food Preparation & Serving (74.4%), and Personal Care & Service (57.1%).
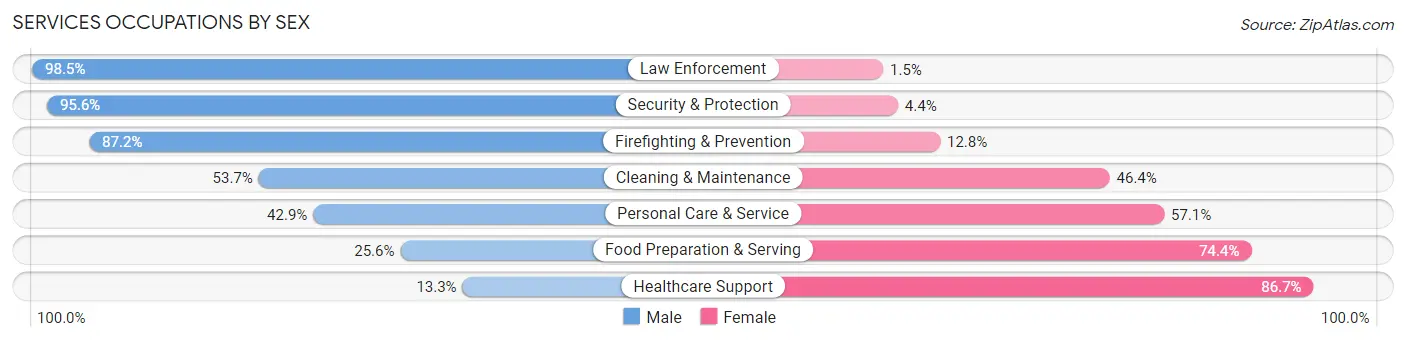
| Occupation | Male | Female |
| Healthcare Support | 71 (13.3%) | 463 (86.7%) |
| Security & Protection | 345 (95.6%) | 16 (4.4%) |
| Firefighting & Prevention | 82 (87.2%) | 12 (12.8%) |
| Law Enforcement | 263 (98.5%) | 4 (1.5%) |
| Food Preparation & Serving | 168 (25.6%) | 488 (74.4%) |
| Cleaning & Maintenance | 147 (53.6%) | 127 (46.4%) |
| Personal Care & Service | 156 (42.9%) | 208 (57.1%) |
| Total (Category) | 887 (40.5%) | 1,302 (59.5%) |
| Total (Overall) | 7,992 (50.3%) | 7,888 (49.7%) |
Sales and Office Occupations
The most common Sales and Office occupations in Lee County are Office & Administration (1,889 | 11.9%), and Sales & Related (1,297 | 8.2%).
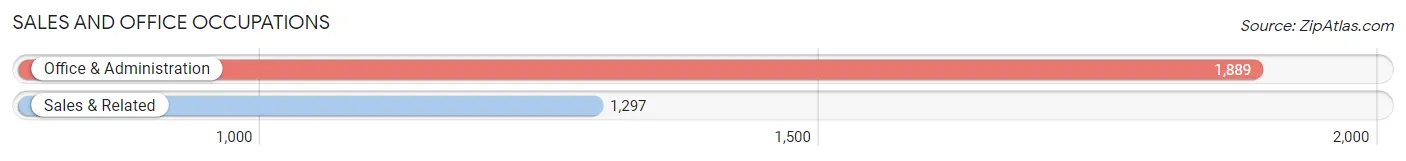
Sales and Office Occupations by Sex
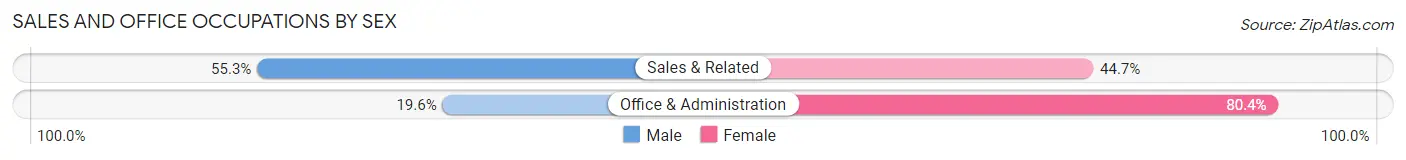
| Occupation | Male | Female |
| Sales & Related | 717 (55.3%) | 580 (44.7%) |
| Office & Administration | 371 (19.6%) | 1,518 (80.4%) |
| Total (Category) | 1,088 (34.2%) | 2,098 (65.8%) |
| Total (Overall) | 7,992 (50.3%) | 7,888 (49.7%) |
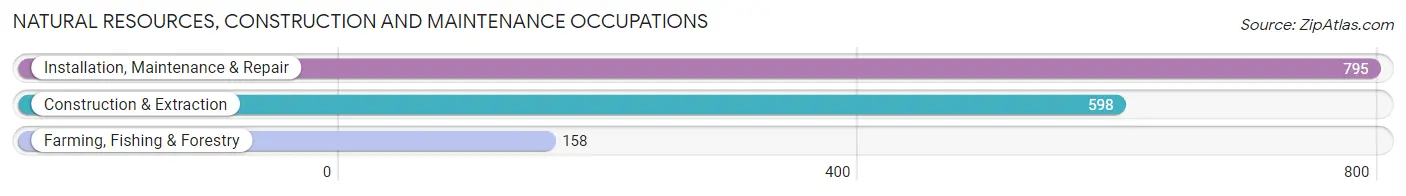
Natural Resources, Construction and Maintenance Occupations
The most common Natural Resources, Construction and Maintenance occupations in Lee County are Installation, Maintenance & Repair (795 | 5.0%), Construction & Extraction (598 | 3.8%), and Farming, Fishing & Forestry (158 | 1.0%).
Natural Resources, Construction and Maintenance Occupations by Sex
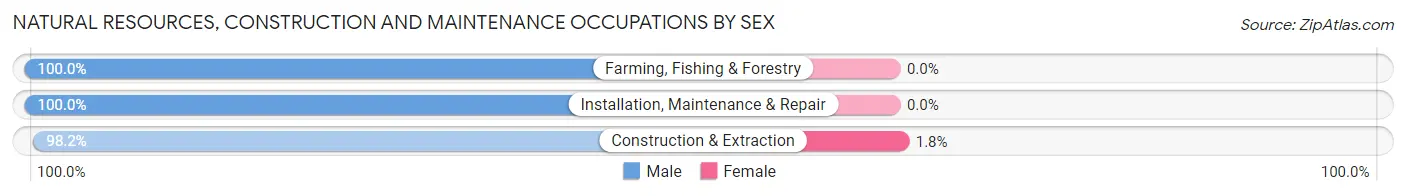
| Occupation | Male | Female |
| Farming, Fishing & Forestry | 158 (100.0%) | 0 (0.0%) |
| Construction & Extraction | 587 (98.2%) | 11 (1.8%) |
| Installation, Maintenance & Repair | 795 (100.0%) | 0 (0.0%) |
| Total (Category) | 1,540 (99.3%) | 11 (0.7%) |
| Total (Overall) | 7,992 (50.3%) | 7,888 (49.7%) |
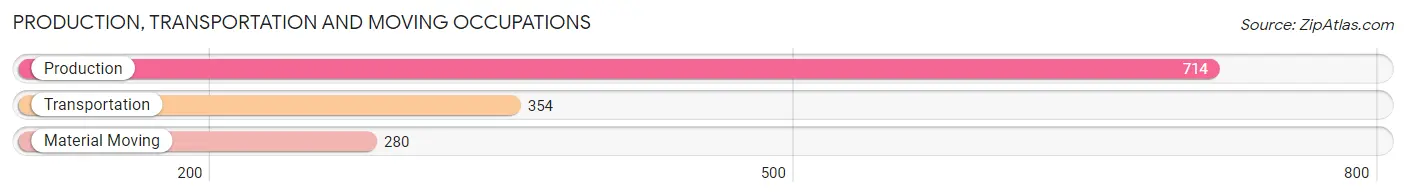
Production, Transportation and Moving Occupations
The most common Production, Transportation and Moving occupations in Lee County are Production (714 | 4.5%), Transportation (354 | 2.2%), and Material Moving (280 | 1.8%).
Production, Transportation and Moving Occupations by Sex
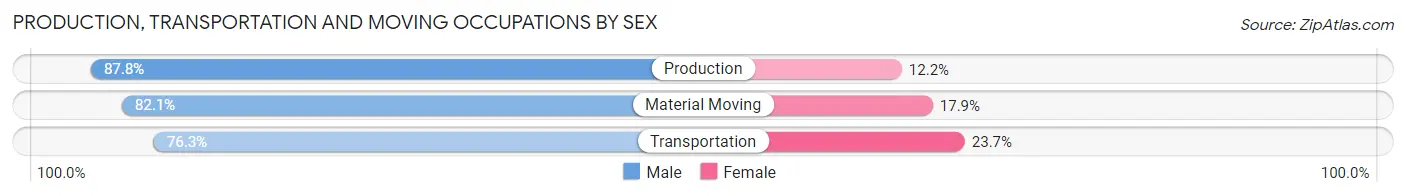
| Occupation | Male | Female |
| Production | 627 (87.8%) | 87 (12.2%) |
| Transportation | 270 (76.3%) | 84 (23.7%) |
| Material Moving | 230 (82.1%) | 50 (17.9%) |
| Total (Category) | 1,127 (83.6%) | 221 (16.4%) |
| Total (Overall) | 7,992 (50.3%) | 7,888 (49.7%) |
Employment Industries by Sex in Lee County
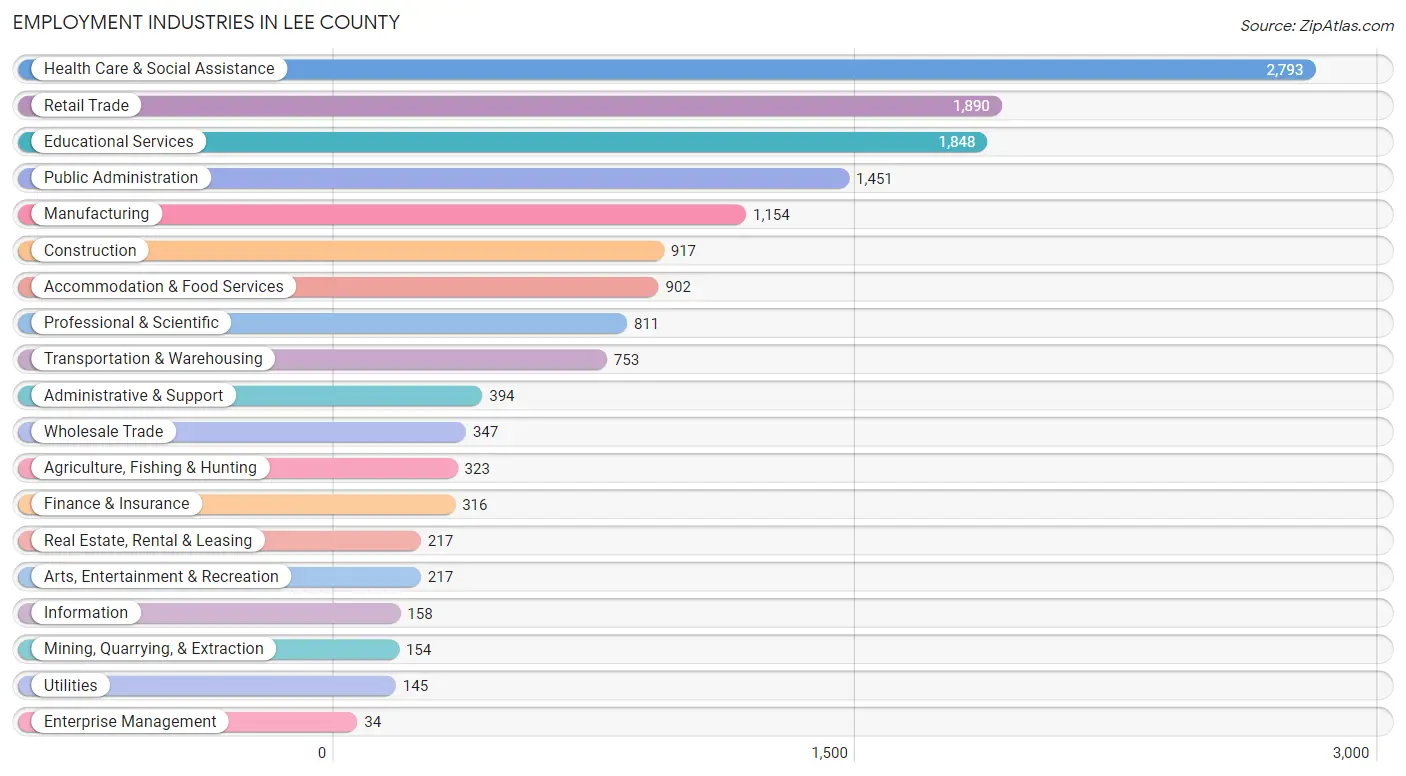
Employment Industries in Lee County
The major employment industries in Lee County include Health Care & Social Assistance (2,793 | 17.6%), Retail Trade (1,890 | 11.9%), Educational Services (1,848 | 11.6%), Public Administration (1,451 | 9.1%), and Manufacturing (1,154 | 7.3%).
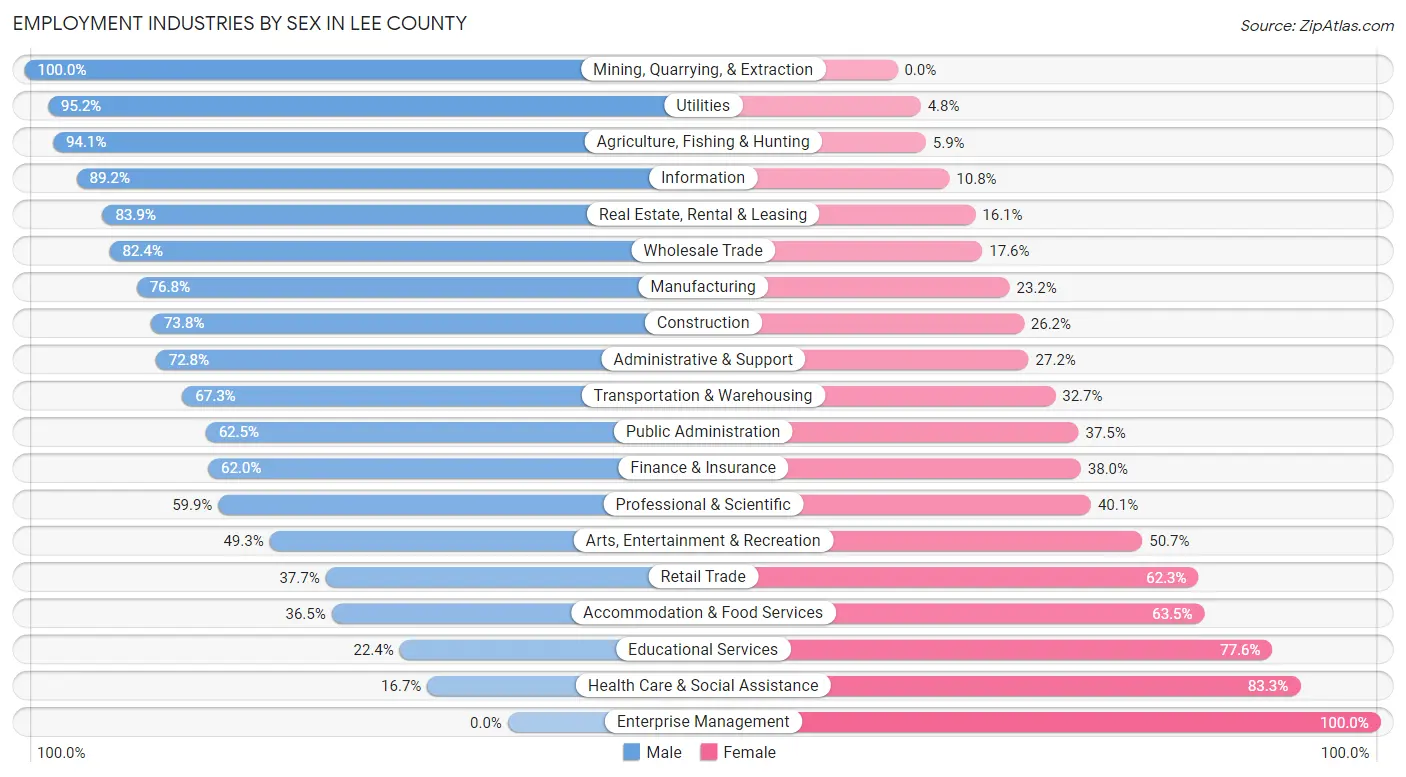
Employment Industries by Sex in Lee County
The Lee County industries that see more men than women are Mining, Quarrying, & Extraction (100.0%), Utilities (95.2%), and Agriculture, Fishing & Hunting (94.1%), whereas the industries that tend to have a higher number of women are Enterprise Management (100.0%), Health Care & Social Assistance (83.3%), and Educational Services (77.6%).
| Industry | Male | Female |
| Agriculture, Fishing & Hunting | 304 (94.1%) | 19 (5.9%) |
| Mining, Quarrying, & Extraction | 154 (100.0%) | 0 (0.0%) |
| Construction | 677 (73.8%) | 240 (26.2%) |
| Manufacturing | 886 (76.8%) | 268 (23.2%) |
| Wholesale Trade | 286 (82.4%) | 61 (17.6%) |
| Retail Trade | 713 (37.7%) | 1,177 (62.3%) |
| Transportation & Warehousing | 507 (67.3%) | 246 (32.7%) |
| Utilities | 138 (95.2%) | 7 (4.8%) |
| Information | 141 (89.2%) | 17 (10.8%) |
| Finance & Insurance | 196 (62.0%) | 120 (38.0%) |
| Real Estate, Rental & Leasing | 182 (83.9%) | 35 (16.1%) |
| Professional & Scientific | 486 (59.9%) | 325 (40.1%) |
| Enterprise Management | 0 (0.0%) | 34 (100.0%) |
| Administrative & Support | 287 (72.8%) | 107 (27.2%) |
| Educational Services | 414 (22.4%) | 1,434 (77.6%) |
| Health Care & Social Assistance | 466 (16.7%) | 2,327 (83.3%) |
| Arts, Entertainment & Recreation | 107 (49.3%) | 110 (50.7%) |
| Accommodation & Food Services | 329 (36.5%) | 573 (63.5%) |
| Public Administration | 907 (62.5%) | 544 (37.5%) |
| Total | 7,992 (50.3%) | 7,888 (49.7%) |
Education in Lee County
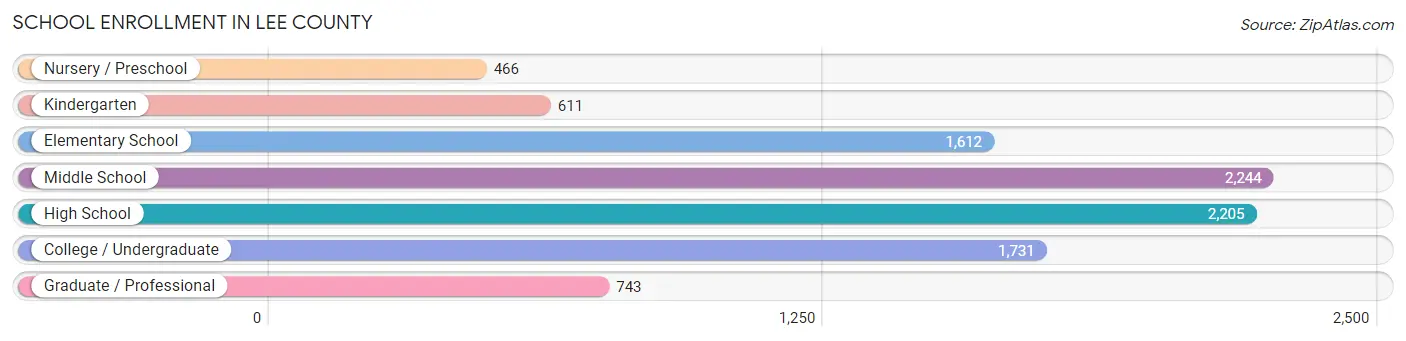
School Enrollment in Lee County
The most common levels of schooling among the 9,612 students in Lee County are middle school (2,244 | 23.4%), high school (2,205 | 22.9%), and college / undergraduate (1,731 | 18.0%).
| School Level | # Students | % Students |
| Nursery / Preschool | 466 | 4.9% |
| Kindergarten | 611 | 6.4% |
| Elementary School | 1,612 | 16.8% |
| Middle School | 2,244 | 23.4% |
| High School | 2,205 | 22.9% |
| College / Undergraduate | 1,731 | 18.0% |
| Graduate / Professional | 743 | 7.7% |
| Total | 9,612 | 100.0% |
School Enrollment by Age by Funding Source in Lee County
Out of a total of 9,612 students who are enrolled in schools in Lee County, 1,028 (10.7%) attend a private institution, while the remaining 8,584 (89.3%) are enrolled in public schools. The age group of 3 to 4 year olds has the highest likelihood of being enrolled in private schools, with 158 (41.6% in the age bracket) enrolled. Conversely, the age group of 15 to 17 year olds has the lowest likelihood of being enrolled in a private school, with 1,629 (99.0% in the age bracket) attending a public institution.
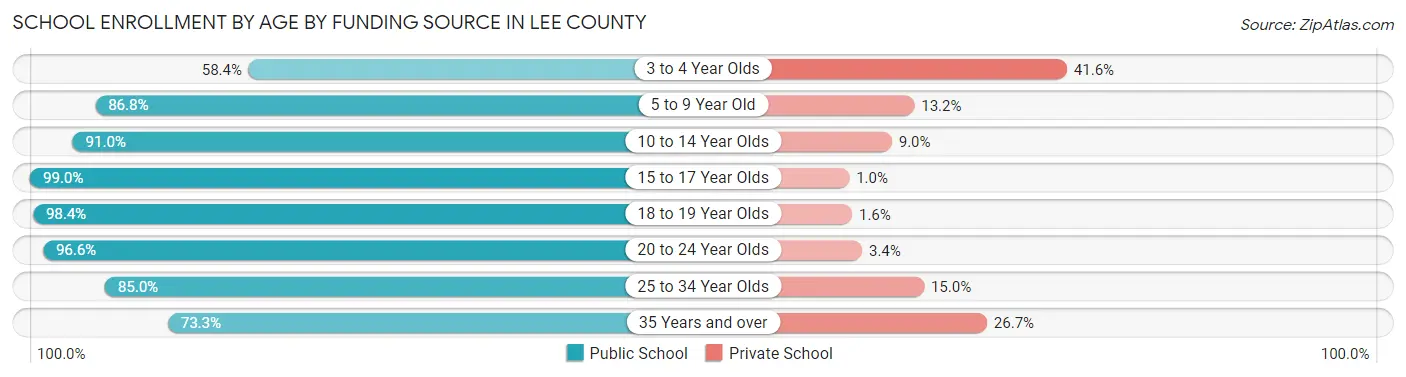
| Age Bracket | Public School | Private School |
| 3 to 4 Year Olds | 222 (58.4%) | 158 (41.6%) |
| 5 to 9 Year Old | 1,715 (86.8%) | 260 (13.2%) |
| 10 to 14 Year Olds | 2,479 (91.0%) | 244 (9.0%) |
| 15 to 17 Year Olds | 1,629 (99.0%) | 17 (1.0%) |
| 18 to 19 Year Olds | 823 (98.4%) | 13 (1.6%) |
| 20 to 24 Year Olds | 565 (96.6%) | 20 (3.4%) |
| 25 to 34 Year Olds | 540 (85.0%) | 95 (15.0%) |
| 35 Years and over | 610 (73.3%) | 222 (26.7%) |
| Total | 8,584 (89.3%) | 1,028 (10.7%) |
Educational Attainment by Field of Study in Lee County
Business (1,630 | 22.4%), education (1,525 | 20.9%), science & technology (1,152 | 15.8%), arts & humanities (779 | 10.7%), and psychology (430 | 5.9%) are the most common fields of study among 7,294 individuals in Lee County who have obtained a bachelor's degree or higher.
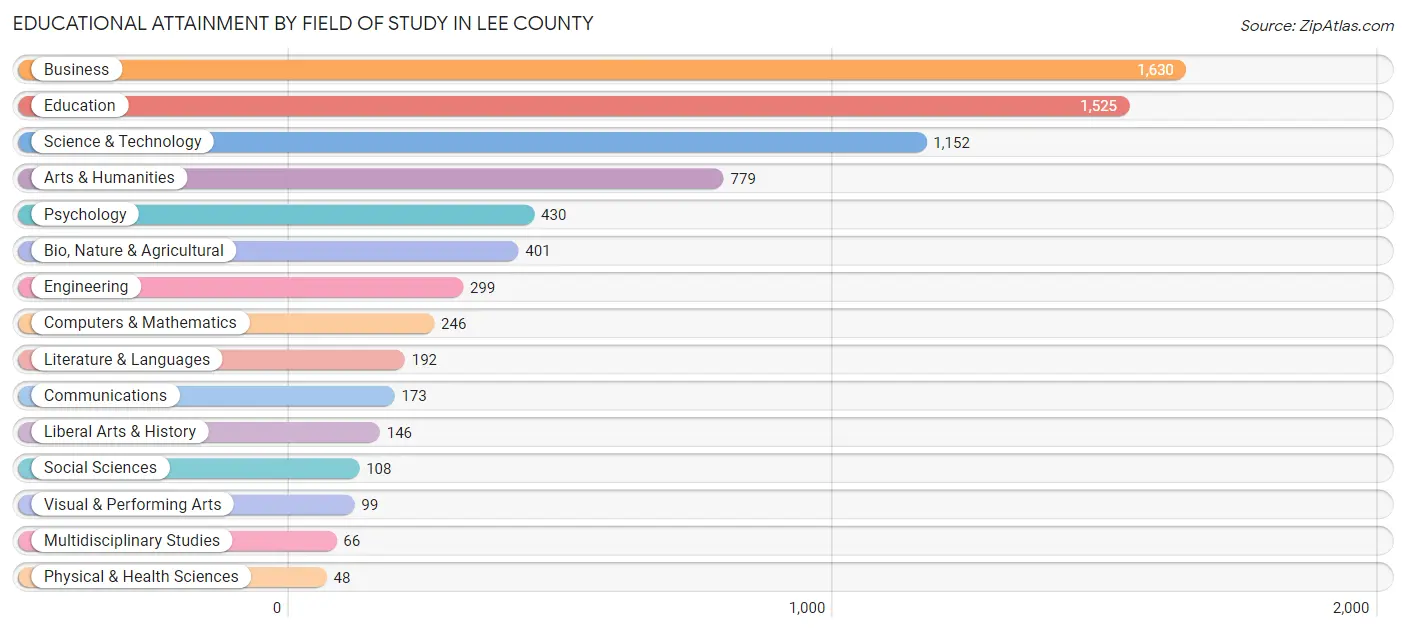
| Field of Study | # Graduates | % Graduates |
| Computers & Mathematics | 246 | 3.4% |
| Bio, Nature & Agricultural | 401 | 5.5% |
| Physical & Health Sciences | 48 | 0.7% |
| Psychology | 430 | 5.9% |
| Social Sciences | 108 | 1.5% |
| Engineering | 299 | 4.1% |
| Multidisciplinary Studies | 66 | 0.9% |
| Science & Technology | 1,152 | 15.8% |
| Business | 1,630 | 22.4% |
| Education | 1,525 | 20.9% |
| Literature & Languages | 192 | 2.6% |
| Liberal Arts & History | 146 | 2.0% |
| Visual & Performing Arts | 99 | 1.4% |
| Communications | 173 | 2.4% |
| Arts & Humanities | 779 | 10.7% |
| Total | 7,294 | 100.0% |
Transportation & Commute in Lee County
Vehicle Availability by Sex in Lee County
The most prevalent vehicle ownership categories in Lee County are males with 2 vehicles (3,233, accounting for 40.2%) and females with 2 vehicles (2,761, making up 42.7%).
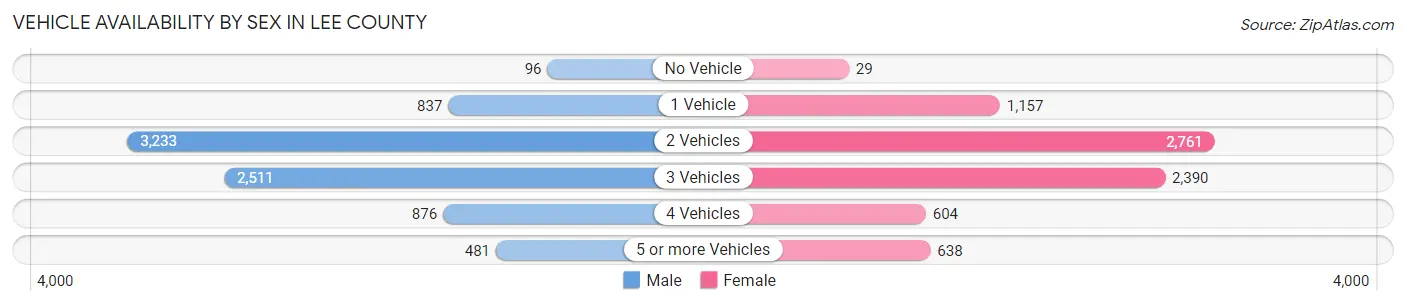
| Vehicles Available | Male | Female |
| No Vehicle | 96 (1.2%) | 29 (0.4%) |
| 1 Vehicle | 837 (10.4%) | 1,157 (15.3%) |
| 2 Vehicles | 3,233 (40.2%) | 2,761 (36.4%) |
| 3 Vehicles | 2,511 (31.2%) | 2,390 (31.5%) |
| 4 Vehicles | 876 (10.9%) | 604 (8.0%) |
| 5 or more Vehicles | 481 (6.0%) | 638 (8.4%) |
| Total | 8,034 (100.0%) | 7,579 (100.0%) |
Commute Time in Lee County
The most frequently occuring commute durations in Lee County are 15 to 19 minutes (3,564 commuters, 24.0%), 20 to 24 minutes (2,748 commuters, 18.5%), and 10 to 14 minutes (2,275 commuters, 15.3%).
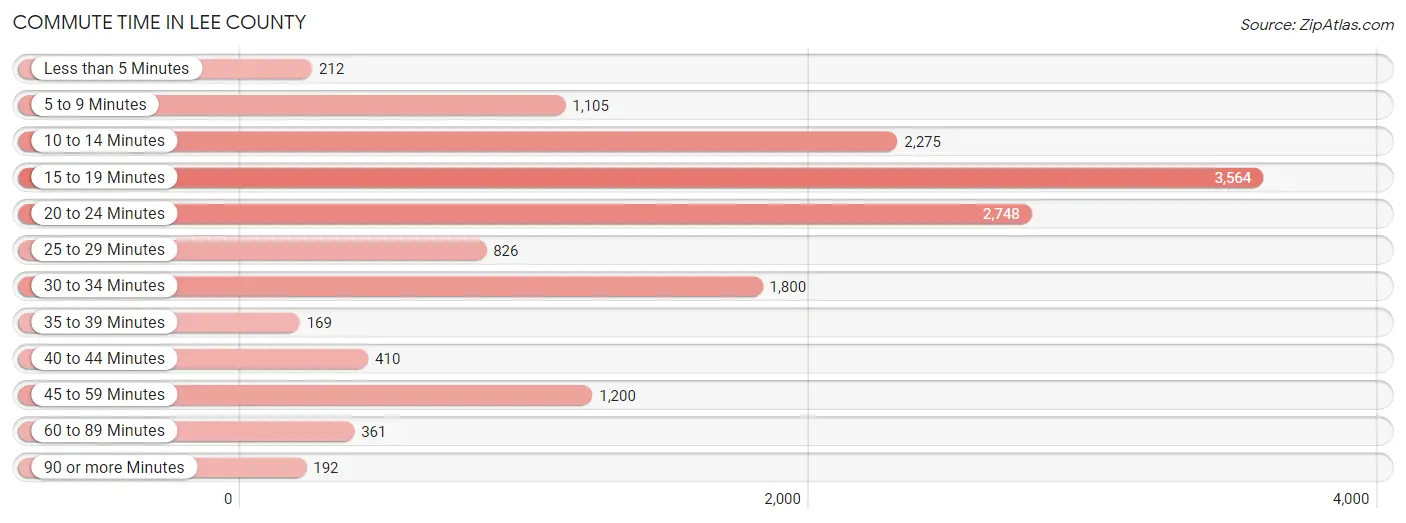
| Commute Time | # Commuters | % Commuters |
| Less than 5 Minutes | 212 | 1.4% |
| 5 to 9 Minutes | 1,105 | 7.4% |
| 10 to 14 Minutes | 2,275 | 15.3% |
| 15 to 19 Minutes | 3,564 | 24.0% |
| 20 to 24 Minutes | 2,748 | 18.5% |
| 25 to 29 Minutes | 826 | 5.6% |
| 30 to 34 Minutes | 1,800 | 12.1% |
| 35 to 39 Minutes | 169 | 1.1% |
| 40 to 44 Minutes | 410 | 2.8% |
| 45 to 59 Minutes | 1,200 | 8.1% |
| 60 to 89 Minutes | 361 | 2.4% |
| 90 or more Minutes | 192 | 1.3% |
Commute Time by Sex in Lee County
The most common commute times in Lee County are 15 to 19 minutes (1,657 commuters, 21.7%) for males and 15 to 19 minutes (1,907 commuters, 26.4%) for females.
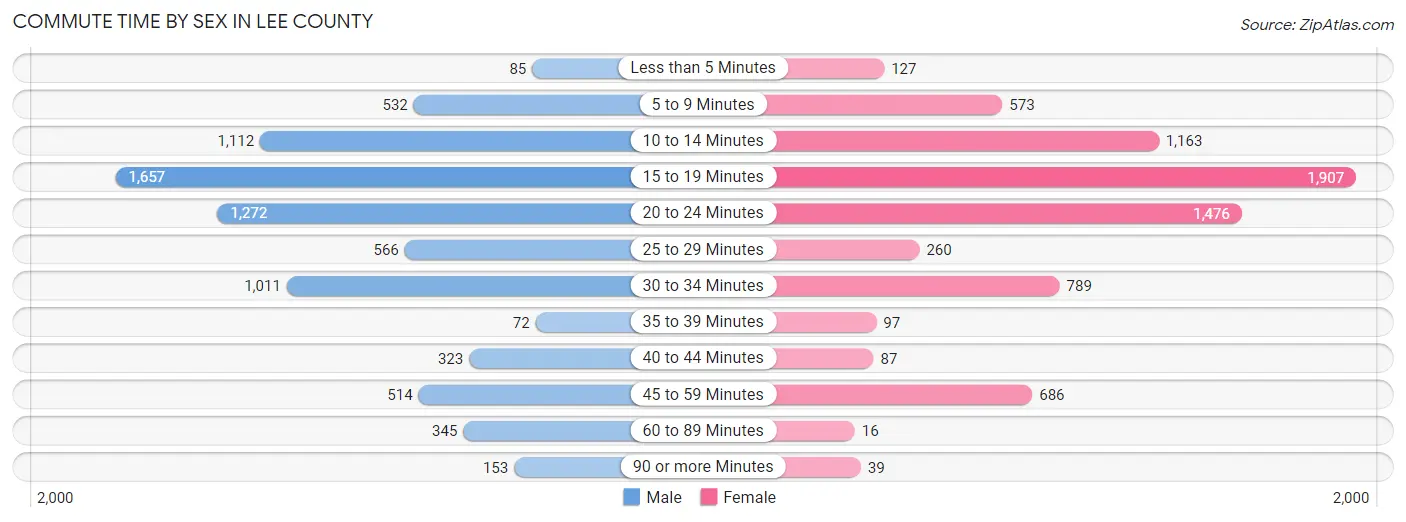
| Commute Time | Male | Female |
| Less than 5 Minutes | 85 (1.1%) | 127 (1.8%) |
| 5 to 9 Minutes | 532 (7.0%) | 573 (7.9%) |
| 10 to 14 Minutes | 1,112 (14.5%) | 1,163 (16.1%) |
| 15 to 19 Minutes | 1,657 (21.7%) | 1,907 (26.4%) |
| 20 to 24 Minutes | 1,272 (16.6%) | 1,476 (20.4%) |
| 25 to 29 Minutes | 566 (7.4%) | 260 (3.6%) |
| 30 to 34 Minutes | 1,011 (13.2%) | 789 (10.9%) |
| 35 to 39 Minutes | 72 (0.9%) | 97 (1.3%) |
| 40 to 44 Minutes | 323 (4.2%) | 87 (1.2%) |
| 45 to 59 Minutes | 514 (6.7%) | 686 (9.5%) |
| 60 to 89 Minutes | 345 (4.5%) | 16 (0.2%) |
| 90 or more Minutes | 153 (2.0%) | 39 (0.5%) |
Time of Departure to Work by Sex in Lee County
The most frequent times of departure to work in Lee County are 7:30 AM to 7:59 AM (1,671, 21.9%) for males and 7:30 AM to 7:59 AM (1,659, 23.0%) for females.
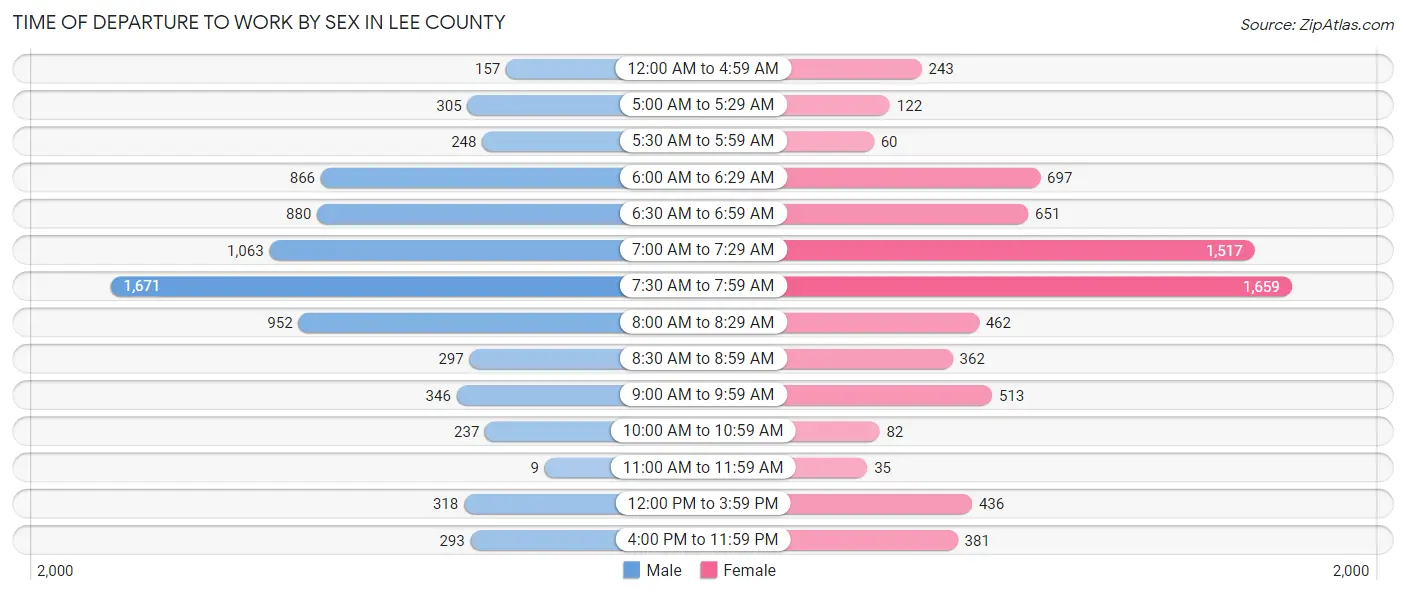
| Time of Departure | Male | Female |
| 12:00 AM to 4:59 AM | 157 (2.1%) | 243 (3.4%) |
| 5:00 AM to 5:29 AM | 305 (4.0%) | 122 (1.7%) |
| 5:30 AM to 5:59 AM | 248 (3.3%) | 60 (0.8%) |
| 6:00 AM to 6:29 AM | 866 (11.3%) | 697 (9.7%) |
| 6:30 AM to 6:59 AM | 880 (11.5%) | 651 (9.0%) |
| 7:00 AM to 7:29 AM | 1,063 (13.9%) | 1,517 (21.0%) |
| 7:30 AM to 7:59 AM | 1,671 (21.9%) | 1,659 (23.0%) |
| 8:00 AM to 8:29 AM | 952 (12.5%) | 462 (6.4%) |
| 8:30 AM to 8:59 AM | 297 (3.9%) | 362 (5.0%) |
| 9:00 AM to 9:59 AM | 346 (4.5%) | 513 (7.1%) |
| 10:00 AM to 10:59 AM | 237 (3.1%) | 82 (1.1%) |
| 11:00 AM to 11:59 AM | 9 (0.1%) | 35 (0.5%) |
| 12:00 PM to 3:59 PM | 318 (4.2%) | 436 (6.0%) |
| 4:00 PM to 11:59 PM | 293 (3.8%) | 381 (5.3%) |
| Total | 7,642 (100.0%) | 7,220 (100.0%) |
Housing Occupancy in Lee County
Occupancy by Ownership in Lee County
Of the total 11,806 dwellings in Lee County, owner-occupied units account for 8,833 (74.8%), while renter-occupied units make up 2,973 (25.2%).
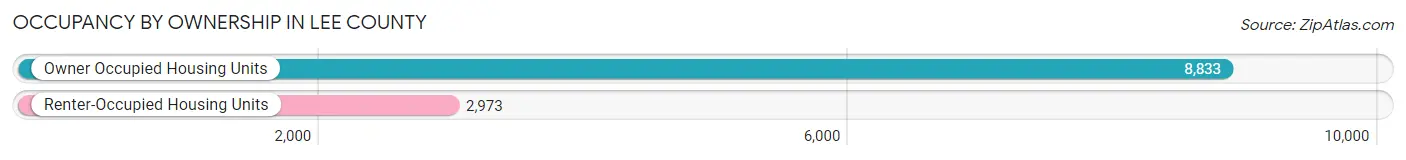
| Occupancy | # Housing Units | % Housing Units |
| Owner Occupied Housing Units | 8,833 | 74.8% |
| Renter-Occupied Housing Units | 2,973 | 25.2% |
| Total Occupied Housing Units | 11,806 | 100.0% |
Occupancy by Household Size in Lee County
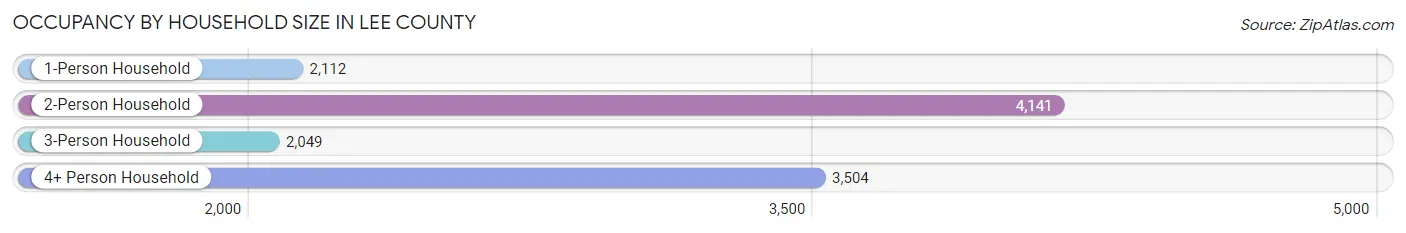
| Household Size | # Housing Units | % Housing Units |
| 1-Person Household | 2,112 | 17.9% |
| 2-Person Household | 4,141 | 35.1% |
| 3-Person Household | 2,049 | 17.4% |
| 4+ Person Household | 3,504 | 29.7% |
| Total Housing Units | 11,806 | 100.0% |
Occupancy by Ownership by Household Size in Lee County
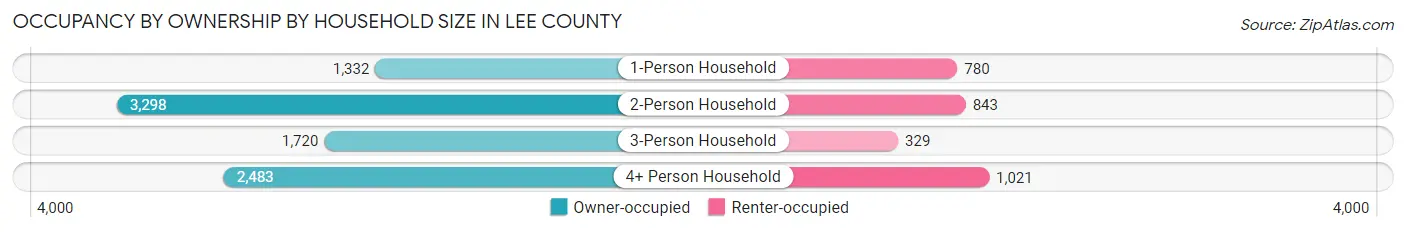
| Household Size | Owner-occupied | Renter-occupied |
| 1-Person Household | 1,332 (63.1%) | 780 (36.9%) |
| 2-Person Household | 3,298 (79.6%) | 843 (20.4%) |
| 3-Person Household | 1,720 (83.9%) | 329 (16.1%) |
| 4+ Person Household | 2,483 (70.9%) | 1,021 (29.1%) |
| Total Housing Units | 8,833 (74.8%) | 2,973 (25.2%) |
Occupancy by Educational Attainment in Lee County
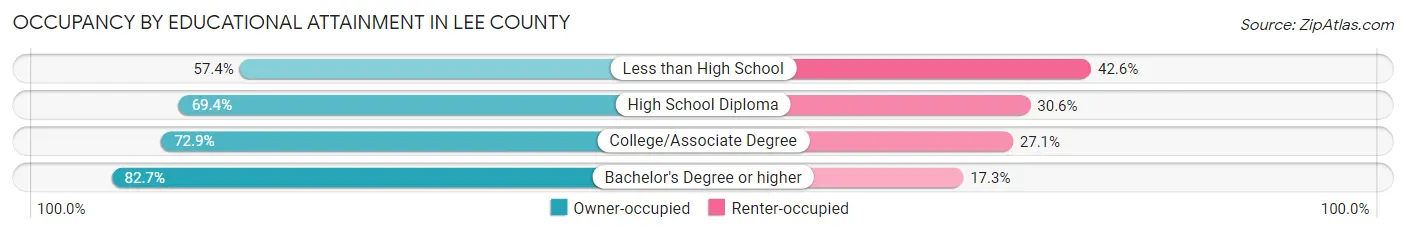
| Household Size | Owner-occupied | Renter-occupied |
| Less than High School | 462 (57.4%) | 343 (42.6%) |
| High School Diploma | 2,024 (69.4%) | 891 (30.6%) |
| College/Associate Degree | 2,542 (72.9%) | 945 (27.1%) |
| Bachelor's Degree or higher | 3,805 (82.7%) | 794 (17.3%) |
Occupancy by Age of Householder in Lee County
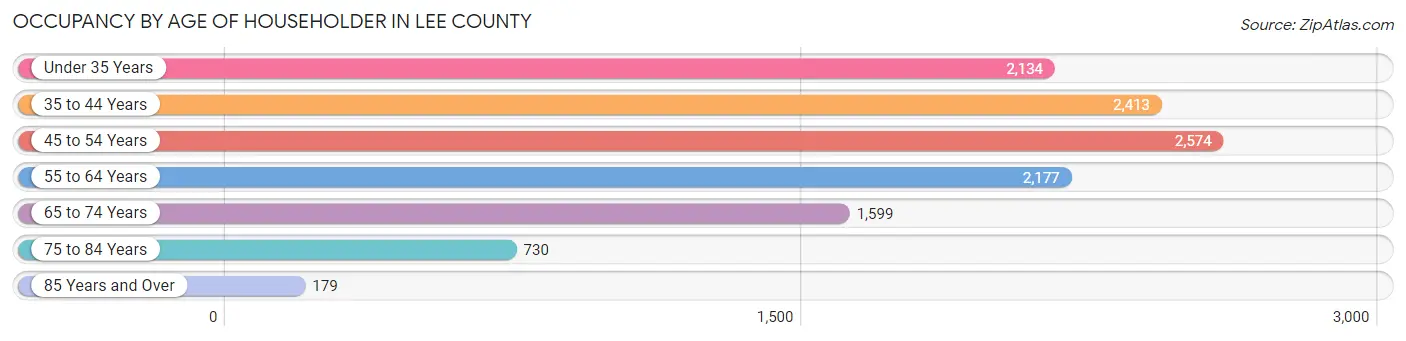
| Age Bracket | # Households | % Households |
| Under 35 Years | 2,134 | 18.1% |
| 35 to 44 Years | 2,413 | 20.4% |
| 45 to 54 Years | 2,574 | 21.8% |
| 55 to 64 Years | 2,177 | 18.4% |
| 65 to 74 Years | 1,599 | 13.5% |
| 75 to 84 Years | 730 | 6.2% |
| 85 Years and Over | 179 | 1.5% |
| Total | 11,806 | 100.0% |
Housing Finances in Lee County
Median Income by Occupancy in Lee County
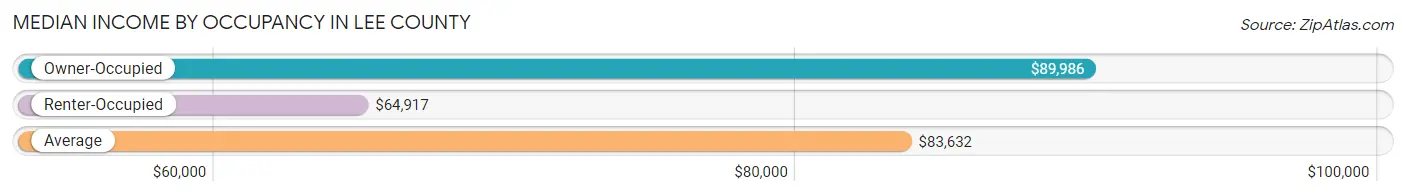
| Occupancy Type | # Households | Median Income |
| Owner-Occupied | 8,833 (74.8%) | $89,986 |
| Renter-Occupied | 2,973 (25.2%) | $64,917 |
| Average | 11,806 (100.0%) | $83,632 |
Occupancy by Householder Income Bracket in Lee County
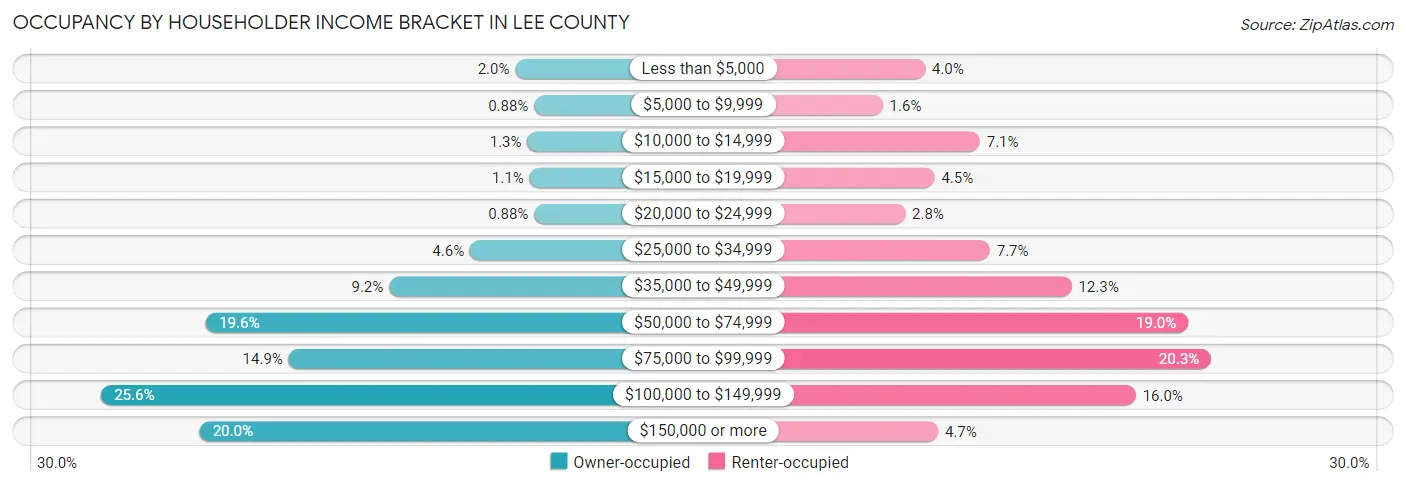
| Income Bracket | Owner-occupied | Renter-occupied |
| Less than $5,000 | 173 (2.0%) | 118 (4.0%) |
| $5,000 to $9,999 | 78 (0.9%) | 46 (1.5%) |
| $10,000 to $14,999 | 112 (1.3%) | 211 (7.1%) |
| $15,000 to $19,999 | 101 (1.1%) | 134 (4.5%) |
| $20,000 to $24,999 | 78 (0.9%) | 84 (2.8%) |
| $25,000 to $34,999 | 402 (4.5%) | 228 (7.7%) |
| $35,000 to $49,999 | 810 (9.2%) | 367 (12.3%) |
| $50,000 to $74,999 | 1,733 (19.6%) | 565 (19.0%) |
| $75,000 to $99,999 | 1,317 (14.9%) | 604 (20.3%) |
| $100,000 to $149,999 | 2,263 (25.6%) | 476 (16.0%) |
| $150,000 or more | 1,766 (20.0%) | 140 (4.7%) |
| Total | 8,833 (100.0%) | 2,973 (100.0%) |
Monthly Housing Cost Tiers in Lee County
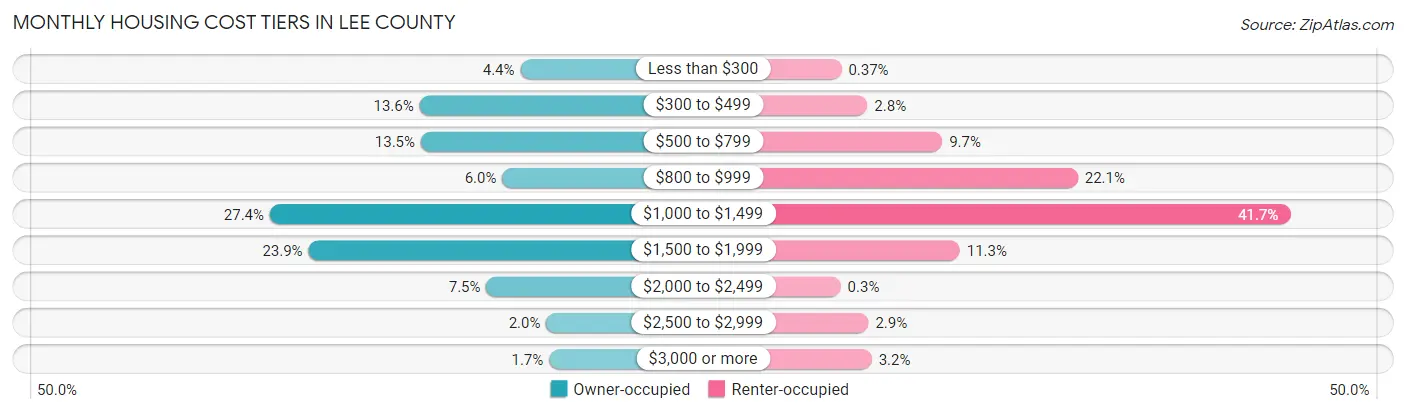
| Monthly Cost | Owner-occupied | Renter-occupied |
| Less than $300 | 385 (4.4%) | 11 (0.4%) |
| $300 to $499 | 1,205 (13.6%) | 82 (2.8%) |
| $500 to $799 | 1,194 (13.5%) | 287 (9.7%) |
| $800 to $999 | 532 (6.0%) | 658 (22.1%) |
| $1,000 to $1,499 | 2,422 (27.4%) | 1,239 (41.7%) |
| $1,500 to $1,999 | 2,108 (23.9%) | 335 (11.3%) |
| $2,000 to $2,499 | 662 (7.5%) | 9 (0.3%) |
| $2,500 to $2,999 | 174 (2.0%) | 85 (2.9%) |
| $3,000 or more | 151 (1.7%) | 94 (3.2%) |
| Total | 8,833 (100.0%) | 2,973 (100.0%) |
Physical Housing Characteristics in Lee County
Housing Structures in Lee County
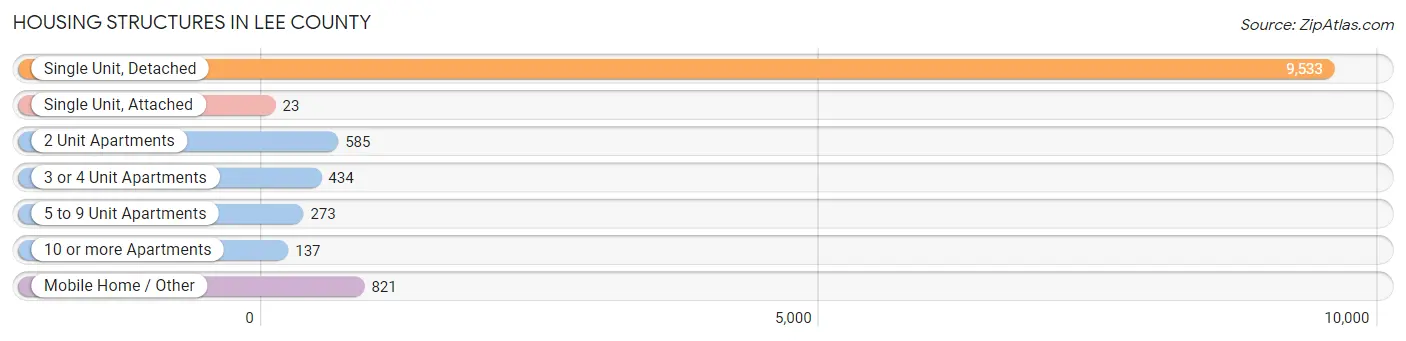
| Structure Type | # Housing Units | % Housing Units |
| Single Unit, Detached | 9,533 | 80.7% |
| Single Unit, Attached | 23 | 0.2% |
| 2 Unit Apartments | 585 | 5.0% |
| 3 or 4 Unit Apartments | 434 | 3.7% |
| 5 to 9 Unit Apartments | 273 | 2.3% |
| 10 or more Apartments | 137 | 1.2% |
| Mobile Home / Other | 821 | 7.0% |
| Total | 11,806 | 100.0% |
Housing Structures by Occupancy in Lee County
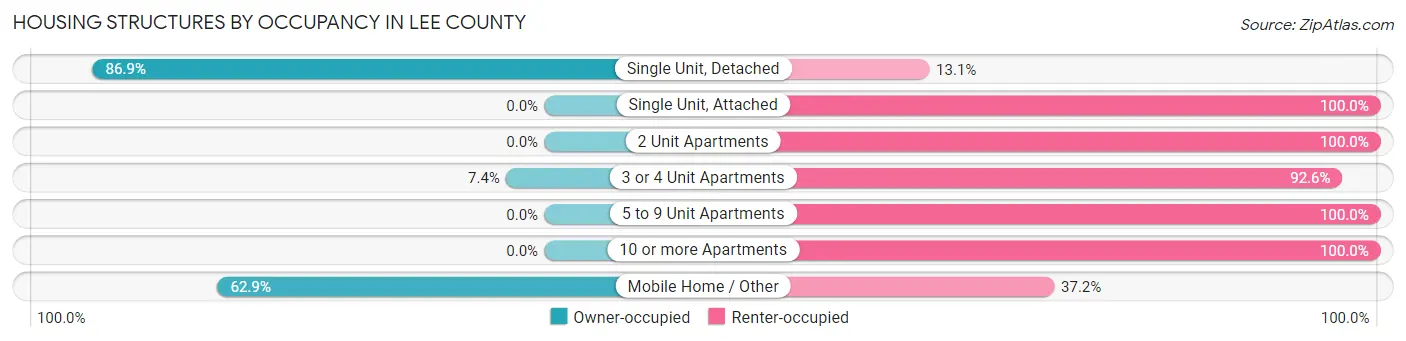
| Structure Type | Owner-occupied | Renter-occupied |
| Single Unit, Detached | 8,285 (86.9%) | 1,248 (13.1%) |
| Single Unit, Attached | 0 (0.0%) | 23 (100.0%) |
| 2 Unit Apartments | 0 (0.0%) | 585 (100.0%) |
| 3 or 4 Unit Apartments | 32 (7.4%) | 402 (92.6%) |
| 5 to 9 Unit Apartments | 0 (0.0%) | 273 (100.0%) |
| 10 or more Apartments | 0 (0.0%) | 137 (100.0%) |
| Mobile Home / Other | 516 (62.8%) | 305 (37.1%) |
| Total | 8,833 (74.8%) | 2,973 (25.2%) |
Housing Structures by Number of Rooms in Lee County
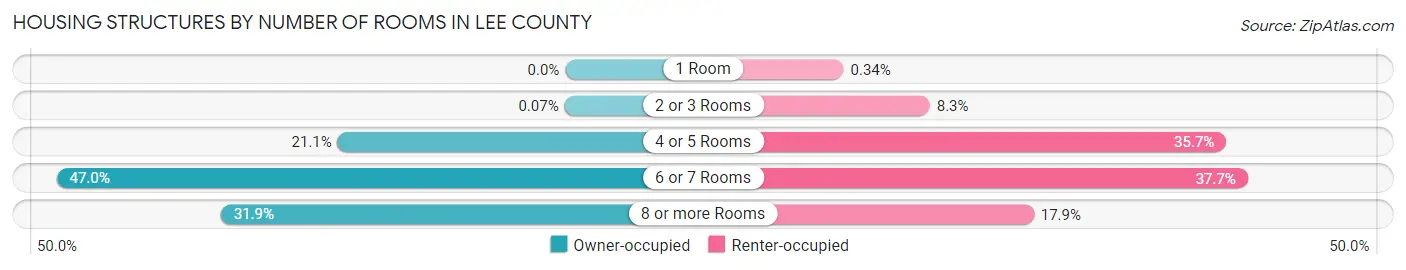
| Number of Rooms | Owner-occupied | Renter-occupied |
| 1 Room | 0 (0.0%) | 10 (0.3%) |
| 2 or 3 Rooms | 6 (0.1%) | 247 (8.3%) |
| 4 or 5 Rooms | 1,859 (21.0%) | 1,062 (35.7%) |
| 6 or 7 Rooms | 4,155 (47.0%) | 1,121 (37.7%) |
| 8 or more Rooms | 2,813 (31.9%) | 533 (17.9%) |
| Total | 8,833 (100.0%) | 2,973 (100.0%) |
Housing Structure by Heating Type in Lee County

| Heating Type | Owner-occupied | Renter-occupied |
| Utility Gas | 175 (2.0%) | 125 (4.2%) |
| Bottled, Tank, or LP Gas | 387 (4.4%) | 111 (3.7%) |
| Electricity | 8,247 (93.4%) | 2,684 (90.3%) |
| Fuel Oil or Kerosene | 5 (0.1%) | 0 (0.0%) |
| Coal or Coke | 0 (0.0%) | 0 (0.0%) |
| All other Fuels | 0 (0.0%) | 0 (0.0%) |
| No Fuel Used | 19 (0.2%) | 53 (1.8%) |
| Total | 8,833 (100.0%) | 2,973 (100.0%) |
Household Vehicle Usage in Lee County
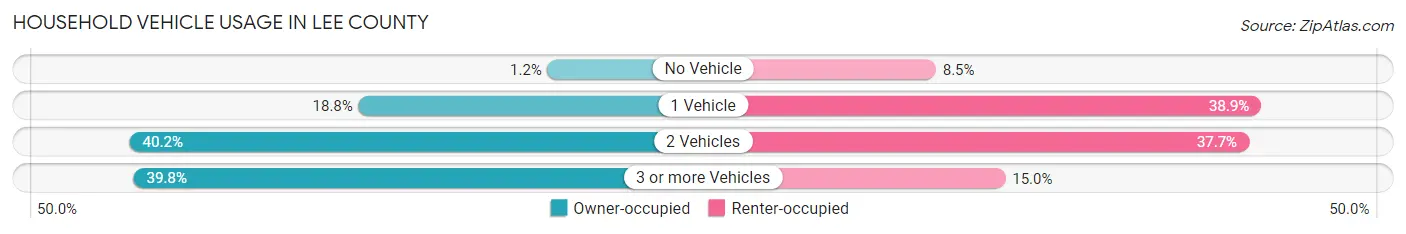
| Vehicles per Household | Owner-occupied | Renter-occupied |
| No Vehicle | 103 (1.2%) | 252 (8.5%) |
| 1 Vehicle | 1,662 (18.8%) | 1,155 (38.9%) |
| 2 Vehicles | 3,550 (40.2%) | 1,121 (37.7%) |
| 3 or more Vehicles | 3,518 (39.8%) | 445 (15.0%) |
| Total | 8,833 (100.0%) | 2,973 (100.0%) |
Real Estate & Mortgages in Lee County
Real Estate and Mortgage Overview in Lee County
| Characteristic | Without Mortgage | With Mortgage |
| Housing Units | 2,825 | 6,008 |
| Median Property Value | $189,600 | $213,600 |
| Median Household Income | $59,394 | $1,552 |
| Monthly Housing Costs | $480 | $151 |
| Real Estate Taxes | $1,859 | $183 |
Property Value by Mortgage Status in Lee County
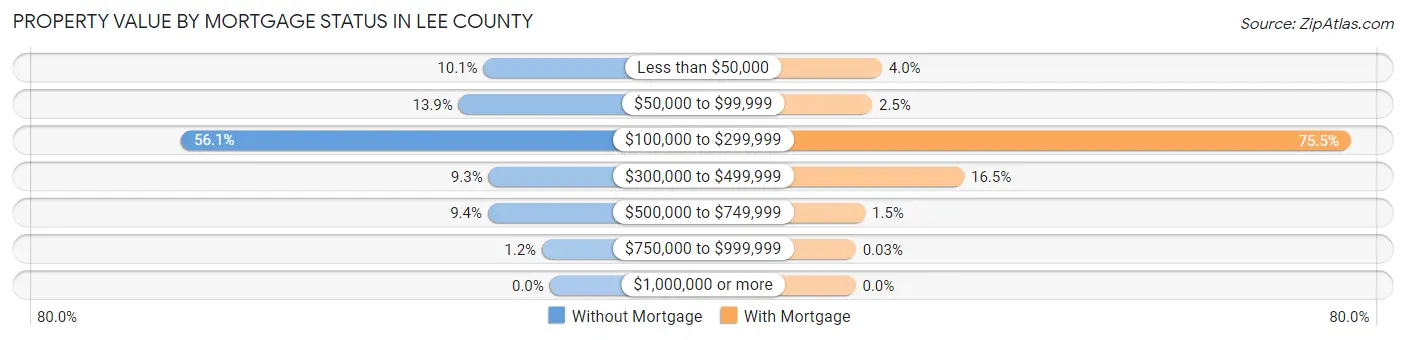
| Property Value | Without Mortgage | With Mortgage |
| Less than $50,000 | 285 (10.1%) | 241 (4.0%) |
| $50,000 to $99,999 | 392 (13.9%) | 151 (2.5%) |
| $100,000 to $299,999 | 1,586 (56.1%) | 4,533 (75.4%) |
| $300,000 to $499,999 | 263 (9.3%) | 993 (16.5%) |
| $500,000 to $749,999 | 266 (9.4%) | 88 (1.5%) |
| $750,000 to $999,999 | 33 (1.2%) | 2 (0.0%) |
| $1,000,000 or more | 0 (0.0%) | 0 (0.0%) |
| Total | 2,825 (100.0%) | 6,008 (100.0%) |
Household Income by Mortgage Status in Lee County
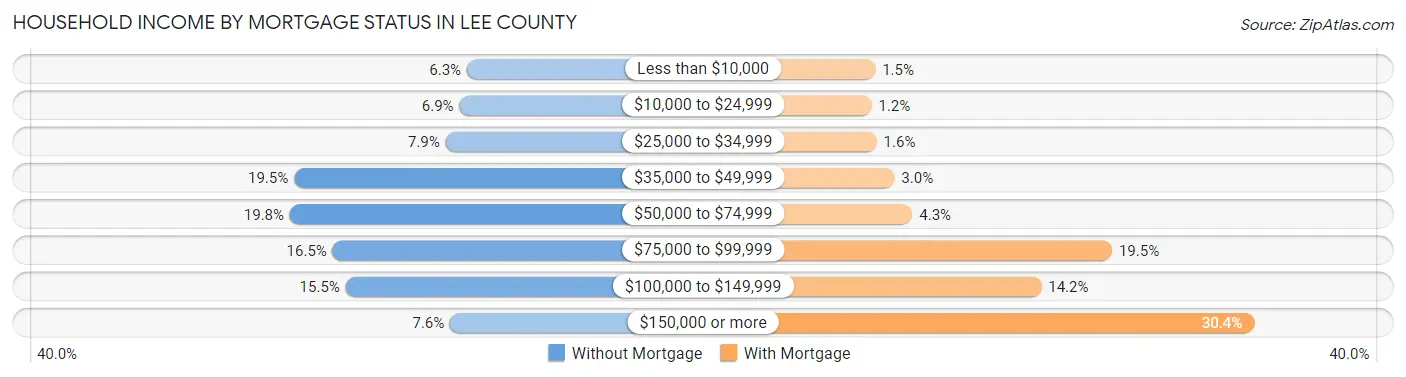
| Household Income | Without Mortgage | With Mortgage |
| Less than $10,000 | 178 (6.3%) | 90 (1.5%) |
| $10,000 to $24,999 | 194 (6.9%) | 73 (1.2%) |
| $25,000 to $34,999 | 224 (7.9%) | 97 (1.6%) |
| $35,000 to $49,999 | 550 (19.5%) | 178 (3.0%) |
| $50,000 to $74,999 | 559 (19.8%) | 260 (4.3%) |
| $75,000 to $99,999 | 467 (16.5%) | 1,174 (19.5%) |
| $100,000 to $149,999 | 439 (15.5%) | 850 (14.1%) |
| $150,000 or more | 214 (7.6%) | 1,824 (30.4%) |
| Total | 2,825 (100.0%) | 6,008 (100.0%) |
Property Value to Household Income Ratio in Lee County
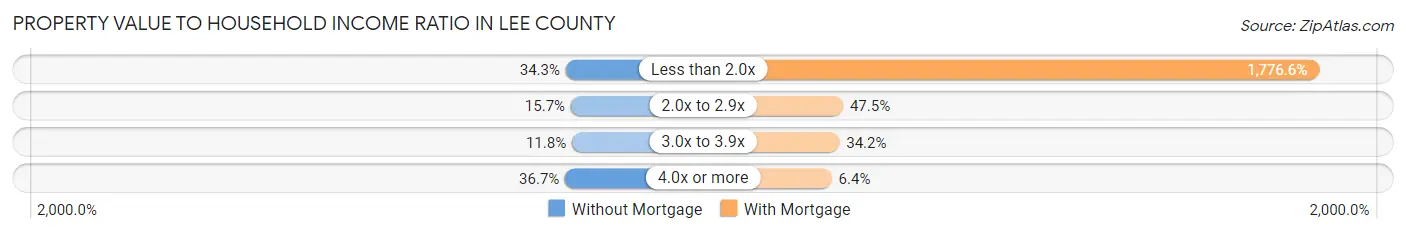
| Value-to-Income Ratio | Without Mortgage | With Mortgage |
| Less than 2.0x | 970 (34.3%) | 106,738 (1,776.6%) |
| 2.0x to 2.9x | 444 (15.7%) | 2,853 (47.5%) |
| 3.0x to 3.9x | 334 (11.8%) | 2,053 (34.2%) |
| 4.0x or more | 1,036 (36.7%) | 382 (6.4%) |
| Total | 2,825 (100.0%) | 6,008 (100.0%) |
Real Estate Taxes by Mortgage Status in Lee County
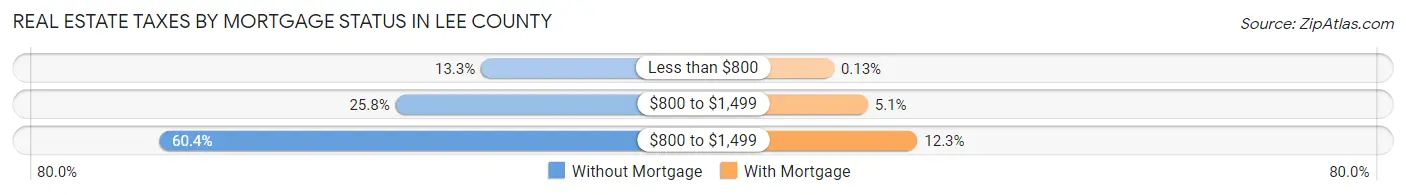
| Property Taxes | Without Mortgage | With Mortgage |
| Less than $800 | 376 (13.3%) | 8 (0.1%) |
| $800 to $1,499 | 729 (25.8%) | 306 (5.1%) |
| $800 to $1,499 | 1,705 (60.4%) | 740 (12.3%) |
| Total | 2,825 (100.0%) | 6,008 (100.0%) |
Health & Disability in Lee County
Health Insurance Coverage by Age in Lee County
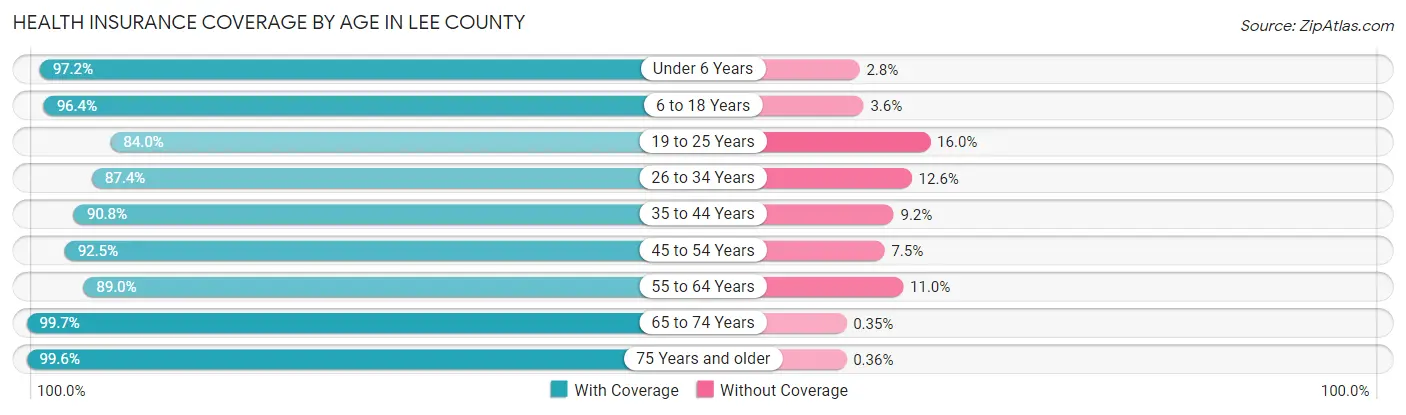
| Age Bracket | With Coverage | Without Coverage |
| Under 6 Years | 2,542 (97.2%) | 74 (2.8%) |
| 6 to 18 Years | 6,296 (96.4%) | 233 (3.6%) |
| 19 to 25 Years | 2,151 (84.0%) | 410 (16.0%) |
| 26 to 34 Years | 3,085 (87.4%) | 443 (12.6%) |
| 35 to 44 Years | 3,889 (90.8%) | 393 (9.2%) |
| 45 to 54 Years | 4,137 (92.5%) | 335 (7.5%) |
| 55 to 64 Years | 3,264 (89.0%) | 402 (11.0%) |
| 65 to 74 Years | 2,815 (99.7%) | 10 (0.4%) |
| 75 Years and older | 1,378 (99.6%) | 5 (0.4%) |
| Total | 29,557 (92.8%) | 2,305 (7.2%) |
Health Insurance Coverage by Citizenship Status in Lee County
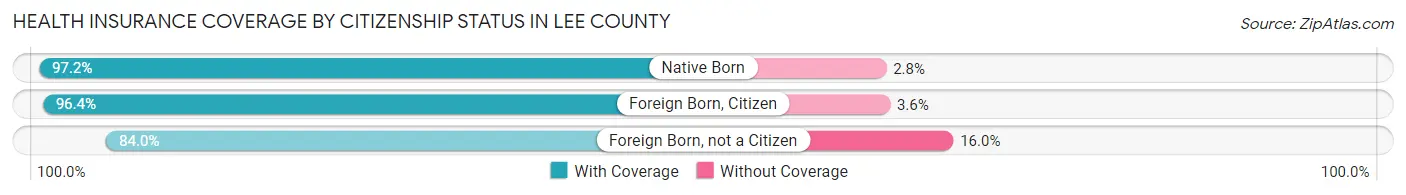
| Citizenship Status | With Coverage | Without Coverage |
| Native Born | 2,542 (97.2%) | 74 (2.8%) |
| Foreign Born, Citizen | 6,296 (96.4%) | 233 (3.6%) |
| Foreign Born, not a Citizen | 2,151 (84.0%) | 410 (16.0%) |
Health Insurance Coverage by Household Income in Lee County
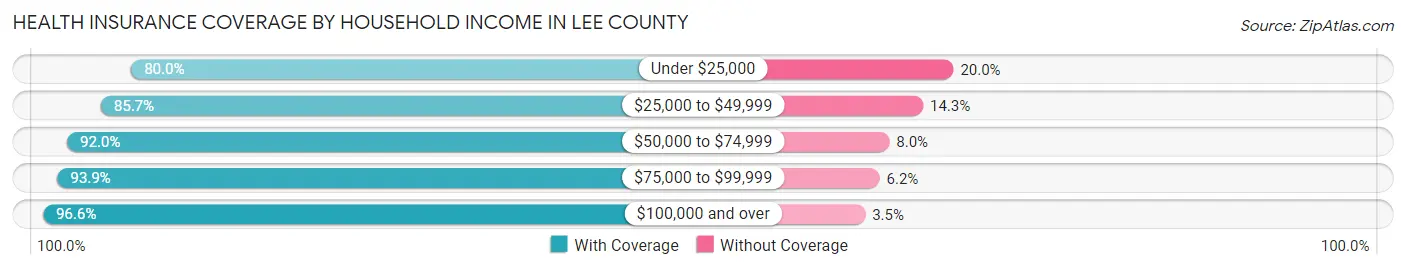
| Household Income | With Coverage | Without Coverage |
| Under $25,000 | 1,782 (80.0%) | 445 (20.0%) |
| $25,000 to $49,999 | 3,281 (85.7%) | 547 (14.3%) |
| $50,000 to $74,999 | 5,392 (92.0%) | 467 (8.0%) |
| $75,000 to $99,999 | 4,762 (93.9%) | 312 (6.1%) |
| $100,000 and over | 14,284 (96.6%) | 510 (3.5%) |
Public vs Private Health Insurance Coverage by Age in Lee County
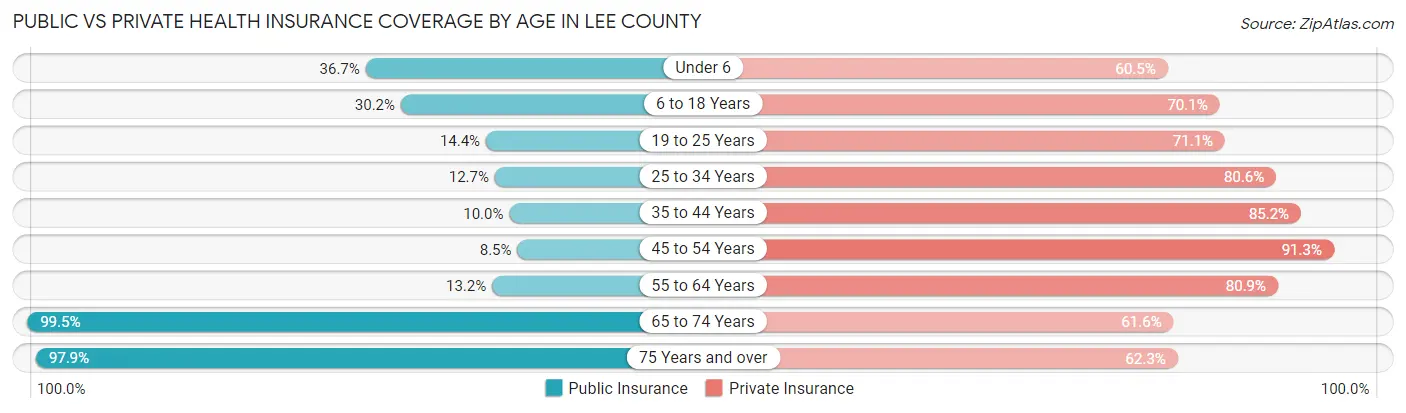
| Age Bracket | Public Insurance | Private Insurance |
| Under 6 | 960 (36.7%) | 1,582 (60.5%) |
| 6 to 18 Years | 1,969 (30.2%) | 4,577 (70.1%) |
| 19 to 25 Years | 368 (14.4%) | 1,821 (71.1%) |
| 25 to 34 Years | 449 (12.7%) | 2,844 (80.6%) |
| 35 to 44 Years | 430 (10.0%) | 3,649 (85.2%) |
| 45 to 54 Years | 382 (8.5%) | 4,083 (91.3%) |
| 55 to 64 Years | 485 (13.2%) | 2,967 (80.9%) |
| 65 to 74 Years | 2,811 (99.5%) | 1,739 (61.6%) |
| 75 Years and over | 1,354 (97.9%) | 862 (62.3%) |
| Total | 9,208 (28.9%) | 24,124 (75.7%) |
Disability Status by Sex by Age in Lee County
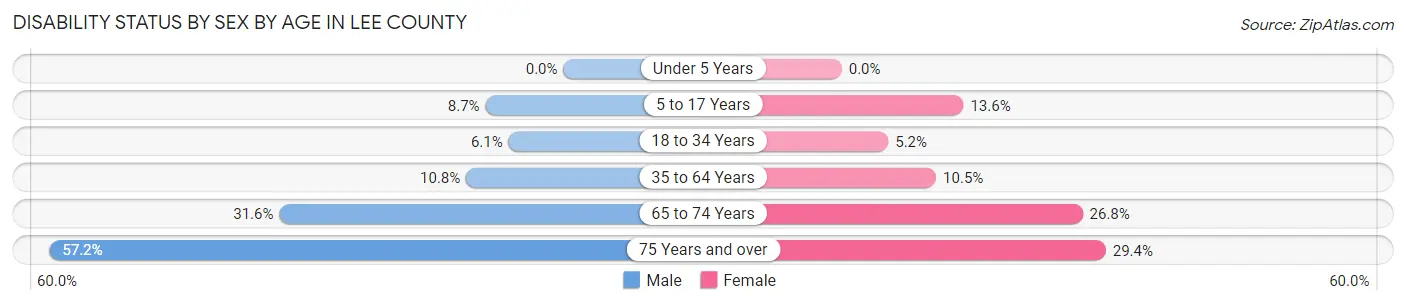
| Age Bracket | Male | Female |
| Under 5 Years | 0 (0.0%) | 0 (0.0%) |
| 5 to 17 Years | 312 (8.7%) | 404 (13.6%) |
| 18 to 34 Years | 197 (6.1%) | 175 (5.2%) |
| 35 to 64 Years | 636 (10.8%) | 688 (10.5%) |
| 65 to 74 Years | 429 (31.6%) | 394 (26.8%) |
| 75 Years and over | 340 (57.2%) | 232 (29.4%) |
Disability Class by Sex by Age in Lee County
Disability Class: Hearing Difficulty
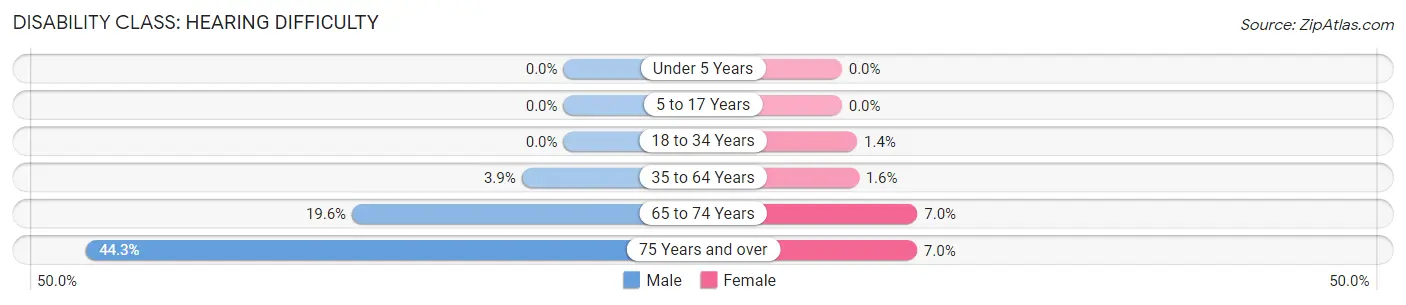
| Age Bracket | Male | Female |
| Under 5 Years | 0 (0.0%) | 0 (0.0%) |
| 5 to 17 Years | 0 (0.0%) | 0 (0.0%) |
| 18 to 34 Years | 0 (0.0%) | 48 (1.4%) |
| 35 to 64 Years | 228 (3.9%) | 103 (1.6%) |
| 65 to 74 Years | 266 (19.6%) | 103 (7.0%) |
| 75 Years and over | 263 (44.3%) | 55 (7.0%) |
Disability Class: Vision Difficulty
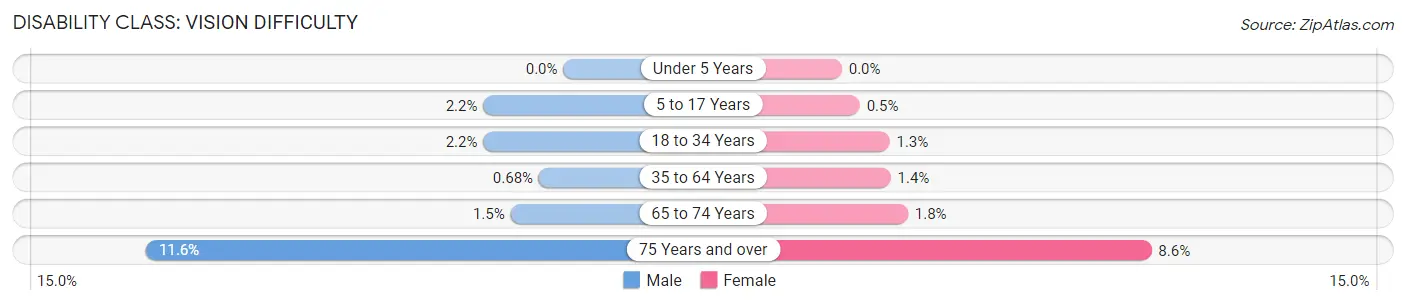
| Age Bracket | Male | Female |
| Under 5 Years | 0 (0.0%) | 0 (0.0%) |
| 5 to 17 Years | 80 (2.2%) | 15 (0.5%) |
| 18 to 34 Years | 72 (2.2%) | 45 (1.3%) |
| 35 to 64 Years | 40 (0.7%) | 89 (1.4%) |
| 65 to 74 Years | 20 (1.5%) | 27 (1.8%) |
| 75 Years and over | 69 (11.6%) | 68 (8.6%) |
Disability Class: Cognitive Difficulty
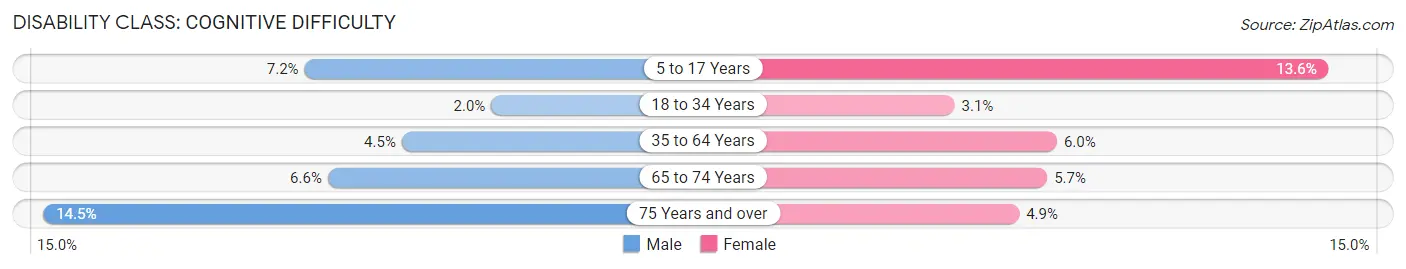
| Age Bracket | Male | Female |
| 5 to 17 Years | 259 (7.2%) | 404 (13.6%) |
| 18 to 34 Years | 65 (2.0%) | 106 (3.1%) |
| 35 to 64 Years | 264 (4.5%) | 392 (6.0%) |
| 65 to 74 Years | 89 (6.6%) | 84 (5.7%) |
| 75 Years and over | 86 (14.5%) | 39 (4.9%) |
Disability Class: Ambulatory Difficulty
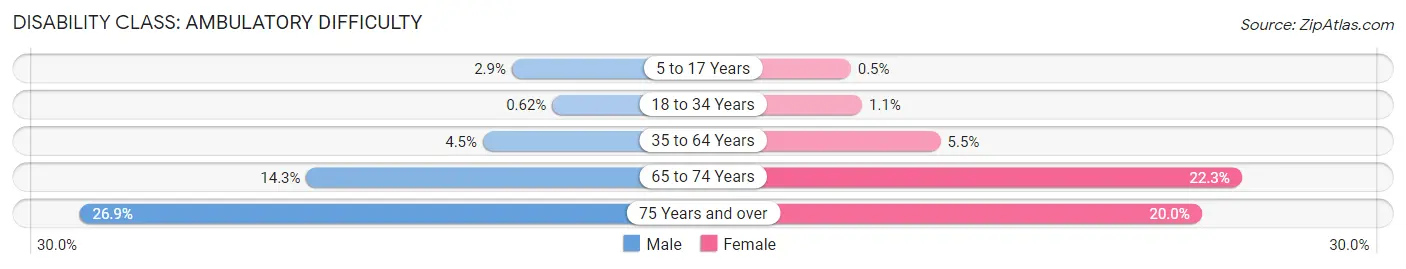
| Age Bracket | Male | Female |
| 5 to 17 Years | 103 (2.9%) | 15 (0.5%) |
| 18 to 34 Years | 20 (0.6%) | 38 (1.1%) |
| 35 to 64 Years | 263 (4.5%) | 360 (5.5%) |
| 65 to 74 Years | 194 (14.3%) | 327 (22.3%) |
| 75 Years and over | 160 (26.9%) | 158 (20.0%) |
Disability Class: Self-Care Difficulty
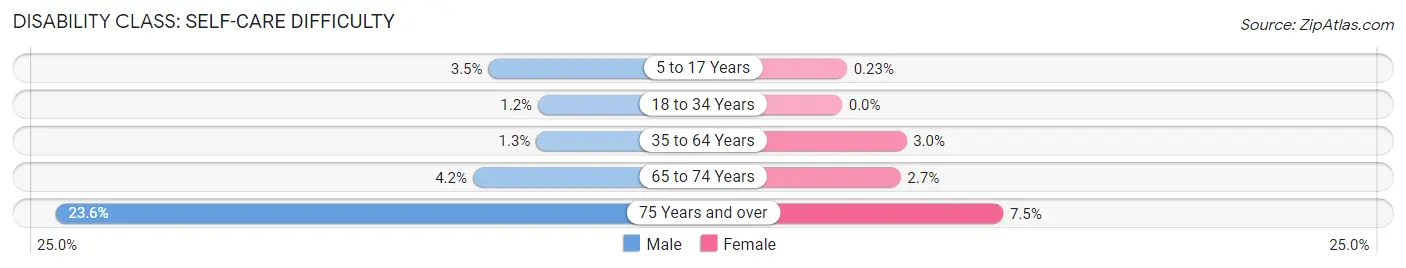
| Age Bracket | Male | Female |
| 5 to 17 Years | 125 (3.5%) | 7 (0.2%) |
| 18 to 34 Years | 38 (1.2%) | 0 (0.0%) |
| 35 to 64 Years | 74 (1.3%) | 196 (3.0%) |
| 65 to 74 Years | 57 (4.2%) | 40 (2.7%) |
| 75 Years and over | 140 (23.6%) | 59 (7.5%) |
Technology Access in Lee County
Computing Device Access in Lee County
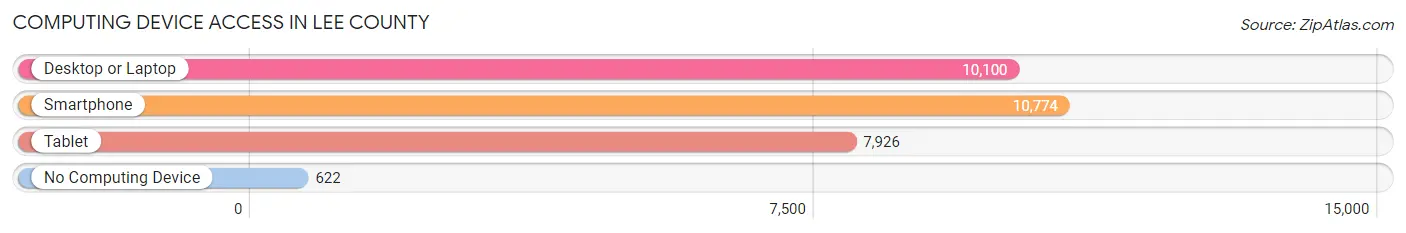
| Device Type | # Households | % Households |
| Desktop or Laptop | 10,100 | 85.6% |
| Smartphone | 10,774 | 91.3% |
| Tablet | 7,926 | 67.1% |
| No Computing Device | 622 | 5.3% |
| Total | 11,806 | 100.0% |
Internet Access in Lee County
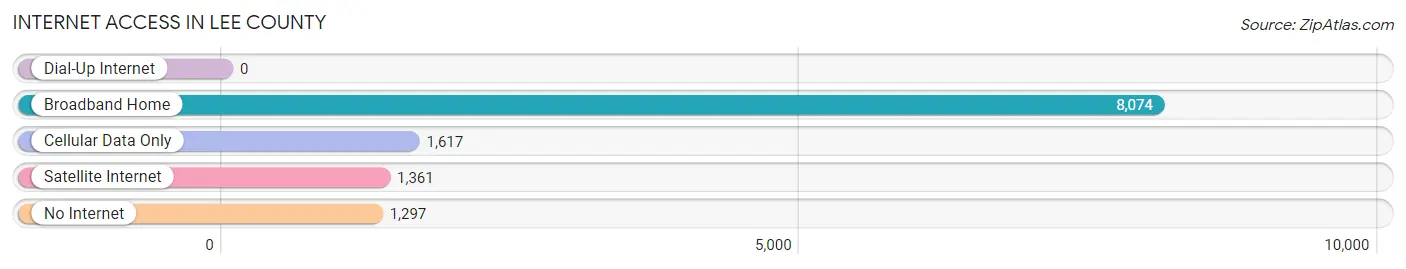
| Internet Type | # Households | % Households |
| Dial-Up Internet | 0 | 0.0% |
| Broadband Home | 8,074 | 68.4% |
| Cellular Data Only | 1,617 | 13.7% |
| Satellite Internet | 1,361 | 11.5% |
| No Internet | 1,297 | 11.0% |
| Total | 11,806 | 100.0% |
Lee County Summary
Lee County is located in the east-central part of the state of Georgia, in the United States. It is bordered by Sumter, Dougherty, Worth, and Terrell counties. The county seat is Leesburg. The county was created in 1826 from Creek Indian lands and was named for General Robert E. Lee.
Geography
Lee County covers an area of 441 square miles and is located in the Coastal Plain region of Georgia. The county is mostly flat, with some rolling hills in the northern part. The Flint River runs through the county, and there are several small creeks and streams. The soil is mostly sandy loam, with some clay and sand. The climate is humid subtropical, with hot, humid summers and mild winters.
Demographics
As of the 2010 census, Lee County had a population of 28,298. The racial makeup of the county was 57.3% African American, 38.2% White, 0.3% Native American, 0.7% Asian, 0.1% Pacific Islander, 2.2% from other races, and 1.4% from two or more races. Hispanic or Latino of any race were 4.2% of the population.
The median household income was $30,945 and the median family income was $37,945. About 22.2% of families and 27.2% of the population were below the poverty line, including 37.2% of those under age 18 and 22.2% of those age 65 or over.
Economy
Lee County’s economy is largely based on agriculture. The county is home to several large farms, and the main crops are cotton, peanuts, corn, and soybeans. The county also has a thriving timber industry, and there are several sawmills and wood-processing plants in the area.
The county is also home to several manufacturing plants, including a paper mill, a textile mill, and a furniture factory. The county is also home to several retail stores, restaurants, and other businesses.
History
Lee County was created in 1826 from Creek Indian lands. The county was named for General Robert E. Lee, who had served in the U.S. Army during the War of 1812.
The county was largely rural until the late 19th century, when the railroad was built through the area. This brought new economic opportunities to the county, and several small towns and villages were established.
In the early 20th century, the county was a major producer of cotton, and the economy was largely based on agriculture. The Great Depression had a major impact on the county, and many people left the area in search of work.
In the 1950s, the county began to diversify its economy, and several new industries were established. This helped to bring new jobs and economic growth to the area.
Today, Lee County is a thriving rural community with a diverse economy. The county is home to several large farms, manufacturing plants, and other businesses. The county is also home to several small towns and villages, and the county seat is Leesburg.
Common Questions
What is Per Capita Income in Lee County?
Per Capita income in Lee County is $34,074.
What is the Median Family Income in Lee County?
Median Family Income in Lee County is $94,150.
What is the Median Household income in Lee County?
Median Household Income in Lee County is $83,632.
What is Income or Wage Gap in Lee County?
Income or Wage Gap in Lee County is 35.3%.
Women in Lee County earn 64.7 cents for every dollar earned by a man.
What is Family Income Deficit in Lee County?
Family Income Deficit in Lee County is $12,611.
Families that are below poverty line in Lee County earn $12,611 less on average than the poverty threshold level.
What is Inequality or Gini Index in Lee County?
Inequality or Gini Index in Lee County is 0.37.
What is the Total Population of Lee County?
Total Population of Lee County is 32,968.
What is the Total Male Population of Lee County?
Total Male Population of Lee County is 16,560.
What is the Total Female Population of Lee County?
Total Female Population of Lee County is 16,408.
What is the Ratio of Males per 100 Females in Lee County?
There are 100.93 Males per 100 Females in Lee County.
What is the Ratio of Females per 100 Males in Lee County?
There are 99.08 Females per 100 Males in Lee County.
What is the Median Population Age in Lee County?
Median Population Age in Lee County is 37.0 Years.
What is the Average Family Size in Lee County
Average Family Size in Lee County is 3.0 People.
What is the Average Household Size in Lee County
Average Household Size in Lee County is 2.7 People.
How Large is the Labor Force in Lee County?
There are 16,770 People in the Labor Forcein in Lee County.
What is the Percentage of People in the Labor Force in Lee County?
65.7% of People are in the Labor Force in Lee County.
What is the Unemployment Rate in Lee County?
Unemployment Rate in Lee County is 4.4%.