Lamar County, GA Map & Demographics
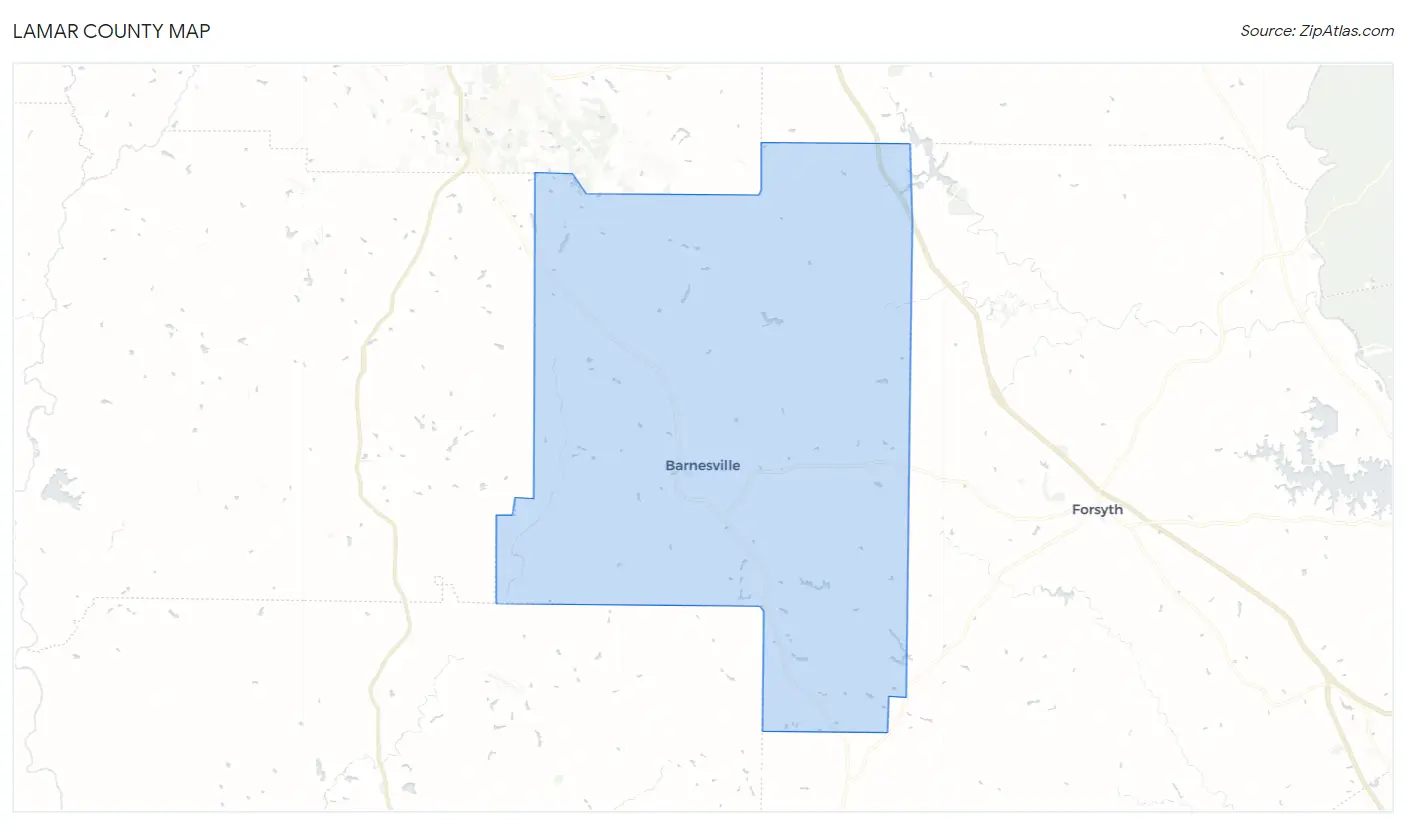
Lamar County Map
Lamar County Overview
$30,978
PER CAPITA INCOME
$83,303
AVG FAMILY INCOME
$64,966
AVG HOUSEHOLD INCOME
38.5%
WAGE / INCOME GAP [ % ]
61.5¢/ $1
WAGE / INCOME GAP [ $ ]
0.42
INEQUALITY / GINI INDEX
18,676
TOTAL POPULATION
9,112
MALE POPULATION
9,564
FEMALE POPULATION
95.27
MALES / 100 FEMALES
104.96
FEMALES / 100 MALES
37.6
MEDIAN AGE
3.2
AVG FAMILY SIZE
2.5
AVG HOUSEHOLD SIZE
8,559
LABOR FORCE [ PEOPLE ]
56.1%
PERCENT IN LABOR FORCE
5.4%
UNEMPLOYMENT RATE
Income in Lamar County
Income Overview in Lamar County
Per Capita Income in Lamar County is $30,978, while median incomes of families and households are $83,303 and $64,966 respectively.
| Characteristic | Number | Measure |
| Per Capita Income | 18,676 | $30,978 |
| Median Family Income | 4,302 | $83,303 |
| Mean Family Income | 4,302 | $100,627 |
| Median Household Income | 6,918 | $64,966 |
| Mean Household Income | 6,918 | $82,098 |
| Income Deficit | 4,302 | $0 |
| Wage / Income Gap (%) | 18,676 | 38.52% |
| Wage / Income Gap ($) | 18,676 | 61.48¢ per $1 |
| Gini / Inequality Index | 18,676 | 0.42 |
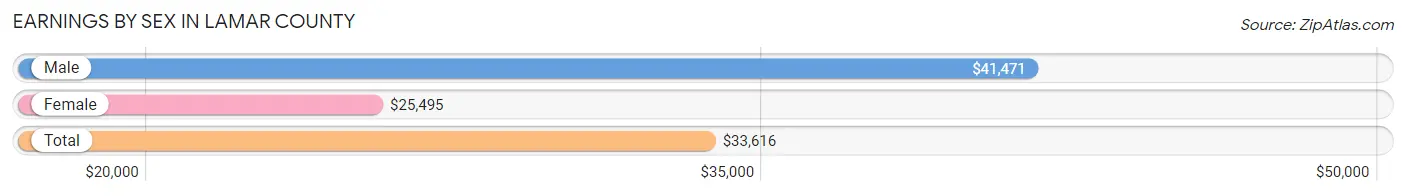
Earnings by Sex in Lamar County
Average Earnings in Lamar County are $33,616, $41,471 for men and $25,495 for women, a difference of 38.5%.
| Sex | Number | Average Earnings |
| Male | 4,859 (53.3%) | $41,471 |
| Female | 4,259 (46.7%) | $25,495 |
| Total | 9,118 (100.0%) | $33,616 |
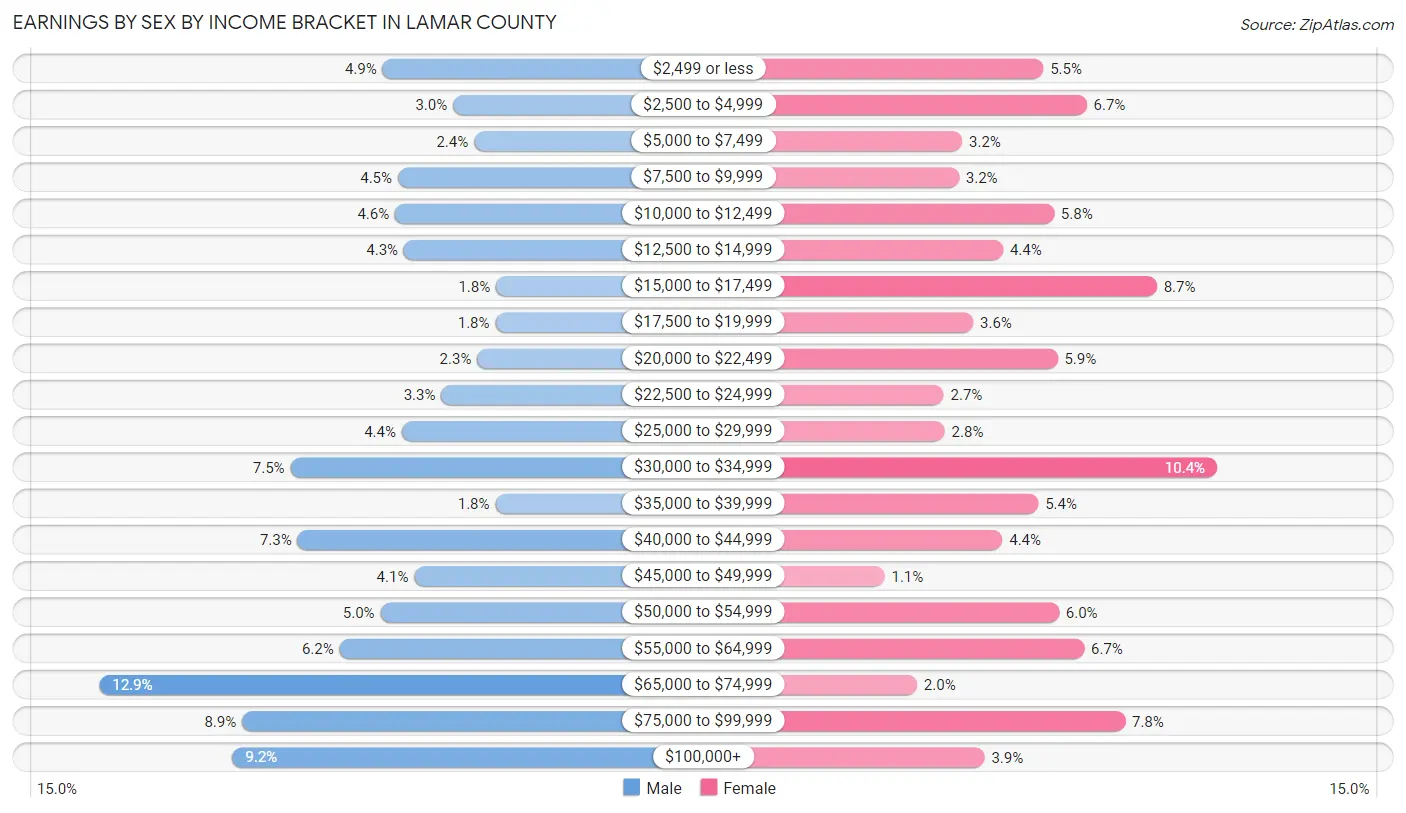
Earnings by Sex by Income Bracket in Lamar County
The most common earnings brackets in Lamar County are $65,000 to $74,999 for men (627 | 12.9%) and $30,000 to $34,999 for women (443 | 10.4%).
| Income | Male | Female |
| $2,499 or less | 240 (4.9%) | 235 (5.5%) |
| $2,500 to $4,999 | 144 (3.0%) | 287 (6.7%) |
| $5,000 to $7,499 | 115 (2.4%) | 138 (3.2%) |
| $7,500 to $9,999 | 219 (4.5%) | 134 (3.2%) |
| $10,000 to $12,499 | 223 (4.6%) | 248 (5.8%) |
| $12,500 to $14,999 | 211 (4.3%) | 187 (4.4%) |
| $15,000 to $17,499 | 85 (1.8%) | 371 (8.7%) |
| $17,500 to $19,999 | 86 (1.8%) | 151 (3.5%) |
| $20,000 to $22,499 | 111 (2.3%) | 252 (5.9%) |
| $22,500 to $24,999 | 160 (3.3%) | 116 (2.7%) |
| $25,000 to $29,999 | 214 (4.4%) | 117 (2.8%) |
| $30,000 to $34,999 | 366 (7.5%) | 443 (10.4%) |
| $35,000 to $39,999 | 86 (1.8%) | 229 (5.4%) |
| $40,000 to $44,999 | 356 (7.3%) | 186 (4.4%) |
| $45,000 to $49,999 | 197 (4.1%) | 45 (1.1%) |
| $50,000 to $54,999 | 243 (5.0%) | 254 (6.0%) |
| $55,000 to $64,999 | 299 (6.1%) | 284 (6.7%) |
| $65,000 to $74,999 | 627 (12.9%) | 84 (2.0%) |
| $75,000 to $99,999 | 432 (8.9%) | 333 (7.8%) |
| $100,000+ | 445 (9.2%) | 165 (3.9%) |
| Total | 4,859 (100.0%) | 4,259 (100.0%) |
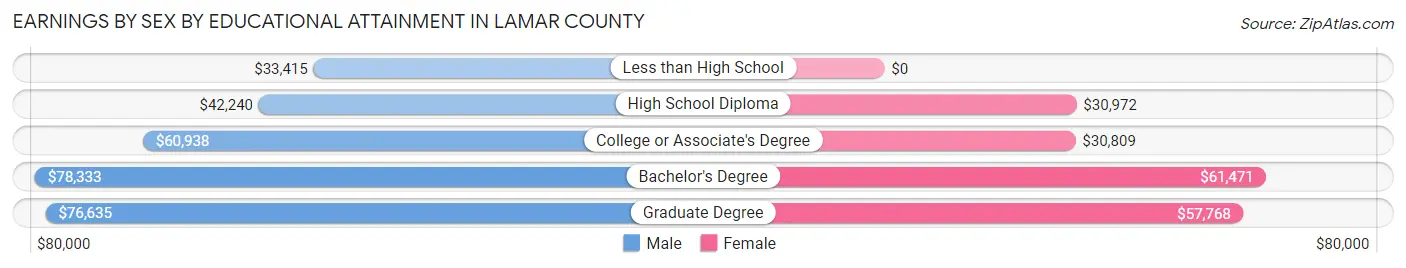
Earnings by Sex by Educational Attainment in Lamar County
Average earnings in Lamar County are $52,683 for men and $33,229 for women, a difference of 36.9%. Men with an educational attainment of bachelor's degree enjoy the highest average annual earnings of $78,333, while those with less than high school education earn the least with $33,415. Women with an educational attainment of bachelor's degree earn the most with the average annual earnings of $61,471, while those with college or associate's degree education have the smallest earnings of $30,809.
| Educational Attainment | Male Income | Female Income |
| Less than High School | $33,415 | $0 |
| High School Diploma | $42,240 | $30,972 |
| College or Associate's Degree | $60,938 | $30,809 |
| Bachelor's Degree | $78,333 | $61,471 |
| Graduate Degree | $76,635 | $57,768 |
| Total | $52,683 | $33,229 |
Family Income in Lamar County
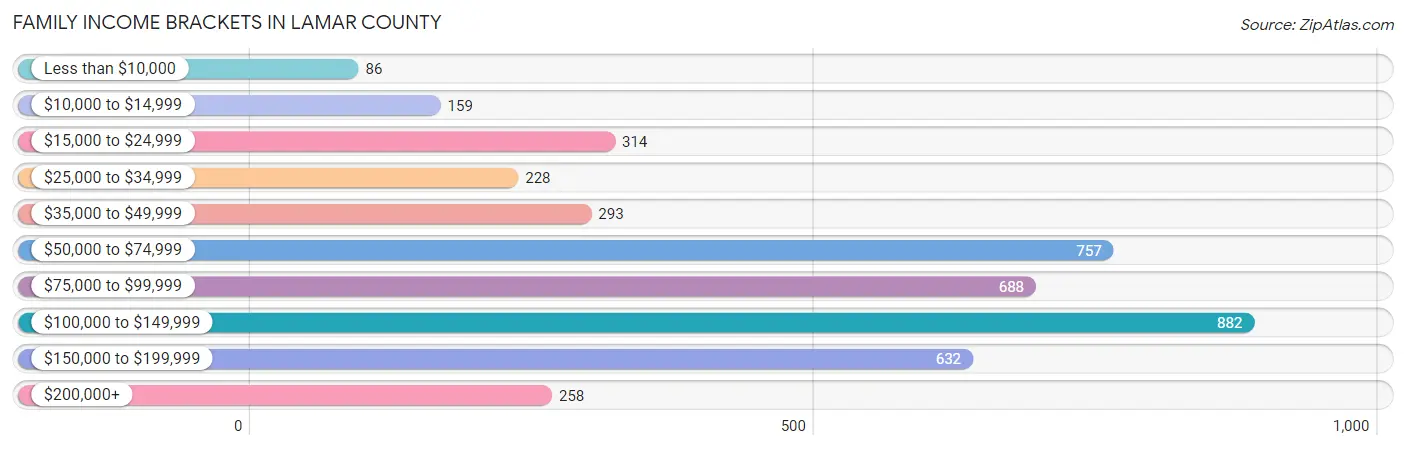
Family Income Brackets in Lamar County
According to the Lamar County family income data, there are 882 families falling into the $100,000 to $149,999 income range, which is the most common income bracket and makes up 20.5% of all families. Conversely, the less than $10,000 income bracket is the least frequent group with only 86 families (2.0%) belonging to this category.
| Income Bracket | # Families | % Families |
| Less than $10,000 | 86 | 2.0% |
| $10,000 to $14,999 | 159 | 3.7% |
| $15,000 to $24,999 | 314 | 7.3% |
| $25,000 to $34,999 | 228 | 5.3% |
| $35,000 to $49,999 | 293 | 6.8% |
| $50,000 to $74,999 | 757 | 17.6% |
| $75,000 to $99,999 | 688 | 16.0% |
| $100,000 to $149,999 | 882 | 20.5% |
| $150,000 to $199,999 | 632 | 14.7% |
| $200,000+ | 258 | 6.0% |
Family Income by Famaliy Size in Lamar County
5-person families (244 | 5.7%) account for the highest median family income in Lamar County with $102,614 per family, while 2-person families (1,996 | 46.4%) have the highest median income of $39,223 per family member.

| Income Bracket | # Families | Median Income |
| 2-Person Families | 1,996 (46.4%) | $78,446 |
| 3-Person Families | 1,060 (24.6%) | $101,053 |
| 4-Person Families | 816 (19.0%) | $81,143 |
| 5-Person Families | 244 (5.7%) | $102,614 |
| 6-Person Families | 92 (2.1%) | $100,875 |
| 7+ Person Families | 94 (2.2%) | $0 |
| Total | 4,302 (100.0%) | $83,303 |
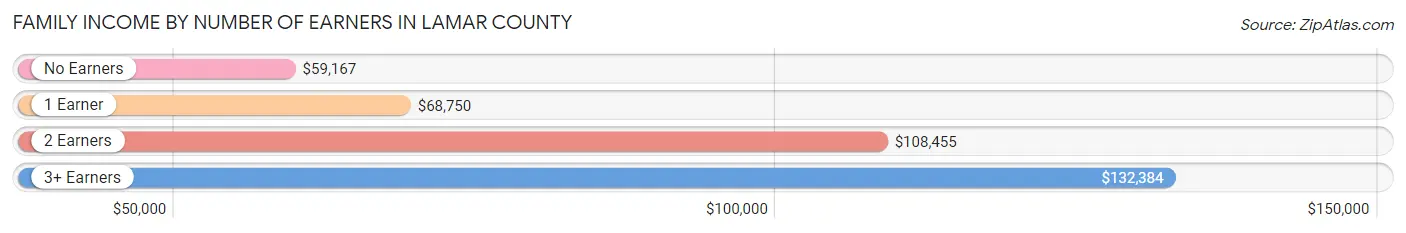
Family Income by Number of Earners in Lamar County
The median family income in Lamar County is $83,303, with families comprising 3+ earners (619) having the highest median family income of $132,384, while families with no earners (762) have the lowest median family income of $59,167, accounting for 14.4% and 17.7% of families, respectively.
| Number of Earners | # Families | Median Income |
| No Earners | 762 (17.7%) | $59,167 |
| 1 Earner | 1,617 (37.6%) | $68,750 |
| 2 Earners | 1,304 (30.3%) | $108,455 |
| 3+ Earners | 619 (14.4%) | $132,384 |
| Total | 4,302 (100.0%) | $83,303 |
Household Income in Lamar County
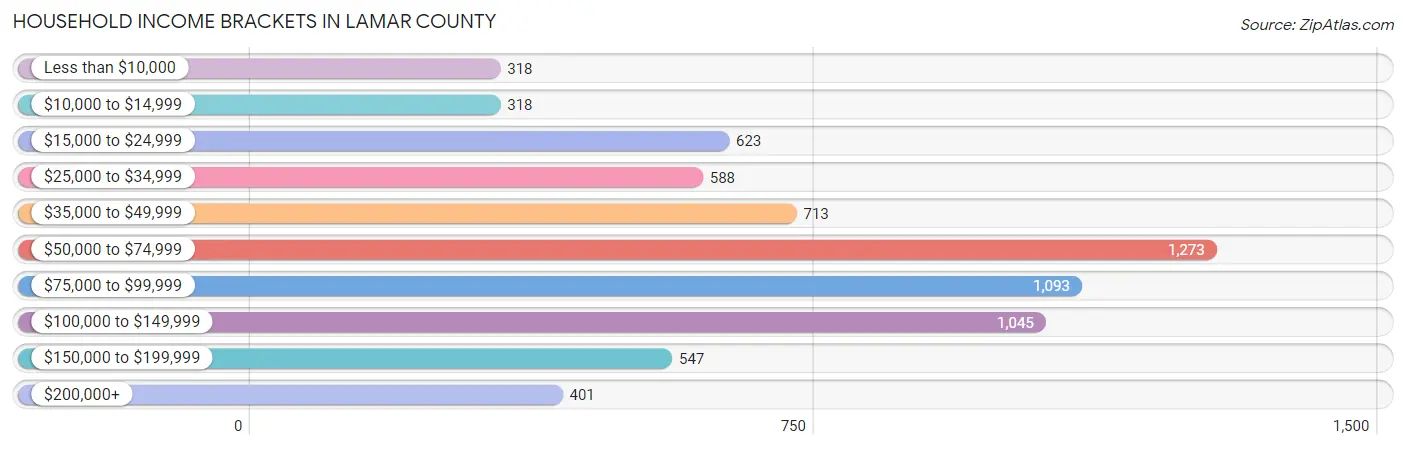
Household Income Brackets in Lamar County
With 1,273 households falling in the category, the $50,000 to $74,999 income range is the most frequent in Lamar County, accounting for 18.4% of all households. In contrast, only 318 households (4.6%) fall into the less than $10,000 income bracket, making it the least populous group.
| Income Bracket | # Households | % Households |
| Less than $10,000 | 318 | 4.6% |
| $10,000 to $14,999 | 318 | 4.6% |
| $15,000 to $24,999 | 623 | 9.0% |
| $25,000 to $34,999 | 588 | 8.5% |
| $35,000 to $49,999 | 713 | 10.3% |
| $50,000 to $74,999 | 1,273 | 18.4% |
| $75,000 to $99,999 | 1,093 | 15.8% |
| $100,000 to $149,999 | 1,045 | 15.1% |
| $150,000 to $199,999 | 547 | 7.9% |
| $200,000+ | 401 | 5.8% |
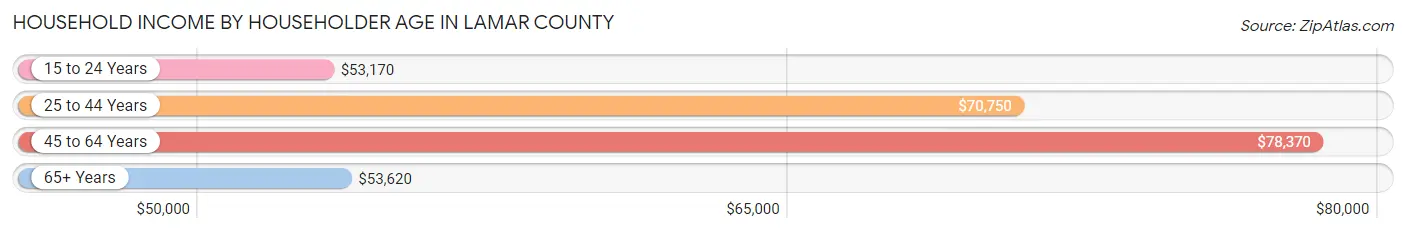
Household Income by Householder Age in Lamar County
The median household income in Lamar County is $64,966, with the highest median household income of $78,370 found in the 45 to 64 years age bracket for the primary householder. A total of 2,324 households (33.6%) fall into this category. Meanwhile, the 15 to 24 years age bracket for the primary householder has the lowest median household income of $53,170, with 165 households (2.4%) in this group.
| Income Bracket | # Households | Median Income |
| 15 to 24 Years | 165 (2.4%) | $53,170 |
| 25 to 44 Years | 2,255 (32.6%) | $70,750 |
| 45 to 64 Years | 2,324 (33.6%) | $78,370 |
| 65+ Years | 2,174 (31.4%) | $53,620 |
| Total | 6,918 (100.0%) | $64,966 |
Poverty in Lamar County
Income Below Poverty by Sex and Age in Lamar County
With 9.6% poverty level for males and 12.8% for females among the residents of Lamar County, 5 year old males and 25 to 34 year old females are the most vulnerable to poverty, with 71 males (38.4%) and 288 females (23.2%) in their respective age groups living below the poverty level.
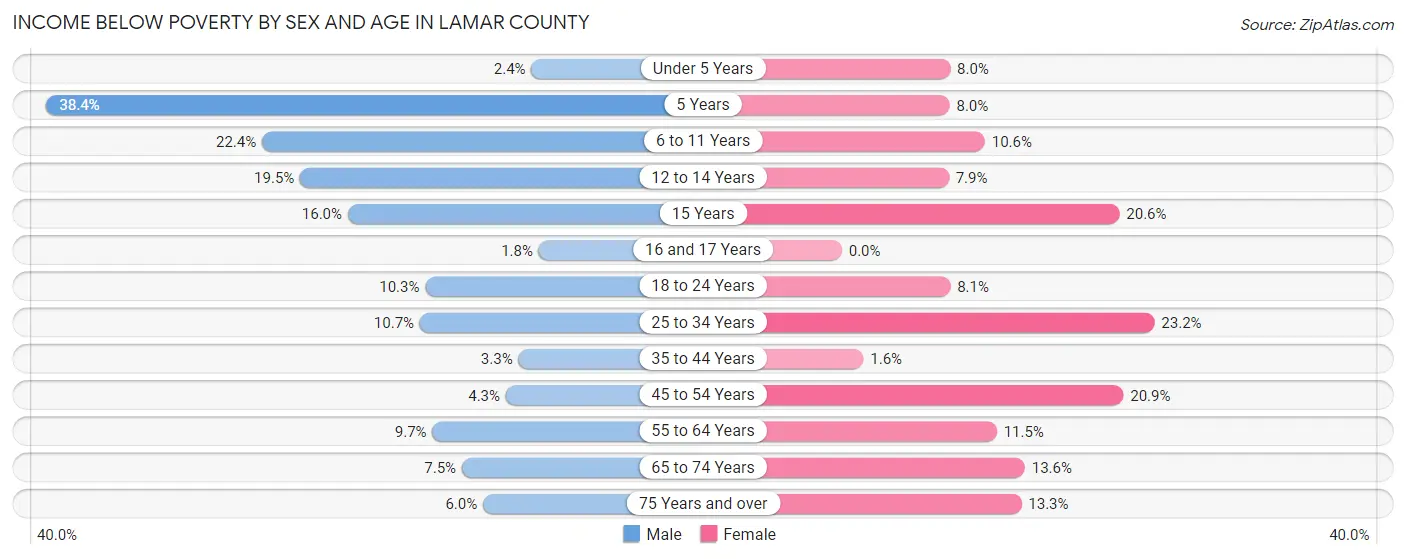
| Age Bracket | Male | Female |
| Under 5 Years | 10 (2.4%) | 36 (8.0%) |
| 5 Years | 71 (38.4%) | 6 (8.0%) |
| 6 to 11 Years | 164 (22.4%) | 69 (10.6%) |
| 12 to 14 Years | 60 (19.5%) | 27 (7.9%) |
| 15 Years | 8 (16.0%) | 34 (20.6%) |
| 16 and 17 Years | 5 (1.8%) | 0 (0.0%) |
| 18 to 24 Years | 95 (10.2%) | 62 (8.1%) |
| 25 to 34 Years | 116 (10.6%) | 288 (23.2%) |
| 35 to 44 Years | 27 (3.3%) | 17 (1.6%) |
| 45 to 54 Years | 48 (4.3%) | 238 (20.9%) |
| 55 to 64 Years | 103 (9.7%) | 154 (11.5%) |
| 65 to 74 Years | 76 (7.5%) | 137 (13.6%) |
| 75 Years and over | 28 (6.0%) | 88 (13.3%) |
| Total | 811 (9.6%) | 1,156 (12.8%) |
Income Above Poverty by Sex and Age in Lamar County
According to the poverty statistics in Lamar County, males aged 16 and 17 years and females aged 16 and 17 years are the age groups that are most secure financially, with 98.2% of males and 100.0% of females in these age groups living above the poverty line.
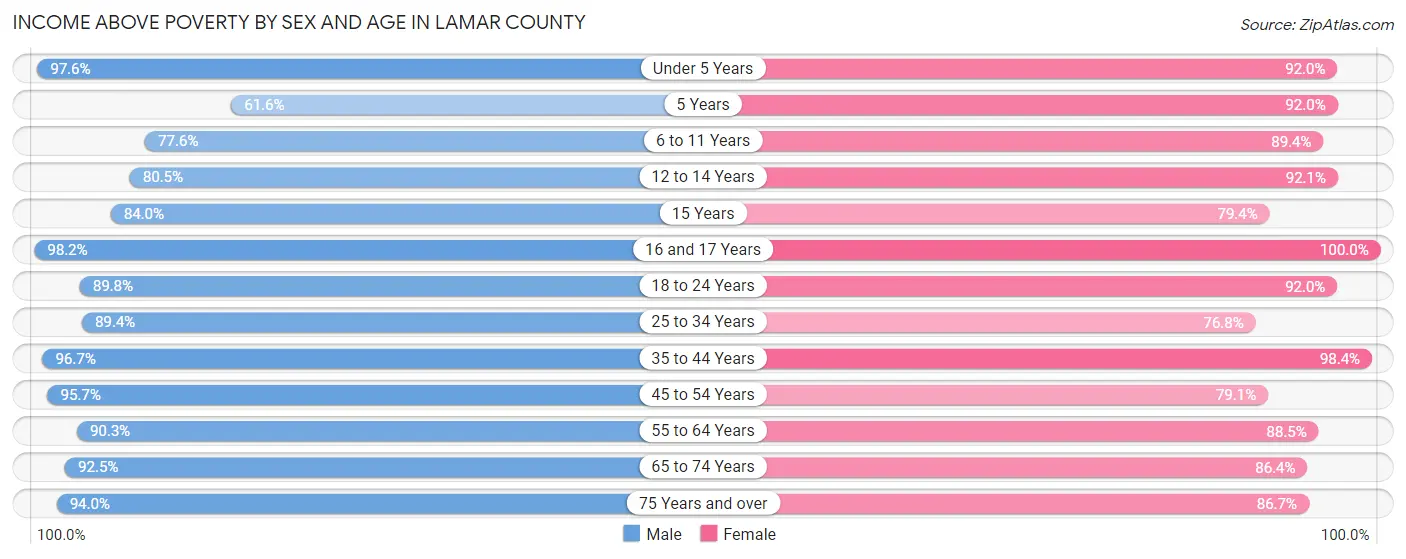
| Age Bracket | Male | Female |
| Under 5 Years | 412 (97.6%) | 412 (92.0%) |
| 5 Years | 114 (61.6%) | 69 (92.0%) |
| 6 to 11 Years | 569 (77.6%) | 581 (89.4%) |
| 12 to 14 Years | 247 (80.5%) | 313 (92.1%) |
| 15 Years | 42 (84.0%) | 131 (79.4%) |
| 16 and 17 Years | 269 (98.2%) | 155 (100.0%) |
| 18 to 24 Years | 832 (89.7%) | 708 (91.9%) |
| 25 to 34 Years | 973 (89.3%) | 953 (76.8%) |
| 35 to 44 Years | 784 (96.7%) | 1,045 (98.4%) |
| 45 to 54 Years | 1,076 (95.7%) | 901 (79.1%) |
| 55 to 64 Years | 957 (90.3%) | 1,185 (88.5%) |
| 65 to 74 Years | 933 (92.5%) | 871 (86.4%) |
| 75 Years and over | 442 (94.0%) | 572 (86.7%) |
| Total | 7,650 (90.4%) | 7,896 (87.2%) |
Income Below Poverty Among Married-Couple Families in Lamar County
The poverty statistics for married-couple families in Lamar County show that 4.2% or 141 of the total 3,393 families live below the poverty line. Families with 1 or 2 children have the highest poverty rate of 6.1%, comprising of 65 families. On the other hand, families with 3 or 4 children have the lowest poverty rate of 0.0%, which includes 0 families.
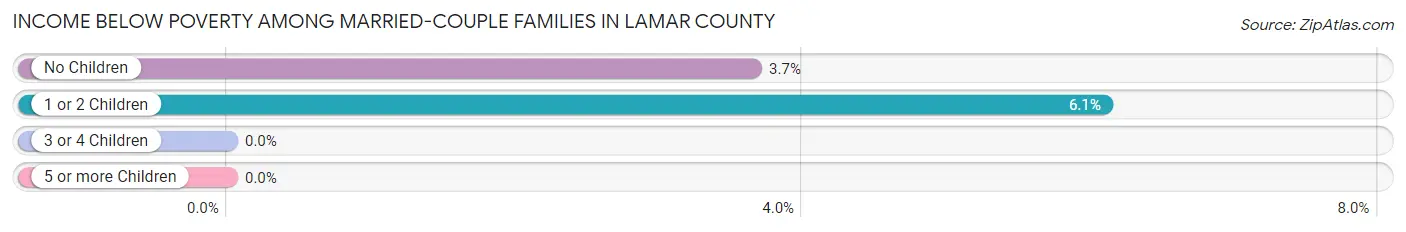
| Children | Above Poverty | Below Poverty |
| No Children | 2,008 (96.4%) | 76 (3.6%) |
| 1 or 2 Children | 1,002 (93.9%) | 65 (6.1%) |
| 3 or 4 Children | 166 (100.0%) | 0 (0.0%) |
| 5 or more Children | 76 (100.0%) | 0 (0.0%) |
| Total | 3,252 (95.8%) | 141 (4.2%) |
Income Below Poverty Among Single-Parent Households in Lamar County
According to the poverty data in Lamar County, 10.6% or 26 single-father households and 28.8% or 191 single-mother households are living below the poverty line. Among single-father households, those with no children have the highest poverty rate, with 26 households (26.8%) experiencing poverty. Likewise, among single-mother households, those with 3 or 4 children have the highest poverty rate, with 112 households (67.1%) falling below the poverty line.
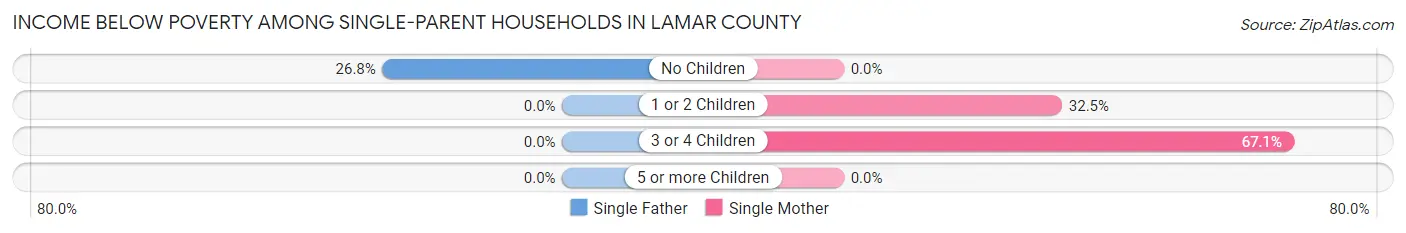
| Children | Single Father | Single Mother |
| No Children | 26 (26.8%) | 0 (0.0%) |
| 1 or 2 Children | 0 (0.0%) | 79 (32.5%) |
| 3 or 4 Children | 0 (0.0%) | 112 (67.1%) |
| 5 or more Children | 0 (0.0%) | 0 (0.0%) |
| Total | 26 (10.6%) | 191 (28.8%) |
Income Below Poverty Among Married-Couple vs Single-Parent Households in Lamar County
The poverty data for Lamar County shows that 141 of the married-couple family households (4.2%) and 217 of the single-parent households (23.9%) are living below the poverty level. Within the married-couple family households, those with 1 or 2 children have the highest poverty rate, with 65 households (6.1%) falling below the poverty line. Among the single-parent households, those with 3 or 4 children have the highest poverty rate, with 112 household (65.5%) living below poverty.
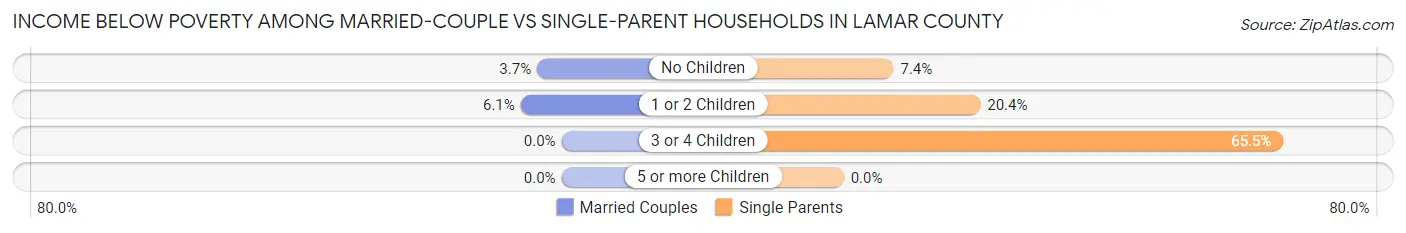
| Children | Married-Couple Families | Single-Parent Households |
| No Children | 76 (3.6%) | 26 (7.4%) |
| 1 or 2 Children | 65 (6.1%) | 79 (20.4%) |
| 3 or 4 Children | 0 (0.0%) | 112 (65.5%) |
| 5 or more Children | 0 (0.0%) | 0 (0.0%) |
| Total | 141 (4.2%) | 217 (23.9%) |
Race in Lamar County
The most populous races in Lamar County are White / Caucasian (12,523 | 67.0%), Black / African American (5,024 | 26.9%), and Two or more Races (723 | 3.9%).
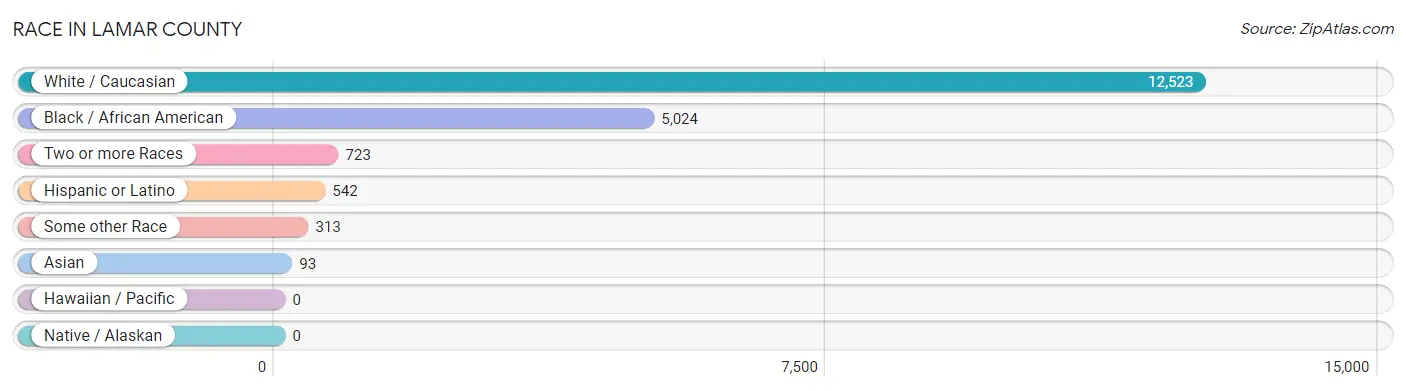
| Race | # Population | % Population |
| Asian | 93 | 0.5% |
| Black / African American | 5,024 | 26.9% |
| Hawaiian / Pacific | 0 | 0.0% |
| Hispanic or Latino | 542 | 2.9% |
| Native / Alaskan | 0 | 0.0% |
| White / Caucasian | 12,523 | 67.0% |
| Two or more Races | 723 | 3.9% |
| Some other Race | 313 | 1.7% |
| Total | 18,676 | 100.0% |
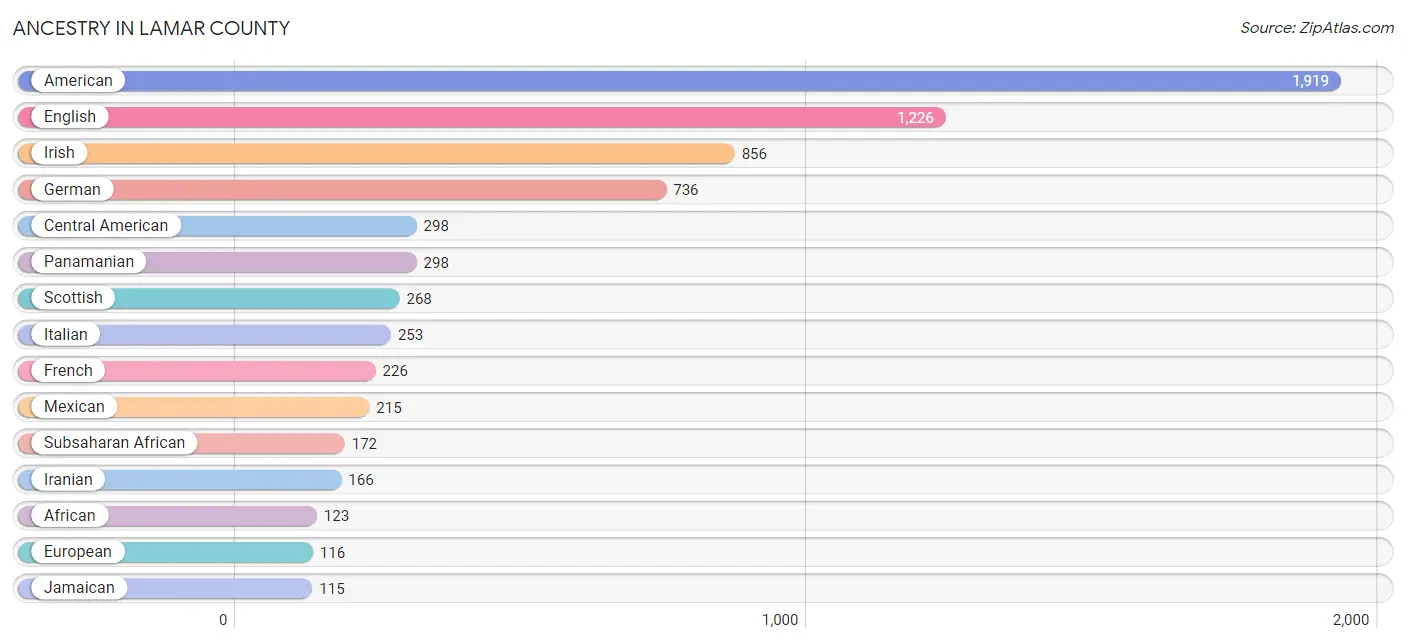
Ancestry in Lamar County
The most populous ancestries reported in Lamar County are American (1,919 | 10.3%), English (1,226 | 6.6%), Irish (856 | 4.6%), German (736 | 3.9%), and Central American (298 | 1.6%), together accounting for 27.0% of all Lamar County residents.
| Ancestry | # Population | % Population |
| African | 123 | 0.7% |
| American | 1,919 | 10.3% |
| Arab | 12 | 0.1% |
| Austrian | 7 | 0.0% |
| Belgian | 3 | 0.0% |
| Blackfeet | 7 | 0.0% |
| British | 2 | 0.0% |
| Burmese | 9 | 0.1% |
| Canadian | 3 | 0.0% |
| Central American | 298 | 1.6% |
| Cherokee | 38 | 0.2% |
| Croatian | 31 | 0.2% |
| Danish | 19 | 0.1% |
| Dutch | 13 | 0.1% |
| Eastern European | 14 | 0.1% |
| English | 1,226 | 6.6% |
| European | 116 | 0.6% |
| Finnish | 12 | 0.1% |
| French | 226 | 1.2% |
| French Canadian | 18 | 0.1% |
| German | 736 | 3.9% |
| Ghanaian | 26 | 0.1% |
| Greek | 2 | 0.0% |
| Hungarian | 61 | 0.3% |
| Indian (Asian) | 28 | 0.2% |
| Inupiat | 1 | 0.0% |
| Iranian | 166 | 0.9% |
| Irish | 856 | 4.6% |
| Italian | 253 | 1.3% |
| Jamaican | 115 | 0.6% |
| Lebanese | 12 | 0.1% |
| Mexican | 215 | 1.1% |
| Nigerian | 23 | 0.1% |
| Northern European | 46 | 0.3% |
| Norwegian | 46 | 0.3% |
| Pakistani | 31 | 0.2% |
| Panamanian | 298 | 1.6% |
| Peruvian | 10 | 0.1% |
| Polish | 43 | 0.2% |
| Puerto Rican | 8 | 0.0% |
| Romanian | 4 | 0.0% |
| Russian | 12 | 0.1% |
| Scandinavian | 3 | 0.0% |
| Scotch-Irish | 53 | 0.3% |
| Scottish | 268 | 1.4% |
| Sioux | 2 | 0.0% |
| South American | 10 | 0.1% |
| Sri Lankan | 11 | 0.1% |
| Subsaharan African | 172 | 0.9% |
| Swedish | 106 | 0.6% |
| Swiss | 35 | 0.2% |
| Thai | 14 | 0.1% |
| Welsh | 9 | 0.1% | View All 53 Rows |
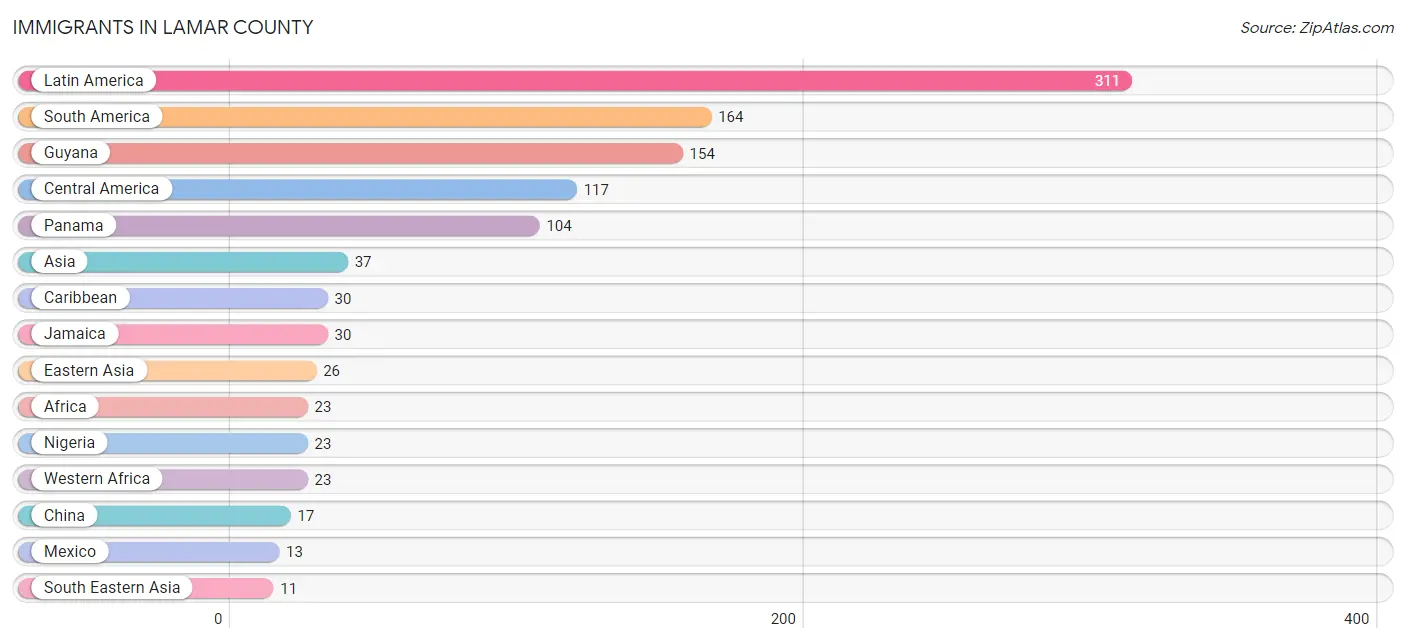
Immigrants in Lamar County
The most numerous immigrant groups reported in Lamar County came from Latin America (311 | 1.7%), South America (164 | 0.9%), Guyana (154 | 0.8%), Central America (117 | 0.6%), and Panama (104 | 0.6%), together accounting for 4.6% of all Lamar County residents.
| Immigration Origin | # Population | % Population |
| Africa | 23 | 0.1% |
| Asia | 37 | 0.2% |
| Canada | 3 | 0.0% |
| Caribbean | 30 | 0.2% |
| Central America | 117 | 0.6% |
| China | 17 | 0.1% |
| Eastern Asia | 26 | 0.1% |
| Europe | 8 | 0.0% |
| France | 8 | 0.0% |
| Guyana | 154 | 0.8% |
| Jamaica | 30 | 0.2% |
| Korea | 9 | 0.1% |
| Latin America | 311 | 1.7% |
| Mexico | 13 | 0.1% |
| Nigeria | 23 | 0.1% |
| Panama | 104 | 0.6% |
| Peru | 10 | 0.1% |
| South America | 164 | 0.9% |
| South Eastern Asia | 11 | 0.1% |
| Vietnam | 11 | 0.1% |
| Western Africa | 23 | 0.1% |
| Western Europe | 8 | 0.0% | View All 22 Rows |
Sex and Age in Lamar County
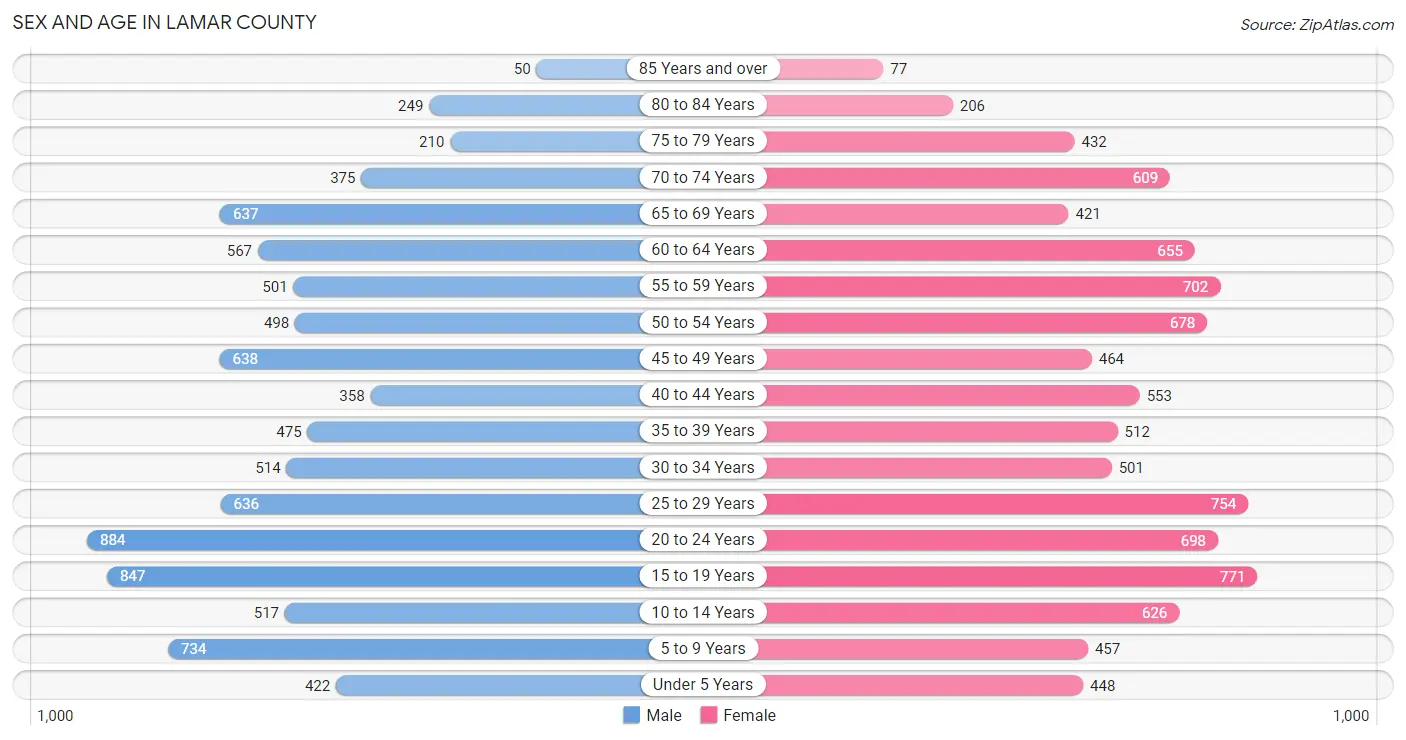
Sex and Age in Lamar County
The most populous age groups in Lamar County are 20 to 24 Years (884 | 9.7%) for men and 15 to 19 Years (771 | 8.1%) for women.
| Age Bracket | Male | Female |
| Under 5 Years | 422 (4.6%) | 448 (4.7%) |
| 5 to 9 Years | 734 (8.1%) | 457 (4.8%) |
| 10 to 14 Years | 517 (5.7%) | 626 (6.6%) |
| 15 to 19 Years | 847 (9.3%) | 771 (8.1%) |
| 20 to 24 Years | 884 (9.7%) | 698 (7.3%) |
| 25 to 29 Years | 636 (7.0%) | 754 (7.9%) |
| 30 to 34 Years | 514 (5.6%) | 501 (5.2%) |
| 35 to 39 Years | 475 (5.2%) | 512 (5.3%) |
| 40 to 44 Years | 358 (3.9%) | 553 (5.8%) |
| 45 to 49 Years | 638 (7.0%) | 464 (4.9%) |
| 50 to 54 Years | 498 (5.5%) | 678 (7.1%) |
| 55 to 59 Years | 501 (5.5%) | 702 (7.3%) |
| 60 to 64 Years | 567 (6.2%) | 655 (6.9%) |
| 65 to 69 Years | 637 (7.0%) | 421 (4.4%) |
| 70 to 74 Years | 375 (4.1%) | 609 (6.4%) |
| 75 to 79 Years | 210 (2.3%) | 432 (4.5%) |
| 80 to 84 Years | 249 (2.7%) | 206 (2.1%) |
| 85 Years and over | 50 (0.5%) | 77 (0.8%) |
| Total | 9,112 (100.0%) | 9,564 (100.0%) |
Families and Households in Lamar County
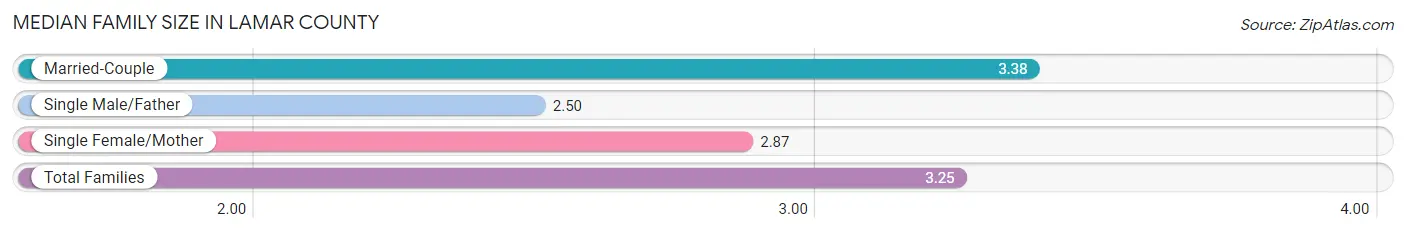
Median Family Size in Lamar County
The median family size in Lamar County is 3.25 persons per family, with married-couple families (3,393 | 78.9%) accounting for the largest median family size of 3.38 persons per family. On the other hand, single male/father families (246 | 5.7%) represent the smallest median family size with 2.50 persons per family.
| Family Type | # Families | Family Size |
| Married-Couple | 3,393 (78.9%) | 3.38 |
| Single Male/Father | 246 (5.7%) | 2.50 |
| Single Female/Mother | 663 (15.4%) | 2.87 |
| Total Families | 4,302 (100.0%) | 3.25 |
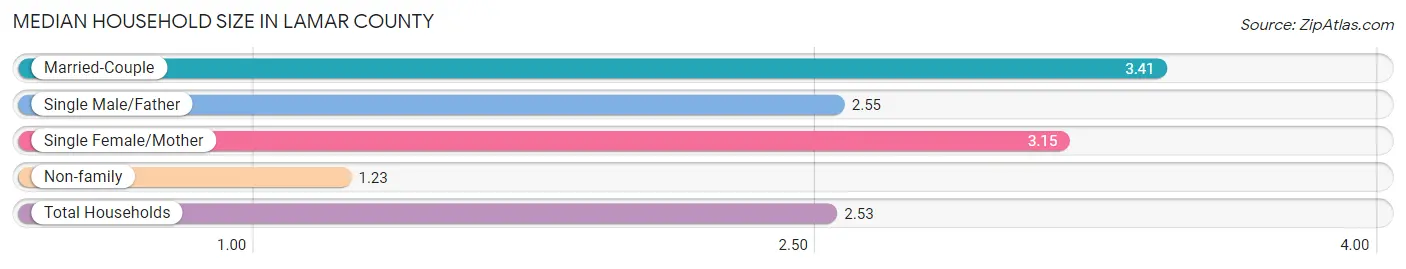
Median Household Size in Lamar County
The median household size in Lamar County is 2.53 persons per household, with married-couple households (3,393 | 49.0%) accounting for the largest median household size of 3.41 persons per household. non-family households (2,616 | 37.8%) represent the smallest median household size with 1.23 persons per household.
| Household Type | # Households | Household Size |
| Married-Couple | 3,393 (49.0%) | 3.41 |
| Single Male/Father | 246 (3.6%) | 2.55 |
| Single Female/Mother | 663 (9.6%) | 3.15 |
| Non-family | 2,616 (37.8%) | 1.23 |
| Total Households | 6,918 (100.0%) | 2.53 |
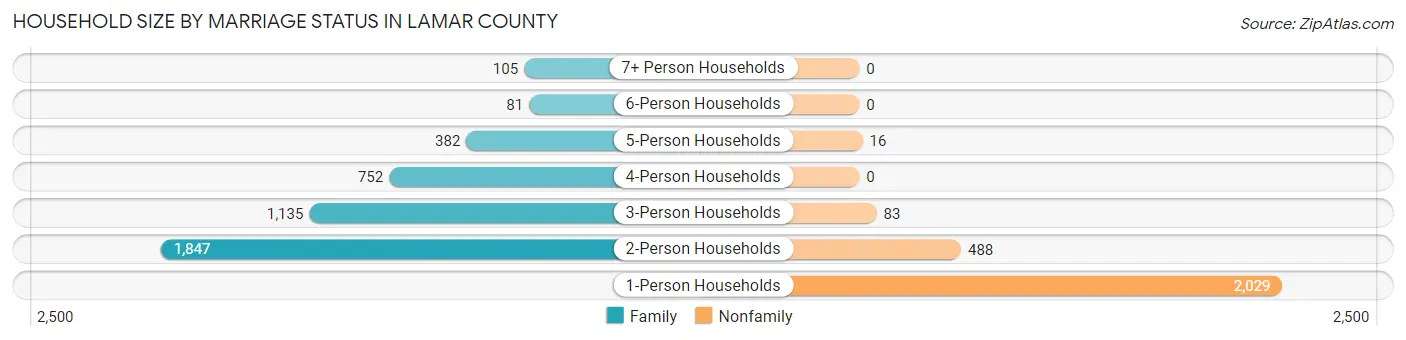
Household Size by Marriage Status in Lamar County
Out of a total of 6,918 households in Lamar County, 4,302 (62.2%) are family households, while 2,616 (37.8%) are nonfamily households. The most numerous type of family households are 2-person households, comprising 1,847, and the most common type of nonfamily households are 1-person households, comprising 2,029.
| Household Size | Family Households | Nonfamily Households |
| 1-Person Households | - | 2,029 (29.3%) |
| 2-Person Households | 1,847 (26.7%) | 488 (7.0%) |
| 3-Person Households | 1,135 (16.4%) | 83 (1.2%) |
| 4-Person Households | 752 (10.9%) | 0 (0.0%) |
| 5-Person Households | 382 (5.5%) | 16 (0.2%) |
| 6-Person Households | 81 (1.2%) | 0 (0.0%) |
| 7+ Person Households | 105 (1.5%) | 0 (0.0%) |
| Total | 4,302 (62.2%) | 2,616 (37.8%) |
Female Fertility in Lamar County
Fertility by Age in Lamar County
Average fertility rate in Lamar County is 41.0 births per 1,000 women. Women in the age bracket of 20 to 34 years have the highest fertility rate with 86.0 births per 1,000 women. Women in the age bracket of 20 to 34 years acount for 90.3% of all women with births.
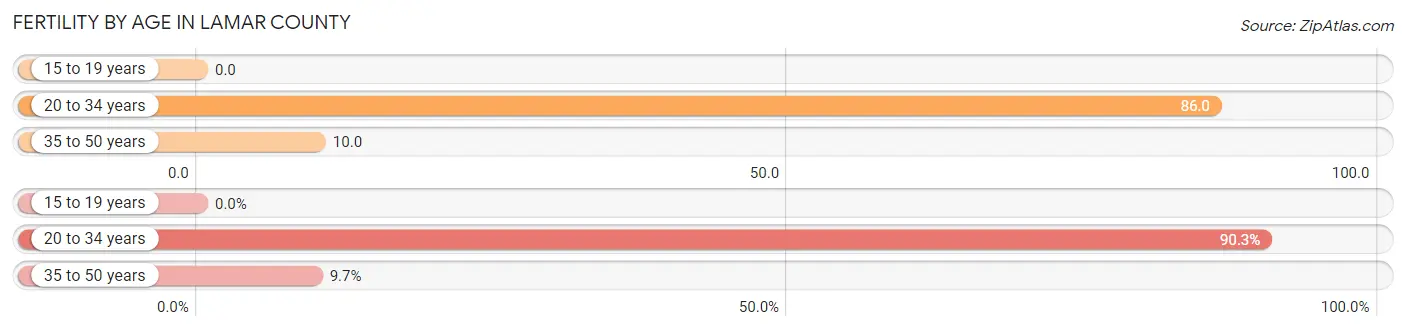
| Age Bracket | Women with Births | Births / 1,000 Women |
| 15 to 19 years | 0 (0.0%) | 0.0 |
| 20 to 34 years | 167 (90.3%) | 86.0 |
| 35 to 50 years | 18 (9.7%) | 10.0 |
| Total | 185 (100.0%) | 41.0 |
Fertility by Age by Marriage Status in Lamar County
73.5% of women with births (185) in Lamar County are married. The highest percentage of unmarried women with births falls into 20 to 34 years age bracket with 29.3% of them unmarried at the time of birth, while the lowest percentage of unmarried women with births belong to 35 to 50 years age bracket with 0.0% of them unmarried.
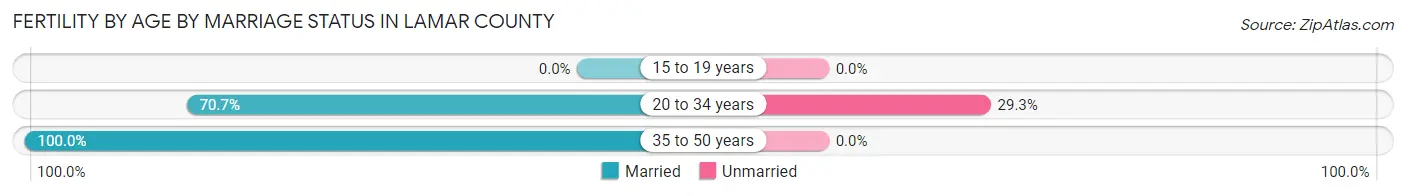
| Age Bracket | Married | Unmarried |
| 15 to 19 years | 0 (0.0%) | 0 (0.0%) |
| 20 to 34 years | 118 (70.7%) | 49 (29.3%) |
| 35 to 50 years | 18 (100.0%) | 0 (0.0%) |
| Total | 136 (73.5%) | 49 (26.5%) |
Fertility by Education in Lamar County
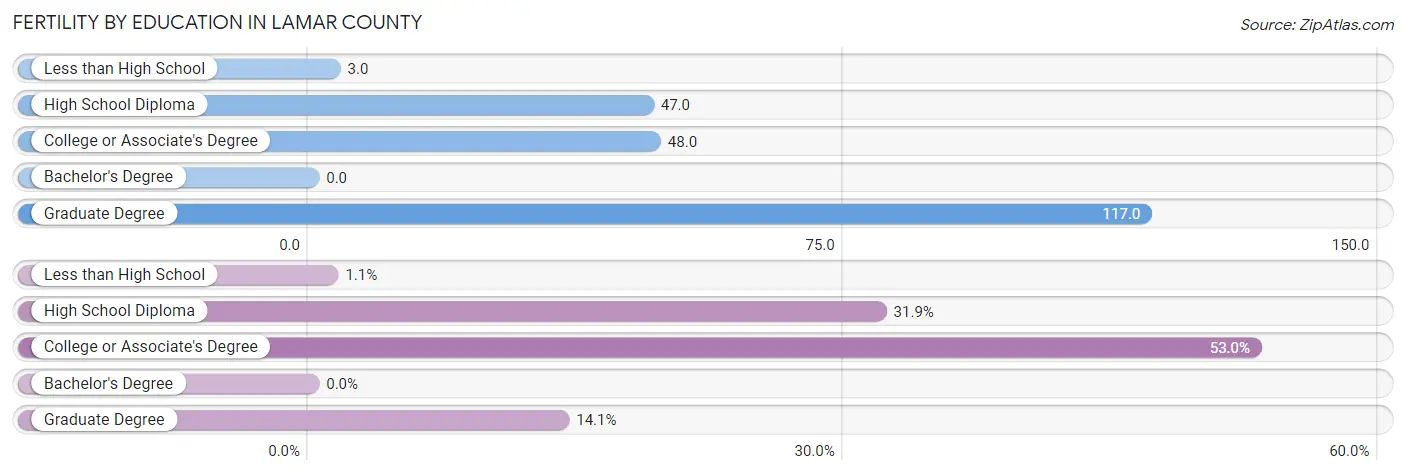
| Educational Attainment | Women with Births | Births / 1,000 Women |
| Less than High School | 2 (1.1%) | 3.0 |
| High School Diploma | 59 (31.9%) | 47.0 |
| College or Associate's Degree | 98 (53.0%) | 48.0 |
| Bachelor's Degree | 0 (0.0%) | 0.0 |
| Graduate Degree | 26 (14.1%) | 117.0 |
| Total | 185 (100.0%) | 41.0 |
Fertility by Education by Marriage Status in Lamar County
26.5% of women with births in Lamar County are unmarried. Women with the educational attainment of high school diploma are most likely to be married with 100.0% of them married at childbirth, while women with the educational attainment of less than high school are least likely to be married with 100.0% of them unmarried at childbirth.
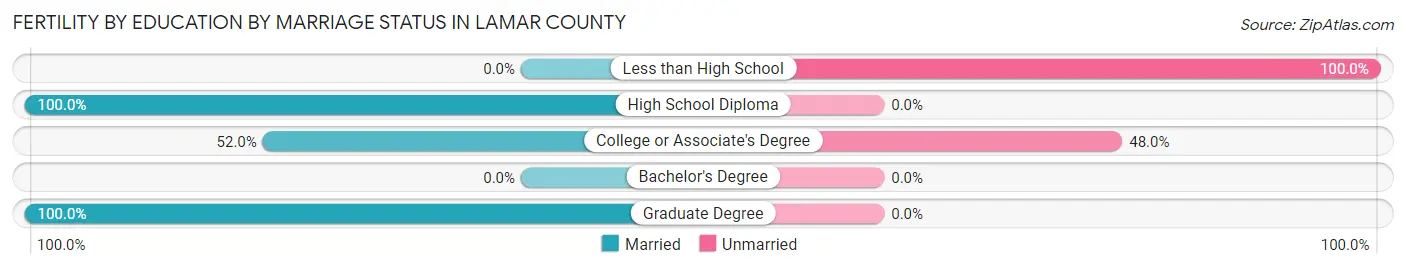
| Educational Attainment | Married | Unmarried |
| Less than High School | 0 (0.0%) | 2 (100.0%) |
| High School Diploma | 59 (100.0%) | 0 (0.0%) |
| College or Associate's Degree | 51 (52.0%) | 47 (48.0%) |
| Bachelor's Degree | 0 (0.0%) | 0 (0.0%) |
| Graduate Degree | 26 (100.0%) | 0 (0.0%) |
| Total | 136 (73.5%) | 49 (26.5%) |
Employment Characteristics in Lamar County
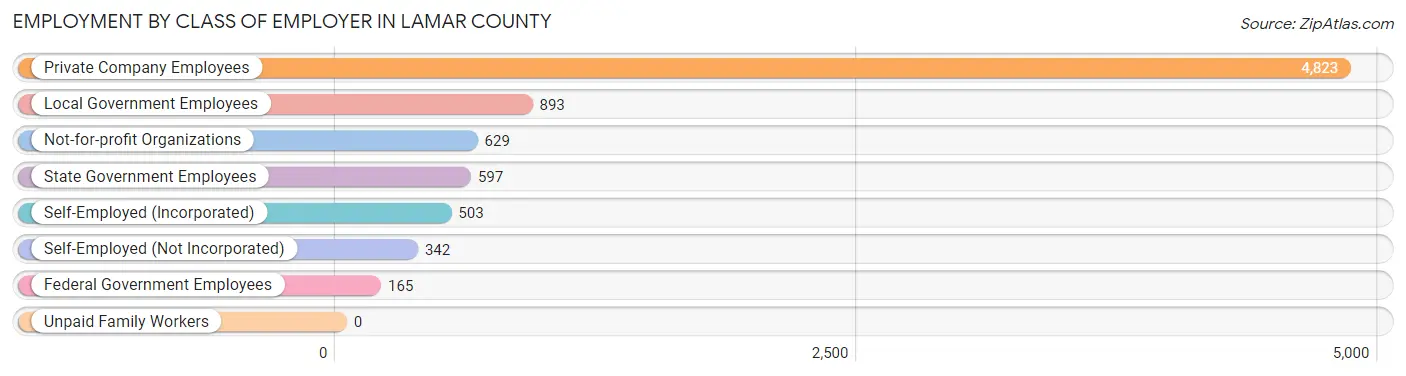
Employment by Class of Employer in Lamar County
Among the 7,952 employed individuals in Lamar County, private company employees (4,823 | 60.7%), local government employees (893 | 11.2%), and not-for-profit organizations (629 | 7.9%) make up the most common classes of employment.
| Employer Class | # Employees | % Employees |
| Private Company Employees | 4,823 | 60.7% |
| Self-Employed (Incorporated) | 503 | 6.3% |
| Self-Employed (Not Incorporated) | 342 | 4.3% |
| Not-for-profit Organizations | 629 | 7.9% |
| Local Government Employees | 893 | 11.2% |
| State Government Employees | 597 | 7.5% |
| Federal Government Employees | 165 | 2.1% |
| Unpaid Family Workers | 0 | 0.0% |
| Total | 7,952 | 100.0% |
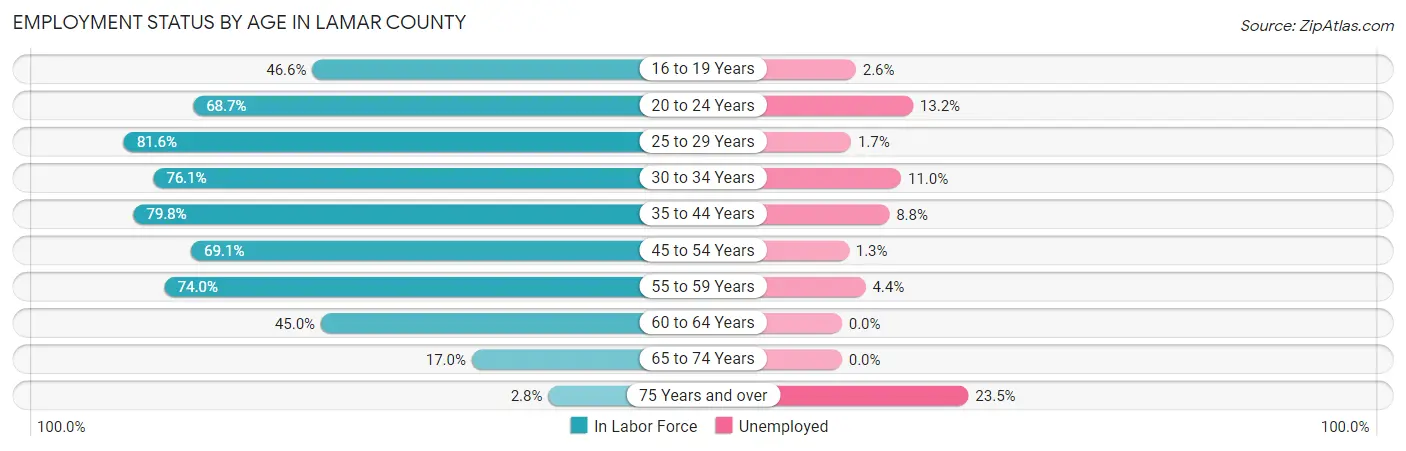
Employment Status by Age in Lamar County
According to the labor force statistics for Lamar County, out of the total population over 16 years of age (15,257), 56.1% or 8,559 individuals are in the labor force, with 5.4% or 462 of them unemployed. The age group with the highest labor force participation rate is 25 to 29 years, with 81.6% or 1,134 individuals in the labor force. Within the labor force, the 75 years and over age range has the highest percentage of unemployed individuals, with 23.5% or 8 of them being unemployed.
| Age Bracket | In Labor Force | Unemployed |
| 16 to 19 Years | 654 (46.6%) | 17 (2.6%) |
| 20 to 24 Years | 1,087 (68.7%) | 143 (13.2%) |
| 25 to 29 Years | 1,134 (81.6%) | 19 (1.7%) |
| 30 to 34 Years | 772 (76.1%) | 85 (11.0%) |
| 35 to 44 Years | 1,515 (79.8%) | 133 (8.8%) |
| 45 to 54 Years | 1,574 (69.1%) | 20 (1.3%) |
| 55 to 59 Years | 890 (74.0%) | 39 (4.4%) |
| 60 to 64 Years | 550 (45.0%) | 0 (0.0%) |
| 65 to 74 Years | 347 (17.0%) | 0 (0.0%) |
| 75 Years and over | 34 (2.8%) | 8 (23.5%) |
| Total | 8,559 (56.1%) | 462 (5.4%) |
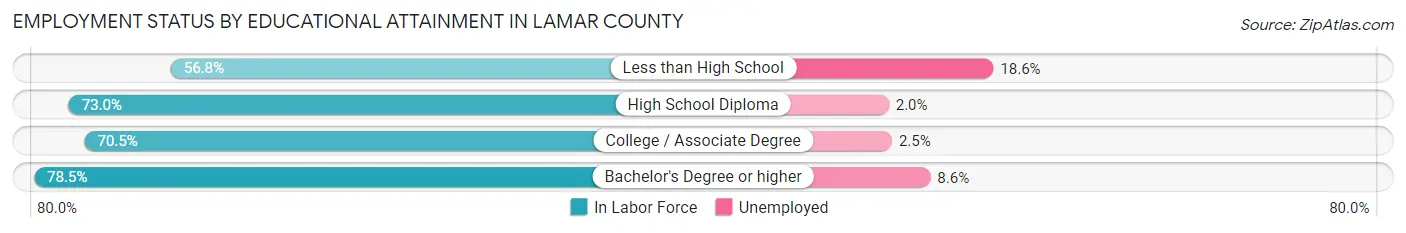
Employment Status by Educational Attainment in Lamar County
According to labor force statistics for Lamar County, 71.5% of individuals (6,439) out of the total population between 25 and 64 years of age (9,006) are in the labor force, with 4.6% or 296 of them being unemployed. The group with the highest labor force participation rate are those with the educational attainment of bachelor's degree or higher, with 78.5% or 1,189 individuals in the labor force. Within the labor force, individuals with less than high school education have the highest percentage of unemployment, with 18.6% or 87 of them being unemployed.
| Educational Attainment | In Labor Force | Unemployed |
| Less than High School | 469 (56.8%) | 153 (18.6%) |
| High School Diploma | 2,307 (73.0%) | 63 (2.0%) |
| College / Associate Degree | 2,472 (70.5%) | 88 (2.5%) |
| Bachelor's Degree or higher | 1,189 (78.5%) | 130 (8.6%) |
| Total | 6,439 (71.5%) | 414 (4.6%) |
Employment Occupations by Sex in Lamar County
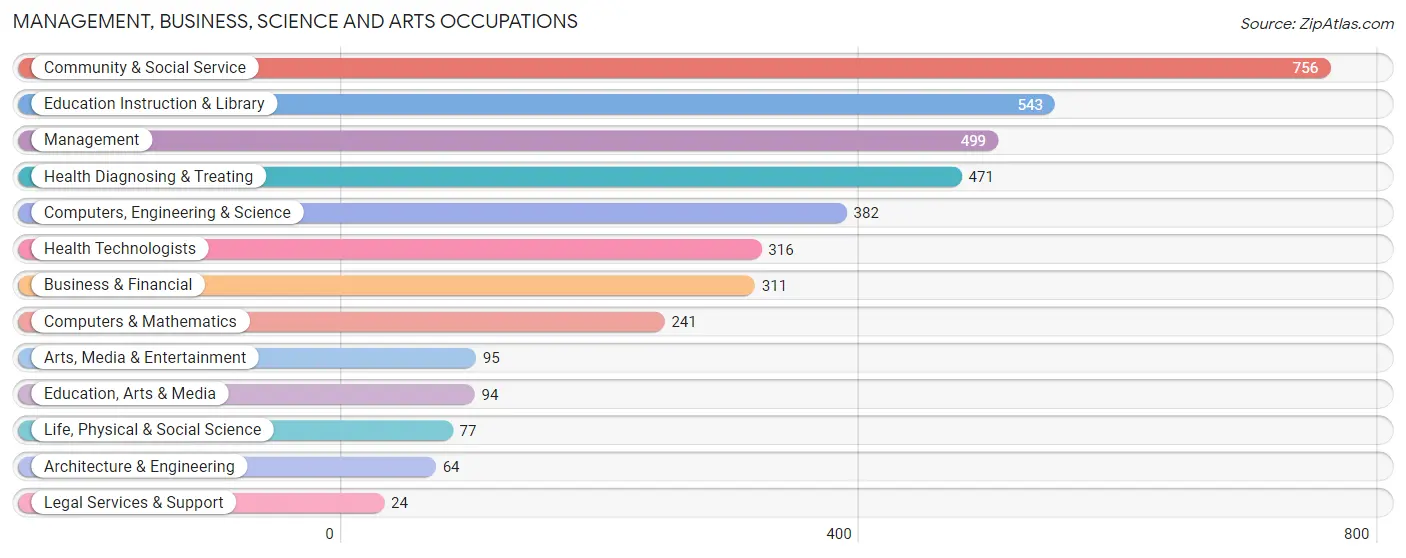
Management, Business, Science and Arts Occupations
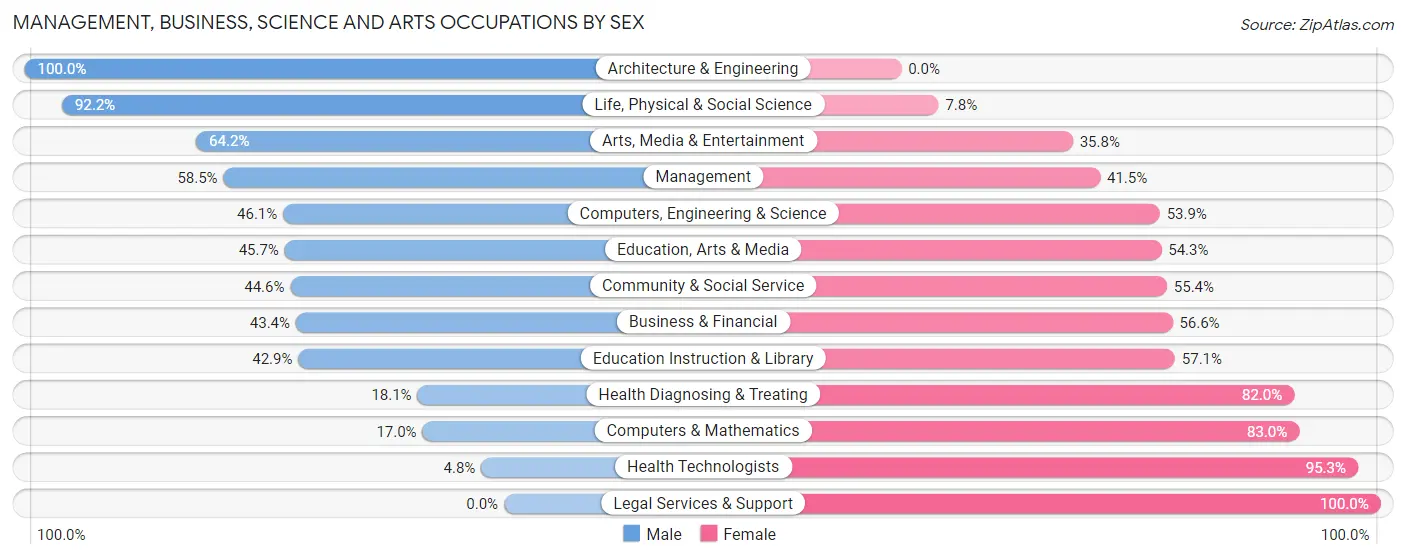
The most common Management, Business, Science and Arts occupations in Lamar County are Community & Social Service (756 | 9.4%), Education Instruction & Library (543 | 6.8%), Management (499 | 6.2%), Health Diagnosing & Treating (471 | 5.9%), and Computers, Engineering & Science (382 | 4.8%).
Management, Business, Science and Arts Occupations by Sex
Within the Management, Business, Science and Arts occupations in Lamar County, the most male-oriented occupations are Architecture & Engineering (100.0%), Life, Physical & Social Science (92.2%), and Arts, Media & Entertainment (64.2%), while the most female-oriented occupations are Legal Services & Support (100.0%), Health Technologists (95.3%), and Computers & Mathematics (83.0%).
| Occupation | Male | Female |
| Management | 292 (58.5%) | 207 (41.5%) |
| Business & Financial | 135 (43.4%) | 176 (56.6%) |
| Computers, Engineering & Science | 176 (46.1%) | 206 (53.9%) |
| Computers & Mathematics | 41 (17.0%) | 200 (83.0%) |
| Architecture & Engineering | 64 (100.0%) | 0 (0.0%) |
| Life, Physical & Social Science | 71 (92.2%) | 6 (7.8%) |
| Community & Social Service | 337 (44.6%) | 419 (55.4%) |
| Education, Arts & Media | 43 (45.7%) | 51 (54.3%) |
| Legal Services & Support | 0 (0.0%) | 24 (100.0%) |
| Education Instruction & Library | 233 (42.9%) | 310 (57.1%) |
| Arts, Media & Entertainment | 61 (64.2%) | 34 (35.8%) |
| Health Diagnosing & Treating | 85 (18.0%) | 386 (82.0%) |
| Health Technologists | 15 (4.8%) | 301 (95.3%) |
| Total (Category) | 1,025 (42.4%) | 1,394 (57.6%) |
| Total (Overall) | 4,208 (52.3%) | 3,839 (47.7%) |
Services Occupations
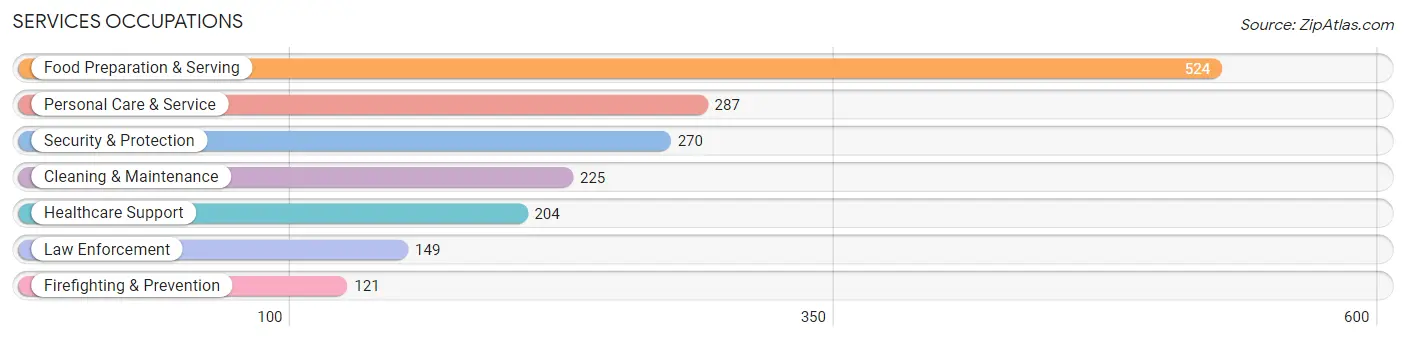
The most common Services occupations in Lamar County are Food Preparation & Serving (524 | 6.5%), Personal Care & Service (287 | 3.6%), Security & Protection (270 | 3.4%), Cleaning & Maintenance (225 | 2.8%), and Healthcare Support (204 | 2.5%).
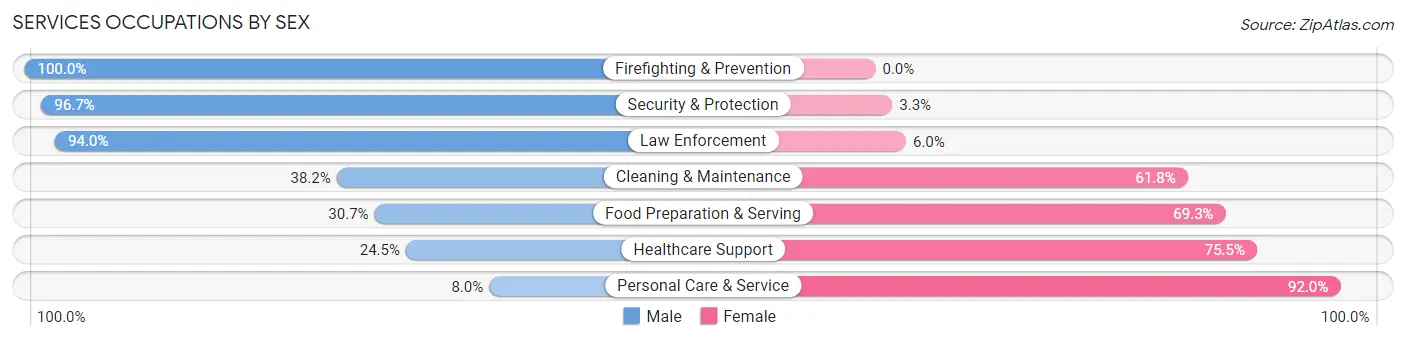
Services Occupations by Sex
Within the Services occupations in Lamar County, the most male-oriented occupations are Firefighting & Prevention (100.0%), Security & Protection (96.7%), and Law Enforcement (94.0%), while the most female-oriented occupations are Personal Care & Service (92.0%), Healthcare Support (75.5%), and Food Preparation & Serving (69.3%).
| Occupation | Male | Female |
| Healthcare Support | 50 (24.5%) | 154 (75.5%) |
| Security & Protection | 261 (96.7%) | 9 (3.3%) |
| Firefighting & Prevention | 121 (100.0%) | 0 (0.0%) |
| Law Enforcement | 140 (94.0%) | 9 (6.0%) |
| Food Preparation & Serving | 161 (30.7%) | 363 (69.3%) |
| Cleaning & Maintenance | 86 (38.2%) | 139 (61.8%) |
| Personal Care & Service | 23 (8.0%) | 264 (92.0%) |
| Total (Category) | 581 (38.5%) | 929 (61.5%) |
| Total (Overall) | 4,208 (52.3%) | 3,839 (47.7%) |
Sales and Office Occupations
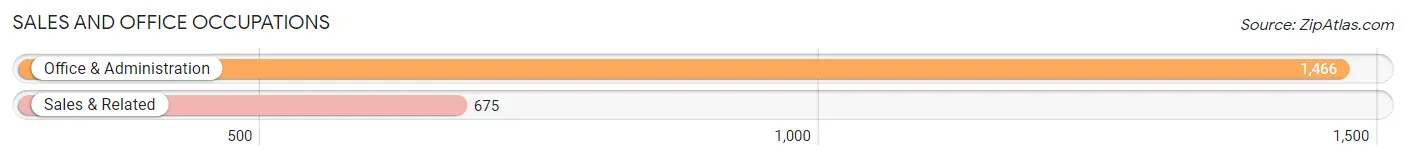
The most common Sales and Office occupations in Lamar County are Office & Administration (1,466 | 18.2%), and Sales & Related (675 | 8.4%).
Sales and Office Occupations by Sex

| Occupation | Male | Female |
| Sales & Related | 374 (55.4%) | 301 (44.6%) |
| Office & Administration | 468 (31.9%) | 998 (68.1%) |
| Total (Category) | 842 (39.3%) | 1,299 (60.7%) |
| Total (Overall) | 4,208 (52.3%) | 3,839 (47.7%) |
Natural Resources, Construction and Maintenance Occupations
The most common Natural Resources, Construction and Maintenance occupations in Lamar County are Installation, Maintenance & Repair (457 | 5.7%), Construction & Extraction (441 | 5.5%), and Farming, Fishing & Forestry (16 | 0.2%).
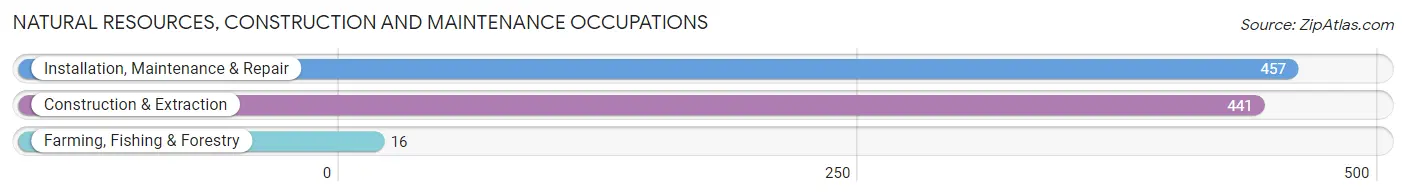
Natural Resources, Construction and Maintenance Occupations by Sex
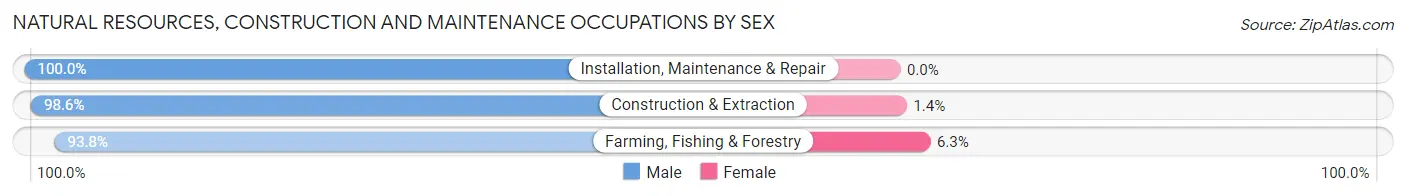
| Occupation | Male | Female |
| Farming, Fishing & Forestry | 15 (93.8%) | 1 (6.2%) |
| Construction & Extraction | 435 (98.6%) | 6 (1.4%) |
| Installation, Maintenance & Repair | 457 (100.0%) | 0 (0.0%) |
| Total (Category) | 907 (99.2%) | 7 (0.8%) |
| Total (Overall) | 4,208 (52.3%) | 3,839 (47.7%) |
Production, Transportation and Moving Occupations
The most common Production, Transportation and Moving occupations in Lamar County are Production (453 | 5.6%), Material Moving (334 | 4.2%), and Transportation (276 | 3.4%).
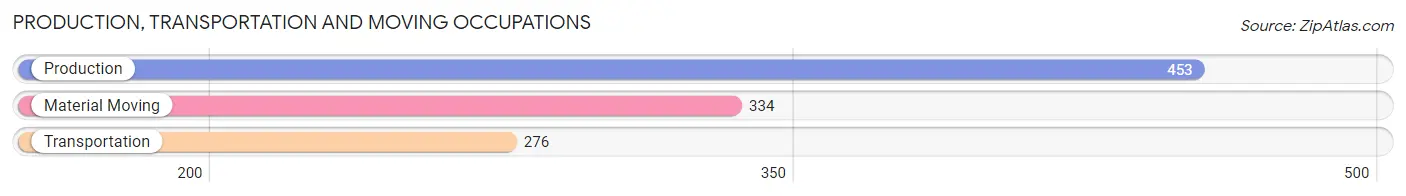
Production, Transportation and Moving Occupations by Sex
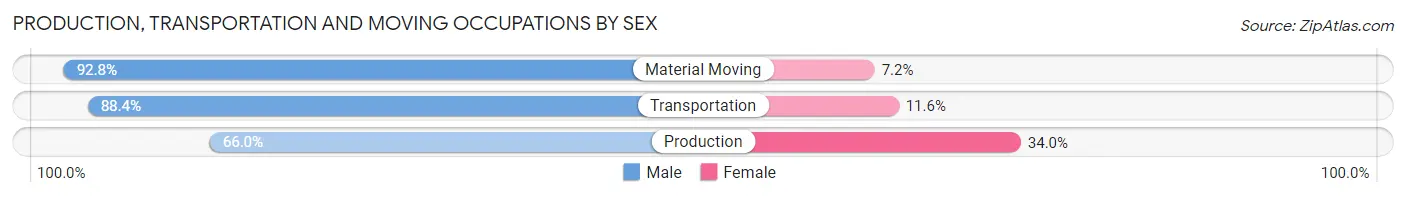
| Occupation | Male | Female |
| Production | 299 (66.0%) | 154 (34.0%) |
| Transportation | 244 (88.4%) | 32 (11.6%) |
| Material Moving | 310 (92.8%) | 24 (7.2%) |
| Total (Category) | 853 (80.2%) | 210 (19.8%) |
| Total (Overall) | 4,208 (52.3%) | 3,839 (47.7%) |
Employment Industries by Sex in Lamar County
Employment Industries in Lamar County
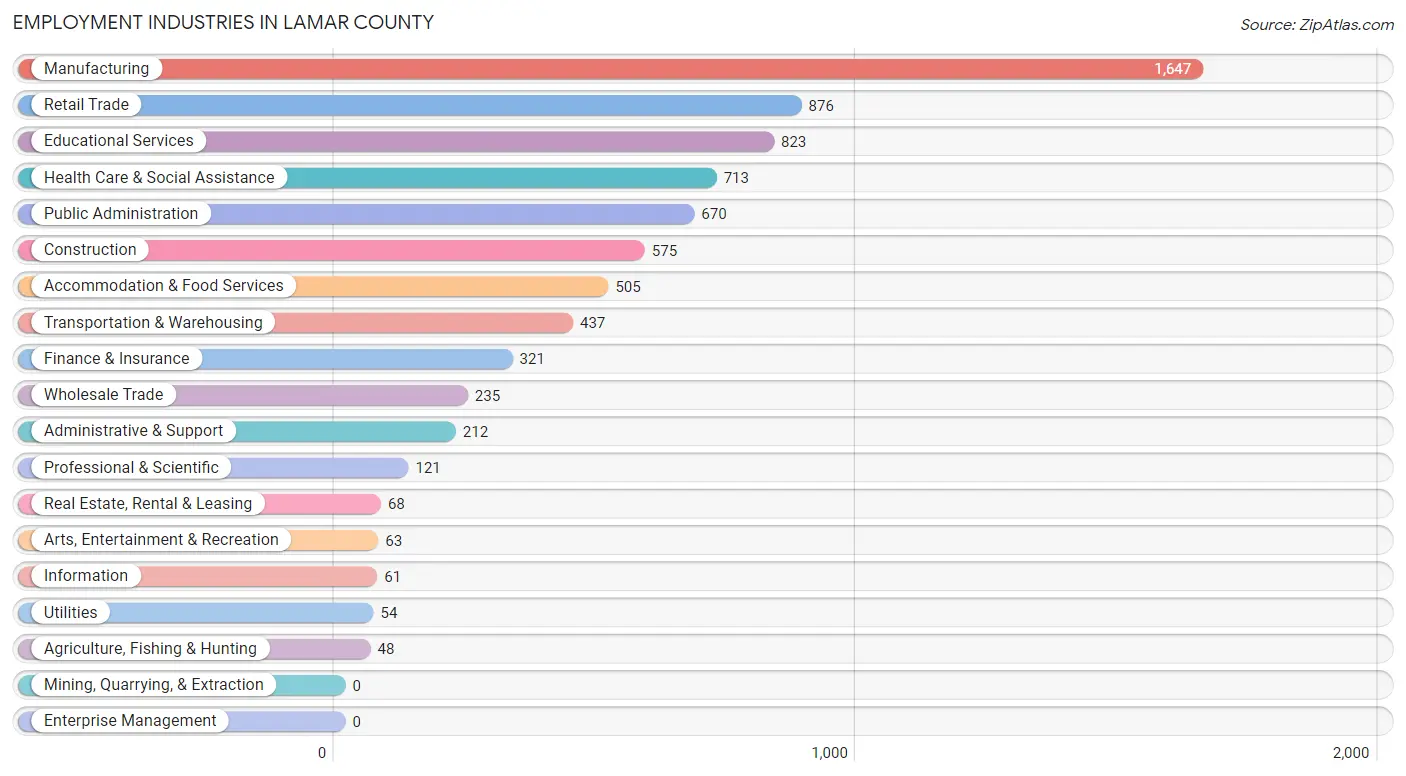
The major employment industries in Lamar County include Manufacturing (1,647 | 20.5%), Retail Trade (876 | 10.9%), Educational Services (823 | 10.2%), Health Care & Social Assistance (713 | 8.9%), and Public Administration (670 | 8.3%).
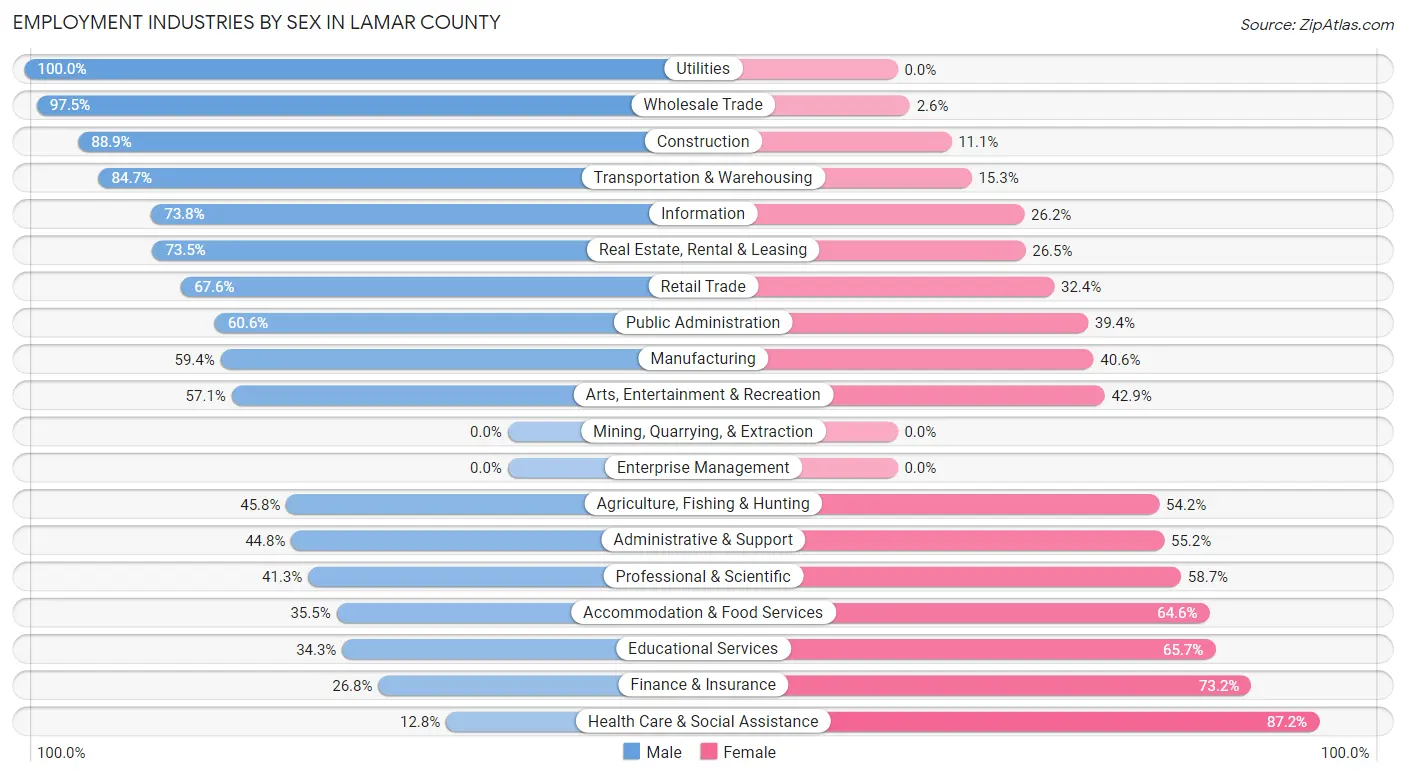
Employment Industries by Sex in Lamar County
The Lamar County industries that see more men than women are Utilities (100.0%), Wholesale Trade (97.5%), and Construction (88.9%), whereas the industries that tend to have a higher number of women are Health Care & Social Assistance (87.2%), Finance & Insurance (73.2%), and Educational Services (65.7%).
| Industry | Male | Female |
| Agriculture, Fishing & Hunting | 22 (45.8%) | 26 (54.2%) |
| Mining, Quarrying, & Extraction | 0 (0.0%) | 0 (0.0%) |
| Construction | 511 (88.9%) | 64 (11.1%) |
| Manufacturing | 979 (59.4%) | 668 (40.6%) |
| Wholesale Trade | 229 (97.5%) | 6 (2.5%) |
| Retail Trade | 592 (67.6%) | 284 (32.4%) |
| Transportation & Warehousing | 370 (84.7%) | 67 (15.3%) |
| Utilities | 54 (100.0%) | 0 (0.0%) |
| Information | 45 (73.8%) | 16 (26.2%) |
| Finance & Insurance | 86 (26.8%) | 235 (73.2%) |
| Real Estate, Rental & Leasing | 50 (73.5%) | 18 (26.5%) |
| Professional & Scientific | 50 (41.3%) | 71 (58.7%) |
| Enterprise Management | 0 (0.0%) | 0 (0.0%) |
| Administrative & Support | 95 (44.8%) | 117 (55.2%) |
| Educational Services | 282 (34.3%) | 541 (65.7%) |
| Health Care & Social Assistance | 91 (12.8%) | 622 (87.2%) |
| Arts, Entertainment & Recreation | 36 (57.1%) | 27 (42.9%) |
| Accommodation & Food Services | 179 (35.4%) | 326 (64.5%) |
| Public Administration | 406 (60.6%) | 264 (39.4%) |
| Total | 4,208 (52.3%) | 3,839 (47.7%) |
Education in Lamar County
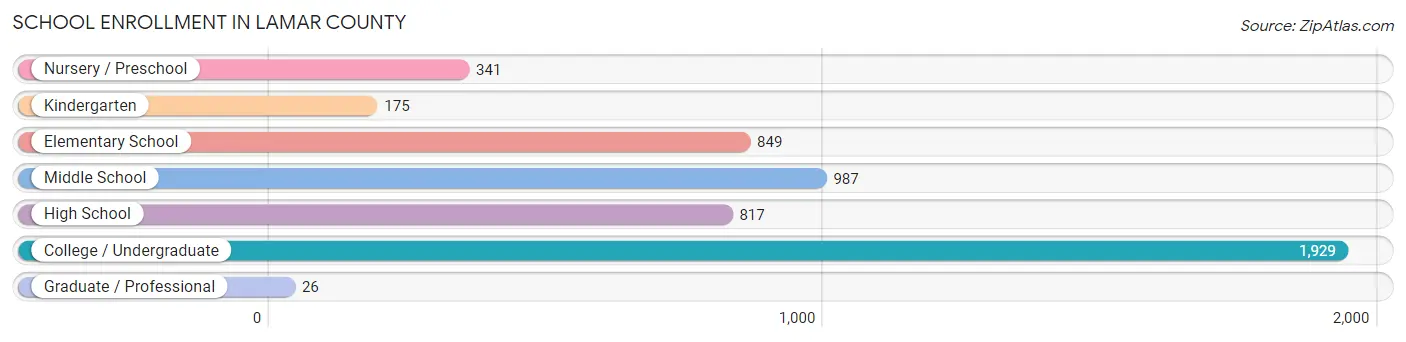
School Enrollment in Lamar County
The most common levels of schooling among the 5,124 students in Lamar County are college / undergraduate (1,929 | 37.7%), middle school (987 | 19.3%), and elementary school (849 | 16.6%).
| School Level | # Students | % Students |
| Nursery / Preschool | 341 | 6.7% |
| Kindergarten | 175 | 3.4% |
| Elementary School | 849 | 16.6% |
| Middle School | 987 | 19.3% |
| High School | 817 | 15.9% |
| College / Undergraduate | 1,929 | 37.7% |
| Graduate / Professional | 26 | 0.5% |
| Total | 5,124 | 100.0% |
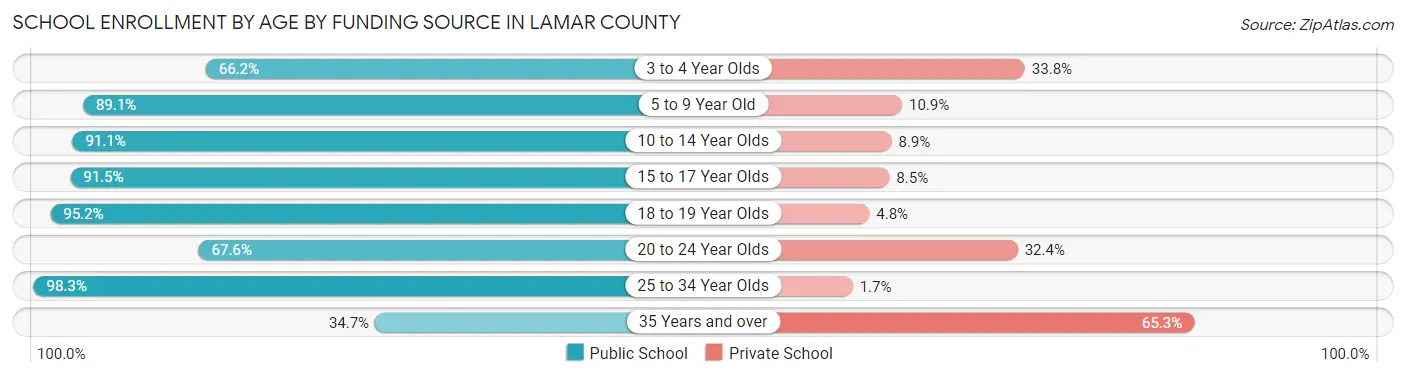
School Enrollment by Age by Funding Source in Lamar County
Out of a total of 5,124 students who are enrolled in schools in Lamar County, 702 (13.7%) attend a private institution, while the remaining 4,422 (86.3%) are enrolled in public schools. The age group of 35 years and over has the highest likelihood of being enrolled in private schools, with 62 (65.3% in the age bracket) enrolled. Conversely, the age group of 25 to 34 year olds has the lowest likelihood of being enrolled in a private school, with 410 (98.3% in the age bracket) attending a public institution.
| Age Bracket | Public School | Private School |
| 3 to 4 Year Olds | 157 (66.2%) | 80 (33.8%) |
| 5 to 9 Year Old | 910 (89.1%) | 111 (10.9%) |
| 10 to 14 Year Olds | 1,041 (91.1%) | 102 (8.9%) |
| 15 to 17 Year Olds | 537 (91.5%) | 50 (8.5%) |
| 18 to 19 Year Olds | 815 (95.2%) | 41 (4.8%) |
| 20 to 24 Year Olds | 519 (67.6%) | 249 (32.4%) |
| 25 to 34 Year Olds | 410 (98.3%) | 7 (1.7%) |
| 35 Years and over | 33 (34.7%) | 62 (65.3%) |
| Total | 4,422 (86.3%) | 702 (13.7%) |
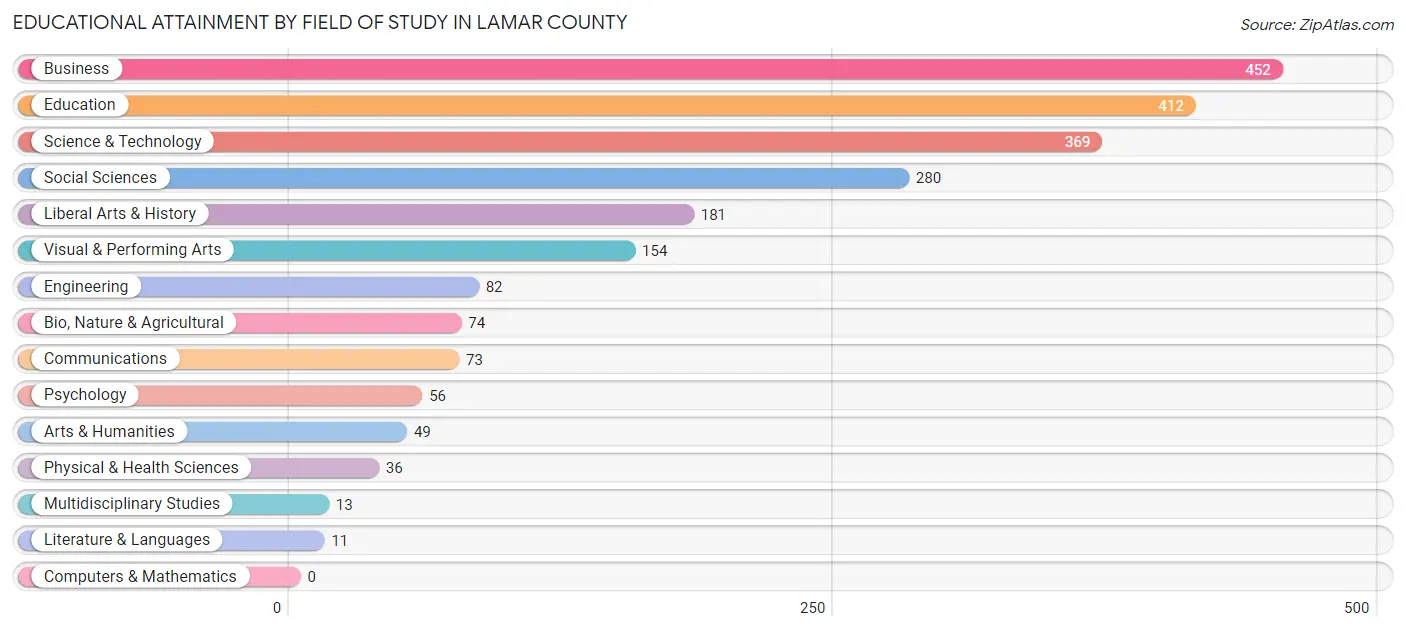
Educational Attainment by Field of Study in Lamar County
Business (452 | 20.2%), education (412 | 18.4%), science & technology (369 | 16.5%), social sciences (280 | 12.5%), and liberal arts & history (181 | 8.1%) are the most common fields of study among 2,242 individuals in Lamar County who have obtained a bachelor's degree or higher.
| Field of Study | # Graduates | % Graduates |
| Computers & Mathematics | 0 | 0.0% |
| Bio, Nature & Agricultural | 74 | 3.3% |
| Physical & Health Sciences | 36 | 1.6% |
| Psychology | 56 | 2.5% |
| Social Sciences | 280 | 12.5% |
| Engineering | 82 | 3.7% |
| Multidisciplinary Studies | 13 | 0.6% |
| Science & Technology | 369 | 16.5% |
| Business | 452 | 20.2% |
| Education | 412 | 18.4% |
| Literature & Languages | 11 | 0.5% |
| Liberal Arts & History | 181 | 8.1% |
| Visual & Performing Arts | 154 | 6.9% |
| Communications | 73 | 3.3% |
| Arts & Humanities | 49 | 2.2% |
| Total | 2,242 | 100.0% |
Transportation & Commute in Lamar County
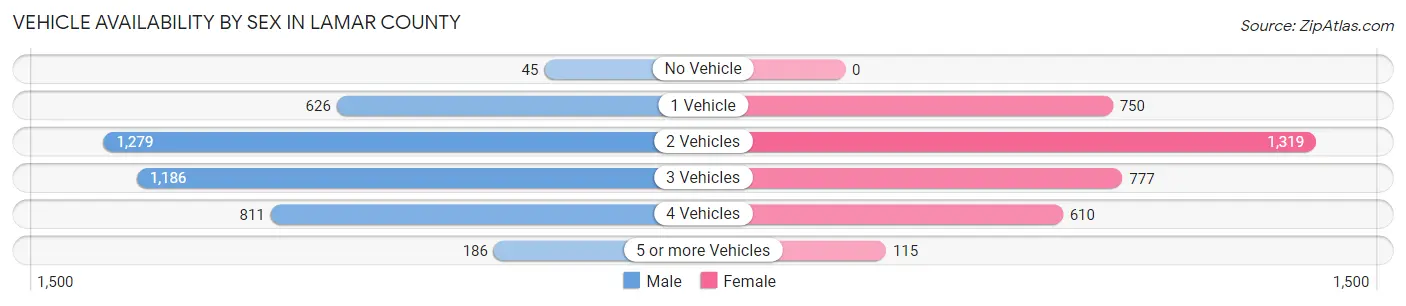
Vehicle Availability by Sex in Lamar County
The most prevalent vehicle ownership categories in Lamar County are males with 2 vehicles (1,279, accounting for 30.9%) and females with 2 vehicles (1,319, making up 35.8%).
| Vehicles Available | Male | Female |
| No Vehicle | 45 (1.1%) | 0 (0.0%) |
| 1 Vehicle | 626 (15.1%) | 750 (21.0%) |
| 2 Vehicles | 1,279 (30.9%) | 1,319 (36.9%) |
| 3 Vehicles | 1,186 (28.7%) | 777 (21.8%) |
| 4 Vehicles | 811 (19.6%) | 610 (17.1%) |
| 5 or more Vehicles | 186 (4.5%) | 115 (3.2%) |
| Total | 4,133 (100.0%) | 3,571 (100.0%) |
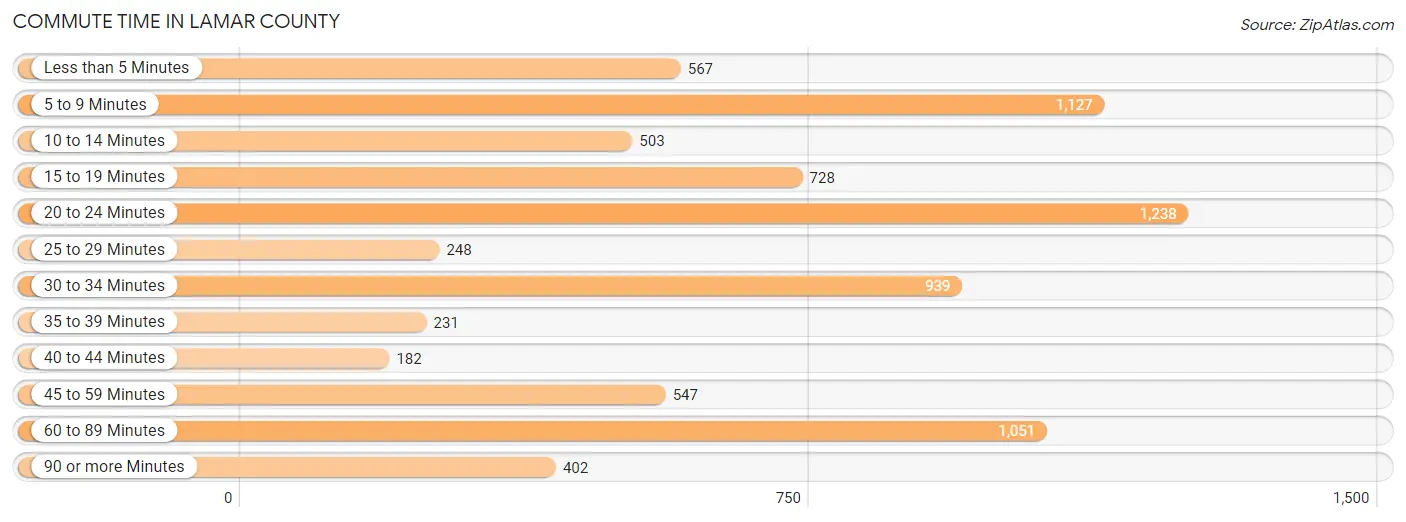
Commute Time in Lamar County
The most frequently occuring commute durations in Lamar County are 20 to 24 minutes (1,238 commuters, 16.0%), 5 to 9 minutes (1,127 commuters, 14.5%), and 60 to 89 minutes (1,051 commuters, 13.5%).
| Commute Time | # Commuters | % Commuters |
| Less than 5 Minutes | 567 | 7.3% |
| 5 to 9 Minutes | 1,127 | 14.5% |
| 10 to 14 Minutes | 503 | 6.5% |
| 15 to 19 Minutes | 728 | 9.4% |
| 20 to 24 Minutes | 1,238 | 16.0% |
| 25 to 29 Minutes | 248 | 3.2% |
| 30 to 34 Minutes | 939 | 12.1% |
| 35 to 39 Minutes | 231 | 3.0% |
| 40 to 44 Minutes | 182 | 2.3% |
| 45 to 59 Minutes | 547 | 7.0% |
| 60 to 89 Minutes | 1,051 | 13.5% |
| 90 or more Minutes | 402 | 5.2% |
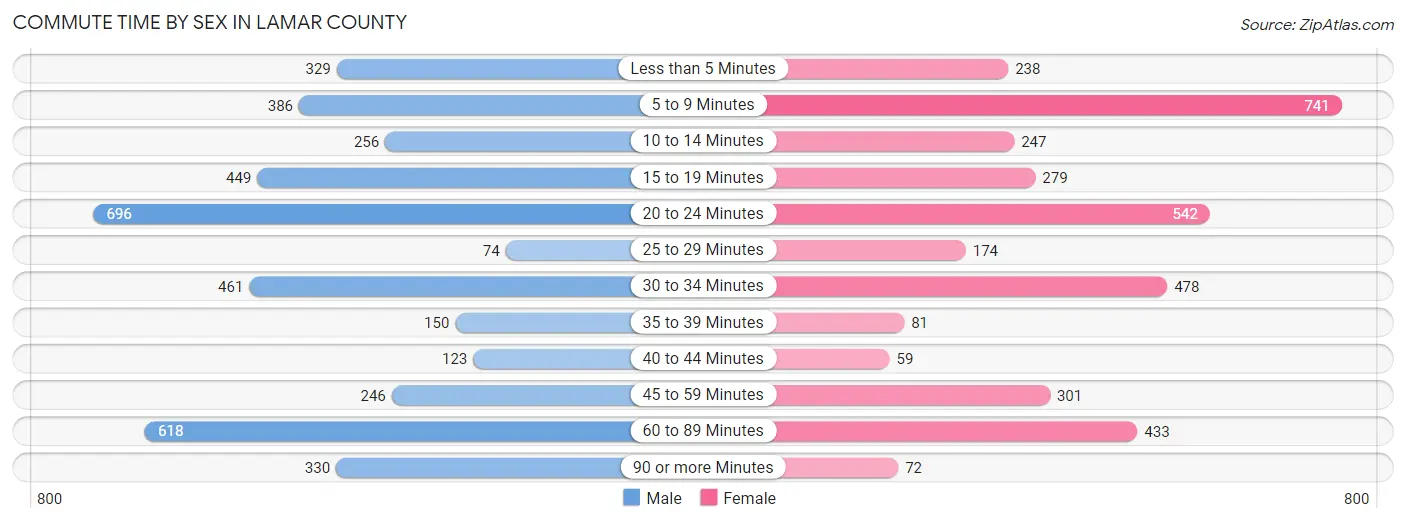
Commute Time by Sex in Lamar County
The most common commute times in Lamar County are 20 to 24 minutes (696 commuters, 16.9%) for males and 5 to 9 minutes (741 commuters, 20.3%) for females.
| Commute Time | Male | Female |
| Less than 5 Minutes | 329 (8.0%) | 238 (6.5%) |
| 5 to 9 Minutes | 386 (9.4%) | 741 (20.3%) |
| 10 to 14 Minutes | 256 (6.2%) | 247 (6.8%) |
| 15 to 19 Minutes | 449 (10.9%) | 279 (7.6%) |
| 20 to 24 Minutes | 696 (16.9%) | 542 (14.9%) |
| 25 to 29 Minutes | 74 (1.8%) | 174 (4.8%) |
| 30 to 34 Minutes | 461 (11.2%) | 478 (13.1%) |
| 35 to 39 Minutes | 150 (3.6%) | 81 (2.2%) |
| 40 to 44 Minutes | 123 (3.0%) | 59 (1.6%) |
| 45 to 59 Minutes | 246 (6.0%) | 301 (8.3%) |
| 60 to 89 Minutes | 618 (15.0%) | 433 (11.9%) |
| 90 or more Minutes | 330 (8.0%) | 72 (2.0%) |
Time of Departure to Work by Sex in Lamar County
The most frequent times of departure to work in Lamar County are 7:00 AM to 7:29 AM (824, 20.0%) for males and 7:30 AM to 7:59 AM (740, 20.3%) for females.
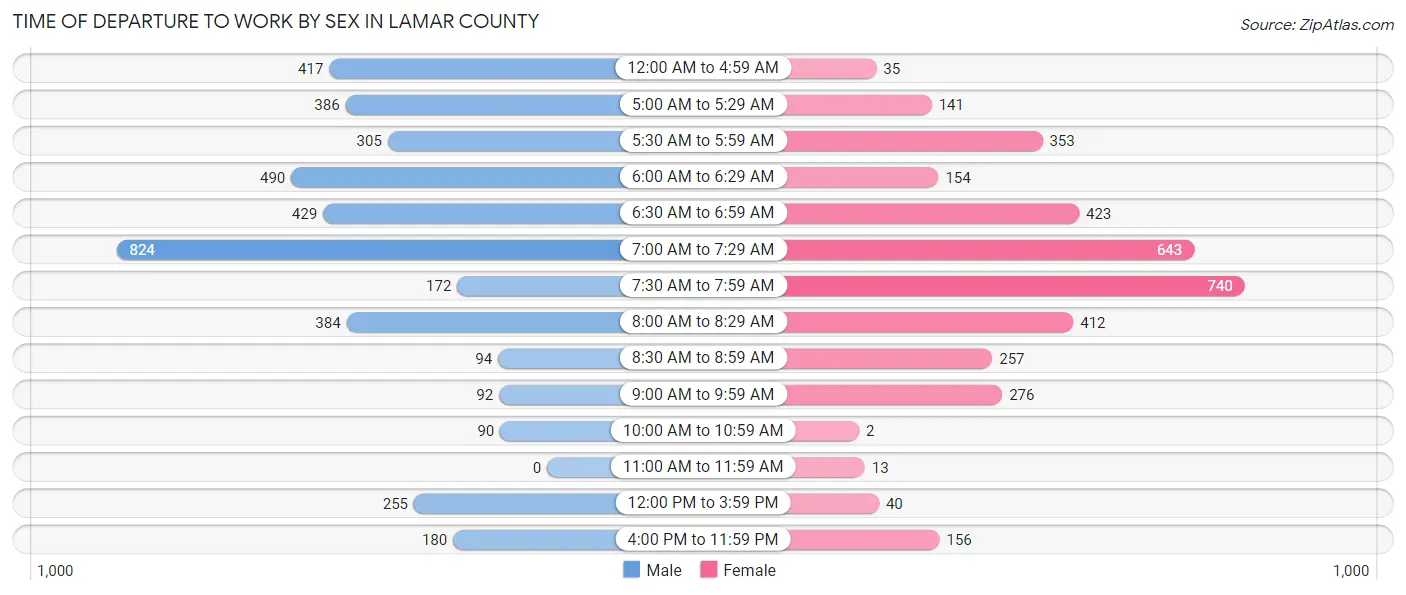
| Time of Departure | Male | Female |
| 12:00 AM to 4:59 AM | 417 (10.1%) | 35 (1.0%) |
| 5:00 AM to 5:29 AM | 386 (9.4%) | 141 (3.9%) |
| 5:30 AM to 5:59 AM | 305 (7.4%) | 353 (9.7%) |
| 6:00 AM to 6:29 AM | 490 (11.9%) | 154 (4.2%) |
| 6:30 AM to 6:59 AM | 429 (10.4%) | 423 (11.6%) |
| 7:00 AM to 7:29 AM | 824 (20.0%) | 643 (17.6%) |
| 7:30 AM to 7:59 AM | 172 (4.2%) | 740 (20.3%) |
| 8:00 AM to 8:29 AM | 384 (9.3%) | 412 (11.3%) |
| 8:30 AM to 8:59 AM | 94 (2.3%) | 257 (7.0%) |
| 9:00 AM to 9:59 AM | 92 (2.2%) | 276 (7.6%) |
| 10:00 AM to 10:59 AM | 90 (2.2%) | 2 (0.1%) |
| 11:00 AM to 11:59 AM | 0 (0.0%) | 13 (0.4%) |
| 12:00 PM to 3:59 PM | 255 (6.2%) | 40 (1.1%) |
| 4:00 PM to 11:59 PM | 180 (4.4%) | 156 (4.3%) |
| Total | 4,118 (100.0%) | 3,645 (100.0%) |
Housing Occupancy in Lamar County
Occupancy by Ownership in Lamar County
Of the total 6,918 dwellings in Lamar County, owner-occupied units account for 5,263 (76.1%), while renter-occupied units make up 1,655 (23.9%).
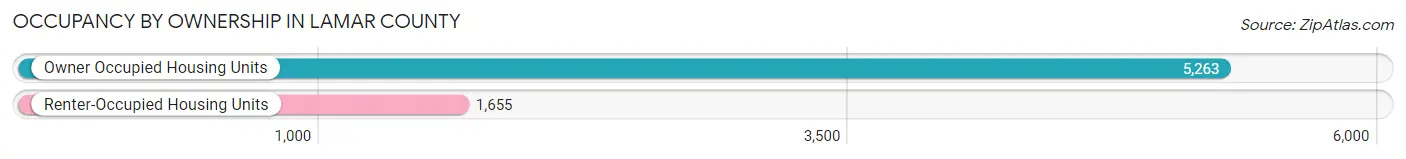
| Occupancy | # Housing Units | % Housing Units |
| Owner Occupied Housing Units | 5,263 | 76.1% |
| Renter-Occupied Housing Units | 1,655 | 23.9% |
| Total Occupied Housing Units | 6,918 | 100.0% |
Occupancy by Household Size in Lamar County
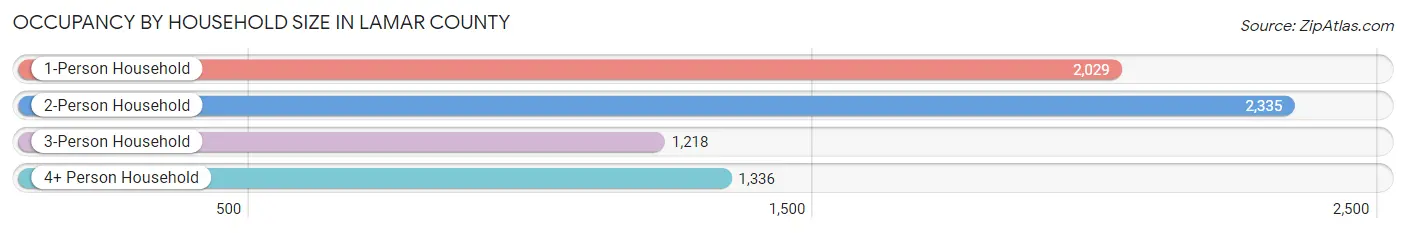
| Household Size | # Housing Units | % Housing Units |
| 1-Person Household | 2,029 | 29.3% |
| 2-Person Household | 2,335 | 33.8% |
| 3-Person Household | 1,218 | 17.6% |
| 4+ Person Household | 1,336 | 19.3% |
| Total Housing Units | 6,918 | 100.0% |
Occupancy by Ownership by Household Size in Lamar County
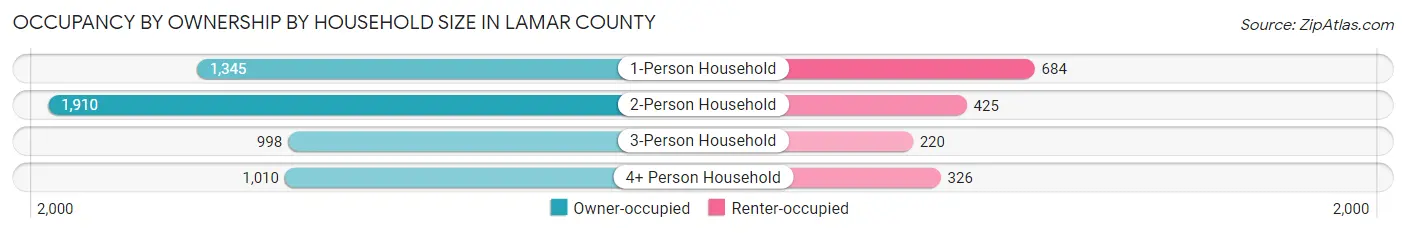
| Household Size | Owner-occupied | Renter-occupied |
| 1-Person Household | 1,345 (66.3%) | 684 (33.7%) |
| 2-Person Household | 1,910 (81.8%) | 425 (18.2%) |
| 3-Person Household | 998 (81.9%) | 220 (18.1%) |
| 4+ Person Household | 1,010 (75.6%) | 326 (24.4%) |
| Total Housing Units | 5,263 (76.1%) | 1,655 (23.9%) |
Occupancy by Educational Attainment in Lamar County
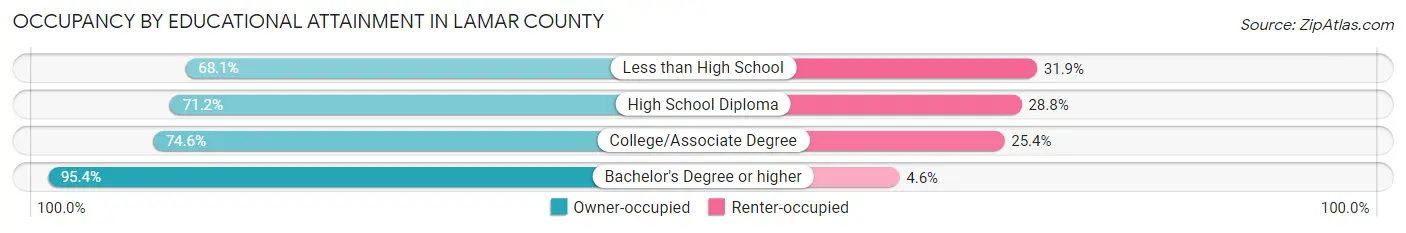
| Household Size | Owner-occupied | Renter-occupied |
| Less than High School | 556 (68.1%) | 260 (31.9%) |
| High School Diploma | 1,680 (71.2%) | 680 (28.8%) |
| College/Associate Degree | 1,946 (74.6%) | 663 (25.4%) |
| Bachelor's Degree or higher | 1,081 (95.4%) | 52 (4.6%) |
Occupancy by Age of Householder in Lamar County
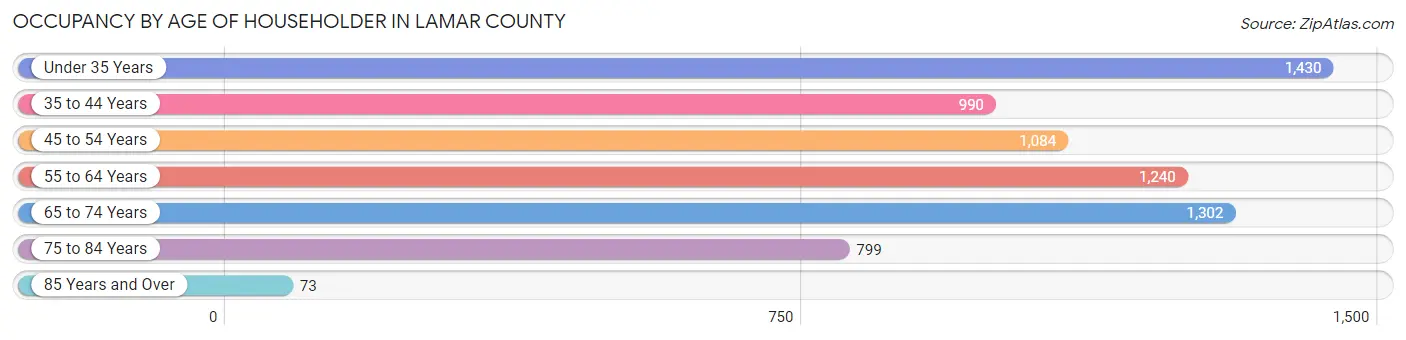
| Age Bracket | # Households | % Households |
| Under 35 Years | 1,430 | 20.7% |
| 35 to 44 Years | 990 | 14.3% |
| 45 to 54 Years | 1,084 | 15.7% |
| 55 to 64 Years | 1,240 | 17.9% |
| 65 to 74 Years | 1,302 | 18.8% |
| 75 to 84 Years | 799 | 11.6% |
| 85 Years and Over | 73 | 1.1% |
| Total | 6,918 | 100.0% |
Housing Finances in Lamar County
Median Income by Occupancy in Lamar County
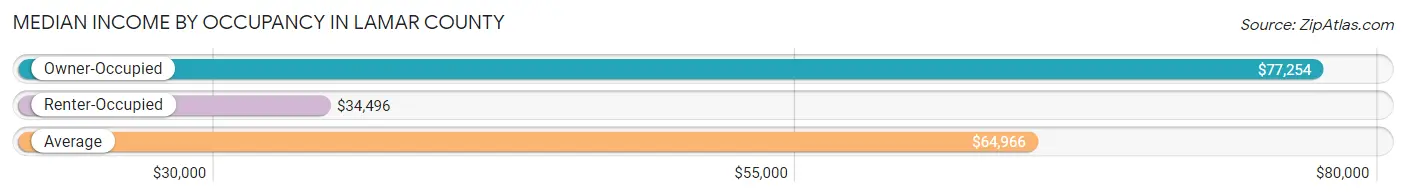
| Occupancy Type | # Households | Median Income |
| Owner-Occupied | 5,263 (76.1%) | $77,254 |
| Renter-Occupied | 1,655 (23.9%) | $34,496 |
| Average | 6,918 (100.0%) | $64,966 |
Occupancy by Householder Income Bracket in Lamar County
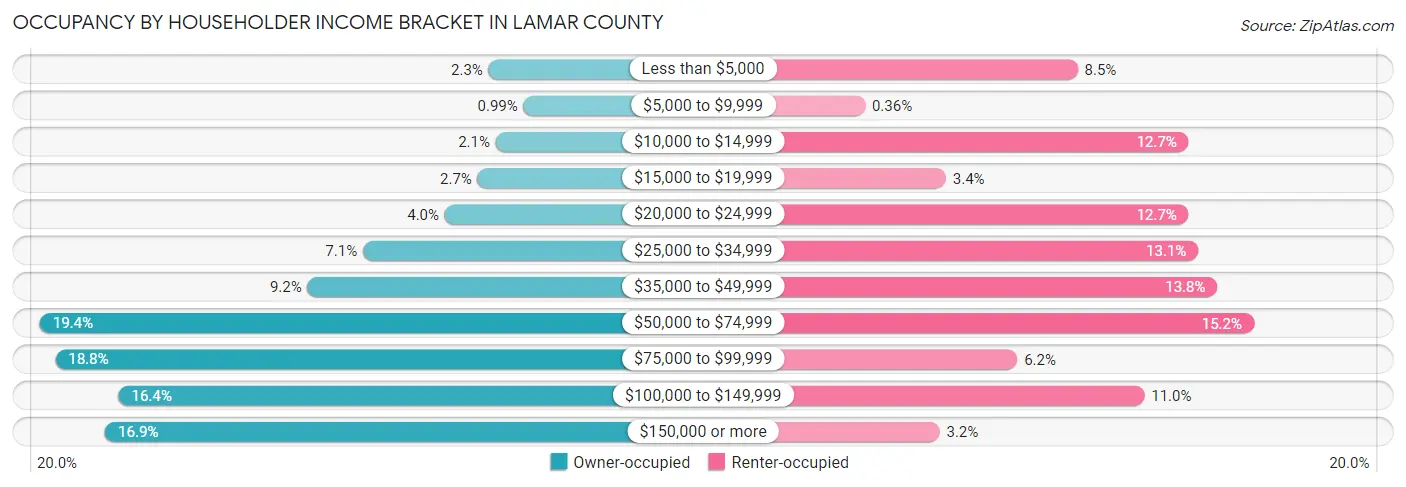
| Income Bracket | Owner-occupied | Renter-occupied |
| Less than $5,000 | 122 (2.3%) | 140 (8.5%) |
| $5,000 to $9,999 | 52 (1.0%) | 6 (0.4%) |
| $10,000 to $14,999 | 108 (2.1%) | 210 (12.7%) |
| $15,000 to $19,999 | 144 (2.7%) | 57 (3.4%) |
| $20,000 to $24,999 | 210 (4.0%) | 210 (12.7%) |
| $25,000 to $34,999 | 374 (7.1%) | 216 (13.1%) |
| $35,000 to $49,999 | 485 (9.2%) | 228 (13.8%) |
| $50,000 to $74,999 | 1,022 (19.4%) | 251 (15.2%) |
| $75,000 to $99,999 | 991 (18.8%) | 102 (6.2%) |
| $100,000 to $149,999 | 864 (16.4%) | 182 (11.0%) |
| $150,000 or more | 891 (16.9%) | 53 (3.2%) |
| Total | 5,263 (100.0%) | 1,655 (100.0%) |
Monthly Housing Cost Tiers in Lamar County
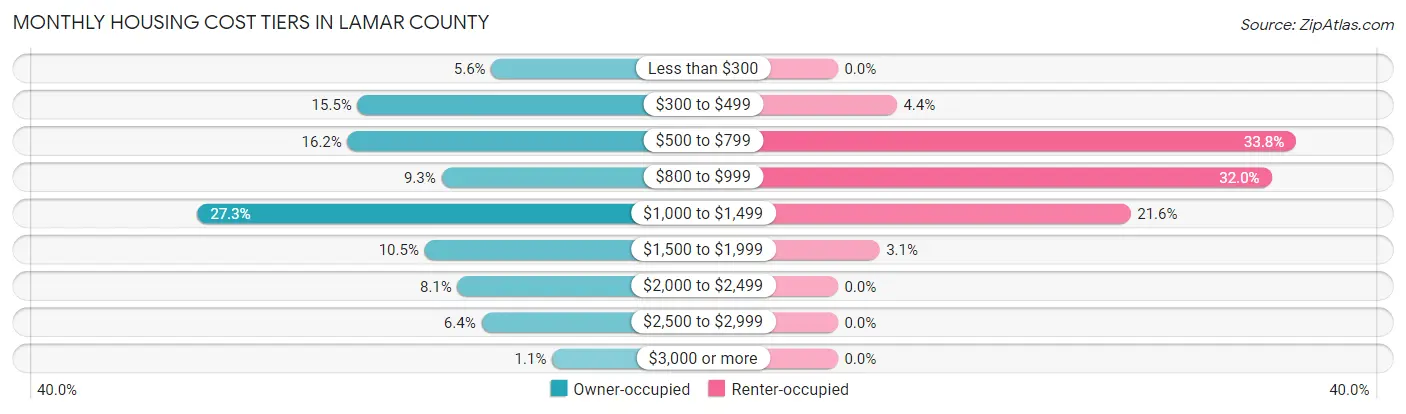
| Monthly Cost | Owner-occupied | Renter-occupied |
| Less than $300 | 296 (5.6%) | 0 (0.0%) |
| $300 to $499 | 814 (15.5%) | 72 (4.3%) |
| $500 to $799 | 853 (16.2%) | 559 (33.8%) |
| $800 to $999 | 489 (9.3%) | 529 (32.0%) |
| $1,000 to $1,499 | 1,436 (27.3%) | 357 (21.6%) |
| $1,500 to $1,999 | 554 (10.5%) | 51 (3.1%) |
| $2,000 to $2,499 | 427 (8.1%) | 0 (0.0%) |
| $2,500 to $2,999 | 334 (6.4%) | 0 (0.0%) |
| $3,000 or more | 60 (1.1%) | 0 (0.0%) |
| Total | 5,263 (100.0%) | 1,655 (100.0%) |
Physical Housing Characteristics in Lamar County
Housing Structures in Lamar County
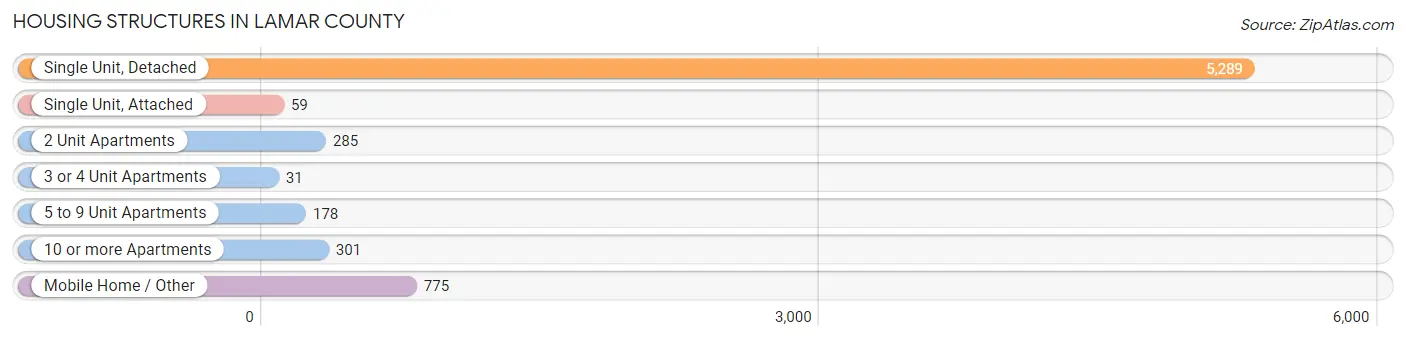
| Structure Type | # Housing Units | % Housing Units |
| Single Unit, Detached | 5,289 | 76.4% |
| Single Unit, Attached | 59 | 0.9% |
| 2 Unit Apartments | 285 | 4.1% |
| 3 or 4 Unit Apartments | 31 | 0.4% |
| 5 to 9 Unit Apartments | 178 | 2.6% |
| 10 or more Apartments | 301 | 4.3% |
| Mobile Home / Other | 775 | 11.2% |
| Total | 6,918 | 100.0% |
Housing Structures by Occupancy in Lamar County
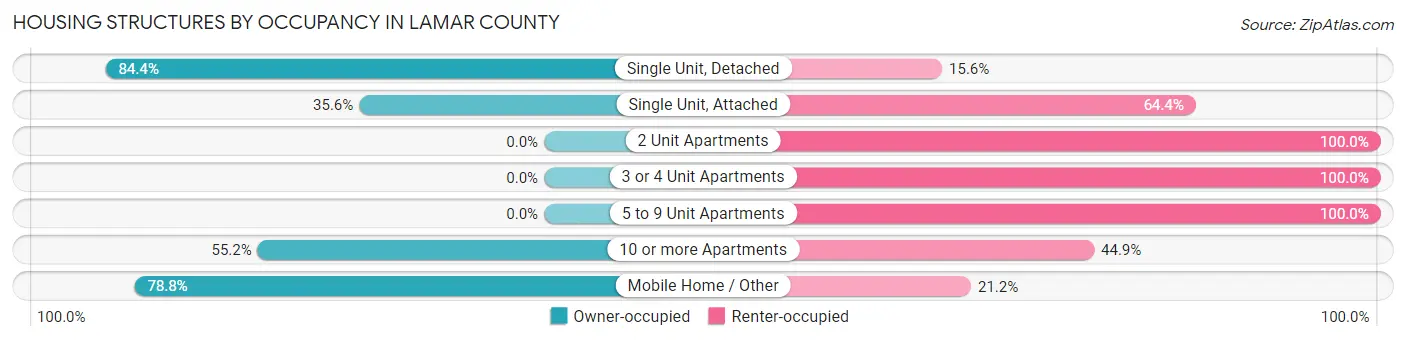
| Structure Type | Owner-occupied | Renter-occupied |
| Single Unit, Detached | 4,465 (84.4%) | 824 (15.6%) |
| Single Unit, Attached | 21 (35.6%) | 38 (64.4%) |
| 2 Unit Apartments | 0 (0.0%) | 285 (100.0%) |
| 3 or 4 Unit Apartments | 0 (0.0%) | 31 (100.0%) |
| 5 to 9 Unit Apartments | 0 (0.0%) | 178 (100.0%) |
| 10 or more Apartments | 166 (55.1%) | 135 (44.9%) |
| Mobile Home / Other | 611 (78.8%) | 164 (21.2%) |
| Total | 5,263 (76.1%) | 1,655 (23.9%) |
Housing Structures by Number of Rooms in Lamar County
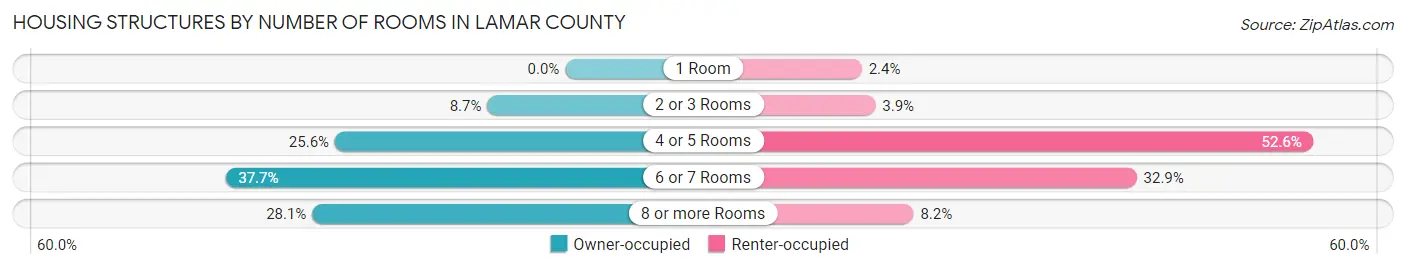
| Number of Rooms | Owner-occupied | Renter-occupied |
| 1 Room | 0 (0.0%) | 40 (2.4%) |
| 2 or 3 Rooms | 455 (8.6%) | 65 (3.9%) |
| 4 or 5 Rooms | 1,345 (25.6%) | 870 (52.6%) |
| 6 or 7 Rooms | 1,985 (37.7%) | 545 (32.9%) |
| 8 or more Rooms | 1,478 (28.1%) | 135 (8.2%) |
| Total | 5,263 (100.0%) | 1,655 (100.0%) |
Housing Structure by Heating Type in Lamar County
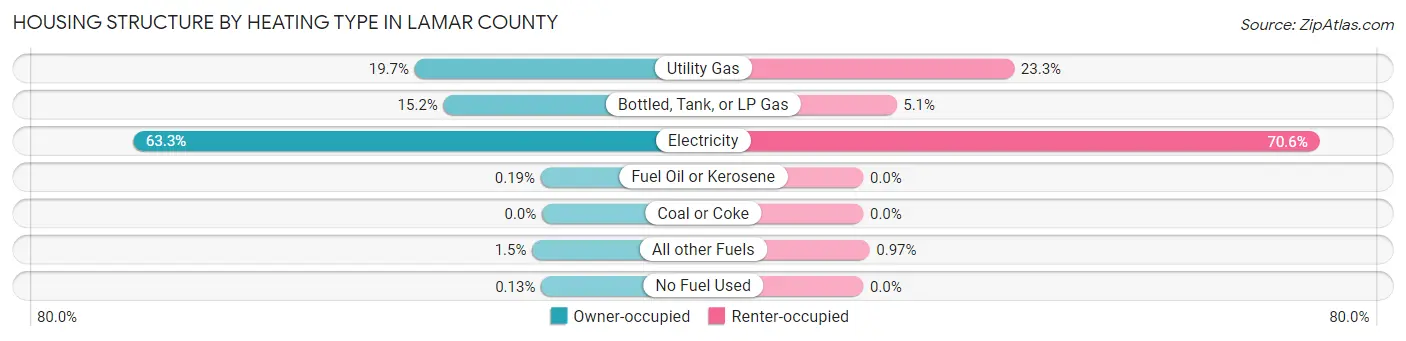
| Heating Type | Owner-occupied | Renter-occupied |
| Utility Gas | 1,036 (19.7%) | 386 (23.3%) |
| Bottled, Tank, or LP Gas | 801 (15.2%) | 85 (5.1%) |
| Electricity | 3,329 (63.2%) | 1,168 (70.6%) |
| Fuel Oil or Kerosene | 10 (0.2%) | 0 (0.0%) |
| Coal or Coke | 0 (0.0%) | 0 (0.0%) |
| All other Fuels | 80 (1.5%) | 16 (1.0%) |
| No Fuel Used | 7 (0.1%) | 0 (0.0%) |
| Total | 5,263 (100.0%) | 1,655 (100.0%) |
Household Vehicle Usage in Lamar County
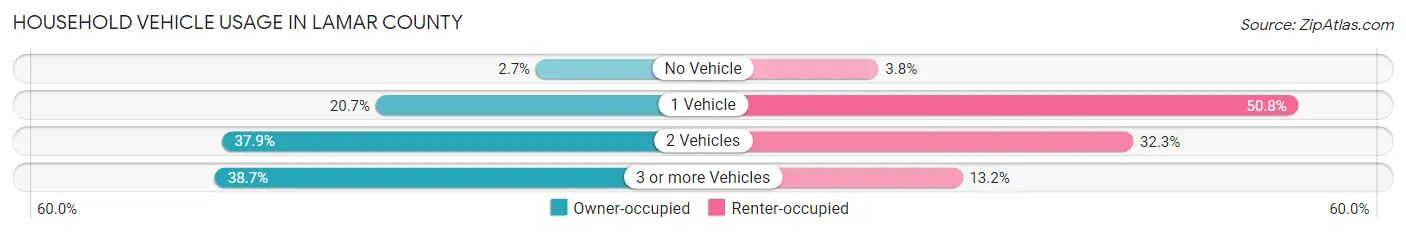
| Vehicles per Household | Owner-occupied | Renter-occupied |
| No Vehicle | 143 (2.7%) | 62 (3.7%) |
| 1 Vehicle | 1,087 (20.6%) | 841 (50.8%) |
| 2 Vehicles | 1,997 (37.9%) | 534 (32.3%) |
| 3 or more Vehicles | 2,036 (38.7%) | 218 (13.2%) |
| Total | 5,263 (100.0%) | 1,655 (100.0%) |
Real Estate & Mortgages in Lamar County
Real Estate and Mortgage Overview in Lamar County
| Characteristic | Without Mortgage | With Mortgage |
| Housing Units | 2,042 | 3,221 |
| Median Property Value | $147,200 | $198,900 |
| Median Household Income | $52,581 | $723 |
| Monthly Housing Costs | $478 | $60 |
| Real Estate Taxes | $1,294 | $33 |
Property Value by Mortgage Status in Lamar County
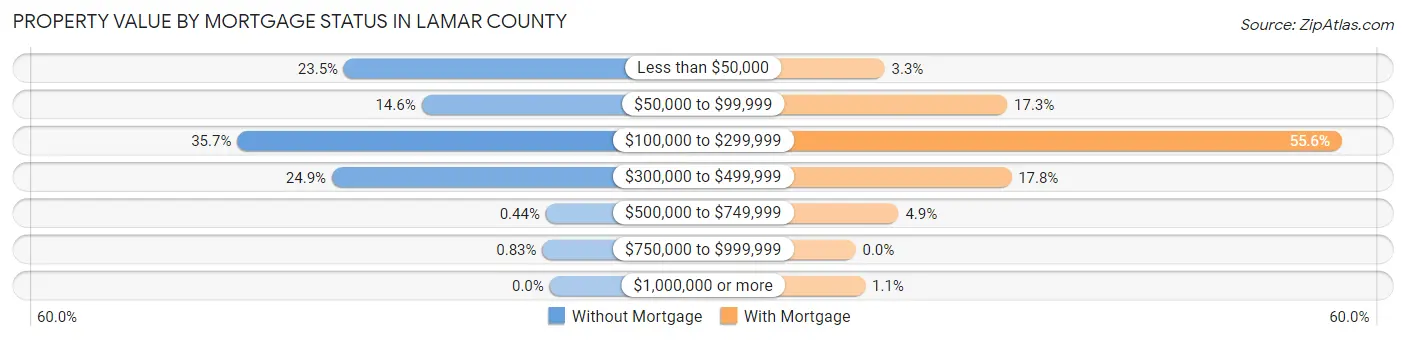
| Property Value | Without Mortgage | With Mortgage |
| Less than $50,000 | 480 (23.5%) | 107 (3.3%) |
| $50,000 to $99,999 | 299 (14.6%) | 558 (17.3%) |
| $100,000 to $299,999 | 729 (35.7%) | 1,790 (55.6%) |
| $300,000 to $499,999 | 508 (24.9%) | 573 (17.8%) |
| $500,000 to $749,999 | 9 (0.4%) | 158 (4.9%) |
| $750,000 to $999,999 | 17 (0.8%) | 0 (0.0%) |
| $1,000,000 or more | 0 (0.0%) | 35 (1.1%) |
| Total | 2,042 (100.0%) | 3,221 (100.0%) |
Household Income by Mortgage Status in Lamar County
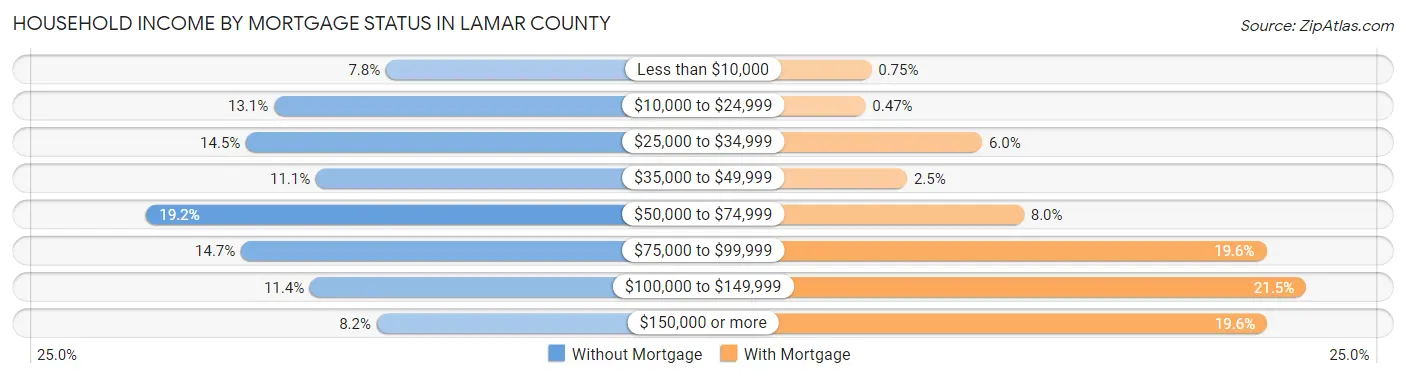
| Household Income | Without Mortgage | With Mortgage |
| Less than $10,000 | 159 (7.8%) | 24 (0.7%) |
| $10,000 to $24,999 | 268 (13.1%) | 15 (0.5%) |
| $25,000 to $34,999 | 295 (14.4%) | 194 (6.0%) |
| $35,000 to $49,999 | 227 (11.1%) | 79 (2.5%) |
| $50,000 to $74,999 | 392 (19.2%) | 258 (8.0%) |
| $75,000 to $99,999 | 300 (14.7%) | 630 (19.6%) |
| $100,000 to $149,999 | 233 (11.4%) | 691 (21.4%) |
| $150,000 or more | 168 (8.2%) | 631 (19.6%) |
| Total | 2,042 (100.0%) | 3,221 (100.0%) |
Property Value to Household Income Ratio in Lamar County
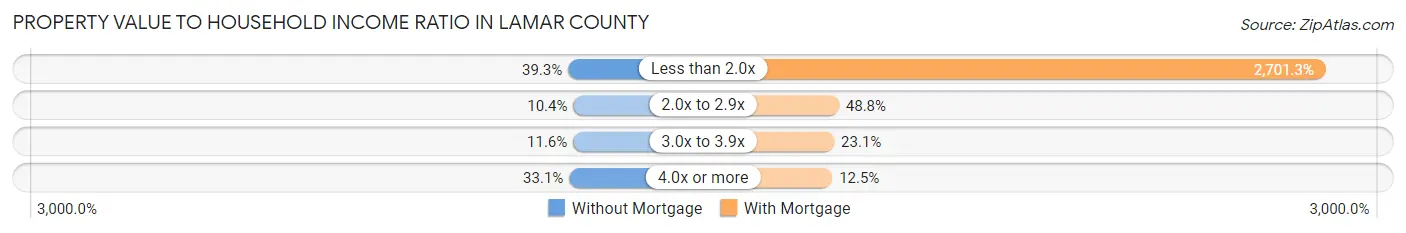
| Value-to-Income Ratio | Without Mortgage | With Mortgage |
| Less than 2.0x | 802 (39.3%) | 87,010 (2,701.3%) |
| 2.0x to 2.9x | 212 (10.4%) | 1,572 (48.8%) |
| 3.0x to 3.9x | 236 (11.6%) | 743 (23.1%) |
| 4.0x or more | 676 (33.1%) | 401 (12.4%) |
| Total | 2,042 (100.0%) | 3,221 (100.0%) |
Real Estate Taxes by Mortgage Status in Lamar County
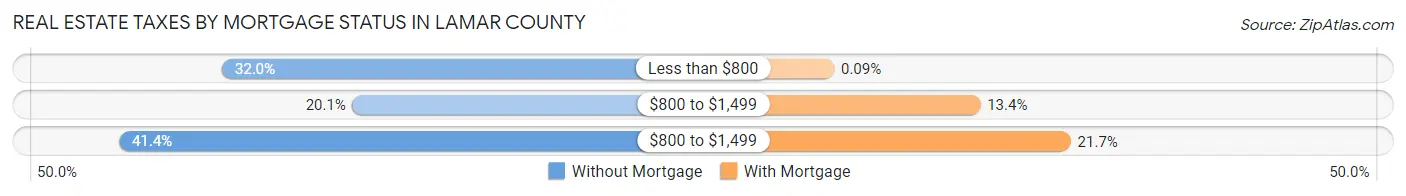
| Property Taxes | Without Mortgage | With Mortgage |
| Less than $800 | 653 (32.0%) | 3 (0.1%) |
| $800 to $1,499 | 411 (20.1%) | 433 (13.4%) |
| $800 to $1,499 | 845 (41.4%) | 699 (21.7%) |
| Total | 2,042 (100.0%) | 3,221 (100.0%) |
Health & Disability in Lamar County
Health Insurance Coverage by Age in Lamar County
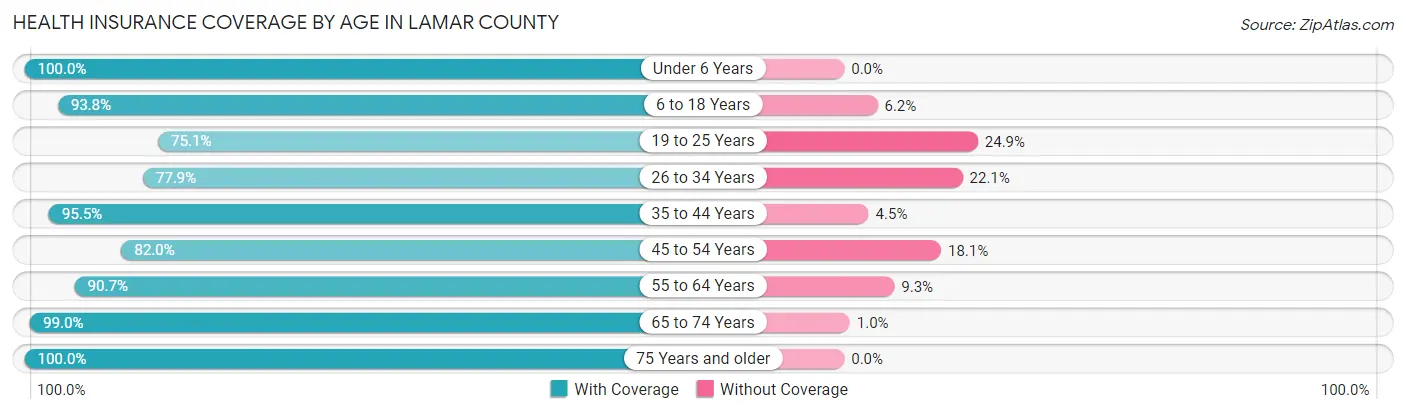
| Age Bracket | With Coverage | Without Coverage |
| Under 6 Years | 1,148 (100.0%) | 0 (0.0%) |
| 6 to 18 Years | 3,012 (93.8%) | 199 (6.2%) |
| 19 to 25 Years | 1,661 (75.1%) | 551 (24.9%) |
| 26 to 34 Years | 1,692 (77.9%) | 479 (22.1%) |
| 35 to 44 Years | 1,788 (95.5%) | 85 (4.5%) |
| 45 to 54 Years | 1,861 (82.0%) | 410 (18.0%) |
| 55 to 64 Years | 2,175 (90.7%) | 224 (9.3%) |
| 65 to 74 Years | 1,996 (99.0%) | 21 (1.0%) |
| 75 Years and older | 1,130 (100.0%) | 0 (0.0%) |
| Total | 16,463 (89.3%) | 1,969 (10.7%) |
Health Insurance Coverage by Citizenship Status in Lamar County
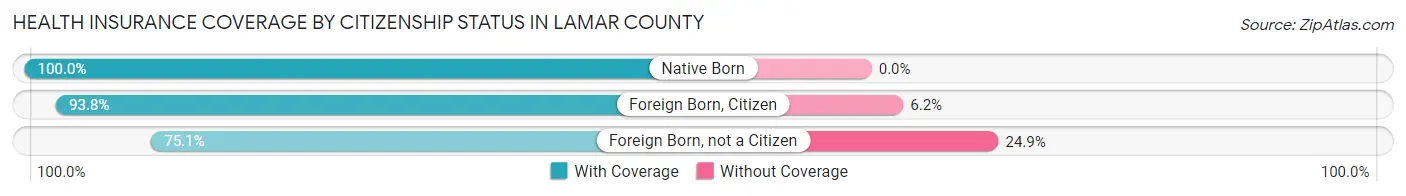
| Citizenship Status | With Coverage | Without Coverage |
| Native Born | 1,148 (100.0%) | 0 (0.0%) |
| Foreign Born, Citizen | 3,012 (93.8%) | 199 (6.2%) |
| Foreign Born, not a Citizen | 1,661 (75.1%) | 551 (24.9%) |
Health Insurance Coverage by Household Income in Lamar County
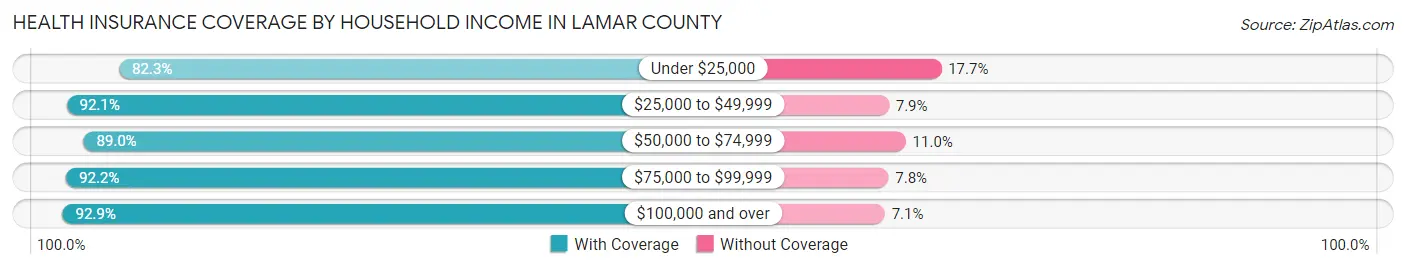
| Household Income | With Coverage | Without Coverage |
| Under $25,000 | 1,717 (82.3%) | 369 (17.7%) |
| $25,000 to $49,999 | 2,365 (92.1%) | 202 (7.9%) |
| $50,000 to $74,999 | 3,299 (89.0%) | 409 (11.0%) |
| $75,000 to $99,999 | 2,099 (92.2%) | 177 (7.8%) |
| $100,000 and over | 6,336 (92.9%) | 485 (7.1%) |
Public vs Private Health Insurance Coverage by Age in Lamar County
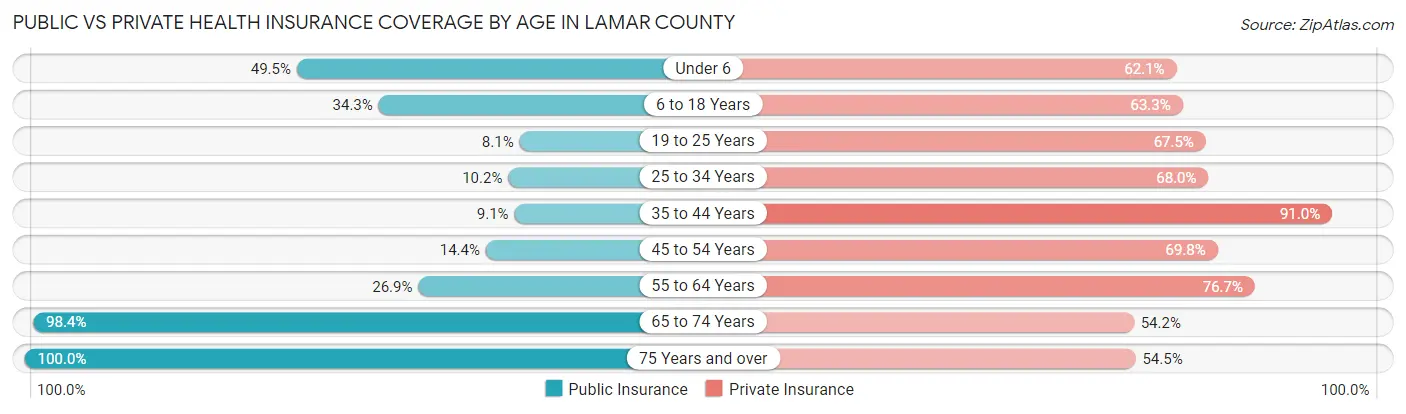
| Age Bracket | Public Insurance | Private Insurance |
| Under 6 | 568 (49.5%) | 713 (62.1%) |
| 6 to 18 Years | 1,101 (34.3%) | 2,031 (63.2%) |
| 19 to 25 Years | 180 (8.1%) | 1,494 (67.5%) |
| 25 to 34 Years | 222 (10.2%) | 1,477 (68.0%) |
| 35 to 44 Years | 170 (9.1%) | 1,704 (91.0%) |
| 45 to 54 Years | 327 (14.4%) | 1,584 (69.8%) |
| 55 to 64 Years | 646 (26.9%) | 1,839 (76.7%) |
| 65 to 74 Years | 1,985 (98.4%) | 1,093 (54.2%) |
| 75 Years and over | 1,130 (100.0%) | 616 (54.5%) |
| Total | 6,329 (34.3%) | 12,551 (68.1%) |
Disability Status by Sex by Age in Lamar County
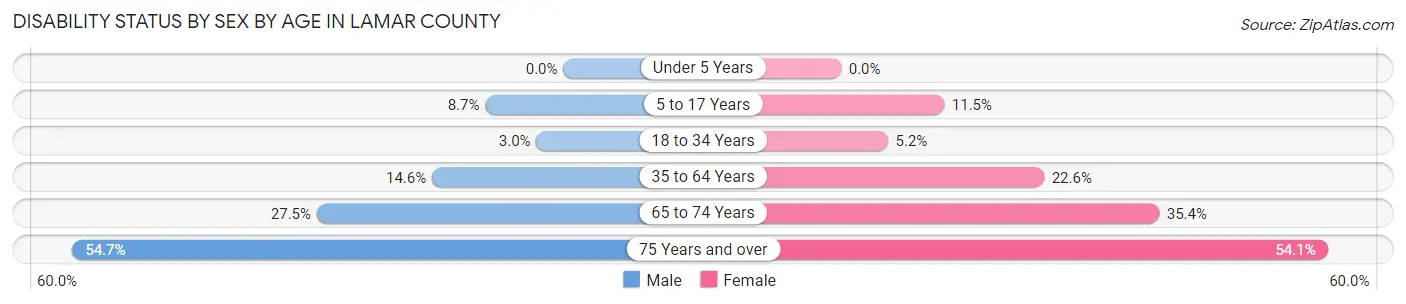
| Age Bracket | Male | Female |
| Under 5 Years | 0 (0.0%) | 0 (0.0%) |
| 5 to 17 Years | 139 (8.7%) | 161 (11.5%) |
| 18 to 34 Years | 74 (3.0%) | 125 (5.2%) |
| 35 to 64 Years | 439 (14.6%) | 800 (22.6%) |
| 65 to 74 Years | 277 (27.5%) | 357 (35.4%) |
| 75 Years and over | 257 (54.7%) | 357 (54.1%) |
Disability Class by Sex by Age in Lamar County
Disability Class: Hearing Difficulty
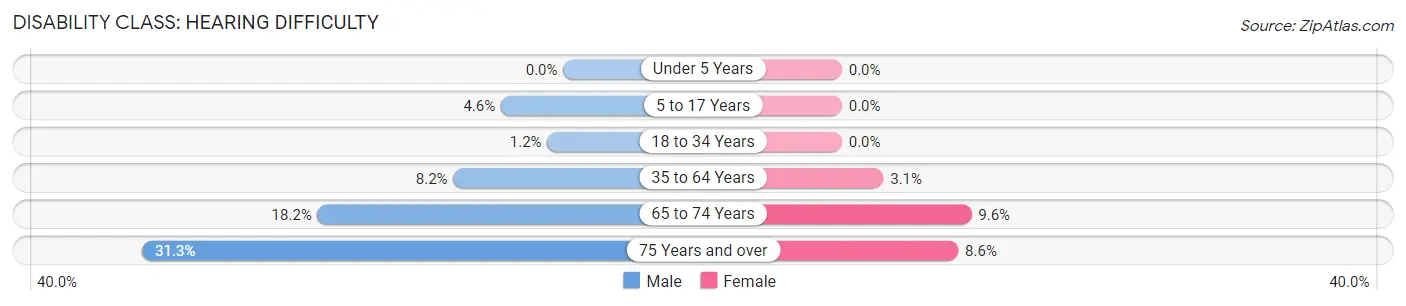
| Age Bracket | Male | Female |
| Under 5 Years | 0 (0.0%) | 0 (0.0%) |
| 5 to 17 Years | 74 (4.6%) | 0 (0.0%) |
| 18 to 34 Years | 29 (1.2%) | 0 (0.0%) |
| 35 to 64 Years | 245 (8.2%) | 109 (3.1%) |
| 65 to 74 Years | 184 (18.2%) | 97 (9.6%) |
| 75 Years and over | 147 (31.3%) | 57 (8.6%) |
Disability Class: Vision Difficulty
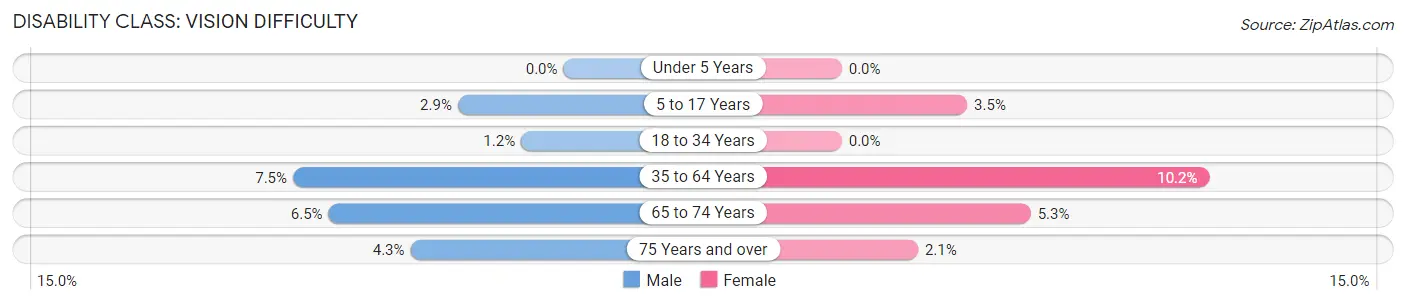
| Age Bracket | Male | Female |
| Under 5 Years | 0 (0.0%) | 0 (0.0%) |
| 5 to 17 Years | 47 (2.9%) | 49 (3.5%) |
| 18 to 34 Years | 29 (1.2%) | 0 (0.0%) |
| 35 to 64 Years | 226 (7.5%) | 362 (10.2%) |
| 65 to 74 Years | 66 (6.5%) | 53 (5.3%) |
| 75 Years and over | 20 (4.3%) | 14 (2.1%) |
Disability Class: Cognitive Difficulty
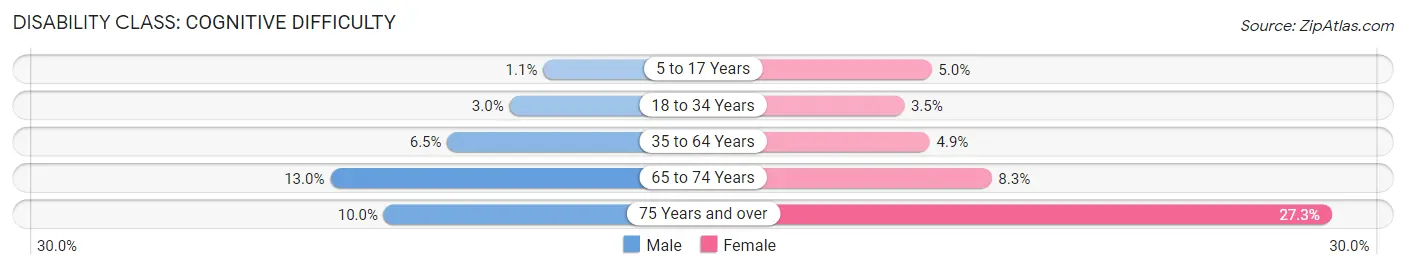
| Age Bracket | Male | Female |
| 5 to 17 Years | 18 (1.1%) | 70 (5.0%) |
| 18 to 34 Years | 74 (3.0%) | 83 (3.5%) |
| 35 to 64 Years | 194 (6.5%) | 173 (4.9%) |
| 65 to 74 Years | 131 (13.0%) | 84 (8.3%) |
| 75 Years and over | 47 (10.0%) | 180 (27.3%) |
Disability Class: Ambulatory Difficulty
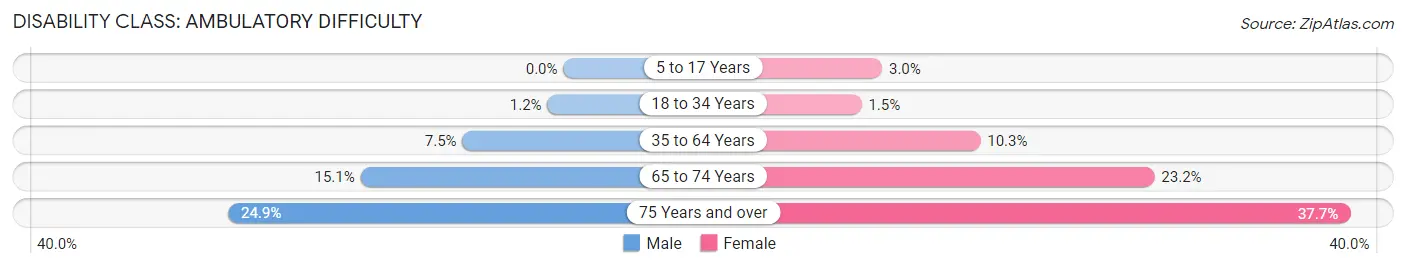
| Age Bracket | Male | Female |
| 5 to 17 Years | 0 (0.0%) | 42 (3.0%) |
| 18 to 34 Years | 29 (1.2%) | 35 (1.5%) |
| 35 to 64 Years | 225 (7.5%) | 364 (10.3%) |
| 65 to 74 Years | 152 (15.1%) | 234 (23.2%) |
| 75 Years and over | 117 (24.9%) | 249 (37.7%) |
Disability Class: Self-Care Difficulty
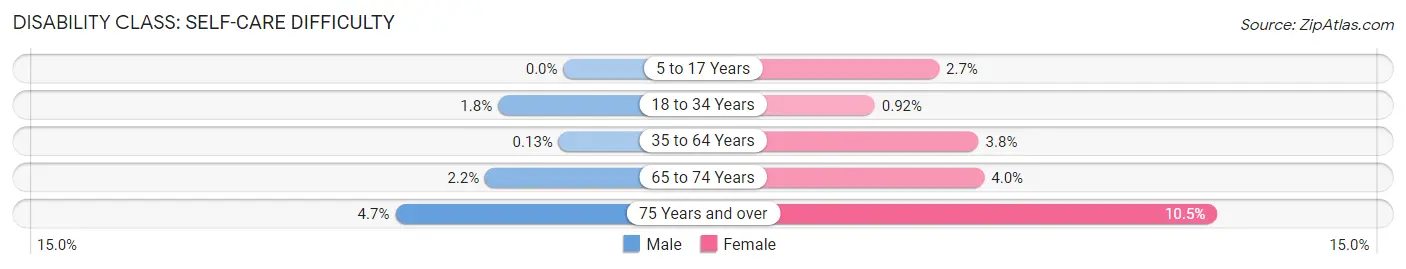
| Age Bracket | Male | Female |
| 5 to 17 Years | 0 (0.0%) | 38 (2.7%) |
| 18 to 34 Years | 45 (1.8%) | 22 (0.9%) |
| 35 to 64 Years | 4 (0.1%) | 135 (3.8%) |
| 65 to 74 Years | 22 (2.2%) | 40 (4.0%) |
| 75 Years and over | 22 (4.7%) | 69 (10.4%) |
Technology Access in Lamar County
Computing Device Access in Lamar County
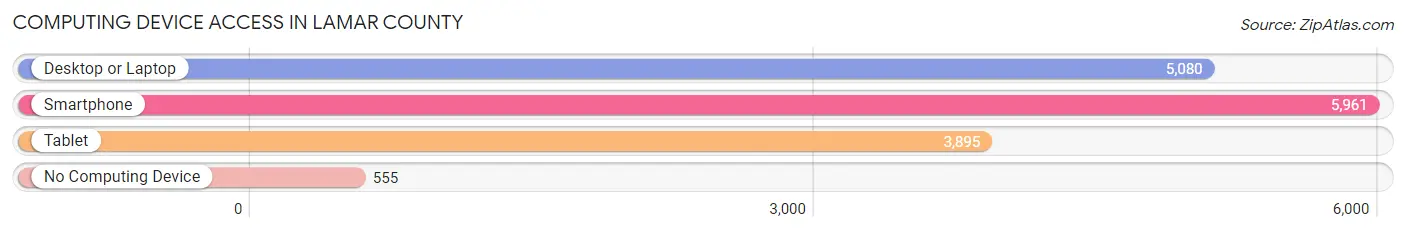
| Device Type | # Households | % Households |
| Desktop or Laptop | 5,080 | 73.4% |
| Smartphone | 5,961 | 86.2% |
| Tablet | 3,895 | 56.3% |
| No Computing Device | 555 | 8.0% |
| Total | 6,918 | 100.0% |
Internet Access in Lamar County
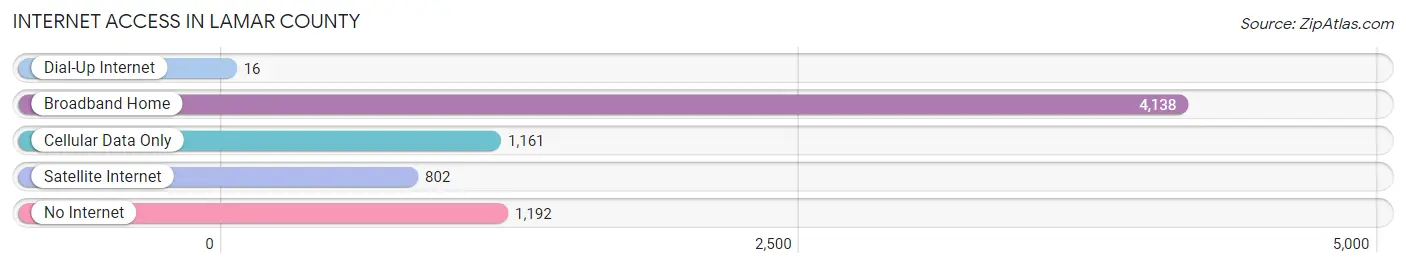
| Internet Type | # Households | % Households |
| Dial-Up Internet | 16 | 0.2% |
| Broadband Home | 4,138 | 59.8% |
| Cellular Data Only | 1,161 | 16.8% |
| Satellite Internet | 802 | 11.6% |
| No Internet | 1,192 | 17.2% |
| Total | 6,918 | 100.0% |
Lamar County Summary
Lamar County, Georgia is located in the west-central part of the state, approximately 45 miles south of Atlanta. It is bordered by Upson, Pike, Spalding, Butts, Monroe, and Henry counties. The county seat is Barnesville, and the county has a population of approximately 18,000 people.
History
Lamar County was created in 1920 from parts of Monroe, Pike, and Upson counties. It was named after Lucius Quintus Cincinnatus Lamar, a former United States Senator from Mississippi. The county was originally part of the Creek Nation, and the area was home to many Native American tribes.
In the early 1800s, the area was settled by European-American settlers, and the county was officially established in 1825. The county was home to several small towns, including Barnesville, Milner, and Meansville.
In the late 1800s, the county experienced a period of growth and development. The railroad was extended to Barnesville in 1882, and the town quickly became the county seat. The county also saw the development of several industries, including cotton mills, sawmills, and gristmills.
Geography
Lamar County is located in the west-central part of the state, approximately 45 miles south of Atlanta. It is bordered by Upson, Pike, Spalding, Butts, Monroe, and Henry counties. The county has a total area of 246 square miles, of which 241 square miles is land and 5 square miles is water.
The county is mostly flat, with some rolling hills in the northern part of the county. The county is drained by the Flint River, which flows through the county from north to south. The county is also home to several small lakes, including Lake Lamar, Lake Milner, and Lake Meansville.
Economy
Lamar County has a diverse economy, with a mix of agriculture, manufacturing, and services. The county is home to several large employers, including Georgia-Pacific, Georgia Power, and the Lamar County School System.
Agriculture is an important part of the county’s economy. The county is home to several large farms, and the main crops grown in the county are cotton, corn, soybeans, and peanuts.
Manufacturing is also an important part of the county’s economy. The county is home to several large manufacturing plants, including Georgia-Pacific, Georgia Power, and the Lamar County School System.
Demographics
As of the 2010 census, Lamar County had a population of 18,317 people. The racial makeup of the county was 79.2% White, 17.3% African American, 0.4% Native American, 0.7% Asian, 0.1% Pacific Islander, 1.2% from other races, and 1.1% from two or more races. Hispanic or Latino of any race were 3.2% of the population.
The median income for a household in the county was $37,945, and the median income for a family was $45,945. The per capita income for the county was $18,945. About 15.2% of families and 19.2% of the population were below the poverty line, including 25.2% of those under age 18 and 14.2% of those age 65 or over.
Common Questions
What is Per Capita Income in Lamar County?
Per Capita income in Lamar County is $30,978.
What is the Median Family Income in Lamar County?
Median Family Income in Lamar County is $83,303.
What is the Median Household income in Lamar County?
Median Household Income in Lamar County is $64,966.
What is Income or Wage Gap in Lamar County?
Income or Wage Gap in Lamar County is 38.5%.
Women in Lamar County earn 61.5 cents for every dollar earned by a man.
What is Inequality or Gini Index in Lamar County?
Inequality or Gini Index in Lamar County is 0.42.
What is the Total Population of Lamar County?
Total Population of Lamar County is 18,676.
What is the Total Male Population of Lamar County?
Total Male Population of Lamar County is 9,112.
What is the Total Female Population of Lamar County?
Total Female Population of Lamar County is 9,564.
What is the Ratio of Males per 100 Females in Lamar County?
There are 95.27 Males per 100 Females in Lamar County.
What is the Ratio of Females per 100 Males in Lamar County?
There are 104.96 Females per 100 Males in Lamar County.
What is the Median Population Age in Lamar County?
Median Population Age in Lamar County is 37.6 Years.
What is the Average Family Size in Lamar County
Average Family Size in Lamar County is 3.2 People.
What is the Average Household Size in Lamar County
Average Household Size in Lamar County is 2.5 People.
How Large is the Labor Force in Lamar County?
There are 8,559 People in the Labor Forcein in Lamar County.
What is the Percentage of People in the Labor Force in Lamar County?
56.1% of People are in the Labor Force in Lamar County.
What is the Unemployment Rate in Lamar County?
Unemployment Rate in Lamar County is 5.4%.