Haralson County, GA Map & Demographics
Haralson County Map
Haralson County Overview
$31,342
PER CAPITA INCOME
$78,070
AVG FAMILY INCOME
$65,940
AVG HOUSEHOLD INCOME
33.6%
WAGE / INCOME GAP [ % ]
66.4¢/ $1
WAGE / INCOME GAP [ $ ]
$13,679
FAMILY INCOME DEFICIT
0.43
INEQUALITY / GINI INDEX
30,178
TOTAL POPULATION
14,860
MALE POPULATION
15,318
FEMALE POPULATION
97.01
MALES / 100 FEMALES
103.08
FEMALES / 100 MALES
39.2
MEDIAN AGE
3.1
AVG FAMILY SIZE
2.6
AVG HOUSEHOLD SIZE
14,699
LABOR FORCE [ PEOPLE ]
61.6%
PERCENT IN LABOR FORCE
4.4%
UNEMPLOYMENT RATE
Income in Haralson County
Income Overview in Haralson County
Per Capita Income in Haralson County is $31,342, while median incomes of families and households are $78,070 and $65,940 respectively.
| Characteristic | Number | Measure |
| Per Capita Income | 30,178 | $31,342 |
| Median Family Income | 8,178 | $78,070 |
| Mean Family Income | 8,178 | $97,803 |
| Median Household Income | 11,357 | $65,940 |
| Mean Household Income | 11,357 | $82,330 |
| Income Deficit | 8,178 | $13,679 |
| Wage / Income Gap (%) | 30,178 | 33.63% |
| Wage / Income Gap ($) | 30,178 | 66.37¢ per $1 |
| Gini / Inequality Index | 30,178 | 0.43 |
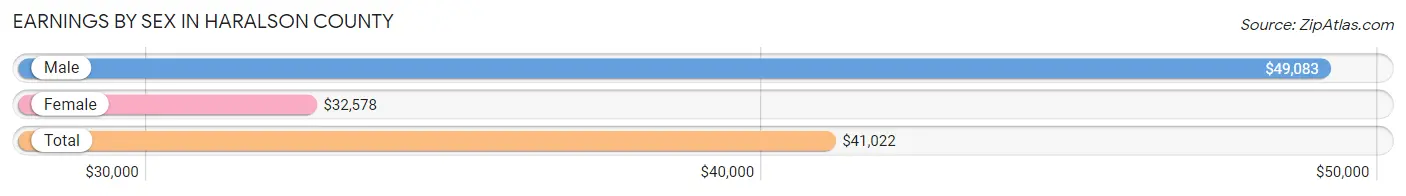
Earnings by Sex in Haralson County
Average Earnings in Haralson County are $41,022, $49,083 for men and $32,578 for women, a difference of 33.6%.
| Sex | Number | Average Earnings |
| Male | 7,961 (52.5%) | $49,083 |
| Female | 7,199 (47.5%) | $32,578 |
| Total | 15,160 (100.0%) | $41,022 |
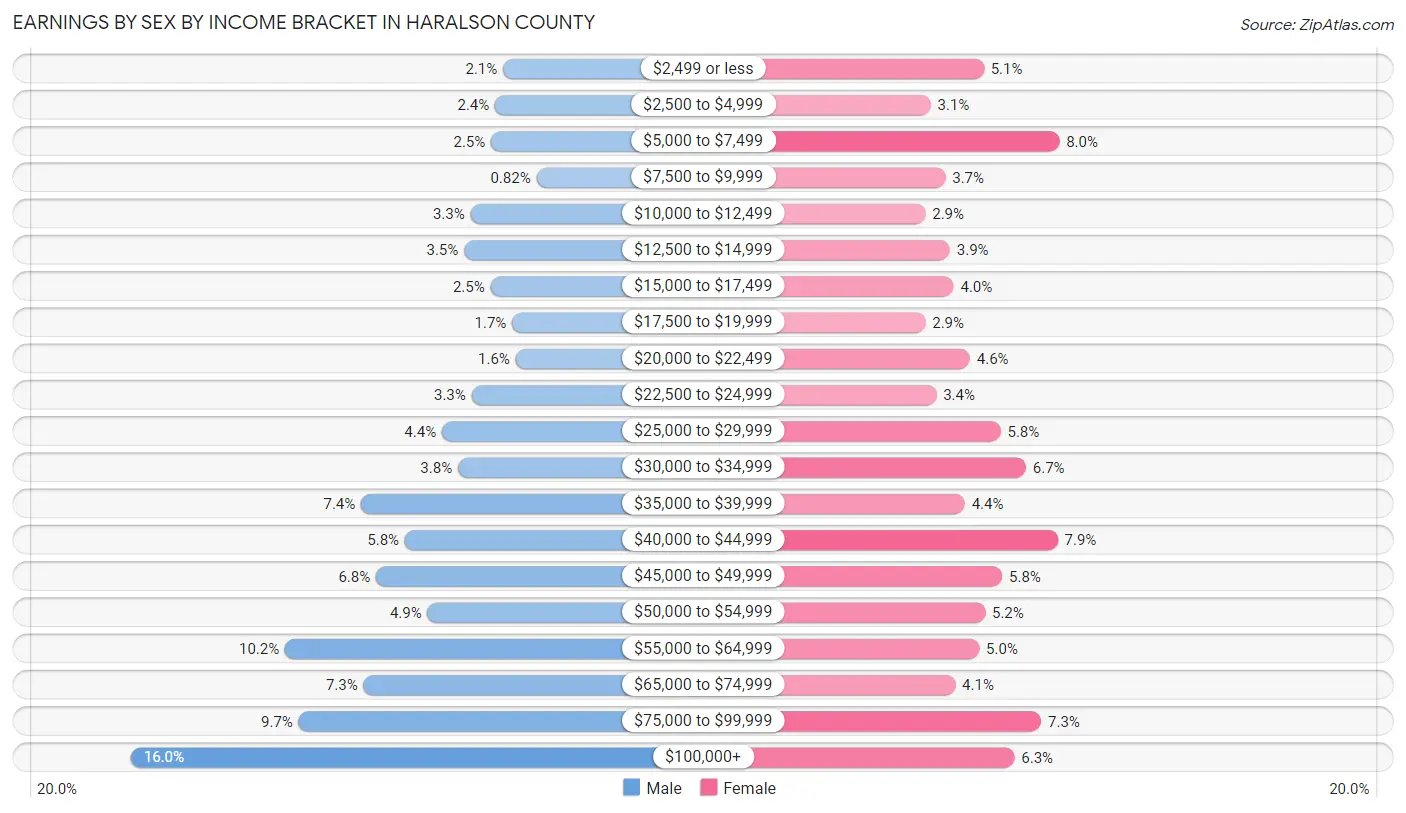
Earnings by Sex by Income Bracket in Haralson County
The most common earnings brackets in Haralson County are $100,000+ for men (1,275 | 16.0%) and $5,000 to $7,499 for women (573 | 8.0%).
| Income | Male | Female |
| $2,499 or less | 165 (2.1%) | 369 (5.1%) |
| $2,500 to $4,999 | 189 (2.4%) | 226 (3.1%) |
| $5,000 to $7,499 | 201 (2.5%) | 573 (8.0%) |
| $7,500 to $9,999 | 65 (0.8%) | 266 (3.7%) |
| $10,000 to $12,499 | 262 (3.3%) | 212 (2.9%) |
| $12,500 to $14,999 | 281 (3.5%) | 278 (3.9%) |
| $15,000 to $17,499 | 202 (2.5%) | 288 (4.0%) |
| $17,500 to $19,999 | 138 (1.7%) | 212 (2.9%) |
| $20,000 to $22,499 | 127 (1.6%) | 332 (4.6%) |
| $22,500 to $24,999 | 259 (3.3%) | 241 (3.4%) |
| $25,000 to $29,999 | 347 (4.4%) | 415 (5.8%) |
| $30,000 to $34,999 | 299 (3.8%) | 483 (6.7%) |
| $35,000 to $39,999 | 588 (7.4%) | 318 (4.4%) |
| $40,000 to $44,999 | 458 (5.8%) | 569 (7.9%) |
| $45,000 to $49,999 | 544 (6.8%) | 419 (5.8%) |
| $50,000 to $54,999 | 390 (4.9%) | 373 (5.2%) |
| $55,000 to $64,999 | 815 (10.2%) | 357 (5.0%) |
| $65,000 to $74,999 | 581 (7.3%) | 292 (4.1%) |
| $75,000 to $99,999 | 775 (9.7%) | 524 (7.3%) |
| $100,000+ | 1,275 (16.0%) | 452 (6.3%) |
| Total | 7,961 (100.0%) | 7,199 (100.0%) |
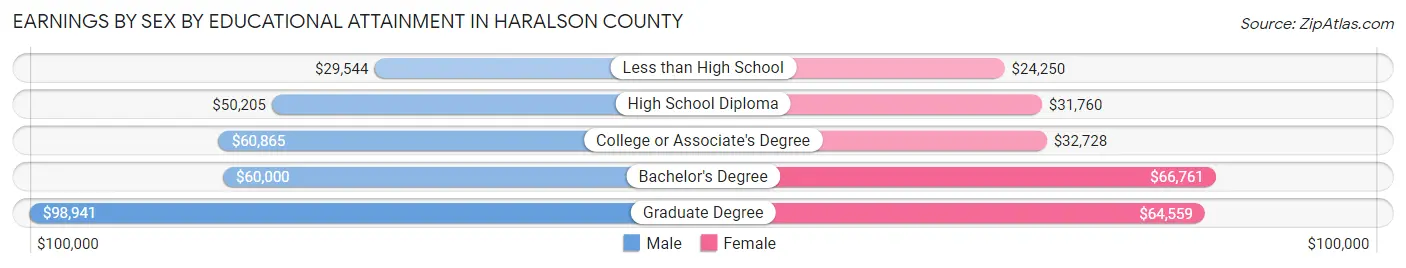
Earnings by Sex by Educational Attainment in Haralson County
Average earnings in Haralson County are $53,131 for men and $37,290 for women, a difference of 29.8%. Men with an educational attainment of graduate degree enjoy the highest average annual earnings of $98,941, while those with less than high school education earn the least with $29,544. Women with an educational attainment of bachelor's degree earn the most with the average annual earnings of $66,761, while those with less than high school education have the smallest earnings of $24,250.
| Educational Attainment | Male Income | Female Income |
| Less than High School | $29,544 | $24,250 |
| High School Diploma | $50,205 | $31,760 |
| College or Associate's Degree | $60,865 | $32,728 |
| Bachelor's Degree | $60,000 | $66,761 |
| Graduate Degree | $98,941 | $64,559 |
| Total | $53,131 | $37,290 |
Family Income in Haralson County
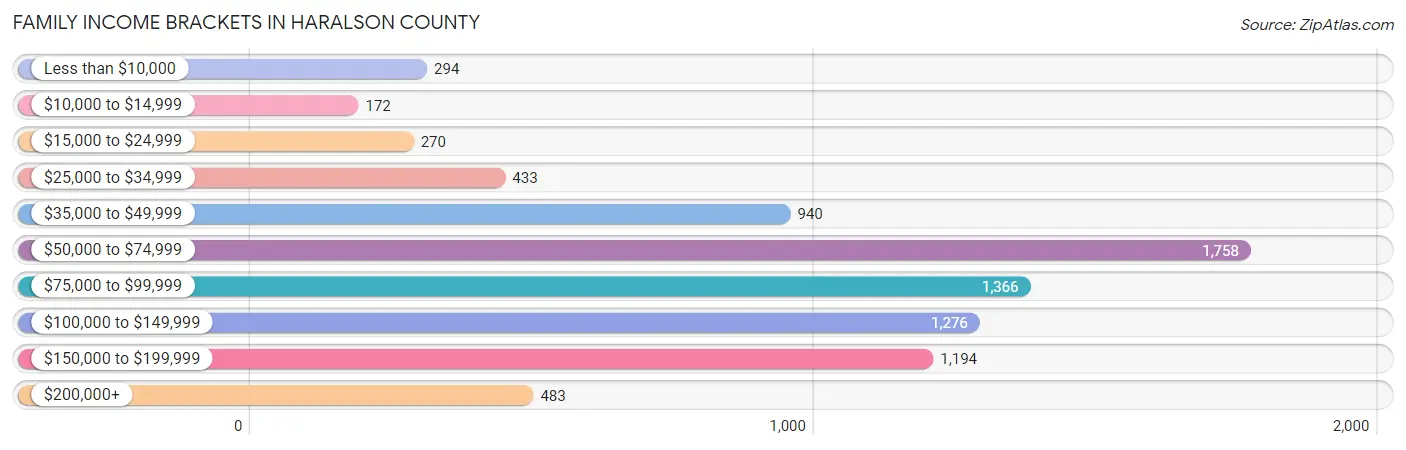
Family Income Brackets in Haralson County
According to the Haralson County family income data, there are 1,758 families falling into the $50,000 to $74,999 income range, which is the most common income bracket and makes up 21.5% of all families. Conversely, the $10,000 to $14,999 income bracket is the least frequent group with only 172 families (2.1%) belonging to this category.
| Income Bracket | # Families | % Families |
| Less than $10,000 | 294 | 3.6% |
| $10,000 to $14,999 | 172 | 2.1% |
| $15,000 to $24,999 | 270 | 3.3% |
| $25,000 to $34,999 | 433 | 5.3% |
| $35,000 to $49,999 | 940 | 11.5% |
| $50,000 to $74,999 | 1,758 | 21.5% |
| $75,000 to $99,999 | 1,366 | 16.7% |
| $100,000 to $149,999 | 1,276 | 15.6% |
| $150,000 to $199,999 | 1,194 | 14.6% |
| $200,000+ | 483 | 5.9% |
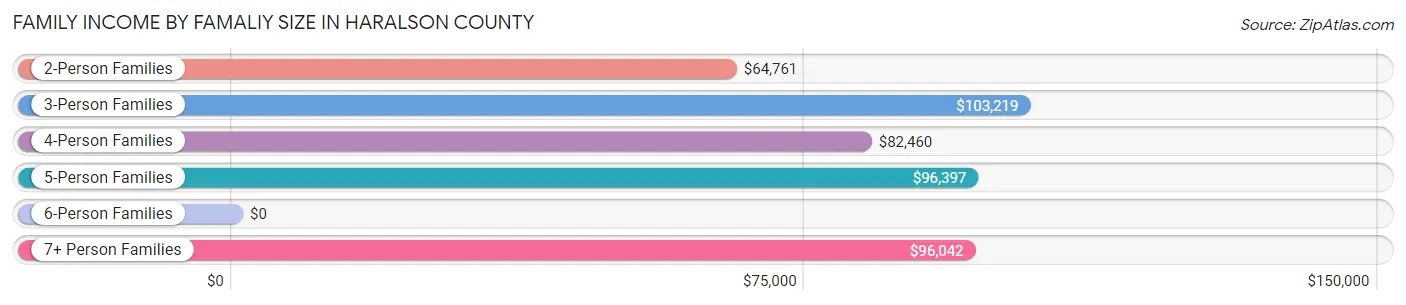
Family Income by Famaliy Size in Haralson County
3-person families (1,607 | 19.7%) account for the highest median family income in Haralson County with $103,219 per family, while 3-person families (1,607 | 19.7%) have the highest median income of $34,406 per family member.
| Income Bracket | # Families | Median Income |
| 2-Person Families | 3,483 (42.6%) | $64,761 |
| 3-Person Families | 1,607 (19.7%) | $103,219 |
| 4-Person Families | 1,896 (23.2%) | $82,460 |
| 5-Person Families | 643 (7.9%) | $96,397 |
| 6-Person Families | 374 (4.6%) | $0 |
| 7+ Person Families | 175 (2.1%) | $96,042 |
| Total | 8,178 (100.0%) | $78,070 |
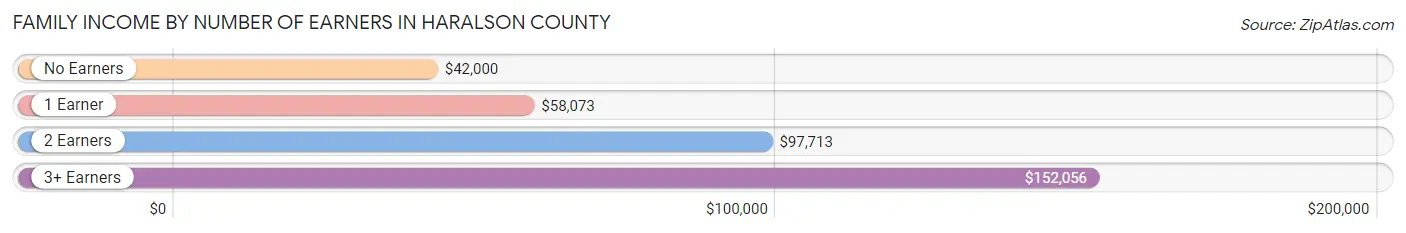
Family Income by Number of Earners in Haralson County
The median family income in Haralson County is $78,070, with families comprising 3+ earners (1,008) having the highest median family income of $152,056, while families with no earners (1,312) have the lowest median family income of $42,000, accounting for 12.3% and 16.0% of families, respectively.
| Number of Earners | # Families | Median Income |
| No Earners | 1,312 (16.0%) | $42,000 |
| 1 Earner | 2,402 (29.4%) | $58,073 |
| 2 Earners | 3,456 (42.3%) | $97,713 |
| 3+ Earners | 1,008 (12.3%) | $152,056 |
| Total | 8,178 (100.0%) | $78,070 |
Household Income in Haralson County
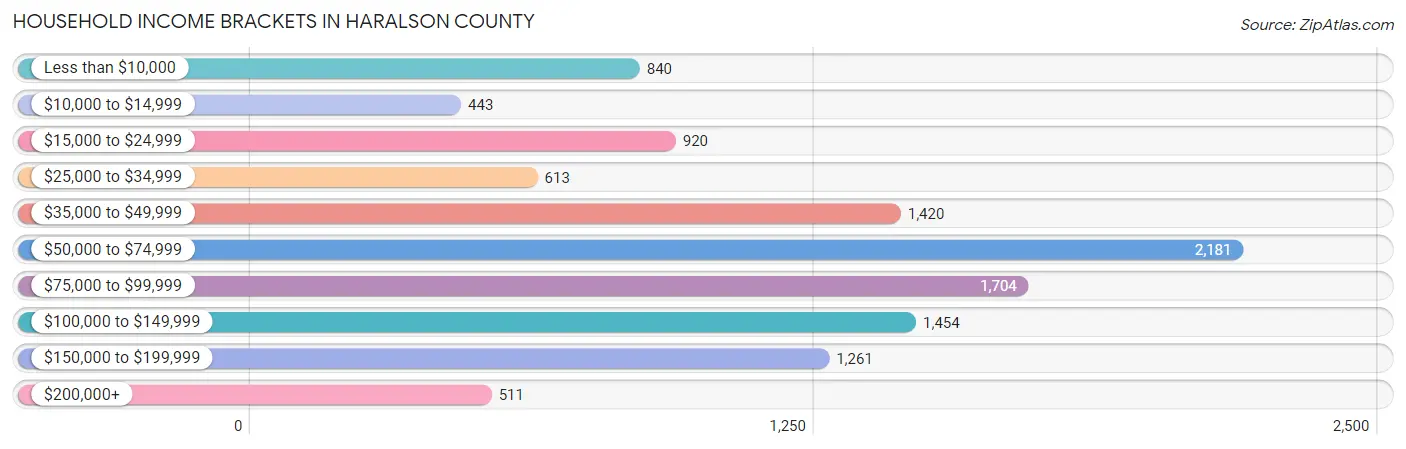
Household Income Brackets in Haralson County
With 2,181 households falling in the category, the $50,000 to $74,999 income range is the most frequent in Haralson County, accounting for 19.2% of all households. In contrast, only 443 households (3.9%) fall into the $10,000 to $14,999 income bracket, making it the least populous group.
| Income Bracket | # Households | % Households |
| Less than $10,000 | 840 | 7.4% |
| $10,000 to $14,999 | 443 | 3.9% |
| $15,000 to $24,999 | 920 | 8.1% |
| $25,000 to $34,999 | 613 | 5.4% |
| $35,000 to $49,999 | 1,420 | 12.5% |
| $50,000 to $74,999 | 2,181 | 19.2% |
| $75,000 to $99,999 | 1,704 | 15.0% |
| $100,000 to $149,999 | 1,454 | 12.8% |
| $150,000 to $199,999 | 1,261 | 11.1% |
| $200,000+ | 511 | 4.5% |
Household Income by Householder Age in Haralson County
The median household income in Haralson County is $65,940, with the highest median household income of $79,772 found in the 45 to 64 years age bracket for the primary householder. A total of 4,289 households (37.8%) fall into this category. Meanwhile, the 65+ years age bracket for the primary householder has the lowest median household income of $39,885, with 3,034 households (26.7%) in this group.
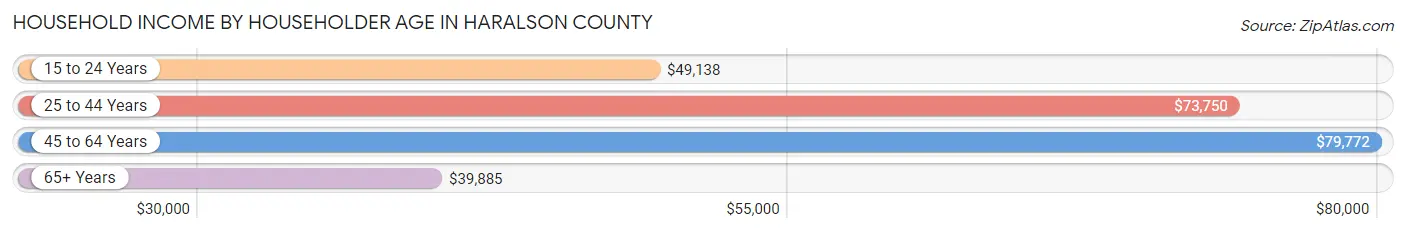
| Income Bracket | # Households | Median Income |
| 15 to 24 Years | 418 (3.7%) | $49,138 |
| 25 to 44 Years | 3,616 (31.8%) | $73,750 |
| 45 to 64 Years | 4,289 (37.8%) | $79,772 |
| 65+ Years | 3,034 (26.7%) | $39,885 |
| Total | 11,357 (100.0%) | $65,940 |
Poverty in Haralson County
Income Below Poverty by Sex and Age in Haralson County
With 12.2% poverty level for males and 12.8% for females among the residents of Haralson County, under 5 year old males and under 5 year old females are the most vulnerable to poverty, with 324 males (32.1%) and 193 females (21.5%) in their respective age groups living below the poverty level.
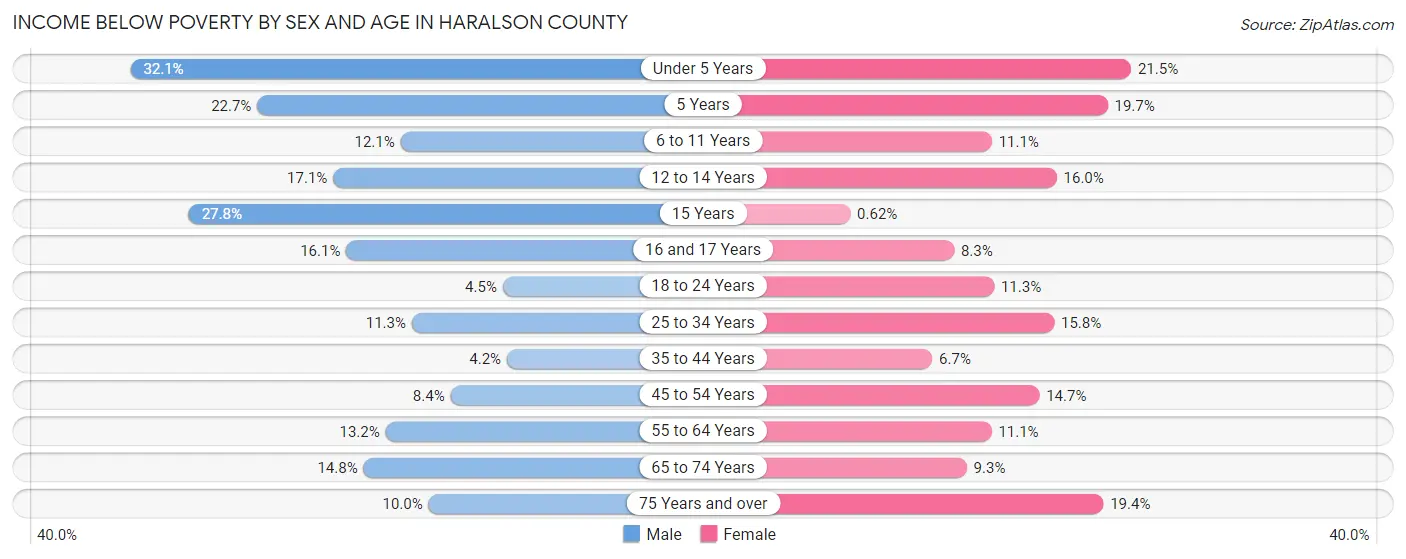
| Age Bracket | Male | Female |
| Under 5 Years | 324 (32.1%) | 193 (21.5%) |
| 5 Years | 60 (22.7%) | 59 (19.7%) |
| 6 to 11 Years | 132 (12.1%) | 126 (11.1%) |
| 12 to 14 Years | 115 (17.1%) | 85 (16.0%) |
| 15 Years | 52 (27.8%) | 1 (0.6%) |
| 16 and 17 Years | 64 (16.1%) | 38 (8.3%) |
| 18 to 24 Years | 50 (4.5%) | 126 (11.3%) |
| 25 to 34 Years | 233 (11.3%) | 311 (15.8%) |
| 35 to 44 Years | 79 (4.2%) | 132 (6.7%) |
| 45 to 54 Years | 172 (8.4%) | 306 (14.7%) |
| 55 to 64 Years | 255 (13.2%) | 213 (11.1%) |
| 65 to 74 Years | 179 (14.8%) | 142 (9.3%) |
| 75 Years and over | 87 (10.0%) | 203 (19.4%) |
| Total | 1,802 (12.2%) | 1,935 (12.8%) |
Income Above Poverty by Sex and Age in Haralson County
According to the poverty statistics in Haralson County, males aged 35 to 44 years and females aged 15 years are the age groups that are most secure financially, with 95.8% of males and 99.4% of females in these age groups living above the poverty line.
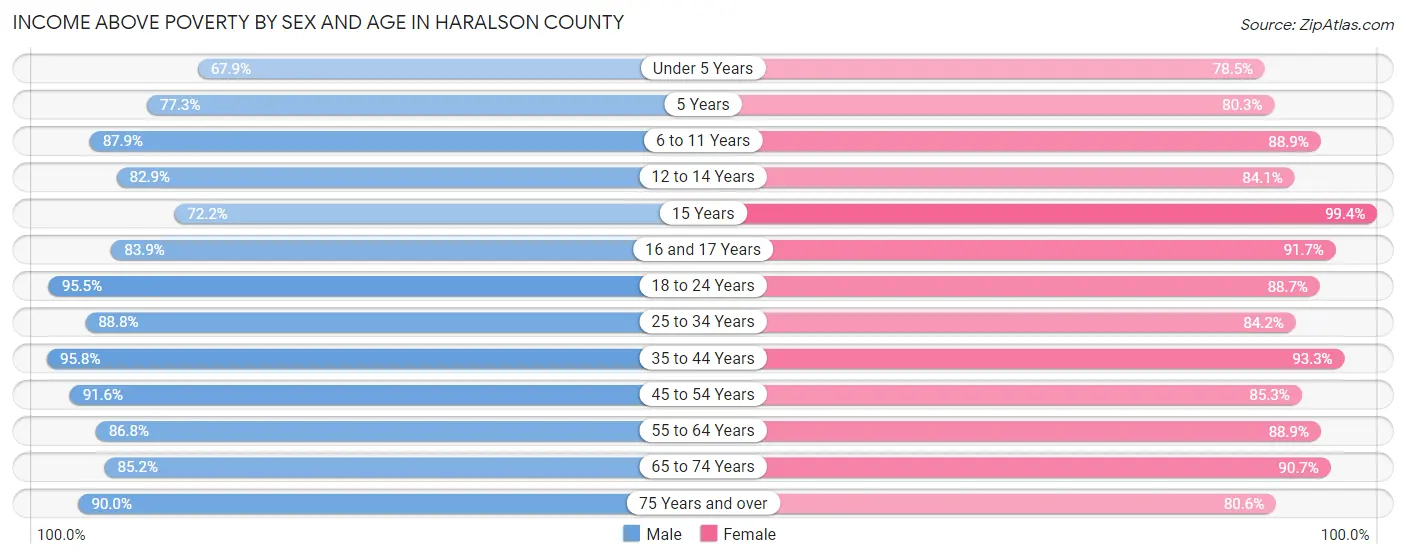
| Age Bracket | Male | Female |
| Under 5 Years | 684 (67.9%) | 706 (78.5%) |
| 5 Years | 204 (77.3%) | 240 (80.3%) |
| 6 to 11 Years | 960 (87.9%) | 1,006 (88.9%) |
| 12 to 14 Years | 558 (82.9%) | 448 (84.1%) |
| 15 Years | 135 (72.2%) | 160 (99.4%) |
| 16 and 17 Years | 333 (83.9%) | 418 (91.7%) |
| 18 to 24 Years | 1,062 (95.5%) | 989 (88.7%) |
| 25 to 34 Years | 1,839 (88.7%) | 1,662 (84.2%) |
| 35 to 44 Years | 1,805 (95.8%) | 1,836 (93.3%) |
| 45 to 54 Years | 1,880 (91.6%) | 1,781 (85.3%) |
| 55 to 64 Years | 1,677 (86.8%) | 1,705 (88.9%) |
| 65 to 74 Years | 1,027 (85.2%) | 1,389 (90.7%) |
| 75 Years and over | 782 (90.0%) | 843 (80.6%) |
| Total | 12,946 (87.8%) | 13,183 (87.2%) |
Income Below Poverty Among Married-Couple Families in Haralson County
The poverty statistics for married-couple families in Haralson County show that 5.7% or 368 of the total 6,432 families live below the poverty line. Families with 5 or more children have the highest poverty rate of 60.8%, comprising of 48 families. On the other hand, families with no children have the lowest poverty rate of 3.1%, which includes 107 families.
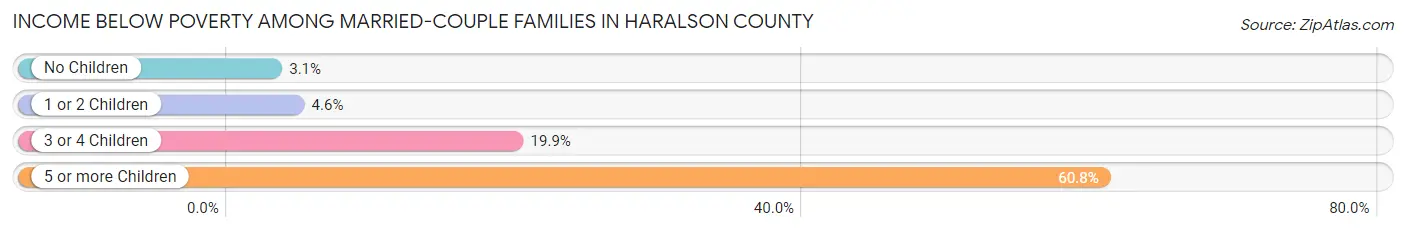
| Children | Above Poverty | Below Poverty |
| No Children | 3,372 (96.9%) | 107 (3.1%) |
| 1 or 2 Children | 2,242 (95.4%) | 109 (4.6%) |
| 3 or 4 Children | 419 (80.1%) | 104 (19.9%) |
| 5 or more Children | 31 (39.2%) | 48 (60.8%) |
| Total | 6,064 (94.3%) | 368 (5.7%) |
Income Below Poverty Among Single-Parent Households in Haralson County
According to the poverty data in Haralson County, 19.8% or 135 single-father households and 21.2% or 226 single-mother households are living below the poverty line. Among single-father households, those with 3 or 4 children have the highest poverty rate, with 7 households (100.0%) experiencing poverty. Likewise, among single-mother households, those with 3 or 4 children have the highest poverty rate, with 95 households (58.3%) falling below the poverty line.
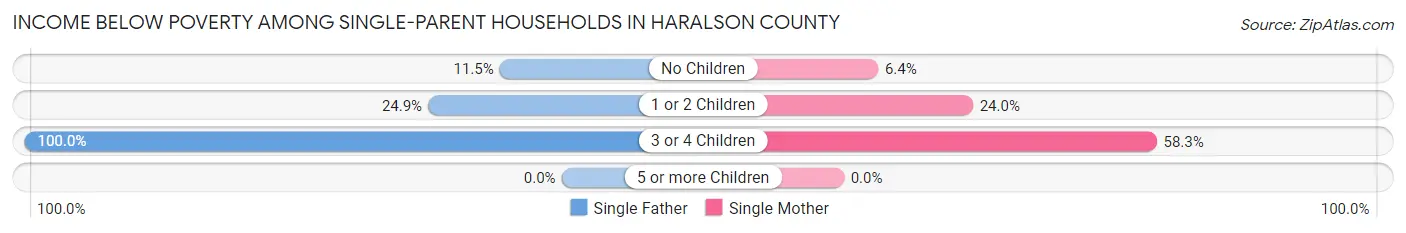
| Children | Single Father | Single Mother |
| No Children | 30 (11.5%) | 31 (6.4%) |
| 1 or 2 Children | 98 (24.9%) | 100 (24.0%) |
| 3 or 4 Children | 7 (100.0%) | 95 (58.3%) |
| 5 or more Children | 0 (0.0%) | 0 (0.0%) |
| Total | 135 (19.8%) | 226 (21.2%) |
Income Below Poverty Among Married-Couple vs Single-Parent Households in Haralson County
The poverty data for Haralson County shows that 368 of the married-couple family households (5.7%) and 361 of the single-parent households (20.7%) are living below the poverty level. Within the married-couple family households, those with 5 or more children have the highest poverty rate, with 48 households (60.8%) falling below the poverty line. Among the single-parent households, those with 3 or 4 children have the highest poverty rate, with 102 household (60.0%) living below poverty.
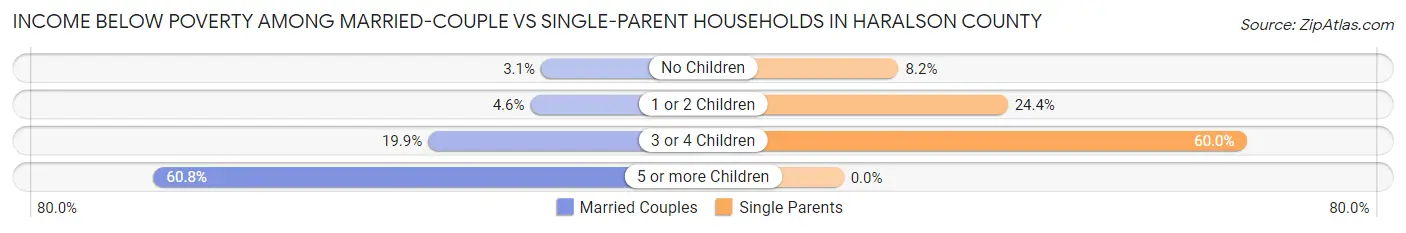
| Children | Married-Couple Families | Single-Parent Households |
| No Children | 107 (3.1%) | 61 (8.2%) |
| 1 or 2 Children | 109 (4.6%) | 198 (24.4%) |
| 3 or 4 Children | 104 (19.9%) | 102 (60.0%) |
| 5 or more Children | 48 (60.8%) | 0 (0.0%) |
| Total | 368 (5.7%) | 361 (20.7%) |
Race in Haralson County
The most populous races in Haralson County are White / Caucasian (27,517 | 91.2%), Black / African American (1,409 | 4.7%), and Two or more Races (708 | 2.4%).
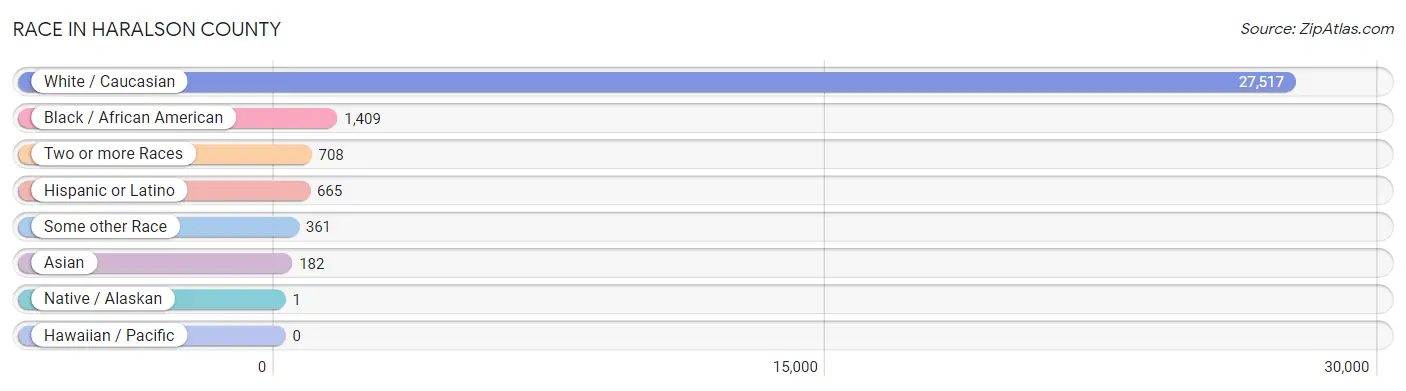
| Race | # Population | % Population |
| Asian | 182 | 0.6% |
| Black / African American | 1,409 | 4.7% |
| Hawaiian / Pacific | 0 | 0.0% |
| Hispanic or Latino | 665 | 2.2% |
| Native / Alaskan | 1 | 0.0% |
| White / Caucasian | 27,517 | 91.2% |
| Two or more Races | 708 | 2.4% |
| Some other Race | 361 | 1.2% |
| Total | 30,178 | 100.0% |
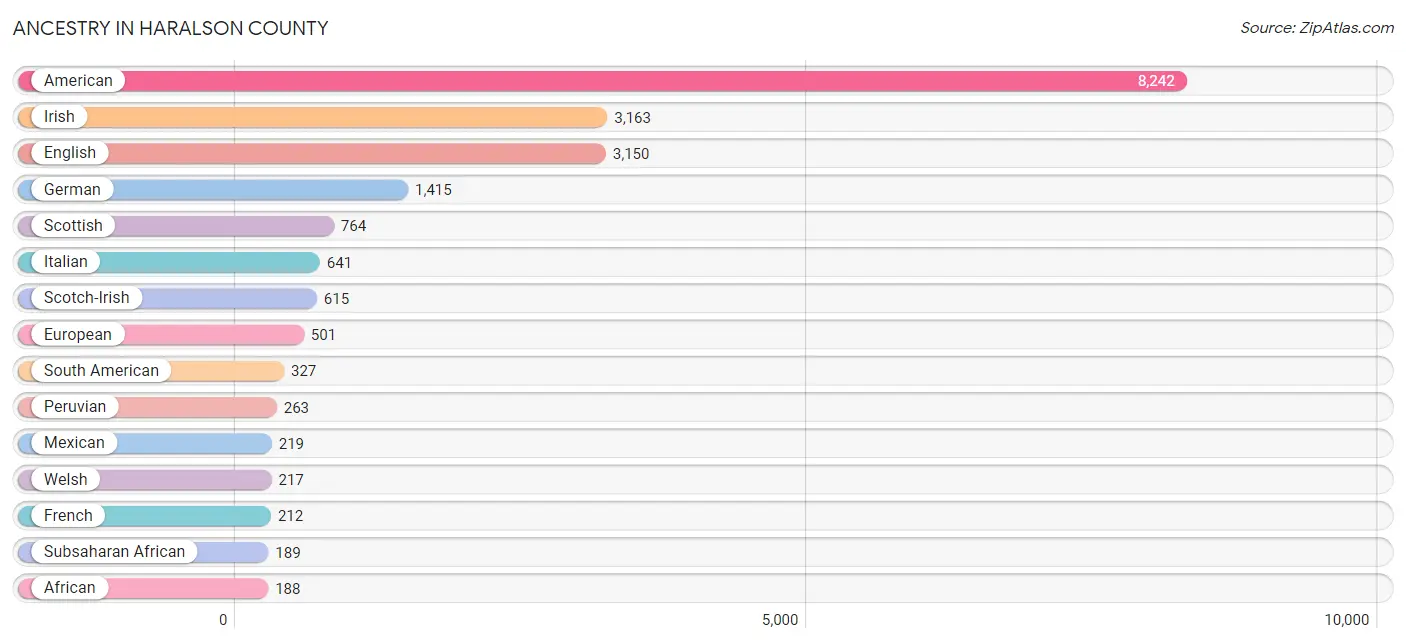
Ancestry in Haralson County
The most populous ancestries reported in Haralson County are American (8,242 | 27.3%), Irish (3,163 | 10.5%), English (3,150 | 10.4%), German (1,415 | 4.7%), and Scottish (764 | 2.5%), together accounting for 55.4% of all Haralson County residents.
| Ancestry | # Population | % Population |
| African | 188 | 0.6% |
| American | 8,242 | 27.3% |
| Arab | 28 | 0.1% |
| Armenian | 13 | 0.0% |
| Austrian | 3 | 0.0% |
| Barbadian | 4 | 0.0% |
| Belgian | 11 | 0.0% |
| Bhutanese | 10 | 0.0% |
| British | 90 | 0.3% |
| Burmese | 3 | 0.0% |
| Cherokee | 68 | 0.2% |
| Cheyenne | 51 | 0.2% |
| Colombian | 64 | 0.2% |
| Czech | 7 | 0.0% |
| Dutch | 79 | 0.3% |
| Eastern European | 45 | 0.2% |
| English | 3,150 | 10.4% |
| European | 501 | 1.7% |
| Finnish | 10 | 0.0% |
| French | 212 | 0.7% |
| French Canadian | 22 | 0.1% |
| German | 1,415 | 4.7% |
| Greek | 5 | 0.0% |
| Guyanese | 2 | 0.0% |
| Hungarian | 26 | 0.1% |
| Indian (Asian) | 121 | 0.4% |
| Irish | 3,163 | 10.5% |
| Italian | 641 | 2.1% |
| Jamaican | 9 | 0.0% |
| Korean | 91 | 0.3% |
| Latvian | 10 | 0.0% |
| Lebanese | 19 | 0.1% |
| Mexican | 219 | 0.7% |
| Native Hawaiian | 7 | 0.0% |
| Navajo | 1 | 0.0% |
| Norwegian | 73 | 0.2% |
| Peruvian | 263 | 0.9% |
| Polish | 103 | 0.3% |
| Romanian | 10 | 0.0% |
| Russian | 25 | 0.1% |
| Scandinavian | 54 | 0.2% |
| Scotch-Irish | 615 | 2.0% |
| Scottish | 764 | 2.5% |
| Sioux | 7 | 0.0% |
| South American | 327 | 1.1% |
| Spaniard | 58 | 0.2% |
| Subsaharan African | 189 | 0.6% |
| Swedish | 119 | 0.4% |
| Thai | 127 | 0.4% |
| Ukrainian | 15 | 0.1% |
| Welsh | 217 | 0.7% |
| Yugoslavian | 11 | 0.0% | View All 52 Rows |
Immigrants in Haralson County
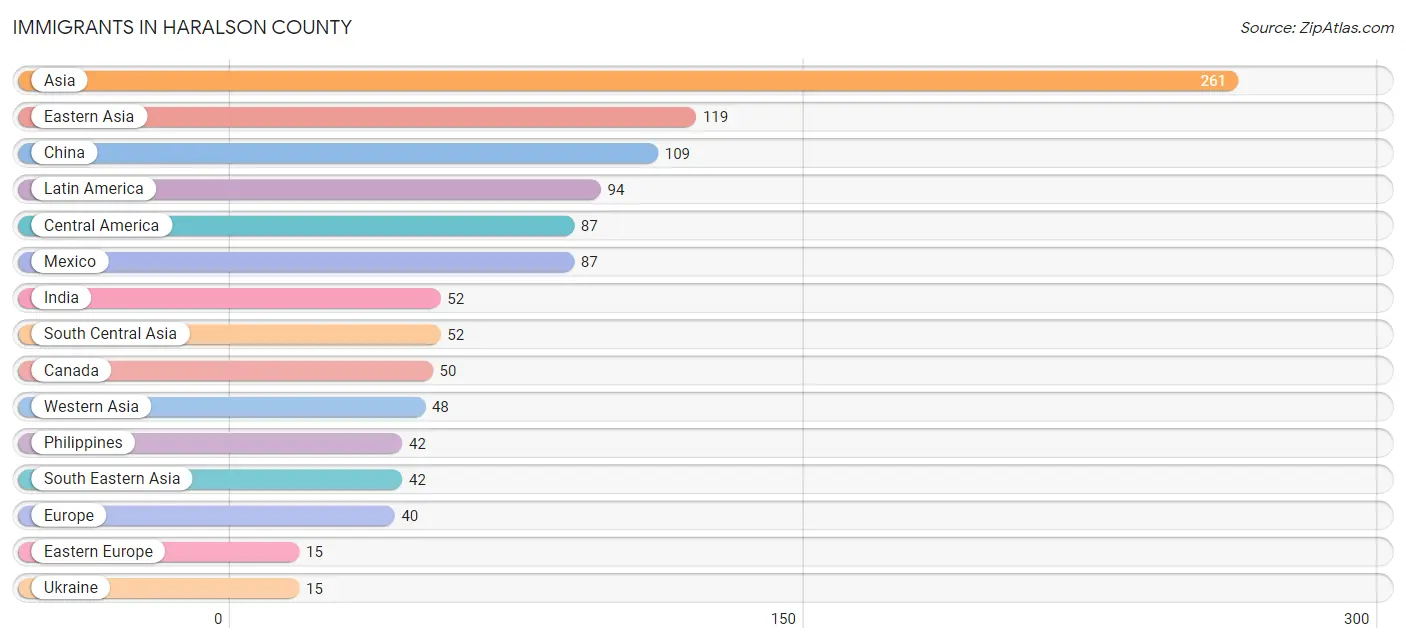
The most numerous immigrant groups reported in Haralson County came from Asia (261 | 0.9%), Eastern Asia (119 | 0.4%), China (109 | 0.4%), Latin America (94 | 0.3%), and Central America (87 | 0.3%), together accounting for 2.2% of all Haralson County residents.
| Immigration Origin | # Population | % Population |
| Asia | 261 | 0.9% |
| Australia | 5 | 0.0% |
| Canada | 50 | 0.2% |
| Caribbean | 5 | 0.0% |
| Central America | 87 | 0.3% |
| China | 109 | 0.4% |
| Eastern Asia | 119 | 0.4% |
| Eastern Europe | 15 | 0.1% |
| Europe | 40 | 0.1% |
| Germany | 14 | 0.1% |
| Guyana | 2 | 0.0% |
| India | 52 | 0.2% |
| Jamaica | 5 | 0.0% |
| Japan | 10 | 0.0% |
| Latin America | 94 | 0.3% |
| Mexico | 87 | 0.3% |
| Northern Europe | 11 | 0.0% |
| Oceania | 5 | 0.0% |
| Philippines | 42 | 0.1% |
| South America | 2 | 0.0% |
| South Central Asia | 52 | 0.2% |
| South Eastern Asia | 42 | 0.1% |
| Sweden | 11 | 0.0% |
| Ukraine | 15 | 0.1% |
| Western Asia | 48 | 0.2% |
| Western Europe | 14 | 0.1% | View All 26 Rows |
Sex and Age in Haralson County
Sex and Age in Haralson County
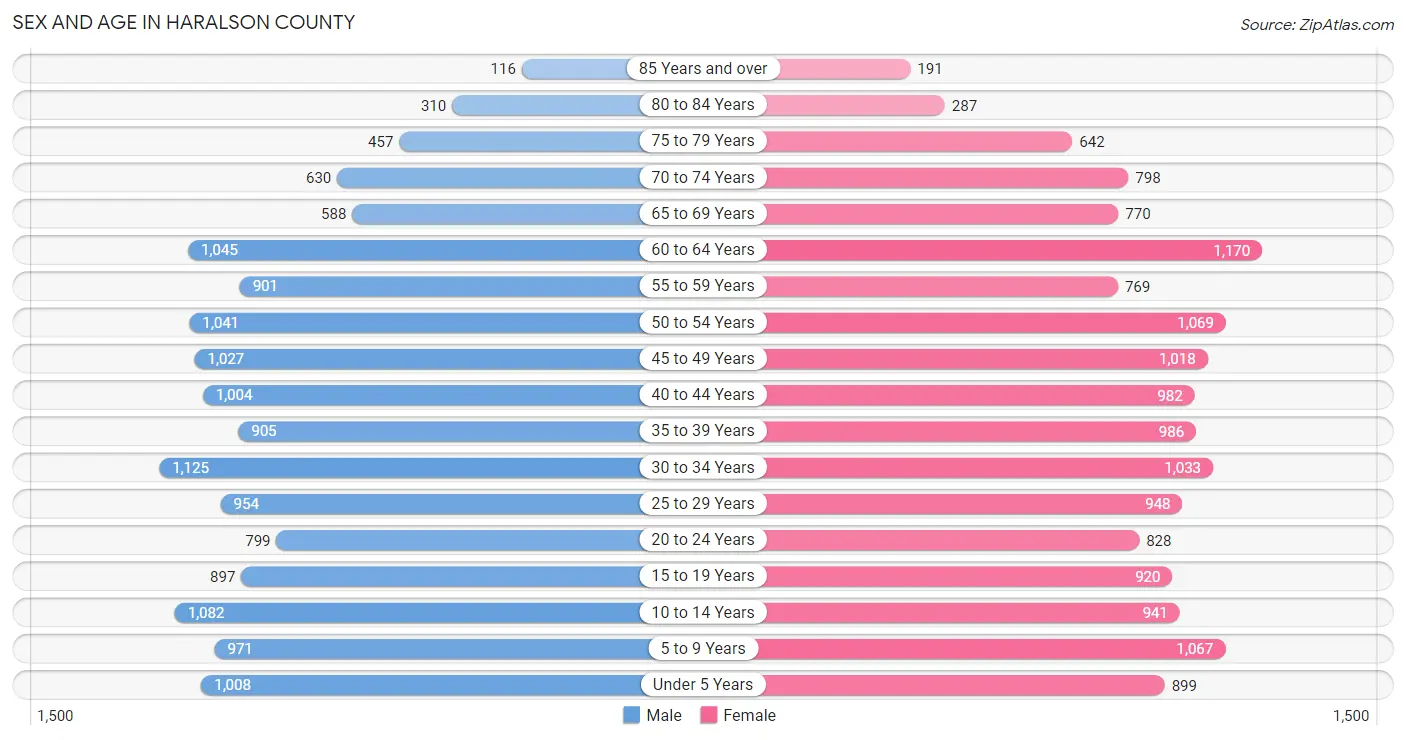
The most populous age groups in Haralson County are 30 to 34 Years (1,125 | 7.6%) for men and 60 to 64 Years (1,170 | 7.6%) for women.
| Age Bracket | Male | Female |
| Under 5 Years | 1,008 (6.8%) | 899 (5.9%) |
| 5 to 9 Years | 971 (6.5%) | 1,067 (7.0%) |
| 10 to 14 Years | 1,082 (7.3%) | 941 (6.1%) |
| 15 to 19 Years | 897 (6.0%) | 920 (6.0%) |
| 20 to 24 Years | 799 (5.4%) | 828 (5.4%) |
| 25 to 29 Years | 954 (6.4%) | 948 (6.2%) |
| 30 to 34 Years | 1,125 (7.6%) | 1,033 (6.7%) |
| 35 to 39 Years | 905 (6.1%) | 986 (6.4%) |
| 40 to 44 Years | 1,004 (6.8%) | 982 (6.4%) |
| 45 to 49 Years | 1,027 (6.9%) | 1,018 (6.7%) |
| 50 to 54 Years | 1,041 (7.0%) | 1,069 (7.0%) |
| 55 to 59 Years | 901 (6.1%) | 769 (5.0%) |
| 60 to 64 Years | 1,045 (7.0%) | 1,170 (7.6%) |
| 65 to 69 Years | 588 (4.0%) | 770 (5.0%) |
| 70 to 74 Years | 630 (4.2%) | 798 (5.2%) |
| 75 to 79 Years | 457 (3.1%) | 642 (4.2%) |
| 80 to 84 Years | 310 (2.1%) | 287 (1.9%) |
| 85 Years and over | 116 (0.8%) | 191 (1.3%) |
| Total | 14,860 (100.0%) | 15,318 (100.0%) |
Families and Households in Haralson County
Median Family Size in Haralson County
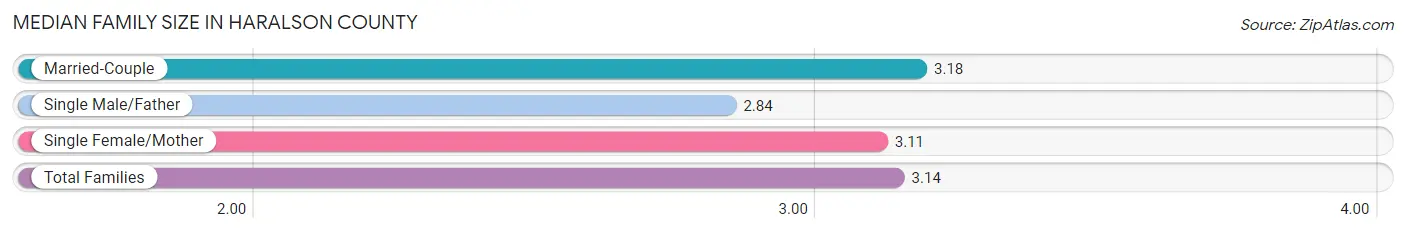
The median family size in Haralson County is 3.14 persons per family, with married-couple families (6,432 | 78.6%) accounting for the largest median family size of 3.18 persons per family. On the other hand, single male/father families (682 | 8.3%) represent the smallest median family size with 2.84 persons per family.
| Family Type | # Families | Family Size |
| Married-Couple | 6,432 (78.6%) | 3.18 |
| Single Male/Father | 682 (8.3%) | 2.84 |
| Single Female/Mother | 1,064 (13.0%) | 3.11 |
| Total Families | 8,178 (100.0%) | 3.14 |
Median Household Size in Haralson County
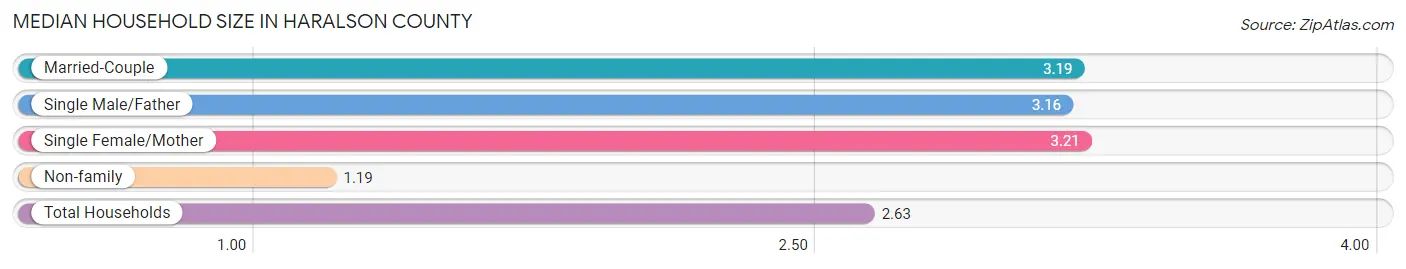
The median household size in Haralson County is 2.63 persons per household, with single female/mother households (1,064 | 9.4%) accounting for the largest median household size of 3.21 persons per household. non-family households (3,179 | 28.0%) represent the smallest median household size with 1.19 persons per household.
| Household Type | # Households | Household Size |
| Married-Couple | 6,432 (56.6%) | 3.19 |
| Single Male/Father | 682 (6.0%) | 3.16 |
| Single Female/Mother | 1,064 (9.4%) | 3.21 |
| Non-family | 3,179 (28.0%) | 1.19 |
| Total Households | 11,357 (100.0%) | 2.63 |
Household Size by Marriage Status in Haralson County
Out of a total of 11,357 households in Haralson County, 8,178 (72.0%) are family households, while 3,179 (28.0%) are nonfamily households. The most numerous type of family households are 2-person households, comprising 3,303, and the most common type of nonfamily households are 1-person households, comprising 2,795.
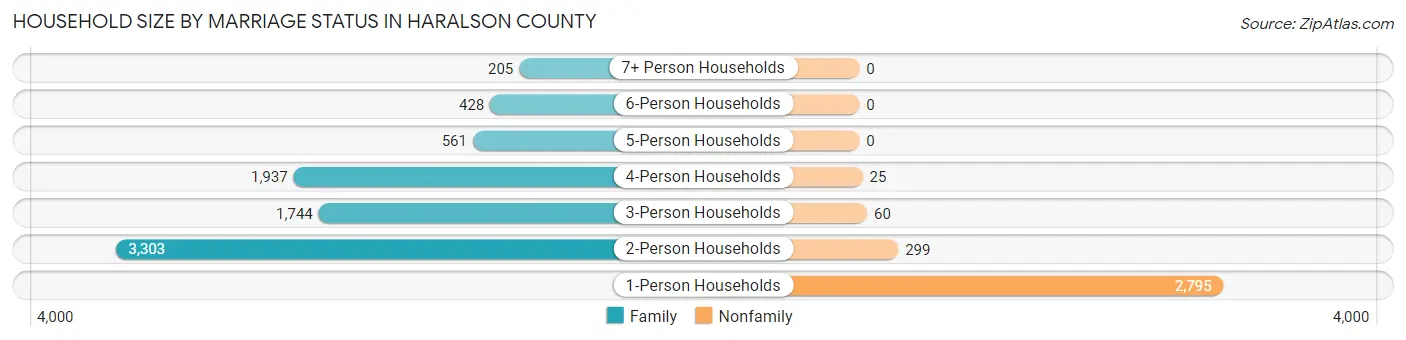
| Household Size | Family Households | Nonfamily Households |
| 1-Person Households | - | 2,795 (24.6%) |
| 2-Person Households | 3,303 (29.1%) | 299 (2.6%) |
| 3-Person Households | 1,744 (15.4%) | 60 (0.5%) |
| 4-Person Households | 1,937 (17.1%) | 25 (0.2%) |
| 5-Person Households | 561 (4.9%) | 0 (0.0%) |
| 6-Person Households | 428 (3.8%) | 0 (0.0%) |
| 7+ Person Households | 205 (1.8%) | 0 (0.0%) |
| Total | 8,178 (72.0%) | 3,179 (28.0%) |
Female Fertility in Haralson County
Fertility by Age in Haralson County
Average fertility rate in Haralson County is 31.0 births per 1,000 women. Women in the age bracket of 20 to 34 years have the highest fertility rate with 35.0 births per 1,000 women. Women in the age bracket of 35 to 50 years acount for 46.5% of all women with births.
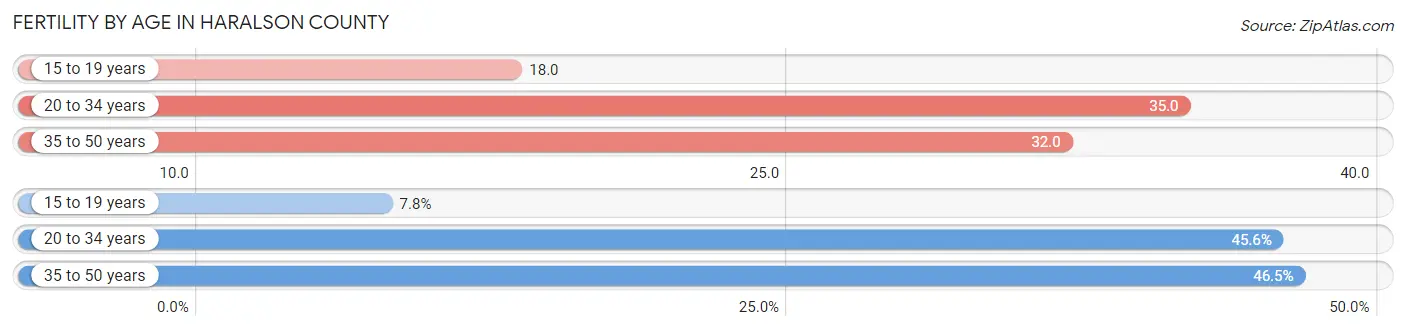
| Age Bracket | Women with Births | Births / 1,000 Women |
| 15 to 19 years | 17 (7.8%) | 18.0 |
| 20 to 34 years | 99 (45.6%) | 35.0 |
| 35 to 50 years | 101 (46.5%) | 32.0 |
| Total | 217 (100.0%) | 31.0 |
Fertility by Age by Marriage Status in Haralson County
71.0% of women with births (217) in Haralson County are married. The highest percentage of unmarried women with births falls into 15 to 19 years age bracket with 100.0% of them unmarried at the time of birth, while the lowest percentage of unmarried women with births belong to 20 to 34 years age bracket with 17.2% of them unmarried.
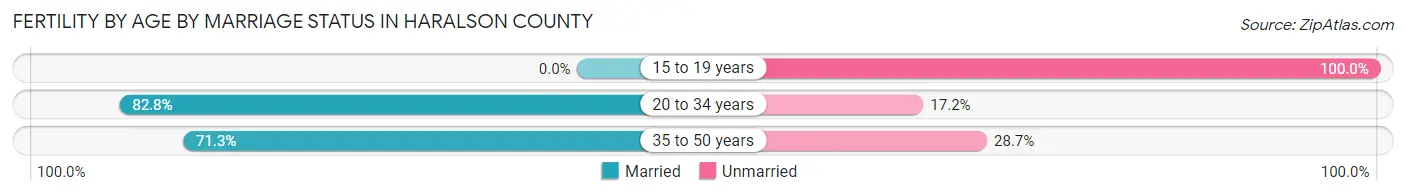
| Age Bracket | Married | Unmarried |
| 15 to 19 years | 0 (0.0%) | 17 (100.0%) |
| 20 to 34 years | 82 (82.8%) | 17 (17.2%) |
| 35 to 50 years | 72 (71.3%) | 29 (28.7%) |
| Total | 154 (71.0%) | 63 (29.0%) |
Fertility by Education in Haralson County
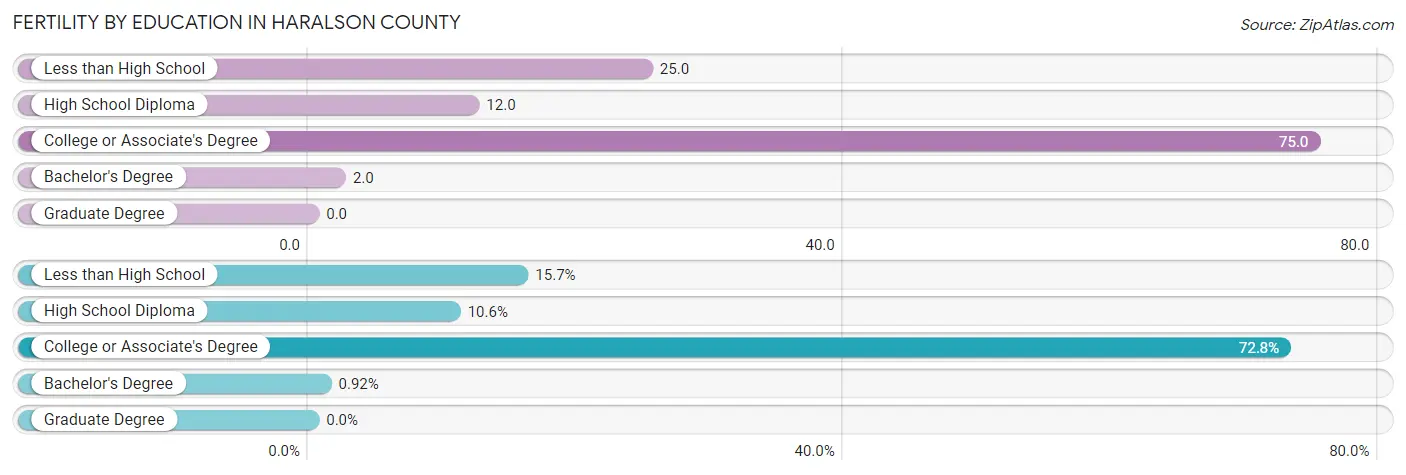
| Educational Attainment | Women with Births | Births / 1,000 Women |
| Less than High School | 34 (15.7%) | 25.0 |
| High School Diploma | 23 (10.6%) | 12.0 |
| College or Associate's Degree | 158 (72.8%) | 75.0 |
| Bachelor's Degree | 2 (0.9%) | 2.0 |
| Graduate Degree | 0 (0.0%) | 0.0 |
| Total | 217 (100.0%) | 31.0 |
Fertility by Education by Marriage Status in Haralson County
29.0% of women with births in Haralson County are unmarried. Women with the educational attainment of high school diploma are most likely to be married with 100.0% of them married at childbirth, while women with the educational attainment of less than high school are least likely to be married with 100.0% of them unmarried at childbirth.
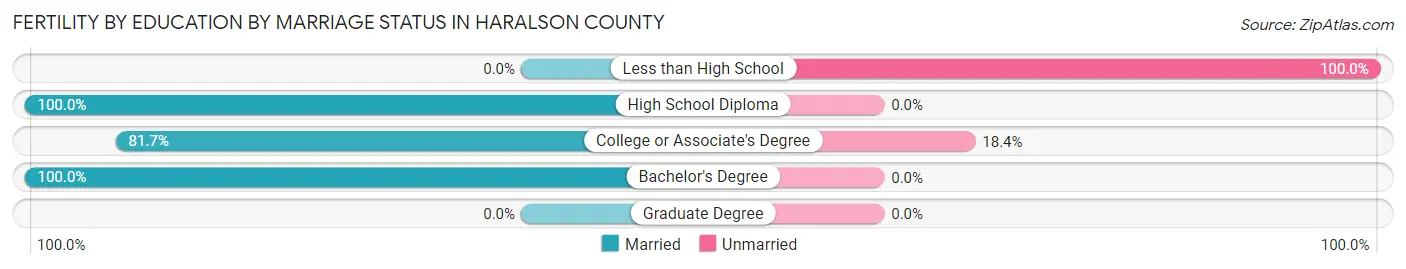
| Educational Attainment | Married | Unmarried |
| Less than High School | 0 (0.0%) | 34 (100.0%) |
| High School Diploma | 23 (100.0%) | 0 (0.0%) |
| College or Associate's Degree | 129 (81.7%) | 29 (18.3%) |
| Bachelor's Degree | 2 (100.0%) | 0 (0.0%) |
| Graduate Degree | 0 (0.0%) | 0 (0.0%) |
| Total | 154 (71.0%) | 63 (29.0%) |
Employment Characteristics in Haralson County
Employment by Class of Employer in Haralson County
Among the 13,781 employed individuals in Haralson County, private company employees (9,695 | 70.4%), local government employees (1,046 | 7.6%), and state government employees (762 | 5.5%) make up the most common classes of employment.
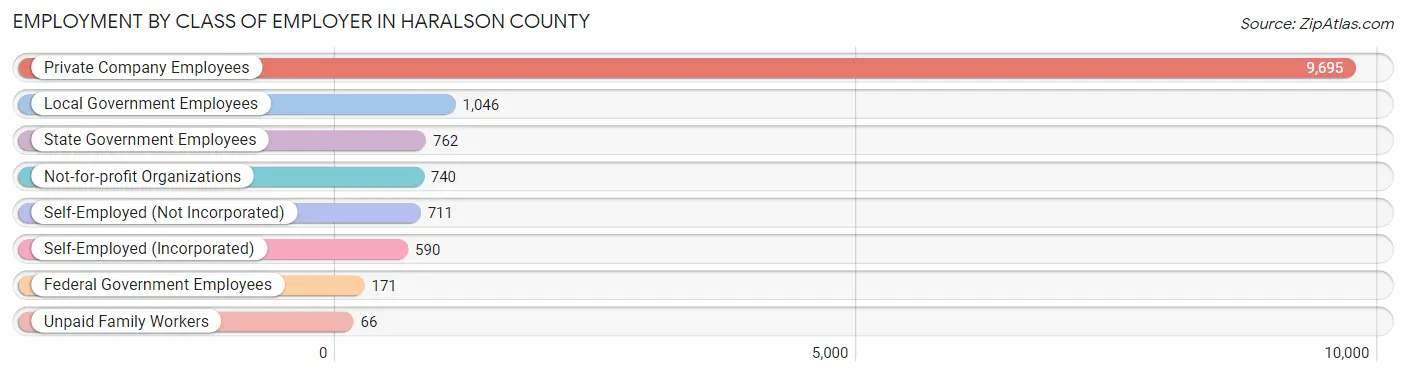
| Employer Class | # Employees | % Employees |
| Private Company Employees | 9,695 | 70.4% |
| Self-Employed (Incorporated) | 590 | 4.3% |
| Self-Employed (Not Incorporated) | 711 | 5.2% |
| Not-for-profit Organizations | 740 | 5.4% |
| Local Government Employees | 1,046 | 7.6% |
| State Government Employees | 762 | 5.5% |
| Federal Government Employees | 171 | 1.2% |
| Unpaid Family Workers | 66 | 0.5% |
| Total | 13,781 | 100.0% |
Employment Status by Age in Haralson County
According to the labor force statistics for Haralson County, out of the total population over 16 years of age (23,862), 61.6% or 14,699 individuals are in the labor force, with 4.4% or 647 of them unemployed. The age group with the highest labor force participation rate is 35 to 44 years, with 86.8% or 3,365 individuals in the labor force. Within the labor force, the 16 to 19 years age range has the highest percentage of unemployed individuals, with 21.4% or 116 of them being unemployed.
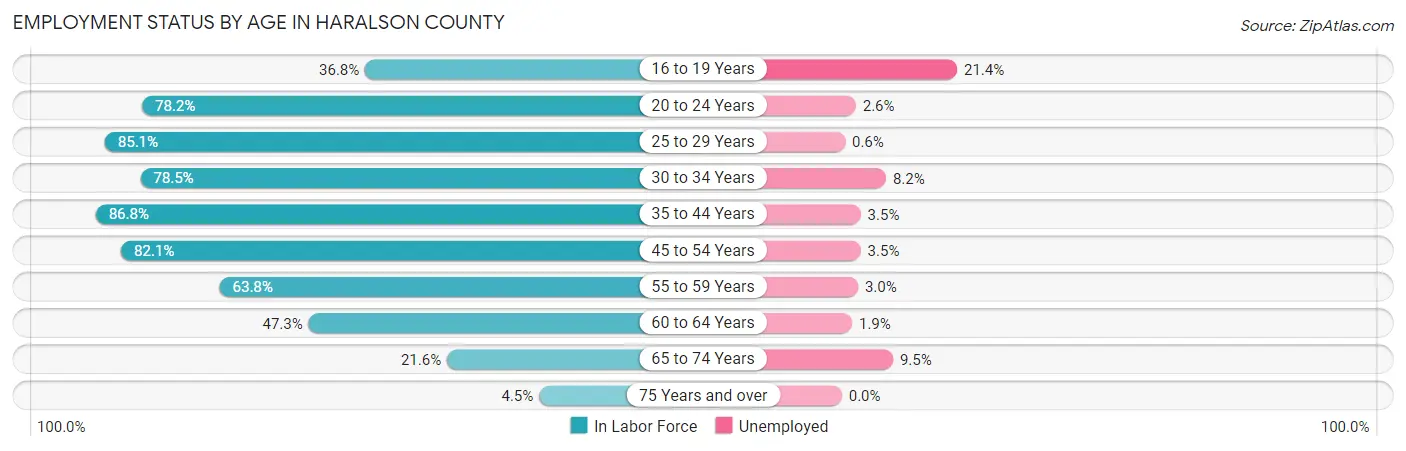
| Age Bracket | In Labor Force | Unemployed |
| 16 to 19 Years | 541 (36.8%) | 116 (21.4%) |
| 20 to 24 Years | 1,272 (78.2%) | 33 (2.6%) |
| 25 to 29 Years | 1,619 (85.1%) | 10 (0.6%) |
| 30 to 34 Years | 1,694 (78.5%) | 139 (8.2%) |
| 35 to 44 Years | 3,365 (86.8%) | 118 (3.5%) |
| 45 to 54 Years | 3,411 (82.1%) | 119 (3.5%) |
| 55 to 59 Years | 1,065 (63.8%) | 32 (3.0%) |
| 60 to 64 Years | 1,048 (47.3%) | 20 (1.9%) |
| 65 to 74 Years | 602 (21.6%) | 57 (9.5%) |
| 75 Years and over | 90 (4.5%) | 0 (0.0%) |
| Total | 14,699 (61.6%) | 647 (4.4%) |
Employment Status by Educational Attainment in Haralson County
According to labor force statistics for Haralson County, 76.4% of individuals (12,206) out of the total population between 25 and 64 years of age (15,977) are in the labor force, with 3.6% or 439 of them being unemployed. The group with the highest labor force participation rate are those with the educational attainment of bachelor's degree or higher, with 87.9% or 2,746 individuals in the labor force. Within the labor force, individuals with less than high school education have the highest percentage of unemployment, with 7.5% or 93 of them being unemployed.
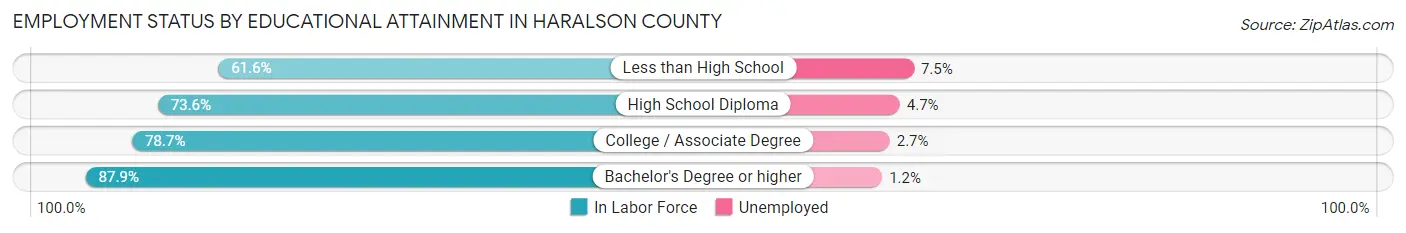
| Educational Attainment | In Labor Force | Unemployed |
| Less than High School | 1,245 (61.6%) | 152 (7.5%) |
| High School Diploma | 4,551 (73.6%) | 291 (4.7%) |
| College / Associate Degree | 3,658 (78.7%) | 125 (2.7%) |
| Bachelor's Degree or higher | 2,746 (87.9%) | 37 (1.2%) |
| Total | 12,206 (76.4%) | 575 (3.6%) |
Employment Occupations by Sex in Haralson County
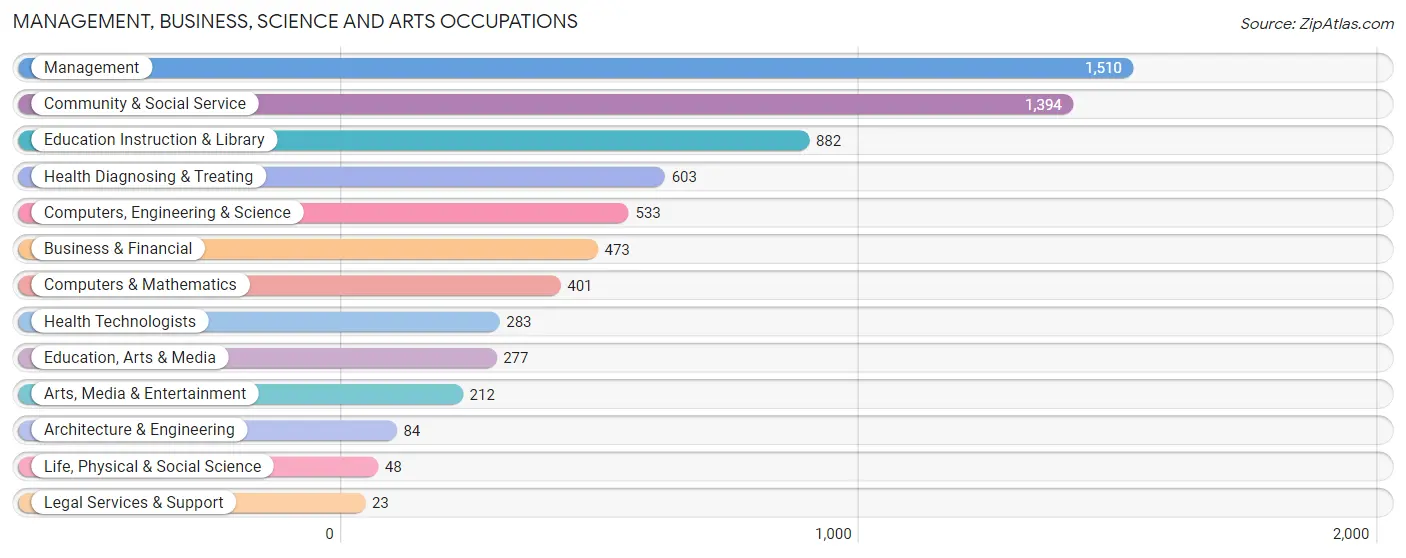
Management, Business, Science and Arts Occupations
The most common Management, Business, Science and Arts occupations in Haralson County are Management (1,510 | 10.7%), Community & Social Service (1,394 | 9.9%), Education Instruction & Library (882 | 6.3%), Health Diagnosing & Treating (603 | 4.3%), and Computers, Engineering & Science (533 | 3.8%).
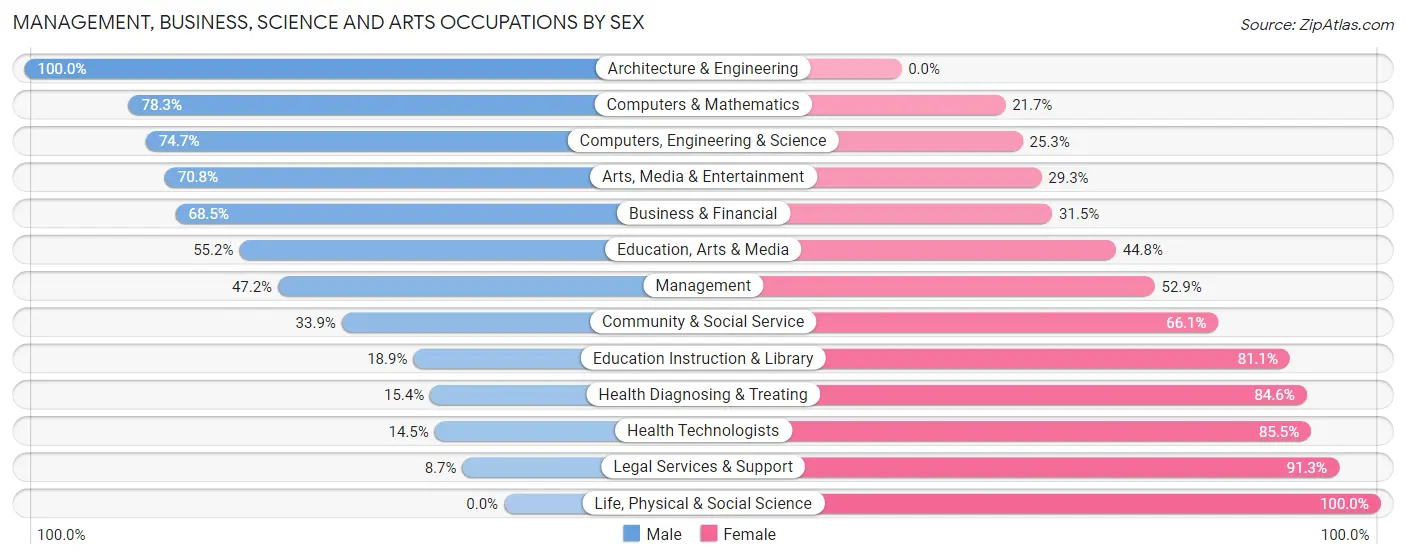
Management, Business, Science and Arts Occupations by Sex
Within the Management, Business, Science and Arts occupations in Haralson County, the most male-oriented occupations are Architecture & Engineering (100.0%), Computers & Mathematics (78.3%), and Computers, Engineering & Science (74.7%), while the most female-oriented occupations are Life, Physical & Social Science (100.0%), Legal Services & Support (91.3%), and Health Technologists (85.5%).
| Occupation | Male | Female |
| Management | 712 (47.1%) | 798 (52.8%) |
| Business & Financial | 324 (68.5%) | 149 (31.5%) |
| Computers, Engineering & Science | 398 (74.7%) | 135 (25.3%) |
| Computers & Mathematics | 314 (78.3%) | 87 (21.7%) |
| Architecture & Engineering | 84 (100.0%) | 0 (0.0%) |
| Life, Physical & Social Science | 0 (0.0%) | 48 (100.0%) |
| Community & Social Service | 472 (33.9%) | 922 (66.1%) |
| Education, Arts & Media | 153 (55.2%) | 124 (44.8%) |
| Legal Services & Support | 2 (8.7%) | 21 (91.3%) |
| Education Instruction & Library | 167 (18.9%) | 715 (81.1%) |
| Arts, Media & Entertainment | 150 (70.8%) | 62 (29.2%) |
| Health Diagnosing & Treating | 93 (15.4%) | 510 (84.6%) |
| Health Technologists | 41 (14.5%) | 242 (85.5%) |
| Total (Category) | 1,999 (44.3%) | 2,514 (55.7%) |
| Total (Overall) | 7,505 (53.4%) | 6,539 (46.6%) |
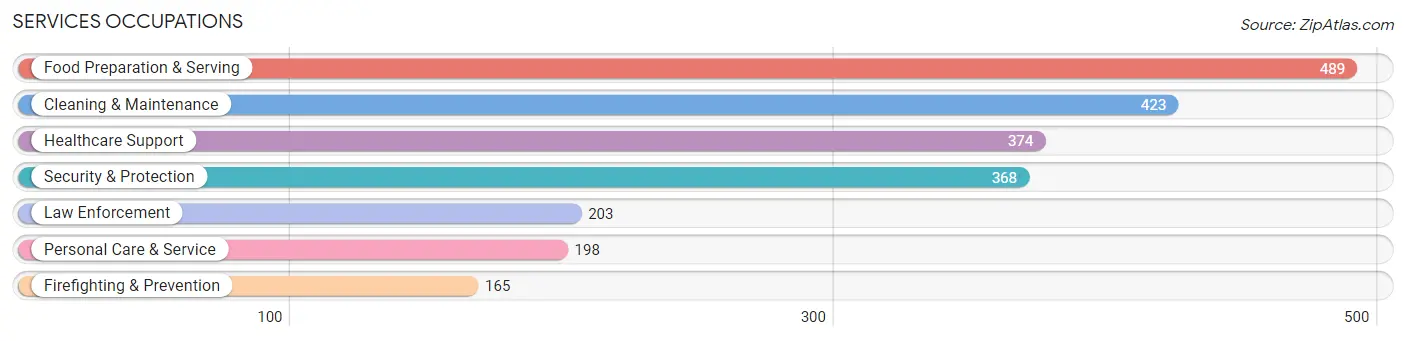
Services Occupations
The most common Services occupations in Haralson County are Food Preparation & Serving (489 | 3.5%), Cleaning & Maintenance (423 | 3.0%), Healthcare Support (374 | 2.7%), Security & Protection (368 | 2.6%), and Law Enforcement (203 | 1.5%).
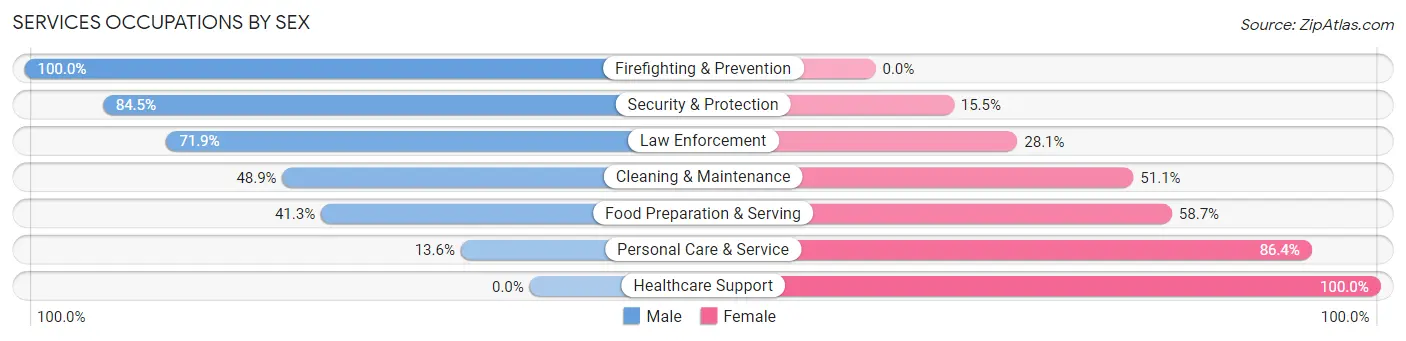
Services Occupations by Sex
Within the Services occupations in Haralson County, the most male-oriented occupations are Firefighting & Prevention (100.0%), Security & Protection (84.5%), and Law Enforcement (71.9%), while the most female-oriented occupations are Healthcare Support (100.0%), Personal Care & Service (86.4%), and Food Preparation & Serving (58.7%).
| Occupation | Male | Female |
| Healthcare Support | 0 (0.0%) | 374 (100.0%) |
| Security & Protection | 311 (84.5%) | 57 (15.5%) |
| Firefighting & Prevention | 165 (100.0%) | 0 (0.0%) |
| Law Enforcement | 146 (71.9%) | 57 (28.1%) |
| Food Preparation & Serving | 202 (41.3%) | 287 (58.7%) |
| Cleaning & Maintenance | 207 (48.9%) | 216 (51.1%) |
| Personal Care & Service | 27 (13.6%) | 171 (86.4%) |
| Total (Category) | 747 (40.3%) | 1,105 (59.7%) |
| Total (Overall) | 7,505 (53.4%) | 6,539 (46.6%) |
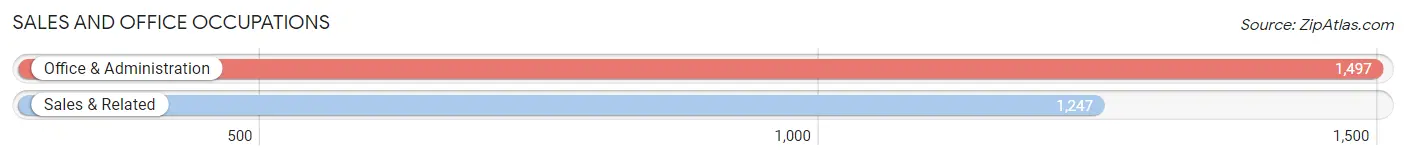
Sales and Office Occupations
The most common Sales and Office occupations in Haralson County are Office & Administration (1,497 | 10.7%), and Sales & Related (1,247 | 8.9%).
Sales and Office Occupations by Sex
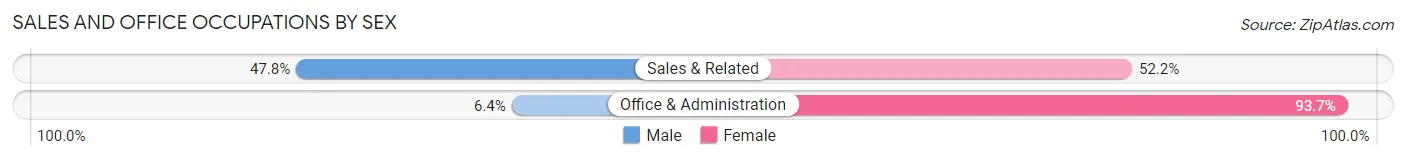
| Occupation | Male | Female |
| Sales & Related | 596 (47.8%) | 651 (52.2%) |
| Office & Administration | 95 (6.4%) | 1,402 (93.6%) |
| Total (Category) | 691 (25.2%) | 2,053 (74.8%) |
| Total (Overall) | 7,505 (53.4%) | 6,539 (46.6%) |
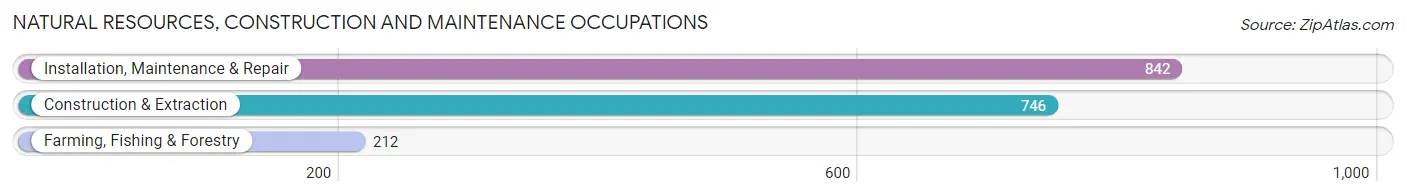
Natural Resources, Construction and Maintenance Occupations
The most common Natural Resources, Construction and Maintenance occupations in Haralson County are Installation, Maintenance & Repair (842 | 6.0%), Construction & Extraction (746 | 5.3%), and Farming, Fishing & Forestry (212 | 1.5%).
Natural Resources, Construction and Maintenance Occupations by Sex
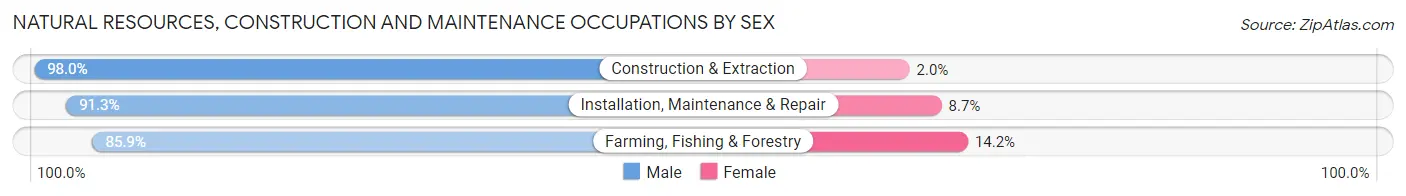
| Occupation | Male | Female |
| Farming, Fishing & Forestry | 182 (85.9%) | 30 (14.1%) |
| Construction & Extraction | 731 (98.0%) | 15 (2.0%) |
| Installation, Maintenance & Repair | 769 (91.3%) | 73 (8.7%) |
| Total (Category) | 1,682 (93.4%) | 118 (6.6%) |
| Total (Overall) | 7,505 (53.4%) | 6,539 (46.6%) |
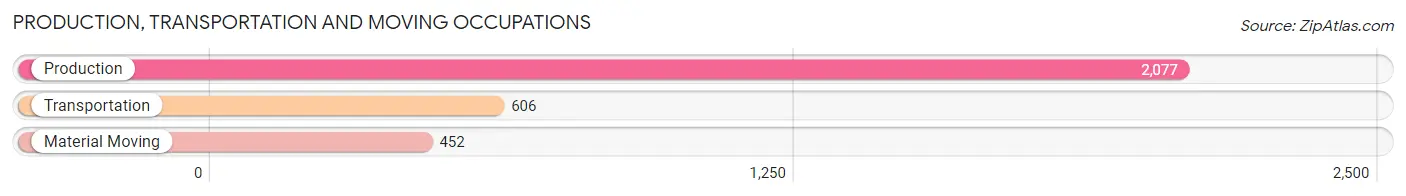
Production, Transportation and Moving Occupations
The most common Production, Transportation and Moving occupations in Haralson County are Production (2,077 | 14.8%), Transportation (606 | 4.3%), and Material Moving (452 | 3.2%).
Production, Transportation and Moving Occupations by Sex
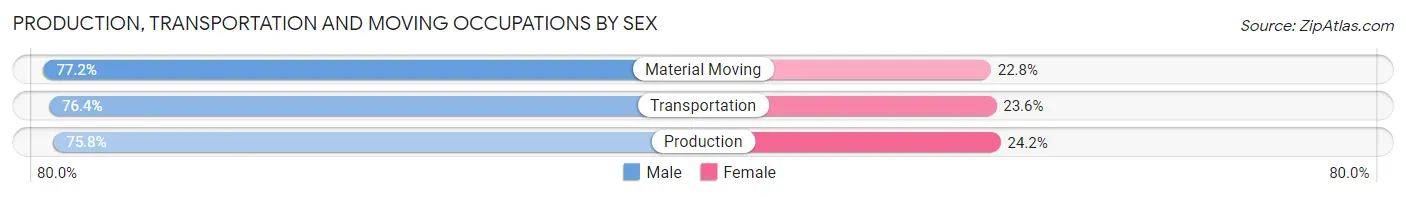
| Occupation | Male | Female |
| Production | 1,574 (75.8%) | 503 (24.2%) |
| Transportation | 463 (76.4%) | 143 (23.6%) |
| Material Moving | 349 (77.2%) | 103 (22.8%) |
| Total (Category) | 2,386 (76.1%) | 749 (23.9%) |
| Total (Overall) | 7,505 (53.4%) | 6,539 (46.6%) |
Employment Industries by Sex in Haralson County
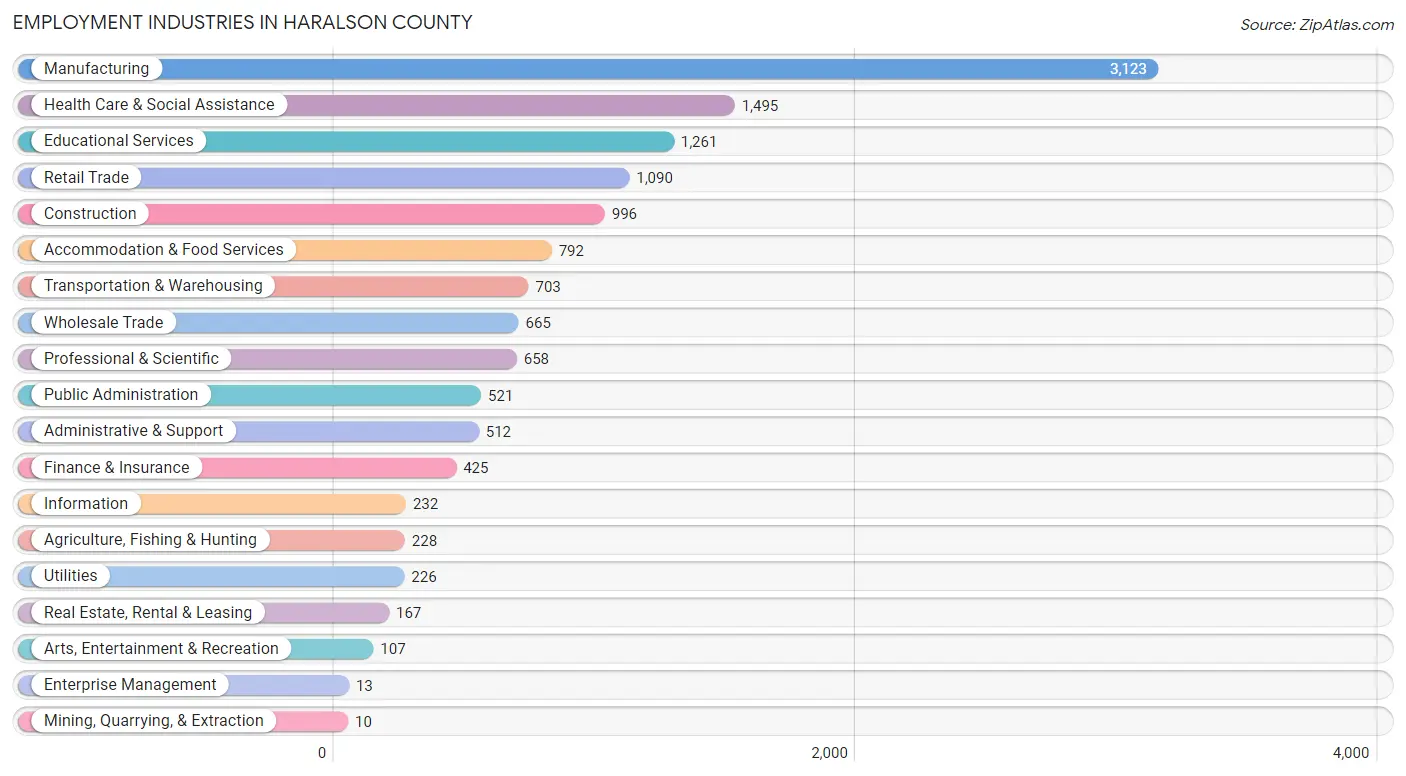
Employment Industries in Haralson County
The major employment industries in Haralson County include Manufacturing (3,123 | 22.2%), Health Care & Social Assistance (1,495 | 10.6%), Educational Services (1,261 | 9.0%), Retail Trade (1,090 | 7.8%), and Construction (996 | 7.1%).
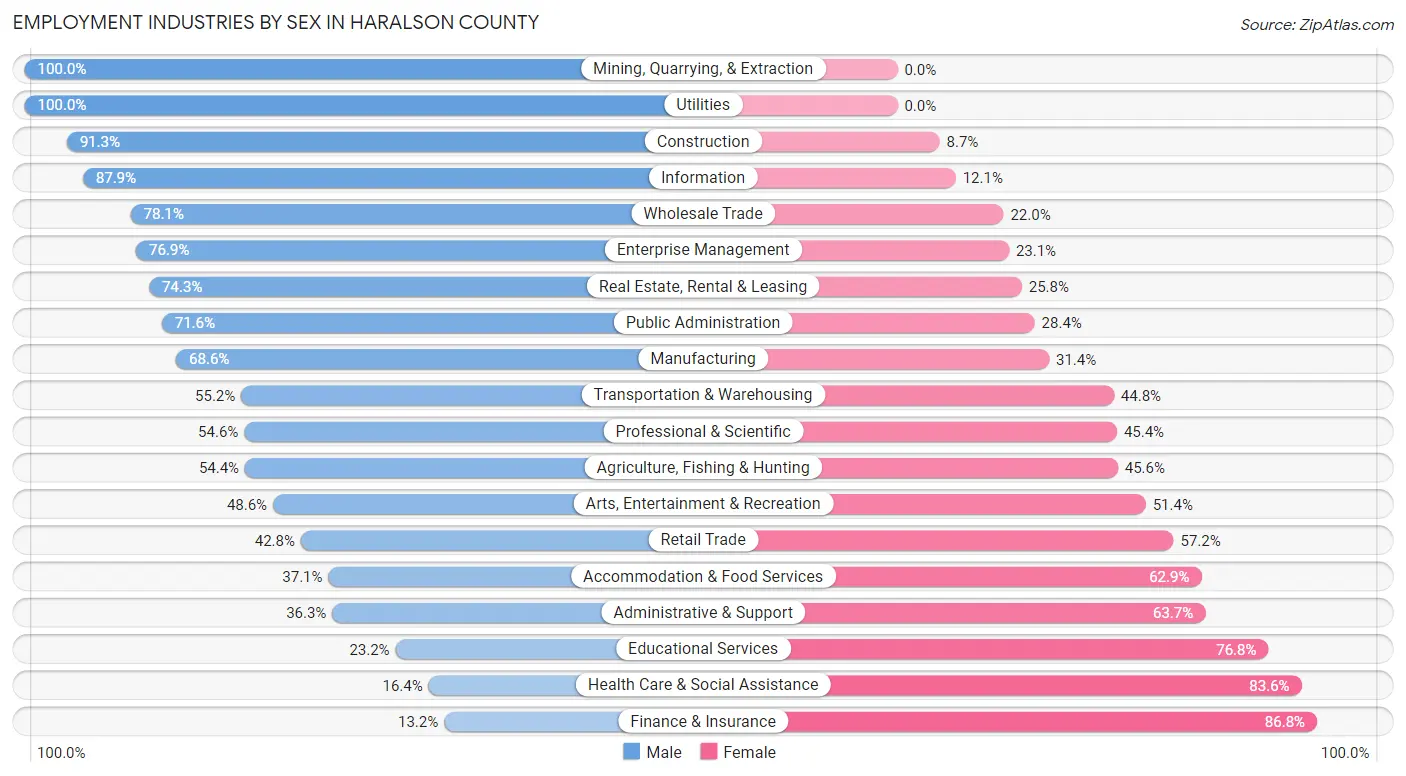
Employment Industries by Sex in Haralson County
The Haralson County industries that see more men than women are Mining, Quarrying, & Extraction (100.0%), Utilities (100.0%), and Construction (91.3%), whereas the industries that tend to have a higher number of women are Finance & Insurance (86.8%), Health Care & Social Assistance (83.6%), and Educational Services (76.8%).
| Industry | Male | Female |
| Agriculture, Fishing & Hunting | 124 (54.4%) | 104 (45.6%) |
| Mining, Quarrying, & Extraction | 10 (100.0%) | 0 (0.0%) |
| Construction | 909 (91.3%) | 87 (8.7%) |
| Manufacturing | 2,143 (68.6%) | 980 (31.4%) |
| Wholesale Trade | 519 (78.0%) | 146 (22.0%) |
| Retail Trade | 467 (42.8%) | 623 (57.2%) |
| Transportation & Warehousing | 388 (55.2%) | 315 (44.8%) |
| Utilities | 226 (100.0%) | 0 (0.0%) |
| Information | 204 (87.9%) | 28 (12.1%) |
| Finance & Insurance | 56 (13.2%) | 369 (86.8%) |
| Real Estate, Rental & Leasing | 124 (74.3%) | 43 (25.8%) |
| Professional & Scientific | 359 (54.6%) | 299 (45.4%) |
| Enterprise Management | 10 (76.9%) | 3 (23.1%) |
| Administrative & Support | 186 (36.3%) | 326 (63.7%) |
| Educational Services | 293 (23.2%) | 968 (76.8%) |
| Health Care & Social Assistance | 245 (16.4%) | 1,250 (83.6%) |
| Arts, Entertainment & Recreation | 52 (48.6%) | 55 (51.4%) |
| Accommodation & Food Services | 294 (37.1%) | 498 (62.9%) |
| Public Administration | 373 (71.6%) | 148 (28.4%) |
| Total | 7,505 (53.4%) | 6,539 (46.6%) |
Education in Haralson County
School Enrollment in Haralson County
The most common levels of schooling among the 6,978 students in Haralson County are high school (1,707 | 24.5%), elementary school (1,552 | 22.2%), and middle school (1,497 | 21.4%).
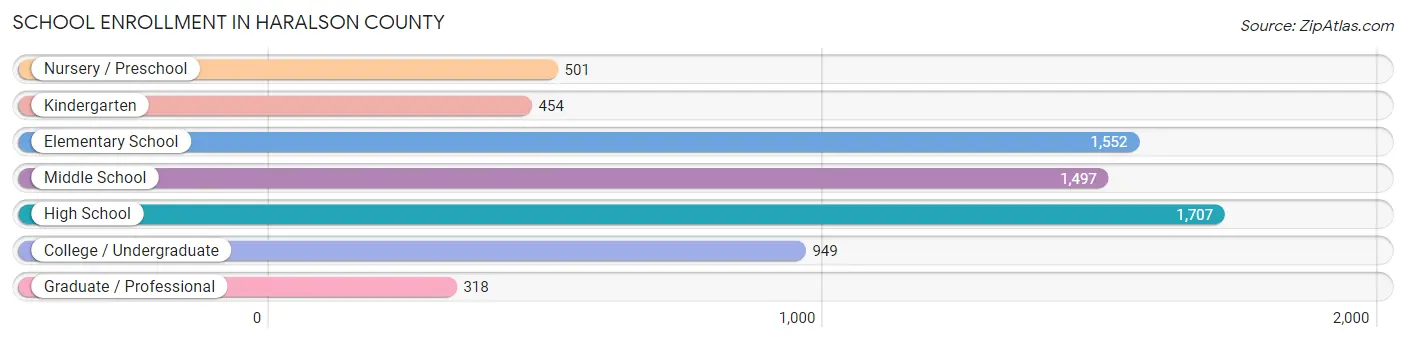
| School Level | # Students | % Students |
| Nursery / Preschool | 501 | 7.2% |
| Kindergarten | 454 | 6.5% |
| Elementary School | 1,552 | 22.2% |
| Middle School | 1,497 | 21.4% |
| High School | 1,707 | 24.5% |
| College / Undergraduate | 949 | 13.6% |
| Graduate / Professional | 318 | 4.6% |
| Total | 6,978 | 100.0% |
School Enrollment by Age by Funding Source in Haralson County
Out of a total of 6,978 students who are enrolled in schools in Haralson County, 481 (6.9%) attend a private institution, while the remaining 6,497 (93.1%) are enrolled in public schools. The age group of 35 years and over has the highest likelihood of being enrolled in private schools, with 151 (28.0% in the age bracket) enrolled. Conversely, the age group of 25 to 34 year olds has the lowest likelihood of being enrolled in a private school, with 215 (100.0% in the age bracket) attending a public institution.
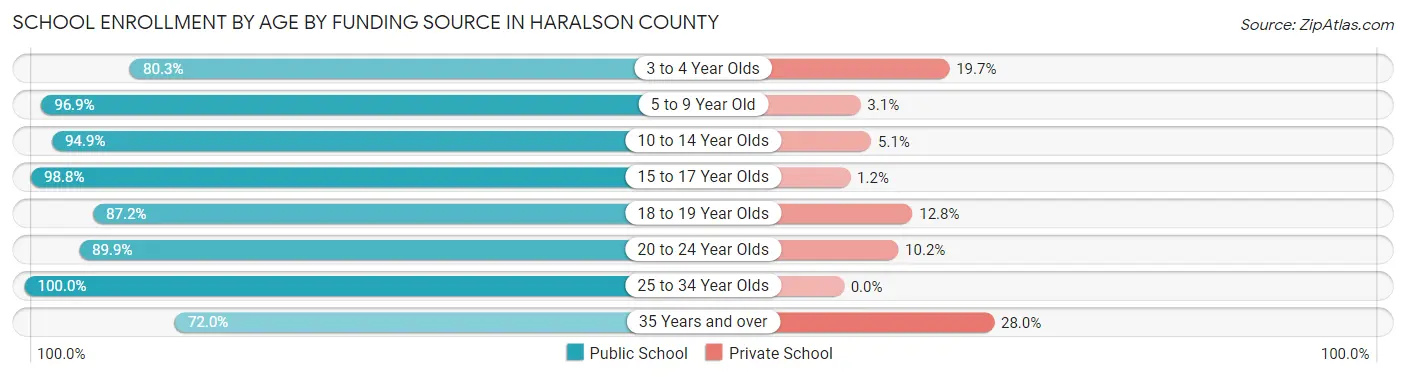
| Age Bracket | Public School | Private School |
| 3 to 4 Year Olds | 233 (80.3%) | 57 (19.7%) |
| 5 to 9 Year Old | 1,865 (96.9%) | 60 (3.1%) |
| 10 to 14 Year Olds | 1,875 (94.9%) | 101 (5.1%) |
| 15 to 17 Year Olds | 1,145 (98.8%) | 14 (1.2%) |
| 18 to 19 Year Olds | 307 (87.2%) | 45 (12.8%) |
| 20 to 24 Year Olds | 469 (89.8%) | 53 (10.2%) |
| 25 to 34 Year Olds | 215 (100.0%) | 0 (0.0%) |
| 35 Years and over | 388 (72.0%) | 151 (28.0%) |
| Total | 6,497 (93.1%) | 481 (6.9%) |
Educational Attainment by Field of Study in Haralson County
Education (843 | 21.4%), business (681 | 17.3%), science & technology (551 | 14.0%), bio, nature & agricultural (360 | 9.2%), and liberal arts & history (269 | 6.8%) are the most common fields of study among 3,931 individuals in Haralson County who have obtained a bachelor's degree or higher.
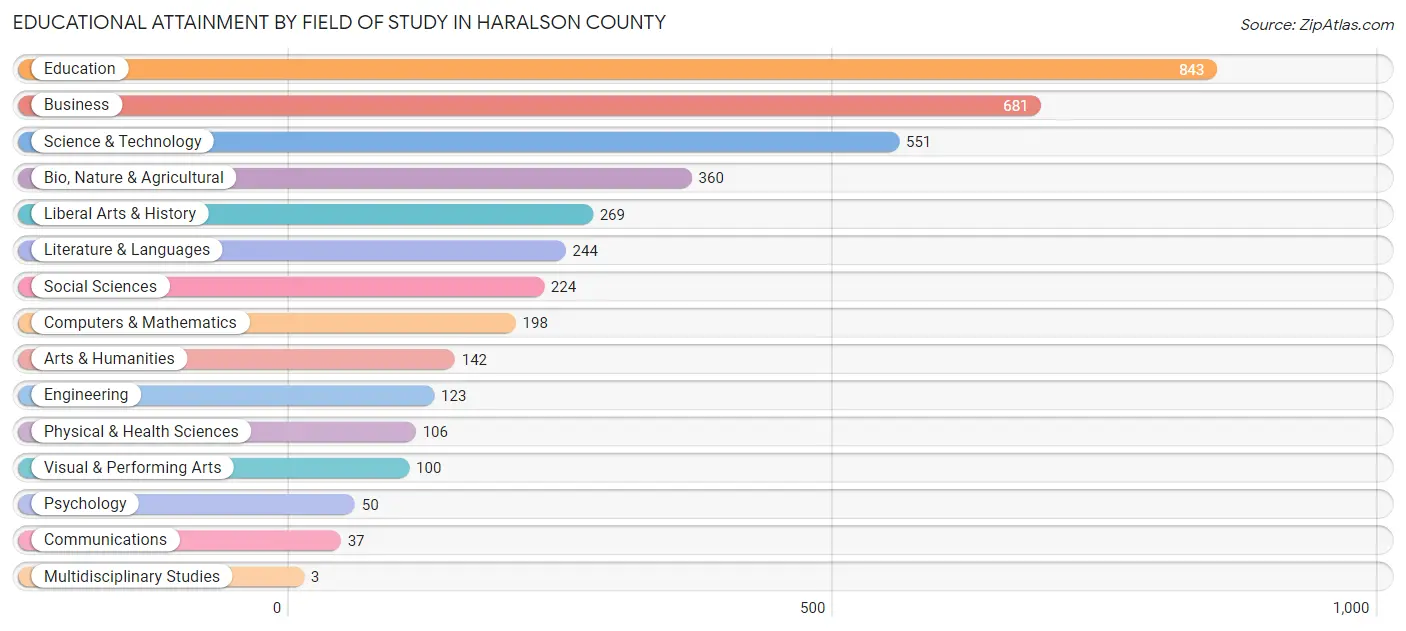
| Field of Study | # Graduates | % Graduates |
| Computers & Mathematics | 198 | 5.0% |
| Bio, Nature & Agricultural | 360 | 9.2% |
| Physical & Health Sciences | 106 | 2.7% |
| Psychology | 50 | 1.3% |
| Social Sciences | 224 | 5.7% |
| Engineering | 123 | 3.1% |
| Multidisciplinary Studies | 3 | 0.1% |
| Science & Technology | 551 | 14.0% |
| Business | 681 | 17.3% |
| Education | 843 | 21.4% |
| Literature & Languages | 244 | 6.2% |
| Liberal Arts & History | 269 | 6.8% |
| Visual & Performing Arts | 100 | 2.5% |
| Communications | 37 | 0.9% |
| Arts & Humanities | 142 | 3.6% |
| Total | 3,931 | 100.0% |
Transportation & Commute in Haralson County
Vehicle Availability by Sex in Haralson County
The most prevalent vehicle ownership categories in Haralson County are males with 2 vehicles (2,778, accounting for 37.8%) and females with 2 vehicles (2,485, making up 43.3%).
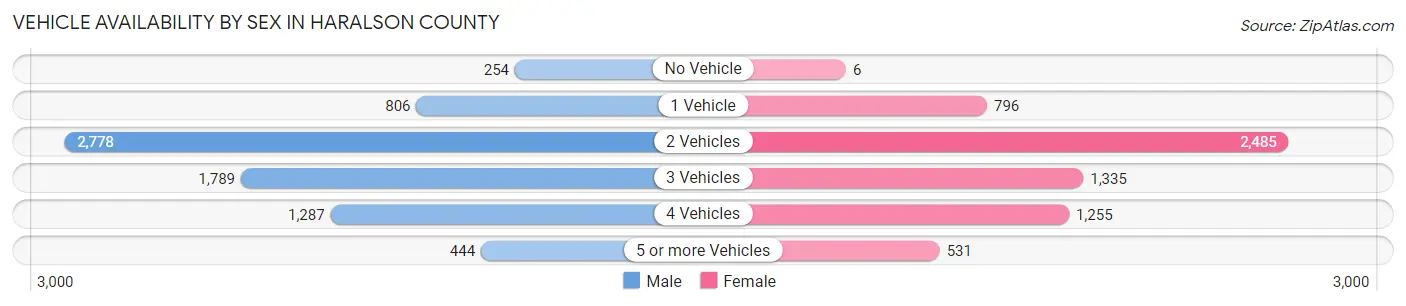
| Vehicles Available | Male | Female |
| No Vehicle | 254 (3.5%) | 6 (0.1%) |
| 1 Vehicle | 806 (11.0%) | 796 (12.4%) |
| 2 Vehicles | 2,778 (37.8%) | 2,485 (38.8%) |
| 3 Vehicles | 1,789 (24.3%) | 1,335 (20.8%) |
| 4 Vehicles | 1,287 (17.5%) | 1,255 (19.6%) |
| 5 or more Vehicles | 444 (6.0%) | 531 (8.3%) |
| Total | 7,358 (100.0%) | 6,408 (100.0%) |
Commute Time in Haralson County
The most frequently occuring commute durations in Haralson County are 30 to 34 minutes (1,761 commuters, 13.8%), 5 to 9 minutes (1,618 commuters, 12.7%), and 20 to 24 minutes (1,520 commuters, 11.9%).
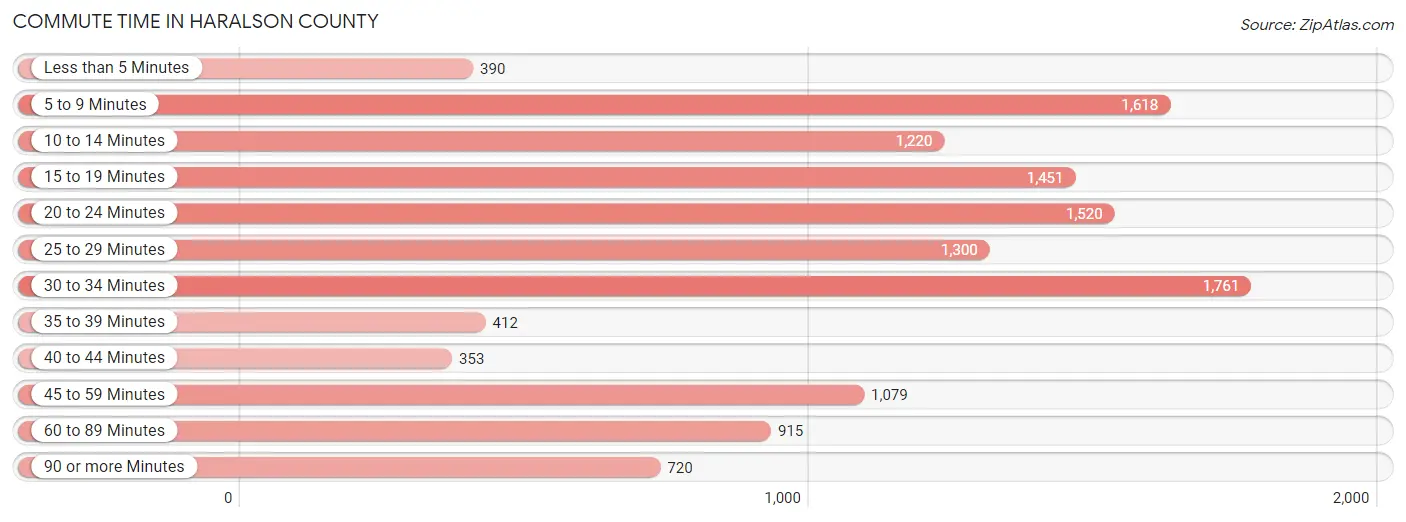
| Commute Time | # Commuters | % Commuters |
| Less than 5 Minutes | 390 | 3.1% |
| 5 to 9 Minutes | 1,618 | 12.7% |
| 10 to 14 Minutes | 1,220 | 9.6% |
| 15 to 19 Minutes | 1,451 | 11.4% |
| 20 to 24 Minutes | 1,520 | 11.9% |
| 25 to 29 Minutes | 1,300 | 10.2% |
| 30 to 34 Minutes | 1,761 | 13.8% |
| 35 to 39 Minutes | 412 | 3.2% |
| 40 to 44 Minutes | 353 | 2.8% |
| 45 to 59 Minutes | 1,079 | 8.5% |
| 60 to 89 Minutes | 915 | 7.2% |
| 90 or more Minutes | 720 | 5.7% |
Commute Time by Sex in Haralson County
The most common commute times in Haralson County are 25 to 29 minutes (852 commuters, 12.3%) for males and 30 to 34 minutes (916 commuters, 15.8%) for females.
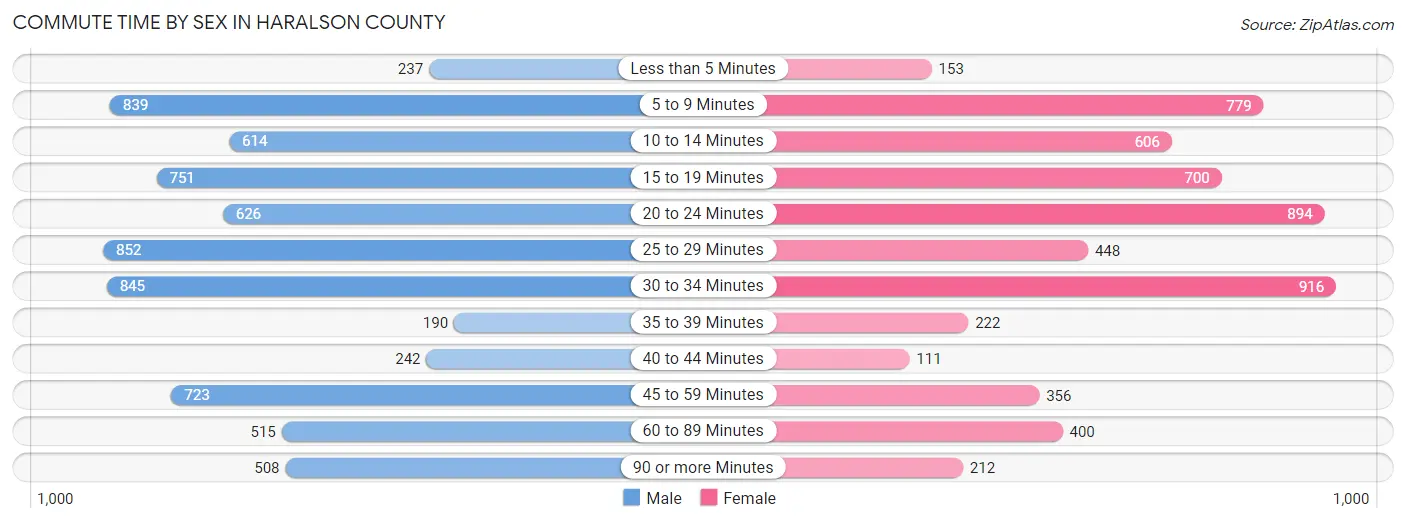
| Commute Time | Male | Female |
| Less than 5 Minutes | 237 (3.4%) | 153 (2.6%) |
| 5 to 9 Minutes | 839 (12.1%) | 779 (13.4%) |
| 10 to 14 Minutes | 614 (8.8%) | 606 (10.4%) |
| 15 to 19 Minutes | 751 (10.8%) | 700 (12.1%) |
| 20 to 24 Minutes | 626 (9.0%) | 894 (15.4%) |
| 25 to 29 Minutes | 852 (12.3%) | 448 (7.7%) |
| 30 to 34 Minutes | 845 (12.2%) | 916 (15.8%) |
| 35 to 39 Minutes | 190 (2.7%) | 222 (3.8%) |
| 40 to 44 Minutes | 242 (3.5%) | 111 (1.9%) |
| 45 to 59 Minutes | 723 (10.4%) | 356 (6.1%) |
| 60 to 89 Minutes | 515 (7.4%) | 400 (6.9%) |
| 90 or more Minutes | 508 (7.3%) | 212 (3.7%) |
Time of Departure to Work by Sex in Haralson County
The most frequent times of departure to work in Haralson County are 12:00 AM to 4:59 AM (889, 12.8%) for males and 7:30 AM to 7:59 AM (1,199, 20.7%) for females.
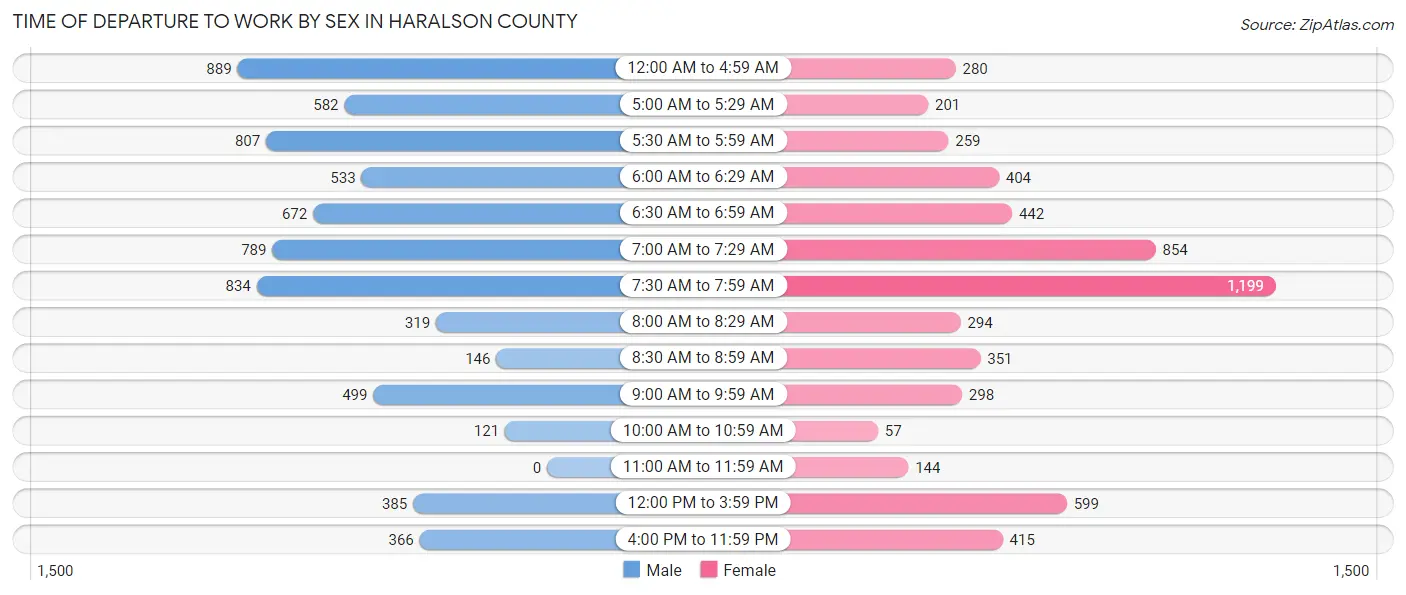
| Time of Departure | Male | Female |
| 12:00 AM to 4:59 AM | 889 (12.8%) | 280 (4.8%) |
| 5:00 AM to 5:29 AM | 582 (8.4%) | 201 (3.5%) |
| 5:30 AM to 5:59 AM | 807 (11.6%) | 259 (4.5%) |
| 6:00 AM to 6:29 AM | 533 (7.7%) | 404 (7.0%) |
| 6:30 AM to 6:59 AM | 672 (9.7%) | 442 (7.6%) |
| 7:00 AM to 7:29 AM | 789 (11.4%) | 854 (14.7%) |
| 7:30 AM to 7:59 AM | 834 (12.0%) | 1,199 (20.7%) |
| 8:00 AM to 8:29 AM | 319 (4.6%) | 294 (5.1%) |
| 8:30 AM to 8:59 AM | 146 (2.1%) | 351 (6.0%) |
| 9:00 AM to 9:59 AM | 499 (7.2%) | 298 (5.1%) |
| 10:00 AM to 10:59 AM | 121 (1.7%) | 57 (1.0%) |
| 11:00 AM to 11:59 AM | 0 (0.0%) | 144 (2.5%) |
| 12:00 PM to 3:59 PM | 385 (5.6%) | 599 (10.3%) |
| 4:00 PM to 11:59 PM | 366 (5.3%) | 415 (7.2%) |
| Total | 6,942 (100.0%) | 5,797 (100.0%) |
Housing Occupancy in Haralson County
Occupancy by Ownership in Haralson County
Of the total 11,357 dwellings in Haralson County, owner-occupied units account for 8,239 (72.6%), while renter-occupied units make up 3,118 (27.5%).
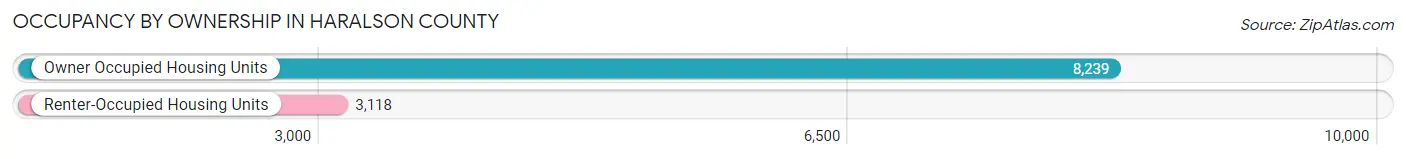
| Occupancy | # Housing Units | % Housing Units |
| Owner Occupied Housing Units | 8,239 | 72.6% |
| Renter-Occupied Housing Units | 3,118 | 27.5% |
| Total Occupied Housing Units | 11,357 | 100.0% |
Occupancy by Household Size in Haralson County
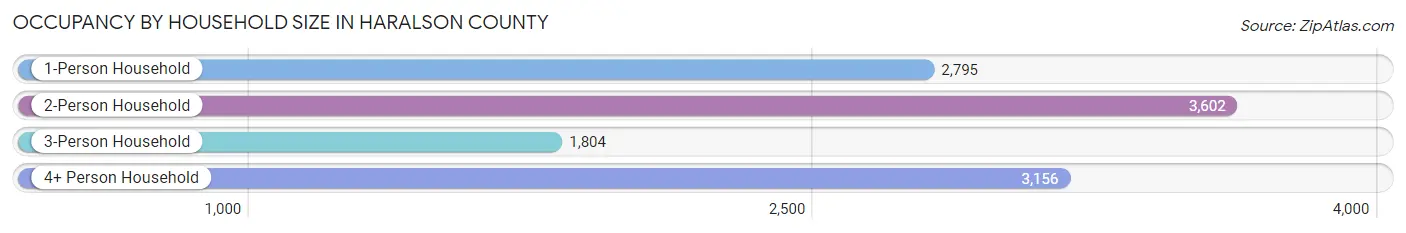
| Household Size | # Housing Units | % Housing Units |
| 1-Person Household | 2,795 | 24.6% |
| 2-Person Household | 3,602 | 31.7% |
| 3-Person Household | 1,804 | 15.9% |
| 4+ Person Household | 3,156 | 27.8% |
| Total Housing Units | 11,357 | 100.0% |
Occupancy by Ownership by Household Size in Haralson County
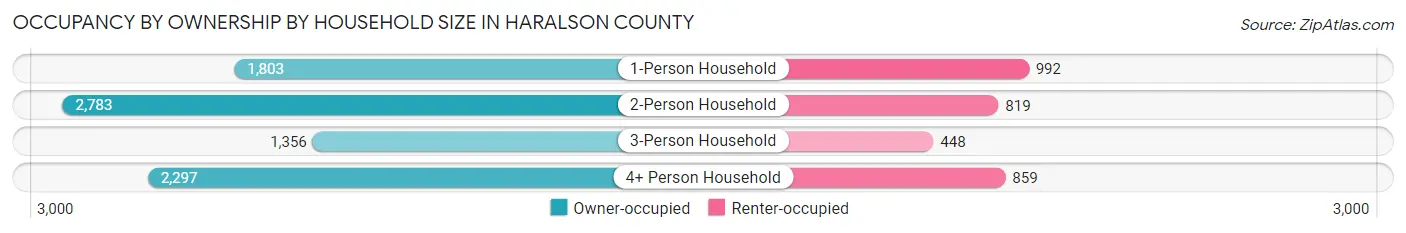
| Household Size | Owner-occupied | Renter-occupied |
| 1-Person Household | 1,803 (64.5%) | 992 (35.5%) |
| 2-Person Household | 2,783 (77.3%) | 819 (22.7%) |
| 3-Person Household | 1,356 (75.2%) | 448 (24.8%) |
| 4+ Person Household | 2,297 (72.8%) | 859 (27.2%) |
| Total Housing Units | 8,239 (72.6%) | 3,118 (27.5%) |
Occupancy by Educational Attainment in Haralson County
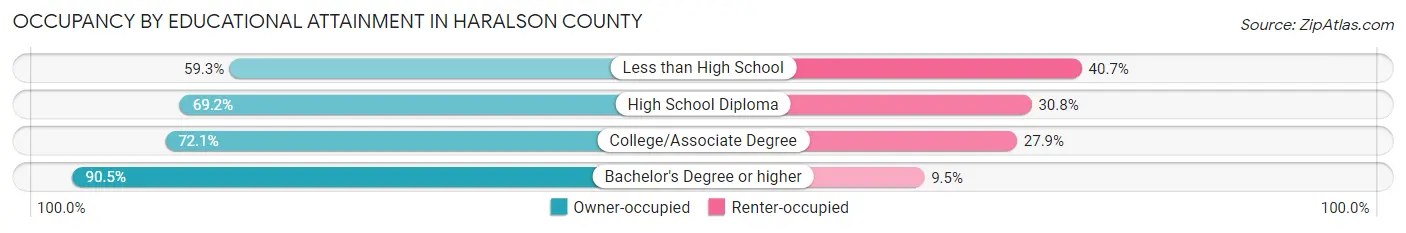
| Household Size | Owner-occupied | Renter-occupied |
| Less than High School | 1,056 (59.3%) | 726 (40.7%) |
| High School Diploma | 3,163 (69.2%) | 1,407 (30.8%) |
| College/Associate Degree | 1,996 (72.1%) | 772 (27.9%) |
| Bachelor's Degree or higher | 2,024 (90.5%) | 213 (9.5%) |
Occupancy by Age of Householder in Haralson County
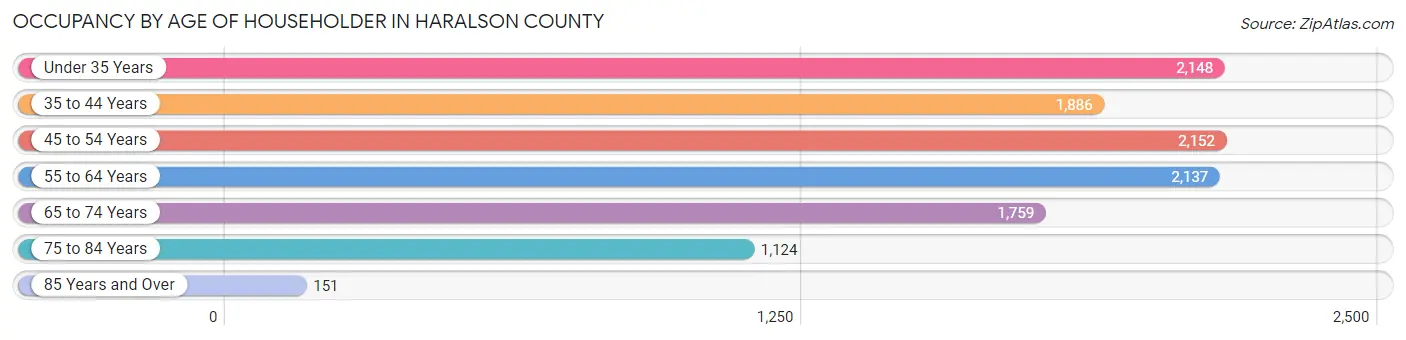
| Age Bracket | # Households | % Households |
| Under 35 Years | 2,148 | 18.9% |
| 35 to 44 Years | 1,886 | 16.6% |
| 45 to 54 Years | 2,152 | 19.0% |
| 55 to 64 Years | 2,137 | 18.8% |
| 65 to 74 Years | 1,759 | 15.5% |
| 75 to 84 Years | 1,124 | 9.9% |
| 85 Years and Over | 151 | 1.3% |
| Total | 11,357 | 100.0% |
Housing Finances in Haralson County
Median Income by Occupancy in Haralson County
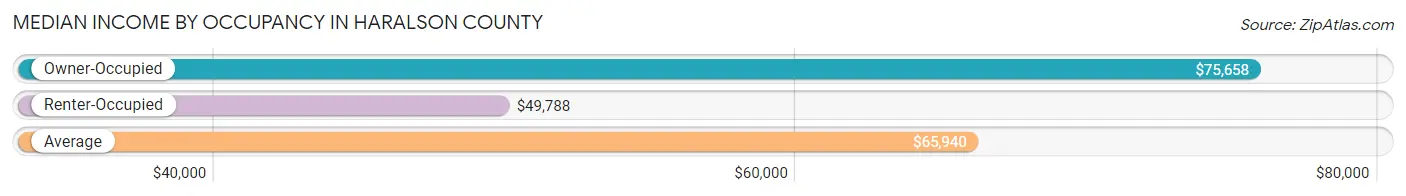
| Occupancy Type | # Households | Median Income |
| Owner-Occupied | 8,239 (72.6%) | $75,658 |
| Renter-Occupied | 3,118 (27.5%) | $49,788 |
| Average | 11,357 (100.0%) | $65,940 |
Occupancy by Householder Income Bracket in Haralson County
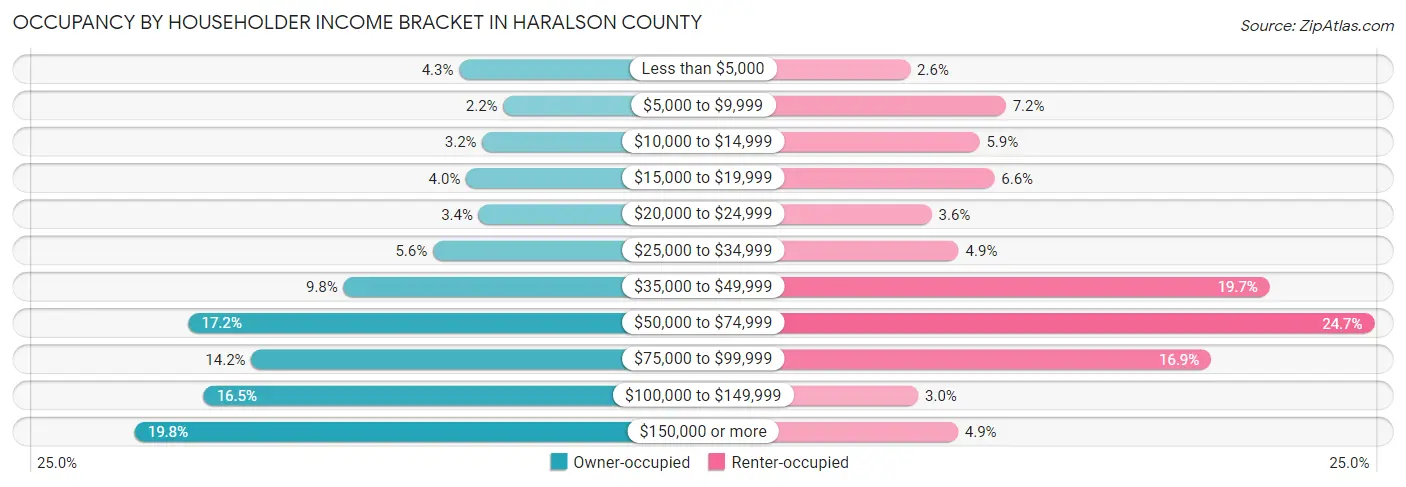
| Income Bracket | Owner-occupied | Renter-occupied |
| Less than $5,000 | 354 (4.3%) | 81 (2.6%) |
| $5,000 to $9,999 | 181 (2.2%) | 223 (7.1%) |
| $10,000 to $14,999 | 264 (3.2%) | 184 (5.9%) |
| $15,000 to $19,999 | 327 (4.0%) | 206 (6.6%) |
| $20,000 to $24,999 | 278 (3.4%) | 113 (3.6%) |
| $25,000 to $34,999 | 457 (5.6%) | 153 (4.9%) |
| $35,000 to $49,999 | 808 (9.8%) | 615 (19.7%) |
| $50,000 to $74,999 | 1,416 (17.2%) | 770 (24.7%) |
| $75,000 to $99,999 | 1,170 (14.2%) | 528 (16.9%) |
| $100,000 to $149,999 | 1,357 (16.5%) | 93 (3.0%) |
| $150,000 or more | 1,627 (19.8%) | 152 (4.9%) |
| Total | 8,239 (100.0%) | 3,118 (100.0%) |
Monthly Housing Cost Tiers in Haralson County
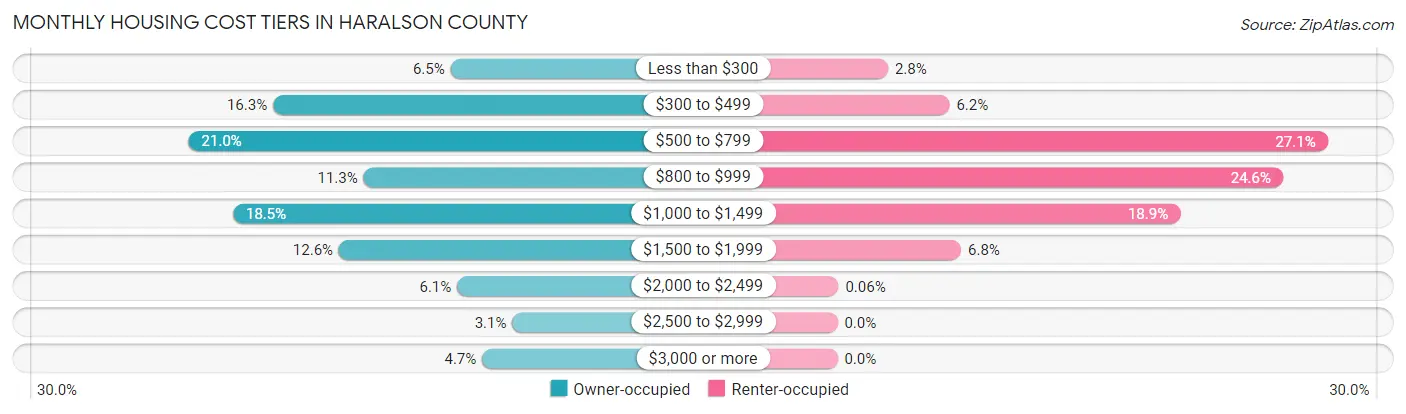
| Monthly Cost | Owner-occupied | Renter-occupied |
| Less than $300 | 533 (6.5%) | 87 (2.8%) |
| $300 to $499 | 1,341 (16.3%) | 193 (6.2%) |
| $500 to $799 | 1,726 (20.9%) | 844 (27.1%) |
| $800 to $999 | 929 (11.3%) | 767 (24.6%) |
| $1,000 to $1,499 | 1,524 (18.5%) | 590 (18.9%) |
| $1,500 to $1,999 | 1,041 (12.6%) | 213 (6.8%) |
| $2,000 to $2,499 | 503 (6.1%) | 2 (0.1%) |
| $2,500 to $2,999 | 252 (3.1%) | 0 (0.0%) |
| $3,000 or more | 390 (4.7%) | 0 (0.0%) |
| Total | 8,239 (100.0%) | 3,118 (100.0%) |
Physical Housing Characteristics in Haralson County
Housing Structures in Haralson County
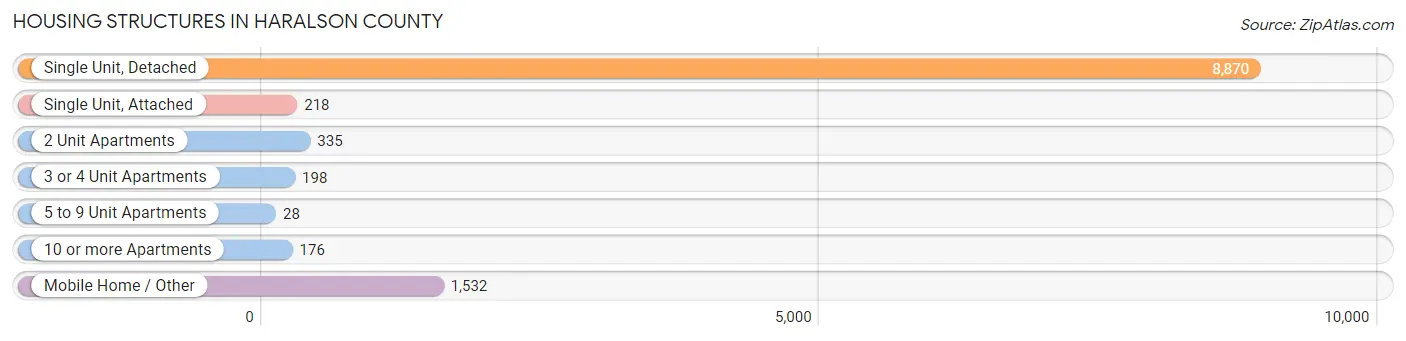
| Structure Type | # Housing Units | % Housing Units |
| Single Unit, Detached | 8,870 | 78.1% |
| Single Unit, Attached | 218 | 1.9% |
| 2 Unit Apartments | 335 | 2.9% |
| 3 or 4 Unit Apartments | 198 | 1.7% |
| 5 to 9 Unit Apartments | 28 | 0.3% |
| 10 or more Apartments | 176 | 1.5% |
| Mobile Home / Other | 1,532 | 13.5% |
| Total | 11,357 | 100.0% |
Housing Structures by Occupancy in Haralson County
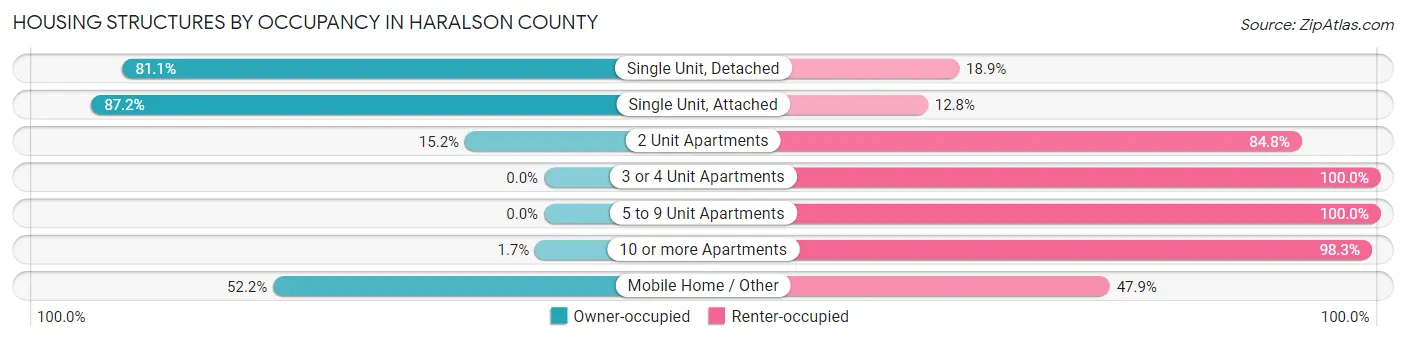
| Structure Type | Owner-occupied | Renter-occupied |
| Single Unit, Detached | 7,196 (81.1%) | 1,674 (18.9%) |
| Single Unit, Attached | 190 (87.2%) | 28 (12.8%) |
| 2 Unit Apartments | 51 (15.2%) | 284 (84.8%) |
| 3 or 4 Unit Apartments | 0 (0.0%) | 198 (100.0%) |
| 5 to 9 Unit Apartments | 0 (0.0%) | 28 (100.0%) |
| 10 or more Apartments | 3 (1.7%) | 173 (98.3%) |
| Mobile Home / Other | 799 (52.1%) | 733 (47.8%) |
| Total | 8,239 (72.6%) | 3,118 (27.5%) |
Housing Structures by Number of Rooms in Haralson County
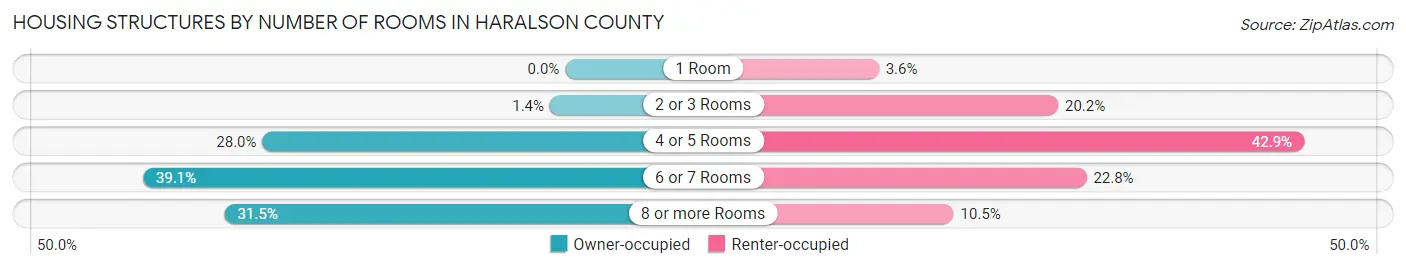
| Number of Rooms | Owner-occupied | Renter-occupied |
| 1 Room | 0 (0.0%) | 112 (3.6%) |
| 2 or 3 Rooms | 117 (1.4%) | 629 (20.2%) |
| 4 or 5 Rooms | 2,308 (28.0%) | 1,338 (42.9%) |
| 6 or 7 Rooms | 3,218 (39.1%) | 711 (22.8%) |
| 8 or more Rooms | 2,596 (31.5%) | 328 (10.5%) |
| Total | 8,239 (100.0%) | 3,118 (100.0%) |
Housing Structure by Heating Type in Haralson County
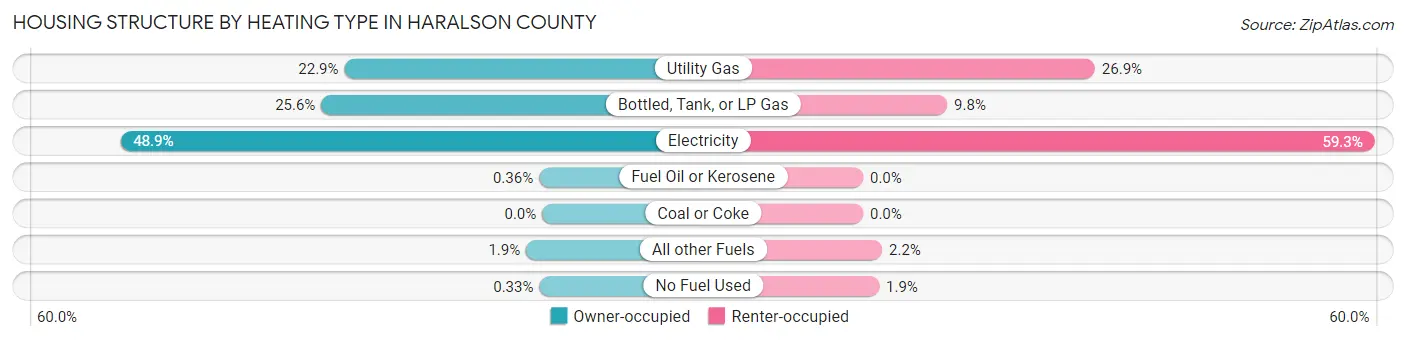
| Heating Type | Owner-occupied | Renter-occupied |
| Utility Gas | 1,889 (22.9%) | 838 (26.9%) |
| Bottled, Tank, or LP Gas | 2,110 (25.6%) | 304 (9.8%) |
| Electricity | 4,030 (48.9%) | 1,849 (59.3%) |
| Fuel Oil or Kerosene | 30 (0.4%) | 0 (0.0%) |
| Coal or Coke | 0 (0.0%) | 0 (0.0%) |
| All other Fuels | 153 (1.9%) | 69 (2.2%) |
| No Fuel Used | 27 (0.3%) | 58 (1.9%) |
| Total | 8,239 (100.0%) | 3,118 (100.0%) |
Household Vehicle Usage in Haralson County
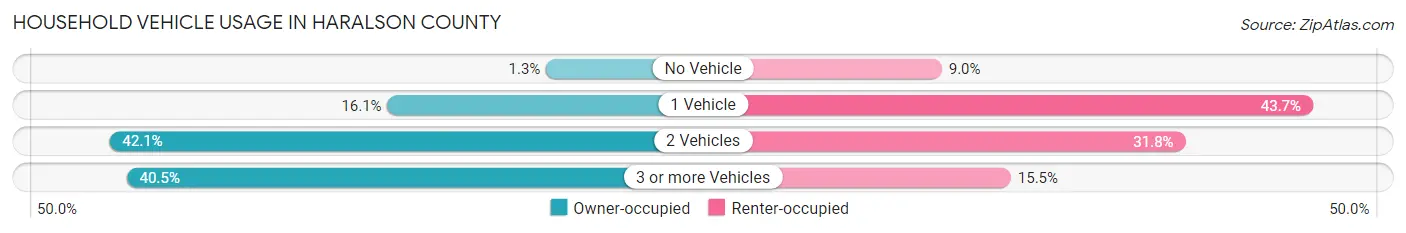
| Vehicles per Household | Owner-occupied | Renter-occupied |
| No Vehicle | 108 (1.3%) | 282 (9.0%) |
| 1 Vehicle | 1,329 (16.1%) | 1,362 (43.7%) |
| 2 Vehicles | 3,467 (42.1%) | 991 (31.8%) |
| 3 or more Vehicles | 3,335 (40.5%) | 483 (15.5%) |
| Total | 8,239 (100.0%) | 3,118 (100.0%) |
Real Estate & Mortgages in Haralson County
Real Estate and Mortgage Overview in Haralson County
| Characteristic | Without Mortgage | With Mortgage |
| Housing Units | 3,860 | 4,379 |
| Median Property Value | $152,000 | $227,200 |
| Median Household Income | $58,942 | $1,205 |
| Monthly Housing Costs | $510 | $390 |
| Real Estate Taxes | $1,445 | $115 |
Property Value by Mortgage Status in Haralson County
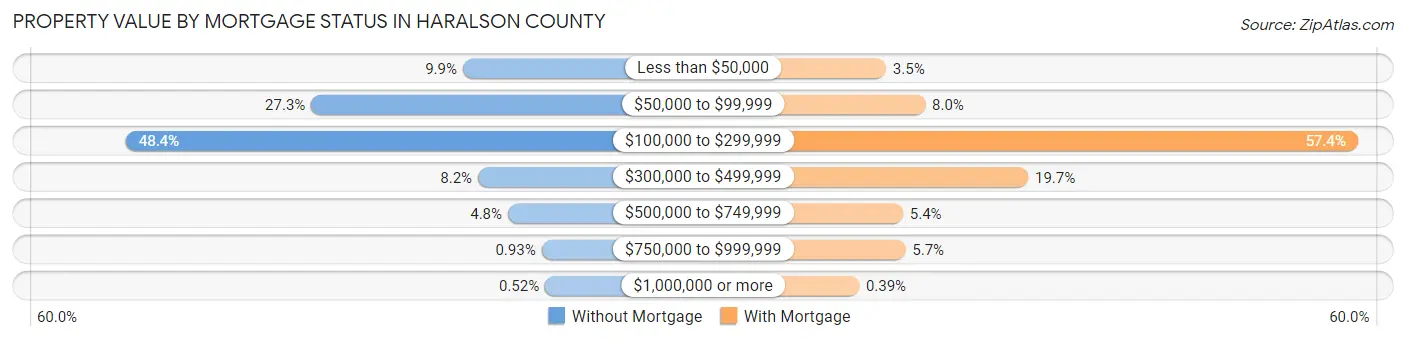
| Property Value | Without Mortgage | With Mortgage |
| Less than $50,000 | 383 (9.9%) | 152 (3.5%) |
| $50,000 to $99,999 | 1,052 (27.3%) | 348 (8.0%) |
| $100,000 to $299,999 | 1,869 (48.4%) | 2,513 (57.4%) |
| $300,000 to $499,999 | 316 (8.2%) | 863 (19.7%) |
| $500,000 to $749,999 | 184 (4.8%) | 237 (5.4%) |
| $750,000 to $999,999 | 36 (0.9%) | 249 (5.7%) |
| $1,000,000 or more | 20 (0.5%) | 17 (0.4%) |
| Total | 3,860 (100.0%) | 4,379 (100.0%) |
Household Income by Mortgage Status in Haralson County
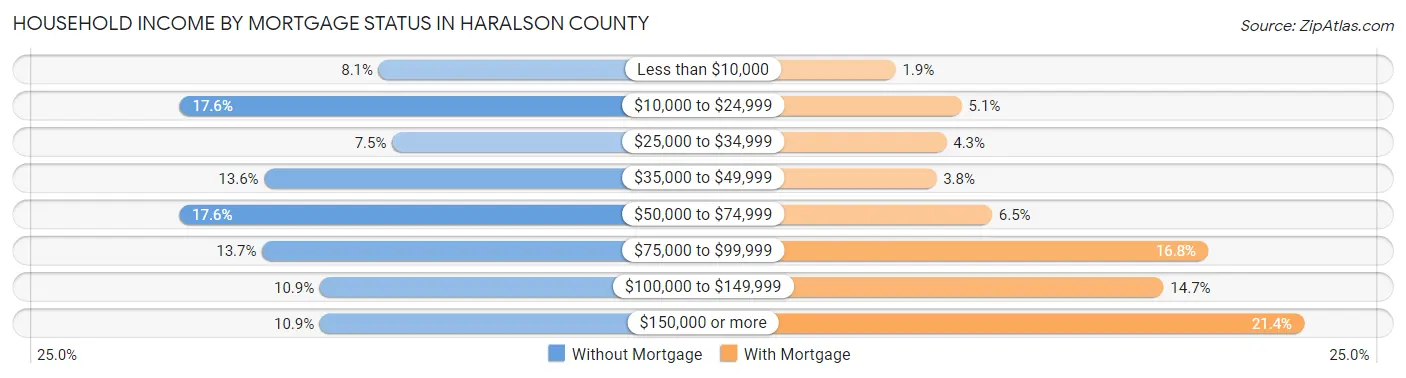
| Household Income | Without Mortgage | With Mortgage |
| Less than $10,000 | 314 (8.1%) | 83 (1.9%) |
| $10,000 to $24,999 | 680 (17.6%) | 221 (5.1%) |
| $25,000 to $34,999 | 289 (7.5%) | 189 (4.3%) |
| $35,000 to $49,999 | 524 (13.6%) | 168 (3.8%) |
| $50,000 to $74,999 | 681 (17.6%) | 284 (6.5%) |
| $75,000 to $99,999 | 528 (13.7%) | 735 (16.8%) |
| $100,000 to $149,999 | 422 (10.9%) | 642 (14.7%) |
| $150,000 or more | 422 (10.9%) | 935 (21.3%) |
| Total | 3,860 (100.0%) | 4,379 (100.0%) |
Property Value to Household Income Ratio in Haralson County
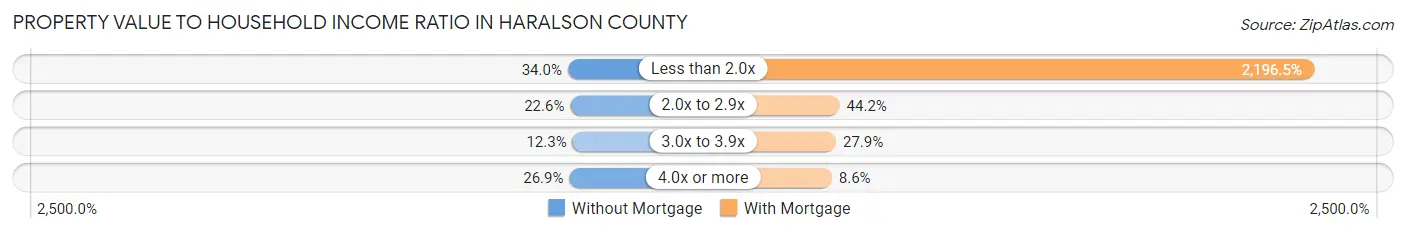
| Value-to-Income Ratio | Without Mortgage | With Mortgage |
| Less than 2.0x | 1,314 (34.0%) | 96,186 (2,196.5%) |
| 2.0x to 2.9x | 871 (22.6%) | 1,934 (44.2%) |
| 3.0x to 3.9x | 476 (12.3%) | 1,220 (27.9%) |
| 4.0x or more | 1,039 (26.9%) | 377 (8.6%) |
| Total | 3,860 (100.0%) | 4,379 (100.0%) |
Real Estate Taxes by Mortgage Status in Haralson County
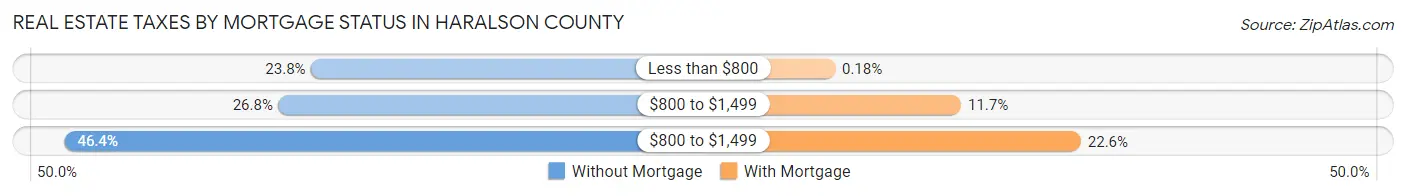
| Property Taxes | Without Mortgage | With Mortgage |
| Less than $800 | 919 (23.8%) | 8 (0.2%) |
| $800 to $1,499 | 1,034 (26.8%) | 512 (11.7%) |
| $800 to $1,499 | 1,789 (46.4%) | 991 (22.6%) |
| Total | 3,860 (100.0%) | 4,379 (100.0%) |
Health & Disability in Haralson County
Health Insurance Coverage by Age in Haralson County
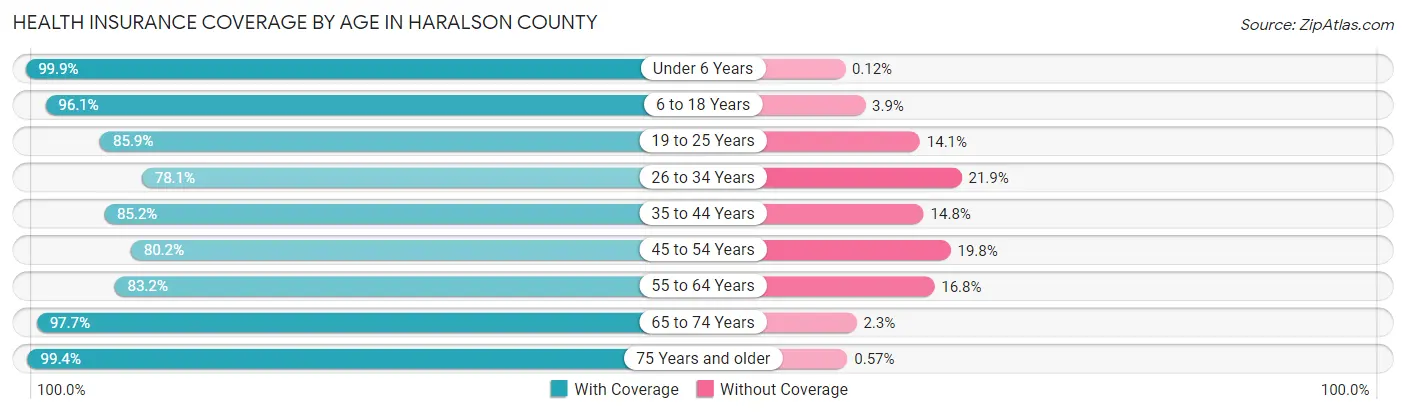
| Age Bracket | With Coverage | Without Coverage |
| Under 6 Years | 2,477 (99.9%) | 3 (0.1%) |
| 6 to 18 Years | 4,831 (96.1%) | 195 (3.9%) |
| 19 to 25 Years | 1,878 (85.9%) | 308 (14.1%) |
| 26 to 34 Years | 2,910 (78.1%) | 814 (21.9%) |
| 35 to 44 Years | 3,282 (85.2%) | 570 (14.8%) |
| 45 to 54 Years | 3,319 (80.2%) | 820 (19.8%) |
| 55 to 64 Years | 3,204 (83.2%) | 646 (16.8%) |
| 65 to 74 Years | 2,675 (97.7%) | 62 (2.3%) |
| 75 Years and older | 1,904 (99.4%) | 11 (0.6%) |
| Total | 26,480 (88.5%) | 3,429 (11.5%) |
Health Insurance Coverage by Citizenship Status in Haralson County
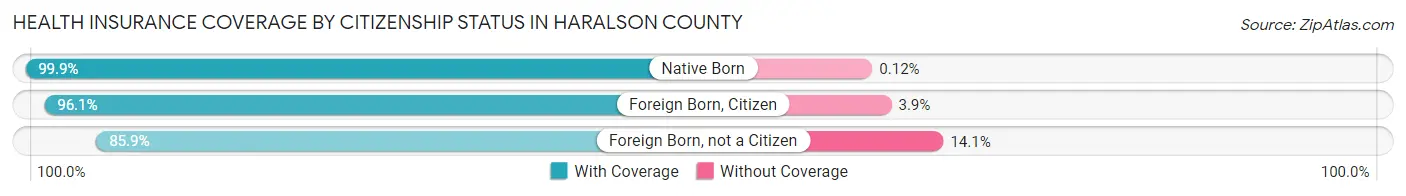
| Citizenship Status | With Coverage | Without Coverage |
| Native Born | 2,477 (99.9%) | 3 (0.1%) |
| Foreign Born, Citizen | 4,831 (96.1%) | 195 (3.9%) |
| Foreign Born, not a Citizen | 1,878 (85.9%) | 308 (14.1%) |
Health Insurance Coverage by Household Income in Haralson County
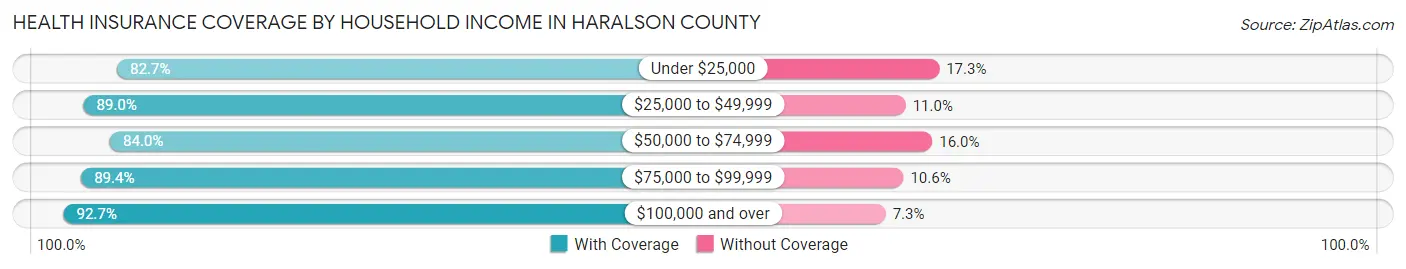
| Household Income | With Coverage | Without Coverage |
| Under $25,000 | 3,165 (82.7%) | 663 (17.3%) |
| $25,000 to $49,999 | 4,028 (89.0%) | 500 (11.0%) |
| $50,000 to $74,999 | 5,060 (84.0%) | 965 (16.0%) |
| $75,000 to $99,999 | 4,308 (89.4%) | 512 (10.6%) |
| $100,000 and over | 9,892 (92.7%) | 779 (7.3%) |
Public vs Private Health Insurance Coverage by Age in Haralson County
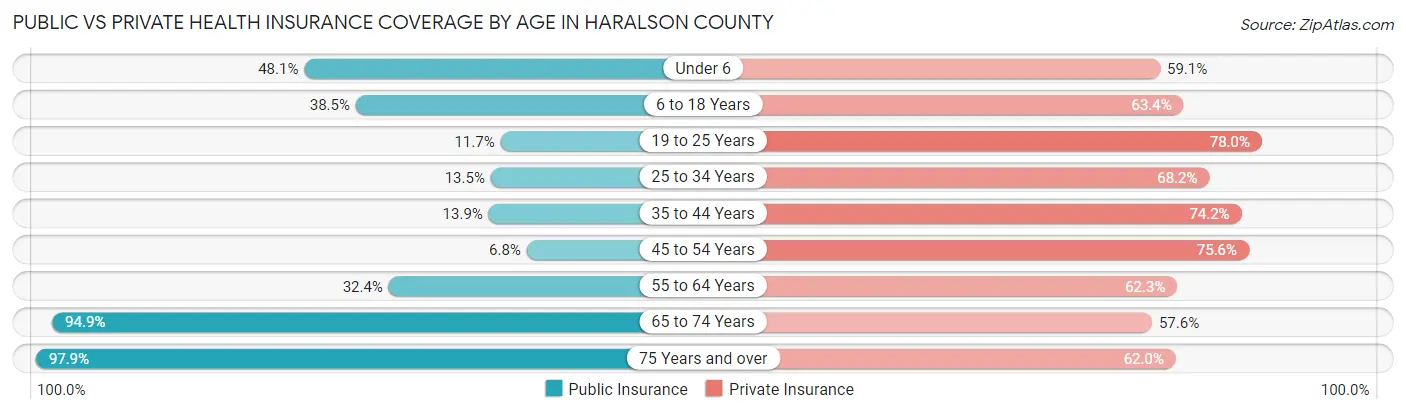
| Age Bracket | Public Insurance | Private Insurance |
| Under 6 | 1,193 (48.1%) | 1,465 (59.1%) |
| 6 to 18 Years | 1,936 (38.5%) | 3,188 (63.4%) |
| 19 to 25 Years | 255 (11.7%) | 1,704 (77.9%) |
| 25 to 34 Years | 502 (13.5%) | 2,540 (68.2%) |
| 35 to 44 Years | 534 (13.9%) | 2,857 (74.2%) |
| 45 to 54 Years | 282 (6.8%) | 3,127 (75.5%) |
| 55 to 64 Years | 1,248 (32.4%) | 2,397 (62.3%) |
| 65 to 74 Years | 2,597 (94.9%) | 1,576 (57.6%) |
| 75 Years and over | 1,875 (97.9%) | 1,187 (62.0%) |
| Total | 10,422 (34.8%) | 20,041 (67.0%) |
Disability Status by Sex by Age in Haralson County
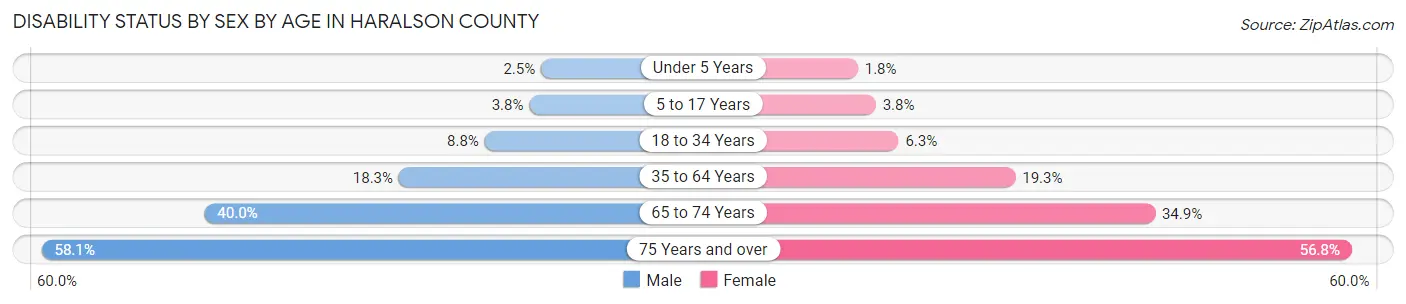
| Age Bracket | Male | Female |
| Under 5 Years | 25 (2.5%) | 16 (1.8%) |
| 5 to 17 Years | 100 (3.8%) | 99 (3.8%) |
| 18 to 34 Years | 277 (8.8%) | 195 (6.3%) |
| 35 to 64 Years | 1,075 (18.3%) | 1,154 (19.3%) |
| 65 to 74 Years | 482 (40.0%) | 534 (34.9%) |
| 75 Years and over | 505 (58.1%) | 594 (56.8%) |
Disability Class by Sex by Age in Haralson County
Disability Class: Hearing Difficulty
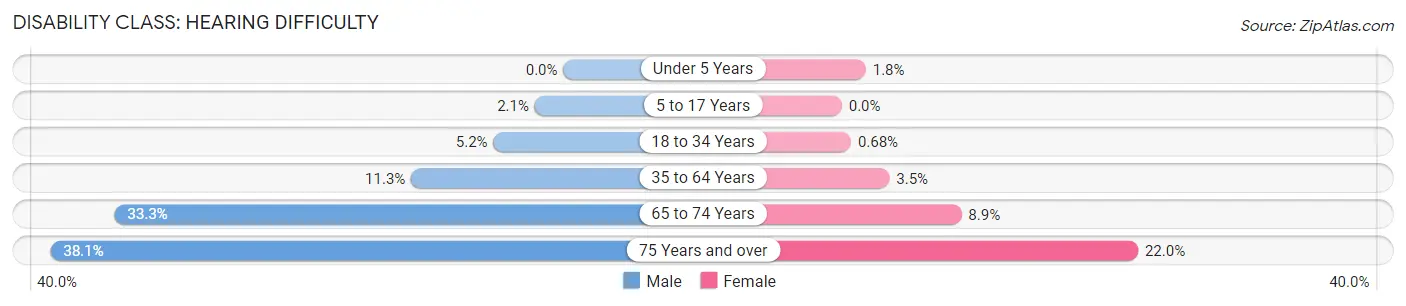
| Age Bracket | Male | Female |
| Under 5 Years | 0 (0.0%) | 16 (1.8%) |
| 5 to 17 Years | 56 (2.1%) | 0 (0.0%) |
| 18 to 34 Years | 164 (5.2%) | 21 (0.7%) |
| 35 to 64 Years | 663 (11.3%) | 211 (3.5%) |
| 65 to 74 Years | 402 (33.3%) | 136 (8.9%) |
| 75 Years and over | 331 (38.1%) | 230 (22.0%) |
Disability Class: Vision Difficulty
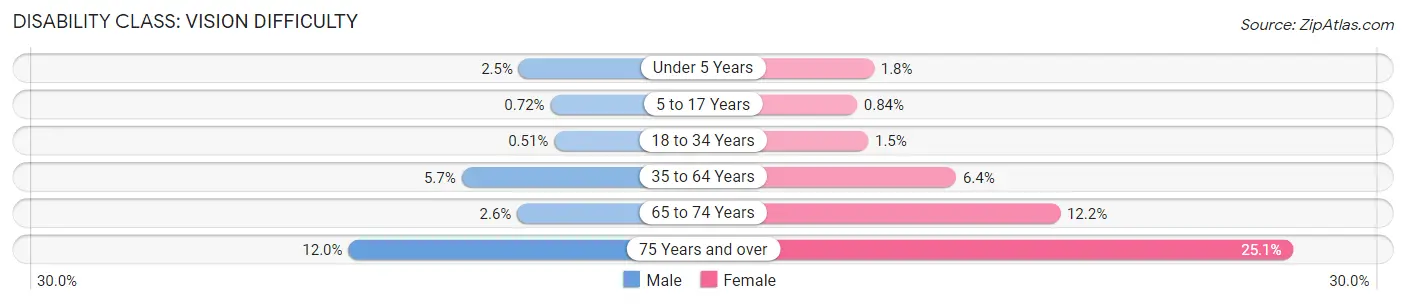
| Age Bracket | Male | Female |
| Under 5 Years | 25 (2.5%) | 16 (1.8%) |
| 5 to 17 Years | 19 (0.7%) | 22 (0.8%) |
| 18 to 34 Years | 16 (0.5%) | 45 (1.5%) |
| 35 to 64 Years | 333 (5.7%) | 380 (6.4%) |
| 65 to 74 Years | 31 (2.6%) | 186 (12.1%) |
| 75 Years and over | 104 (12.0%) | 263 (25.1%) |
Disability Class: Cognitive Difficulty
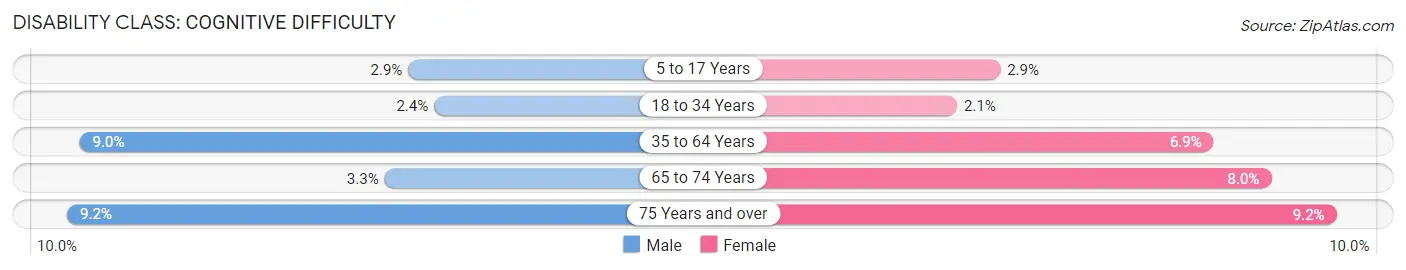
| Age Bracket | Male | Female |
| 5 to 17 Years | 76 (2.9%) | 77 (2.9%) |
| 18 to 34 Years | 76 (2.4%) | 66 (2.1%) |
| 35 to 64 Years | 527 (9.0%) | 412 (6.9%) |
| 65 to 74 Years | 40 (3.3%) | 122 (8.0%) |
| 75 Years and over | 80 (9.2%) | 96 (9.2%) |
Disability Class: Ambulatory Difficulty
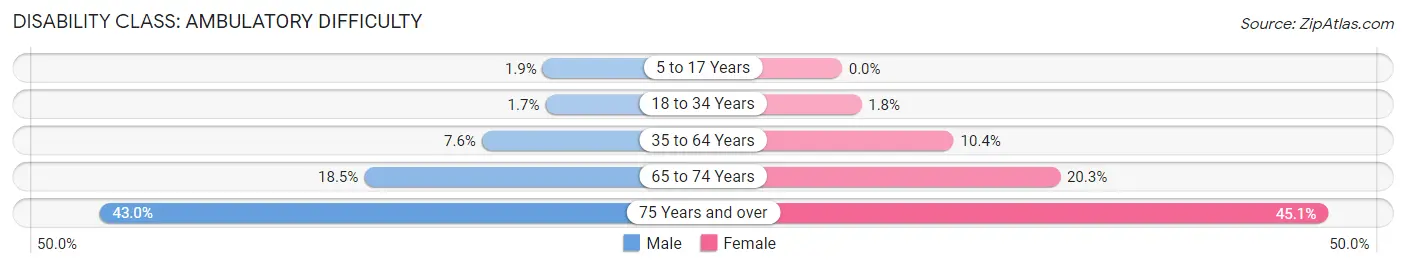
| Age Bracket | Male | Female |
| 5 to 17 Years | 51 (1.9%) | 0 (0.0%) |
| 18 to 34 Years | 53 (1.7%) | 56 (1.8%) |
| 35 to 64 Years | 445 (7.6%) | 620 (10.4%) |
| 65 to 74 Years | 223 (18.5%) | 310 (20.3%) |
| 75 Years and over | 374 (43.0%) | 472 (45.1%) |
Disability Class: Self-Care Difficulty
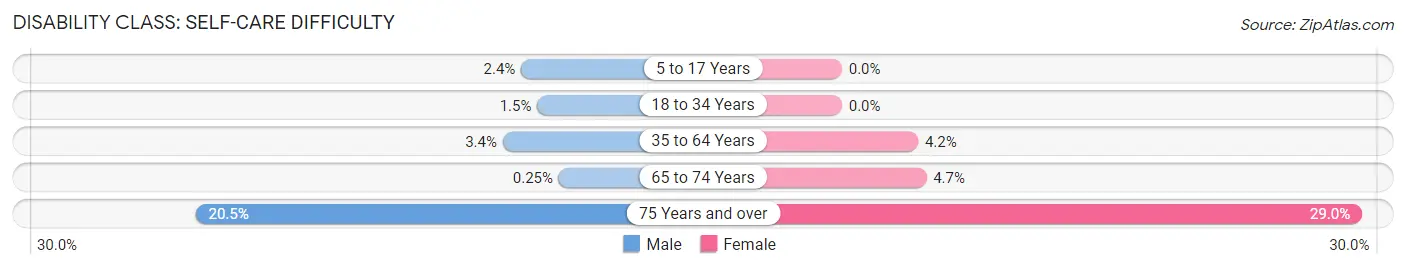
| Age Bracket | Male | Female |
| 5 to 17 Years | 62 (2.4%) | 0 (0.0%) |
| 18 to 34 Years | 46 (1.5%) | 0 (0.0%) |
| 35 to 64 Years | 198 (3.4%) | 253 (4.2%) |
| 65 to 74 Years | 3 (0.3%) | 72 (4.7%) |
| 75 Years and over | 178 (20.5%) | 303 (29.0%) |
Technology Access in Haralson County
Computing Device Access in Haralson County
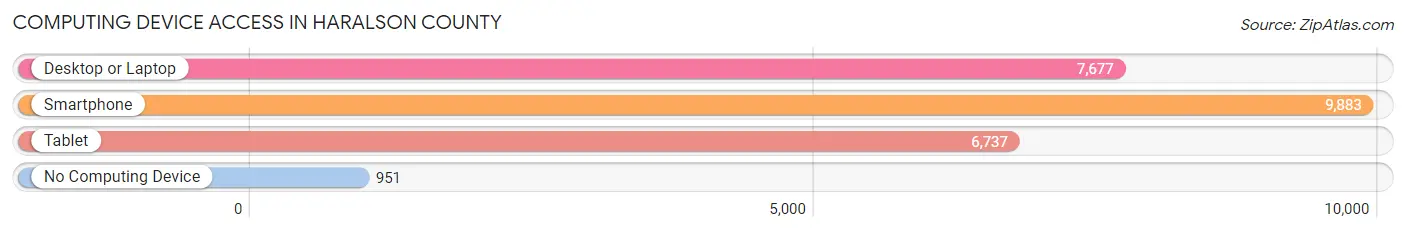
| Device Type | # Households | % Households |
| Desktop or Laptop | 7,677 | 67.6% |
| Smartphone | 9,883 | 87.0% |
| Tablet | 6,737 | 59.3% |
| No Computing Device | 951 | 8.4% |
| Total | 11,357 | 100.0% |
Internet Access in Haralson County
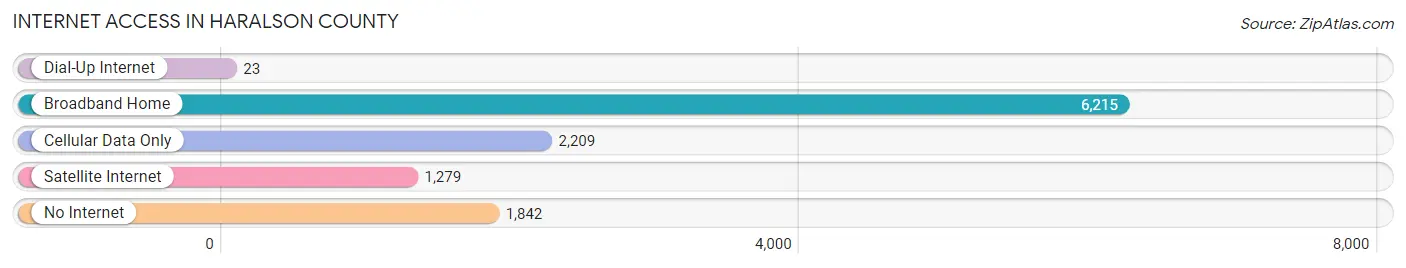
| Internet Type | # Households | % Households |
| Dial-Up Internet | 23 | 0.2% |
| Broadband Home | 6,215 | 54.7% |
| Cellular Data Only | 2,209 | 19.5% |
| Satellite Internet | 1,279 | 11.3% |
| No Internet | 1,842 | 16.2% |
| Total | 11,357 | 100.0% |
Haralson County Summary
Haralson County is located in the northwestern part of the state of Georgia, in the foothills of the Appalachian Mountains. It is bordered by Polk County to the north, Carroll County to the east, Paulding County to the south, and Heard County to the west. The county seat is Buchanan, and the county has a total area of 441 square miles.
History
Haralson County was created in 1856 from parts of Carroll and Polk counties. It was named for Hugh A. Haralson, a former Georgia congressman and state senator. The county was originally part of the Cherokee Nation, and the area was home to several Native American tribes.
The first settlers in the area were mostly farmers, and the county was largely agricultural until the late 19th century. The county was home to several small towns, including Buchanan, Tallapoosa, and Waco. The county was also home to several small industries, including sawmills, gristmills, and cotton gins.
Geography
Haralson County is located in the foothills of the Appalachian Mountains. The county is mostly rural, with rolling hills and valleys. The county is home to several small rivers, including the Tallapoosa River, the Waco Creek, and the Little Tallapoosa River. The county is also home to several small lakes, including Lake Haralson and Lake Waco.
The county is mostly forested, with pine and hardwood trees. The county is also home to several wildlife preserves, including the Haralson County Wildlife Management Area and the Tallapoosa Wildlife Management Area.
Economy
The economy of Haralson County is largely based on agriculture. The county is home to several large farms, and the main crops grown in the county are corn, soybeans, cotton, and peanuts. The county is also home to several small businesses, including sawmills, gristmills, and cotton gins.
The county is also home to several manufacturing companies, including a furniture factory, a textile mill, and a plastics factory. The county is also home to several small retail stores, including grocery stores, hardware stores, and clothing stores.
Demographics
As of the 2010 census, the population of Haralson County was 28,780. The population is mostly white (90.3%), with small percentages of African Americans (7.2%), Hispanics (1.3%), and Asians (0.7%). The median household income in the county is $41,945, and the median home value is $117,400.
The county is home to several small towns, including Buchanan, Tallapoosa, and Waco. The county is also home to several small unincorporated communities, including Bremen, Felton, and Waco. The county is served by several school districts, including the Haralson County School District, the Tallapoosa City School District, and the Waco City School District.
Common Questions
What is Per Capita Income in Haralson County?
Per Capita income in Haralson County is $31,342.
What is the Median Family Income in Haralson County?
Median Family Income in Haralson County is $78,070.
What is the Median Household income in Haralson County?
Median Household Income in Haralson County is $65,940.
What is Income or Wage Gap in Haralson County?
Income or Wage Gap in Haralson County is 33.6%.
Women in Haralson County earn 66.4 cents for every dollar earned by a man.
What is Family Income Deficit in Haralson County?
Family Income Deficit in Haralson County is $13,679.
Families that are below poverty line in Haralson County earn $13,679 less on average than the poverty threshold level.
What is Inequality or Gini Index in Haralson County?
Inequality or Gini Index in Haralson County is 0.43.
What is the Total Population of Haralson County?
Total Population of Haralson County is 30,178.
What is the Total Male Population of Haralson County?
Total Male Population of Haralson County is 14,860.
What is the Total Female Population of Haralson County?
Total Female Population of Haralson County is 15,318.
What is the Ratio of Males per 100 Females in Haralson County?
There are 97.01 Males per 100 Females in Haralson County.
What is the Ratio of Females per 100 Males in Haralson County?
There are 103.08 Females per 100 Males in Haralson County.
What is the Median Population Age in Haralson County?
Median Population Age in Haralson County is 39.2 Years.
What is the Average Family Size in Haralson County
Average Family Size in Haralson County is 3.1 People.
What is the Average Household Size in Haralson County
Average Household Size in Haralson County is 2.6 People.
How Large is the Labor Force in Haralson County?
There are 14,699 People in the Labor Forcein in Haralson County.
What is the Percentage of People in the Labor Force in Haralson County?
61.6% of People are in the Labor Force in Haralson County.
What is the Unemployment Rate in Haralson County?
Unemployment Rate in Haralson County is 4.4%.