Gilmer County, GA Map & Demographics
Gilmer County Overview
$34,412
PER CAPITA INCOME
$78,531
AVG FAMILY INCOME
$70,334
AVG HOUSEHOLD INCOME
28.4%
WAGE / INCOME GAP [ % ]
71.6¢/ $1
WAGE / INCOME GAP [ $ ]
$9,351
FAMILY INCOME DEFICIT
0.44
INEQUALITY / GINI INDEX
31,519
TOTAL POPULATION
15,692
MALE POPULATION
15,827
FEMALE POPULATION
99.15
MALES / 100 FEMALES
100.86
FEMALES / 100 MALES
49.6
MEDIAN AGE
2.9
AVG FAMILY SIZE
2.4
AVG HOUSEHOLD SIZE
13,909
LABOR FORCE [ PEOPLE ]
53.2%
PERCENT IN LABOR FORCE
2.4%
UNEMPLOYMENT RATE
Income in Gilmer County
Income Overview in Gilmer County
Per Capita Income in Gilmer County is $34,412, while median incomes of families and households are $78,531 and $70,334 respectively.
| Characteristic | Number | Measure |
| Per Capita Income | 31,519 | $34,412 |
| Median Family Income | 8,970 | $78,531 |
| Mean Family Income | 8,970 | $96,176 |
| Median Household Income | 12,868 | $70,334 |
| Mean Household Income | 12,868 | $83,115 |
| Income Deficit | 8,970 | $9,351 |
| Wage / Income Gap (%) | 31,519 | 28.44% |
| Wage / Income Gap ($) | 31,519 | 71.56¢ per $1 |
| Gini / Inequality Index | 31,519 | 0.44 |
Earnings by Sex in Gilmer County
Average Earnings in Gilmer County are $34,605, $41,184 for men and $29,472 for women, a difference of 28.4%.
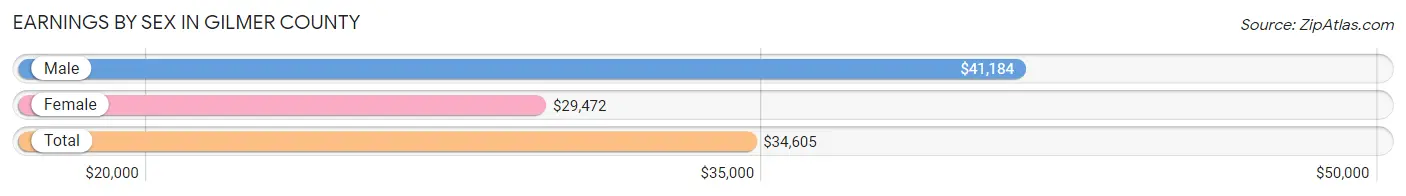
| Sex | Number | Average Earnings |
| Male | 8,179 (55.2%) | $41,184 |
| Female | 6,631 (44.8%) | $29,472 |
| Total | 14,810 (100.0%) | $34,605 |
Earnings by Sex by Income Bracket in Gilmer County
The most common earnings brackets in Gilmer County are $100,000+ for men (926 | 11.3%) and $25,000 to $29,999 for women (792 | 11.9%).
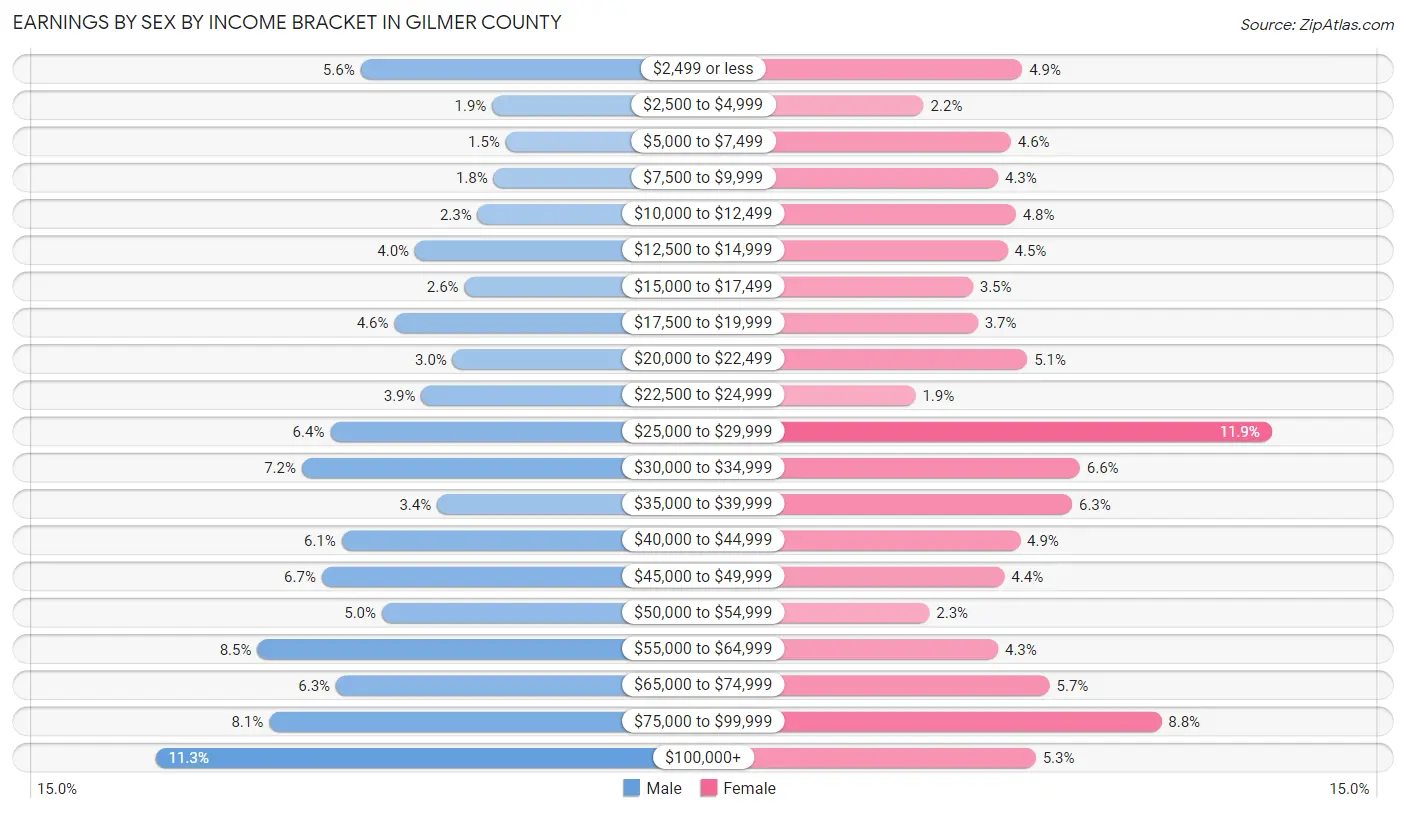
| Income | Male | Female |
| $2,499 or less | 455 (5.6%) | 327 (4.9%) |
| $2,500 to $4,999 | 152 (1.9%) | 143 (2.2%) |
| $5,000 to $7,499 | 121 (1.5%) | 306 (4.6%) |
| $7,500 to $9,999 | 149 (1.8%) | 282 (4.3%) |
| $10,000 to $12,499 | 186 (2.3%) | 315 (4.8%) |
| $12,500 to $14,999 | 330 (4.0%) | 300 (4.5%) |
| $15,000 to $17,499 | 216 (2.6%) | 235 (3.5%) |
| $17,500 to $19,999 | 377 (4.6%) | 244 (3.7%) |
| $20,000 to $22,499 | 243 (3.0%) | 336 (5.1%) |
| $22,500 to $24,999 | 315 (3.8%) | 128 (1.9%) |
| $25,000 to $29,999 | 524 (6.4%) | 792 (11.9%) |
| $30,000 to $34,999 | 590 (7.2%) | 434 (6.6%) |
| $35,000 to $39,999 | 279 (3.4%) | 420 (6.3%) |
| $40,000 to $44,999 | 498 (6.1%) | 323 (4.9%) |
| $45,000 to $49,999 | 544 (6.7%) | 294 (4.4%) |
| $50,000 to $54,999 | 406 (5.0%) | 154 (2.3%) |
| $55,000 to $64,999 | 692 (8.5%) | 282 (4.3%) |
| $65,000 to $74,999 | 511 (6.2%) | 378 (5.7%) |
| $75,000 to $99,999 | 665 (8.1%) | 586 (8.8%) |
| $100,000+ | 926 (11.3%) | 352 (5.3%) |
| Total | 8,179 (100.0%) | 6,631 (100.0%) |
Earnings by Sex by Educational Attainment in Gilmer County
Average earnings in Gilmer County are $44,226 for men and $34,446 for women, a difference of 22.1%. Men with an educational attainment of graduate degree enjoy the highest average annual earnings of $70,117, while those with less than high school education earn the least with $25,347. Women with an educational attainment of graduate degree earn the most with the average annual earnings of $70,966, while those with less than high school education have the smallest earnings of $18,571.
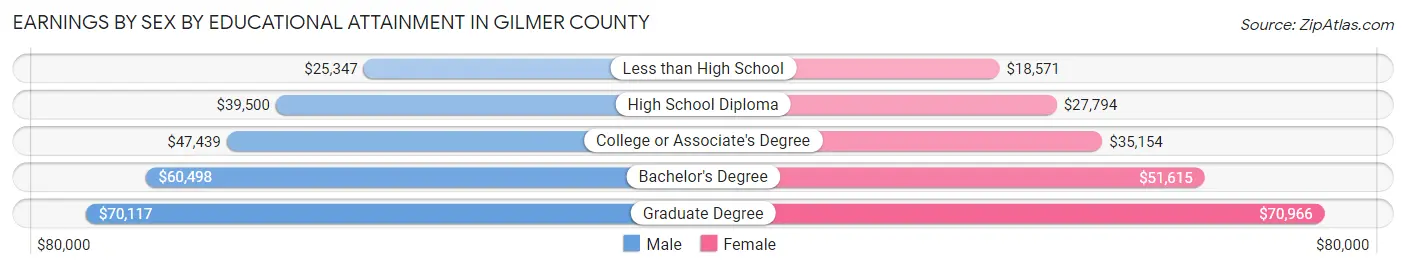
| Educational Attainment | Male Income | Female Income |
| Less than High School | $25,347 | $18,571 |
| High School Diploma | $39,500 | $27,794 |
| College or Associate's Degree | $47,439 | $35,154 |
| Bachelor's Degree | $60,498 | $51,615 |
| Graduate Degree | $70,117 | $70,966 |
| Total | $44,226 | $34,446 |
Family Income in Gilmer County
Family Income Brackets in Gilmer County
According to the Gilmer County family income data, there are 1,982 families falling into the $100,000 to $149,999 income range, which is the most common income bracket and makes up 22.1% of all families. Conversely, the less than $10,000 income bracket is the least frequent group with only 152 families (1.7%) belonging to this category.
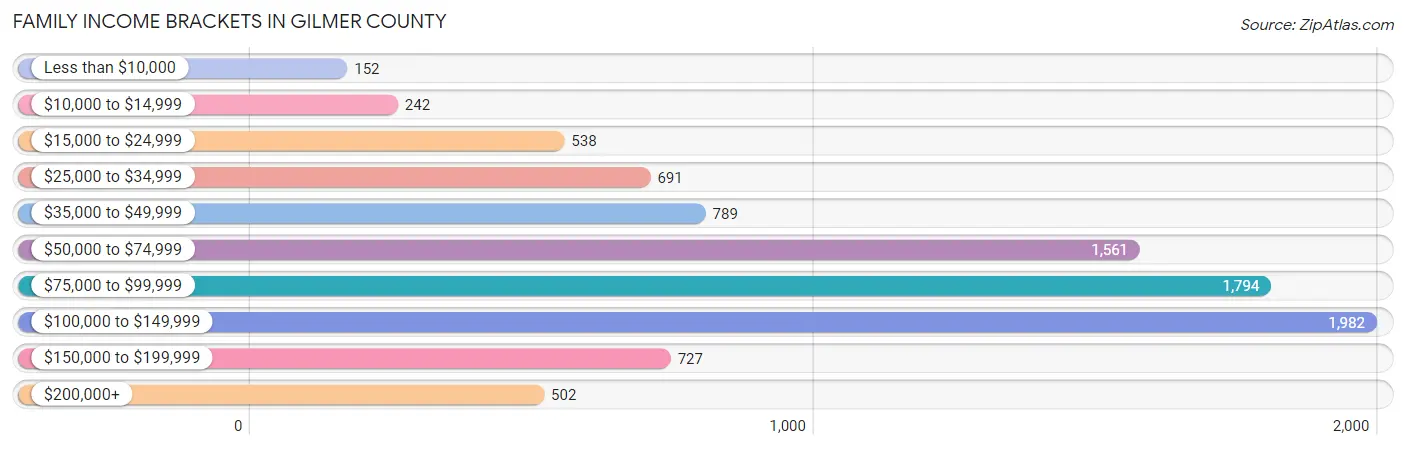
| Income Bracket | # Families | % Families |
| Less than $10,000 | 152 | 1.7% |
| $10,000 to $14,999 | 242 | 2.7% |
| $15,000 to $24,999 | 538 | 6.0% |
| $25,000 to $34,999 | 691 | 7.7% |
| $35,000 to $49,999 | 789 | 8.8% |
| $50,000 to $74,999 | 1,561 | 17.4% |
| $75,000 to $99,999 | 1,794 | 20.0% |
| $100,000 to $149,999 | 1,982 | 22.1% |
| $150,000 to $199,999 | 727 | 8.1% |
| $200,000+ | 502 | 5.6% |
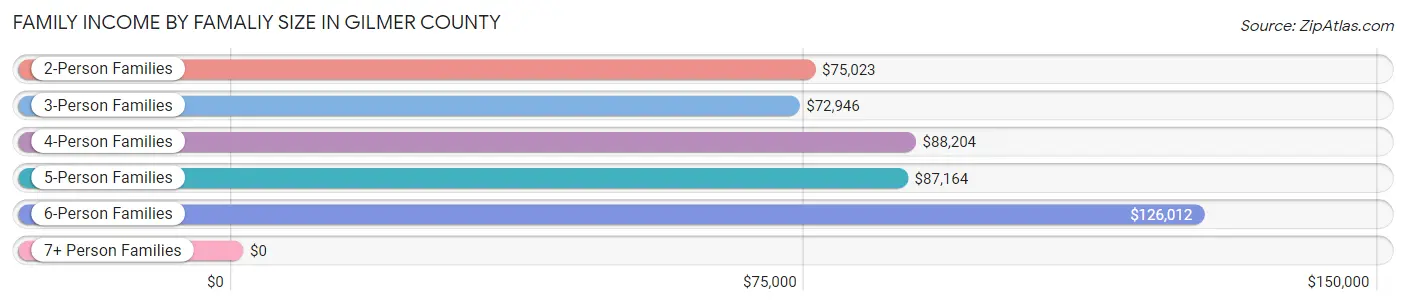
Family Income by Famaliy Size in Gilmer County
6-person families (315 | 3.5%) account for the highest median family income in Gilmer County with $126,012 per family, while 2-person families (5,377 | 59.9%) have the highest median income of $37,512 per family member.
| Income Bracket | # Families | Median Income |
| 2-Person Families | 5,377 (59.9%) | $75,023 |
| 3-Person Families | 1,332 (14.8%) | $72,946 |
| 4-Person Families | 1,193 (13.3%) | $88,204 |
| 5-Person Families | 547 (6.1%) | $87,164 |
| 6-Person Families | 315 (3.5%) | $126,012 |
| 7+ Person Families | 206 (2.3%) | $0 |
| Total | 8,970 (100.0%) | $78,531 |
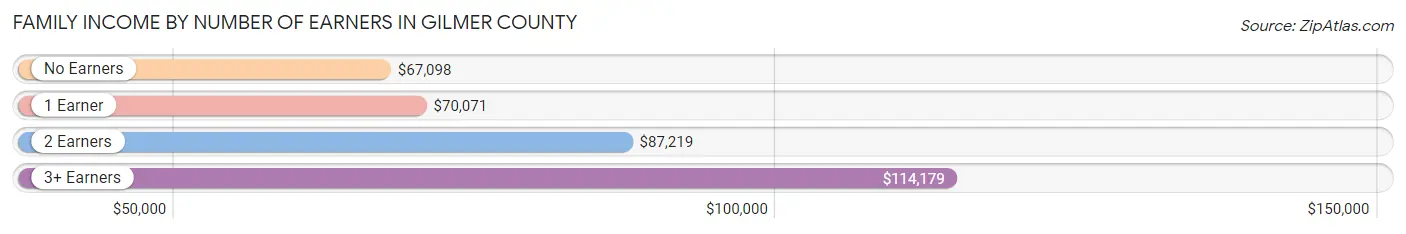
Family Income by Number of Earners in Gilmer County
The median family income in Gilmer County is $78,531, with families comprising 3+ earners (1,187) having the highest median family income of $114,179, while families with no earners (2,349) have the lowest median family income of $67,098, accounting for 13.2% and 26.2% of families, respectively.
| Number of Earners | # Families | Median Income |
| No Earners | 2,349 (26.2%) | $67,098 |
| 1 Earner | 2,819 (31.4%) | $70,071 |
| 2 Earners | 2,615 (29.1%) | $87,219 |
| 3+ Earners | 1,187 (13.2%) | $114,179 |
| Total | 8,970 (100.0%) | $78,531 |
Household Income in Gilmer County
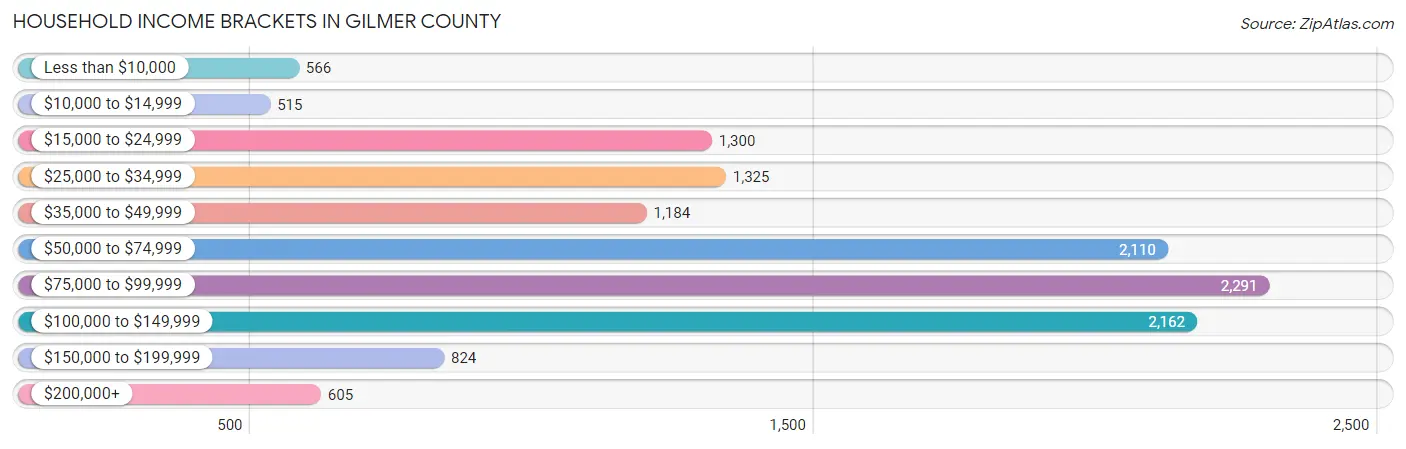
Household Income Brackets in Gilmer County
With 2,291 households falling in the category, the $75,000 to $99,999 income range is the most frequent in Gilmer County, accounting for 17.8% of all households. In contrast, only 515 households (4.0%) fall into the $10,000 to $14,999 income bracket, making it the least populous group.
| Income Bracket | # Households | % Households |
| Less than $10,000 | 566 | 4.4% |
| $10,000 to $14,999 | 515 | 4.0% |
| $15,000 to $24,999 | 1,300 | 10.1% |
| $25,000 to $34,999 | 1,325 | 10.3% |
| $35,000 to $49,999 | 1,184 | 9.2% |
| $50,000 to $74,999 | 2,110 | 16.4% |
| $75,000 to $99,999 | 2,291 | 17.8% |
| $100,000 to $149,999 | 2,162 | 16.8% |
| $150,000 to $199,999 | 824 | 6.4% |
| $200,000+ | 605 | 4.7% |
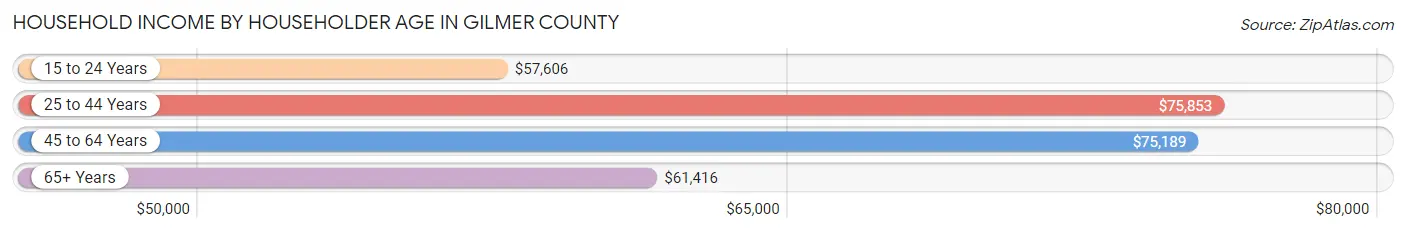
Household Income by Householder Age in Gilmer County
The median household income in Gilmer County is $70,334, with the highest median household income of $75,853 found in the 25 to 44 years age bracket for the primary householder. A total of 2,955 households (23.0%) fall into this category. Meanwhile, the 15 to 24 years age bracket for the primary householder has the lowest median household income of $57,606, with 204 households (1.6%) in this group.
| Income Bracket | # Households | Median Income |
| 15 to 24 Years | 204 (1.6%) | $57,606 |
| 25 to 44 Years | 2,955 (23.0%) | $75,853 |
| 45 to 64 Years | 5,027 (39.1%) | $75,189 |
| 65+ Years | 4,682 (36.4%) | $61,416 |
| Total | 12,868 (100.0%) | $70,334 |
Poverty in Gilmer County
Income Below Poverty by Sex and Age in Gilmer County
With 14.8% poverty level for males and 14.9% for females among the residents of Gilmer County, 5 year old males and 12 to 14 year old females are the most vulnerable to poverty, with 93 males (56.7%) and 224 females (41.1%) in their respective age groups living below the poverty level.
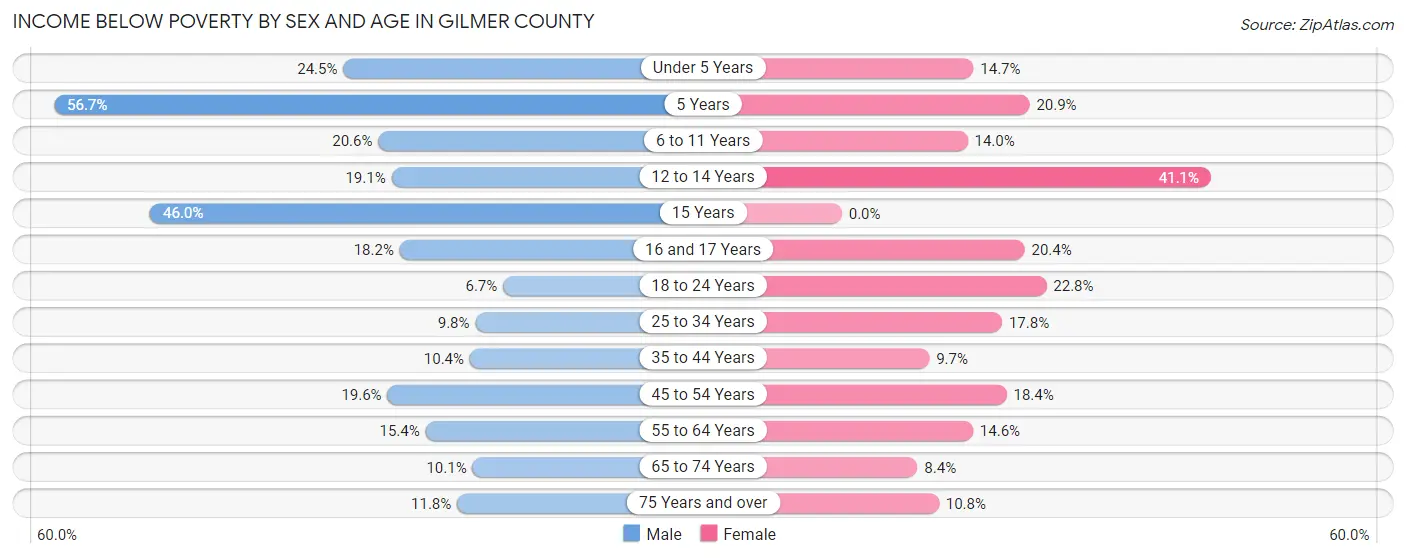
| Age Bracket | Male | Female |
| Under 5 Years | 138 (24.5%) | 131 (14.6%) |
| 5 Years | 93 (56.7%) | 37 (20.9%) |
| 6 to 11 Years | 244 (20.6%) | 119 (14.0%) |
| 12 to 14 Years | 80 (19.1%) | 224 (41.1%) |
| 15 Years | 104 (46.0%) | 0 (0.0%) |
| 16 and 17 Years | 39 (18.2%) | 70 (20.3%) |
| 18 to 24 Years | 70 (6.7%) | 246 (22.8%) |
| 25 to 34 Years | 159 (9.8%) | 236 (17.8%) |
| 35 to 44 Years | 178 (10.4%) | 149 (9.7%) |
| 45 to 54 Years | 373 (19.6%) | 359 (18.3%) |
| 55 to 64 Years | 400 (15.3%) | 381 (14.6%) |
| 65 to 74 Years | 252 (10.1%) | 221 (8.4%) |
| 75 Years and over | 164 (11.8%) | 167 (10.8%) |
| Total | 2,294 (14.8%) | 2,340 (14.9%) |
Income Above Poverty by Sex and Age in Gilmer County
According to the poverty statistics in Gilmer County, males aged 18 to 24 years and females aged 15 years are the age groups that are most secure financially, with 93.3% of males and 100.0% of females in these age groups living above the poverty line.
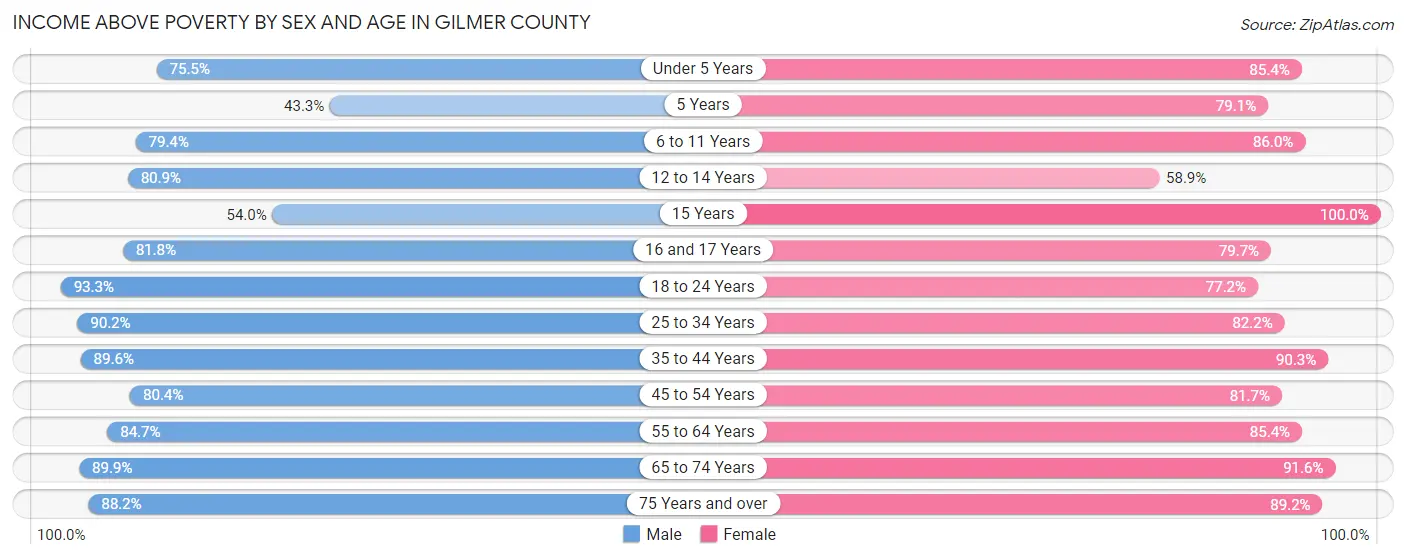
| Age Bracket | Male | Female |
| Under 5 Years | 425 (75.5%) | 763 (85.4%) |
| 5 Years | 71 (43.3%) | 140 (79.1%) |
| 6 to 11 Years | 940 (79.4%) | 731 (86.0%) |
| 12 to 14 Years | 338 (80.9%) | 321 (58.9%) |
| 15 Years | 122 (54.0%) | 220 (100.0%) |
| 16 and 17 Years | 175 (81.8%) | 274 (79.6%) |
| 18 to 24 Years | 973 (93.3%) | 834 (77.2%) |
| 25 to 34 Years | 1,463 (90.2%) | 1,087 (82.2%) |
| 35 to 44 Years | 1,532 (89.6%) | 1,380 (90.3%) |
| 45 to 54 Years | 1,531 (80.4%) | 1,597 (81.7%) |
| 55 to 64 Years | 2,206 (84.7%) | 2,229 (85.4%) |
| 65 to 74 Years | 2,239 (89.9%) | 2,404 (91.6%) |
| 75 Years and over | 1,222 (88.2%) | 1,379 (89.2%) |
| Total | 13,237 (85.2%) | 13,359 (85.1%) |
Income Below Poverty Among Married-Couple Families in Gilmer County
The poverty statistics for married-couple families in Gilmer County show that 4.2% or 297 of the total 7,028 families live below the poverty line. Families with 3 or 4 children have the highest poverty rate of 27.2%, comprising of 90 families. On the other hand, families with 5 or more children have the lowest poverty rate of 2.0%, which includes 1 families.
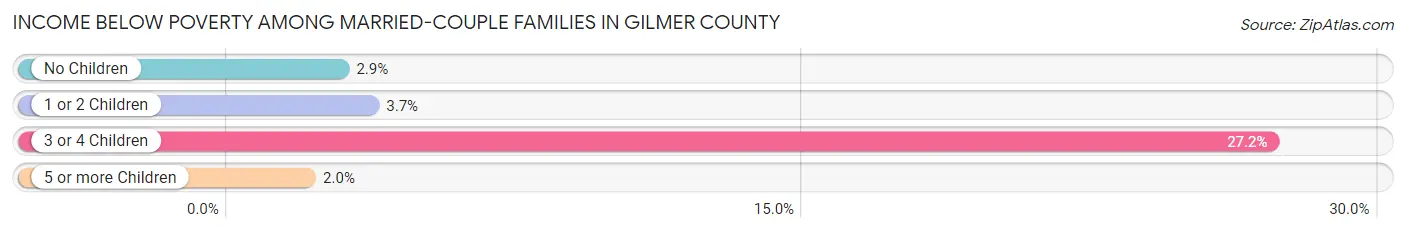
| Children | Above Poverty | Below Poverty |
| No Children | 4,875 (97.1%) | 146 (2.9%) |
| 1 or 2 Children | 1,567 (96.3%) | 60 (3.7%) |
| 3 or 4 Children | 241 (72.8%) | 90 (27.2%) |
| 5 or more Children | 48 (98.0%) | 1 (2.0%) |
| Total | 6,731 (95.8%) | 297 (4.2%) |
Income Below Poverty Among Single-Parent Households in Gilmer County
According to the poverty data in Gilmer County, 18.9% or 131 single-father households and 33.9% or 424 single-mother households are living below the poverty line. Among single-father households, those with 3 or 4 children have the highest poverty rate, with 8 households (50.0%) experiencing poverty. Likewise, among single-mother households, those with 5 or more children have the highest poverty rate, with 26 households (100.0%) falling below the poverty line.
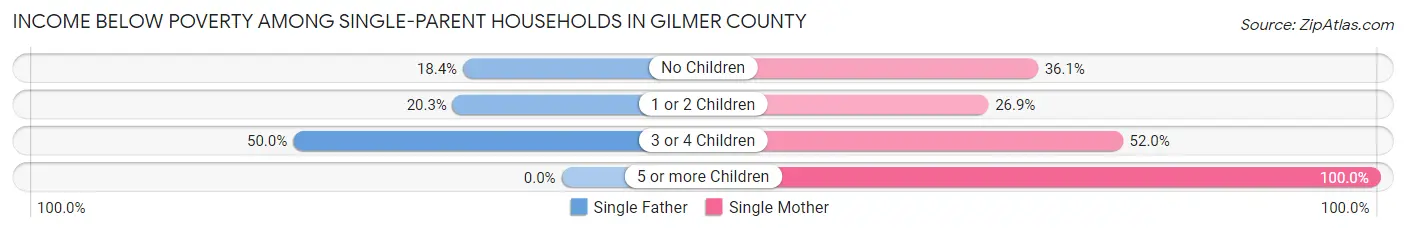
| Children | Single Father | Single Mother |
| No Children | 60 (18.3%) | 193 (36.1%) |
| 1 or 2 Children | 63 (20.3%) | 165 (26.9%) |
| 3 or 4 Children | 8 (50.0%) | 40 (51.9%) |
| 5 or more Children | 0 (0.0%) | 26 (100.0%) |
| Total | 131 (18.9%) | 424 (33.9%) |
Income Below Poverty Among Married-Couple vs Single-Parent Households in Gilmer County
The poverty data for Gilmer County shows that 297 of the married-couple family households (4.2%) and 555 of the single-parent households (28.6%) are living below the poverty level. Within the married-couple family households, those with 3 or 4 children have the highest poverty rate, with 90 households (27.2%) falling below the poverty line. Among the single-parent households, those with 3 or 4 children have the highest poverty rate, with 48 household (51.6%) living below poverty.
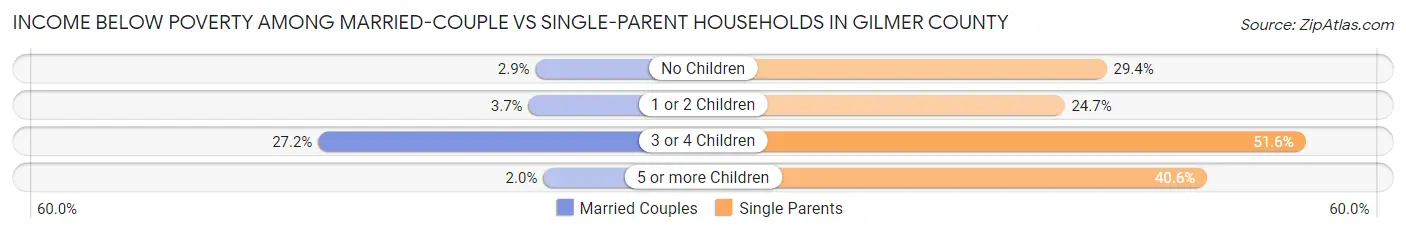
| Children | Married-Couple Families | Single-Parent Households |
| No Children | 146 (2.9%) | 253 (29.4%) |
| 1 or 2 Children | 60 (3.7%) | 228 (24.7%) |
| 3 or 4 Children | 90 (27.2%) | 48 (51.6%) |
| 5 or more Children | 1 (2.0%) | 26 (40.6%) |
| Total | 297 (4.2%) | 555 (28.6%) |
Race in Gilmer County
The most populous races in Gilmer County are White / Caucasian (28,345 | 89.9%), Hispanic or Latino (3,915 | 12.4%), and Two or more Races (1,593 | 5.1%).
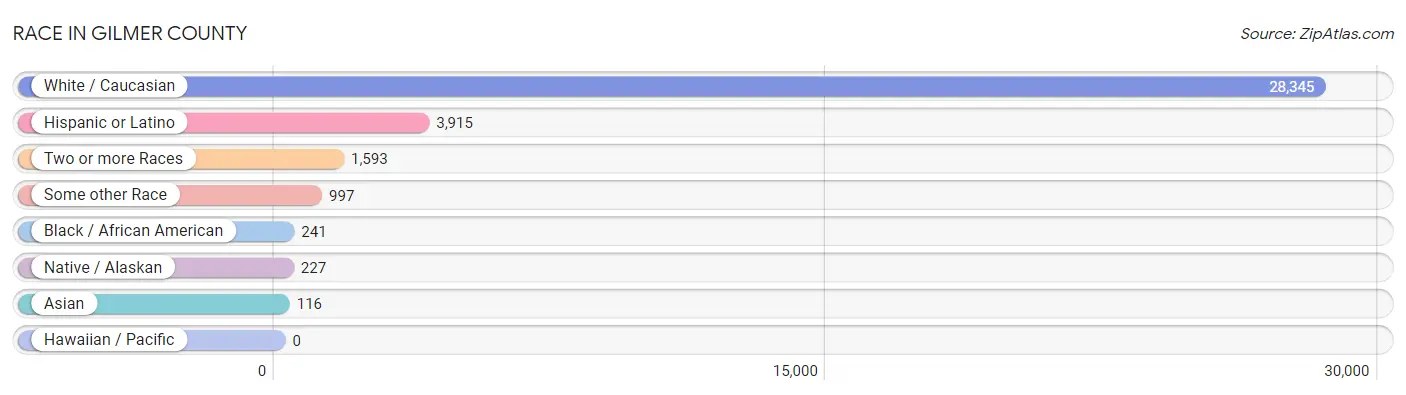
| Race | # Population | % Population |
| Asian | 116 | 0.4% |
| Black / African American | 241 | 0.8% |
| Hawaiian / Pacific | 0 | 0.0% |
| Hispanic or Latino | 3,915 | 12.4% |
| Native / Alaskan | 227 | 0.7% |
| White / Caucasian | 28,345 | 89.9% |
| Two or more Races | 1,593 | 5.1% |
| Some other Race | 997 | 3.2% |
| Total | 31,519 | 100.0% |
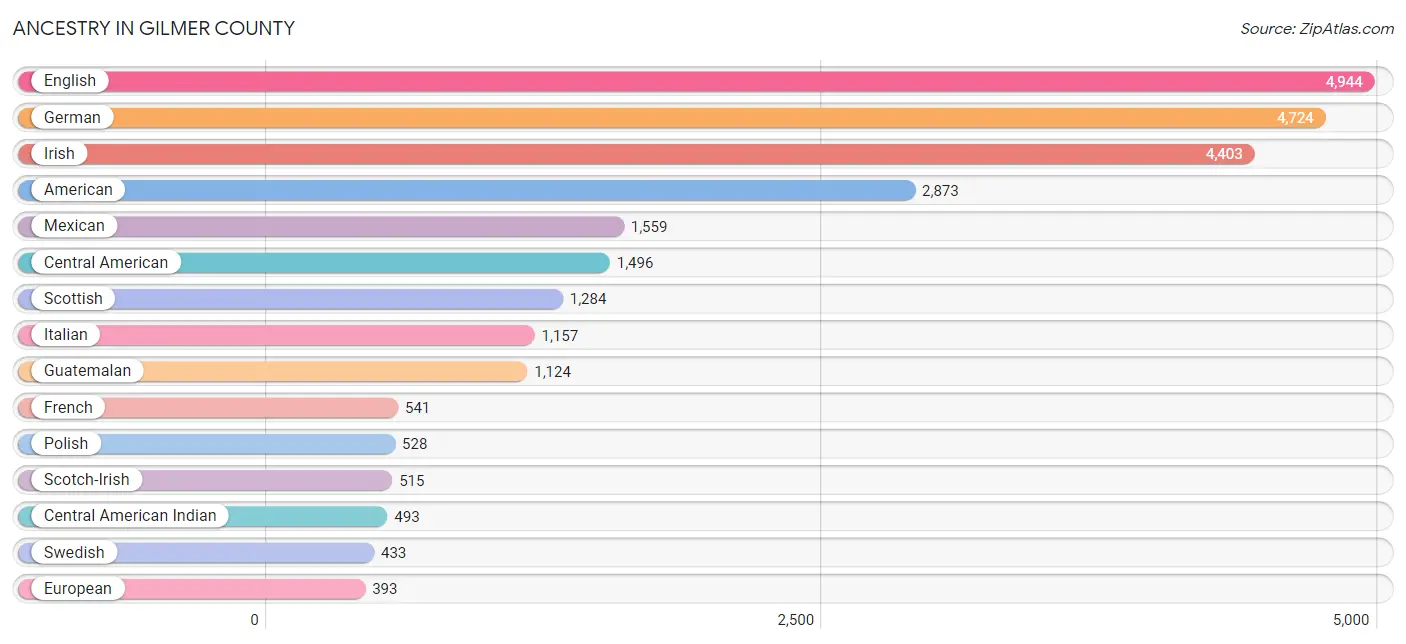
Ancestry in Gilmer County
The most populous ancestries reported in Gilmer County are English (4,944 | 15.7%), German (4,724 | 15.0%), Irish (4,403 | 14.0%), American (2,873 | 9.1%), and Mexican (1,559 | 5.0%), together accounting for 58.7% of all Gilmer County residents.
| Ancestry | # Population | % Population |
| American | 2,873 | 9.1% |
| Arab | 30 | 0.1% |
| Argentinean | 28 | 0.1% |
| Armenian | 28 | 0.1% |
| Assyrian / Chaldean / Syriac | 6 | 0.0% |
| Basque | 13 | 0.0% |
| Belgian | 17 | 0.1% |
| Bhutanese | 77 | 0.2% |
| Blackfeet | 10 | 0.0% |
| British | 273 | 0.9% |
| Cajun | 13 | 0.0% |
| Canadian | 25 | 0.1% |
| Central American | 1,496 | 4.8% |
| Central American Indian | 493 | 1.6% |
| Cherokee | 333 | 1.1% |
| Chilean | 17 | 0.1% |
| Colombian | 86 | 0.3% |
| Creek | 56 | 0.2% |
| Croatian | 34 | 0.1% |
| Cuban | 64 | 0.2% |
| Czech | 41 | 0.1% |
| Czechoslovakian | 9 | 0.0% |
| Danish | 142 | 0.4% |
| Dominican | 68 | 0.2% |
| Dutch | 344 | 1.1% |
| Eastern European | 44 | 0.1% |
| English | 4,944 | 15.7% |
| European | 393 | 1.3% |
| Finnish | 9 | 0.0% |
| French | 541 | 1.7% |
| French American Indian | 13 | 0.0% |
| French Canadian | 232 | 0.7% |
| German | 4,724 | 15.0% |
| Ghanaian | 9 | 0.0% |
| Guatemalan | 1,124 | 3.6% |
| Hungarian | 68 | 0.2% |
| Indian (Asian) | 13 | 0.0% |
| Irish | 4,403 | 14.0% |
| Italian | 1,157 | 3.7% |
| Japanese | 75 | 0.2% |
| Korean | 89 | 0.3% |
| Latvian | 9 | 0.0% |
| Lebanese | 24 | 0.1% |
| Lithuanian | 14 | 0.0% |
| Mexican | 1,559 | 5.0% |
| Mexican American Indian | 90 | 0.3% |
| Northern European | 23 | 0.1% |
| Norwegian | 163 | 0.5% |
| Pakistani | 9 | 0.0% |
| Panamanian | 290 | 0.9% |
| Pennsylvania German | 19 | 0.1% |
| Peruvian | 16 | 0.1% |
| Polish | 528 | 1.7% |
| Portuguese | 23 | 0.1% |
| Puerto Rican | 122 | 0.4% |
| Romanian | 98 | 0.3% |
| Russian | 41 | 0.1% |
| Salvadoran | 82 | 0.3% |
| Scandinavian | 22 | 0.1% |
| Scotch-Irish | 515 | 1.6% |
| Scottish | 1,284 | 4.1% |
| Slavic | 26 | 0.1% |
| Slovak | 15 | 0.1% |
| South African | 6 | 0.0% |
| South American | 177 | 0.6% |
| South American Indian | 7 | 0.0% |
| Spanish | 33 | 0.1% |
| Subsaharan African | 15 | 0.1% |
| Swedish | 433 | 1.4% |
| Swiss | 71 | 0.2% |
| Syrian | 6 | 0.0% |
| Thai | 14 | 0.0% |
| Ukrainian | 20 | 0.1% |
| Venezuelan | 30 | 0.1% |
| Welsh | 244 | 0.8% | View All 75 Rows |
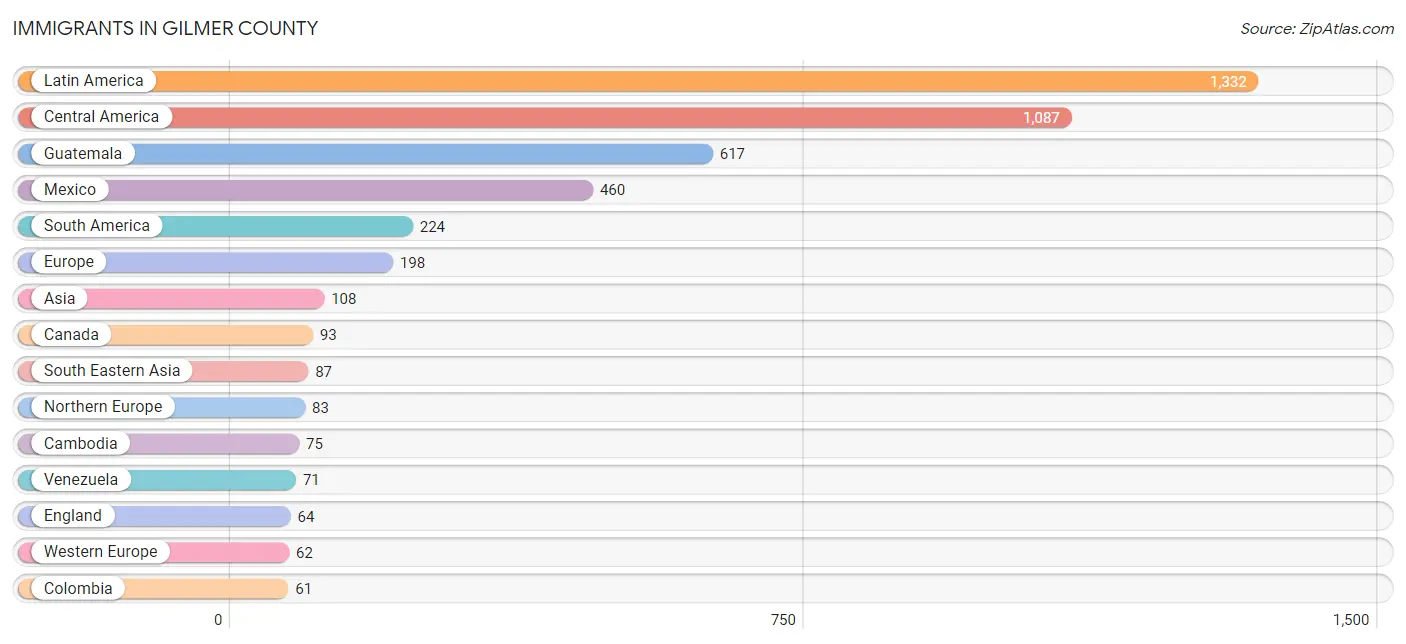
Immigrants in Gilmer County
The most numerous immigrant groups reported in Gilmer County came from Latin America (1,332 | 4.2%), Central America (1,087 | 3.5%), Guatemala (617 | 2.0%), Mexico (460 | 1.5%), and South America (224 | 0.7%), together accounting for 11.8% of all Gilmer County residents.
| Immigration Origin | # Population | % Population |
| Africa | 6 | 0.0% |
| Asia | 108 | 0.3% |
| Belgium | 15 | 0.1% |
| Brazil | 58 | 0.2% |
| Cambodia | 75 | 0.2% |
| Canada | 93 | 0.3% |
| Caribbean | 21 | 0.1% |
| Central America | 1,087 | 3.5% |
| Chile | 17 | 0.1% |
| China | 7 | 0.0% |
| Colombia | 61 | 0.2% |
| Cuba | 21 | 0.1% |
| Eastern Asia | 14 | 0.0% |
| Eastern Europe | 53 | 0.2% |
| Ecuador | 1 | 0.0% |
| England | 64 | 0.2% |
| Europe | 198 | 0.6% |
| Germany | 47 | 0.2% |
| Guatemala | 617 | 2.0% |
| Honduras | 10 | 0.0% |
| India | 7 | 0.0% |
| Japan | 7 | 0.0% |
| Latin America | 1,332 | 4.2% |
| Mexico | 460 | 1.5% |
| Northern Europe | 83 | 0.3% |
| Oceania | 18 | 0.1% |
| Peru | 16 | 0.1% |
| Philippines | 12 | 0.0% |
| Romania | 40 | 0.1% |
| Russia | 13 | 0.0% |
| South Africa | 6 | 0.0% |
| South America | 224 | 0.7% |
| South Central Asia | 7 | 0.0% |
| South Eastern Asia | 87 | 0.3% |
| Venezuela | 71 | 0.2% |
| Western Europe | 62 | 0.2% | View All 36 Rows |
Sex and Age in Gilmer County
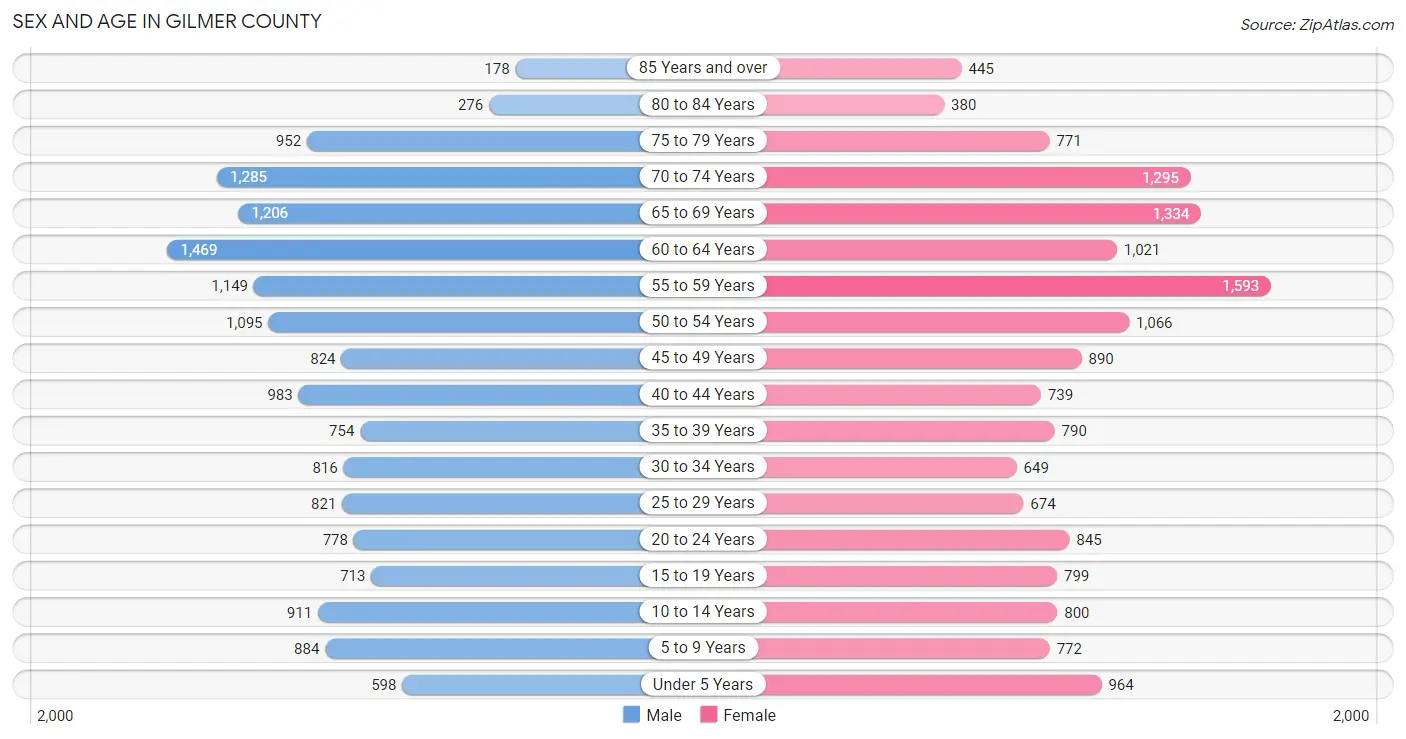
Sex and Age in Gilmer County
The most populous age groups in Gilmer County are 60 to 64 Years (1,469 | 9.4%) for men and 55 to 59 Years (1,593 | 10.1%) for women.
| Age Bracket | Male | Female |
| Under 5 Years | 598 (3.8%) | 964 (6.1%) |
| 5 to 9 Years | 884 (5.6%) | 772 (4.9%) |
| 10 to 14 Years | 911 (5.8%) | 800 (5.1%) |
| 15 to 19 Years | 713 (4.5%) | 799 (5.1%) |
| 20 to 24 Years | 778 (5.0%) | 845 (5.3%) |
| 25 to 29 Years | 821 (5.2%) | 674 (4.3%) |
| 30 to 34 Years | 816 (5.2%) | 649 (4.1%) |
| 35 to 39 Years | 754 (4.8%) | 790 (5.0%) |
| 40 to 44 Years | 983 (6.3%) | 739 (4.7%) |
| 45 to 49 Years | 824 (5.2%) | 890 (5.6%) |
| 50 to 54 Years | 1,095 (7.0%) | 1,066 (6.7%) |
| 55 to 59 Years | 1,149 (7.3%) | 1,593 (10.1%) |
| 60 to 64 Years | 1,469 (9.4%) | 1,021 (6.5%) |
| 65 to 69 Years | 1,206 (7.7%) | 1,334 (8.4%) |
| 70 to 74 Years | 1,285 (8.2%) | 1,295 (8.2%) |
| 75 to 79 Years | 952 (6.1%) | 771 (4.9%) |
| 80 to 84 Years | 276 (1.8%) | 380 (2.4%) |
| 85 Years and over | 178 (1.1%) | 445 (2.8%) |
| Total | 15,692 (100.0%) | 15,827 (100.0%) |
Families and Households in Gilmer County
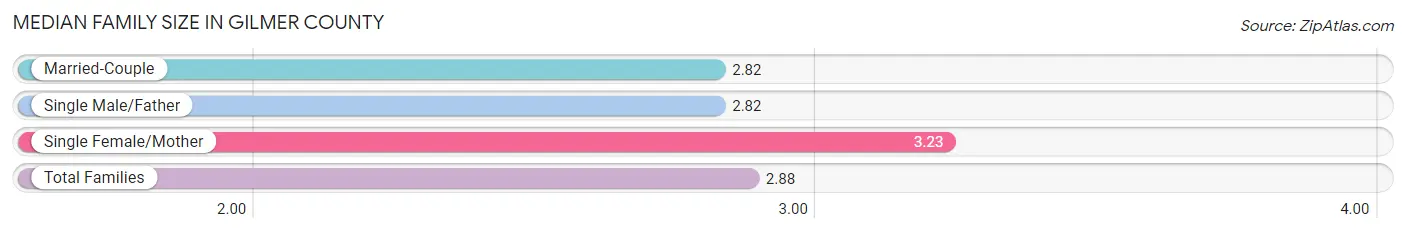
Median Family Size in Gilmer County
The median family size in Gilmer County is 2.88 persons per family, with single female/mother families (1,250 | 13.9%) accounting for the largest median family size of 3.23 persons per family. On the other hand, married-couple families (7,028 | 78.3%) represent the smallest median family size with 2.82 persons per family.
| Family Type | # Families | Family Size |
| Married-Couple | 7,028 (78.3%) | 2.82 |
| Single Male/Father | 692 (7.7%) | 2.82 |
| Single Female/Mother | 1,250 (13.9%) | 3.23 |
| Total Families | 8,970 (100.0%) | 2.88 |
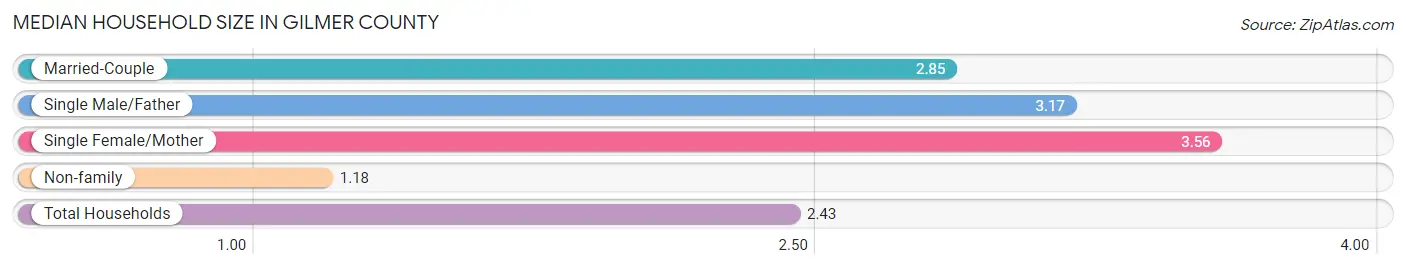
Median Household Size in Gilmer County
The median household size in Gilmer County is 2.43 persons per household, with single female/mother households (1,250 | 9.7%) accounting for the largest median household size of 3.56 persons per household. non-family households (3,898 | 30.3%) represent the smallest median household size with 1.18 persons per household.
| Household Type | # Households | Household Size |
| Married-Couple | 7,028 (54.6%) | 2.85 |
| Single Male/Father | 692 (5.4%) | 3.17 |
| Single Female/Mother | 1,250 (9.7%) | 3.56 |
| Non-family | 3,898 (30.3%) | 1.18 |
| Total Households | 12,868 (100.0%) | 2.43 |
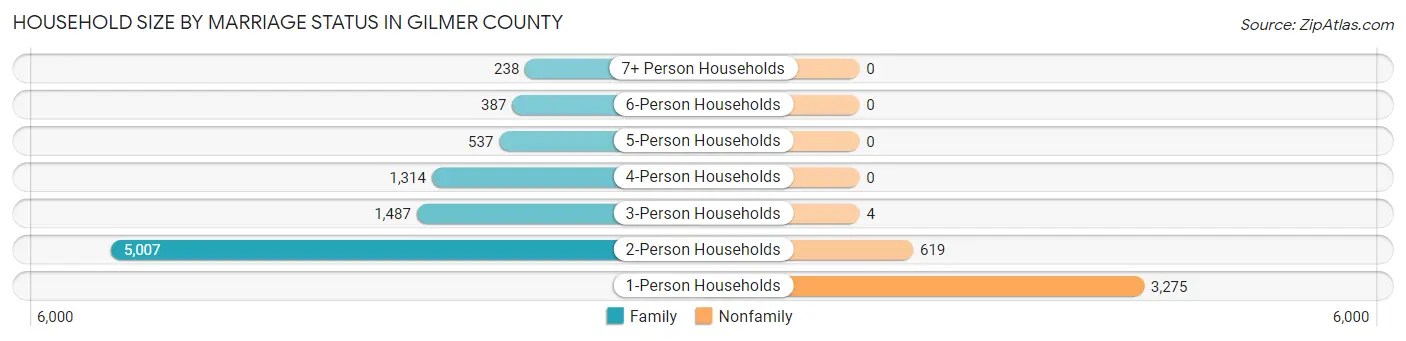
Household Size by Marriage Status in Gilmer County
Out of a total of 12,868 households in Gilmer County, 8,970 (69.7%) are family households, while 3,898 (30.3%) are nonfamily households. The most numerous type of family households are 2-person households, comprising 5,007, and the most common type of nonfamily households are 1-person households, comprising 3,275.
| Household Size | Family Households | Nonfamily Households |
| 1-Person Households | - | 3,275 (25.5%) |
| 2-Person Households | 5,007 (38.9%) | 619 (4.8%) |
| 3-Person Households | 1,487 (11.6%) | 4 (0.0%) |
| 4-Person Households | 1,314 (10.2%) | 0 (0.0%) |
| 5-Person Households | 537 (4.2%) | 0 (0.0%) |
| 6-Person Households | 387 (3.0%) | 0 (0.0%) |
| 7+ Person Households | 238 (1.8%) | 0 (0.0%) |
| Total | 8,970 (69.7%) | 3,898 (30.3%) |
Female Fertility in Gilmer County
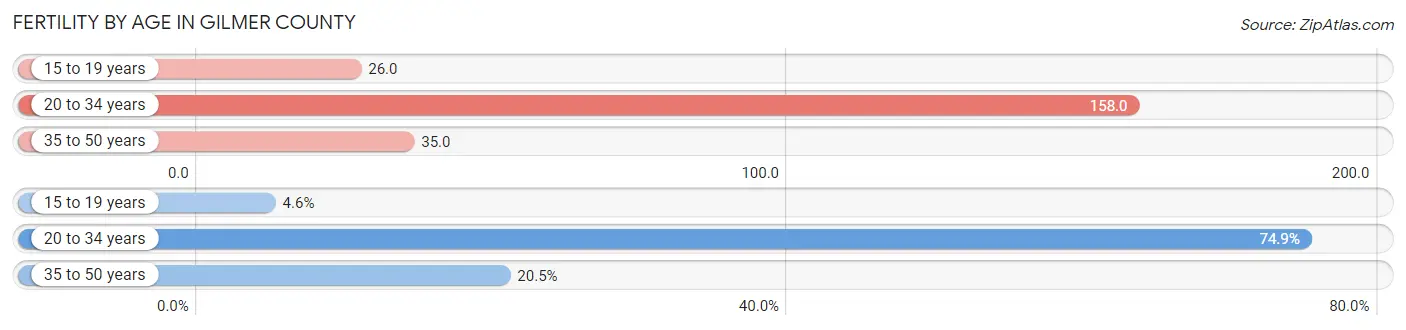
Fertility by Age in Gilmer County
Average fertility rate in Gilmer County is 81.0 births per 1,000 women. Women in the age bracket of 20 to 34 years have the highest fertility rate with 158.0 births per 1,000 women. Women in the age bracket of 20 to 34 years acount for 74.9% of all women with births.
| Age Bracket | Women with Births | Births / 1,000 Women |
| 15 to 19 years | 21 (4.6%) | 26.0 |
| 20 to 34 years | 343 (74.9%) | 158.0 |
| 35 to 50 years | 94 (20.5%) | 35.0 |
| Total | 458 (100.0%) | 81.0 |
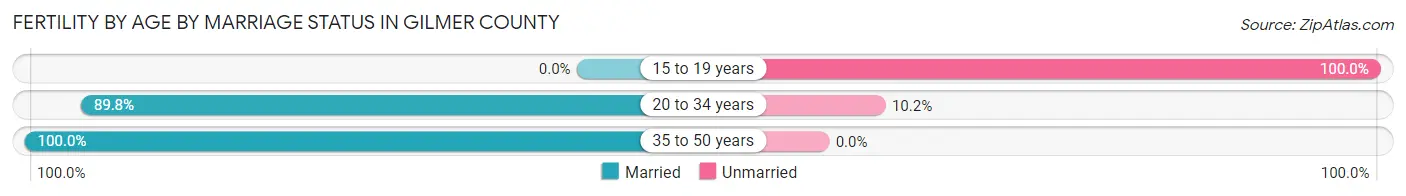
Fertility by Age by Marriage Status in Gilmer County
87.8% of women with births (458) in Gilmer County are married. The highest percentage of unmarried women with births falls into 15 to 19 years age bracket with 100.0% of them unmarried at the time of birth, while the lowest percentage of unmarried women with births belong to 35 to 50 years age bracket with 0.0% of them unmarried.
| Age Bracket | Married | Unmarried |
| 15 to 19 years | 0 (0.0%) | 21 (100.0%) |
| 20 to 34 years | 308 (89.8%) | 35 (10.2%) |
| 35 to 50 years | 94 (100.0%) | 0 (0.0%) |
| Total | 402 (87.8%) | 56 (12.2%) |
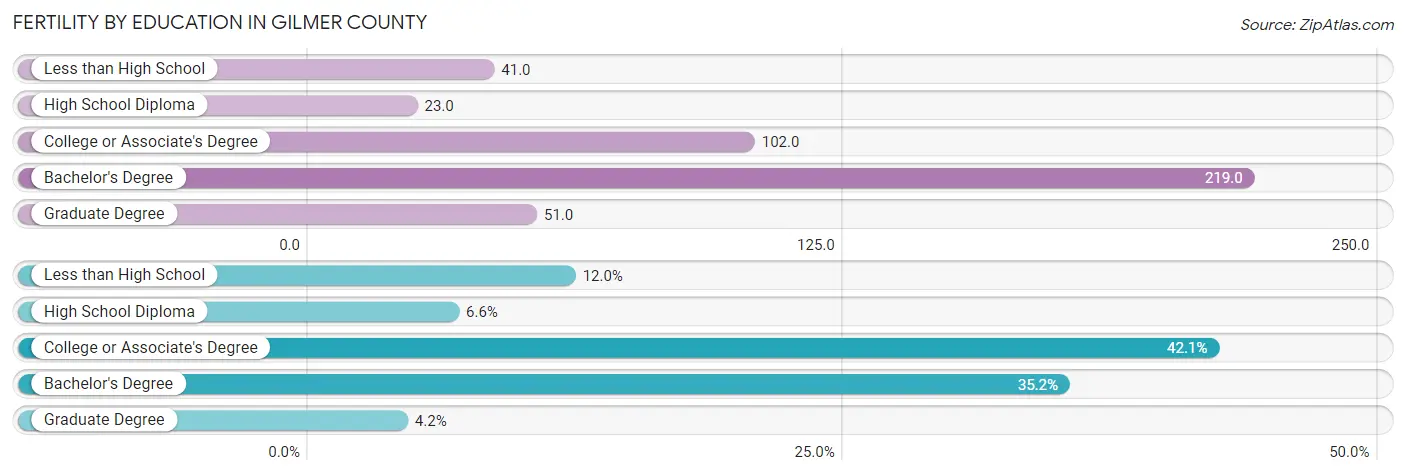
Fertility by Education in Gilmer County
Average fertility rate in Gilmer County is 81.0 births per 1,000 women. Women with the education attainment of bachelor's degree have the highest fertility rate of 219.0 births per 1,000 women, while women with the education attainment of high school diploma have the lowest fertility at 23.0 births per 1,000 women. Women with the education attainment of college or associate's degree represent 42.1% of all women with births.
| Educational Attainment | Women with Births | Births / 1,000 Women |
| Less than High School | 55 (12.0%) | 41.0 |
| High School Diploma | 30 (6.6%) | 23.0 |
| College or Associate's Degree | 193 (42.1%) | 102.0 |
| Bachelor's Degree | 161 (35.1%) | 219.0 |
| Graduate Degree | 19 (4.2%) | 51.0 |
| Total | 458 (100.0%) | 81.0 |
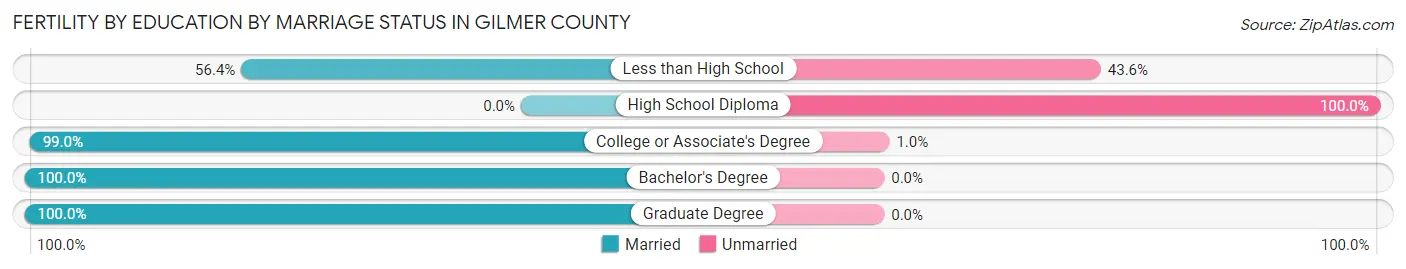
Fertility by Education by Marriage Status in Gilmer County
12.2% of women with births in Gilmer County are unmarried. Women with the educational attainment of bachelor's degree are most likely to be married with 100.0% of them married at childbirth, while women with the educational attainment of high school diploma are least likely to be married with 100.0% of them unmarried at childbirth.
| Educational Attainment | Married | Unmarried |
| Less than High School | 31 (56.4%) | 24 (43.6%) |
| High School Diploma | 0 (0.0%) | 30 (100.0%) |
| College or Associate's Degree | 191 (99.0%) | 2 (1.0%) |
| Bachelor's Degree | 161 (100.0%) | 0 (0.0%) |
| Graduate Degree | 19 (100.0%) | 0 (0.0%) |
| Total | 402 (87.8%) | 56 (12.2%) |
Employment Characteristics in Gilmer County
Employment by Class of Employer in Gilmer County
Among the 13,217 employed individuals in Gilmer County, private company employees (8,933 | 67.6%), local government employees (1,530 | 11.6%), and self-employed (not incorporated) (982 | 7.4%) make up the most common classes of employment.
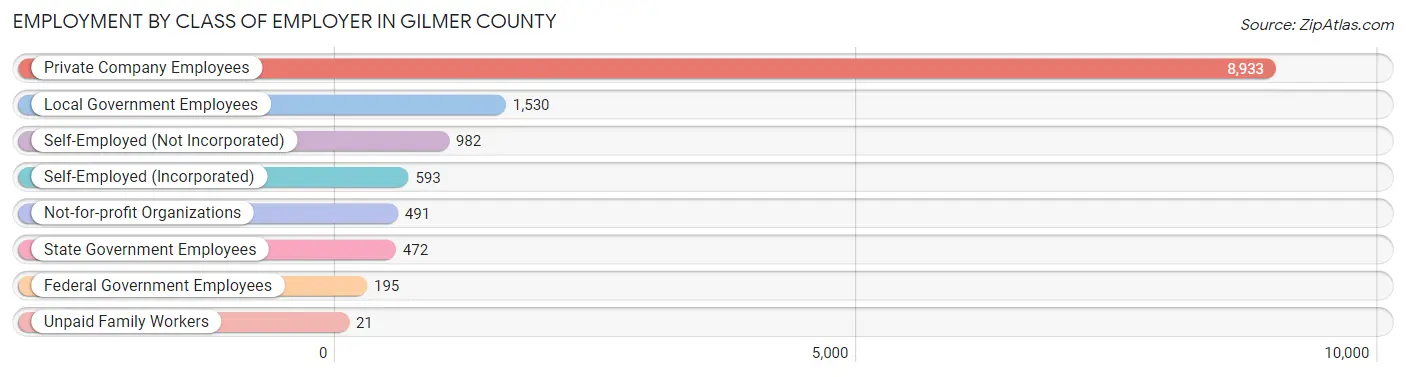
| Employer Class | # Employees | % Employees |
| Private Company Employees | 8,933 | 67.6% |
| Self-Employed (Incorporated) | 593 | 4.5% |
| Self-Employed (Not Incorporated) | 982 | 7.4% |
| Not-for-profit Organizations | 491 | 3.7% |
| Local Government Employees | 1,530 | 11.6% |
| State Government Employees | 472 | 3.6% |
| Federal Government Employees | 195 | 1.5% |
| Unpaid Family Workers | 21 | 0.2% |
| Total | 13,217 | 100.0% |
Employment Status by Age in Gilmer County
According to the labor force statistics for Gilmer County, out of the total population over 16 years of age (26,144), 53.2% or 13,909 individuals are in the labor force, with 2.4% or 334 of them unemployed. The age group with the highest labor force participation rate is 25 to 29 years, with 88.0% or 1,316 individuals in the labor force. Within the labor force, the 20 to 24 years age range has the highest percentage of unemployed individuals, with 9.1% or 104 of them being unemployed.
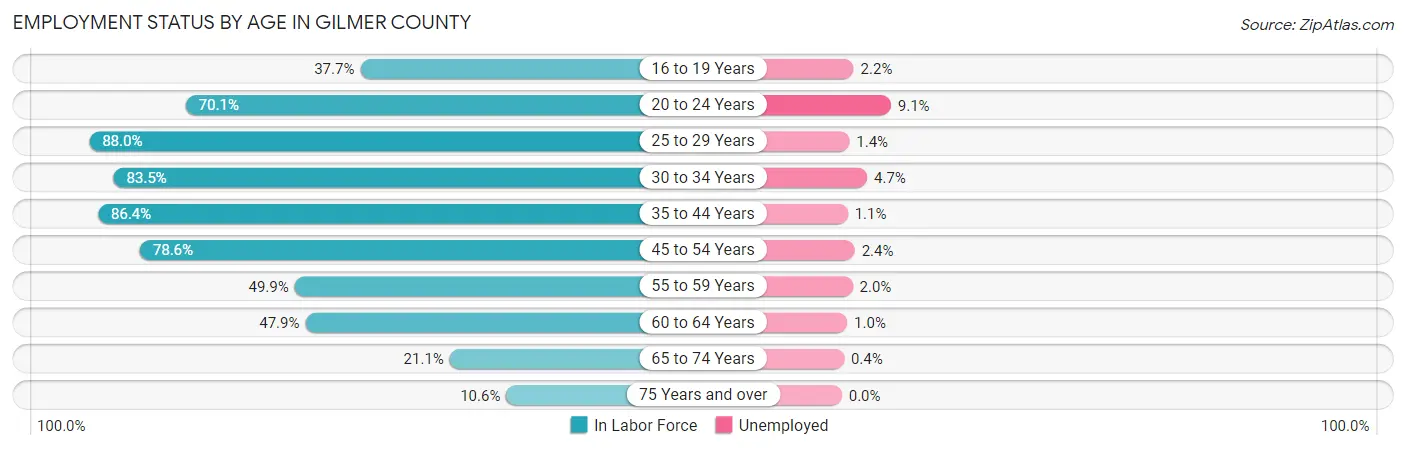
| Age Bracket | In Labor Force | Unemployed |
| 16 to 19 Years | 402 (37.7%) | 9 (2.2%) |
| 20 to 24 Years | 1,138 (70.1%) | 104 (9.1%) |
| 25 to 29 Years | 1,316 (88.0%) | 18 (1.4%) |
| 30 to 34 Years | 1,223 (83.5%) | 57 (4.7%) |
| 35 to 44 Years | 2,822 (86.4%) | 31 (1.1%) |
| 45 to 54 Years | 3,046 (78.6%) | 73 (2.4%) |
| 55 to 59 Years | 1,368 (49.9%) | 27 (2.0%) |
| 60 to 64 Years | 1,193 (47.9%) | 12 (1.0%) |
| 65 to 74 Years | 1,080 (21.1%) | 4 (0.4%) |
| 75 Years and over | 318 (10.6%) | 0 (0.0%) |
| Total | 13,909 (53.2%) | 334 (2.4%) |
Employment Status by Educational Attainment in Gilmer County
According to labor force statistics for Gilmer County, 71.5% of individuals (10,963) out of the total population between 25 and 64 years of age (15,333) are in the labor force, with 2.0% or 219 of them being unemployed. The group with the highest labor force participation rate are those with the educational attainment of bachelor's degree or higher, with 82.9% or 2,506 individuals in the labor force. Within the labor force, individuals with less than high school education have the highest percentage of unemployment, with 3.6% or 51 of them being unemployed.
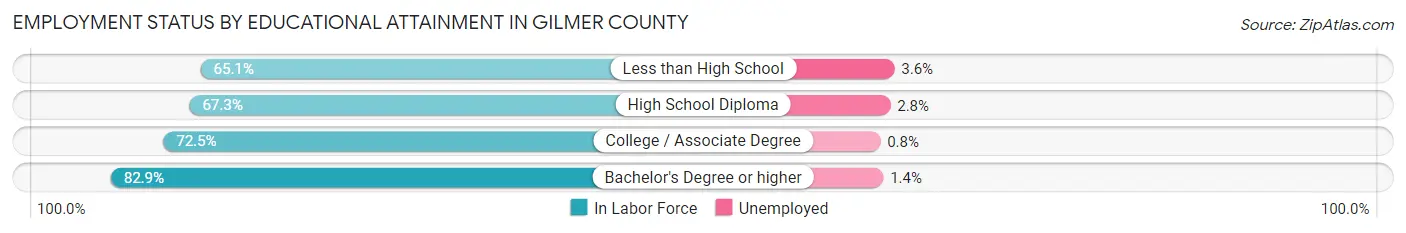
| Educational Attainment | In Labor Force | Unemployed |
| Less than High School | 1,429 (65.1%) | 79 (3.6%) |
| High School Diploma | 3,844 (67.3%) | 160 (2.8%) |
| College / Associate Degree | 3,193 (72.5%) | 35 (0.8%) |
| Bachelor's Degree or higher | 2,506 (82.9%) | 42 (1.4%) |
| Total | 10,963 (71.5%) | 307 (2.0%) |
Employment Occupations by Sex in Gilmer County
Management, Business, Science and Arts Occupations
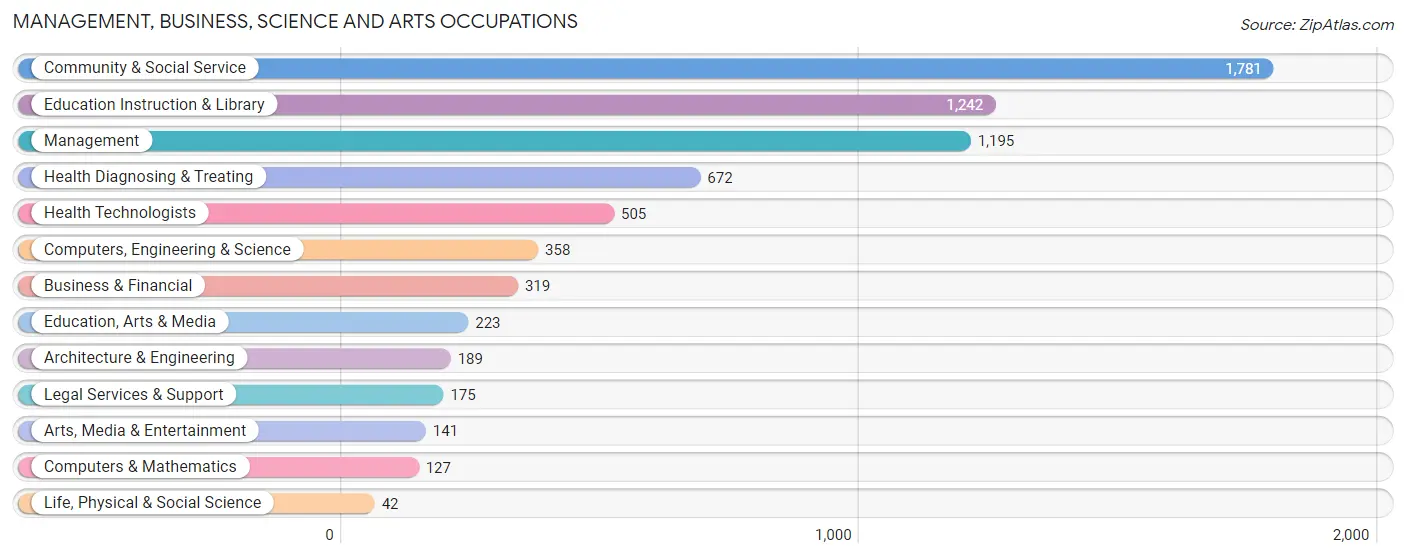
The most common Management, Business, Science and Arts occupations in Gilmer County are Community & Social Service (1,781 | 13.1%), Education Instruction & Library (1,242 | 9.1%), Management (1,195 | 8.8%), Health Diagnosing & Treating (672 | 5.0%), and Health Technologists (505 | 3.7%).
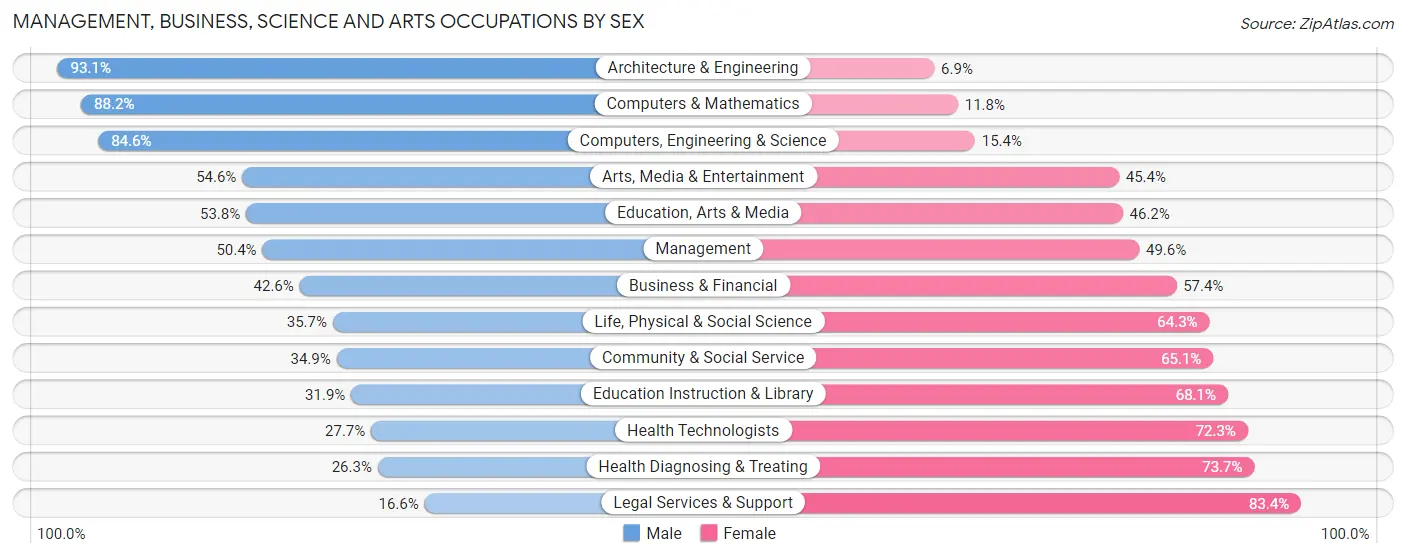
Management, Business, Science and Arts Occupations by Sex
Within the Management, Business, Science and Arts occupations in Gilmer County, the most male-oriented occupations are Architecture & Engineering (93.1%), Computers & Mathematics (88.2%), and Computers, Engineering & Science (84.6%), while the most female-oriented occupations are Legal Services & Support (83.4%), Health Diagnosing & Treating (73.7%), and Health Technologists (72.3%).
| Occupation | Male | Female |
| Management | 602 (50.4%) | 593 (49.6%) |
| Business & Financial | 136 (42.6%) | 183 (57.4%) |
| Computers, Engineering & Science | 303 (84.6%) | 55 (15.4%) |
| Computers & Mathematics | 112 (88.2%) | 15 (11.8%) |
| Architecture & Engineering | 176 (93.1%) | 13 (6.9%) |
| Life, Physical & Social Science | 15 (35.7%) | 27 (64.3%) |
| Community & Social Service | 622 (34.9%) | 1,159 (65.1%) |
| Education, Arts & Media | 120 (53.8%) | 103 (46.2%) |
| Legal Services & Support | 29 (16.6%) | 146 (83.4%) |
| Education Instruction & Library | 396 (31.9%) | 846 (68.1%) |
| Arts, Media & Entertainment | 77 (54.6%) | 64 (45.4%) |
| Health Diagnosing & Treating | 177 (26.3%) | 495 (73.7%) |
| Health Technologists | 140 (27.7%) | 365 (72.3%) |
| Total (Category) | 1,840 (42.5%) | 2,485 (57.5%) |
| Total (Overall) | 7,610 (56.1%) | 5,961 (43.9%) |
Services Occupations
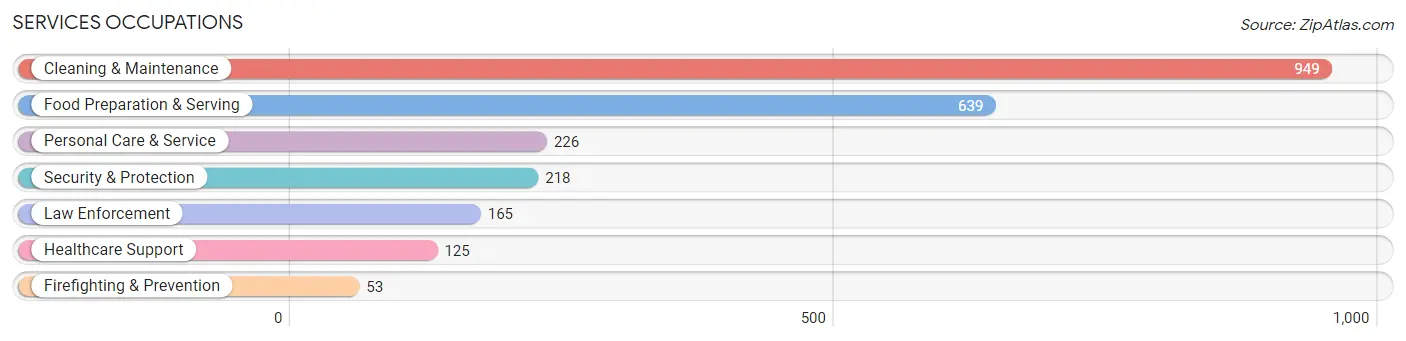
The most common Services occupations in Gilmer County are Cleaning & Maintenance (949 | 7.0%), Food Preparation & Serving (639 | 4.7%), Personal Care & Service (226 | 1.7%), Security & Protection (218 | 1.6%), and Law Enforcement (165 | 1.2%).
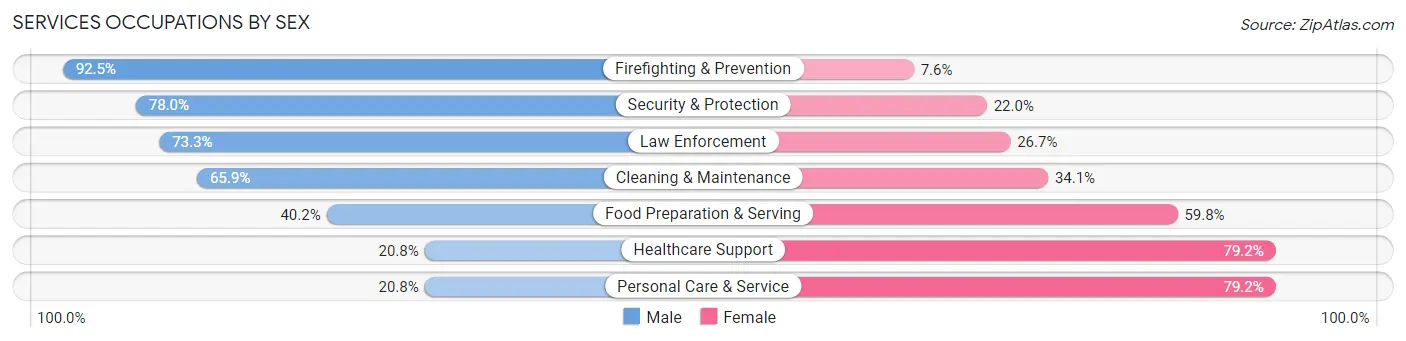
Services Occupations by Sex
Within the Services occupations in Gilmer County, the most male-oriented occupations are Firefighting & Prevention (92.4%), Security & Protection (78.0%), and Law Enforcement (73.3%), while the most female-oriented occupations are Healthcare Support (79.2%), Personal Care & Service (79.2%), and Food Preparation & Serving (59.8%).
| Occupation | Male | Female |
| Healthcare Support | 26 (20.8%) | 99 (79.2%) |
| Security & Protection | 170 (78.0%) | 48 (22.0%) |
| Firefighting & Prevention | 49 (92.4%) | 4 (7.5%) |
| Law Enforcement | 121 (73.3%) | 44 (26.7%) |
| Food Preparation & Serving | 257 (40.2%) | 382 (59.8%) |
| Cleaning & Maintenance | 625 (65.9%) | 324 (34.1%) |
| Personal Care & Service | 47 (20.8%) | 179 (79.2%) |
| Total (Category) | 1,125 (52.2%) | 1,032 (47.8%) |
| Total (Overall) | 7,610 (56.1%) | 5,961 (43.9%) |
Sales and Office Occupations
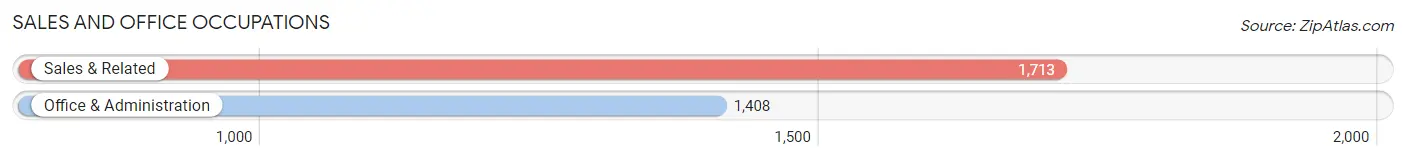
The most common Sales and Office occupations in Gilmer County are Sales & Related (1,713 | 12.6%), and Office & Administration (1,408 | 10.4%).
Sales and Office Occupations by Sex
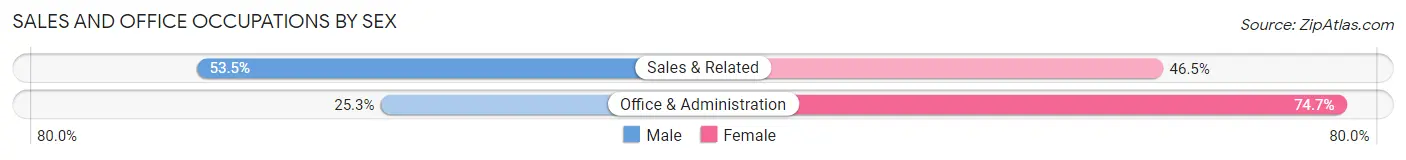
| Occupation | Male | Female |
| Sales & Related | 917 (53.5%) | 796 (46.5%) |
| Office & Administration | 356 (25.3%) | 1,052 (74.7%) |
| Total (Category) | 1,273 (40.8%) | 1,848 (59.2%) |
| Total (Overall) | 7,610 (56.1%) | 5,961 (43.9%) |
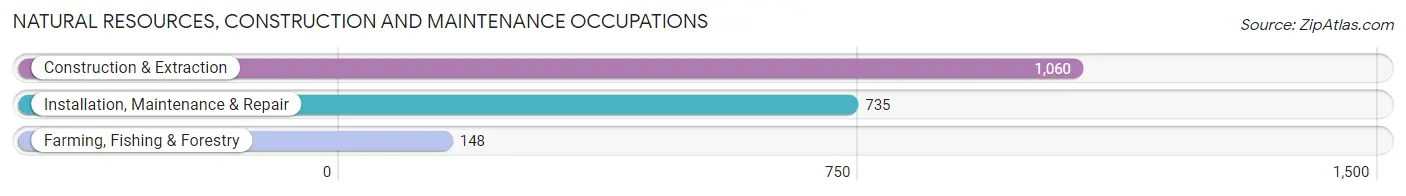
Natural Resources, Construction and Maintenance Occupations
The most common Natural Resources, Construction and Maintenance occupations in Gilmer County are Construction & Extraction (1,060 | 7.8%), Installation, Maintenance & Repair (735 | 5.4%), and Farming, Fishing & Forestry (148 | 1.1%).
Natural Resources, Construction and Maintenance Occupations by Sex
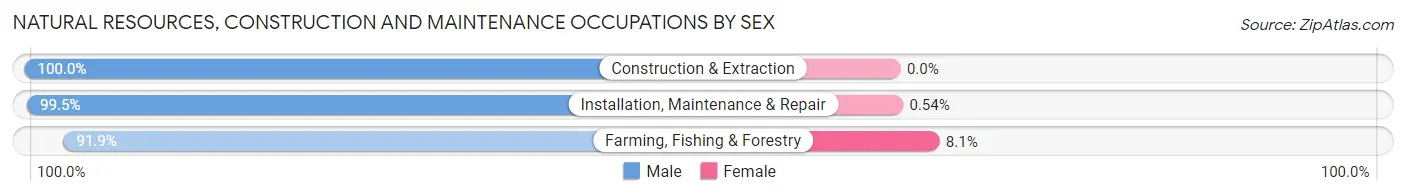
| Occupation | Male | Female |
| Farming, Fishing & Forestry | 136 (91.9%) | 12 (8.1%) |
| Construction & Extraction | 1,060 (100.0%) | 0 (0.0%) |
| Installation, Maintenance & Repair | 731 (99.5%) | 4 (0.5%) |
| Total (Category) | 1,927 (99.2%) | 16 (0.8%) |
| Total (Overall) | 7,610 (56.1%) | 5,961 (43.9%) |
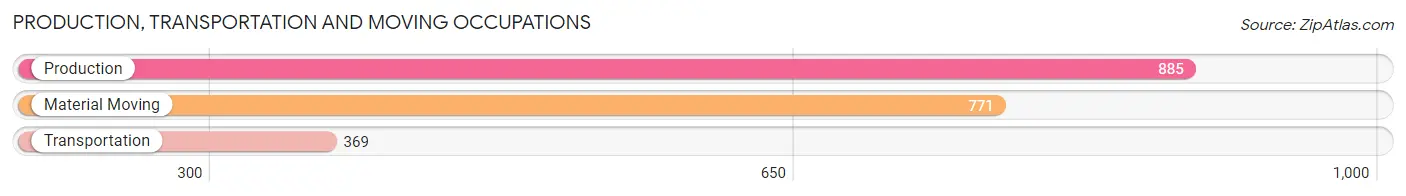
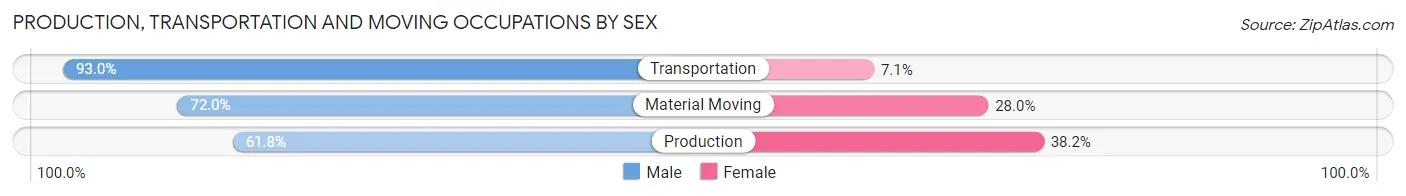
Production, Transportation and Moving Occupations
The most common Production, Transportation and Moving occupations in Gilmer County are Production (885 | 6.5%), Material Moving (771 | 5.7%), and Transportation (369 | 2.7%).
Production, Transportation and Moving Occupations by Sex
| Occupation | Male | Female |
| Production | 547 (61.8%) | 338 (38.2%) |
| Transportation | 343 (92.9%) | 26 (7.0%) |
| Material Moving | 555 (72.0%) | 216 (28.0%) |
| Total (Category) | 1,445 (71.4%) | 580 (28.6%) |
| Total (Overall) | 7,610 (56.1%) | 5,961 (43.9%) |
Employment Industries by Sex in Gilmer County
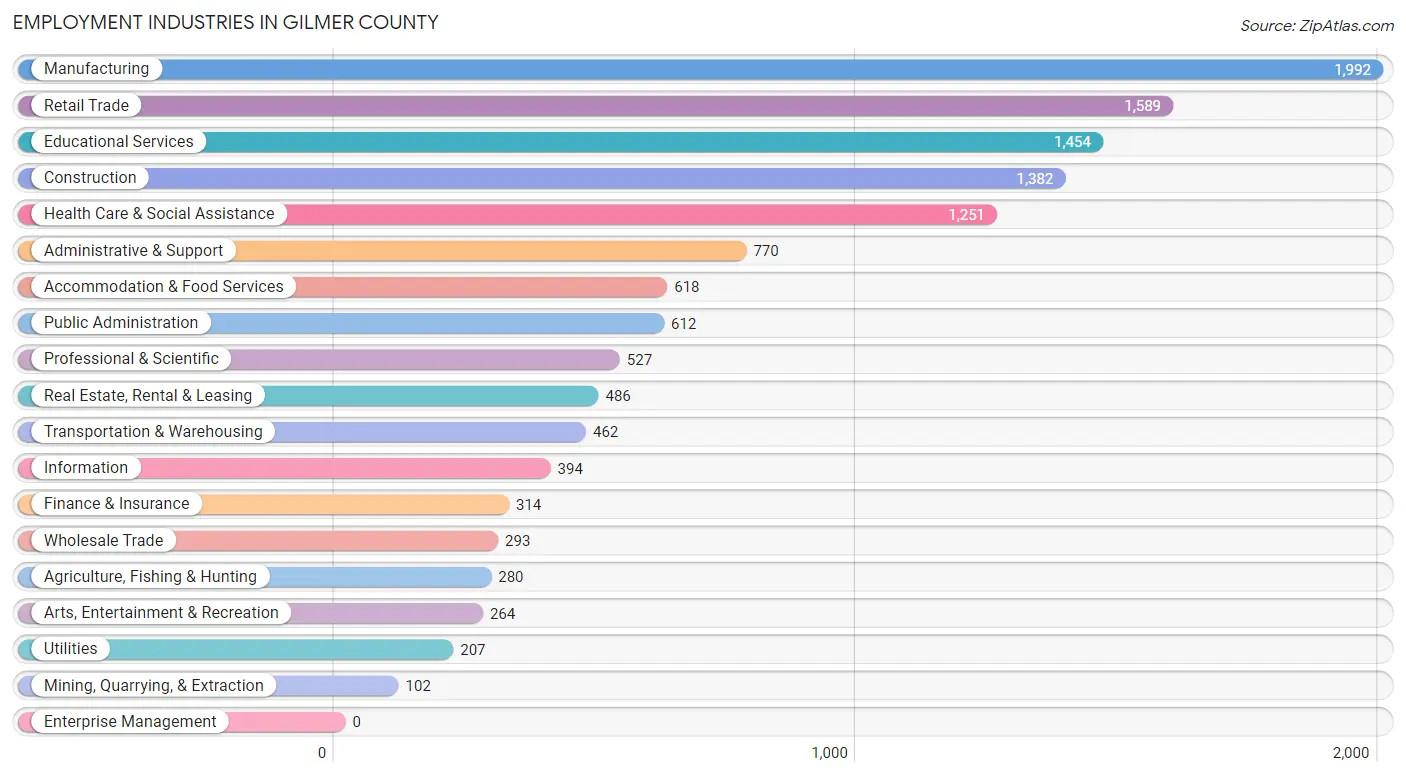
Employment Industries in Gilmer County
The major employment industries in Gilmer County include Manufacturing (1,992 | 14.7%), Retail Trade (1,589 | 11.7%), Educational Services (1,454 | 10.7%), Construction (1,382 | 10.2%), and Health Care & Social Assistance (1,251 | 9.2%).
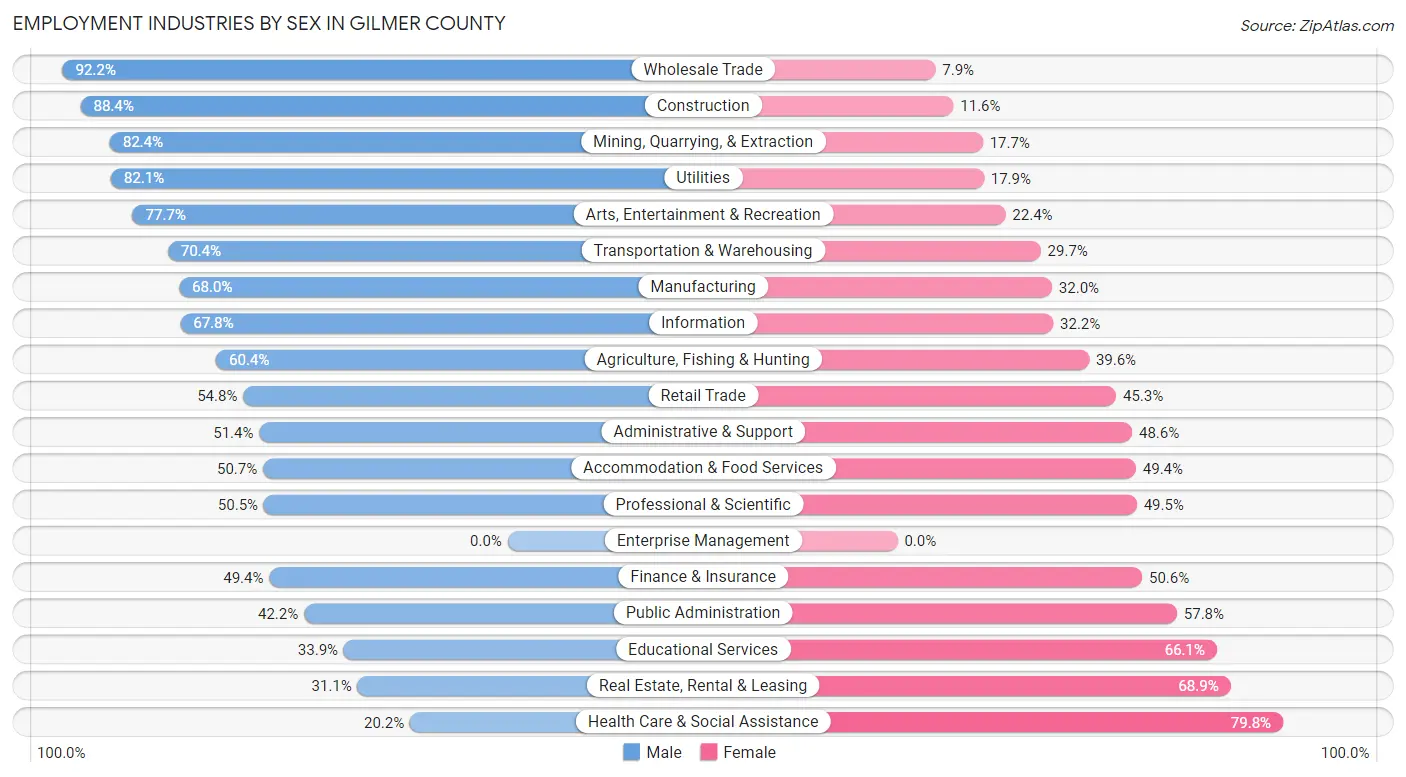
Employment Industries by Sex in Gilmer County
The Gilmer County industries that see more men than women are Wholesale Trade (92.1%), Construction (88.4%), and Mining, Quarrying, & Extraction (82.4%), whereas the industries that tend to have a higher number of women are Health Care & Social Assistance (79.8%), Real Estate, Rental & Leasing (68.9%), and Educational Services (66.1%).
| Industry | Male | Female |
| Agriculture, Fishing & Hunting | 169 (60.4%) | 111 (39.6%) |
| Mining, Quarrying, & Extraction | 84 (82.4%) | 18 (17.6%) |
| Construction | 1,222 (88.4%) | 160 (11.6%) |
| Manufacturing | 1,355 (68.0%) | 637 (32.0%) |
| Wholesale Trade | 270 (92.1%) | 23 (7.9%) |
| Retail Trade | 870 (54.7%) | 719 (45.3%) |
| Transportation & Warehousing | 325 (70.4%) | 137 (29.6%) |
| Utilities | 170 (82.1%) | 37 (17.9%) |
| Information | 267 (67.8%) | 127 (32.2%) |
| Finance & Insurance | 155 (49.4%) | 159 (50.6%) |
| Real Estate, Rental & Leasing | 151 (31.1%) | 335 (68.9%) |
| Professional & Scientific | 266 (50.5%) | 261 (49.5%) |
| Enterprise Management | 0 (0.0%) | 0 (0.0%) |
| Administrative & Support | 396 (51.4%) | 374 (48.6%) |
| Educational Services | 493 (33.9%) | 961 (66.1%) |
| Health Care & Social Assistance | 253 (20.2%) | 998 (79.8%) |
| Arts, Entertainment & Recreation | 205 (77.6%) | 59 (22.4%) |
| Accommodation & Food Services | 313 (50.6%) | 305 (49.3%) |
| Public Administration | 258 (42.2%) | 354 (57.8%) |
| Total | 7,610 (56.1%) | 5,961 (43.9%) |
Education in Gilmer County
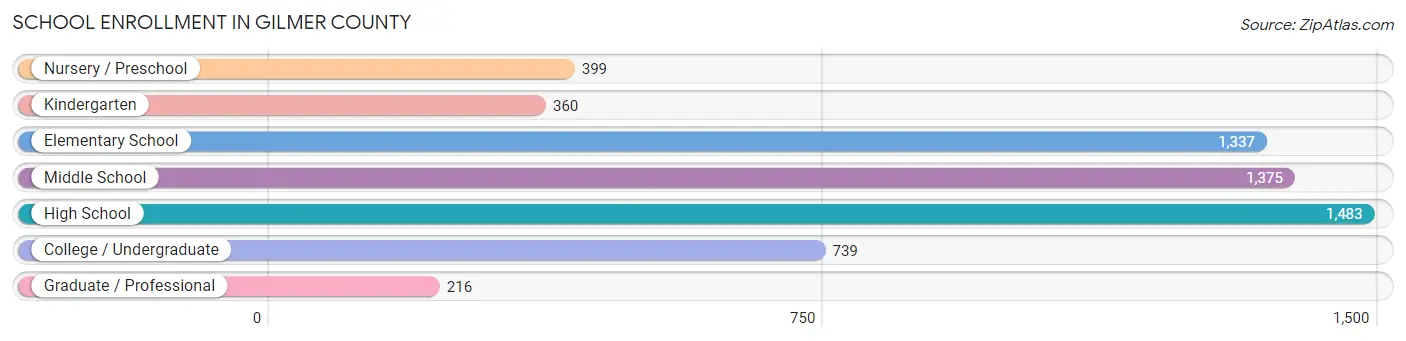
School Enrollment in Gilmer County
The most common levels of schooling among the 5,909 students in Gilmer County are high school (1,483 | 25.1%), middle school (1,375 | 23.3%), and elementary school (1,337 | 22.6%).
| School Level | # Students | % Students |
| Nursery / Preschool | 399 | 6.8% |
| Kindergarten | 360 | 6.1% |
| Elementary School | 1,337 | 22.6% |
| Middle School | 1,375 | 23.3% |
| High School | 1,483 | 25.1% |
| College / Undergraduate | 739 | 12.5% |
| Graduate / Professional | 216 | 3.7% |
| Total | 5,909 | 100.0% |
School Enrollment by Age by Funding Source in Gilmer County
Out of a total of 5,909 students who are enrolled in schools in Gilmer County, 739 (12.5%) attend a private institution, while the remaining 5,170 (87.5%) are enrolled in public schools. The age group of 25 to 34 year olds has the highest likelihood of being enrolled in private schools, with 81 (49.1% in the age bracket) enrolled. Conversely, the age group of 15 to 17 year olds has the lowest likelihood of being enrolled in a private school, with 968 (96.4% in the age bracket) attending a public institution.
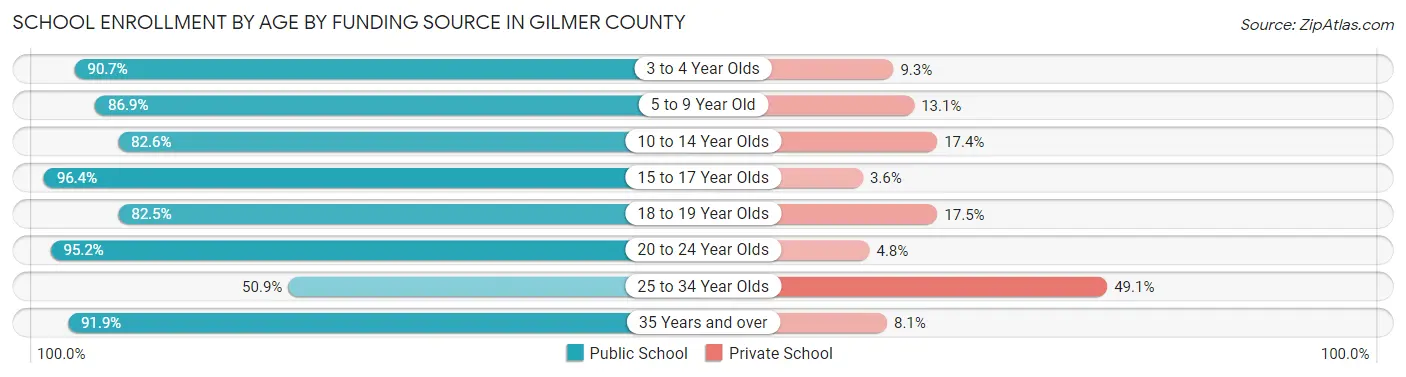
| Age Bracket | Public School | Private School |
| 3 to 4 Year Olds | 215 (90.7%) | 22 (9.3%) |
| 5 to 9 Year Old | 1,408 (86.9%) | 213 (13.1%) |
| 10 to 14 Year Olds | 1,413 (82.6%) | 298 (17.4%) |
| 15 to 17 Year Olds | 968 (96.4%) | 36 (3.6%) |
| 18 to 19 Year Olds | 156 (82.5%) | 33 (17.5%) |
| 20 to 24 Year Olds | 652 (95.2%) | 33 (4.8%) |
| 25 to 34 Year Olds | 84 (50.9%) | 81 (49.1%) |
| 35 Years and over | 273 (91.9%) | 24 (8.1%) |
| Total | 5,170 (87.5%) | 739 (12.5%) |
Educational Attainment by Field of Study in Gilmer County
Education (1,036 | 17.3%), business (994 | 16.6%), science & technology (689 | 11.5%), arts & humanities (478 | 8.0%), and engineering (378 | 6.3%) are the most common fields of study among 5,976 individuals in Gilmer County who have obtained a bachelor's degree or higher.
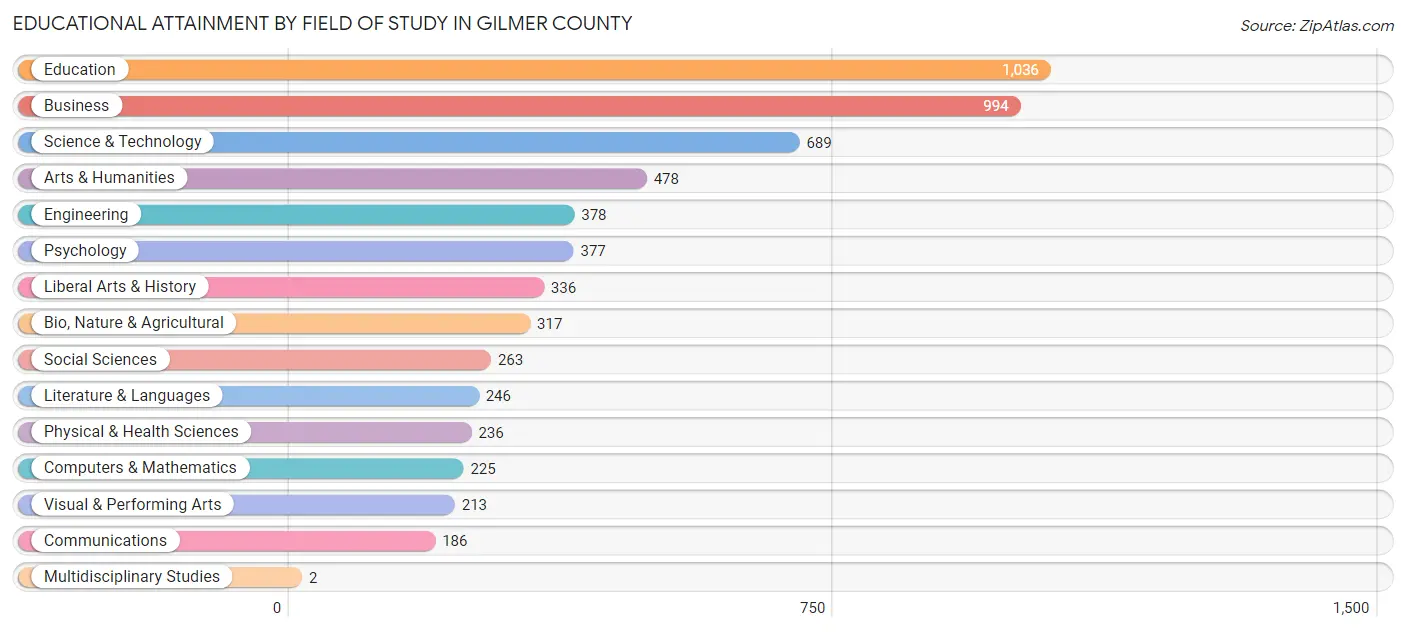
| Field of Study | # Graduates | % Graduates |
| Computers & Mathematics | 225 | 3.8% |
| Bio, Nature & Agricultural | 317 | 5.3% |
| Physical & Health Sciences | 236 | 4.0% |
| Psychology | 377 | 6.3% |
| Social Sciences | 263 | 4.4% |
| Engineering | 378 | 6.3% |
| Multidisciplinary Studies | 2 | 0.0% |
| Science & Technology | 689 | 11.5% |
| Business | 994 | 16.6% |
| Education | 1,036 | 17.3% |
| Literature & Languages | 246 | 4.1% |
| Liberal Arts & History | 336 | 5.6% |
| Visual & Performing Arts | 213 | 3.6% |
| Communications | 186 | 3.1% |
| Arts & Humanities | 478 | 8.0% |
| Total | 5,976 | 100.0% |
Transportation & Commute in Gilmer County
Vehicle Availability by Sex in Gilmer County
The most prevalent vehicle ownership categories in Gilmer County are males with 2 vehicles (2,804, accounting for 38.0%) and females with 2 vehicles (1,939, making up 48.1%).
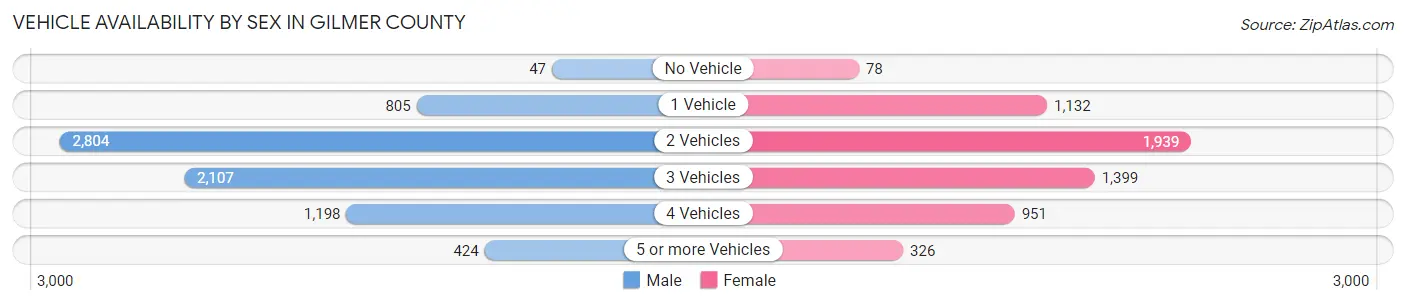
| Vehicles Available | Male | Female |
| No Vehicle | 47 (0.6%) | 78 (1.3%) |
| 1 Vehicle | 805 (10.9%) | 1,132 (19.4%) |
| 2 Vehicles | 2,804 (38.0%) | 1,939 (33.3%) |
| 3 Vehicles | 2,107 (28.5%) | 1,399 (24.0%) |
| 4 Vehicles | 1,198 (16.2%) | 951 (16.3%) |
| 5 or more Vehicles | 424 (5.7%) | 326 (5.6%) |
| Total | 7,385 (100.0%) | 5,825 (100.0%) |
Commute Time in Gilmer County
The most frequently occuring commute durations in Gilmer County are 15 to 19 minutes (2,290 commuters, 18.6%), 10 to 14 minutes (1,700 commuters, 13.8%), and 20 to 24 minutes (1,523 commuters, 12.4%).
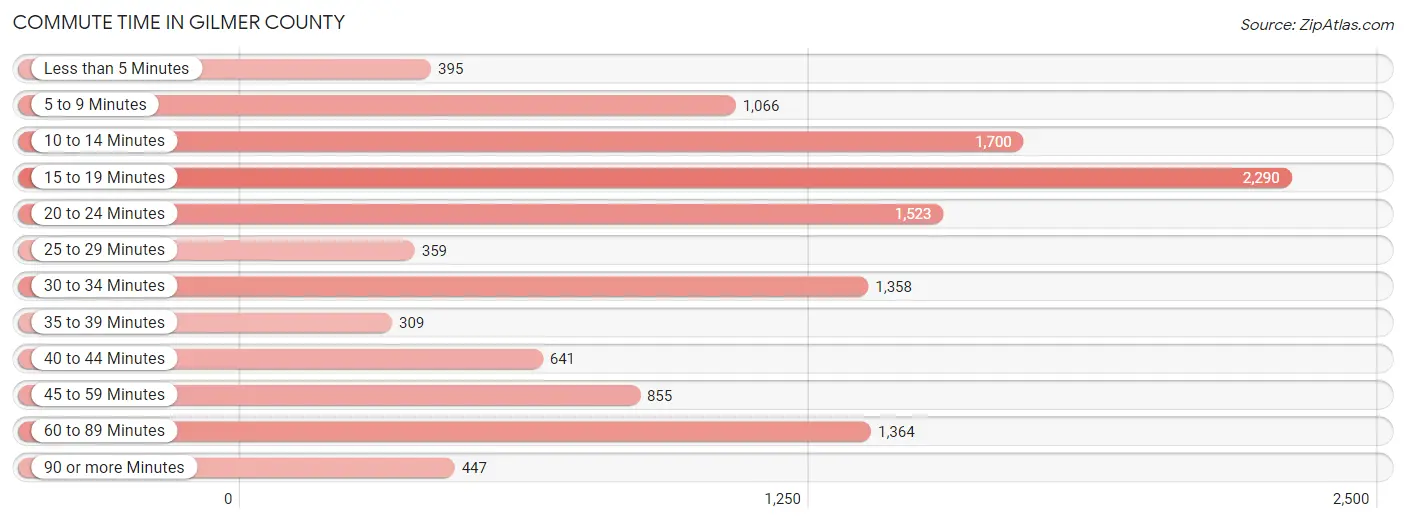
| Commute Time | # Commuters | % Commuters |
| Less than 5 Minutes | 395 | 3.2% |
| 5 to 9 Minutes | 1,066 | 8.7% |
| 10 to 14 Minutes | 1,700 | 13.8% |
| 15 to 19 Minutes | 2,290 | 18.6% |
| 20 to 24 Minutes | 1,523 | 12.4% |
| 25 to 29 Minutes | 359 | 2.9% |
| 30 to 34 Minutes | 1,358 | 11.0% |
| 35 to 39 Minutes | 309 | 2.5% |
| 40 to 44 Minutes | 641 | 5.2% |
| 45 to 59 Minutes | 855 | 7.0% |
| 60 to 89 Minutes | 1,364 | 11.1% |
| 90 or more Minutes | 447 | 3.6% |
Commute Time by Sex in Gilmer County
The most common commute times in Gilmer County are 60 to 89 minutes (1,076 commuters, 15.5%) for males and 15 to 19 minutes (1,248 commuters, 23.3%) for females.
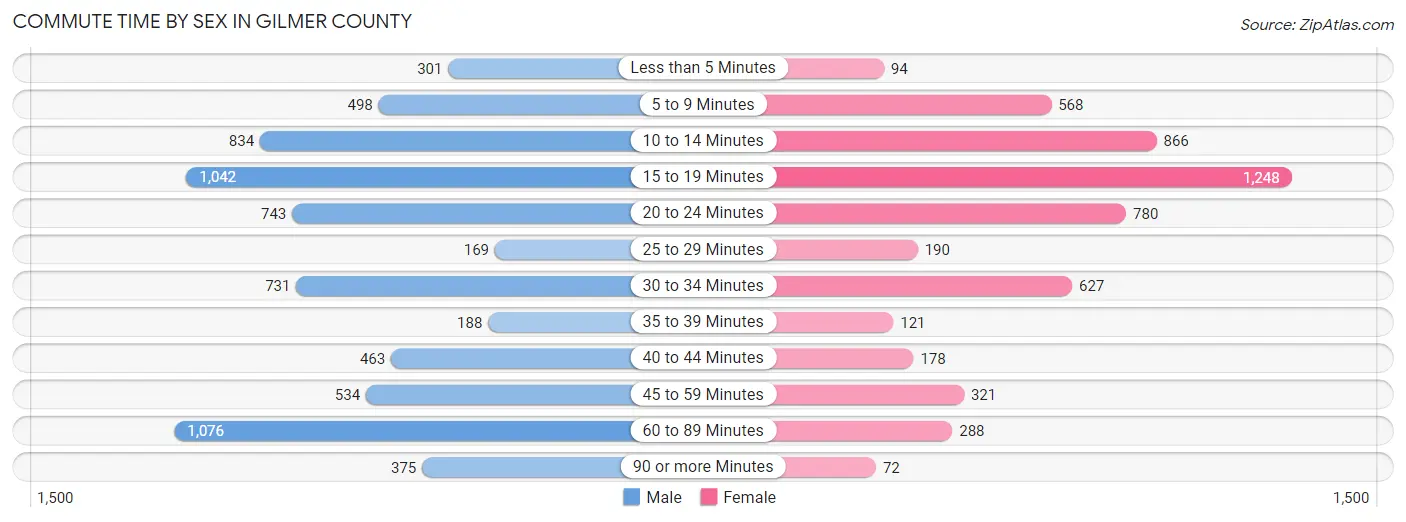
| Commute Time | Male | Female |
| Less than 5 Minutes | 301 (4.3%) | 94 (1.8%) |
| 5 to 9 Minutes | 498 (7.2%) | 568 (10.6%) |
| 10 to 14 Minutes | 834 (12.0%) | 866 (16.2%) |
| 15 to 19 Minutes | 1,042 (15.0%) | 1,248 (23.3%) |
| 20 to 24 Minutes | 743 (10.7%) | 780 (14.6%) |
| 25 to 29 Minutes | 169 (2.4%) | 190 (3.5%) |
| 30 to 34 Minutes | 731 (10.5%) | 627 (11.7%) |
| 35 to 39 Minutes | 188 (2.7%) | 121 (2.3%) |
| 40 to 44 Minutes | 463 (6.7%) | 178 (3.3%) |
| 45 to 59 Minutes | 534 (7.7%) | 321 (6.0%) |
| 60 to 89 Minutes | 1,076 (15.5%) | 288 (5.4%) |
| 90 or more Minutes | 375 (5.4%) | 72 (1.3%) |
Time of Departure to Work by Sex in Gilmer County
The most frequent times of departure to work in Gilmer County are 7:00 AM to 7:29 AM (1,017, 14.6%) for males and 7:00 AM to 7:29 AM (1,138, 21.3%) for females.
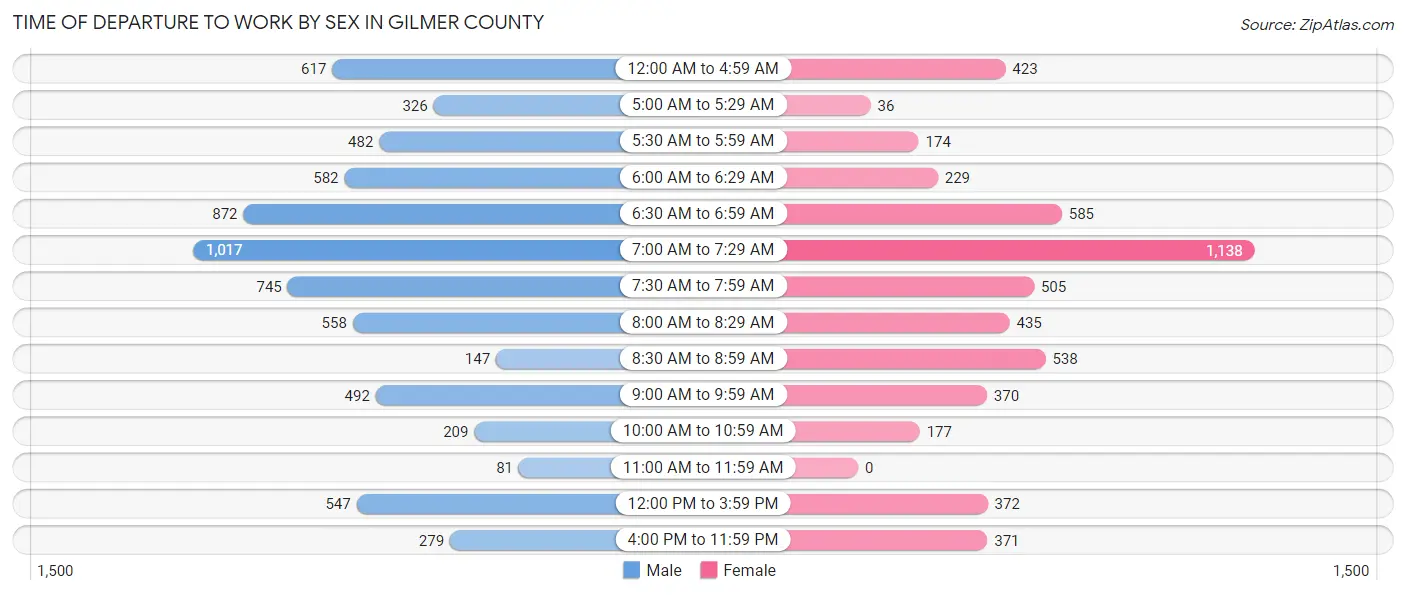
| Time of Departure | Male | Female |
| 12:00 AM to 4:59 AM | 617 (8.9%) | 423 (7.9%) |
| 5:00 AM to 5:29 AM | 326 (4.7%) | 36 (0.7%) |
| 5:30 AM to 5:59 AM | 482 (6.9%) | 174 (3.3%) |
| 6:00 AM to 6:29 AM | 582 (8.4%) | 229 (4.3%) |
| 6:30 AM to 6:59 AM | 872 (12.5%) | 585 (10.9%) |
| 7:00 AM to 7:29 AM | 1,017 (14.6%) | 1,138 (21.3%) |
| 7:30 AM to 7:59 AM | 745 (10.7%) | 505 (9.4%) |
| 8:00 AM to 8:29 AM | 558 (8.0%) | 435 (8.1%) |
| 8:30 AM to 8:59 AM | 147 (2.1%) | 538 (10.1%) |
| 9:00 AM to 9:59 AM | 492 (7.1%) | 370 (6.9%) |
| 10:00 AM to 10:59 AM | 209 (3.0%) | 177 (3.3%) |
| 11:00 AM to 11:59 AM | 81 (1.2%) | 0 (0.0%) |
| 12:00 PM to 3:59 PM | 547 (7.9%) | 372 (7.0%) |
| 4:00 PM to 11:59 PM | 279 (4.0%) | 371 (6.9%) |
| Total | 6,954 (100.0%) | 5,353 (100.0%) |
Housing Occupancy in Gilmer County
Occupancy by Ownership in Gilmer County
Of the total 12,868 dwellings in Gilmer County, owner-occupied units account for 9,791 (76.1%), while renter-occupied units make up 3,077 (23.9%).
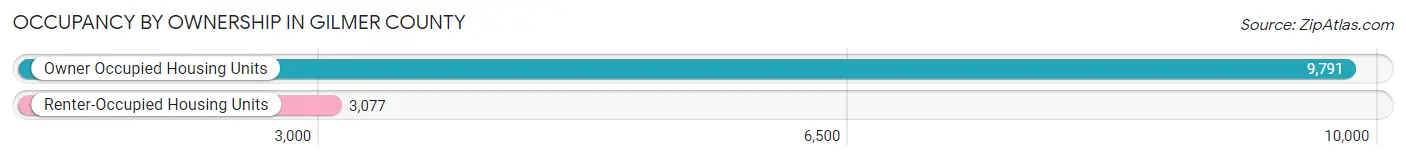
| Occupancy | # Housing Units | % Housing Units |
| Owner Occupied Housing Units | 9,791 | 76.1% |
| Renter-Occupied Housing Units | 3,077 | 23.9% |
| Total Occupied Housing Units | 12,868 | 100.0% |
Occupancy by Household Size in Gilmer County
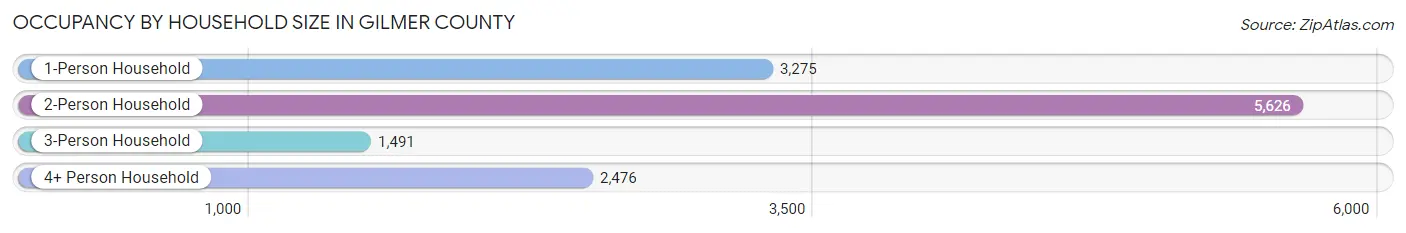
| Household Size | # Housing Units | % Housing Units |
| 1-Person Household | 3,275 | 25.5% |
| 2-Person Household | 5,626 | 43.7% |
| 3-Person Household | 1,491 | 11.6% |
| 4+ Person Household | 2,476 | 19.2% |
| Total Housing Units | 12,868 | 100.0% |
Occupancy by Ownership by Household Size in Gilmer County
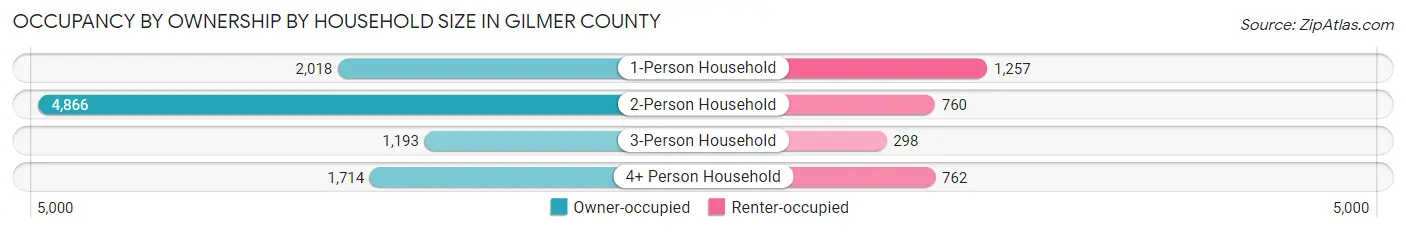
| Household Size | Owner-occupied | Renter-occupied |
| 1-Person Household | 2,018 (61.6%) | 1,257 (38.4%) |
| 2-Person Household | 4,866 (86.5%) | 760 (13.5%) |
| 3-Person Household | 1,193 (80.0%) | 298 (20.0%) |
| 4+ Person Household | 1,714 (69.2%) | 762 (30.8%) |
| Total Housing Units | 9,791 (76.1%) | 3,077 (23.9%) |
Occupancy by Educational Attainment in Gilmer County
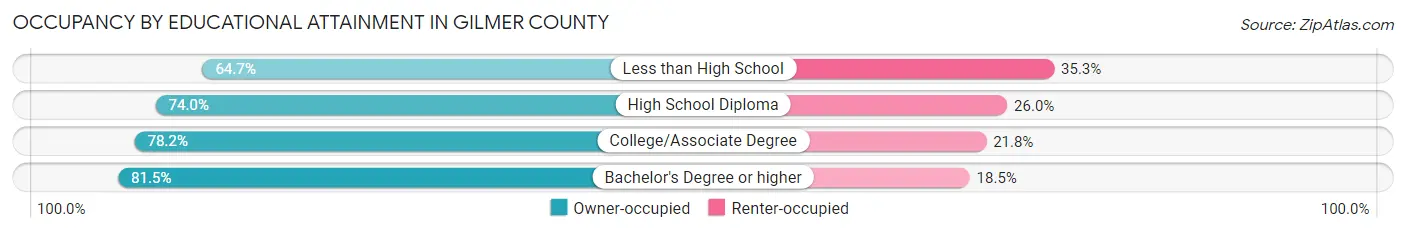
| Household Size | Owner-occupied | Renter-occupied |
| Less than High School | 1,066 (64.7%) | 581 (35.3%) |
| High School Diploma | 2,793 (74.0%) | 980 (26.0%) |
| College/Associate Degree | 3,245 (78.2%) | 905 (21.8%) |
| Bachelor's Degree or higher | 2,687 (81.5%) | 611 (18.5%) |
Occupancy by Age of Householder in Gilmer County
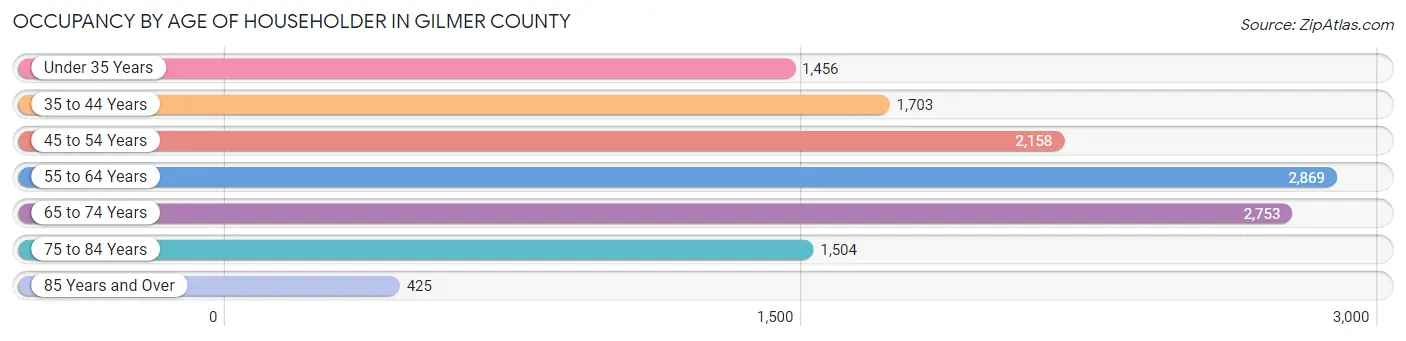
| Age Bracket | # Households | % Households |
| Under 35 Years | 1,456 | 11.3% |
| 35 to 44 Years | 1,703 | 13.2% |
| 45 to 54 Years | 2,158 | 16.8% |
| 55 to 64 Years | 2,869 | 22.3% |
| 65 to 74 Years | 2,753 | 21.4% |
| 75 to 84 Years | 1,504 | 11.7% |
| 85 Years and Over | 425 | 3.3% |
| Total | 12,868 | 100.0% |
Housing Finances in Gilmer County
Median Income by Occupancy in Gilmer County
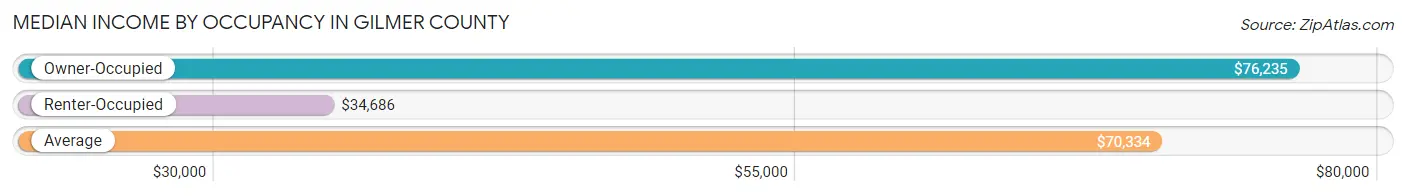
| Occupancy Type | # Households | Median Income |
| Owner-Occupied | 9,791 (76.1%) | $76,235 |
| Renter-Occupied | 3,077 (23.9%) | $34,686 |
| Average | 12,868 (100.0%) | $70,334 |
Occupancy by Householder Income Bracket in Gilmer County
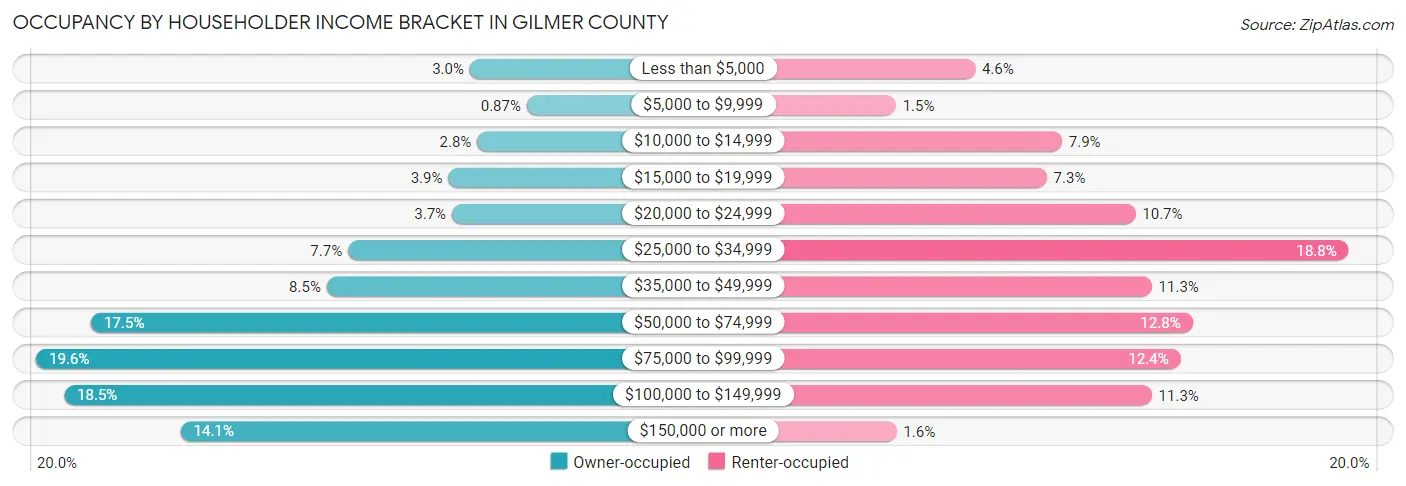
| Income Bracket | Owner-occupied | Renter-occupied |
| Less than $5,000 | 298 (3.0%) | 140 (4.5%) |
| $5,000 to $9,999 | 85 (0.9%) | 47 (1.5%) |
| $10,000 to $14,999 | 270 (2.8%) | 242 (7.9%) |
| $15,000 to $19,999 | 378 (3.9%) | 224 (7.3%) |
| $20,000 to $24,999 | 364 (3.7%) | 328 (10.7%) |
| $25,000 to $34,999 | 752 (7.7%) | 578 (18.8%) |
| $35,000 to $49,999 | 831 (8.5%) | 347 (11.3%) |
| $50,000 to $74,999 | 1,710 (17.5%) | 395 (12.8%) |
| $75,000 to $99,999 | 1,915 (19.6%) | 381 (12.4%) |
| $100,000 to $149,999 | 1,811 (18.5%) | 347 (11.3%) |
| $150,000 or more | 1,377 (14.1%) | 48 (1.6%) |
| Total | 9,791 (100.0%) | 3,077 (100.0%) |
Monthly Housing Cost Tiers in Gilmer County
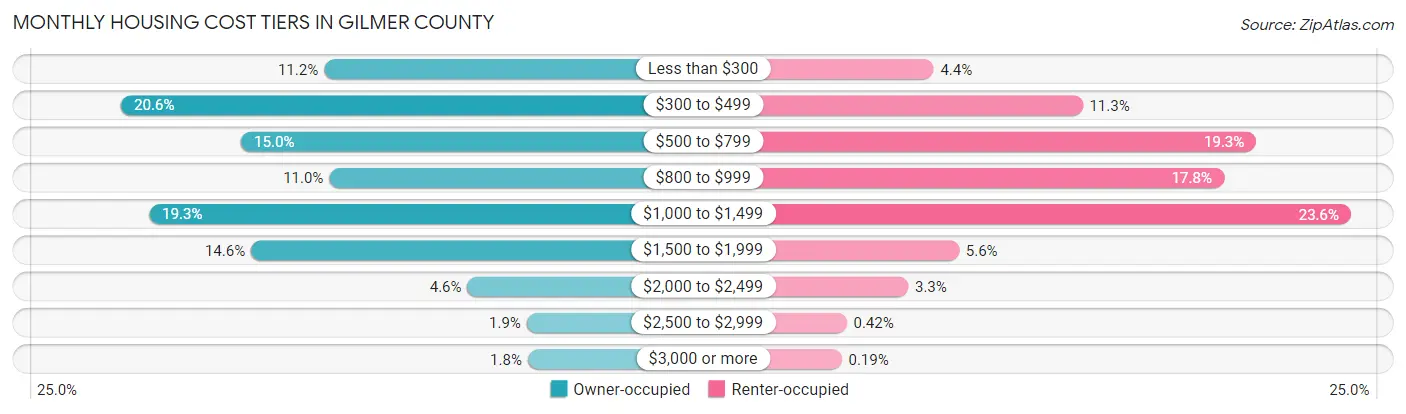
| Monthly Cost | Owner-occupied | Renter-occupied |
| Less than $300 | 1,099 (11.2%) | 136 (4.4%) |
| $300 to $499 | 2,013 (20.6%) | 347 (11.3%) |
| $500 to $799 | 1,472 (15.0%) | 593 (19.3%) |
| $800 to $999 | 1,075 (11.0%) | 547 (17.8%) |
| $1,000 to $1,499 | 1,887 (19.3%) | 727 (23.6%) |
| $1,500 to $1,999 | 1,428 (14.6%) | 172 (5.6%) |
| $2,000 to $2,499 | 452 (4.6%) | 100 (3.3%) |
| $2,500 to $2,999 | 185 (1.9%) | 13 (0.4%) |
| $3,000 or more | 180 (1.8%) | 6 (0.2%) |
| Total | 9,791 (100.0%) | 3,077 (100.0%) |
Physical Housing Characteristics in Gilmer County
Housing Structures in Gilmer County
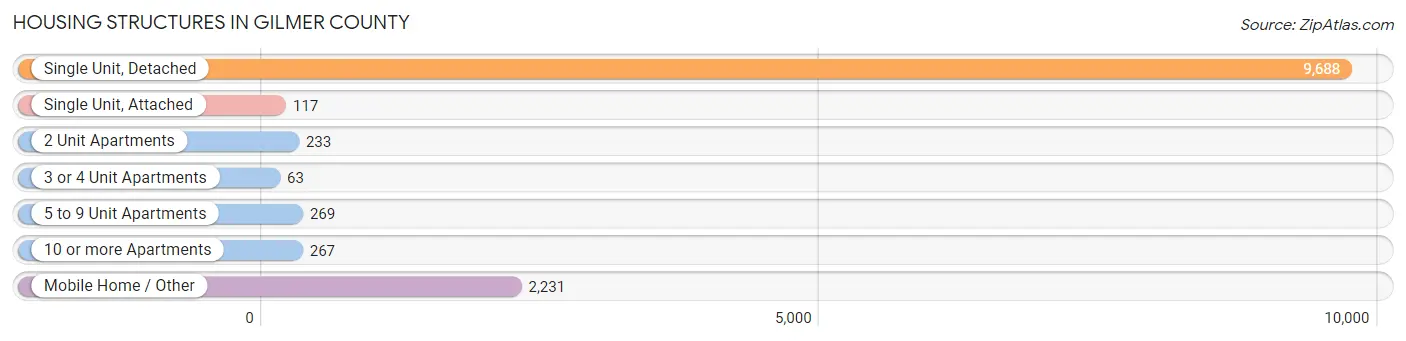
| Structure Type | # Housing Units | % Housing Units |
| Single Unit, Detached | 9,688 | 75.3% |
| Single Unit, Attached | 117 | 0.9% |
| 2 Unit Apartments | 233 | 1.8% |
| 3 or 4 Unit Apartments | 63 | 0.5% |
| 5 to 9 Unit Apartments | 269 | 2.1% |
| 10 or more Apartments | 267 | 2.1% |
| Mobile Home / Other | 2,231 | 17.3% |
| Total | 12,868 | 100.0% |
Housing Structures by Occupancy in Gilmer County
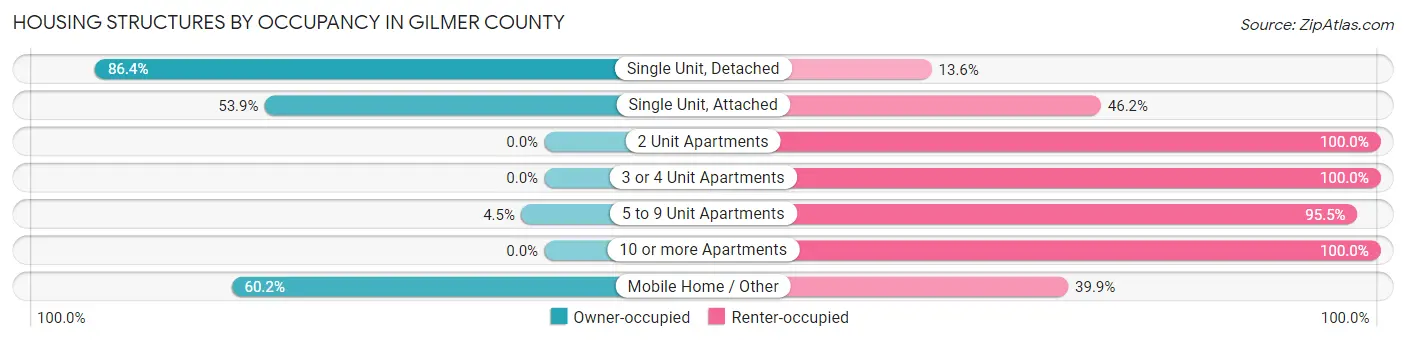
| Structure Type | Owner-occupied | Renter-occupied |
| Single Unit, Detached | 8,374 (86.4%) | 1,314 (13.6%) |
| Single Unit, Attached | 63 (53.8%) | 54 (46.2%) |
| 2 Unit Apartments | 0 (0.0%) | 233 (100.0%) |
| 3 or 4 Unit Apartments | 0 (0.0%) | 63 (100.0%) |
| 5 to 9 Unit Apartments | 12 (4.5%) | 257 (95.5%) |
| 10 or more Apartments | 0 (0.0%) | 267 (100.0%) |
| Mobile Home / Other | 1,342 (60.2%) | 889 (39.9%) |
| Total | 9,791 (76.1%) | 3,077 (23.9%) |
Housing Structures by Number of Rooms in Gilmer County
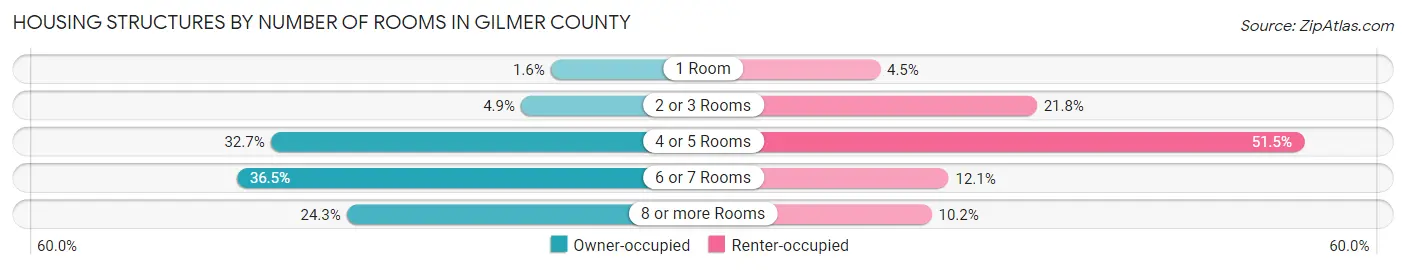
| Number of Rooms | Owner-occupied | Renter-occupied |
| 1 Room | 160 (1.6%) | 137 (4.4%) |
| 2 or 3 Rooms | 483 (4.9%) | 672 (21.8%) |
| 4 or 5 Rooms | 3,203 (32.7%) | 1,584 (51.5%) |
| 6 or 7 Rooms | 3,569 (36.4%) | 371 (12.1%) |
| 8 or more Rooms | 2,376 (24.3%) | 313 (10.2%) |
| Total | 9,791 (100.0%) | 3,077 (100.0%) |
Housing Structure by Heating Type in Gilmer County
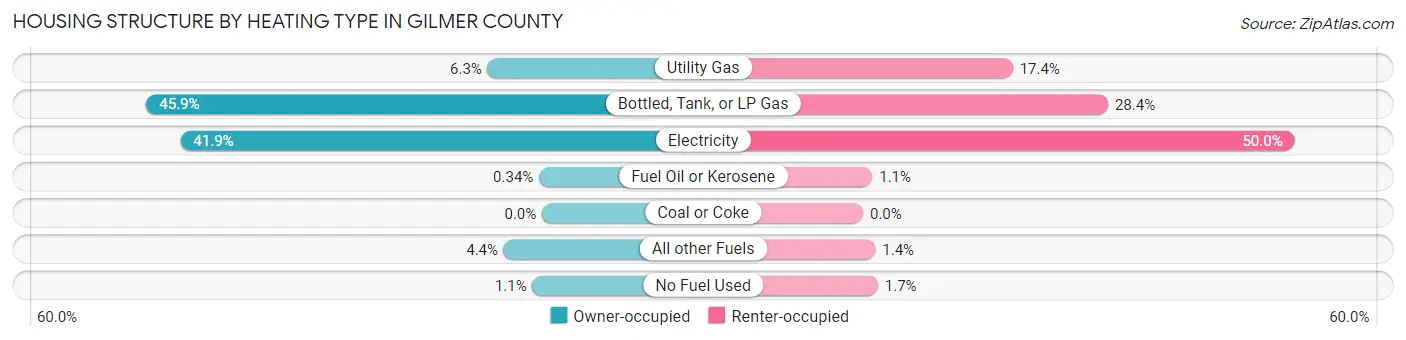
| Heating Type | Owner-occupied | Renter-occupied |
| Utility Gas | 618 (6.3%) | 534 (17.3%) |
| Bottled, Tank, or LP Gas | 4,492 (45.9%) | 874 (28.4%) |
| Electricity | 4,105 (41.9%) | 1,539 (50.0%) |
| Fuel Oil or Kerosene | 33 (0.3%) | 33 (1.1%) |
| Coal or Coke | 0 (0.0%) | 0 (0.0%) |
| All other Fuels | 434 (4.4%) | 44 (1.4%) |
| No Fuel Used | 109 (1.1%) | 53 (1.7%) |
| Total | 9,791 (100.0%) | 3,077 (100.0%) |
Household Vehicle Usage in Gilmer County
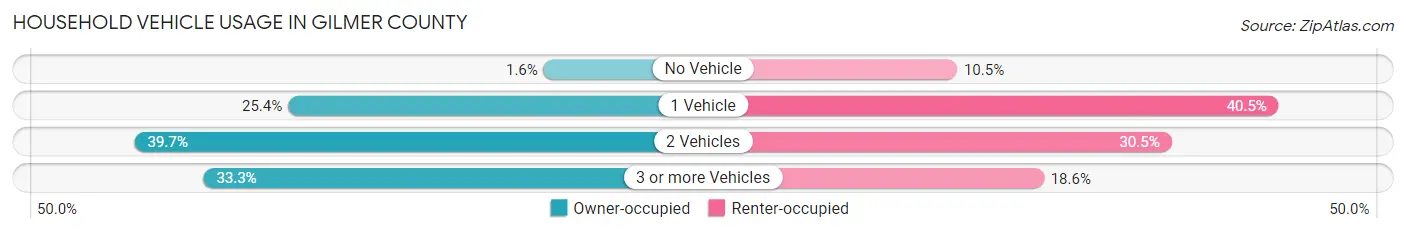
| Vehicles per Household | Owner-occupied | Renter-occupied |
| No Vehicle | 152 (1.5%) | 322 (10.5%) |
| 1 Vehicle | 2,488 (25.4%) | 1,246 (40.5%) |
| 2 Vehicles | 3,891 (39.7%) | 938 (30.5%) |
| 3 or more Vehicles | 3,260 (33.3%) | 571 (18.6%) |
| Total | 9,791 (100.0%) | 3,077 (100.0%) |
Real Estate & Mortgages in Gilmer County
Real Estate and Mortgage Overview in Gilmer County
| Characteristic | Without Mortgage | With Mortgage |
| Housing Units | 4,571 | 5,220 |
| Median Property Value | $237,300 | $271,900 |
| Median Household Income | $62,037 | $903 |
| Monthly Housing Costs | $398 | $180 |
| Real Estate Taxes | $870 | $41 |
Property Value by Mortgage Status in Gilmer County
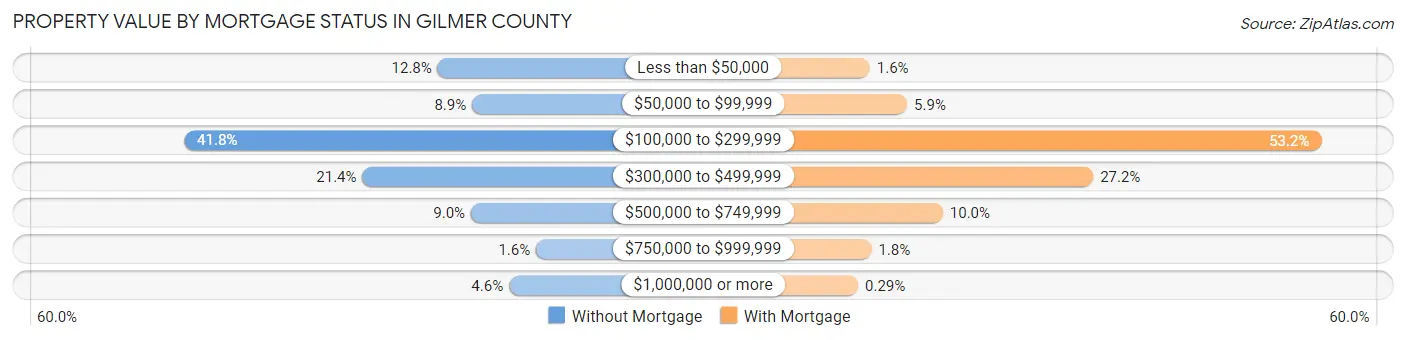
| Property Value | Without Mortgage | With Mortgage |
| Less than $50,000 | 585 (12.8%) | 85 (1.6%) |
| $50,000 to $99,999 | 405 (8.9%) | 308 (5.9%) |
| $100,000 to $299,999 | 1,909 (41.8%) | 2,778 (53.2%) |
| $300,000 to $499,999 | 978 (21.4%) | 1,418 (27.2%) |
| $500,000 to $749,999 | 411 (9.0%) | 521 (10.0%) |
| $750,000 to $999,999 | 71 (1.5%) | 95 (1.8%) |
| $1,000,000 or more | 212 (4.6%) | 15 (0.3%) |
| Total | 4,571 (100.0%) | 5,220 (100.0%) |
Household Income by Mortgage Status in Gilmer County
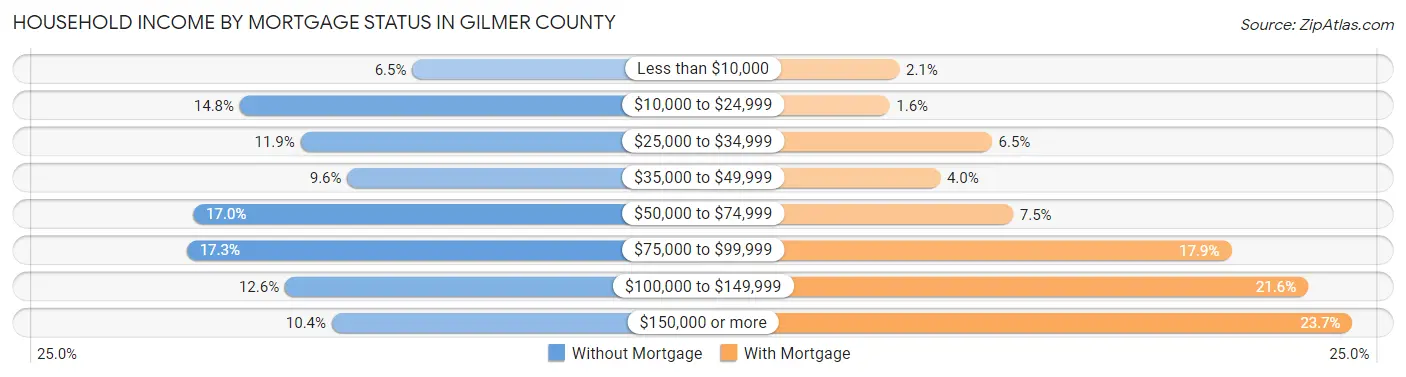
| Household Income | Without Mortgage | With Mortgage |
| Less than $10,000 | 299 (6.5%) | 108 (2.1%) |
| $10,000 to $24,999 | 674 (14.7%) | 84 (1.6%) |
| $25,000 to $34,999 | 542 (11.9%) | 338 (6.5%) |
| $35,000 to $49,999 | 440 (9.6%) | 210 (4.0%) |
| $50,000 to $74,999 | 776 (17.0%) | 391 (7.5%) |
| $75,000 to $99,999 | 790 (17.3%) | 934 (17.9%) |
| $100,000 to $149,999 | 576 (12.6%) | 1,125 (21.5%) |
| $150,000 or more | 474 (10.4%) | 1,235 (23.7%) |
| Total | 4,571 (100.0%) | 5,220 (100.0%) |
Property Value to Household Income Ratio in Gilmer County
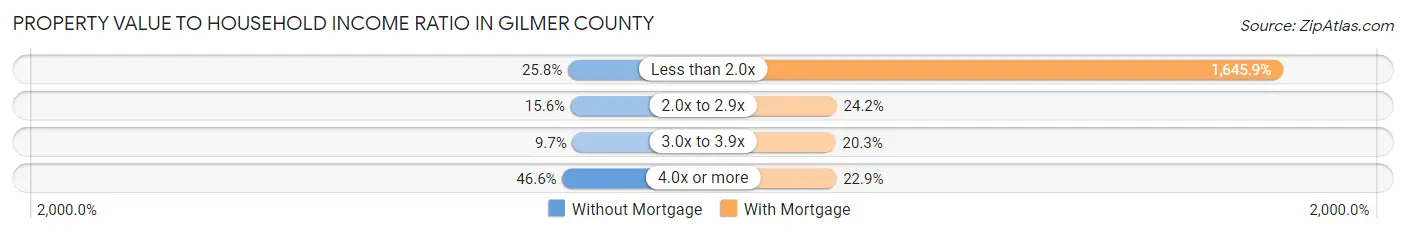
| Value-to-Income Ratio | Without Mortgage | With Mortgage |
| Less than 2.0x | 1,180 (25.8%) | 85,914 (1,645.9%) |
| 2.0x to 2.9x | 715 (15.6%) | 1,264 (24.2%) |
| 3.0x to 3.9x | 443 (9.7%) | 1,061 (20.3%) |
| 4.0x or more | 2,130 (46.6%) | 1,197 (22.9%) |
| Total | 4,571 (100.0%) | 5,220 (100.0%) |
Real Estate Taxes by Mortgage Status in Gilmer County
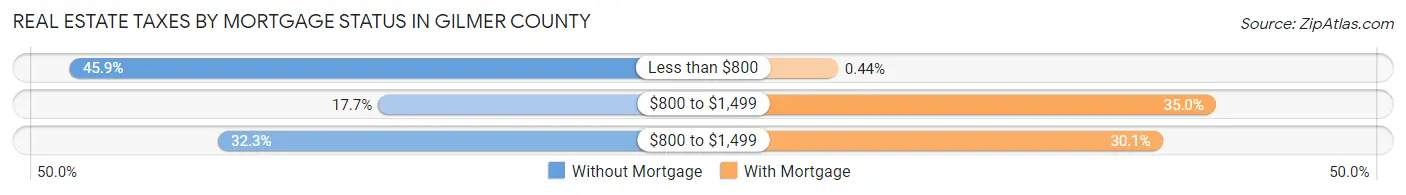
| Property Taxes | Without Mortgage | With Mortgage |
| Less than $800 | 2,096 (45.9%) | 23 (0.4%) |
| $800 to $1,499 | 810 (17.7%) | 1,825 (35.0%) |
| $800 to $1,499 | 1,478 (32.3%) | 1,571 (30.1%) |
| Total | 4,571 (100.0%) | 5,220 (100.0%) |
Health & Disability in Gilmer County
Health Insurance Coverage by Age in Gilmer County
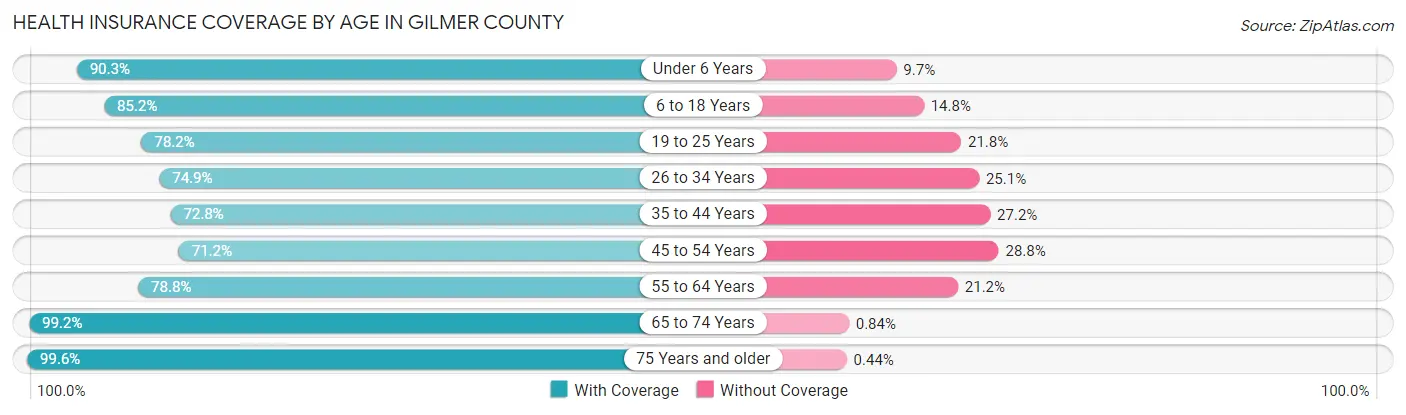
| Age Bracket | With Coverage | Without Coverage |
| Under 6 Years | 1,718 (90.3%) | 185 (9.7%) |
| 6 to 18 Years | 3,618 (85.2%) | 629 (14.8%) |
| 19 to 25 Years | 1,677 (78.2%) | 467 (21.8%) |
| 26 to 34 Years | 2,027 (74.9%) | 680 (25.1%) |
| 35 to 44 Years | 2,358 (72.8%) | 881 (27.2%) |
| 45 to 54 Years | 2,750 (71.2%) | 1,110 (28.8%) |
| 55 to 64 Years | 4,111 (78.8%) | 1,105 (21.2%) |
| 65 to 74 Years | 5,073 (99.2%) | 43 (0.8%) |
| 75 Years and older | 2,919 (99.6%) | 13 (0.4%) |
| Total | 26,251 (83.7%) | 5,113 (16.3%) |
Health Insurance Coverage by Citizenship Status in Gilmer County
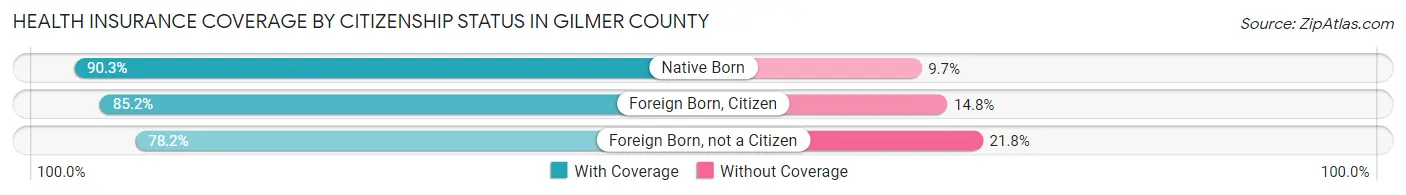
| Citizenship Status | With Coverage | Without Coverage |
| Native Born | 1,718 (90.3%) | 185 (9.7%) |
| Foreign Born, Citizen | 3,618 (85.2%) | 629 (14.8%) |
| Foreign Born, not a Citizen | 1,677 (78.2%) | 467 (21.8%) |
Health Insurance Coverage by Household Income in Gilmer County
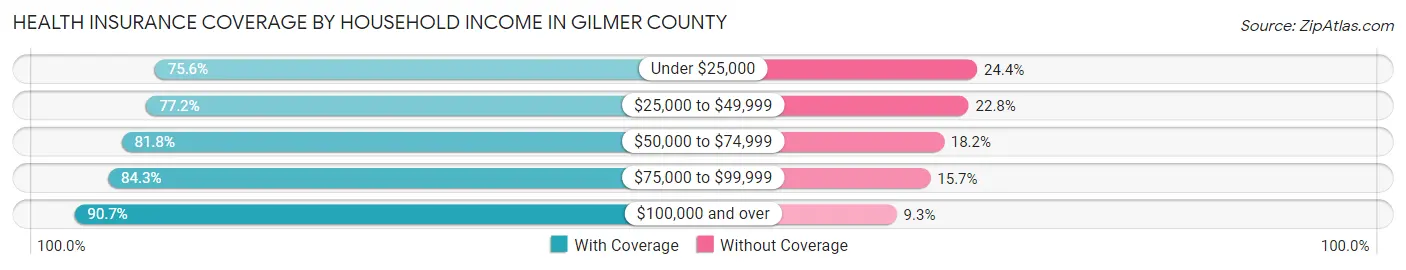
| Household Income | With Coverage | Without Coverage |
| Under $25,000 | 3,115 (75.6%) | 1,006 (24.4%) |
| $25,000 to $49,999 | 4,044 (77.2%) | 1,196 (22.8%) |
| $50,000 to $74,999 | 4,214 (81.8%) | 936 (18.2%) |
| $75,000 to $99,999 | 5,077 (84.3%) | 943 (15.7%) |
| $100,000 and over | 9,754 (90.7%) | 1,005 (9.3%) |
Public vs Private Health Insurance Coverage by Age in Gilmer County
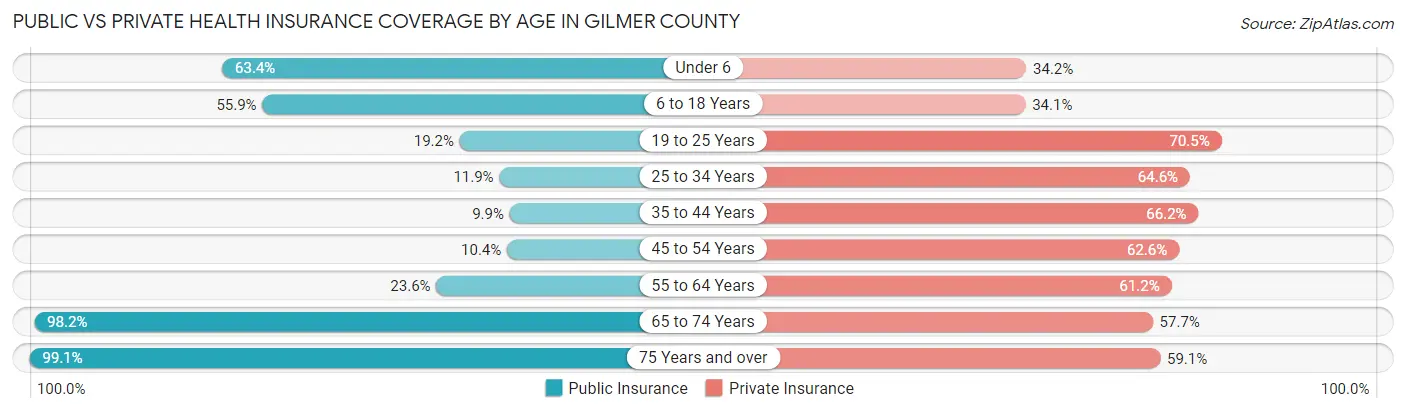
| Age Bracket | Public Insurance | Private Insurance |
| Under 6 | 1,206 (63.4%) | 651 (34.2%) |
| 6 to 18 Years | 2,372 (55.8%) | 1,446 (34.1%) |
| 19 to 25 Years | 412 (19.2%) | 1,511 (70.5%) |
| 25 to 34 Years | 321 (11.9%) | 1,749 (64.6%) |
| 35 to 44 Years | 322 (9.9%) | 2,144 (66.2%) |
| 45 to 54 Years | 403 (10.4%) | 2,416 (62.6%) |
| 55 to 64 Years | 1,229 (23.6%) | 3,192 (61.2%) |
| 65 to 74 Years | 5,025 (98.2%) | 2,952 (57.7%) |
| 75 Years and over | 2,906 (99.1%) | 1,732 (59.1%) |
| Total | 14,196 (45.3%) | 17,793 (56.7%) |
Disability Status by Sex by Age in Gilmer County
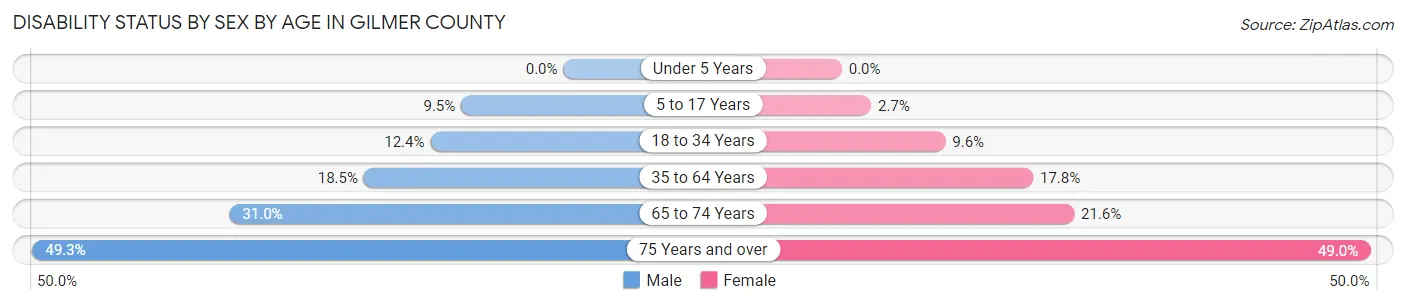
| Age Bracket | Male | Female |
| Under 5 Years | 0 (0.0%) | 0 (0.0%) |
| 5 to 17 Years | 212 (9.5%) | 58 (2.7%) |
| 18 to 34 Years | 329 (12.3%) | 231 (9.6%) |
| 35 to 64 Years | 1,152 (18.5%) | 1,082 (17.7%) |
| 65 to 74 Years | 772 (31.0%) | 566 (21.6%) |
| 75 Years and over | 683 (49.3%) | 758 (49.0%) |
Disability Class by Sex by Age in Gilmer County
Disability Class: Hearing Difficulty
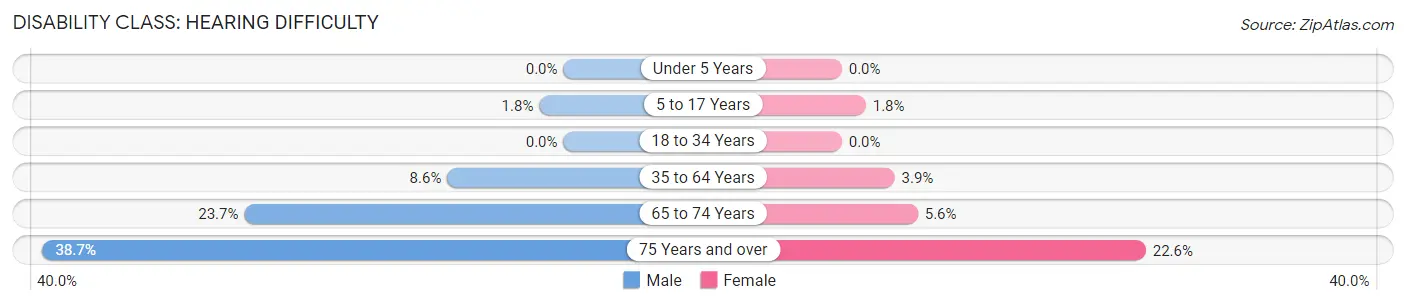
| Age Bracket | Male | Female |
| Under 5 Years | 0 (0.0%) | 0 (0.0%) |
| 5 to 17 Years | 40 (1.8%) | 38 (1.8%) |
| 18 to 34 Years | 0 (0.0%) | 0 (0.0%) |
| 35 to 64 Years | 536 (8.6%) | 239 (3.9%) |
| 65 to 74 Years | 590 (23.7%) | 148 (5.6%) |
| 75 Years and over | 536 (38.7%) | 349 (22.6%) |
Disability Class: Vision Difficulty
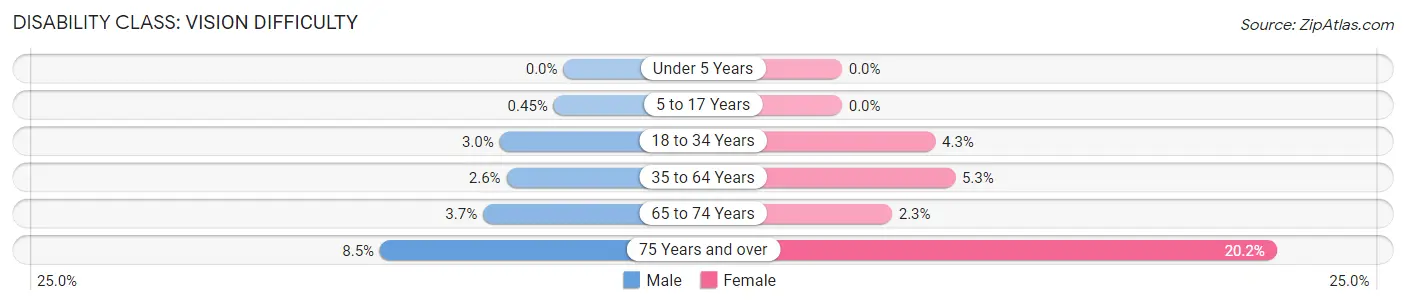
| Age Bracket | Male | Female |
| Under 5 Years | 0 (0.0%) | 0 (0.0%) |
| 5 to 17 Years | 10 (0.4%) | 0 (0.0%) |
| 18 to 34 Years | 79 (3.0%) | 104 (4.3%) |
| 35 to 64 Years | 164 (2.6%) | 320 (5.2%) |
| 65 to 74 Years | 93 (3.7%) | 61 (2.3%) |
| 75 Years and over | 118 (8.5%) | 312 (20.2%) |
Disability Class: Cognitive Difficulty
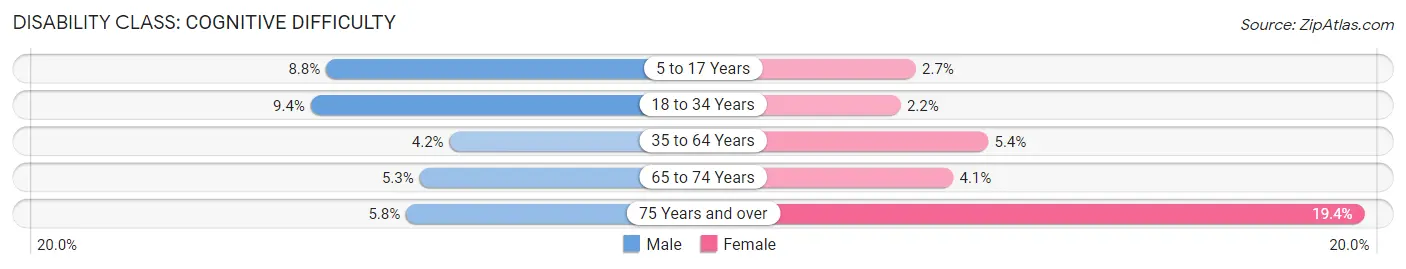
| Age Bracket | Male | Female |
| 5 to 17 Years | 197 (8.8%) | 58 (2.7%) |
| 18 to 34 Years | 250 (9.4%) | 52 (2.2%) |
| 35 to 64 Years | 263 (4.2%) | 330 (5.4%) |
| 65 to 74 Years | 133 (5.3%) | 108 (4.1%) |
| 75 Years and over | 81 (5.8%) | 300 (19.4%) |
Disability Class: Ambulatory Difficulty
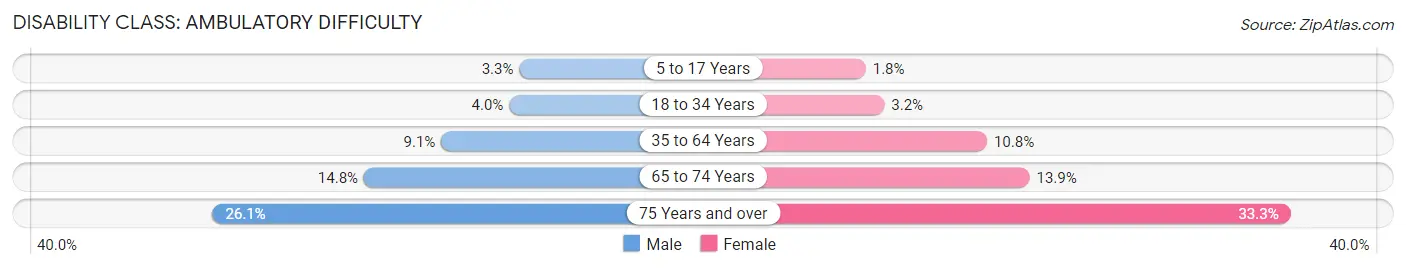
| Age Bracket | Male | Female |
| 5 to 17 Years | 73 (3.3%) | 38 (1.8%) |
| 18 to 34 Years | 107 (4.0%) | 76 (3.2%) |
| 35 to 64 Years | 564 (9.1%) | 657 (10.8%) |
| 65 to 74 Years | 369 (14.8%) | 366 (13.9%) |
| 75 Years and over | 361 (26.1%) | 515 (33.3%) |
Disability Class: Self-Care Difficulty
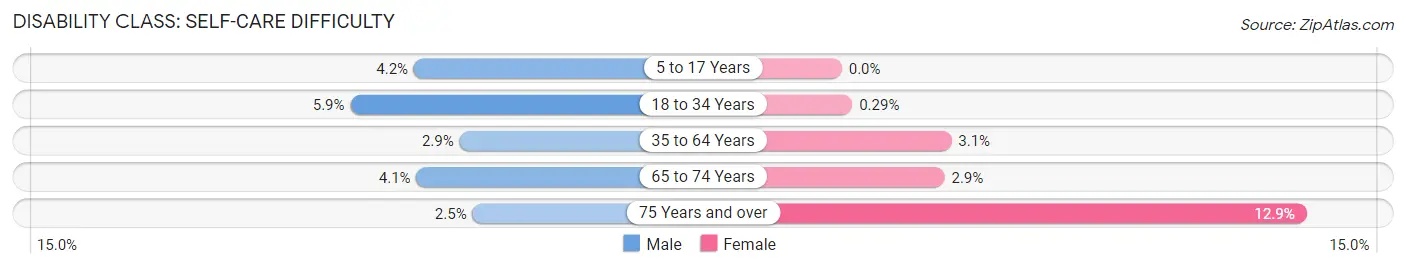
| Age Bracket | Male | Female |
| 5 to 17 Years | 93 (4.2%) | 0 (0.0%) |
| 18 to 34 Years | 158 (5.9%) | 7 (0.3%) |
| 35 to 64 Years | 180 (2.9%) | 186 (3.0%) |
| 65 to 74 Years | 102 (4.1%) | 75 (2.9%) |
| 75 Years and over | 35 (2.5%) | 200 (12.9%) |
Technology Access in Gilmer County
Computing Device Access in Gilmer County
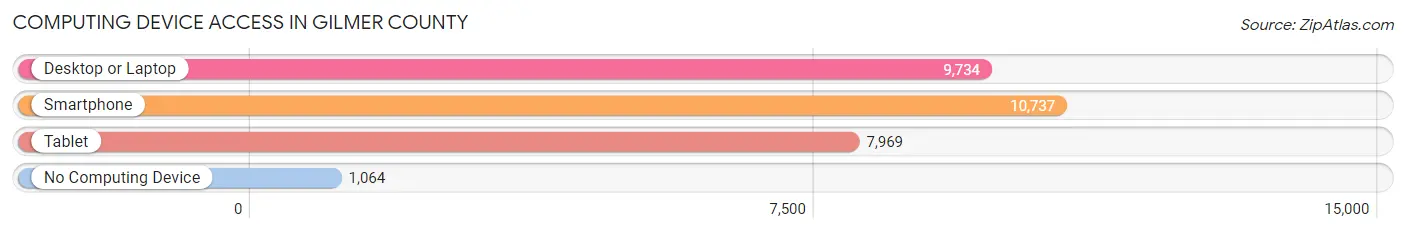
| Device Type | # Households | % Households |
| Desktop or Laptop | 9,734 | 75.6% |
| Smartphone | 10,737 | 83.4% |
| Tablet | 7,969 | 61.9% |
| No Computing Device | 1,064 | 8.3% |
| Total | 12,868 | 100.0% |
Internet Access in Gilmer County
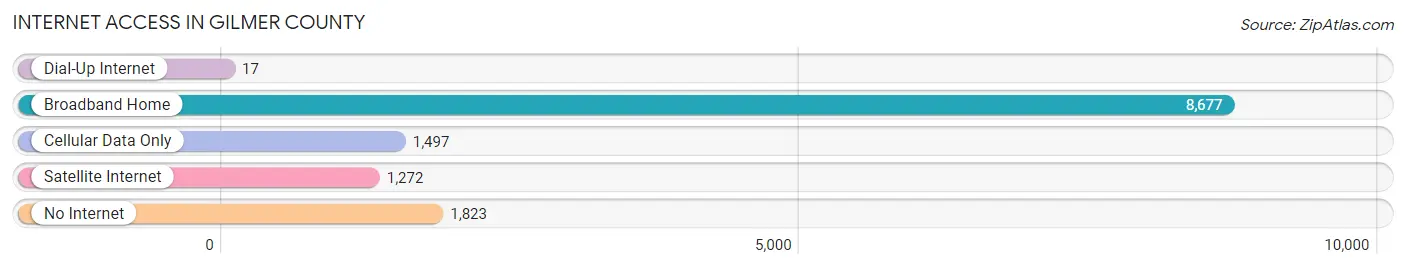
| Internet Type | # Households | % Households |
| Dial-Up Internet | 17 | 0.1% |
| Broadband Home | 8,677 | 67.4% |
| Cellular Data Only | 1,497 | 11.6% |
| Satellite Internet | 1,272 | 9.9% |
| No Internet | 1,823 | 14.2% |
| Total | 12,868 | 100.0% |
Gilmer County Summary
Gilmer County is located in the north-central part of the state of Georgia, in the foothills of the Appalachian Mountains. It is bordered by Fannin County to the north, Pickens County to the east, Dawson County to the south, and Cherokee County to the west. The county seat is Ellijay, and the county is named for George Rockingham Gilmer, who served as Governor of Georgia from 1829 to 1831.
History
The area that is now Gilmer County was originally inhabited by the Cherokee Indians. The Cherokee were forcibly removed from the area in the 1830s as part of the Indian Removal Act. The land was then divided up and sold to settlers, mostly from the Carolinas and Virginia. The county was officially established in 1832, and Ellijay was chosen as the county seat.
The county was largely agricultural in the 19th century, with cotton, corn, and tobacco being the main crops. The county also had a thriving timber industry, with the Ellijay Lumber Company being one of the largest employers in the area.
In the early 20th century, the county began to diversify its economy. The Ellijay Canning Company was established in 1912, and the county also had a thriving apple industry. The county also had a number of small manufacturing companies, including a furniture factory and a textile mill.
Geography
Gilmer County covers an area of approximately 437 square miles. The terrain is mostly mountainous, with the highest point being Brasstown Bald, which has an elevation of 4,784 feet. The county is drained by the Coosawattee River and its tributaries.
The county is located in the Chattahoochee National Forest, and is home to a number of state parks and recreation areas, including Amicalola Falls State Park, Fort Mountain State Park, and Vogel State Park.
Economy
The economy of Gilmer County is largely based on tourism and agriculture. The county is home to a number of apple orchards, and is also known for its production of blueberries, peaches, and other fruits and vegetables. The county also has a thriving timber industry, and is home to a number of small manufacturing companies.
The county is also home to a number of wineries and breweries, as well as a number of outdoor recreation businesses. The county is also home to a number of bed and breakfasts, as well as a number of campgrounds and RV parks.
Demographics
As of the 2010 census, Gilmer County had a population of 28,292. The population was spread out, with 24.3% under the age of 18, 8.2% from 18 to 24, 28.2% from 25 to 44, 24.3% from 45 to 64, and 14.0% who were 65 years of age or older. The median age was 37.4 years.
The median income for a household in the county was $41,945, and the median income for a family was $50,945. The per capita income for the county was $21,945. About 11.2% of families and 14.7% of the population were below the poverty line, including 19.2% of those under age 18 and 10.2% of those age 65 or over.
Common Questions
What is Per Capita Income in Gilmer County?
Per Capita income in Gilmer County is $34,412.
What is the Median Family Income in Gilmer County?
Median Family Income in Gilmer County is $78,531.
What is the Median Household income in Gilmer County?
Median Household Income in Gilmer County is $70,334.
What is Income or Wage Gap in Gilmer County?
Income or Wage Gap in Gilmer County is 28.4%.
Women in Gilmer County earn 71.6 cents for every dollar earned by a man.
What is Family Income Deficit in Gilmer County?
Family Income Deficit in Gilmer County is $9,351.
Families that are below poverty line in Gilmer County earn $9,351 less on average than the poverty threshold level.
What is Inequality or Gini Index in Gilmer County?
Inequality or Gini Index in Gilmer County is 0.44.
What is the Total Population of Gilmer County?
Total Population of Gilmer County is 31,519.
What is the Total Male Population of Gilmer County?
Total Male Population of Gilmer County is 15,692.
What is the Total Female Population of Gilmer County?
Total Female Population of Gilmer County is 15,827.
What is the Ratio of Males per 100 Females in Gilmer County?
There are 99.15 Males per 100 Females in Gilmer County.
What is the Ratio of Females per 100 Males in Gilmer County?
There are 100.86 Females per 100 Males in Gilmer County.
What is the Median Population Age in Gilmer County?
Median Population Age in Gilmer County is 49.6 Years.
What is the Average Family Size in Gilmer County
Average Family Size in Gilmer County is 2.9 People.
What is the Average Household Size in Gilmer County
Average Household Size in Gilmer County is 2.4 People.
How Large is the Labor Force in Gilmer County?
There are 13,909 People in the Labor Forcein in Gilmer County.
What is the Percentage of People in the Labor Force in Gilmer County?
53.2% of People are in the Labor Force in Gilmer County.
What is the Unemployment Rate in Gilmer County?
Unemployment Rate in Gilmer County is 2.4%.