Franklin County, GA Map & Demographics
Franklin County Map
Franklin County Overview
$27,671
PER CAPITA INCOME
$63,774
AVG FAMILY INCOME
$52,597
AVG HOUSEHOLD INCOME
39.2%
WAGE / INCOME GAP [ % ]
60.8¢/ $1
WAGE / INCOME GAP [ $ ]
$9,440
FAMILY INCOME DEFICIT
0.48
INEQUALITY / GINI INDEX
23,480
TOTAL POPULATION
11,680
MALE POPULATION
11,800
FEMALE POPULATION
98.98
MALES / 100 FEMALES
101.03
FEMALES / 100 MALES
40.9
MEDIAN AGE
3.1
AVG FAMILY SIZE
2.7
AVG HOUSEHOLD SIZE
10,125
LABOR FORCE [ PEOPLE ]
53.0%
PERCENT IN LABOR FORCE
6.2%
UNEMPLOYMENT RATE
Income in Franklin County
Income Overview in Franklin County
Per Capita Income in Franklin County is $27,671, while median incomes of families and households are $63,774 and $52,597 respectively.
| Characteristic | Number | Measure |
| Per Capita Income | 23,480 | $27,671 |
| Median Family Income | 6,103 | $63,774 |
| Mean Family Income | 6,103 | $80,961 |
| Median Household Income | 8,539 | $52,597 |
| Mean Household Income | 8,539 | $71,474 |
| Income Deficit | 6,103 | $9,440 |
| Wage / Income Gap (%) | 23,480 | 39.15% |
| Wage / Income Gap ($) | 23,480 | 60.85¢ per $1 |
| Gini / Inequality Index | 23,480 | 0.48 |
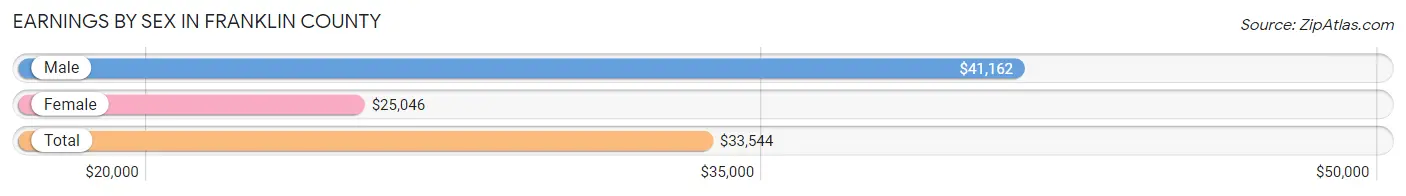
Earnings by Sex in Franklin County
Average Earnings in Franklin County are $33,544, $41,162 for men and $25,046 for women, a difference of 39.2%.
| Sex | Number | Average Earnings |
| Male | 5,484 (51.0%) | $41,162 |
| Female | 5,258 (48.9%) | $25,046 |
| Total | 10,742 (100.0%) | $33,544 |
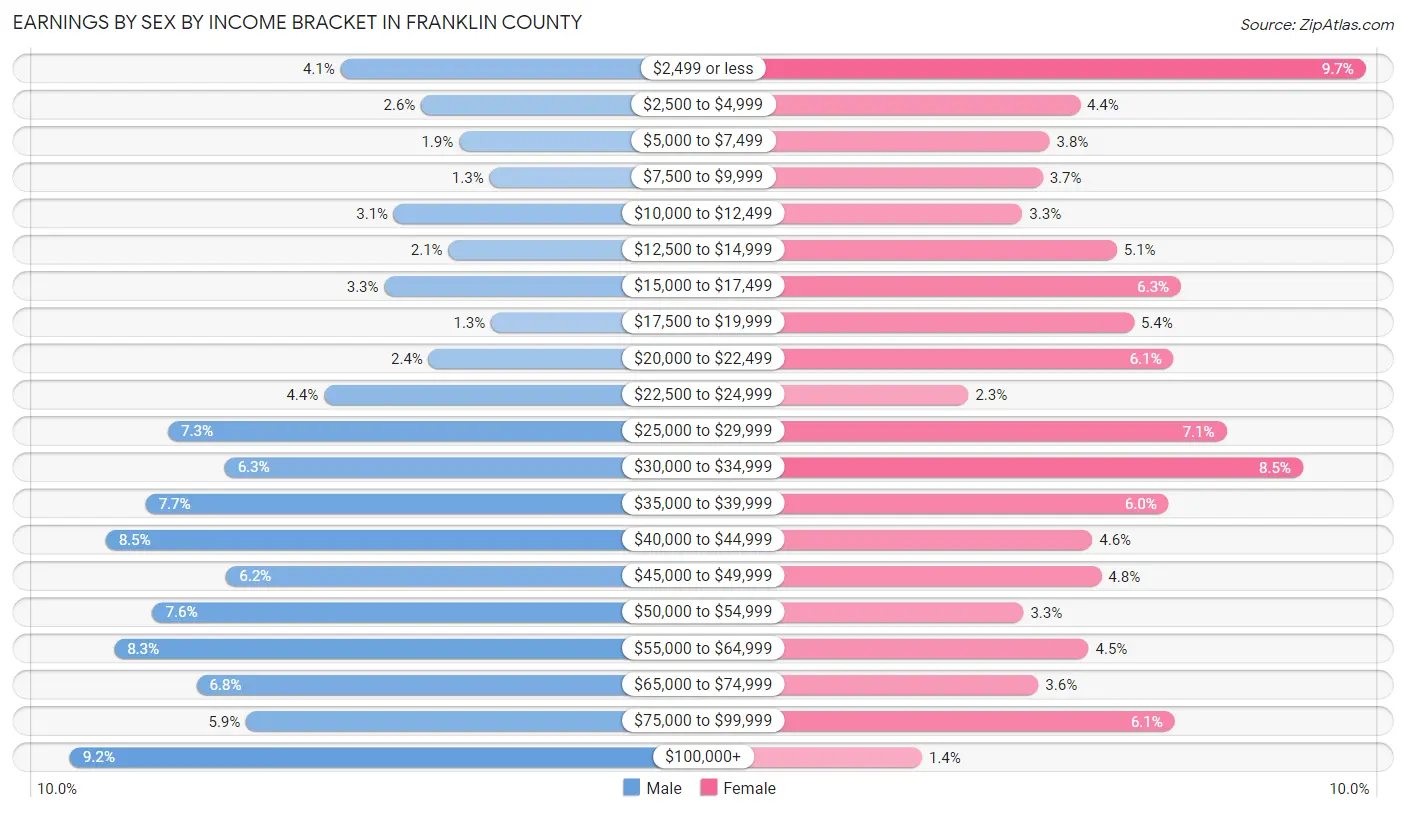
Earnings by Sex by Income Bracket in Franklin County
The most common earnings brackets in Franklin County are $100,000+ for men (502 | 9.1%) and $2,499 or less for women (511 | 9.7%).
| Income | Male | Female |
| $2,499 or less | 224 (4.1%) | 511 (9.7%) |
| $2,500 to $4,999 | 141 (2.6%) | 230 (4.4%) |
| $5,000 to $7,499 | 102 (1.9%) | 200 (3.8%) |
| $7,500 to $9,999 | 71 (1.3%) | 193 (3.7%) |
| $10,000 to $12,499 | 169 (3.1%) | 173 (3.3%) |
| $12,500 to $14,999 | 113 (2.1%) | 266 (5.1%) |
| $15,000 to $17,499 | 179 (3.3%) | 329 (6.3%) |
| $17,500 to $19,999 | 69 (1.3%) | 283 (5.4%) |
| $20,000 to $22,499 | 133 (2.4%) | 322 (6.1%) |
| $22,500 to $24,999 | 241 (4.4%) | 120 (2.3%) |
| $25,000 to $29,999 | 401 (7.3%) | 374 (7.1%) |
| $30,000 to $34,999 | 343 (6.2%) | 449 (8.5%) |
| $35,000 to $39,999 | 424 (7.7%) | 317 (6.0%) |
| $40,000 to $44,999 | 465 (8.5%) | 242 (4.6%) |
| $45,000 to $49,999 | 341 (6.2%) | 251 (4.8%) |
| $50,000 to $54,999 | 417 (7.6%) | 174 (3.3%) |
| $55,000 to $64,999 | 456 (8.3%) | 238 (4.5%) |
| $65,000 to $74,999 | 372 (6.8%) | 189 (3.6%) |
| $75,000 to $99,999 | 321 (5.9%) | 323 (6.1%) |
| $100,000+ | 502 (9.1%) | 74 (1.4%) |
| Total | 5,484 (100.0%) | 5,258 (100.0%) |
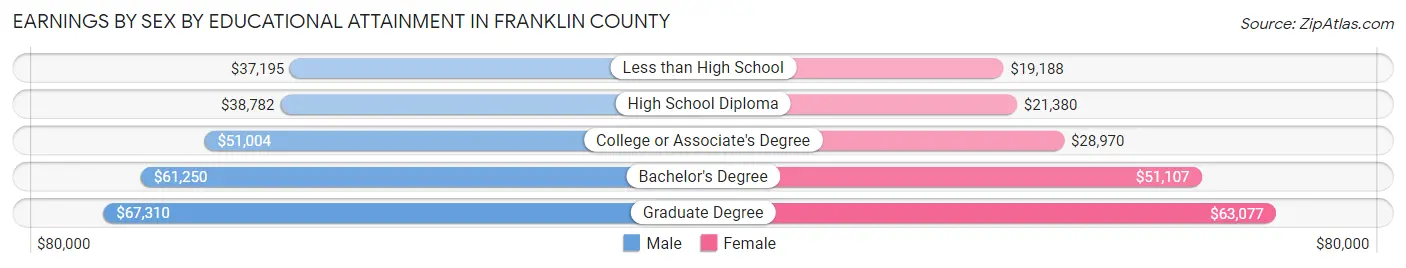
Earnings by Sex by Educational Attainment in Franklin County
Average earnings in Franklin County are $45,495 for men and $29,887 for women, a difference of 34.3%. Men with an educational attainment of graduate degree enjoy the highest average annual earnings of $67,310, while those with less than high school education earn the least with $37,195. Women with an educational attainment of graduate degree earn the most with the average annual earnings of $63,077, while those with less than high school education have the smallest earnings of $19,188.
| Educational Attainment | Male Income | Female Income |
| Less than High School | $37,195 | $19,188 |
| High School Diploma | $38,782 | $21,380 |
| College or Associate's Degree | $51,004 | $28,970 |
| Bachelor's Degree | $61,250 | $51,107 |
| Graduate Degree | $67,310 | $63,077 |
| Total | $45,495 | $29,887 |
Family Income in Franklin County
Family Income Brackets in Franklin County
According to the Franklin County family income data, there are 1,288 families falling into the $50,000 to $74,999 income range, which is the most common income bracket and makes up 21.1% of all families. Conversely, the less than $10,000 income bracket is the least frequent group with only 195 families (3.2%) belonging to this category.
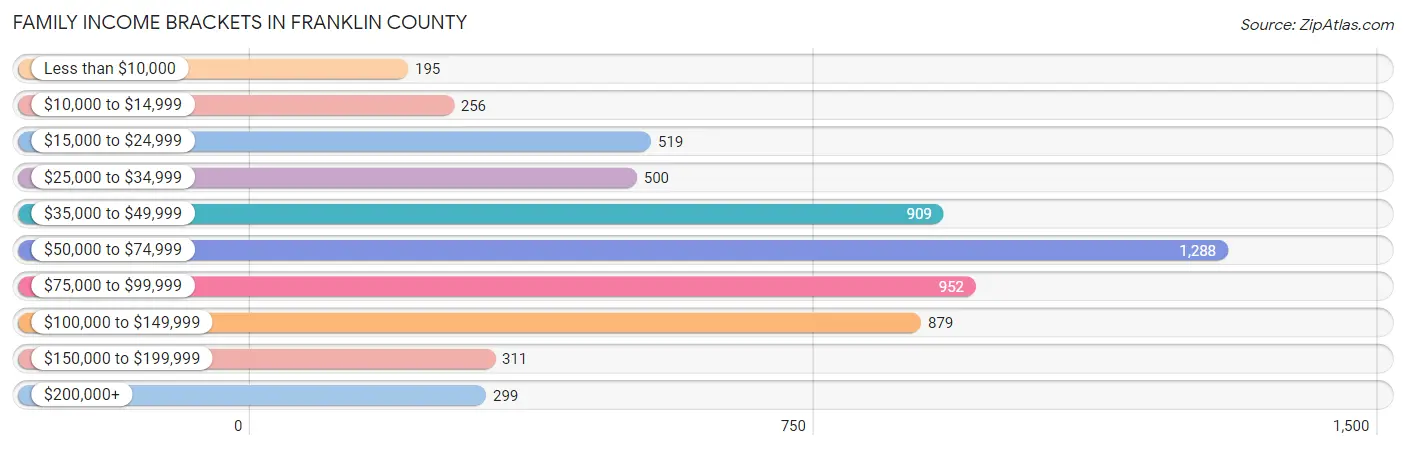
| Income Bracket | # Families | % Families |
| Less than $10,000 | 195 | 3.2% |
| $10,000 to $14,999 | 256 | 4.2% |
| $15,000 to $24,999 | 519 | 8.5% |
| $25,000 to $34,999 | 500 | 8.2% |
| $35,000 to $49,999 | 909 | 14.9% |
| $50,000 to $74,999 | 1,288 | 21.1% |
| $75,000 to $99,999 | 952 | 15.6% |
| $100,000 to $149,999 | 879 | 14.4% |
| $150,000 to $199,999 | 311 | 5.1% |
| $200,000+ | 299 | 4.9% |
Family Income by Famaliy Size in Franklin County
6-person families (67 | 1.1%) account for the highest median family income in Franklin County with $134,861 per family, while 2-person families (3,041 | 49.8%) have the highest median income of $29,326 per family member.
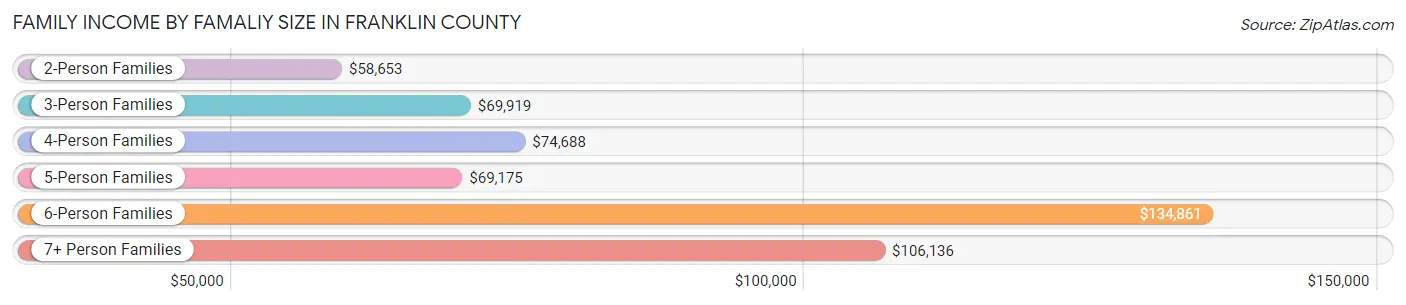
| Income Bracket | # Families | Median Income |
| 2-Person Families | 3,041 (49.8%) | $58,653 |
| 3-Person Families | 1,622 (26.6%) | $69,919 |
| 4-Person Families | 975 (16.0%) | $74,688 |
| 5-Person Families | 312 (5.1%) | $69,175 |
| 6-Person Families | 67 (1.1%) | $134,861 |
| 7+ Person Families | 86 (1.4%) | $106,136 |
| Total | 6,103 (100.0%) | $63,774 |
Family Income by Number of Earners in Franklin County
The median family income in Franklin County is $63,774, with families comprising 3+ earners (620) having the highest median family income of $129,323, while families with no earners (1,497) have the lowest median family income of $38,050, accounting for 10.2% and 24.5% of families, respectively.
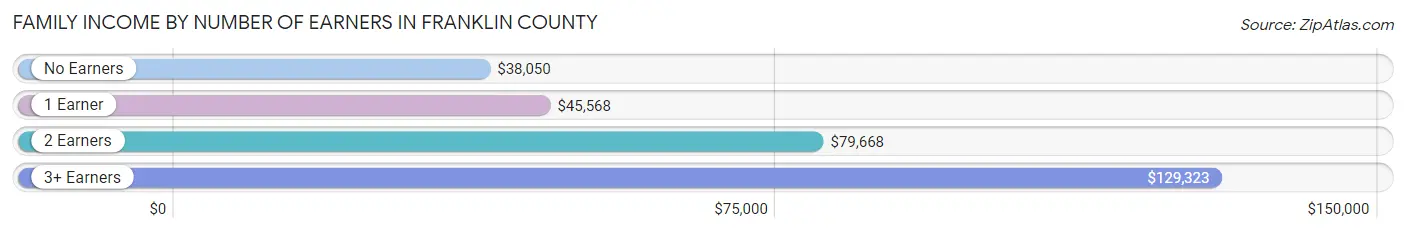
| Number of Earners | # Families | Median Income |
| No Earners | 1,497 (24.5%) | $38,050 |
| 1 Earner | 1,785 (29.2%) | $45,568 |
| 2 Earners | 2,201 (36.1%) | $79,668 |
| 3+ Earners | 620 (10.2%) | $129,323 |
| Total | 6,103 (100.0%) | $63,774 |
Household Income in Franklin County
Household Income Brackets in Franklin County
With 1,631 households falling in the category, the $50,000 to $74,999 income range is the most frequent in Franklin County, accounting for 19.1% of all households. In contrast, only 367 households (4.3%) fall into the $150,000 to $199,999 income bracket, making it the least populous group.
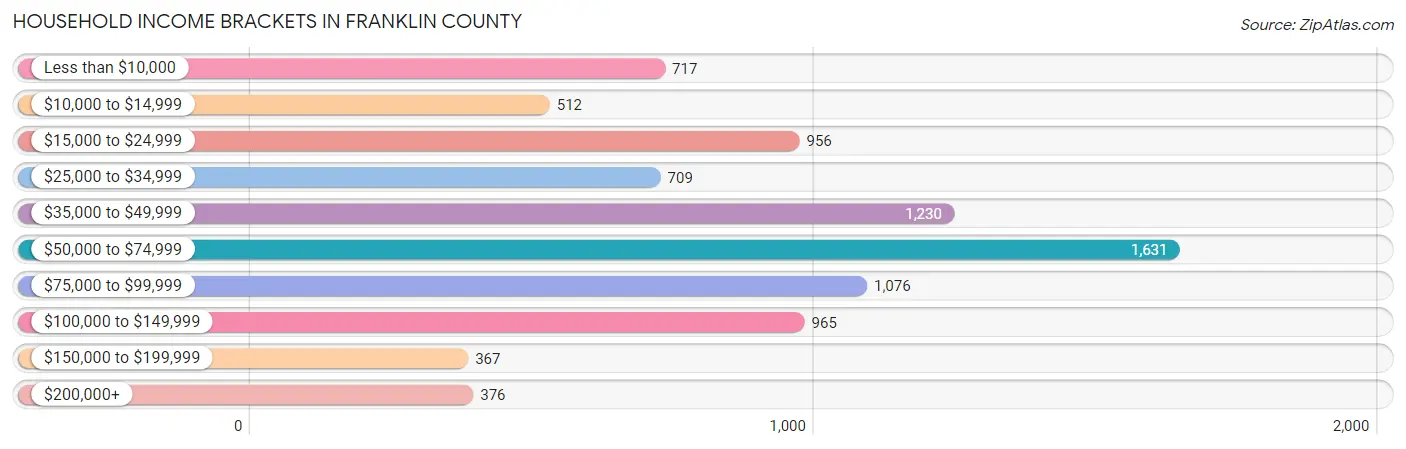
| Income Bracket | # Households | % Households |
| Less than $10,000 | 717 | 8.4% |
| $10,000 to $14,999 | 512 | 6.0% |
| $15,000 to $24,999 | 956 | 11.2% |
| $25,000 to $34,999 | 709 | 8.3% |
| $35,000 to $49,999 | 1,230 | 14.4% |
| $50,000 to $74,999 | 1,631 | 19.1% |
| $75,000 to $99,999 | 1,076 | 12.6% |
| $100,000 to $149,999 | 965 | 11.3% |
| $150,000 to $199,999 | 367 | 4.3% |
| $200,000+ | 376 | 4.4% |
Household Income by Householder Age in Franklin County
The median household income in Franklin County is $52,597, with the highest median household income of $62,479 found in the 25 to 44 years age bracket for the primary householder. A total of 2,094 households (24.5%) fall into this category. Meanwhile, the 15 to 24 years age bracket for the primary householder has the lowest median household income of $20,179, with 211 households (2.5%) in this group.
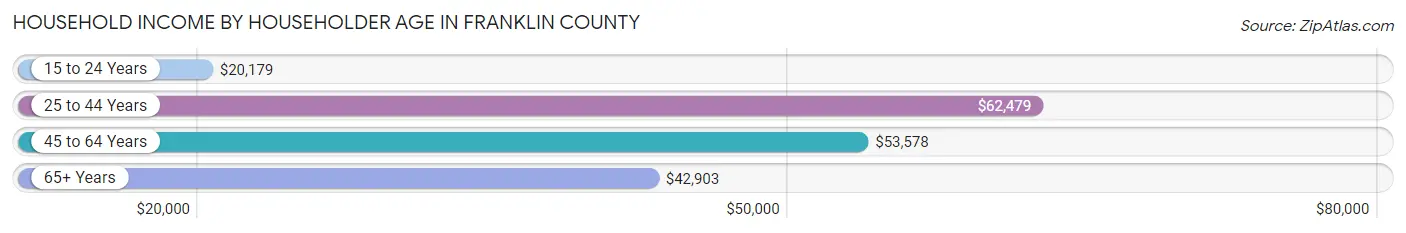
| Income Bracket | # Households | Median Income |
| 15 to 24 Years | 211 (2.5%) | $20,179 |
| 25 to 44 Years | 2,094 (24.5%) | $62,479 |
| 45 to 64 Years | 3,713 (43.5%) | $53,578 |
| 65+ Years | 2,521 (29.5%) | $42,903 |
| Total | 8,539 (100.0%) | $52,597 |
Poverty in Franklin County
Income Below Poverty by Sex and Age in Franklin County
With 18.3% poverty level for males and 18.6% for females among the residents of Franklin County, 5 year old males and 75 year old and over females are the most vulnerable to poverty, with 89 males (62.2%) and 295 females (27.9%) in their respective age groups living below the poverty level.
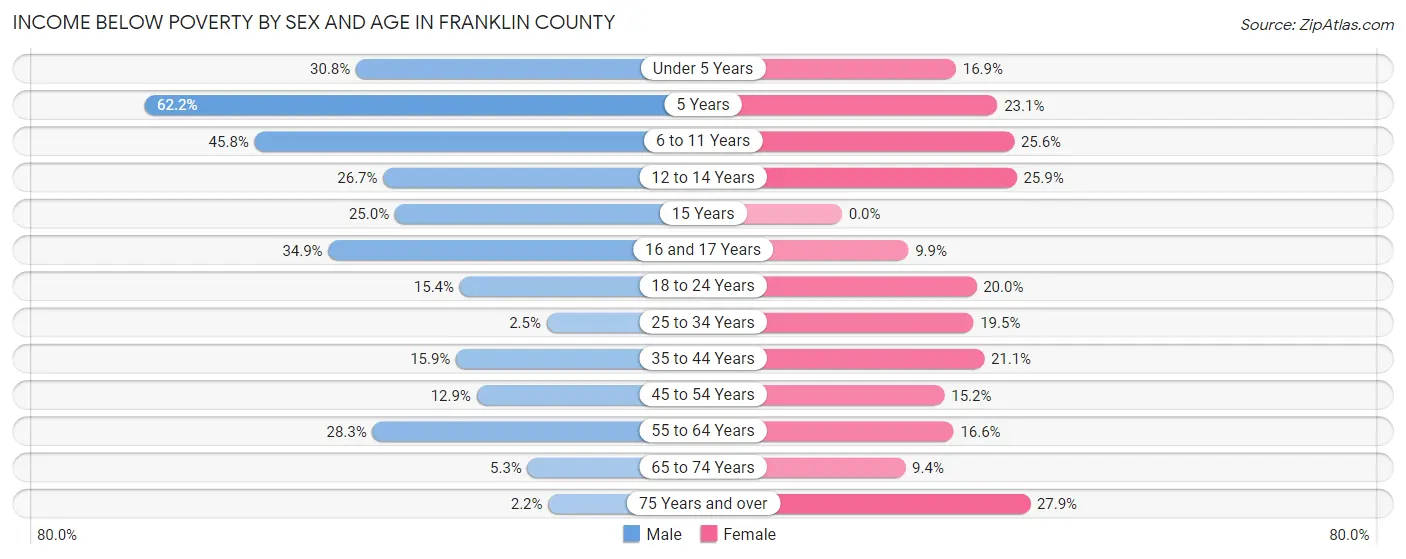
| Age Bracket | Male | Female |
| Under 5 Years | 196 (30.8%) | 85 (16.9%) |
| 5 Years | 89 (62.2%) | 24 (23.1%) |
| 6 to 11 Years | 336 (45.8%) | 194 (25.6%) |
| 12 to 14 Years | 135 (26.7%) | 138 (25.9%) |
| 15 Years | 12 (25.0%) | 0 (0.0%) |
| 16 and 17 Years | 128 (34.9%) | 35 (9.9%) |
| 18 to 24 Years | 158 (15.4%) | 209 (20.0%) |
| 25 to 34 Years | 33 (2.5%) | 260 (19.5%) |
| 35 to 44 Years | 197 (15.9%) | 269 (21.1%) |
| 45 to 54 Years | 211 (12.9%) | 224 (15.2%) |
| 55 to 64 Years | 470 (28.3%) | 260 (16.6%) |
| 65 to 74 Years | 61 (5.3%) | 128 (9.4%) |
| 75 Years and over | 15 (2.2%) | 295 (27.9%) |
| Total | 2,041 (18.3%) | 2,121 (18.6%) |
Income Above Poverty by Sex and Age in Franklin County
According to the poverty statistics in Franklin County, males aged 75 years and over and females aged 15 years are the age groups that are most secure financially, with 97.8% of males and 100.0% of females in these age groups living above the poverty line.
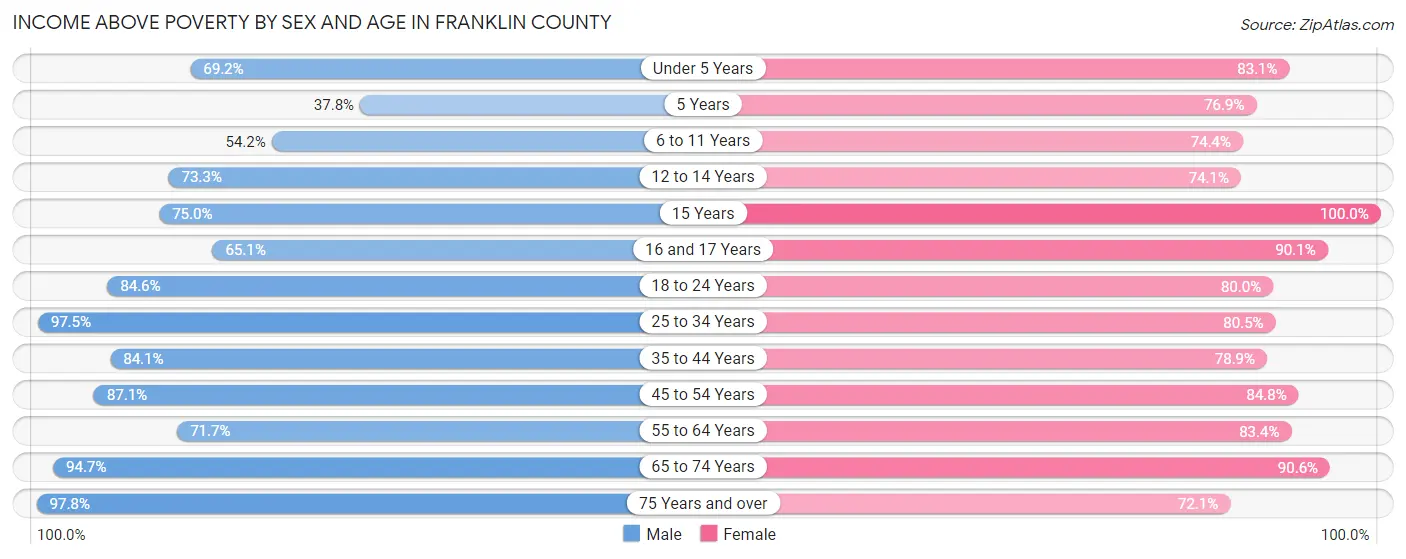
| Age Bracket | Male | Female |
| Under 5 Years | 441 (69.2%) | 417 (83.1%) |
| 5 Years | 54 (37.8%) | 80 (76.9%) |
| 6 to 11 Years | 397 (54.2%) | 565 (74.4%) |
| 12 to 14 Years | 370 (73.3%) | 394 (74.1%) |
| 15 Years | 36 (75.0%) | 51 (100.0%) |
| 16 and 17 Years | 239 (65.1%) | 320 (90.1%) |
| 18 to 24 Years | 870 (84.6%) | 838 (80.0%) |
| 25 to 34 Years | 1,309 (97.5%) | 1,072 (80.5%) |
| 35 to 44 Years | 1,041 (84.1%) | 1,005 (78.9%) |
| 45 to 54 Years | 1,429 (87.1%) | 1,248 (84.8%) |
| 55 to 64 Years | 1,189 (71.7%) | 1,308 (83.4%) |
| 65 to 74 Years | 1,090 (94.7%) | 1,232 (90.6%) |
| 75 Years and over | 659 (97.8%) | 761 (72.1%) |
| Total | 9,124 (81.7%) | 9,291 (81.4%) |
Income Below Poverty Among Married-Couple Families in Franklin County
The poverty statistics for married-couple families in Franklin County show that 5.1% or 224 of the total 4,413 families live below the poverty line. Families with 5 or more children have the highest poverty rate of 36.4%, comprising of 12 families. On the other hand, families with no children have the lowest poverty rate of 3.0%, which includes 89 families.
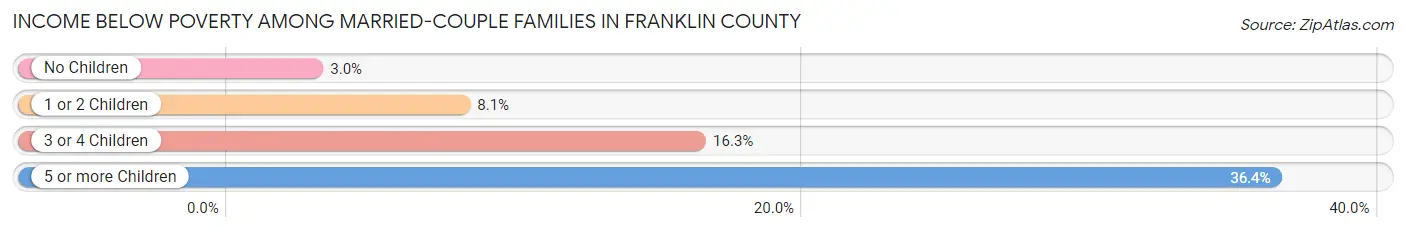
| Children | Above Poverty | Below Poverty |
| No Children | 2,908 (97.0%) | 89 (3.0%) |
| 1 or 2 Children | 1,147 (91.9%) | 101 (8.1%) |
| 3 or 4 Children | 113 (83.7%) | 22 (16.3%) |
| 5 or more Children | 21 (63.6%) | 12 (36.4%) |
| Total | 4,189 (94.9%) | 224 (5.1%) |
Income Below Poverty Among Single-Parent Households in Franklin County
According to the poverty data in Franklin County, 26.9% or 160 single-father households and 37.1% or 406 single-mother households are living below the poverty line. Among single-father households, those with 5 or more children have the highest poverty rate, with 10 households (90.9%) experiencing poverty. Likewise, among single-mother households, those with 3 or 4 children have the highest poverty rate, with 57 households (100.0%) falling below the poverty line.
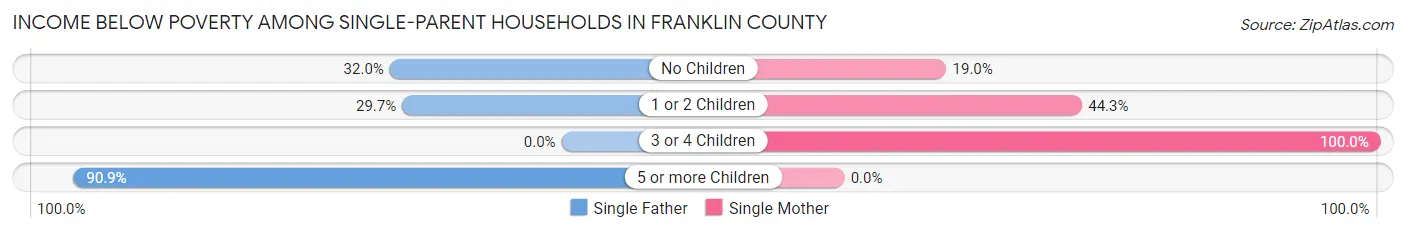
| Children | Single Father | Single Mother |
| No Children | 112 (32.0%) | 83 (19.0%) |
| 1 or 2 Children | 38 (29.7%) | 266 (44.3%) |
| 3 or 4 Children | 0 (0.0%) | 57 (100.0%) |
| 5 or more Children | 10 (90.9%) | 0 (0.0%) |
| Total | 160 (26.9%) | 406 (37.1%) |
Income Below Poverty Among Married-Couple vs Single-Parent Households in Franklin County
The poverty data for Franklin County shows that 224 of the married-couple family households (5.1%) and 566 of the single-parent households (33.5%) are living below the poverty level. Within the married-couple family households, those with 5 or more children have the highest poverty rate, with 12 households (36.4%) falling below the poverty line. Among the single-parent households, those with 5 or more children have the highest poverty rate, with 10 household (90.9%) living below poverty.
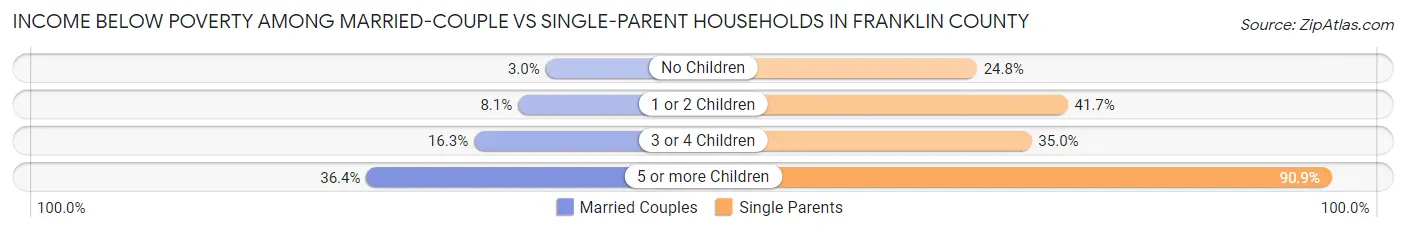
| Children | Married-Couple Families | Single-Parent Households |
| No Children | 89 (3.0%) | 195 (24.8%) |
| 1 or 2 Children | 101 (8.1%) | 304 (41.7%) |
| 3 or 4 Children | 22 (16.3%) | 57 (35.0%) |
| 5 or more Children | 12 (36.4%) | 10 (90.9%) |
| Total | 224 (5.1%) | 566 (33.5%) |
Race in Franklin County
The most populous races in Franklin County are White / Caucasian (19,492 | 83.0%), Black / African American (2,158 | 9.2%), and Hispanic or Latino (1,243 | 5.3%).
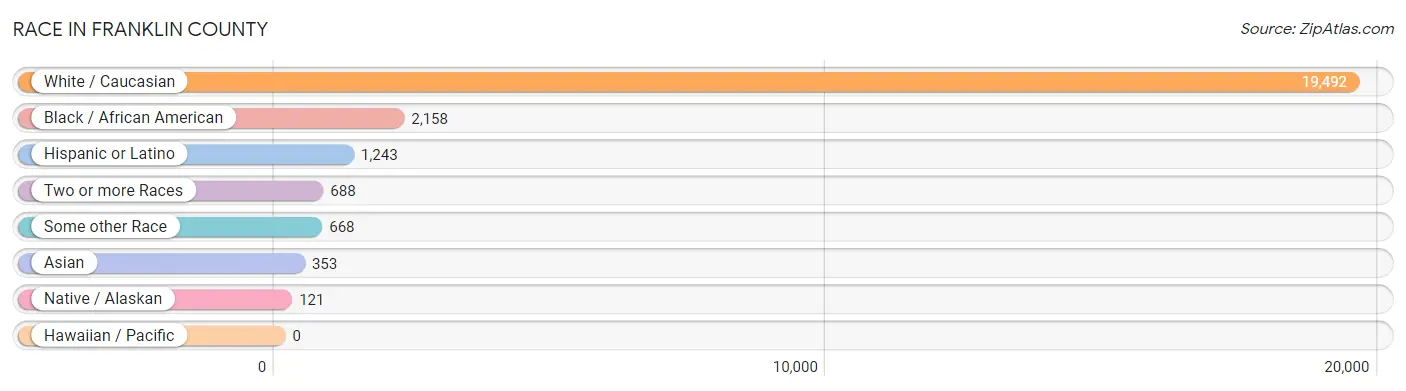
| Race | # Population | % Population |
| Asian | 353 | 1.5% |
| Black / African American | 2,158 | 9.2% |
| Hawaiian / Pacific | 0 | 0.0% |
| Hispanic or Latino | 1,243 | 5.3% |
| Native / Alaskan | 121 | 0.5% |
| White / Caucasian | 19,492 | 83.0% |
| Two or more Races | 688 | 2.9% |
| Some other Race | 668 | 2.8% |
| Total | 23,480 | 100.0% |
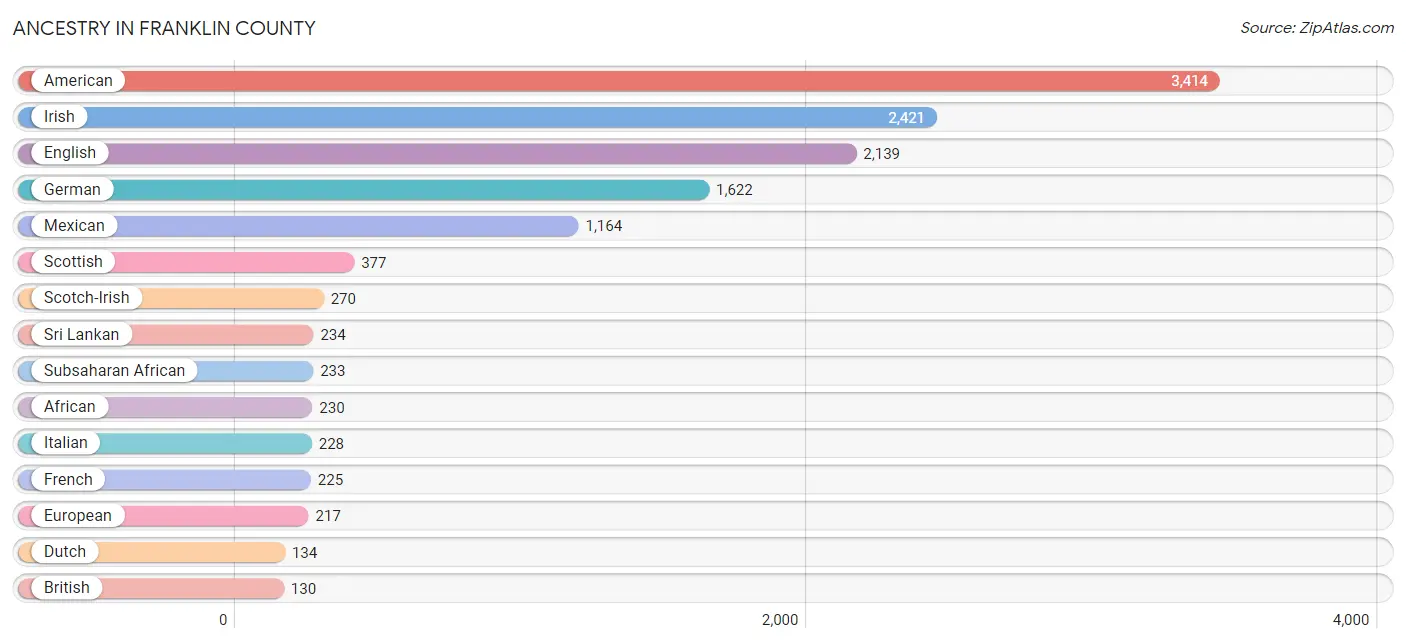
Ancestry in Franklin County
The most populous ancestries reported in Franklin County are American (3,414 | 14.5%), Irish (2,421 | 10.3%), English (2,139 | 9.1%), German (1,622 | 6.9%), and Mexican (1,164 | 5.0%), together accounting for 45.8% of all Franklin County residents.
| Ancestry | # Population | % Population |
| African | 230 | 1.0% |
| American | 3,414 | 14.5% |
| Arab | 41 | 0.2% |
| Armenian | 8 | 0.0% |
| Austrian | 19 | 0.1% |
| Bhutanese | 8 | 0.0% |
| Blackfeet | 10 | 0.0% |
| British | 130 | 0.5% |
| Burmese | 8 | 0.0% |
| Cajun | 14 | 0.1% |
| Canadian | 3 | 0.0% |
| Celtic | 8 | 0.0% |
| Central American | 23 | 0.1% |
| Cherokee | 89 | 0.4% |
| Choctaw | 5 | 0.0% |
| Creek | 2 | 0.0% |
| Croatian | 4 | 0.0% |
| Cuban | 9 | 0.0% |
| Czech | 44 | 0.2% |
| Czechoslovakian | 40 | 0.2% |
| Danish | 19 | 0.1% |
| Dominican | 4 | 0.0% |
| Dutch | 134 | 0.6% |
| Eastern European | 12 | 0.1% |
| Egyptian | 2 | 0.0% |
| English | 2,139 | 9.1% |
| European | 217 | 0.9% |
| French | 225 | 1.0% |
| French Canadian | 22 | 0.1% |
| German | 1,622 | 6.9% |
| Greek | 36 | 0.2% |
| Honduran | 20 | 0.1% |
| Hungarian | 19 | 0.1% |
| Indian (Asian) | 43 | 0.2% |
| Irish | 2,421 | 10.3% |
| Israeli | 6 | 0.0% |
| Italian | 228 | 1.0% |
| Korean | 23 | 0.1% |
| Laotian | 15 | 0.1% |
| Lebanese | 17 | 0.1% |
| Luxembourger | 10 | 0.0% |
| Mexican | 1,164 | 5.0% |
| Mexican American Indian | 94 | 0.4% |
| Nigerian | 3 | 0.0% |
| Northern European | 19 | 0.1% |
| Norwegian | 21 | 0.1% |
| Polish | 98 | 0.4% |
| Puerto Rican | 26 | 0.1% |
| Russian | 39 | 0.2% |
| Salvadoran | 3 | 0.0% |
| Scandinavian | 5 | 0.0% |
| Scotch-Irish | 270 | 1.1% |
| Scottish | 377 | 1.6% |
| Seminole | 26 | 0.1% |
| Serbian | 4 | 0.0% |
| Spaniard | 9 | 0.0% |
| Spanish | 8 | 0.0% |
| Sri Lankan | 234 | 1.0% |
| Subsaharan African | 233 | 1.0% |
| Swedish | 98 | 0.4% |
| Swiss | 9 | 0.0% |
| Thai | 33 | 0.1% |
| Turkish | 8 | 0.0% |
| Welsh | 109 | 0.5% |
| West Indian | 12 | 0.1% | View All 65 Rows |
Immigrants in Franklin County
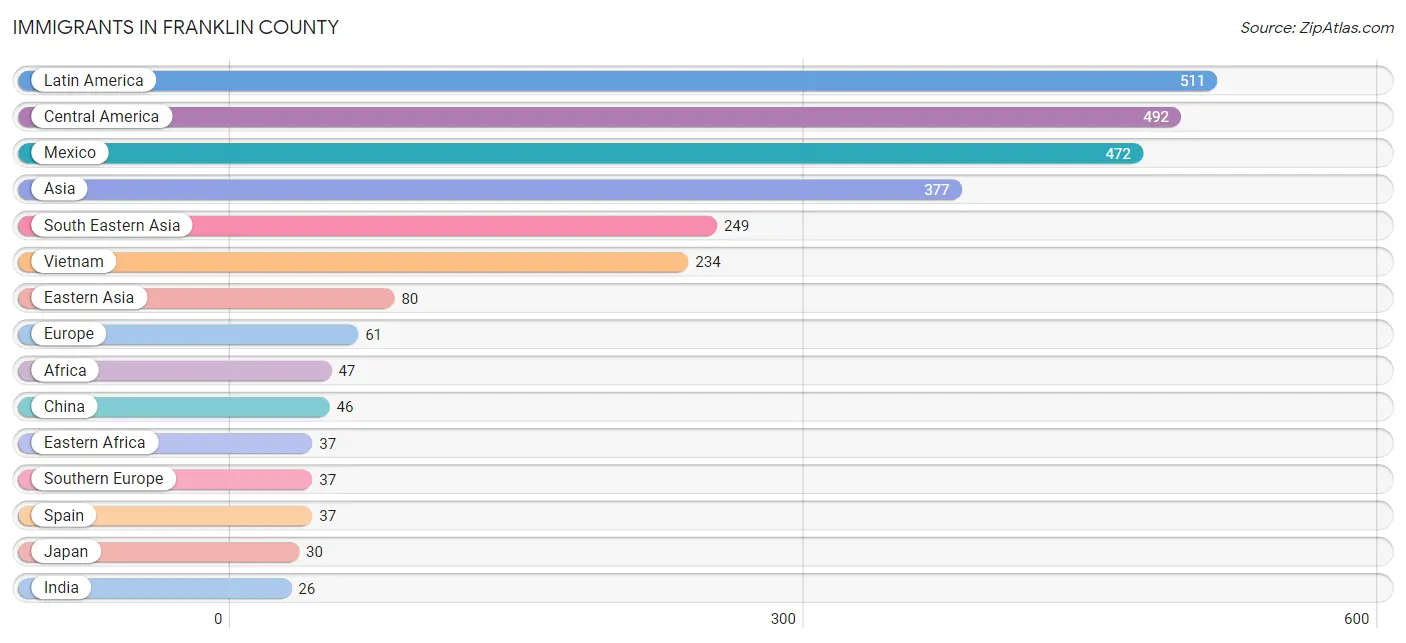
The most numerous immigrant groups reported in Franklin County came from Latin America (511 | 2.2%), Central America (492 | 2.1%), Mexico (472 | 2.0%), Asia (377 | 1.6%), and South Eastern Asia (249 | 1.1%), together accounting for 9.0% of all Franklin County residents.
| Immigration Origin | # Population | % Population |
| Africa | 47 | 0.2% |
| Asia | 377 | 1.6% |
| Austria | 7 | 0.0% |
| Canada | 10 | 0.0% |
| Caribbean | 16 | 0.1% |
| Central America | 492 | 2.1% |
| China | 46 | 0.2% |
| Dominica | 4 | 0.0% |
| Eastern Africa | 37 | 0.2% |
| Eastern Asia | 80 | 0.3% |
| Eastern Europe | 4 | 0.0% |
| Europe | 61 | 0.3% |
| Germany | 4 | 0.0% |
| Grenada | 12 | 0.1% |
| Honduras | 20 | 0.1% |
| India | 26 | 0.1% |
| Indonesia | 15 | 0.1% |
| Japan | 30 | 0.1% |
| Korea | 4 | 0.0% |
| Latin America | 511 | 2.2% |
| Mexico | 472 | 2.0% |
| Netherlands | 9 | 0.0% |
| Saudi Arabia | 22 | 0.1% |
| South Africa | 10 | 0.0% |
| South America | 3 | 0.0% |
| South Central Asia | 26 | 0.1% |
| South Eastern Asia | 249 | 1.1% |
| Southern Europe | 37 | 0.2% |
| Spain | 37 | 0.2% |
| Venezuela | 3 | 0.0% |
| Vietnam | 234 | 1.0% |
| Western Asia | 22 | 0.1% |
| Western Europe | 20 | 0.1% | View All 33 Rows |
Sex and Age in Franklin County
Sex and Age in Franklin County
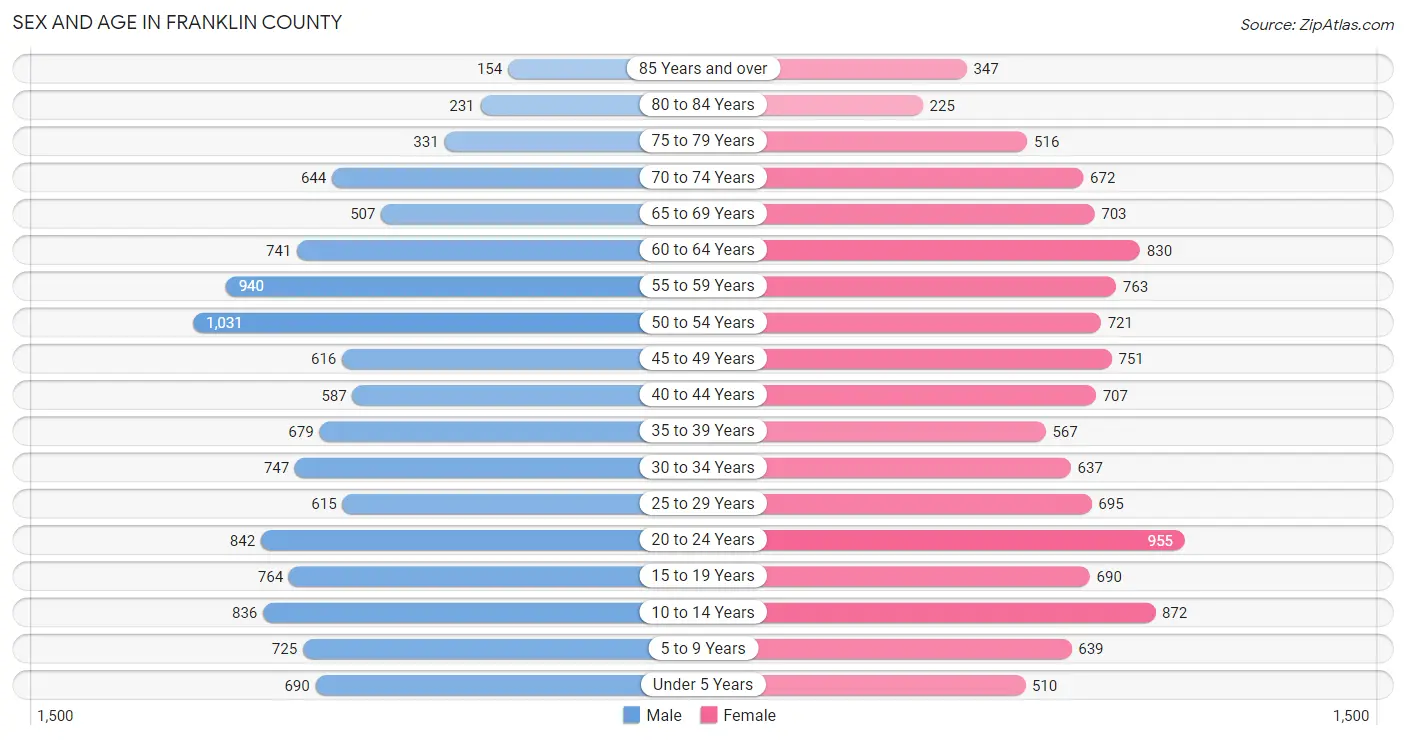
The most populous age groups in Franklin County are 50 to 54 Years (1,031 | 8.8%) for men and 20 to 24 Years (955 | 8.1%) for women.
| Age Bracket | Male | Female |
| Under 5 Years | 690 (5.9%) | 510 (4.3%) |
| 5 to 9 Years | 725 (6.2%) | 639 (5.4%) |
| 10 to 14 Years | 836 (7.2%) | 872 (7.4%) |
| 15 to 19 Years | 764 (6.5%) | 690 (5.9%) |
| 20 to 24 Years | 842 (7.2%) | 955 (8.1%) |
| 25 to 29 Years | 615 (5.3%) | 695 (5.9%) |
| 30 to 34 Years | 747 (6.4%) | 637 (5.4%) |
| 35 to 39 Years | 679 (5.8%) | 567 (4.8%) |
| 40 to 44 Years | 587 (5.0%) | 707 (6.0%) |
| 45 to 49 Years | 616 (5.3%) | 751 (6.4%) |
| 50 to 54 Years | 1,031 (8.8%) | 721 (6.1%) |
| 55 to 59 Years | 940 (8.1%) | 763 (6.5%) |
| 60 to 64 Years | 741 (6.3%) | 830 (7.0%) |
| 65 to 69 Years | 507 (4.3%) | 703 (6.0%) |
| 70 to 74 Years | 644 (5.5%) | 672 (5.7%) |
| 75 to 79 Years | 331 (2.8%) | 516 (4.4%) |
| 80 to 84 Years | 231 (2.0%) | 225 (1.9%) |
| 85 Years and over | 154 (1.3%) | 347 (2.9%) |
| Total | 11,680 (100.0%) | 11,800 (100.0%) |
Families and Households in Franklin County
Median Family Size in Franklin County
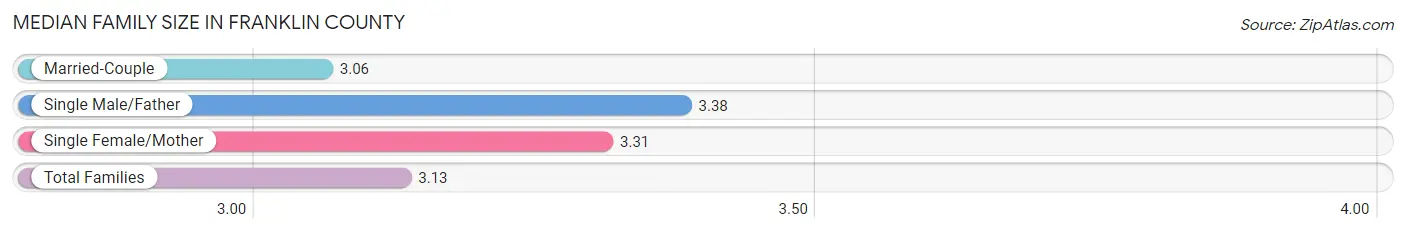
The median family size in Franklin County is 3.13 persons per family, with single male/father families (595 | 9.8%) accounting for the largest median family size of 3.38 persons per family. On the other hand, married-couple families (4,413 | 72.3%) represent the smallest median family size with 3.06 persons per family.
| Family Type | # Families | Family Size |
| Married-Couple | 4,413 (72.3%) | 3.06 |
| Single Male/Father | 595 (9.8%) | 3.38 |
| Single Female/Mother | 1,095 (17.9%) | 3.31 |
| Total Families | 6,103 (100.0%) | 3.13 |
Median Household Size in Franklin County
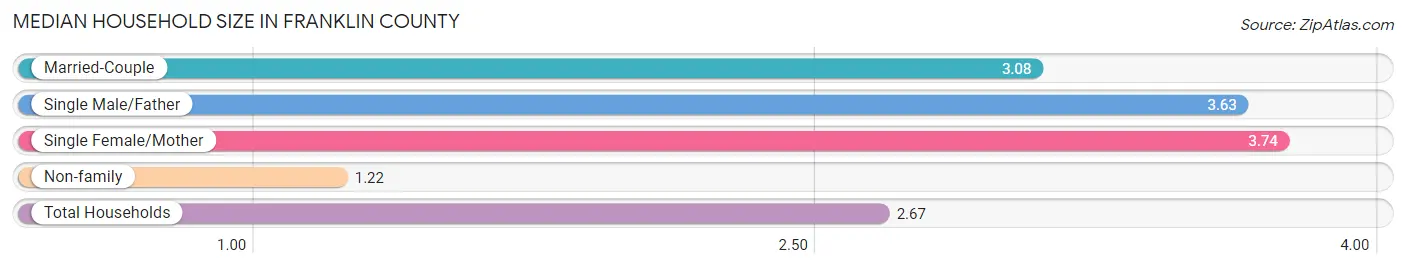
The median household size in Franklin County is 2.67 persons per household, with single female/mother households (1,095 | 12.8%) accounting for the largest median household size of 3.74 persons per household. non-family households (2,436 | 28.5%) represent the smallest median household size with 1.22 persons per household.
| Household Type | # Households | Household Size |
| Married-Couple | 4,413 (51.7%) | 3.08 |
| Single Male/Father | 595 (7.0%) | 3.63 |
| Single Female/Mother | 1,095 (12.8%) | 3.74 |
| Non-family | 2,436 (28.5%) | 1.22 |
| Total Households | 8,539 (100.0%) | 2.67 |
Household Size by Marriage Status in Franklin County
Out of a total of 8,539 households in Franklin County, 6,103 (71.5%) are family households, while 2,436 (28.5%) are nonfamily households. The most numerous type of family households are 2-person households, comprising 2,880, and the most common type of nonfamily households are 1-person households, comprising 2,014.
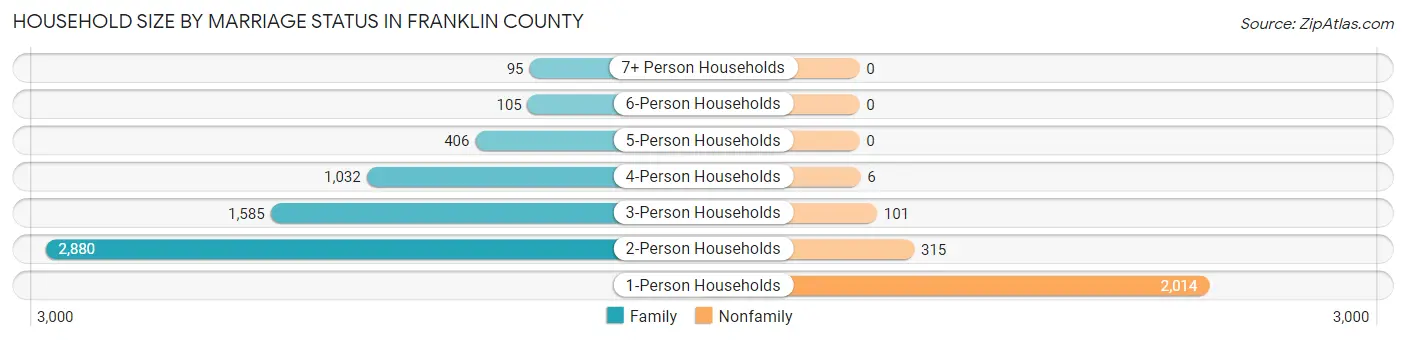
| Household Size | Family Households | Nonfamily Households |
| 1-Person Households | - | 2,014 (23.6%) |
| 2-Person Households | 2,880 (33.7%) | 315 (3.7%) |
| 3-Person Households | 1,585 (18.6%) | 101 (1.2%) |
| 4-Person Households | 1,032 (12.1%) | 6 (0.1%) |
| 5-Person Households | 406 (4.8%) | 0 (0.0%) |
| 6-Person Households | 105 (1.2%) | 0 (0.0%) |
| 7+ Person Households | 95 (1.1%) | 0 (0.0%) |
| Total | 6,103 (71.5%) | 2,436 (28.5%) |
Female Fertility in Franklin County
Fertility by Age in Franklin County
Average fertility rate in Franklin County is 49.0 births per 1,000 women. Women in the age bracket of 20 to 34 years have the highest fertility rate with 101.0 births per 1,000 women. Women in the age bracket of 20 to 34 years acount for 90.5% of all women with births.
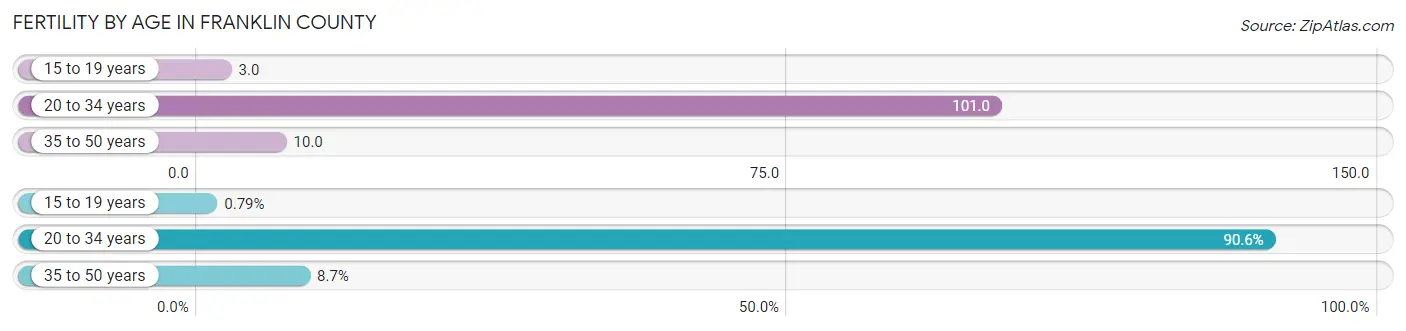
| Age Bracket | Women with Births | Births / 1,000 Women |
| 15 to 19 years | 2 (0.8%) | 3.0 |
| 20 to 34 years | 230 (90.5%) | 101.0 |
| 35 to 50 years | 22 (8.7%) | 10.0 |
| Total | 254 (100.0%) | 49.0 |
Fertility by Age by Marriage Status in Franklin County
76.0% of women with births (254) in Franklin County are married. The highest percentage of unmarried women with births falls into 15 to 19 years age bracket with 100.0% of them unmarried at the time of birth, while the lowest percentage of unmarried women with births belong to 20 to 34 years age bracket with 21.7% of them unmarried.
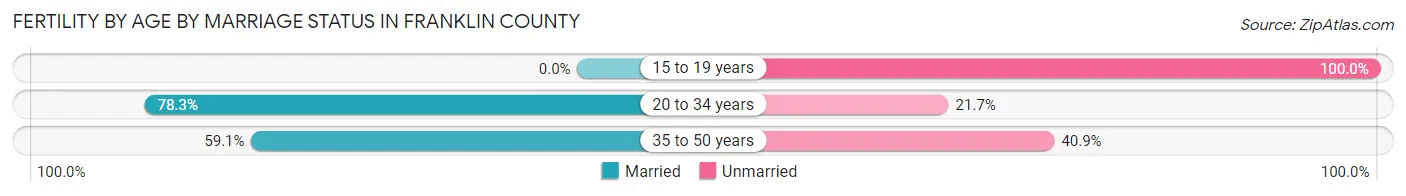
| Age Bracket | Married | Unmarried |
| 15 to 19 years | 0 (0.0%) | 2 (100.0%) |
| 20 to 34 years | 180 (78.3%) | 50 (21.7%) |
| 35 to 50 years | 13 (59.1%) | 9 (40.9%) |
| Total | 193 (76.0%) | 61 (24.0%) |
Fertility by Education in Franklin County
Average fertility rate in Franklin County is 49.0 births per 1,000 women. Women with the education attainment of bachelor's degree have the highest fertility rate of 78.0 births per 1,000 women, while women with the education attainment of graduate degree have the lowest fertility at 21.0 births per 1,000 women. Women with the education attainment of high school diploma represent 33.5% of all women with births.
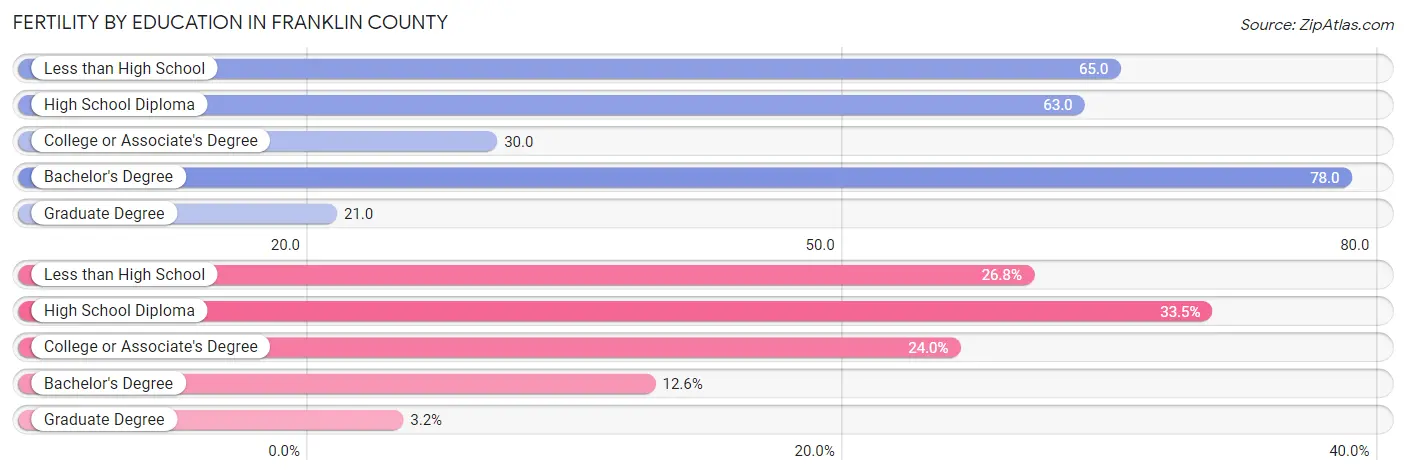
| Educational Attainment | Women with Births | Births / 1,000 Women |
| Less than High School | 68 (26.8%) | 65.0 |
| High School Diploma | 85 (33.5%) | 63.0 |
| College or Associate's Degree | 61 (24.0%) | 30.0 |
| Bachelor's Degree | 32 (12.6%) | 78.0 |
| Graduate Degree | 8 (3.2%) | 21.0 |
| Total | 254 (100.0%) | 49.0 |
Fertility by Education by Marriage Status in Franklin County
24.0% of women with births in Franklin County are unmarried. Women with the educational attainment of bachelor's degree are most likely to be married with 100.0% of them married at childbirth, while women with the educational attainment of graduate degree are least likely to be married with 100.0% of them unmarried at childbirth.
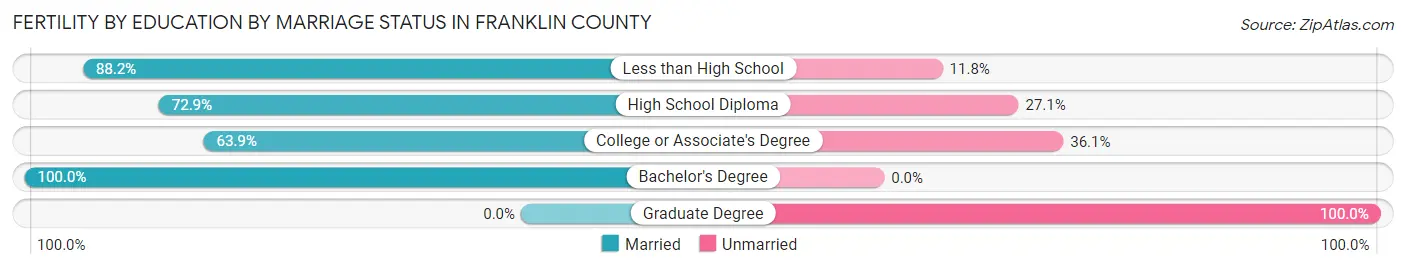
| Educational Attainment | Married | Unmarried |
| Less than High School | 60 (88.2%) | 8 (11.8%) |
| High School Diploma | 62 (72.9%) | 23 (27.1%) |
| College or Associate's Degree | 39 (63.9%) | 22 (36.1%) |
| Bachelor's Degree | 32 (100.0%) | 0 (0.0%) |
| Graduate Degree | 0 (0.0%) | 8 (100.0%) |
| Total | 193 (76.0%) | 61 (24.0%) |
Employment Characteristics in Franklin County
Employment by Class of Employer in Franklin County
Among the 9,404 employed individuals in Franklin County, private company employees (6,652 | 70.7%), local government employees (927 | 9.9%), and self-employed (not incorporated) (614 | 6.5%) make up the most common classes of employment.
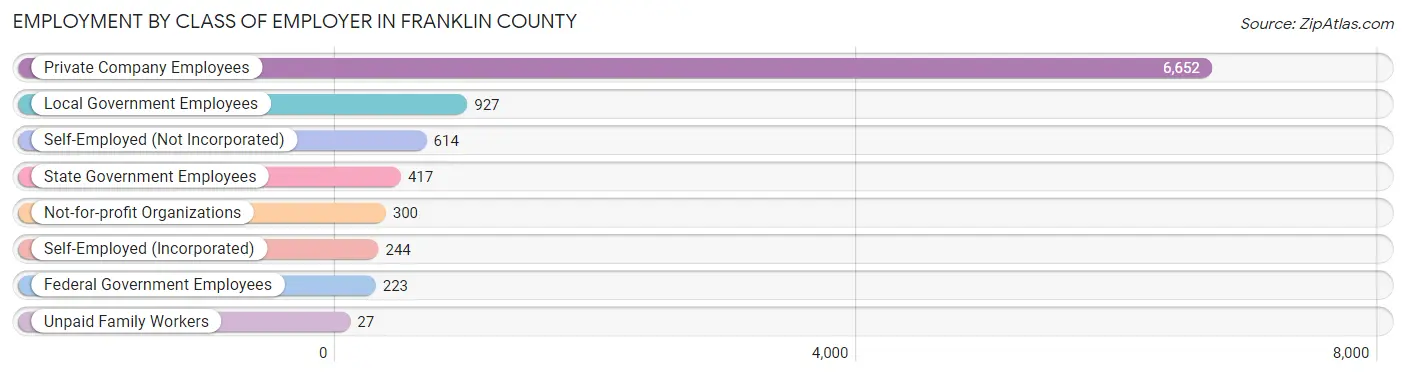
| Employer Class | # Employees | % Employees |
| Private Company Employees | 6,652 | 70.7% |
| Self-Employed (Incorporated) | 244 | 2.6% |
| Self-Employed (Not Incorporated) | 614 | 6.5% |
| Not-for-profit Organizations | 300 | 3.2% |
| Local Government Employees | 927 | 9.9% |
| State Government Employees | 417 | 4.4% |
| Federal Government Employees | 223 | 2.4% |
| Unpaid Family Workers | 27 | 0.3% |
| Total | 9,404 | 100.0% |
Employment Status by Age in Franklin County
According to the labor force statistics for Franklin County, out of the total population over 16 years of age (19,104), 53.0% or 10,125 individuals are in the labor force, with 6.2% or 628 of them unemployed. The age group with the highest labor force participation rate is 25 to 29 years, with 83.4% or 1,093 individuals in the labor force. Within the labor force, the 16 to 19 years age range has the highest percentage of unemployed individuals, with 18.0% or 93 of them being unemployed.
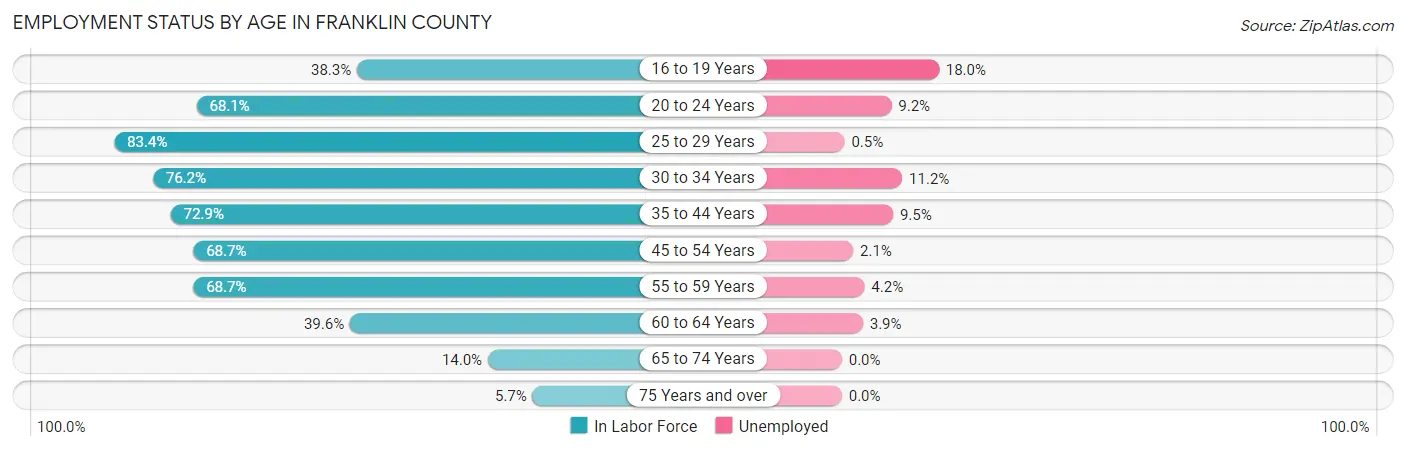
| Age Bracket | In Labor Force | Unemployed |
| 16 to 19 Years | 517 (38.3%) | 93 (18.0%) |
| 20 to 24 Years | 1,224 (68.1%) | 113 (9.2%) |
| 25 to 29 Years | 1,093 (83.4%) | 5 (0.5%) |
| 30 to 34 Years | 1,055 (76.2%) | 118 (11.2%) |
| 35 to 44 Years | 1,852 (72.9%) | 176 (9.5%) |
| 45 to 54 Years | 2,143 (68.7%) | 45 (2.1%) |
| 55 to 59 Years | 1,170 (68.7%) | 49 (4.2%) |
| 60 to 64 Years | 622 (39.6%) | 24 (3.9%) |
| 65 to 74 Years | 354 (14.0%) | 0 (0.0%) |
| 75 Years and over | 103 (5.7%) | 0 (0.0%) |
| Total | 10,125 (53.0%) | 628 (6.2%) |
Employment Status by Educational Attainment in Franklin County
According to labor force statistics for Franklin County, 68.2% of individuals (7,930) out of the total population between 25 and 64 years of age (11,627) are in the labor force, with 5.3% or 420 of them being unemployed. The group with the highest labor force participation rate are those with the educational attainment of bachelor's degree or higher, with 86.5% or 1,704 individuals in the labor force. Within the labor force, individuals with high school diploma education have the highest percentage of unemployment, with 8.8% or 188 of them being unemployed.
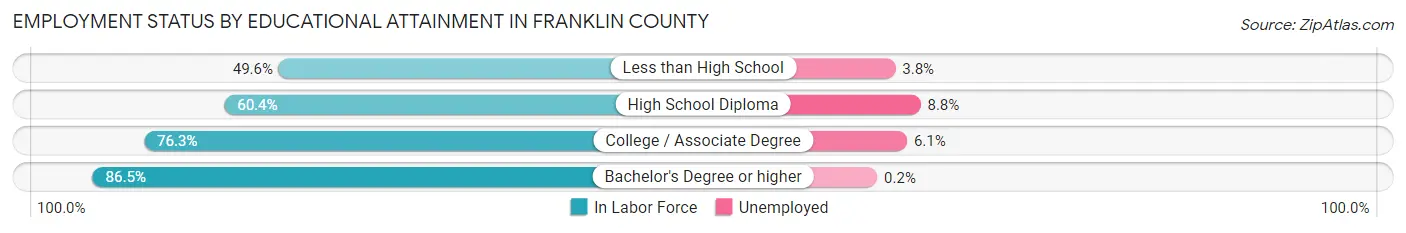
| Educational Attainment | In Labor Force | Unemployed |
| Less than High School | 1,070 (49.6%) | 82 (3.8%) |
| High School Diploma | 2,138 (60.4%) | 311 (8.8%) |
| College / Associate Degree | 3,022 (76.3%) | 242 (6.1%) |
| Bachelor's Degree or higher | 1,704 (86.5%) | 4 (0.2%) |
| Total | 7,930 (68.2%) | 616 (5.3%) |
Employment Occupations by Sex in Franklin County
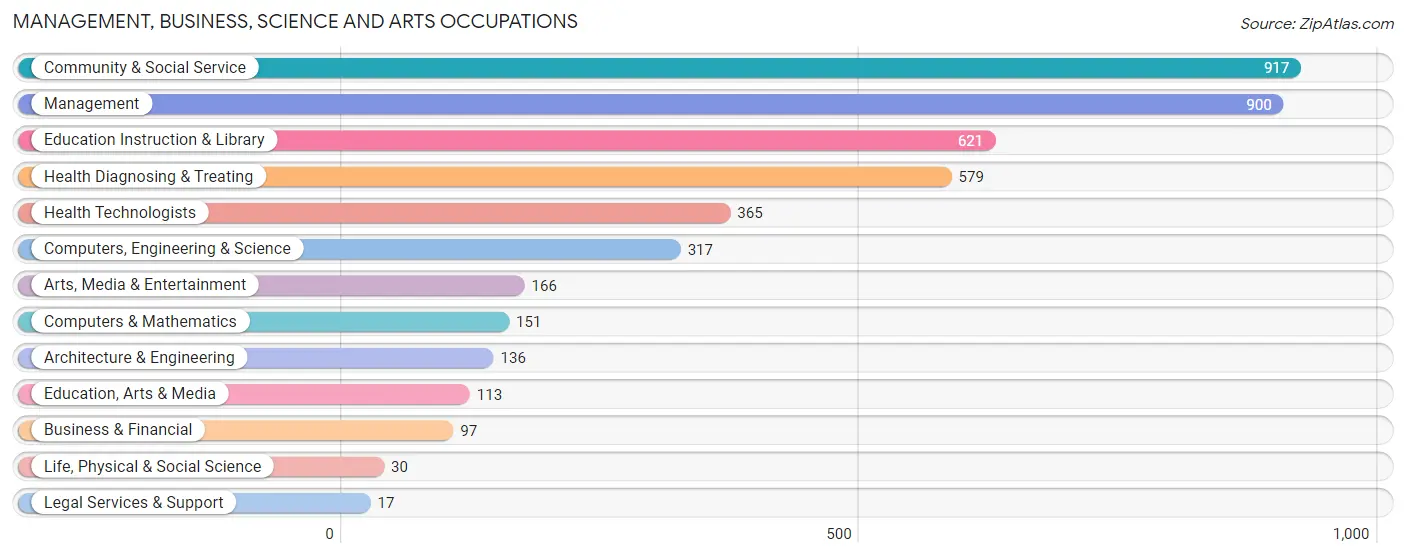
Management, Business, Science and Arts Occupations
The most common Management, Business, Science and Arts occupations in Franklin County are Community & Social Service (917 | 9.7%), Management (900 | 9.5%), Education Instruction & Library (621 | 6.5%), Health Diagnosing & Treating (579 | 6.1%), and Health Technologists (365 | 3.8%).
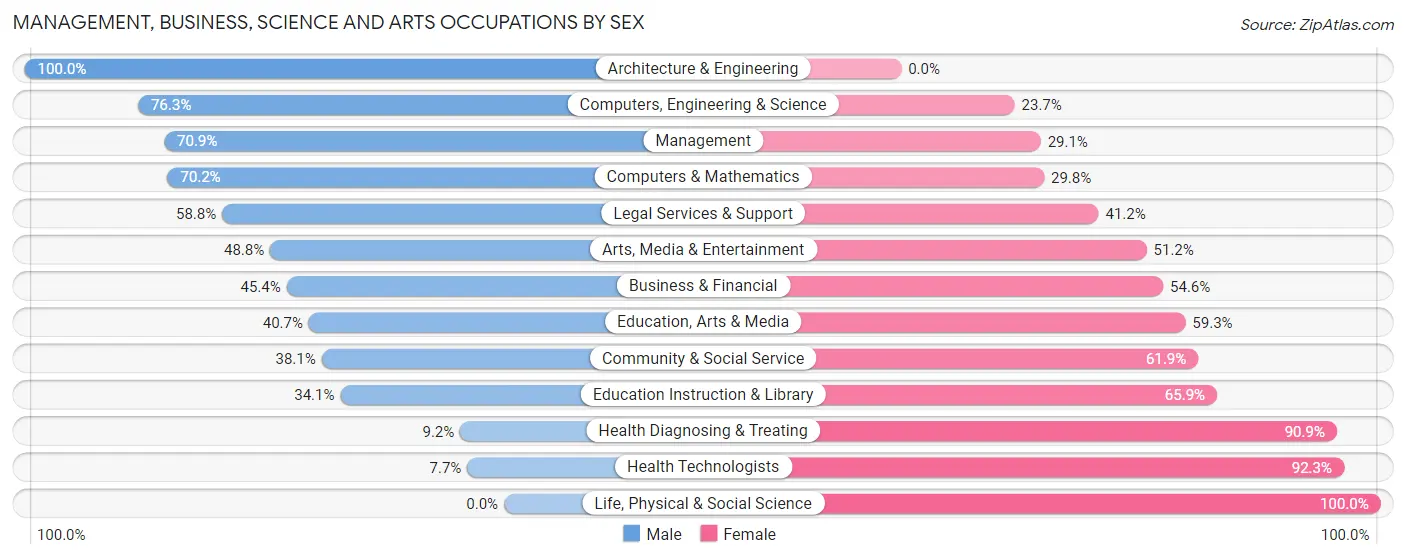
Management, Business, Science and Arts Occupations by Sex
Within the Management, Business, Science and Arts occupations in Franklin County, the most male-oriented occupations are Architecture & Engineering (100.0%), Computers, Engineering & Science (76.3%), and Management (70.9%), while the most female-oriented occupations are Life, Physical & Social Science (100.0%), Health Technologists (92.3%), and Health Diagnosing & Treating (90.8%).
| Occupation | Male | Female |
| Management | 638 (70.9%) | 262 (29.1%) |
| Business & Financial | 44 (45.4%) | 53 (54.6%) |
| Computers, Engineering & Science | 242 (76.3%) | 75 (23.7%) |
| Computers & Mathematics | 106 (70.2%) | 45 (29.8%) |
| Architecture & Engineering | 136 (100.0%) | 0 (0.0%) |
| Life, Physical & Social Science | 0 (0.0%) | 30 (100.0%) |
| Community & Social Service | 349 (38.1%) | 568 (61.9%) |
| Education, Arts & Media | 46 (40.7%) | 67 (59.3%) |
| Legal Services & Support | 10 (58.8%) | 7 (41.2%) |
| Education Instruction & Library | 212 (34.1%) | 409 (65.9%) |
| Arts, Media & Entertainment | 81 (48.8%) | 85 (51.2%) |
| Health Diagnosing & Treating | 53 (9.1%) | 526 (90.8%) |
| Health Technologists | 28 (7.7%) | 337 (92.3%) |
| Total (Category) | 1,326 (47.2%) | 1,484 (52.8%) |
| Total (Overall) | 4,992 (52.5%) | 4,513 (47.5%) |
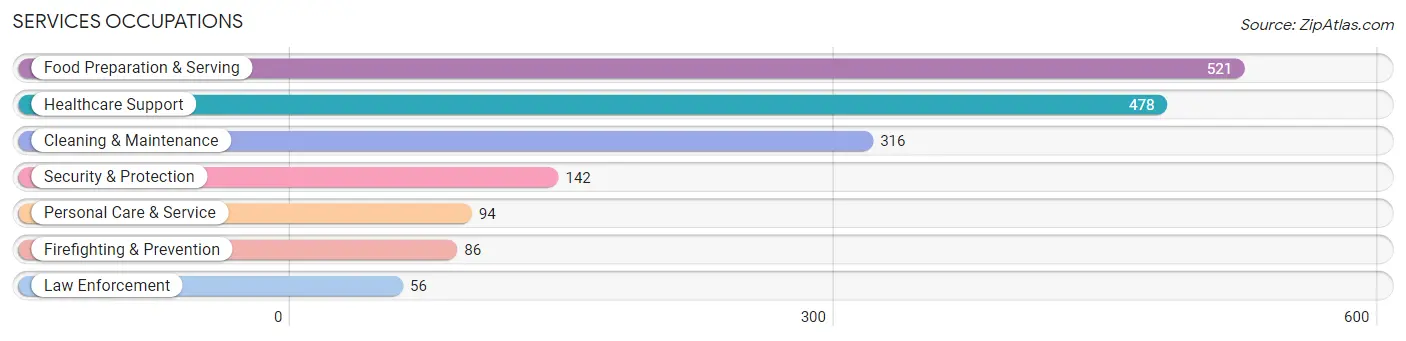
Services Occupations
The most common Services occupations in Franklin County are Food Preparation & Serving (521 | 5.5%), Healthcare Support (478 | 5.0%), Cleaning & Maintenance (316 | 3.3%), Security & Protection (142 | 1.5%), and Personal Care & Service (94 | 1.0%).
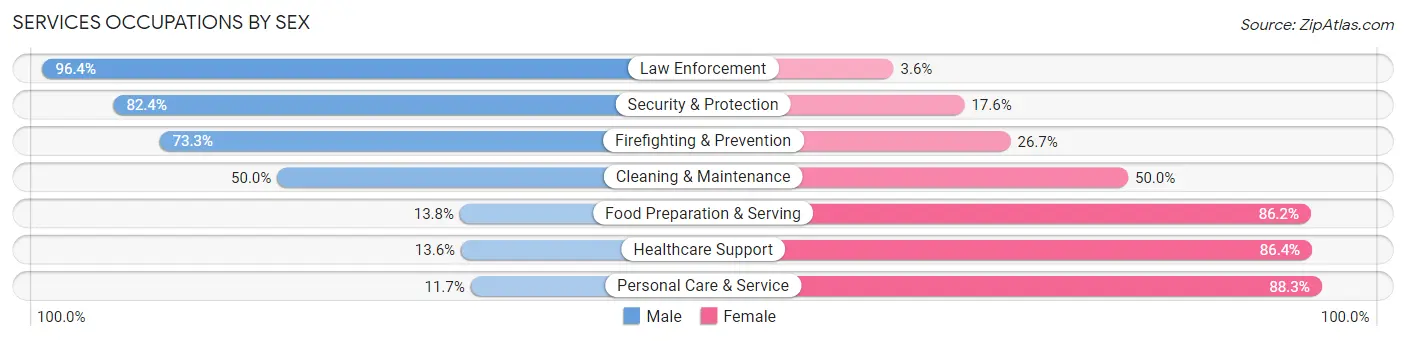
Services Occupations by Sex
Within the Services occupations in Franklin County, the most male-oriented occupations are Law Enforcement (96.4%), Security & Protection (82.4%), and Firefighting & Prevention (73.3%), while the most female-oriented occupations are Personal Care & Service (88.3%), Healthcare Support (86.4%), and Food Preparation & Serving (86.2%).
| Occupation | Male | Female |
| Healthcare Support | 65 (13.6%) | 413 (86.4%) |
| Security & Protection | 117 (82.4%) | 25 (17.6%) |
| Firefighting & Prevention | 63 (73.3%) | 23 (26.7%) |
| Law Enforcement | 54 (96.4%) | 2 (3.6%) |
| Food Preparation & Serving | 72 (13.8%) | 449 (86.2%) |
| Cleaning & Maintenance | 158 (50.0%) | 158 (50.0%) |
| Personal Care & Service | 11 (11.7%) | 83 (88.3%) |
| Total (Category) | 423 (27.3%) | 1,128 (72.7%) |
| Total (Overall) | 4,992 (52.5%) | 4,513 (47.5%) |
Sales and Office Occupations
The most common Sales and Office occupations in Franklin County are Office & Administration (895 | 9.4%), and Sales & Related (894 | 9.4%).

Sales and Office Occupations by Sex

| Occupation | Male | Female |
| Sales & Related | 401 (44.9%) | 493 (55.1%) |
| Office & Administration | 159 (17.8%) | 736 (82.2%) |
| Total (Category) | 560 (31.3%) | 1,229 (68.7%) |
| Total (Overall) | 4,992 (52.5%) | 4,513 (47.5%) |
Natural Resources, Construction and Maintenance Occupations
The most common Natural Resources, Construction and Maintenance occupations in Franklin County are Installation, Maintenance & Repair (487 | 5.1%), Construction & Extraction (418 | 4.4%), and Farming, Fishing & Forestry (176 | 1.8%).
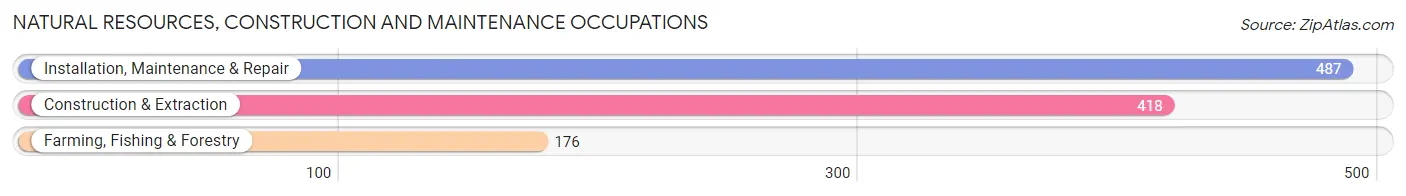
Natural Resources, Construction and Maintenance Occupations by Sex
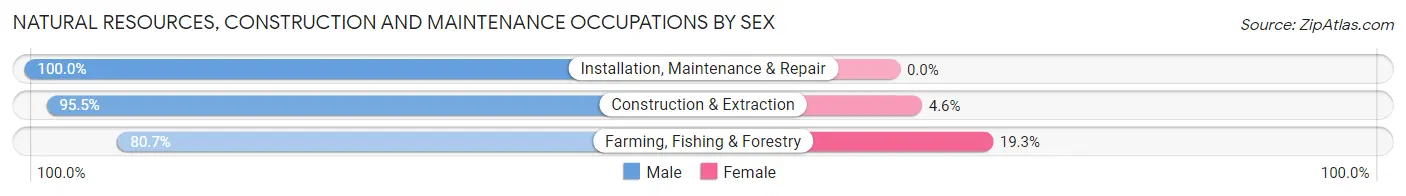
| Occupation | Male | Female |
| Farming, Fishing & Forestry | 142 (80.7%) | 34 (19.3%) |
| Construction & Extraction | 399 (95.5%) | 19 (4.5%) |
| Installation, Maintenance & Repair | 487 (100.0%) | 0 (0.0%) |
| Total (Category) | 1,028 (95.1%) | 53 (4.9%) |
| Total (Overall) | 4,992 (52.5%) | 4,513 (47.5%) |
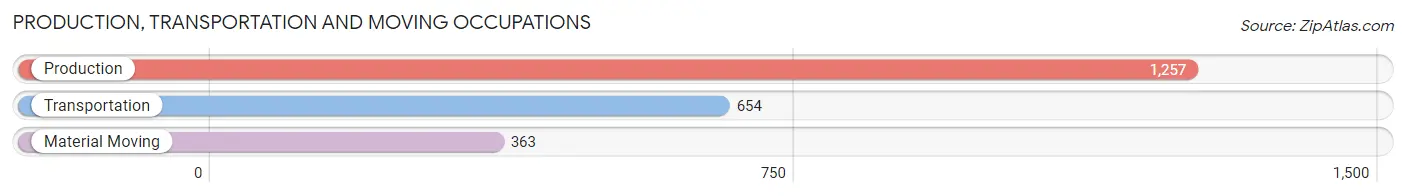
Production, Transportation and Moving Occupations
The most common Production, Transportation and Moving occupations in Franklin County are Production (1,257 | 13.2%), Transportation (654 | 6.9%), and Material Moving (363 | 3.8%).
Production, Transportation and Moving Occupations by Sex
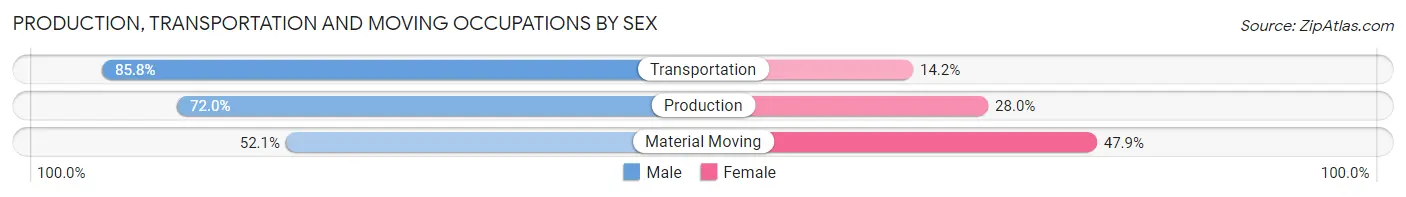
| Occupation | Male | Female |
| Production | 905 (72.0%) | 352 (28.0%) |
| Transportation | 561 (85.8%) | 93 (14.2%) |
| Material Moving | 189 (52.1%) | 174 (47.9%) |
| Total (Category) | 1,655 (72.8%) | 619 (27.2%) |
| Total (Overall) | 4,992 (52.5%) | 4,513 (47.5%) |
Employment Industries by Sex in Franklin County
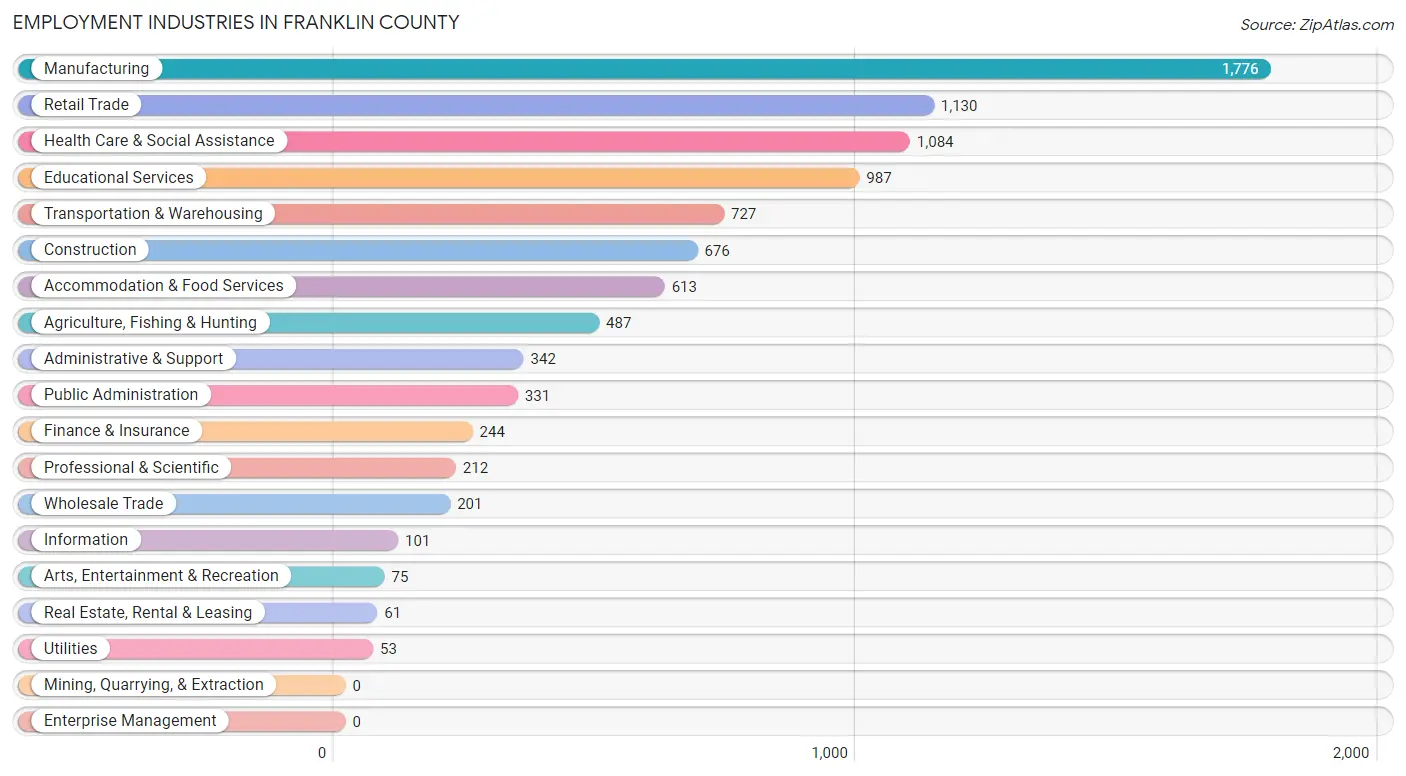
Employment Industries in Franklin County
The major employment industries in Franklin County include Manufacturing (1,776 | 18.7%), Retail Trade (1,130 | 11.9%), Health Care & Social Assistance (1,084 | 11.4%), Educational Services (987 | 10.4%), and Transportation & Warehousing (727 | 7.6%).
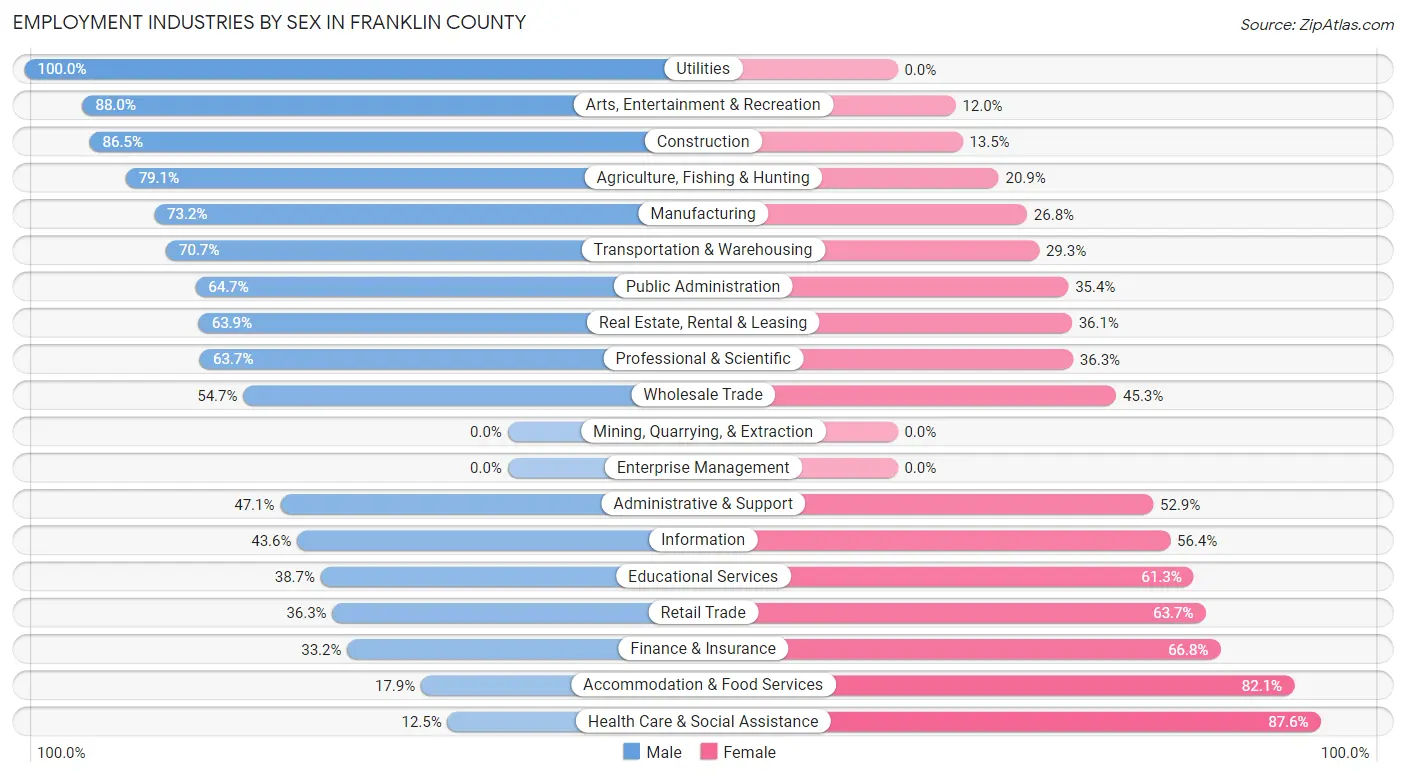
Employment Industries by Sex in Franklin County
The Franklin County industries that see more men than women are Utilities (100.0%), Arts, Entertainment & Recreation (88.0%), and Construction (86.5%), whereas the industries that tend to have a higher number of women are Health Care & Social Assistance (87.5%), Accommodation & Food Services (82.1%), and Finance & Insurance (66.8%).
| Industry | Male | Female |
| Agriculture, Fishing & Hunting | 385 (79.1%) | 102 (20.9%) |
| Mining, Quarrying, & Extraction | 0 (0.0%) | 0 (0.0%) |
| Construction | 585 (86.5%) | 91 (13.5%) |
| Manufacturing | 1,300 (73.2%) | 476 (26.8%) |
| Wholesale Trade | 110 (54.7%) | 91 (45.3%) |
| Retail Trade | 410 (36.3%) | 720 (63.7%) |
| Transportation & Warehousing | 514 (70.7%) | 213 (29.3%) |
| Utilities | 53 (100.0%) | 0 (0.0%) |
| Information | 44 (43.6%) | 57 (56.4%) |
| Finance & Insurance | 81 (33.2%) | 163 (66.8%) |
| Real Estate, Rental & Leasing | 39 (63.9%) | 22 (36.1%) |
| Professional & Scientific | 135 (63.7%) | 77 (36.3%) |
| Enterprise Management | 0 (0.0%) | 0 (0.0%) |
| Administrative & Support | 161 (47.1%) | 181 (52.9%) |
| Educational Services | 382 (38.7%) | 605 (61.3%) |
| Health Care & Social Assistance | 135 (12.4%) | 949 (87.5%) |
| Arts, Entertainment & Recreation | 66 (88.0%) | 9 (12.0%) |
| Accommodation & Food Services | 110 (17.9%) | 503 (82.1%) |
| Public Administration | 214 (64.6%) | 117 (35.3%) |
| Total | 4,992 (52.5%) | 4,513 (47.5%) |
Education in Franklin County
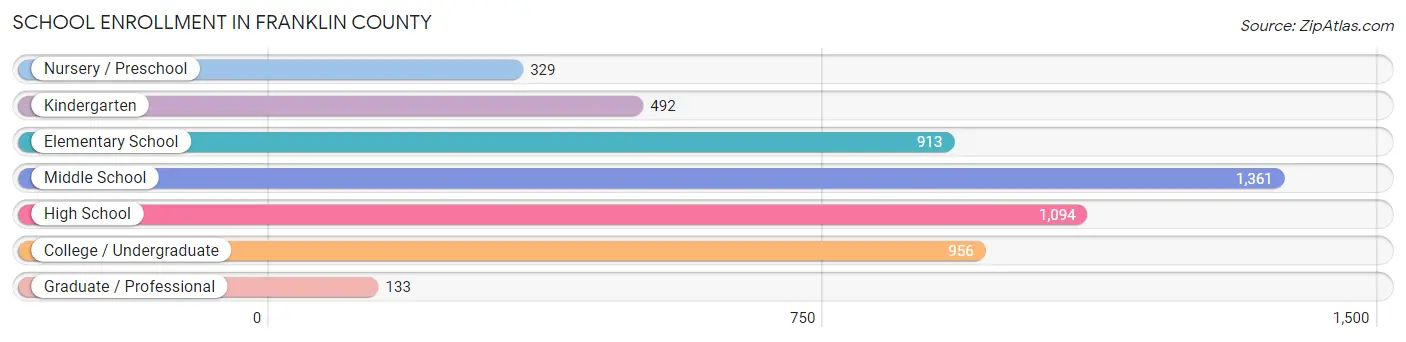
School Enrollment in Franklin County
The most common levels of schooling among the 5,278 students in Franklin County are middle school (1,361 | 25.8%), high school (1,094 | 20.7%), and college / undergraduate (956 | 18.1%).
| School Level | # Students | % Students |
| Nursery / Preschool | 329 | 6.2% |
| Kindergarten | 492 | 9.3% |
| Elementary School | 913 | 17.3% |
| Middle School | 1,361 | 25.8% |
| High School | 1,094 | 20.7% |
| College / Undergraduate | 956 | 18.1% |
| Graduate / Professional | 133 | 2.5% |
| Total | 5,278 | 100.0% |
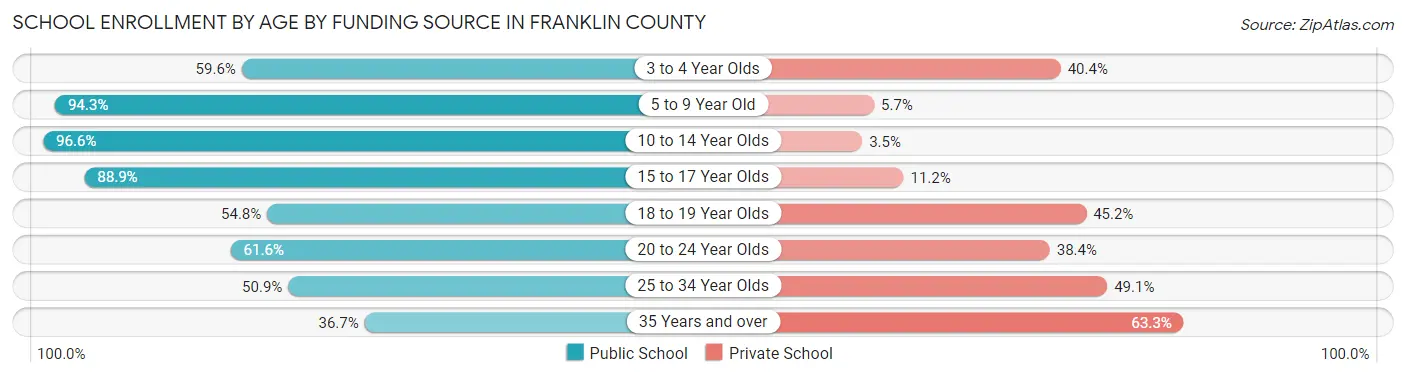
School Enrollment by Age by Funding Source in Franklin County
Out of a total of 5,278 students who are enrolled in schools in Franklin County, 903 (17.1%) attend a private institution, while the remaining 4,375 (82.9%) are enrolled in public schools. The age group of 35 years and over has the highest likelihood of being enrolled in private schools, with 145 (63.3% in the age bracket) enrolled. Conversely, the age group of 10 to 14 year olds has the lowest likelihood of being enrolled in a private school, with 1,568 (96.6% in the age bracket) attending a public institution.
| Age Bracket | Public School | Private School |
| 3 to 4 Year Olds | 137 (59.6%) | 93 (40.4%) |
| 5 to 9 Year Old | 1,280 (94.3%) | 77 (5.7%) |
| 10 to 14 Year Olds | 1,568 (96.6%) | 56 (3.5%) |
| 15 to 17 Year Olds | 693 (88.8%) | 87 (11.2%) |
| 18 to 19 Year Olds | 227 (54.8%) | 187 (45.2%) |
| 20 to 24 Year Olds | 329 (61.6%) | 205 (38.4%) |
| 25 to 34 Year Olds | 56 (50.9%) | 54 (49.1%) |
| 35 Years and over | 84 (36.7%) | 145 (63.3%) |
| Total | 4,375 (82.9%) | 903 (17.1%) |
Educational Attainment by Field of Study in Franklin County
Business (658 | 23.2%), education (549 | 19.3%), science & technology (361 | 12.7%), engineering (194 | 6.8%), and arts & humanities (164 | 5.8%) are the most common fields of study among 2,842 individuals in Franklin County who have obtained a bachelor's degree or higher.
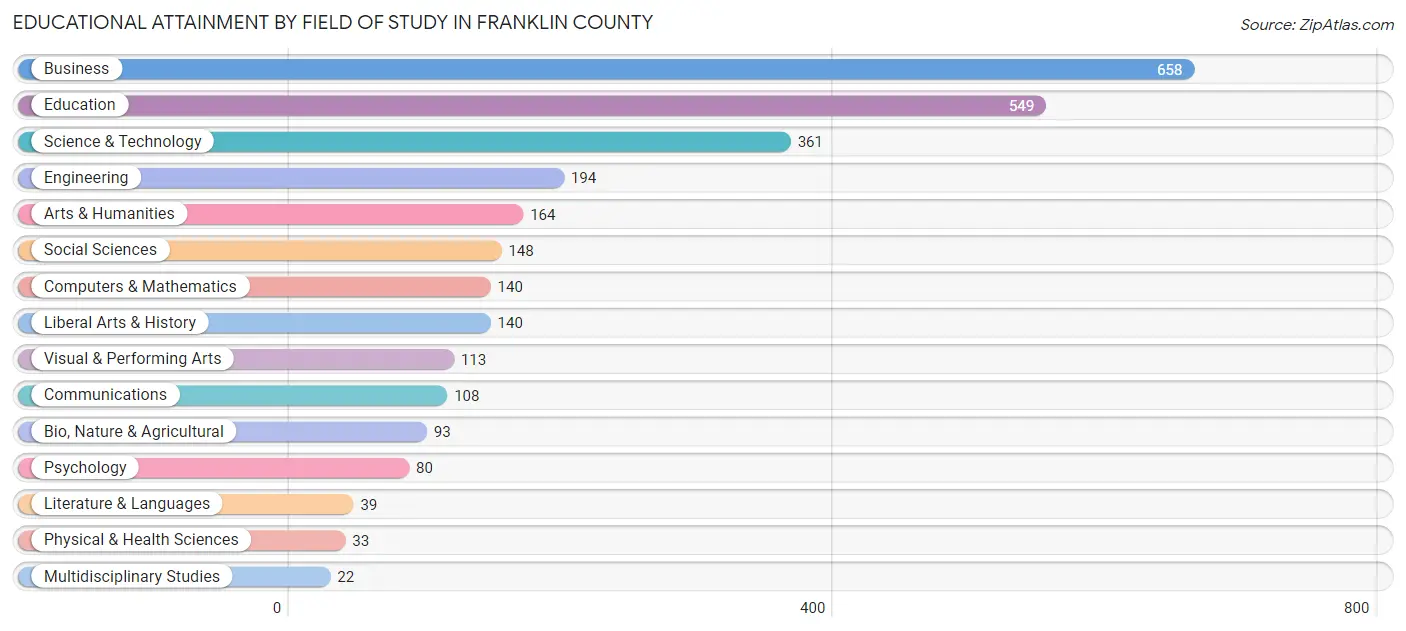
| Field of Study | # Graduates | % Graduates |
| Computers & Mathematics | 140 | 4.9% |
| Bio, Nature & Agricultural | 93 | 3.3% |
| Physical & Health Sciences | 33 | 1.2% |
| Psychology | 80 | 2.8% |
| Social Sciences | 148 | 5.2% |
| Engineering | 194 | 6.8% |
| Multidisciplinary Studies | 22 | 0.8% |
| Science & Technology | 361 | 12.7% |
| Business | 658 | 23.2% |
| Education | 549 | 19.3% |
| Literature & Languages | 39 | 1.4% |
| Liberal Arts & History | 140 | 4.9% |
| Visual & Performing Arts | 113 | 4.0% |
| Communications | 108 | 3.8% |
| Arts & Humanities | 164 | 5.8% |
| Total | 2,842 | 100.0% |
Transportation & Commute in Franklin County
Vehicle Availability by Sex in Franklin County
The most prevalent vehicle ownership categories in Franklin County are males with 2 vehicles (1,557, accounting for 31.7%) and females with 2 vehicles (1,170, making up 35.8%).
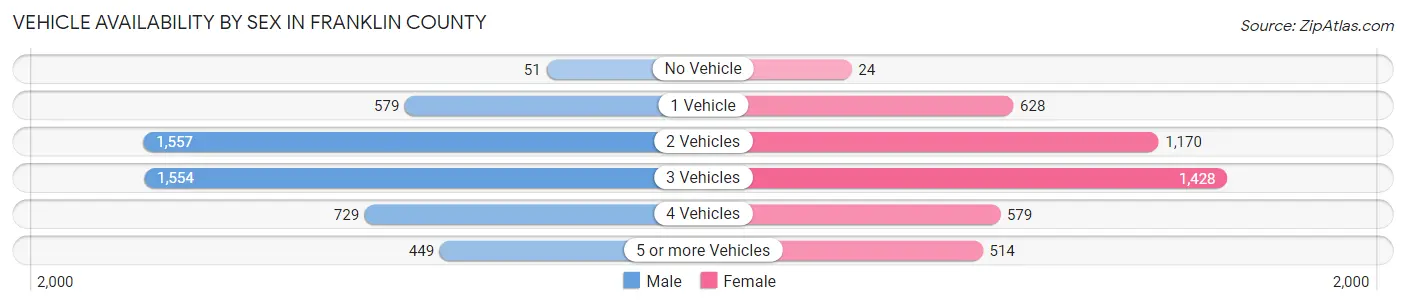
| Vehicles Available | Male | Female |
| No Vehicle | 51 (1.0%) | 24 (0.5%) |
| 1 Vehicle | 579 (11.8%) | 628 (14.5%) |
| 2 Vehicles | 1,557 (31.7%) | 1,170 (26.9%) |
| 3 Vehicles | 1,554 (31.6%) | 1,428 (32.9%) |
| 4 Vehicles | 729 (14.8%) | 579 (13.3%) |
| 5 or more Vehicles | 449 (9.1%) | 514 (11.8%) |
| Total | 4,919 (100.0%) | 4,343 (100.0%) |
Commute Time in Franklin County
The most frequently occuring commute durations in Franklin County are 15 to 19 minutes (1,228 commuters, 14.1%), 30 to 34 minutes (1,194 commuters, 13.7%), and 10 to 14 minutes (1,070 commuters, 12.3%).
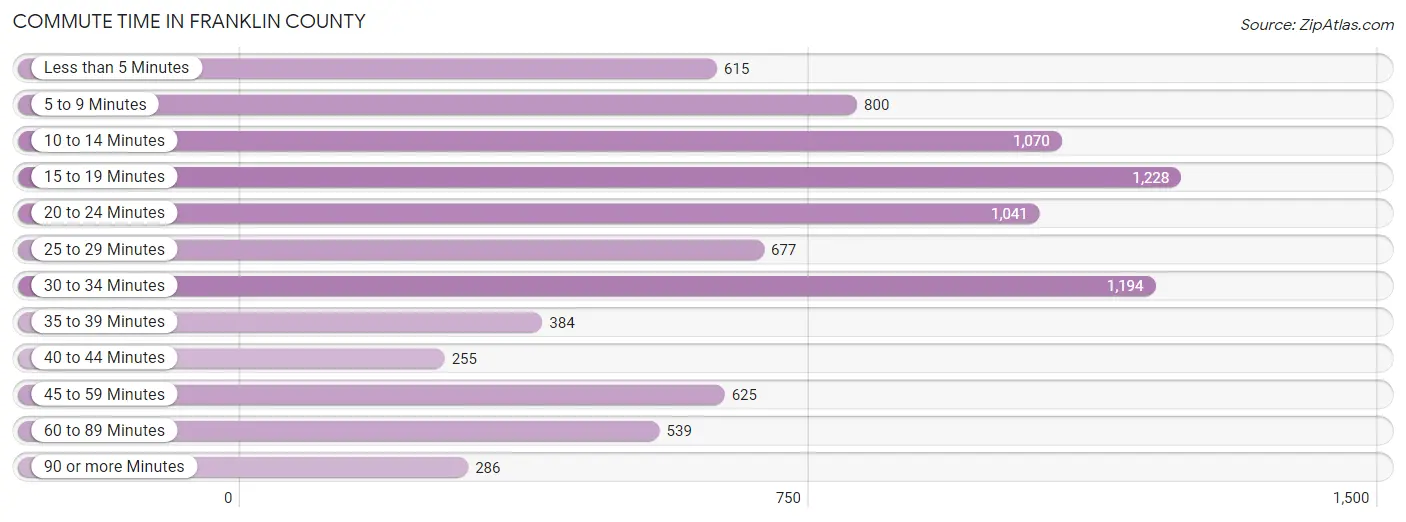
| Commute Time | # Commuters | % Commuters |
| Less than 5 Minutes | 615 | 7.1% |
| 5 to 9 Minutes | 800 | 9.2% |
| 10 to 14 Minutes | 1,070 | 12.3% |
| 15 to 19 Minutes | 1,228 | 14.1% |
| 20 to 24 Minutes | 1,041 | 11.9% |
| 25 to 29 Minutes | 677 | 7.8% |
| 30 to 34 Minutes | 1,194 | 13.7% |
| 35 to 39 Minutes | 384 | 4.4% |
| 40 to 44 Minutes | 255 | 2.9% |
| 45 to 59 Minutes | 625 | 7.2% |
| 60 to 89 Minutes | 539 | 6.2% |
| 90 or more Minutes | 286 | 3.3% |
Commute Time by Sex in Franklin County
The most common commute times in Franklin County are 20 to 24 minutes (609 commuters, 12.9%) for males and 10 to 14 minutes (732 commuters, 18.3%) for females.
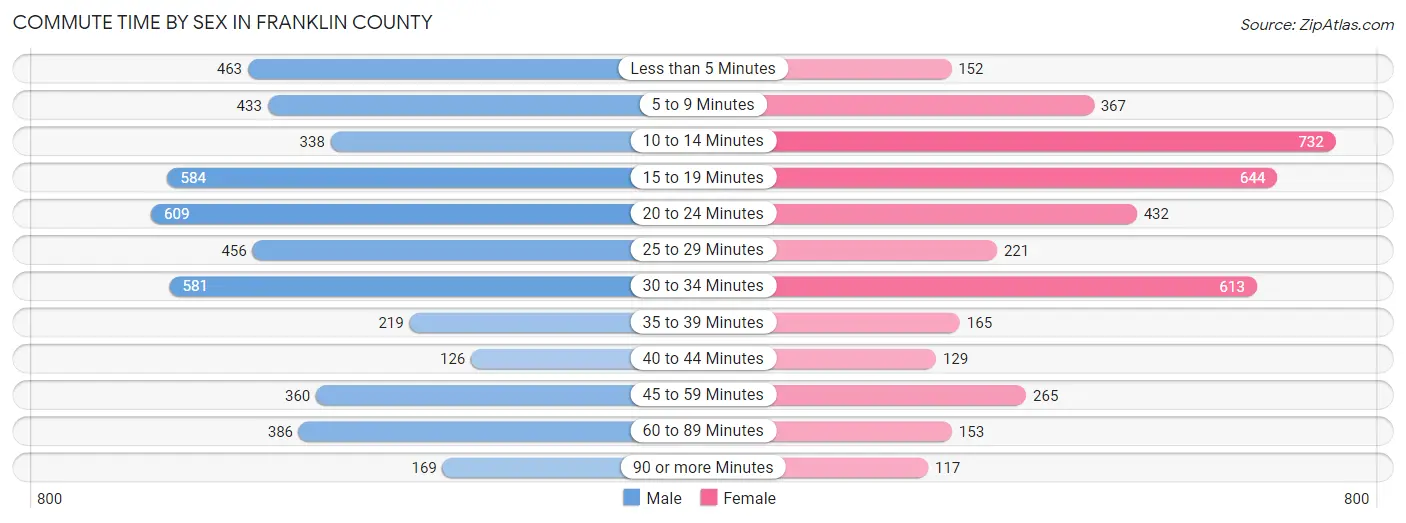
| Commute Time | Male | Female |
| Less than 5 Minutes | 463 (9.8%) | 152 (3.8%) |
| 5 to 9 Minutes | 433 (9.2%) | 367 (9.2%) |
| 10 to 14 Minutes | 338 (7.1%) | 732 (18.3%) |
| 15 to 19 Minutes | 584 (12.4%) | 644 (16.1%) |
| 20 to 24 Minutes | 609 (12.9%) | 432 (10.8%) |
| 25 to 29 Minutes | 456 (9.7%) | 221 (5.5%) |
| 30 to 34 Minutes | 581 (12.3%) | 613 (15.4%) |
| 35 to 39 Minutes | 219 (4.6%) | 165 (4.1%) |
| 40 to 44 Minutes | 126 (2.7%) | 129 (3.2%) |
| 45 to 59 Minutes | 360 (7.6%) | 265 (6.6%) |
| 60 to 89 Minutes | 386 (8.2%) | 153 (3.8%) |
| 90 or more Minutes | 169 (3.6%) | 117 (2.9%) |
Time of Departure to Work by Sex in Franklin County
The most frequent times of departure to work in Franklin County are 6:00 AM to 6:29 AM (948, 20.1%) for males and 7:30 AM to 7:59 AM (612, 15.3%) for females.
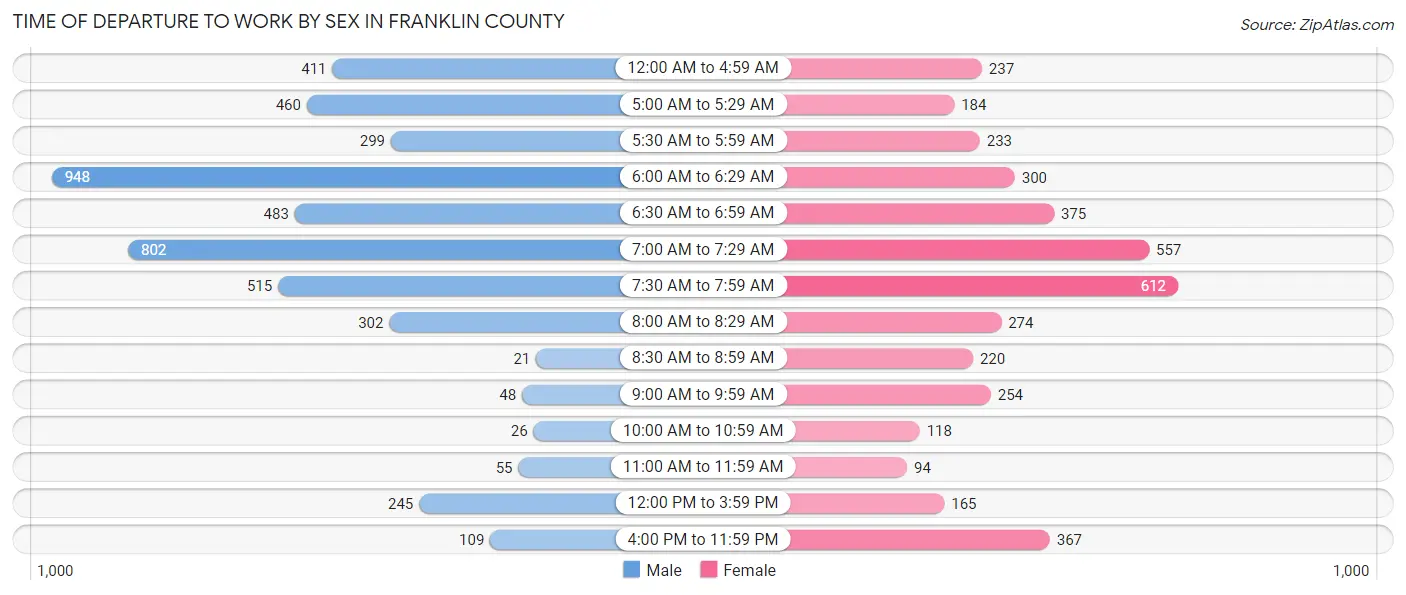
| Time of Departure | Male | Female |
| 12:00 AM to 4:59 AM | 411 (8.7%) | 237 (5.9%) |
| 5:00 AM to 5:29 AM | 460 (9.7%) | 184 (4.6%) |
| 5:30 AM to 5:59 AM | 299 (6.3%) | 233 (5.8%) |
| 6:00 AM to 6:29 AM | 948 (20.1%) | 300 (7.5%) |
| 6:30 AM to 6:59 AM | 483 (10.2%) | 375 (9.4%) |
| 7:00 AM to 7:29 AM | 802 (17.0%) | 557 (14.0%) |
| 7:30 AM to 7:59 AM | 515 (10.9%) | 612 (15.3%) |
| 8:00 AM to 8:29 AM | 302 (6.4%) | 274 (6.9%) |
| 8:30 AM to 8:59 AM | 21 (0.4%) | 220 (5.5%) |
| 9:00 AM to 9:59 AM | 48 (1.0%) | 254 (6.4%) |
| 10:00 AM to 10:59 AM | 26 (0.5%) | 118 (3.0%) |
| 11:00 AM to 11:59 AM | 55 (1.2%) | 94 (2.4%) |
| 12:00 PM to 3:59 PM | 245 (5.2%) | 165 (4.1%) |
| 4:00 PM to 11:59 PM | 109 (2.3%) | 367 (9.2%) |
| Total | 4,724 (100.0%) | 3,990 (100.0%) |
Housing Occupancy in Franklin County
Occupancy by Ownership in Franklin County
Of the total 8,539 dwellings in Franklin County, owner-occupied units account for 6,313 (73.9%), while renter-occupied units make up 2,226 (26.1%).
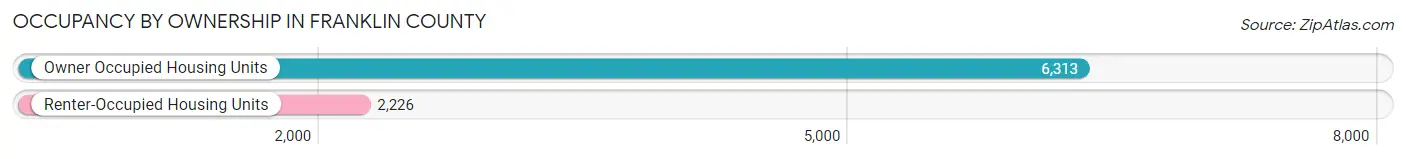
| Occupancy | # Housing Units | % Housing Units |
| Owner Occupied Housing Units | 6,313 | 73.9% |
| Renter-Occupied Housing Units | 2,226 | 26.1% |
| Total Occupied Housing Units | 8,539 | 100.0% |
Occupancy by Household Size in Franklin County
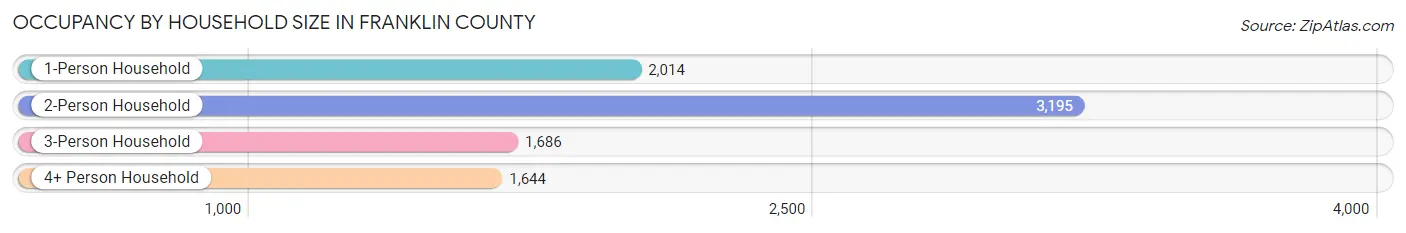
| Household Size | # Housing Units | % Housing Units |
| 1-Person Household | 2,014 | 23.6% |
| 2-Person Household | 3,195 | 37.4% |
| 3-Person Household | 1,686 | 19.7% |
| 4+ Person Household | 1,644 | 19.3% |
| Total Housing Units | 8,539 | 100.0% |
Occupancy by Ownership by Household Size in Franklin County
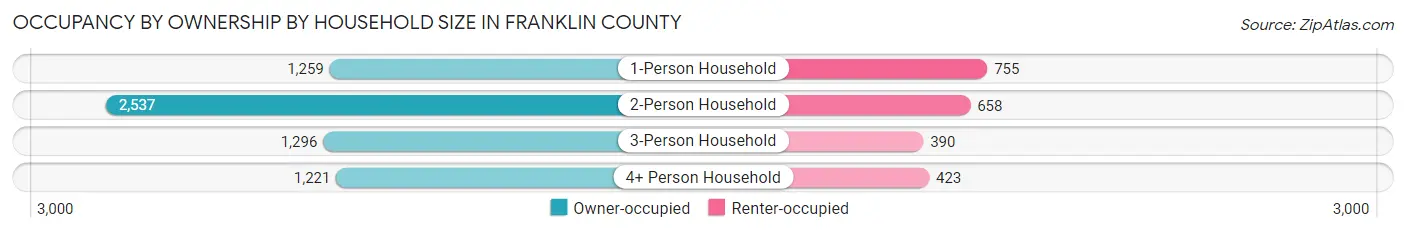
| Household Size | Owner-occupied | Renter-occupied |
| 1-Person Household | 1,259 (62.5%) | 755 (37.5%) |
| 2-Person Household | 2,537 (79.4%) | 658 (20.6%) |
| 3-Person Household | 1,296 (76.9%) | 390 (23.1%) |
| 4+ Person Household | 1,221 (74.3%) | 423 (25.7%) |
| Total Housing Units | 6,313 (73.9%) | 2,226 (26.1%) |
Occupancy by Educational Attainment in Franklin County
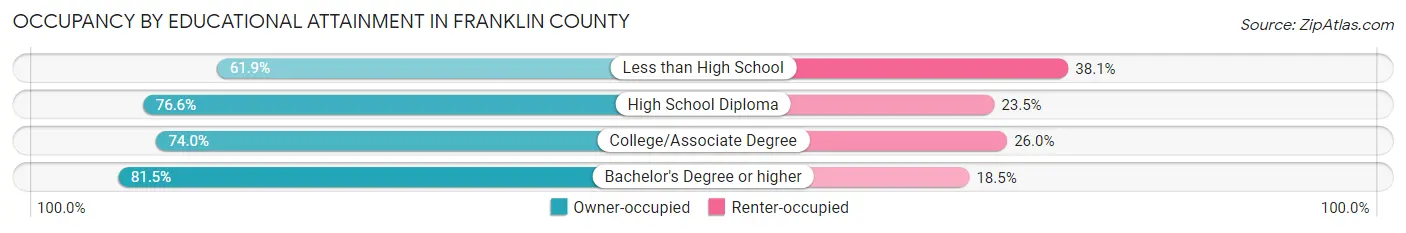
| Household Size | Owner-occupied | Renter-occupied |
| Less than High School | 989 (61.9%) | 609 (38.1%) |
| High School Diploma | 2,253 (76.5%) | 690 (23.4%) |
| College/Associate Degree | 1,851 (74.0%) | 650 (26.0%) |
| Bachelor's Degree or higher | 1,220 (81.5%) | 277 (18.5%) |
Occupancy by Age of Householder in Franklin County
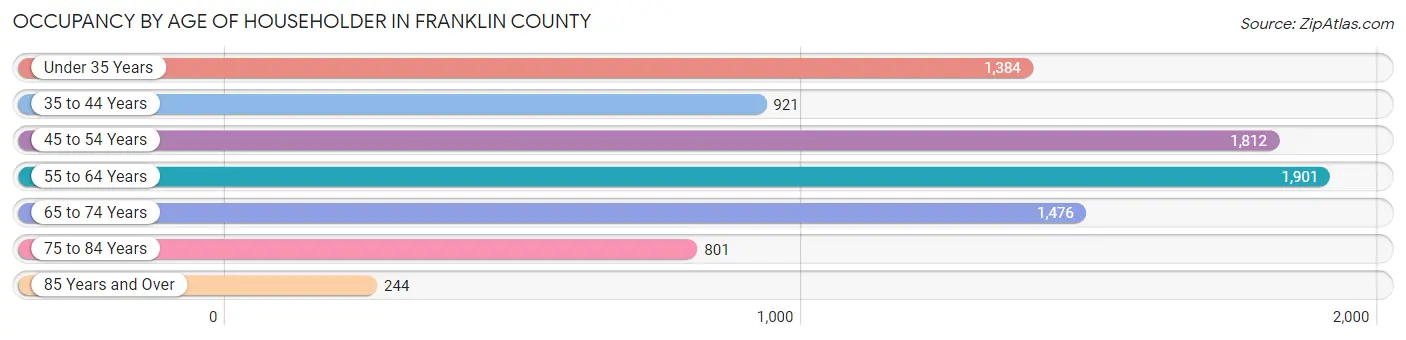
| Age Bracket | # Households | % Households |
| Under 35 Years | 1,384 | 16.2% |
| 35 to 44 Years | 921 | 10.8% |
| 45 to 54 Years | 1,812 | 21.2% |
| 55 to 64 Years | 1,901 | 22.3% |
| 65 to 74 Years | 1,476 | 17.3% |
| 75 to 84 Years | 801 | 9.4% |
| 85 Years and Over | 244 | 2.9% |
| Total | 8,539 | 100.0% |
Housing Finances in Franklin County
Median Income by Occupancy in Franklin County
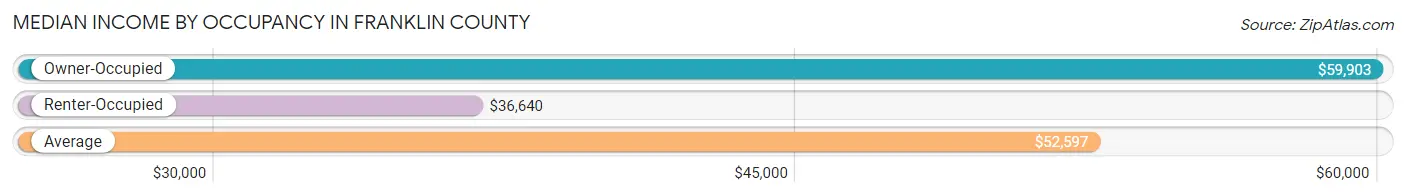
| Occupancy Type | # Households | Median Income |
| Owner-Occupied | 6,313 (73.9%) | $59,903 |
| Renter-Occupied | 2,226 (26.1%) | $36,640 |
| Average | 8,539 (100.0%) | $52,597 |
Occupancy by Householder Income Bracket in Franklin County
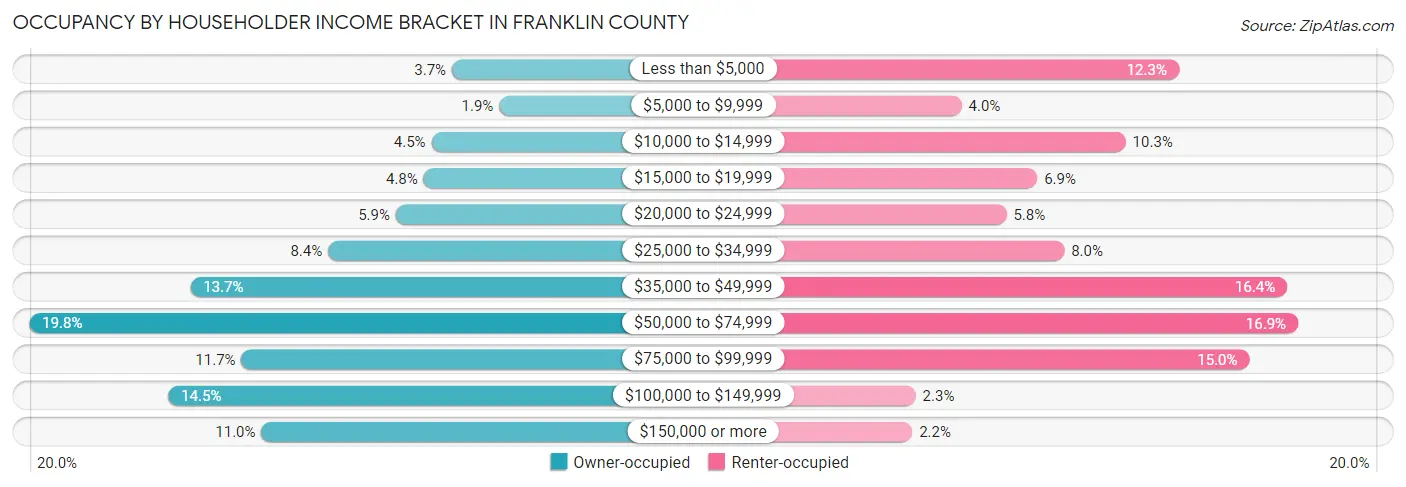
| Income Bracket | Owner-occupied | Renter-occupied |
| Less than $5,000 | 235 (3.7%) | 274 (12.3%) |
| $5,000 to $9,999 | 121 (1.9%) | 90 (4.0%) |
| $10,000 to $14,999 | 284 (4.5%) | 229 (10.3%) |
| $15,000 to $19,999 | 303 (4.8%) | 154 (6.9%) |
| $20,000 to $24,999 | 370 (5.9%) | 128 (5.8%) |
| $25,000 to $34,999 | 533 (8.4%) | 177 (8.0%) |
| $35,000 to $49,999 | 864 (13.7%) | 366 (16.4%) |
| $50,000 to $74,999 | 1,252 (19.8%) | 375 (16.9%) |
| $75,000 to $99,999 | 741 (11.7%) | 334 (15.0%) |
| $100,000 to $149,999 | 917 (14.5%) | 51 (2.3%) |
| $150,000 or more | 693 (11.0%) | 48 (2.2%) |
| Total | 6,313 (100.0%) | 2,226 (100.0%) |
Monthly Housing Cost Tiers in Franklin County
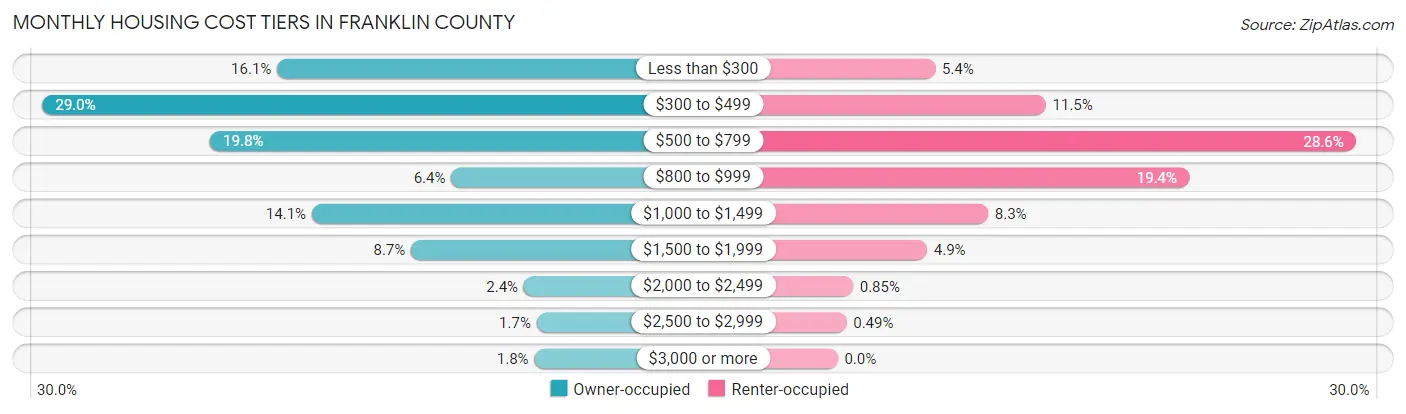
| Monthly Cost | Owner-occupied | Renter-occupied |
| Less than $300 | 1,013 (16.1%) | 120 (5.4%) |
| $300 to $499 | 1,832 (29.0%) | 256 (11.5%) |
| $500 to $799 | 1,247 (19.8%) | 637 (28.6%) |
| $800 to $999 | 406 (6.4%) | 432 (19.4%) |
| $1,000 to $1,499 | 892 (14.1%) | 185 (8.3%) |
| $1,500 to $1,999 | 546 (8.6%) | 110 (4.9%) |
| $2,000 to $2,499 | 153 (2.4%) | 19 (0.9%) |
| $2,500 to $2,999 | 108 (1.7%) | 11 (0.5%) |
| $3,000 or more | 116 (1.8%) | 0 (0.0%) |
| Total | 6,313 (100.0%) | 2,226 (100.0%) |
Physical Housing Characteristics in Franklin County
Housing Structures in Franklin County
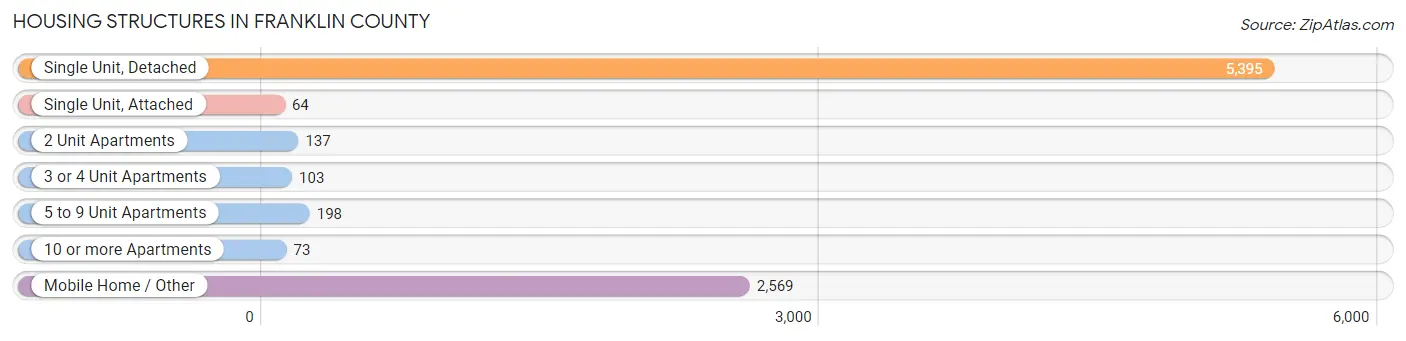
| Structure Type | # Housing Units | % Housing Units |
| Single Unit, Detached | 5,395 | 63.2% |
| Single Unit, Attached | 64 | 0.7% |
| 2 Unit Apartments | 137 | 1.6% |
| 3 or 4 Unit Apartments | 103 | 1.2% |
| 5 to 9 Unit Apartments | 198 | 2.3% |
| 10 or more Apartments | 73 | 0.9% |
| Mobile Home / Other | 2,569 | 30.1% |
| Total | 8,539 | 100.0% |
Housing Structures by Occupancy in Franklin County
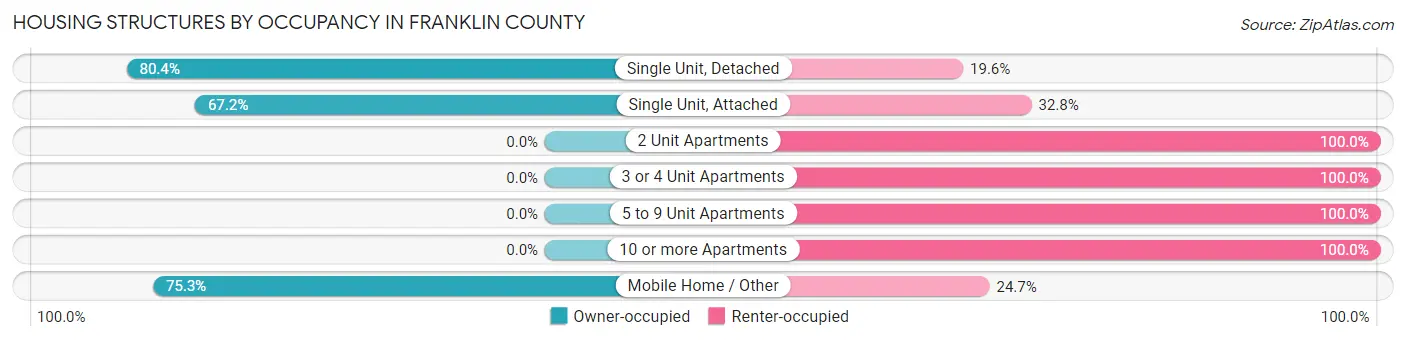
| Structure Type | Owner-occupied | Renter-occupied |
| Single Unit, Detached | 4,336 (80.4%) | 1,059 (19.6%) |
| Single Unit, Attached | 43 (67.2%) | 21 (32.8%) |
| 2 Unit Apartments | 0 (0.0%) | 137 (100.0%) |
| 3 or 4 Unit Apartments | 0 (0.0%) | 103 (100.0%) |
| 5 to 9 Unit Apartments | 0 (0.0%) | 198 (100.0%) |
| 10 or more Apartments | 0 (0.0%) | 73 (100.0%) |
| Mobile Home / Other | 1,934 (75.3%) | 635 (24.7%) |
| Total | 6,313 (73.9%) | 2,226 (26.1%) |
Housing Structures by Number of Rooms in Franklin County
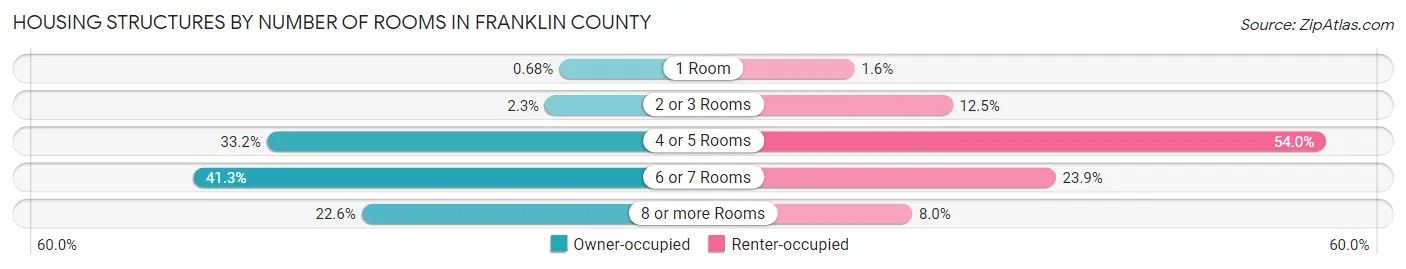
| Number of Rooms | Owner-occupied | Renter-occupied |
| 1 Room | 43 (0.7%) | 36 (1.6%) |
| 2 or 3 Rooms | 142 (2.2%) | 278 (12.5%) |
| 4 or 5 Rooms | 2,093 (33.2%) | 1,201 (53.9%) |
| 6 or 7 Rooms | 2,608 (41.3%) | 533 (23.9%) |
| 8 or more Rooms | 1,427 (22.6%) | 178 (8.0%) |
| Total | 6,313 (100.0%) | 2,226 (100.0%) |
Housing Structure by Heating Type in Franklin County
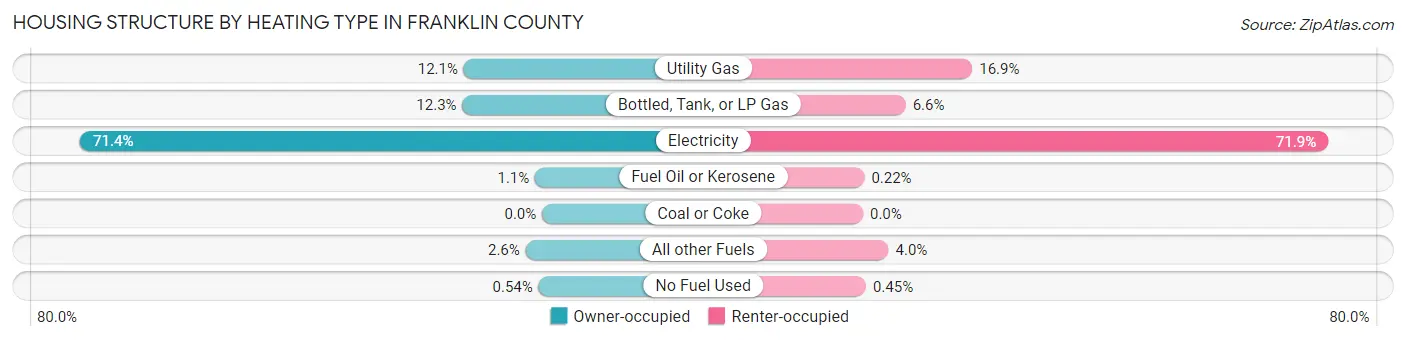
| Heating Type | Owner-occupied | Renter-occupied |
| Utility Gas | 764 (12.1%) | 376 (16.9%) |
| Bottled, Tank, or LP Gas | 778 (12.3%) | 147 (6.6%) |
| Electricity | 4,508 (71.4%) | 1,600 (71.9%) |
| Fuel Oil or Kerosene | 68 (1.1%) | 5 (0.2%) |
| Coal or Coke | 0 (0.0%) | 0 (0.0%) |
| All other Fuels | 161 (2.5%) | 88 (4.0%) |
| No Fuel Used | 34 (0.5%) | 10 (0.4%) |
| Total | 6,313 (100.0%) | 2,226 (100.0%) |
Household Vehicle Usage in Franklin County
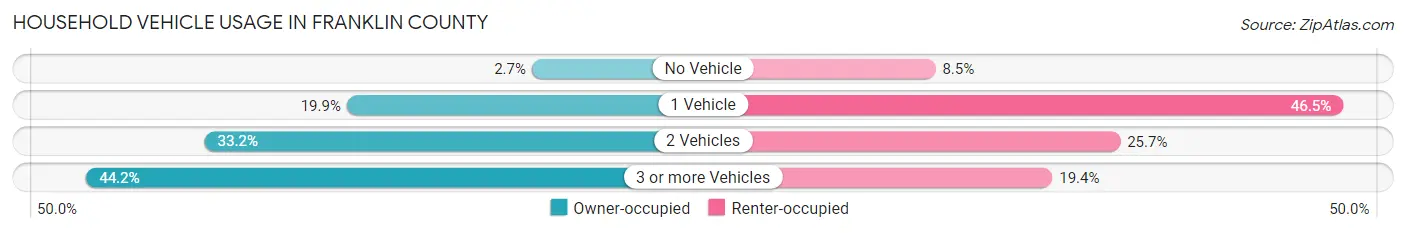
| Vehicles per Household | Owner-occupied | Renter-occupied |
| No Vehicle | 167 (2.6%) | 188 (8.5%) |
| 1 Vehicle | 1,258 (19.9%) | 1,035 (46.5%) |
| 2 Vehicles | 2,095 (33.2%) | 572 (25.7%) |
| 3 or more Vehicles | 2,793 (44.2%) | 431 (19.4%) |
| Total | 6,313 (100.0%) | 2,226 (100.0%) |
Real Estate & Mortgages in Franklin County
Real Estate and Mortgage Overview in Franklin County
| Characteristic | Without Mortgage | With Mortgage |
| Housing Units | 3,762 | 2,551 |
| Median Property Value | $124,900 | $185,500 |
| Median Household Income | $50,208 | $447 |
| Monthly Housing Costs | $419 | $109 |
| Real Estate Taxes | $993 | $38 |
Property Value by Mortgage Status in Franklin County
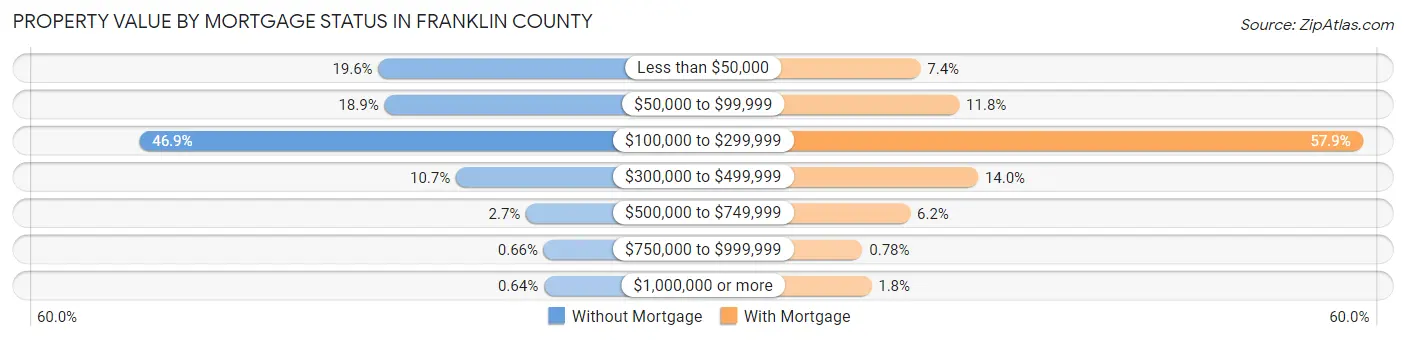
| Property Value | Without Mortgage | With Mortgage |
| Less than $50,000 | 736 (19.6%) | 189 (7.4%) |
| $50,000 to $99,999 | 710 (18.9%) | 302 (11.8%) |
| $100,000 to $299,999 | 1,764 (46.9%) | 1,478 (57.9%) |
| $300,000 to $499,999 | 402 (10.7%) | 357 (14.0%) |
| $500,000 to $749,999 | 101 (2.7%) | 159 (6.2%) |
| $750,000 to $999,999 | 25 (0.7%) | 20 (0.8%) |
| $1,000,000 or more | 24 (0.6%) | 46 (1.8%) |
| Total | 3,762 (100.0%) | 2,551 (100.0%) |
Household Income by Mortgage Status in Franklin County
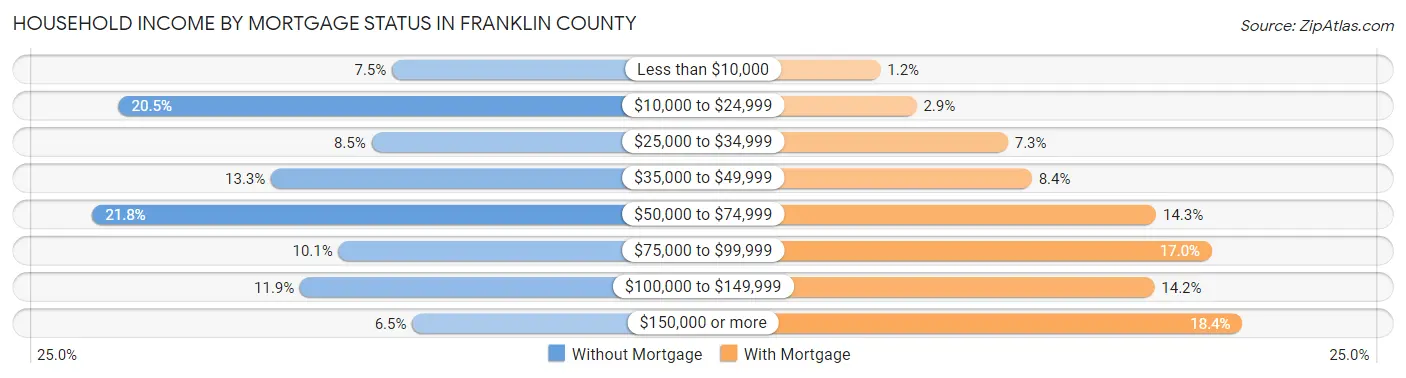
| Household Income | Without Mortgage | With Mortgage |
| Less than $10,000 | 282 (7.5%) | 30 (1.2%) |
| $10,000 to $24,999 | 772 (20.5%) | 74 (2.9%) |
| $25,000 to $34,999 | 319 (8.5%) | 185 (7.2%) |
| $35,000 to $49,999 | 499 (13.3%) | 214 (8.4%) |
| $50,000 to $74,999 | 819 (21.8%) | 365 (14.3%) |
| $75,000 to $99,999 | 378 (10.1%) | 433 (17.0%) |
| $100,000 to $149,999 | 447 (11.9%) | 363 (14.2%) |
| $150,000 or more | 246 (6.5%) | 470 (18.4%) |
| Total | 3,762 (100.0%) | 2,551 (100.0%) |
Property Value to Household Income Ratio in Franklin County
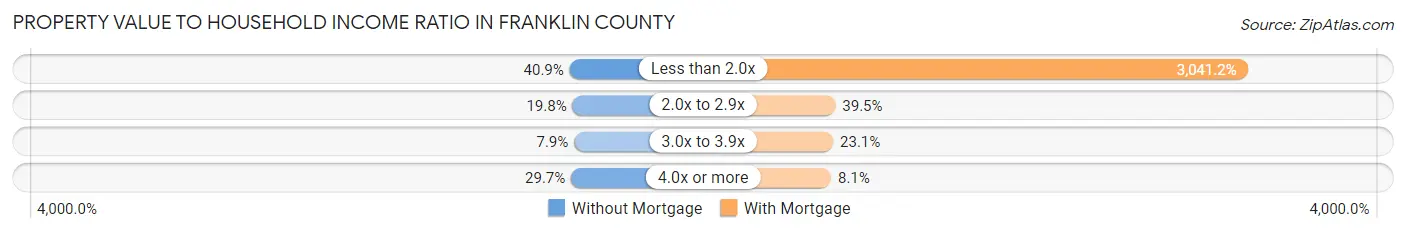
| Value-to-Income Ratio | Without Mortgage | With Mortgage |
| Less than 2.0x | 1,540 (40.9%) | 77,580 (3,041.2%) |
| 2.0x to 2.9x | 745 (19.8%) | 1,008 (39.5%) |
| 3.0x to 3.9x | 297 (7.9%) | 590 (23.1%) |
| 4.0x or more | 1,117 (29.7%) | 207 (8.1%) |
| Total | 3,762 (100.0%) | 2,551 (100.0%) |
Real Estate Taxes by Mortgage Status in Franklin County
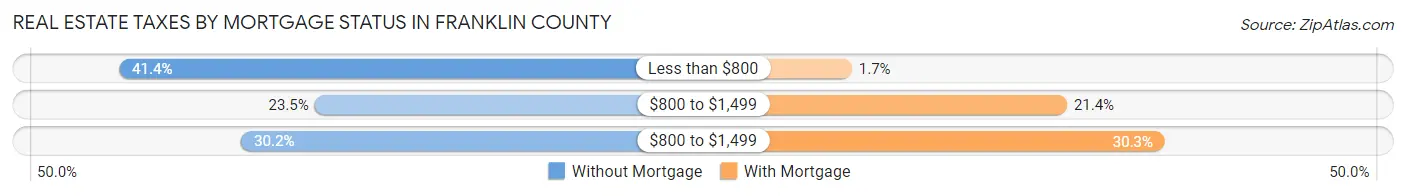
| Property Taxes | Without Mortgage | With Mortgage |
| Less than $800 | 1,556 (41.4%) | 44 (1.7%) |
| $800 to $1,499 | 885 (23.5%) | 545 (21.4%) |
| $800 to $1,499 | 1,137 (30.2%) | 773 (30.3%) |
| Total | 3,762 (100.0%) | 2,551 (100.0%) |
Health & Disability in Franklin County
Health Insurance Coverage by Age in Franklin County
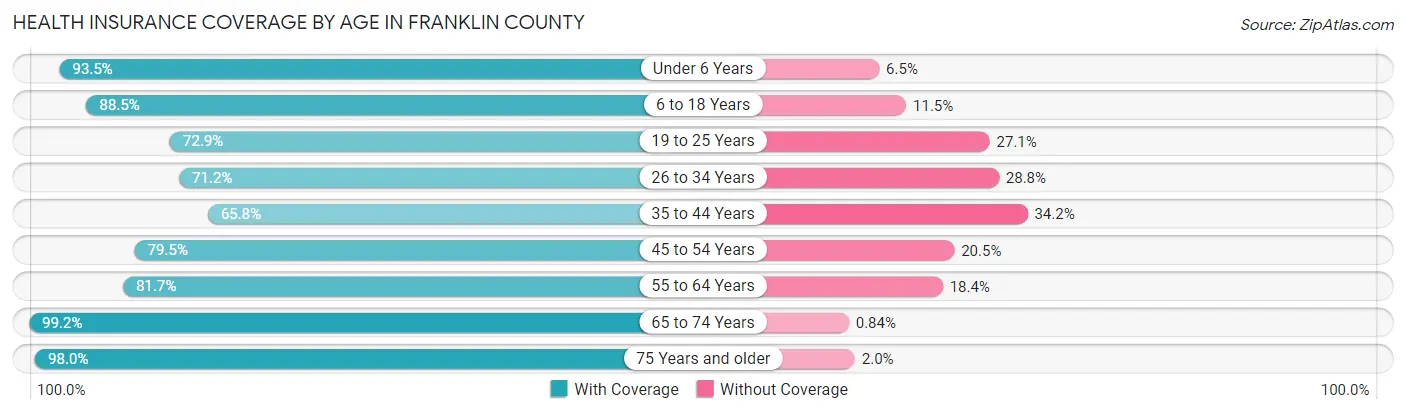
| Age Bracket | With Coverage | Without Coverage |
| Under 6 Years | 1,353 (93.5%) | 94 (6.5%) |
| 6 to 18 Years | 3,506 (88.5%) | 457 (11.5%) |
| 19 to 25 Years | 1,762 (72.9%) | 655 (27.1%) |
| 26 to 34 Years | 1,667 (71.2%) | 675 (28.8%) |
| 35 to 44 Years | 1,654 (65.8%) | 858 (34.2%) |
| 45 to 54 Years | 2,474 (79.5%) | 638 (20.5%) |
| 55 to 64 Years | 2,635 (81.7%) | 592 (18.3%) |
| 65 to 74 Years | 2,490 (99.2%) | 21 (0.8%) |
| 75 Years and older | 1,696 (98.0%) | 34 (2.0%) |
| Total | 19,237 (82.7%) | 4,024 (17.3%) |
Health Insurance Coverage by Citizenship Status in Franklin County
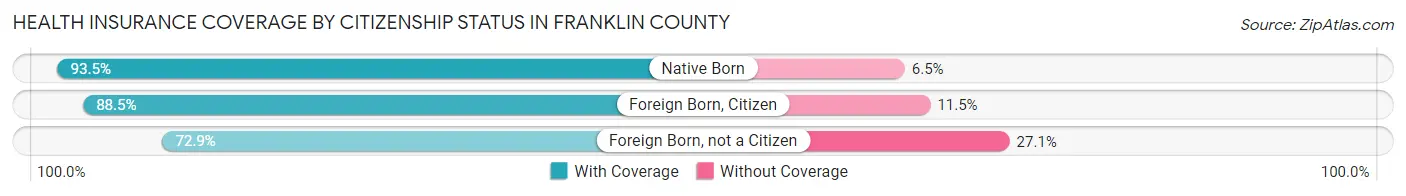
| Citizenship Status | With Coverage | Without Coverage |
| Native Born | 1,353 (93.5%) | 94 (6.5%) |
| Foreign Born, Citizen | 3,506 (88.5%) | 457 (11.5%) |
| Foreign Born, not a Citizen | 1,762 (72.9%) | 655 (27.1%) |
Health Insurance Coverage by Household Income in Franklin County
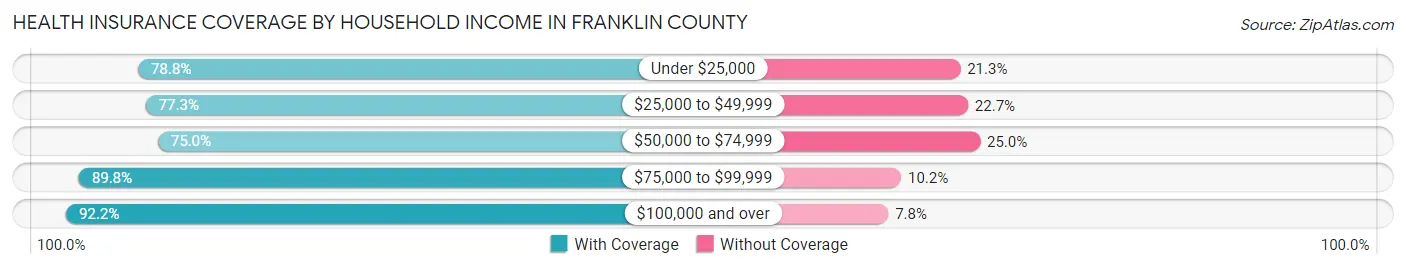
| Household Income | With Coverage | Without Coverage |
| Under $25,000 | 3,431 (78.7%) | 926 (21.2%) |
| $25,000 to $49,999 | 3,479 (77.3%) | 1,021 (22.7%) |
| $50,000 to $74,999 | 3,718 (75.0%) | 1,237 (25.0%) |
| $75,000 to $99,999 | 3,152 (89.8%) | 357 (10.2%) |
| $100,000 and over | 5,066 (92.2%) | 426 (7.8%) |
Public vs Private Health Insurance Coverage by Age in Franklin County
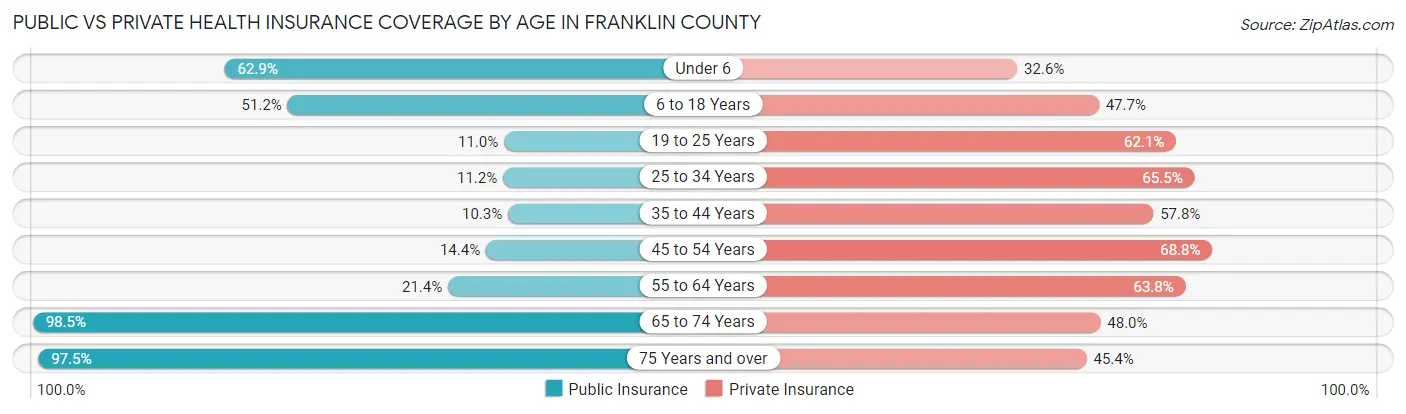
| Age Bracket | Public Insurance | Private Insurance |
| Under 6 | 910 (62.9%) | 471 (32.6%) |
| 6 to 18 Years | 2,028 (51.2%) | 1,890 (47.7%) |
| 19 to 25 Years | 266 (11.0%) | 1,500 (62.1%) |
| 25 to 34 Years | 262 (11.2%) | 1,533 (65.5%) |
| 35 to 44 Years | 258 (10.3%) | 1,452 (57.8%) |
| 45 to 54 Years | 447 (14.4%) | 2,140 (68.8%) |
| 55 to 64 Years | 691 (21.4%) | 2,059 (63.8%) |
| 65 to 74 Years | 2,473 (98.5%) | 1,205 (48.0%) |
| 75 Years and over | 1,686 (97.5%) | 786 (45.4%) |
| Total | 9,021 (38.8%) | 13,036 (56.0%) |
Disability Status by Sex by Age in Franklin County
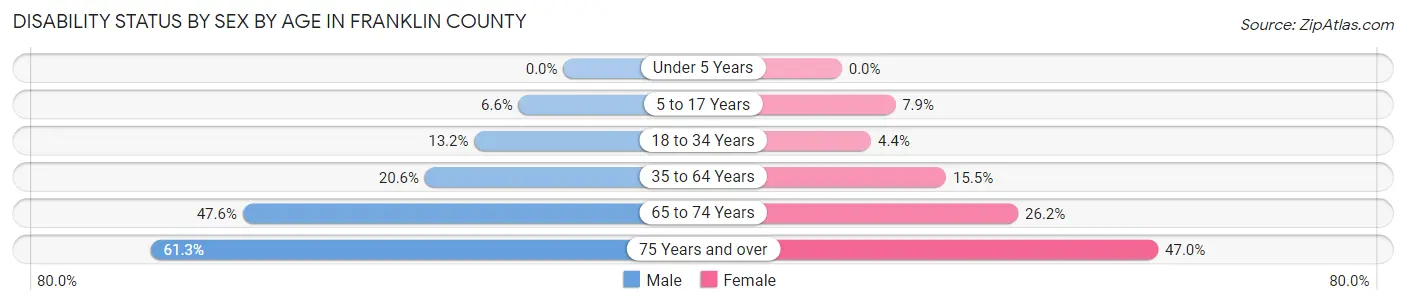
| Age Bracket | Male | Female |
| Under 5 Years | 0 (0.0%) | 0 (0.0%) |
| 5 to 17 Years | 131 (6.6%) | 152 (7.9%) |
| 18 to 34 Years | 332 (13.2%) | 112 (4.4%) |
| 35 to 64 Years | 933 (20.6%) | 668 (15.5%) |
| 65 to 74 Years | 548 (47.6%) | 356 (26.2%) |
| 75 Years and over | 413 (61.3%) | 496 (47.0%) |
Disability Class by Sex by Age in Franklin County
Disability Class: Hearing Difficulty
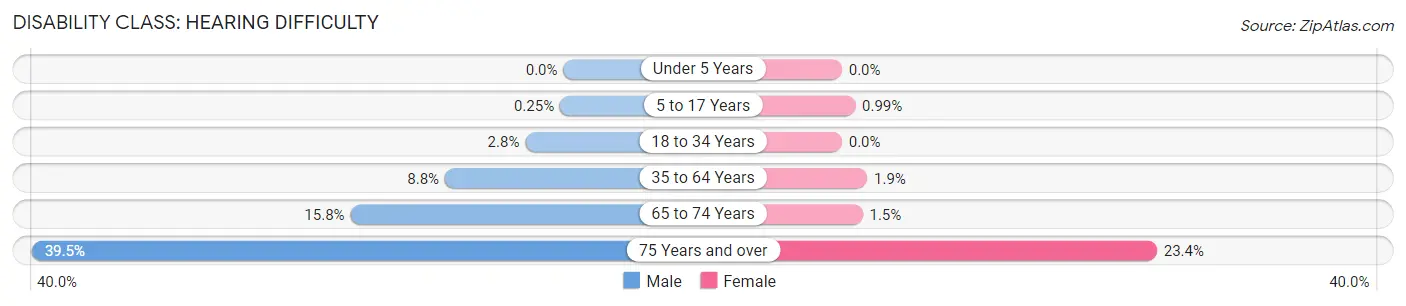
| Age Bracket | Male | Female |
| Under 5 Years | 0 (0.0%) | 0 (0.0%) |
| 5 to 17 Years | 5 (0.3%) | 19 (1.0%) |
| 18 to 34 Years | 71 (2.8%) | 0 (0.0%) |
| 35 to 64 Years | 399 (8.8%) | 81 (1.9%) |
| 65 to 74 Years | 182 (15.8%) | 21 (1.5%) |
| 75 Years and over | 266 (39.5%) | 247 (23.4%) |
Disability Class: Vision Difficulty
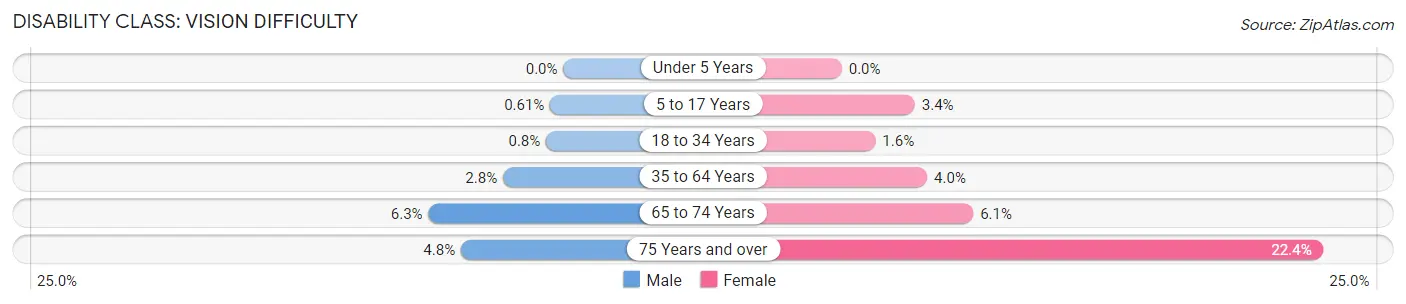
| Age Bracket | Male | Female |
| Under 5 Years | 0 (0.0%) | 0 (0.0%) |
| 5 to 17 Years | 12 (0.6%) | 65 (3.4%) |
| 18 to 34 Years | 20 (0.8%) | 40 (1.6%) |
| 35 to 64 Years | 127 (2.8%) | 171 (4.0%) |
| 65 to 74 Years | 72 (6.3%) | 83 (6.1%) |
| 75 Years and over | 32 (4.8%) | 236 (22.4%) |
Disability Class: Cognitive Difficulty
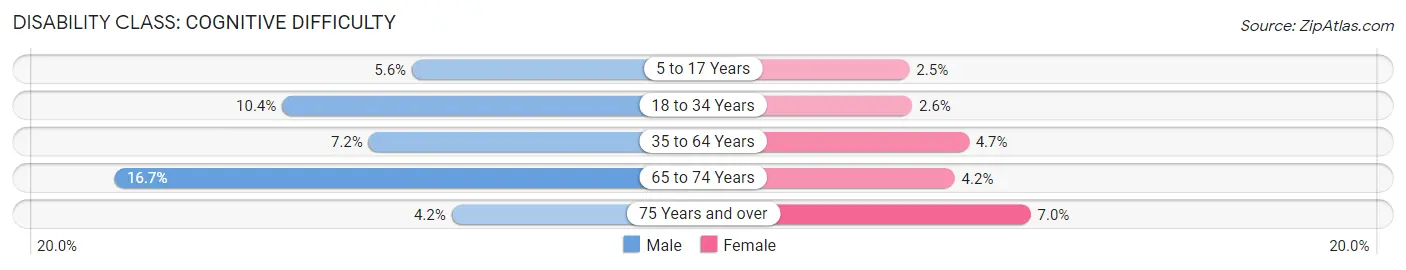
| Age Bracket | Male | Female |
| 5 to 17 Years | 111 (5.6%) | 48 (2.5%) |
| 18 to 34 Years | 262 (10.4%) | 67 (2.6%) |
| 35 to 64 Years | 328 (7.2%) | 203 (4.7%) |
| 65 to 74 Years | 192 (16.7%) | 57 (4.2%) |
| 75 Years and over | 28 (4.2%) | 74 (7.0%) |
Disability Class: Ambulatory Difficulty
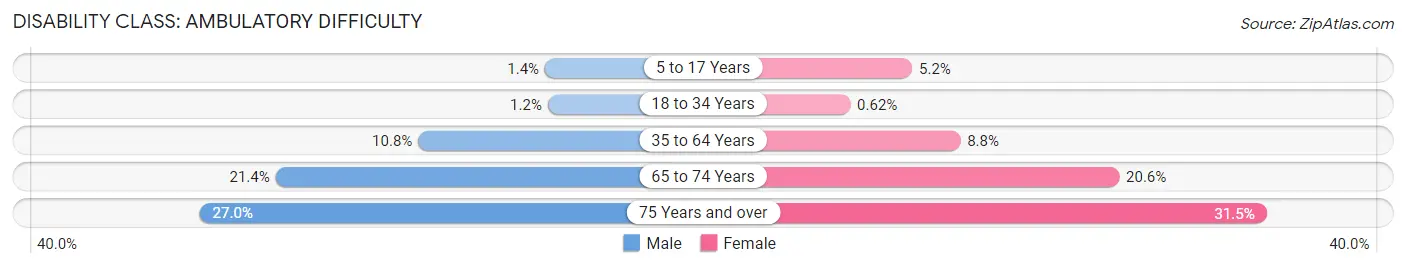
| Age Bracket | Male | Female |
| 5 to 17 Years | 27 (1.4%) | 100 (5.2%) |
| 18 to 34 Years | 29 (1.2%) | 16 (0.6%) |
| 35 to 64 Years | 489 (10.8%) | 379 (8.8%) |
| 65 to 74 Years | 246 (21.4%) | 280 (20.6%) |
| 75 Years and over | 182 (27.0%) | 333 (31.5%) |
Disability Class: Self-Care Difficulty
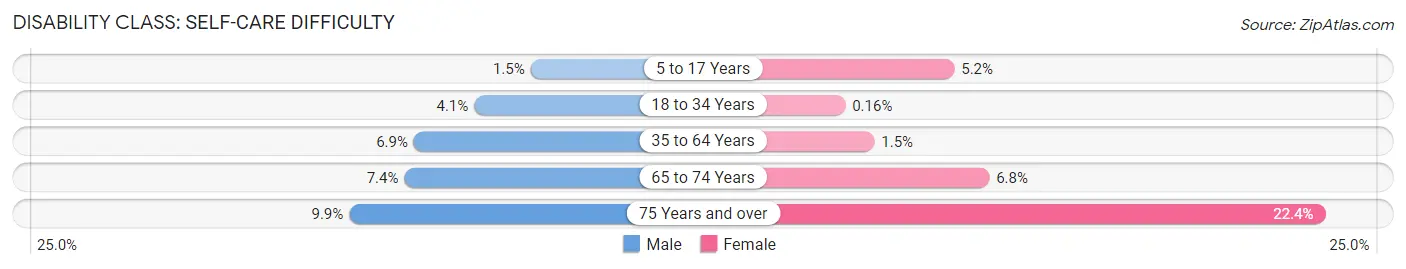
| Age Bracket | Male | Female |
| 5 to 17 Years | 30 (1.5%) | 100 (5.2%) |
| 18 to 34 Years | 104 (4.1%) | 4 (0.2%) |
| 35 to 64 Years | 315 (6.9%) | 65 (1.5%) |
| 65 to 74 Years | 85 (7.4%) | 93 (6.8%) |
| 75 Years and over | 67 (9.9%) | 237 (22.4%) |
Technology Access in Franklin County
Computing Device Access in Franklin County
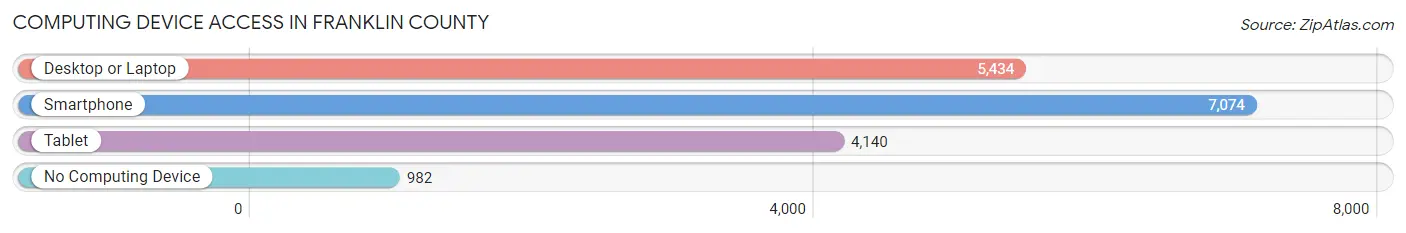
| Device Type | # Households | % Households |
| Desktop or Laptop | 5,434 | 63.6% |
| Smartphone | 7,074 | 82.8% |
| Tablet | 4,140 | 48.5% |
| No Computing Device | 982 | 11.5% |
| Total | 8,539 | 100.0% |
Internet Access in Franklin County
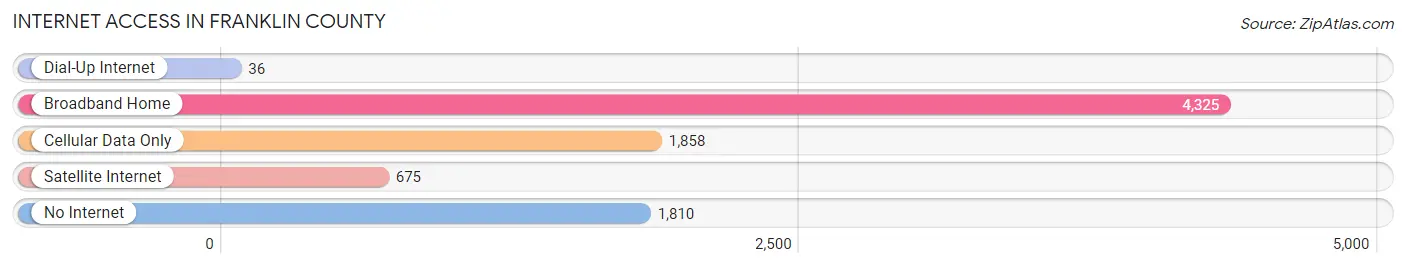
| Internet Type | # Households | % Households |
| Dial-Up Internet | 36 | 0.4% |
| Broadband Home | 4,325 | 50.6% |
| Cellular Data Only | 1,858 | 21.8% |
| Satellite Internet | 675 | 7.9% |
| No Internet | 1,810 | 21.2% |
| Total | 8,539 | 100.0% |
Franklin County Summary
Franklin County, Georgia is located in the northeastern part of the state, and is bordered by Hart, Stephens, Banks, Habersham, and Madison counties. The county seat is Carnesville, and the county was named after Benjamin Franklin. The county has a total area of 441 square miles, of which 439 square miles is land and 2 square miles is water.
History
Franklin County was created in 1784 from part of the original Cherokee County. The county was named after Benjamin Franklin, one of the Founding Fathers of the United States. The county was originally part of the Cherokee Nation, and the area was home to the Cherokee people for centuries before the arrival of European settlers.
In the early 19th century, the county was home to a number of small towns, including Carnesville, Lavonia, and Royston. The county was also home to a number of plantations, and the area was a major producer of cotton. During the Civil War, the county was the site of several battles, including the Battle of Carnesville in 1864.
Geography
Franklin County is located in the northeastern part of the state, and is bordered by Hart, Stephens, Banks, Habersham, and Madison counties. The county has a total area of 441 square miles, of which 439 square miles is land and 2 square miles is water. The county is located in the Piedmont region of Georgia, and is characterized by rolling hills and valleys. The county is home to several rivers, including the Broad, Tugaloo, and Chattahoochee.
The county is home to several state parks, including the Franklin County State Park, which is located on the shores of Lake Hartwell. The county is also home to the Franklin County Wildlife Management Area, which is a popular destination for hunting and fishing.
Economy
The economy of Franklin County is largely based on agriculture, with the county being a major producer of cotton, corn, soybeans, and other crops. The county is also home to several manufacturing companies, including a number of automotive parts suppliers. The county is also home to several wineries, and the area is a popular destination for wine tourism.
The county is home to several colleges and universities, including the University of North Georgia, which is located in Carnesville. The county is also home to several hospitals, including the Franklin Medical Center in Carnesville.
Demographics
As of the 2010 census, the population of Franklin County was 22,084, an increase of 8.3% from the 2000 census. The population is spread out with a median age of 39.7 years. The racial makeup of the county is 87.3% White, 8.7% African American, 0.4% Native American, 0.7% Asian, 0.1% Pacific Islander, 1.3% from other races, and 1.5% from two or more races.
The median household income in the county is $37,945, and the median family income is $45,945. The per capita income in the county is $19,945. The poverty rate in the county is 17.3%, and the unemployment rate is 6.2%.
Conclusion
Franklin County, Georgia is located in the northeastern part of the state, and is bordered by Hart, Stephens, Banks, Habersham, and Madison counties. The county was created in 1784 from part of the original Cherokee County, and was named after Benjamin Franklin. The county has a total area of 441 square miles, of which 439 square miles is land and 2 square miles is water. The county is home to several state parks, and is a major producer of cotton, corn, soybeans, and other crops. The population of the county is 22,084, and the median household income is $37,945. The county is home to several colleges and universities, and is a popular destination for wine tourism.
Common Questions
What is Per Capita Income in Franklin County?
Per Capita income in Franklin County is $27,671.
What is the Median Family Income in Franklin County?
Median Family Income in Franklin County is $63,774.
What is the Median Household income in Franklin County?
Median Household Income in Franklin County is $52,597.
What is Income or Wage Gap in Franklin County?
Income or Wage Gap in Franklin County is 39.2%.
Women in Franklin County earn 60.8 cents for every dollar earned by a man.
What is Family Income Deficit in Franklin County?
Family Income Deficit in Franklin County is $9,440.
Families that are below poverty line in Franklin County earn $9,440 less on average than the poverty threshold level.
What is Inequality or Gini Index in Franklin County?
Inequality or Gini Index in Franklin County is 0.48.
What is the Total Population of Franklin County?
Total Population of Franklin County is 23,480.
What is the Total Male Population of Franklin County?
Total Male Population of Franklin County is 11,680.
What is the Total Female Population of Franklin County?
Total Female Population of Franklin County is 11,800.
What is the Ratio of Males per 100 Females in Franklin County?
There are 98.98 Males per 100 Females in Franklin County.
What is the Ratio of Females per 100 Males in Franklin County?
There are 101.03 Females per 100 Males in Franklin County.
What is the Median Population Age in Franklin County?
Median Population Age in Franklin County is 40.9 Years.
What is the Average Family Size in Franklin County
Average Family Size in Franklin County is 3.1 People.
What is the Average Household Size in Franklin County
Average Household Size in Franklin County is 2.7 People.
How Large is the Labor Force in Franklin County?
There are 10,125 People in the Labor Forcein in Franklin County.
What is the Percentage of People in the Labor Force in Franklin County?
53.0% of People are in the Labor Force in Franklin County.
What is the Unemployment Rate in Franklin County?
Unemployment Rate in Franklin County is 6.2%.