Early County, GA Map & Demographics
Early County Map
Early County Overview
$25,929
PER CAPITA INCOME
$57,030
AVG FAMILY INCOME
$48,355
AVG HOUSEHOLD INCOME
21.9%
WAGE / INCOME GAP [ % ]
78.1¢/ $1
WAGE / INCOME GAP [ $ ]
$10,641
FAMILY INCOME DEFICIT
0.48
INEQUALITY / GINI INDEX
10,753
TOTAL POPULATION
5,082
MALE POPULATION
5,671
FEMALE POPULATION
89.61
MALES / 100 FEMALES
111.59
FEMALES / 100 MALES
40.4
MEDIAN AGE
3.3
AVG FAMILY SIZE
2.6
AVG HOUSEHOLD SIZE
4,557
LABOR FORCE [ PEOPLE ]
53.8%
PERCENT IN LABOR FORCE
6.0%
UNEMPLOYMENT RATE
Early County Area Codes
Income in Early County
Income Overview in Early County
Per Capita Income in Early County is $25,929, while median incomes of families and households are $57,030 and $48,355 respectively.
| Characteristic | Number | Measure |
| Per Capita Income | 10,753 | $25,929 |
| Median Family Income | 2,791 | $57,030 |
| Mean Family Income | 2,791 | $68,920 |
| Median Household Income | 4,016 | $48,355 |
| Mean Household Income | 4,016 | $67,361 |
| Income Deficit | 2,791 | $10,641 |
| Wage / Income Gap (%) | 10,753 | 21.86% |
| Wage / Income Gap ($) | 10,753 | 78.14¢ per $1 |
| Gini / Inequality Index | 10,753 | 0.48 |
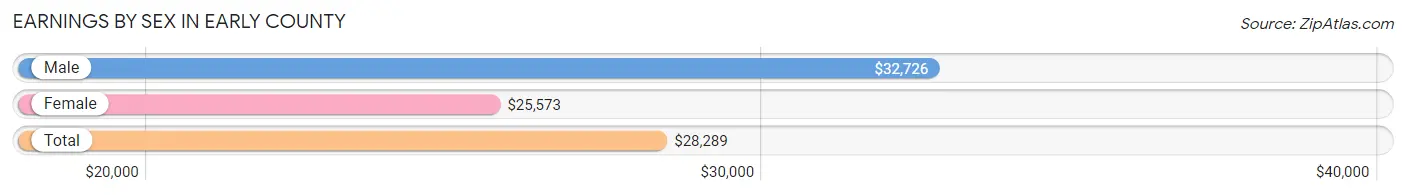
Earnings by Sex in Early County
Average Earnings in Early County are $28,289, $32,726 for men and $25,573 for women, a difference of 21.9%.
| Sex | Number | Average Earnings |
| Male | 2,178 (46.1%) | $32,726 |
| Female | 2,543 (53.9%) | $25,573 |
| Total | 4,721 (100.0%) | $28,289 |
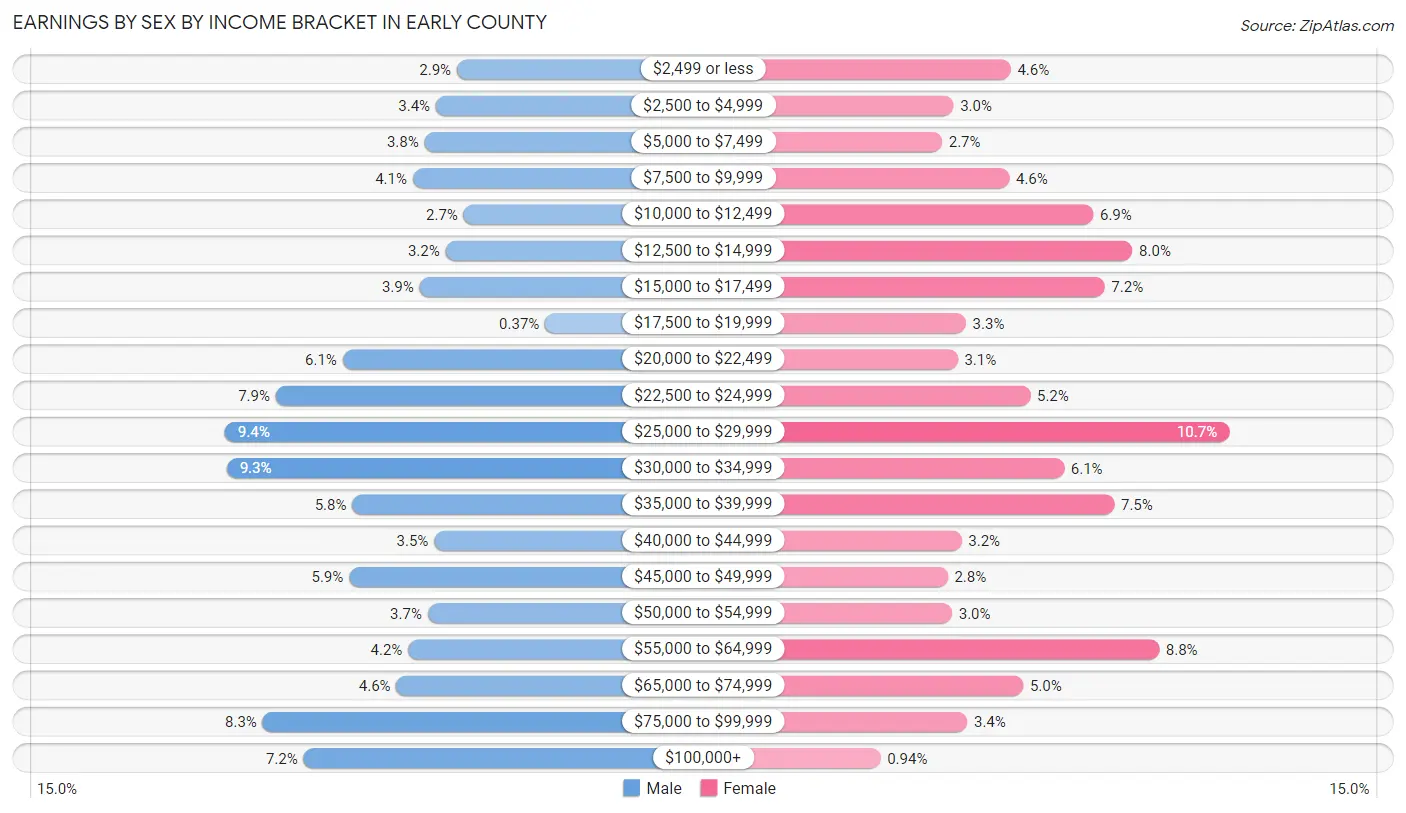
Earnings by Sex by Income Bracket in Early County
The most common earnings brackets in Early County are $25,000 to $29,999 for men (204 | 9.4%) and $25,000 to $29,999 for women (273 | 10.7%).
| Income | Male | Female |
| $2,499 or less | 62 (2.9%) | 117 (4.6%) |
| $2,500 to $4,999 | 75 (3.4%) | 76 (3.0%) |
| $5,000 to $7,499 | 82 (3.8%) | 68 (2.7%) |
| $7,500 to $9,999 | 89 (4.1%) | 116 (4.6%) |
| $10,000 to $12,499 | 58 (2.7%) | 176 (6.9%) |
| $12,500 to $14,999 | 69 (3.2%) | 204 (8.0%) |
| $15,000 to $17,499 | 85 (3.9%) | 184 (7.2%) |
| $17,500 to $19,999 | 8 (0.4%) | 85 (3.3%) |
| $20,000 to $22,499 | 132 (6.1%) | 79 (3.1%) |
| $22,500 to $24,999 | 173 (7.9%) | 131 (5.1%) |
| $25,000 to $29,999 | 204 (9.4%) | 273 (10.7%) |
| $30,000 to $34,999 | 203 (9.3%) | 155 (6.1%) |
| $35,000 to $39,999 | 126 (5.8%) | 191 (7.5%) |
| $40,000 to $44,999 | 76 (3.5%) | 82 (3.2%) |
| $45,000 to $49,999 | 128 (5.9%) | 72 (2.8%) |
| $50,000 to $54,999 | 80 (3.7%) | 75 (2.9%) |
| $55,000 to $64,999 | 92 (4.2%) | 223 (8.8%) |
| $65,000 to $74,999 | 99 (4.5%) | 126 (5.0%) |
| $75,000 to $99,999 | 181 (8.3%) | 86 (3.4%) |
| $100,000+ | 156 (7.2%) | 24 (0.9%) |
| Total | 2,178 (100.0%) | 2,543 (100.0%) |
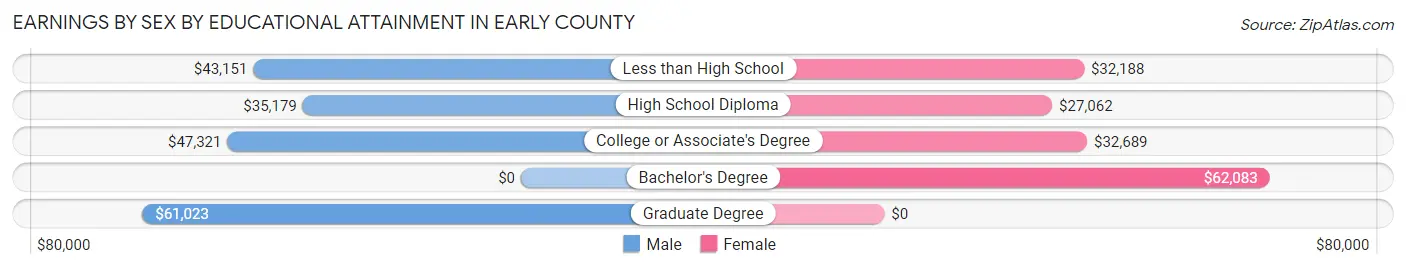
Earnings by Sex by Educational Attainment in Early County
Average earnings in Early County are $39,120 for men and $31,645 for women, a difference of 19.1%. Men with an educational attainment of graduate degree enjoy the highest average annual earnings of $61,023, while those with high school diploma education earn the least with $35,179. Women with an educational attainment of bachelor's degree earn the most with the average annual earnings of $62,083, while those with high school diploma education have the smallest earnings of $27,062.
| Educational Attainment | Male Income | Female Income |
| Less than High School | $43,151 | $32,188 |
| High School Diploma | $35,179 | $27,062 |
| College or Associate's Degree | $47,321 | $32,689 |
| Bachelor's Degree | - | - |
| Graduate Degree | $61,023 | $0 |
| Total | $39,120 | $31,645 |
Family Income in Early County
Family Income Brackets in Early County
According to the Early County family income data, there are 631 families falling into the $50,000 to $74,999 income range, which is the most common income bracket and makes up 22.6% of all families. Conversely, the $200,000+ income bracket is the least frequent group with only 39 families (1.4%) belonging to this category.
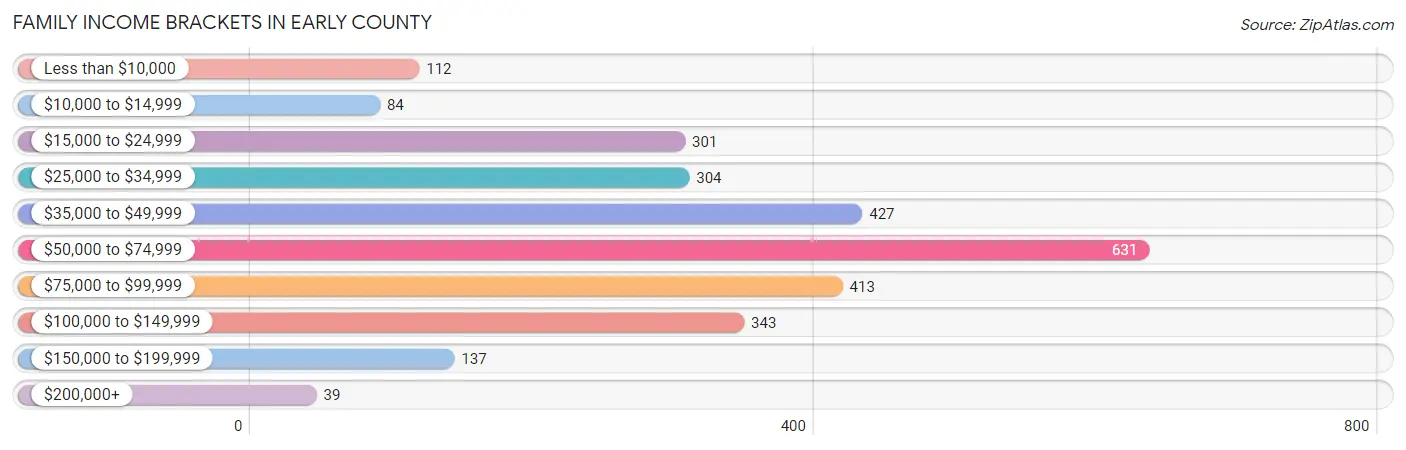
| Income Bracket | # Families | % Families |
| Less than $10,000 | 112 | 4.0% |
| $10,000 to $14,999 | 84 | 3.0% |
| $15,000 to $24,999 | 301 | 10.8% |
| $25,000 to $34,999 | 304 | 10.9% |
| $35,000 to $49,999 | 427 | 15.3% |
| $50,000 to $74,999 | 631 | 22.6% |
| $75,000 to $99,999 | 413 | 14.8% |
| $100,000 to $149,999 | 343 | 12.3% |
| $150,000 to $199,999 | 137 | 4.9% |
| $200,000+ | 39 | 1.4% |
Family Income by Famaliy Size in Early County
6-person families (40 | 1.4%) account for the highest median family income in Early County with $109,432 per family, while 2-person families (1,429 | 51.2%) have the highest median income of $27,006 per family member.
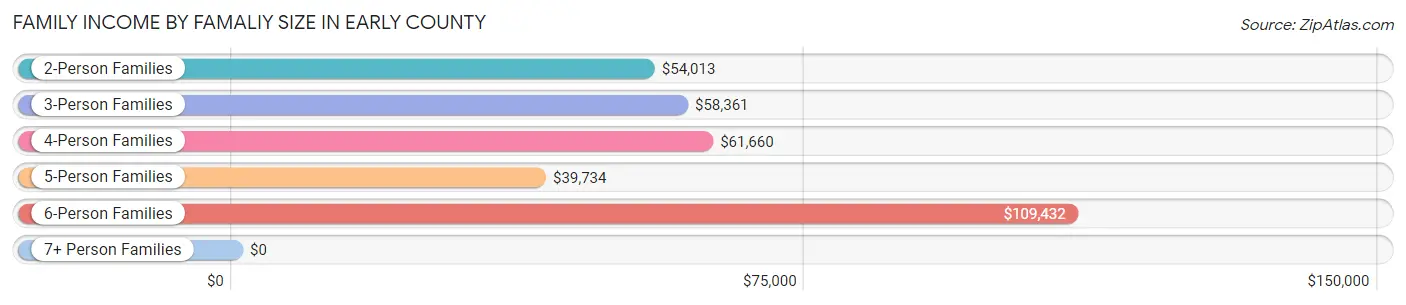
| Income Bracket | # Families | Median Income |
| 2-Person Families | 1,429 (51.2%) | $54,013 |
| 3-Person Families | 528 (18.9%) | $58,361 |
| 4-Person Families | 431 (15.4%) | $61,660 |
| 5-Person Families | 306 (11.0%) | $39,734 |
| 6-Person Families | 40 (1.4%) | $109,432 |
| 7+ Person Families | 57 (2.0%) | $0 |
| Total | 2,791 (100.0%) | $57,030 |
Family Income by Number of Earners in Early County
The median family income in Early County is $57,030, with families comprising 3+ earners (208) having the highest median family income of $86,859, while families with no earners (570) have the lowest median family income of $36,429, accounting for 7.4% and 20.4% of families, respectively.
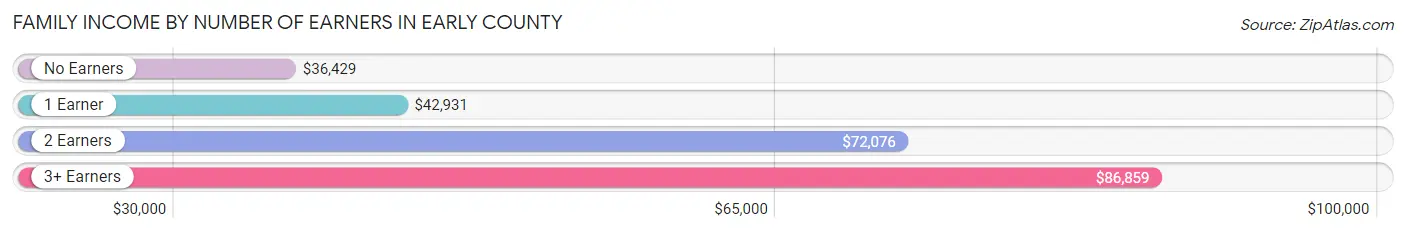
| Number of Earners | # Families | Median Income |
| No Earners | 570 (20.4%) | $36,429 |
| 1 Earner | 966 (34.6%) | $42,931 |
| 2 Earners | 1,047 (37.5%) | $72,076 |
| 3+ Earners | 208 (7.4%) | $86,859 |
| Total | 2,791 (100.0%) | $57,030 |
Household Income in Early County
Household Income Brackets in Early County
With 743 households falling in the category, the $50,000 to $74,999 income range is the most frequent in Early County, accounting for 18.5% of all households. In contrast, only 68 households (1.7%) fall into the $200,000+ income bracket, making it the least populous group.
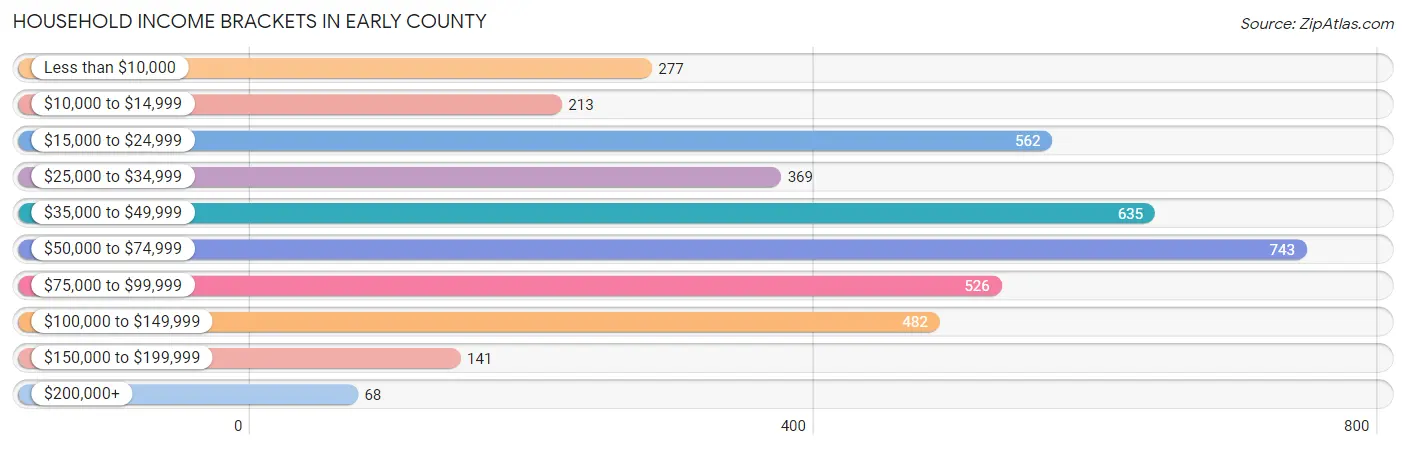
| Income Bracket | # Households | % Households |
| Less than $10,000 | 277 | 6.9% |
| $10,000 to $14,999 | 213 | 5.3% |
| $15,000 to $24,999 | 562 | 14.0% |
| $25,000 to $34,999 | 369 | 9.2% |
| $35,000 to $49,999 | 635 | 15.8% |
| $50,000 to $74,999 | 743 | 18.5% |
| $75,000 to $99,999 | 526 | 13.1% |
| $100,000 to $149,999 | 482 | 12.0% |
| $150,000 to $199,999 | 141 | 3.5% |
| $200,000+ | 68 | 1.7% |
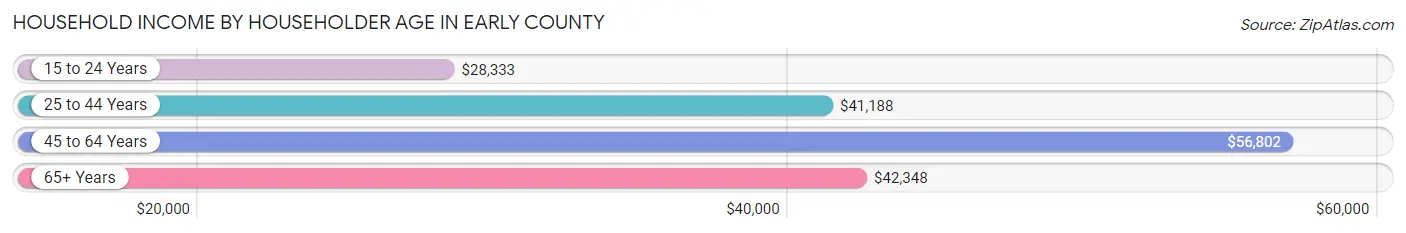
Household Income by Householder Age in Early County
The median household income in Early County is $48,355, with the highest median household income of $56,802 found in the 45 to 64 years age bracket for the primary householder. A total of 1,694 households (42.2%) fall into this category. Meanwhile, the 15 to 24 years age bracket for the primary householder has the lowest median household income of $28,333, with 170 households (4.2%) in this group.
| Income Bracket | # Households | Median Income |
| 15 to 24 Years | 170 (4.2%) | $28,333 |
| 25 to 44 Years | 826 (20.6%) | $41,188 |
| 45 to 64 Years | 1,694 (42.2%) | $56,802 |
| 65+ Years | 1,326 (33.0%) | $42,348 |
| Total | 4,016 (100.0%) | $48,355 |
Poverty in Early County
Income Below Poverty by Sex and Age in Early County
With 17.3% poverty level for males and 26.7% for females among the residents of Early County, under 5 year old males and 5 year old females are the most vulnerable to poverty, with 139 males (44.3%) and 77 females (78.6%) in their respective age groups living below the poverty level.
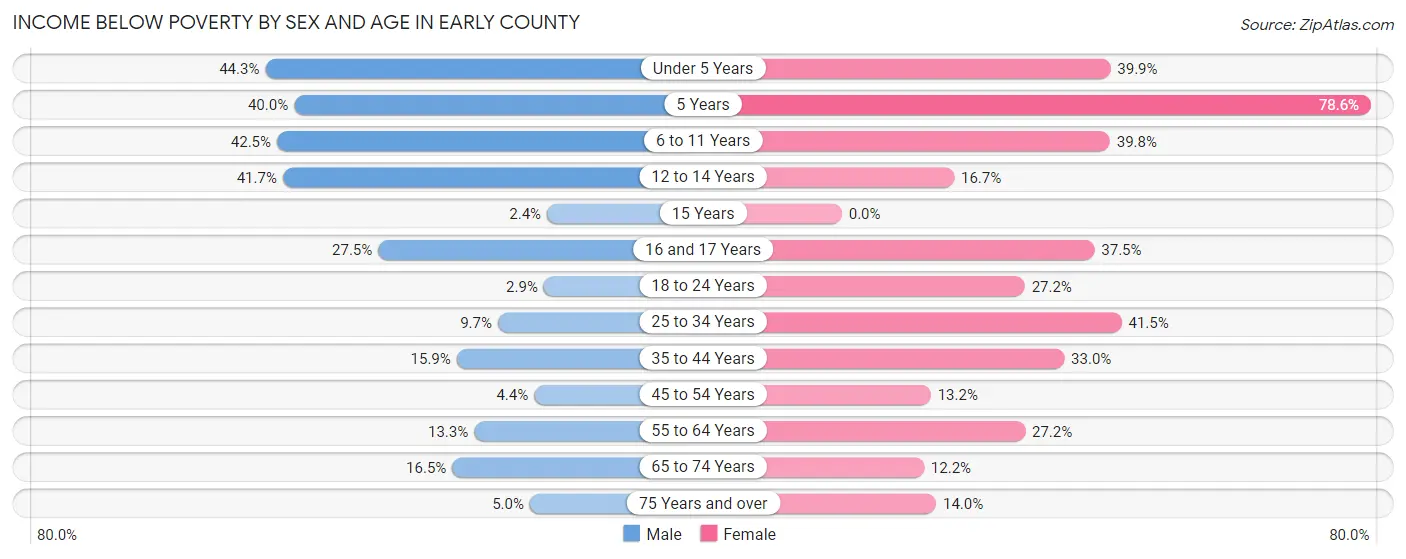
| Age Bracket | Male | Female |
| Under 5 Years | 139 (44.3%) | 134 (39.9%) |
| 5 Years | 16 (40.0%) | 77 (78.6%) |
| 6 to 11 Years | 154 (42.5%) | 158 (39.8%) |
| 12 to 14 Years | 145 (41.7%) | 37 (16.7%) |
| 15 Years | 2 (2.4%) | 0 (0.0%) |
| 16 and 17 Years | 52 (27.5%) | 54 (37.5%) |
| 18 to 24 Years | 20 (2.9%) | 157 (27.2%) |
| 25 to 34 Years | 32 (9.7%) | 211 (41.5%) |
| 35 to 44 Years | 84 (15.9%) | 214 (33.0%) |
| 45 to 54 Years | 27 (4.3%) | 91 (13.2%) |
| 55 to 64 Years | 89 (13.3%) | 209 (27.2%) |
| 65 to 74 Years | 90 (16.5%) | 73 (12.2%) |
| 75 Years and over | 14 (5.0%) | 77 (14.0%) |
| Total | 864 (17.3%) | 1,492 (26.7%) |
Income Above Poverty by Sex and Age in Early County
According to the poverty statistics in Early County, males aged 15 years and females aged 15 years are the age groups that are most secure financially, with 97.6% of males and 100.0% of females in these age groups living above the poverty line.
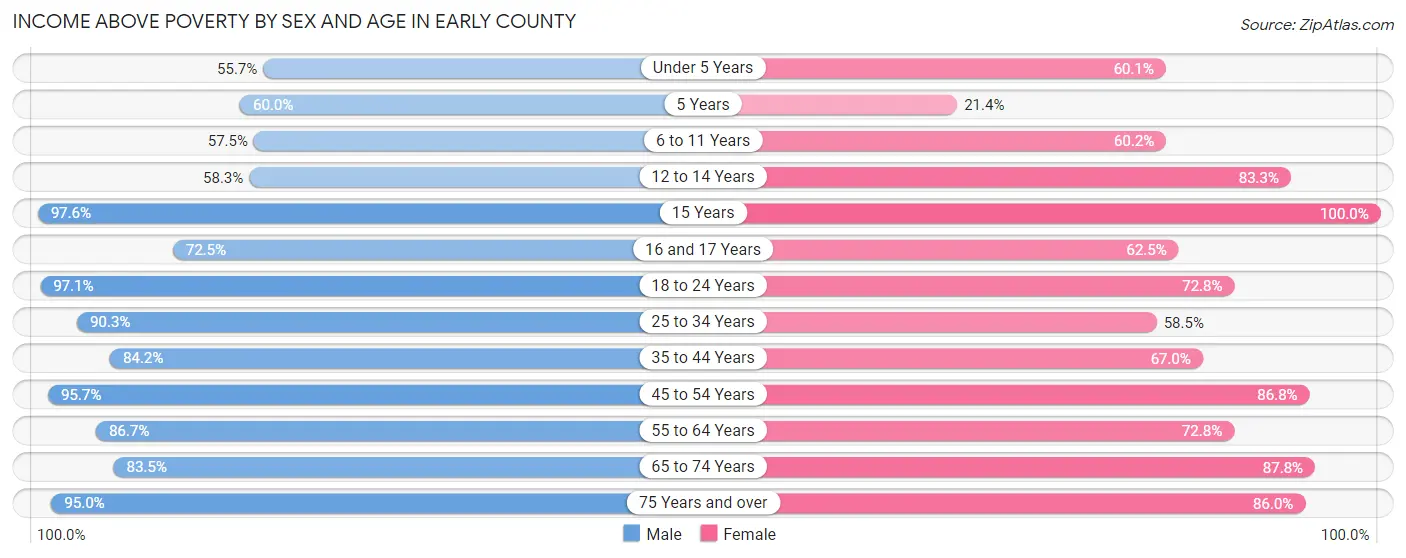
| Age Bracket | Male | Female |
| Under 5 Years | 175 (55.7%) | 202 (60.1%) |
| 5 Years | 24 (60.0%) | 21 (21.4%) |
| 6 to 11 Years | 208 (57.5%) | 239 (60.2%) |
| 12 to 14 Years | 203 (58.3%) | 185 (83.3%) |
| 15 Years | 80 (97.6%) | 55 (100.0%) |
| 16 and 17 Years | 137 (72.5%) | 90 (62.5%) |
| 18 to 24 Years | 667 (97.1%) | 421 (72.8%) |
| 25 to 34 Years | 297 (90.3%) | 297 (58.5%) |
| 35 to 44 Years | 446 (84.2%) | 434 (67.0%) |
| 45 to 54 Years | 594 (95.7%) | 598 (86.8%) |
| 55 to 64 Years | 582 (86.7%) | 559 (72.8%) |
| 65 to 74 Years | 455 (83.5%) | 526 (87.8%) |
| 75 Years and over | 267 (95.0%) | 473 (86.0%) |
| Total | 4,135 (82.7%) | 4,100 (73.3%) |
Income Below Poverty Among Married-Couple Families in Early County
The poverty statistics for married-couple families in Early County show that 5.4% or 89 of the total 1,661 families live below the poverty line. Families with 3 or 4 children have the highest poverty rate of 6.5%, comprising of 8 families. On the other hand, families with no children have the lowest poverty rate of 4.6%, which includes 47 families.
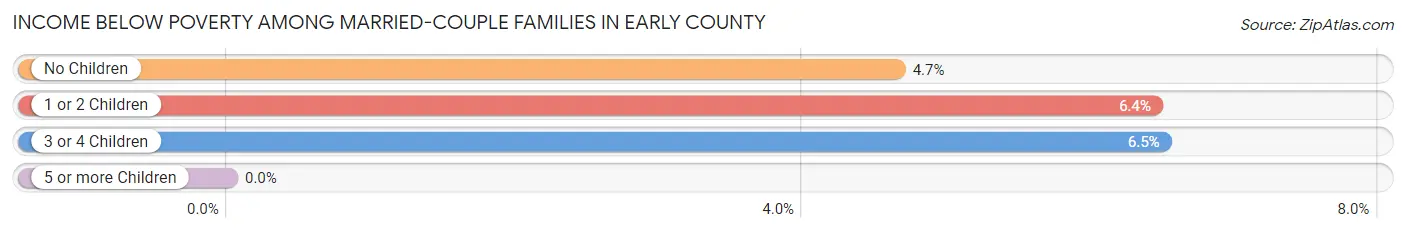
| Children | Above Poverty | Below Poverty |
| No Children | 963 (95.4%) | 47 (4.6%) |
| 1 or 2 Children | 494 (93.6%) | 34 (6.4%) |
| 3 or 4 Children | 115 (93.5%) | 8 (6.5%) |
| 5 or more Children | 0 (0.0%) | 0 (0.0%) |
| Total | 1,572 (94.6%) | 89 (5.4%) |
Income Below Poverty Among Single-Parent Households in Early County
According to the poverty data in Early County, 12.7% or 28 single-father households and 39.5% or 359 single-mother households are living below the poverty line. Among single-father households, those with 3 or 4 children have the highest poverty rate, with 5 households (31.2%) experiencing poverty. Likewise, among single-mother households, those with 5 or more children have the highest poverty rate, with 25 households (100.0%) falling below the poverty line.
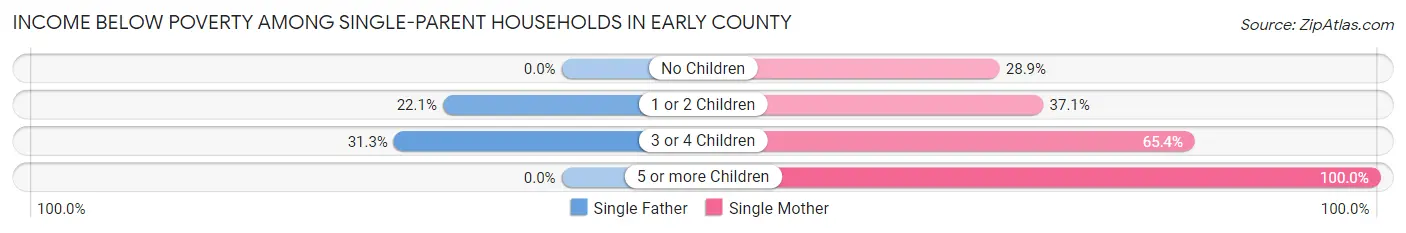
| Children | Single Father | Single Mother |
| No Children | 0 (0.0%) | 137 (28.9%) |
| 1 or 2 Children | 23 (22.1%) | 93 (37.0%) |
| 3 or 4 Children | 5 (31.2%) | 104 (65.4%) |
| 5 or more Children | 0 (0.0%) | 25 (100.0%) |
| Total | 28 (12.7%) | 359 (39.5%) |
Income Below Poverty Among Married-Couple vs Single-Parent Households in Early County
The poverty data for Early County shows that 89 of the married-couple family households (5.4%) and 387 of the single-parent households (34.3%) are living below the poverty level. Within the married-couple family households, those with 3 or 4 children have the highest poverty rate, with 8 households (6.5%) falling below the poverty line. Among the single-parent households, those with 5 or more children have the highest poverty rate, with 25 household (100.0%) living below poverty.
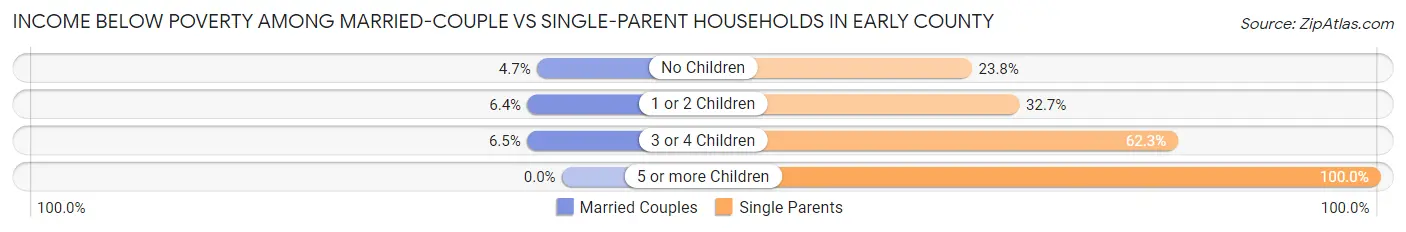
| Children | Married-Couple Families | Single-Parent Households |
| No Children | 47 (4.6%) | 137 (23.8%) |
| 1 or 2 Children | 34 (6.4%) | 116 (32.7%) |
| 3 or 4 Children | 8 (6.5%) | 109 (62.3%) |
| 5 or more Children | 0 (0.0%) | 25 (100.0%) |
| Total | 89 (5.4%) | 387 (34.3%) |
Race in Early County
The most populous races in Early County are Black / African American (5,685 | 52.9%), White / Caucasian (4,718 | 43.9%), and Two or more Races (245 | 2.3%).
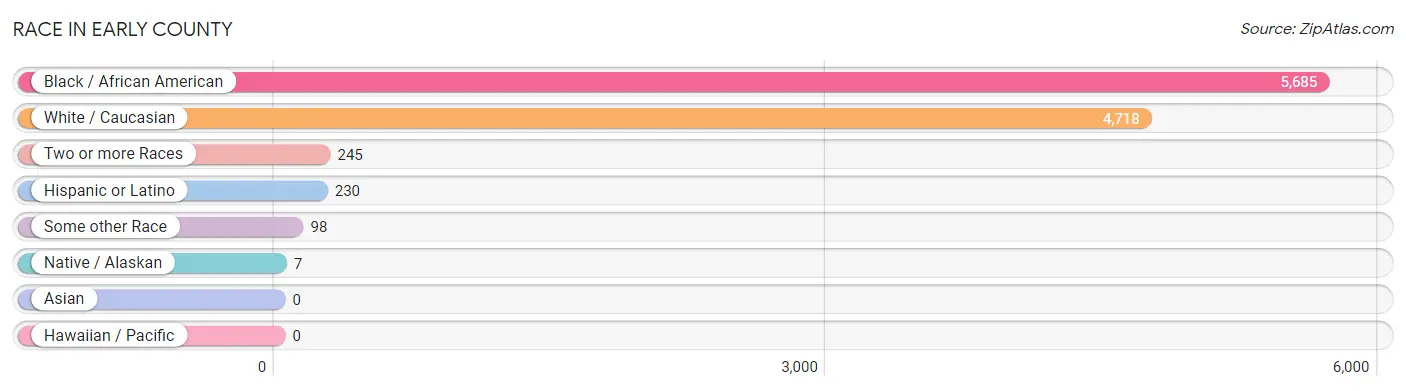
| Race | # Population | % Population |
| Asian | 0 | 0.0% |
| Black / African American | 5,685 | 52.9% |
| Hawaiian / Pacific | 0 | 0.0% |
| Hispanic or Latino | 230 | 2.1% |
| Native / Alaskan | 7 | 0.1% |
| White / Caucasian | 4,718 | 43.9% |
| Two or more Races | 245 | 2.3% |
| Some other Race | 98 | 0.9% |
| Total | 10,753 | 100.0% |
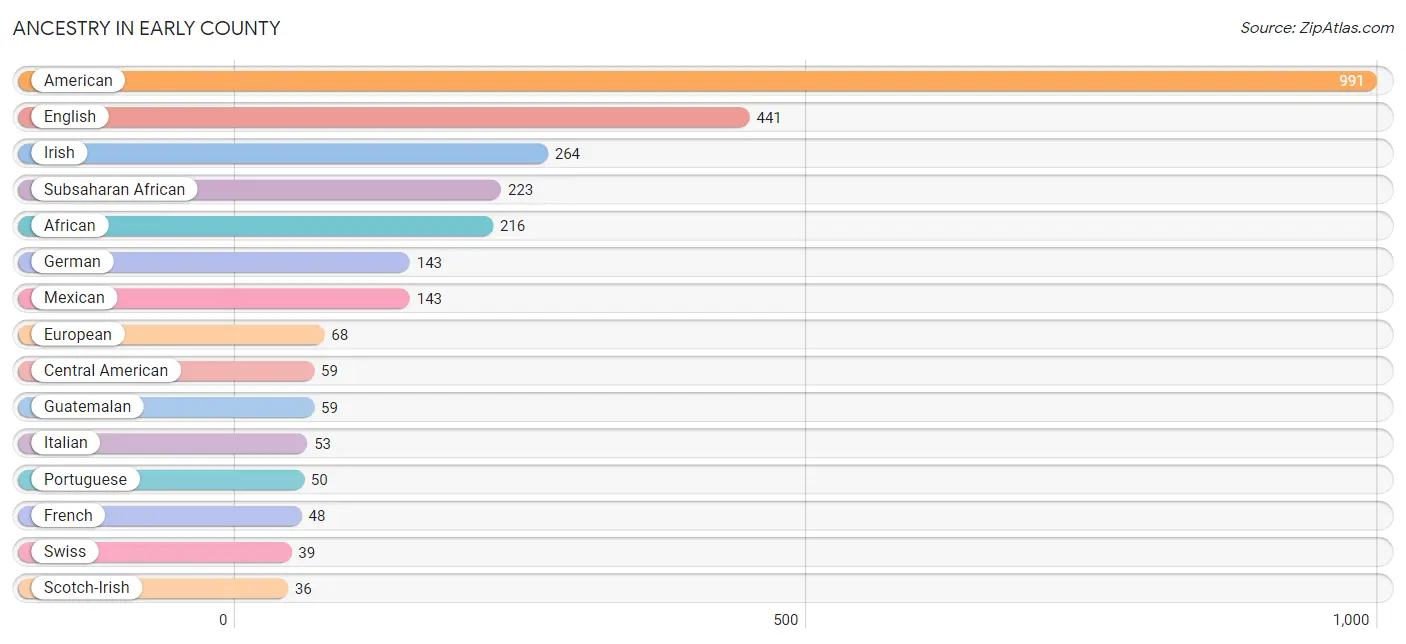
Ancestry in Early County
The most populous ancestries reported in Early County are American (991 | 9.2%), English (441 | 4.1%), Irish (264 | 2.5%), Subsaharan African (223 | 2.1%), and African (216 | 2.0%), together accounting for 19.9% of all Early County residents.
| Ancestry | # Population | % Population |
| African | 216 | 2.0% |
| American | 991 | 9.2% |
| Blackfeet | 6 | 0.1% |
| British West Indian | 19 | 0.2% |
| Central American | 59 | 0.5% |
| Cherokee | 7 | 0.1% |
| Czech | 14 | 0.1% |
| Dutch | 17 | 0.2% |
| Eastern European | 21 | 0.2% |
| English | 441 | 4.1% |
| European | 68 | 0.6% |
| French | 48 | 0.4% |
| French Canadian | 6 | 0.1% |
| German | 143 | 1.3% |
| Guatemalan | 59 | 0.5% |
| Irish | 264 | 2.5% |
| Italian | 53 | 0.5% |
| Lithuanian | 3 | 0.0% |
| Mexican | 143 | 1.3% |
| Nigerian | 7 | 0.1% |
| Portuguese | 50 | 0.5% |
| Scotch-Irish | 36 | 0.3% |
| Scottish | 10 | 0.1% |
| Seminole | 6 | 0.1% |
| Subsaharan African | 223 | 2.1% |
| Swiss | 39 | 0.4% |
| Thai | 3 | 0.0% | View All 27 Rows |
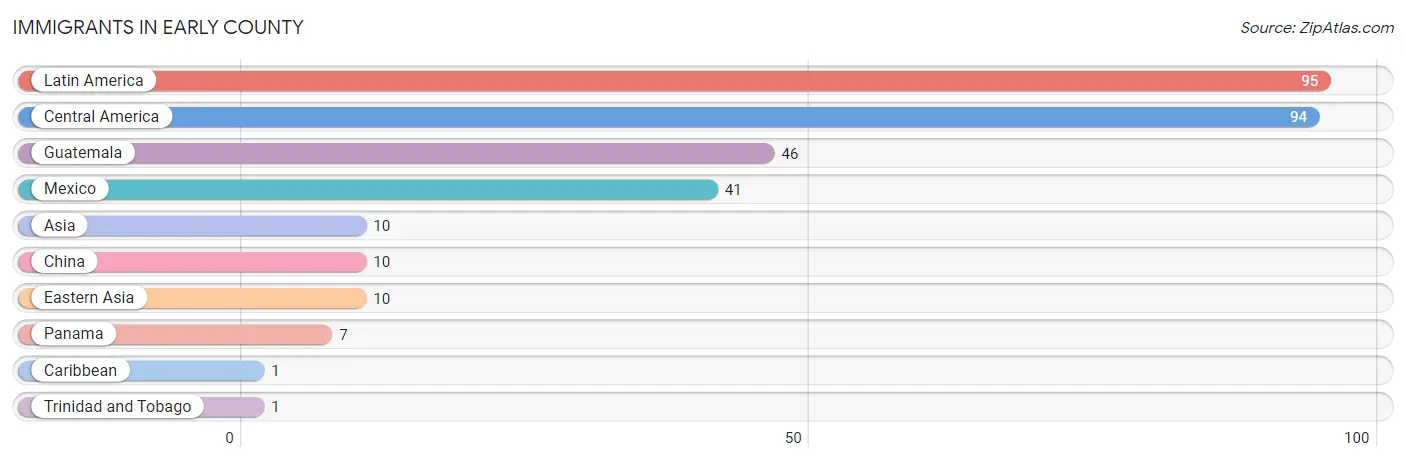
Immigrants in Early County
The most numerous immigrant groups reported in Early County came from Latin America (95 | 0.9%), Central America (94 | 0.9%), Guatemala (46 | 0.4%), Mexico (41 | 0.4%), and Asia (10 | 0.1%), together accounting for 2.7% of all Early County residents.
| Immigration Origin | # Population | % Population |
| Asia | 10 | 0.1% |
| Caribbean | 1 | 0.0% |
| Central America | 94 | 0.9% |
| China | 10 | 0.1% |
| Eastern Asia | 10 | 0.1% |
| Guatemala | 46 | 0.4% |
| Latin America | 95 | 0.9% |
| Mexico | 41 | 0.4% |
| Panama | 7 | 0.1% |
| Trinidad and Tobago | 1 | 0.0% | View All 10 Rows |
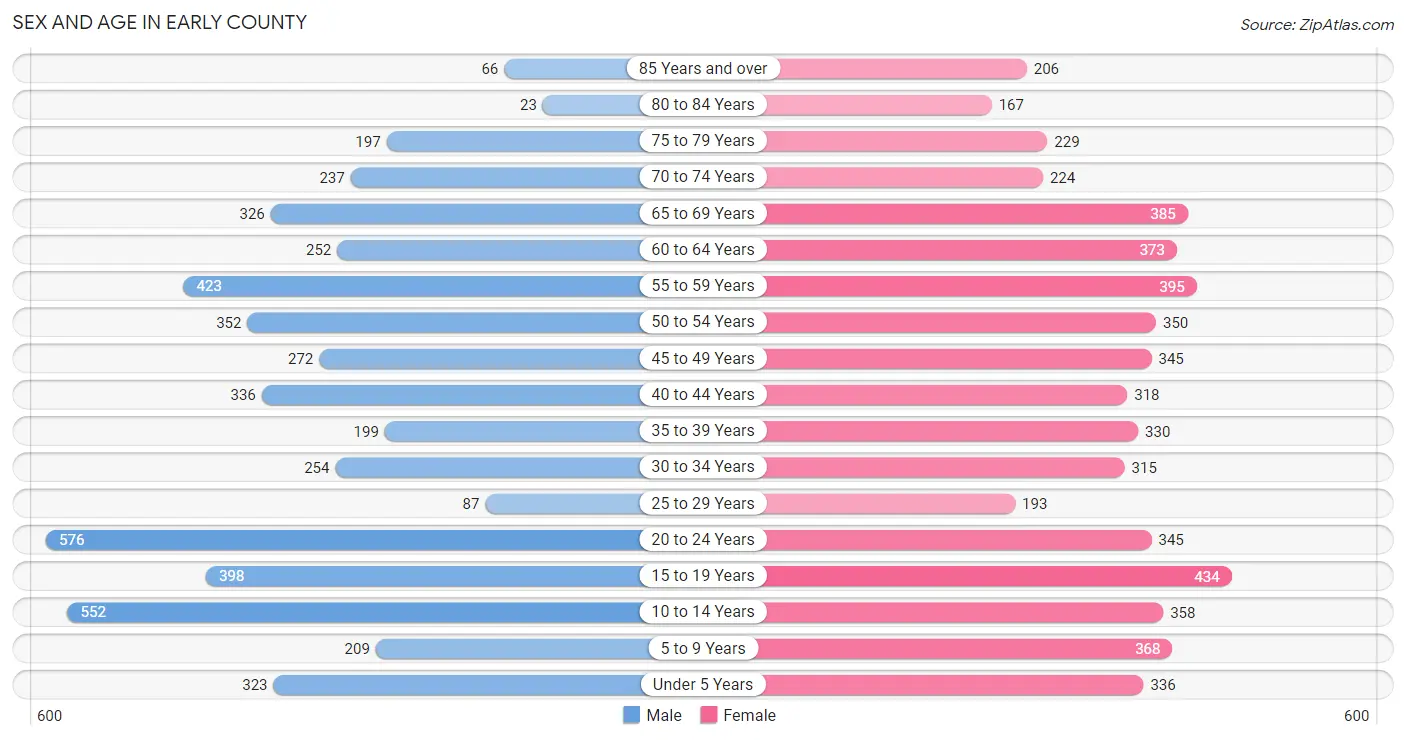
Sex and Age in Early County
Sex and Age in Early County
The most populous age groups in Early County are 20 to 24 Years (576 | 11.3%) for men and 15 to 19 Years (434 | 7.6%) for women.
| Age Bracket | Male | Female |
| Under 5 Years | 323 (6.4%) | 336 (5.9%) |
| 5 to 9 Years | 209 (4.1%) | 368 (6.5%) |
| 10 to 14 Years | 552 (10.9%) | 358 (6.3%) |
| 15 to 19 Years | 398 (7.8%) | 434 (7.6%) |
| 20 to 24 Years | 576 (11.3%) | 345 (6.1%) |
| 25 to 29 Years | 87 (1.7%) | 193 (3.4%) |
| 30 to 34 Years | 254 (5.0%) | 315 (5.6%) |
| 35 to 39 Years | 199 (3.9%) | 330 (5.8%) |
| 40 to 44 Years | 336 (6.6%) | 318 (5.6%) |
| 45 to 49 Years | 272 (5.3%) | 345 (6.1%) |
| 50 to 54 Years | 352 (6.9%) | 350 (6.2%) |
| 55 to 59 Years | 423 (8.3%) | 395 (7.0%) |
| 60 to 64 Years | 252 (5.0%) | 373 (6.6%) |
| 65 to 69 Years | 326 (6.4%) | 385 (6.8%) |
| 70 to 74 Years | 237 (4.7%) | 224 (4.0%) |
| 75 to 79 Years | 197 (3.9%) | 229 (4.0%) |
| 80 to 84 Years | 23 (0.4%) | 167 (2.9%) |
| 85 Years and over | 66 (1.3%) | 206 (3.6%) |
| Total | 5,082 (100.0%) | 5,671 (100.0%) |
Families and Households in Early County
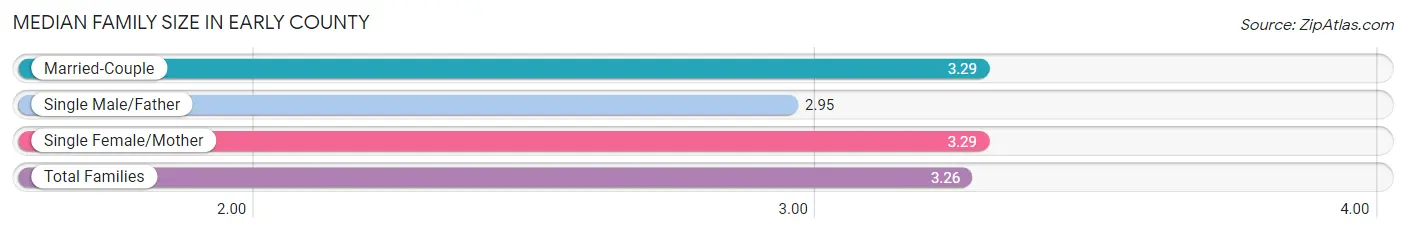
Median Family Size in Early County
The median family size in Early County is 3.26 persons per family, with married-couple families (1,661 | 59.5%) accounting for the largest median family size of 3.29 persons per family. On the other hand, single male/father families (221 | 7.9%) represent the smallest median family size with 2.95 persons per family.
| Family Type | # Families | Family Size |
| Married-Couple | 1,661 (59.5%) | 3.29 |
| Single Male/Father | 221 (7.9%) | 2.95 |
| Single Female/Mother | 909 (32.6%) | 3.29 |
| Total Families | 2,791 (100.0%) | 3.26 |
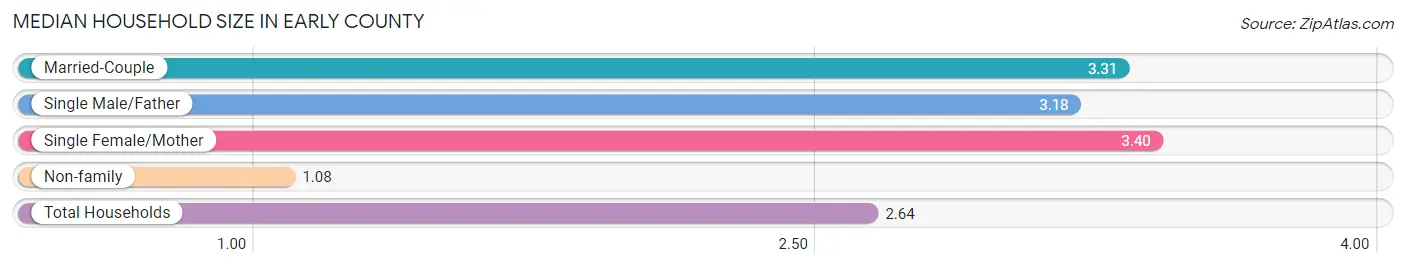
Median Household Size in Early County
The median household size in Early County is 2.64 persons per household, with single female/mother households (909 | 22.6%) accounting for the largest median household size of 3.4 persons per household. non-family households (1,225 | 30.5%) represent the smallest median household size with 1.08 persons per household.
| Household Type | # Households | Household Size |
| Married-Couple | 1,661 (41.4%) | 3.31 |
| Single Male/Father | 221 (5.5%) | 3.18 |
| Single Female/Mother | 909 (22.6%) | 3.40 |
| Non-family | 1,225 (30.5%) | 1.08 |
| Total Households | 4,016 (100.0%) | 2.64 |
Household Size by Marriage Status in Early County
Out of a total of 4,016 households in Early County, 2,791 (69.5%) are family households, while 1,225 (30.5%) are nonfamily households. The most numerous type of family households are 2-person households, comprising 1,367, and the most common type of nonfamily households are 1-person households, comprising 1,171.
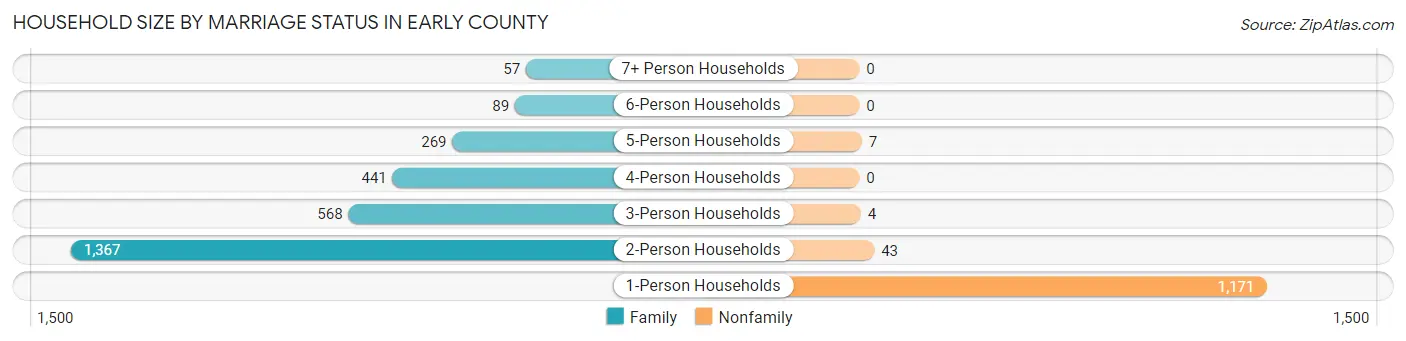
| Household Size | Family Households | Nonfamily Households |
| 1-Person Households | - | 1,171 (29.2%) |
| 2-Person Households | 1,367 (34.0%) | 43 (1.1%) |
| 3-Person Households | 568 (14.1%) | 4 (0.1%) |
| 4-Person Households | 441 (11.0%) | 0 (0.0%) |
| 5-Person Households | 269 (6.7%) | 7 (0.2%) |
| 6-Person Households | 89 (2.2%) | 0 (0.0%) |
| 7+ Person Households | 57 (1.4%) | 0 (0.0%) |
| Total | 2,791 (69.5%) | 1,225 (30.5%) |
Female Fertility in Early County
Fertility by Age in Early County
Average fertility rate in Early County is 34.0 births per 1,000 women. Women in the age bracket of 20 to 34 years have the highest fertility rate with 53.0 births per 1,000 women. Women in the age bracket of 20 to 34 years acount for 57.0% of all women with births.
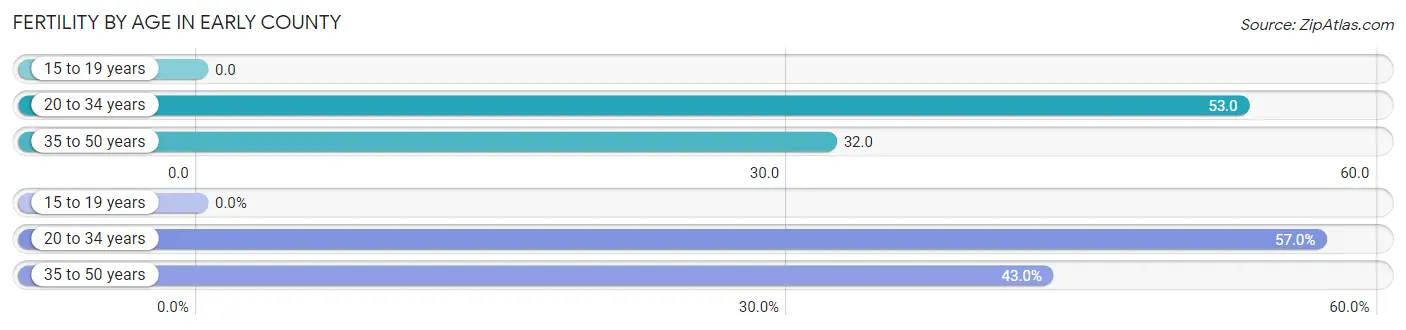
| Age Bracket | Women with Births | Births / 1,000 Women |
| 15 to 19 years | 0 (0.0%) | 0.0 |
| 20 to 34 years | 45 (57.0%) | 53.0 |
| 35 to 50 years | 34 (43.0%) | 32.0 |
| Total | 79 (100.0%) | 34.0 |
Fertility by Age by Marriage Status in Early County
32.9% of women with births (79) in Early County are married. The highest percentage of unmarried women with births falls into 35 to 50 years age bracket with 100.0% of them unmarried at the time of birth, while the lowest percentage of unmarried women with births belong to 20 to 34 years age bracket with 42.2% of them unmarried.
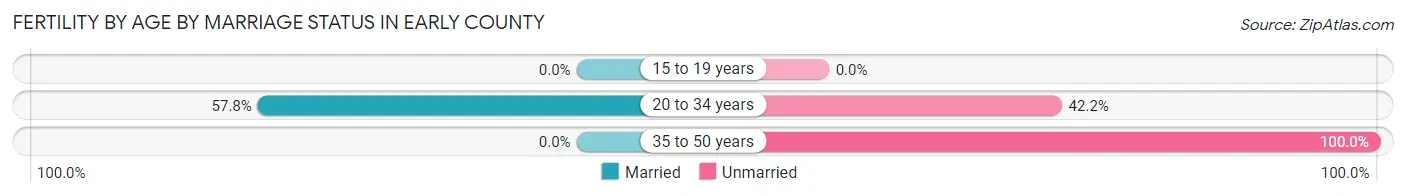
| Age Bracket | Married | Unmarried |
| 15 to 19 years | 0 (0.0%) | 0 (0.0%) |
| 20 to 34 years | 26 (57.8%) | 19 (42.2%) |
| 35 to 50 years | 0 (0.0%) | 34 (100.0%) |
| Total | 26 (32.9%) | 53 (67.1%) |
Fertility by Education in Early County
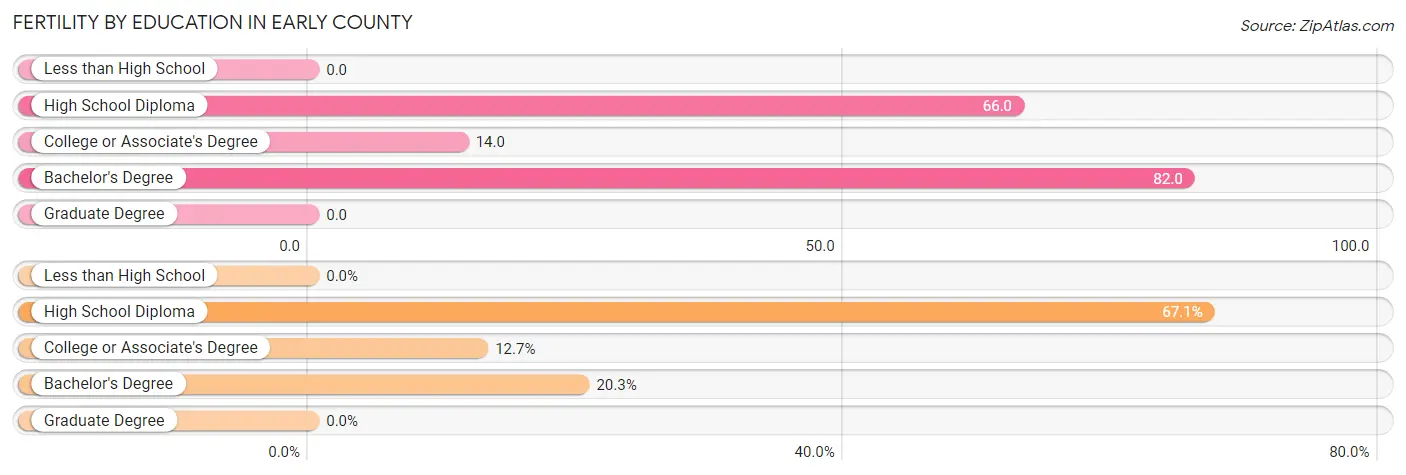
| Educational Attainment | Women with Births | Births / 1,000 Women |
| Less than High School | 0 (0.0%) | 0.0 |
| High School Diploma | 53 (67.1%) | 66.0 |
| College or Associate's Degree | 10 (12.7%) | 14.0 |
| Bachelor's Degree | 16 (20.3%) | 82.0 |
| Graduate Degree | 0 (0.0%) | 0.0 |
| Total | 79 (100.0%) | 34.0 |
Fertility by Education by Marriage Status in Early County
67.1% of women with births in Early County are unmarried. Women with the educational attainment of college or associate's degree are most likely to be married with 100.0% of them married at childbirth, while women with the educational attainment of high school diploma are least likely to be married with 100.0% of them unmarried at childbirth.
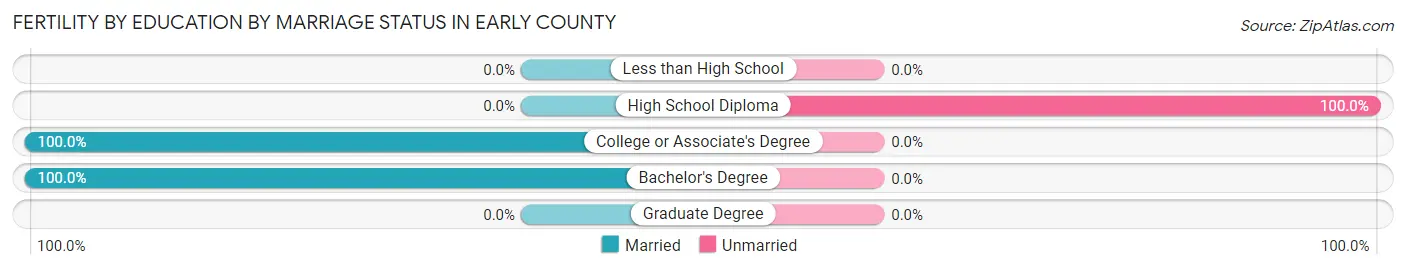
| Educational Attainment | Married | Unmarried |
| Less than High School | 0 (0.0%) | 0 (0.0%) |
| High School Diploma | 0 (0.0%) | 53 (100.0%) |
| College or Associate's Degree | 10 (100.0%) | 0 (0.0%) |
| Bachelor's Degree | 16 (100.0%) | 0 (0.0%) |
| Graduate Degree | 0 (0.0%) | 0 (0.0%) |
| Total | 26 (32.9%) | 53 (67.1%) |
Employment Characteristics in Early County
Employment by Class of Employer in Early County
Among the 4,220 employed individuals in Early County, private company employees (2,791 | 66.1%), local government employees (470 | 11.1%), and state government employees (360 | 8.5%) make up the most common classes of employment.
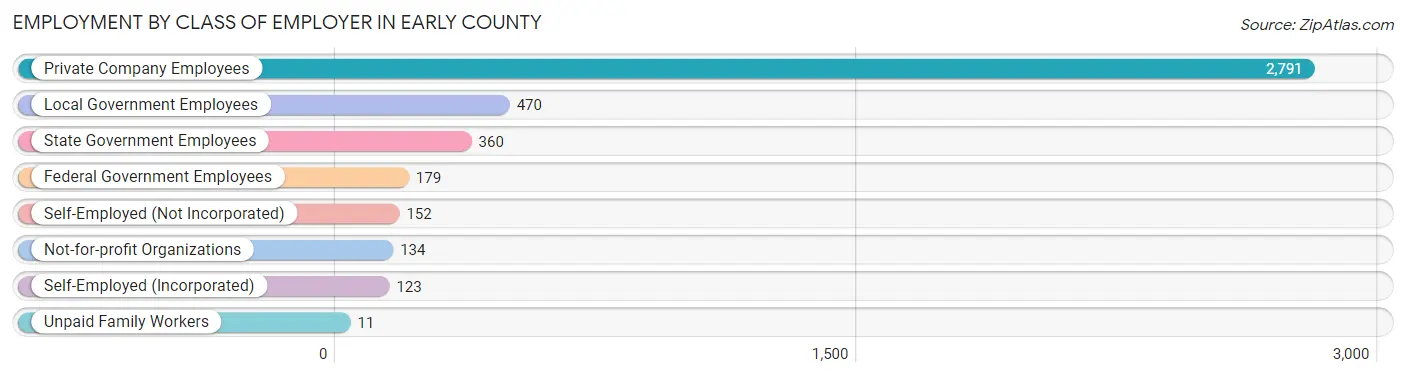
| Employer Class | # Employees | % Employees |
| Private Company Employees | 2,791 | 66.1% |
| Self-Employed (Incorporated) | 123 | 2.9% |
| Self-Employed (Not Incorporated) | 152 | 3.6% |
| Not-for-profit Organizations | 134 | 3.2% |
| Local Government Employees | 470 | 11.1% |
| State Government Employees | 360 | 8.5% |
| Federal Government Employees | 179 | 4.2% |
| Unpaid Family Workers | 11 | 0.3% |
| Total | 4,220 | 100.0% |
Employment Status by Age in Early County
According to the labor force statistics for Early County, out of the total population over 16 years of age (8,470), 53.8% or 4,557 individuals are in the labor force, with 6.0% or 273 of them unemployed. The age group with the highest labor force participation rate is 25 to 29 years, with 84.6% or 237 individuals in the labor force. Within the labor force, the 25 to 29 years age range has the highest percentage of unemployed individuals, with 30.4% or 72 of them being unemployed.
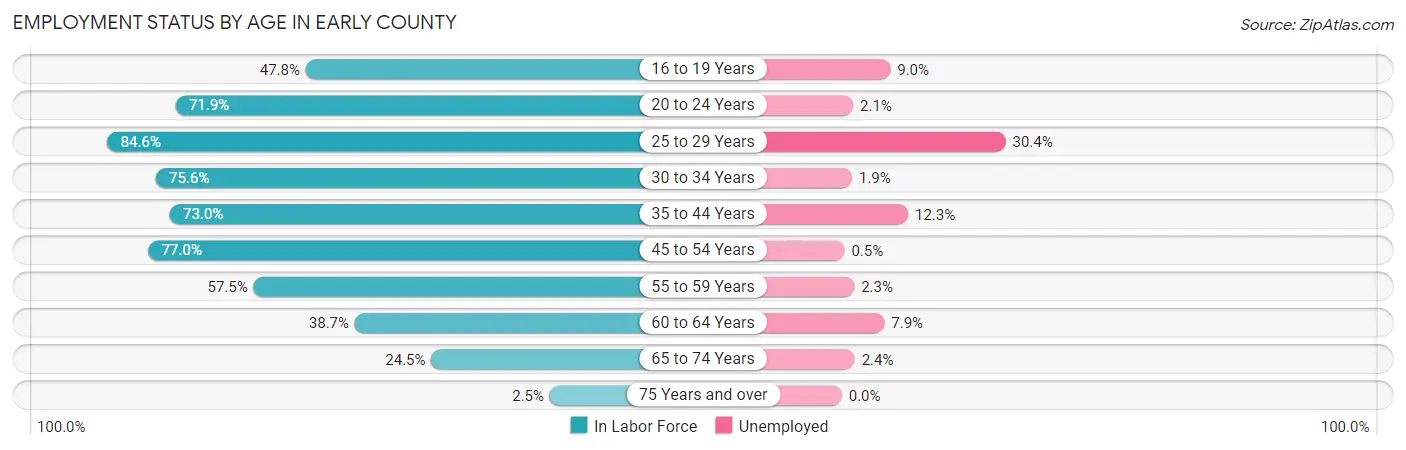
| Age Bracket | In Labor Force | Unemployed |
| 16 to 19 Years | 332 (47.8%) | 30 (9.0%) |
| 20 to 24 Years | 662 (71.9%) | 14 (2.1%) |
| 25 to 29 Years | 237 (84.6%) | 72 (30.4%) |
| 30 to 34 Years | 430 (75.6%) | 8 (1.9%) |
| 35 to 44 Years | 864 (73.0%) | 106 (12.3%) |
| 45 to 54 Years | 1,016 (77.0%) | 5 (0.5%) |
| 55 to 59 Years | 470 (57.5%) | 11 (2.3%) |
| 60 to 64 Years | 242 (38.7%) | 19 (7.9%) |
| 65 to 74 Years | 287 (24.5%) | 7 (2.4%) |
| 75 Years and over | 22 (2.5%) | 0 (0.0%) |
| Total | 4,557 (53.8%) | 273 (6.0%) |
Employment Status by Educational Attainment in Early County
According to labor force statistics for Early County, 67.9% of individuals (3,255) out of the total population between 25 and 64 years of age (4,794) are in the labor force, with 6.8% or 221 of them being unemployed. The group with the highest labor force participation rate are those with the educational attainment of college / associate degree, with 82.4% or 1,165 individuals in the labor force. Within the labor force, individuals with less than high school education have the highest percentage of unemployment, with 16.4% or 63 of them being unemployed.
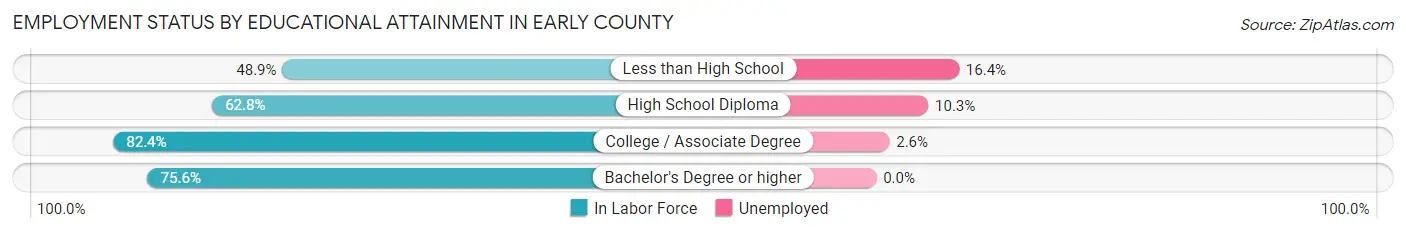
| Educational Attainment | In Labor Force | Unemployed |
| Less than High School | 384 (48.9%) | 129 (16.4%) |
| High School Diploma | 1,241 (62.8%) | 204 (10.3%) |
| College / Associate Degree | 1,165 (82.4%) | 37 (2.6%) |
| Bachelor's Degree or higher | 467 (75.6%) | 0 (0.0%) |
| Total | 3,255 (67.9%) | 326 (6.8%) |
Employment Occupations by Sex in Early County
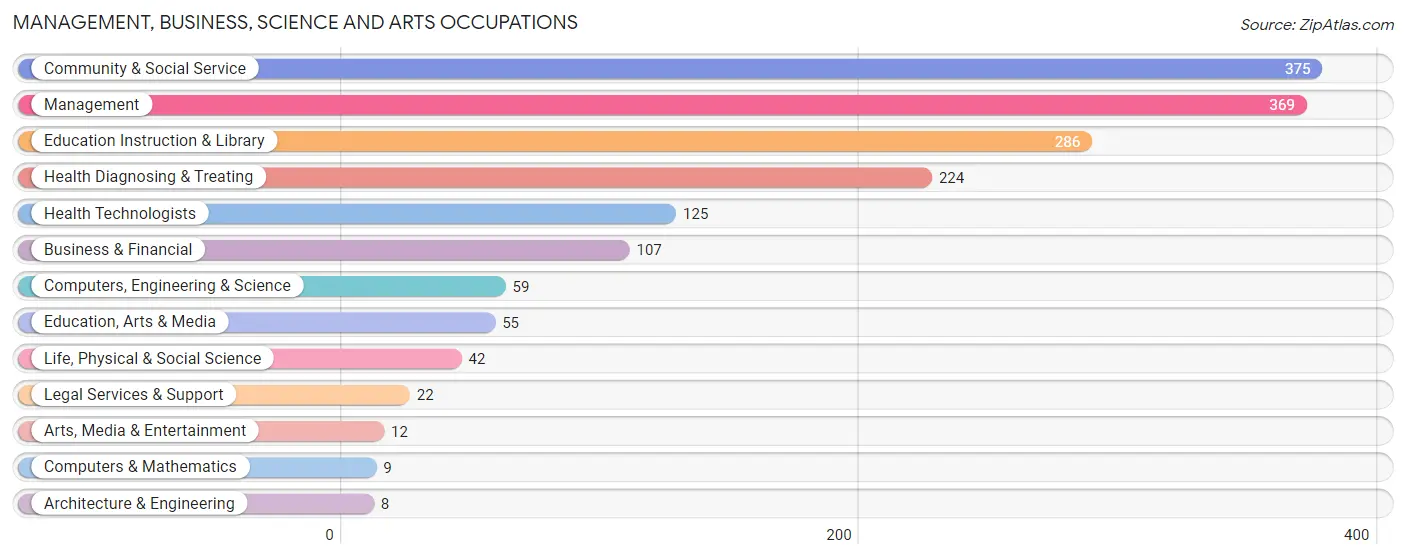
Management, Business, Science and Arts Occupations
The most common Management, Business, Science and Arts occupations in Early County are Community & Social Service (375 | 8.8%), Management (369 | 8.7%), Education Instruction & Library (286 | 6.7%), Health Diagnosing & Treating (224 | 5.3%), and Health Technologists (125 | 2.9%).
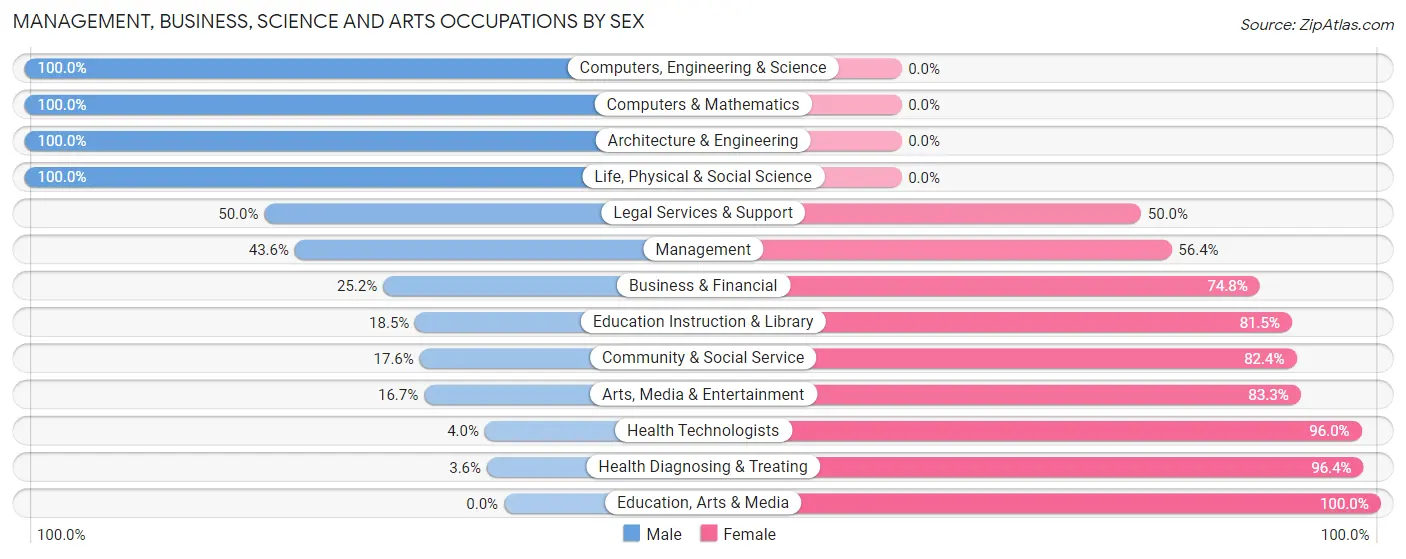
Management, Business, Science and Arts Occupations by Sex
Within the Management, Business, Science and Arts occupations in Early County, the most male-oriented occupations are Computers, Engineering & Science (100.0%), Computers & Mathematics (100.0%), and Architecture & Engineering (100.0%), while the most female-oriented occupations are Education, Arts & Media (100.0%), Health Diagnosing & Treating (96.4%), and Health Technologists (96.0%).
| Occupation | Male | Female |
| Management | 161 (43.6%) | 208 (56.4%) |
| Business & Financial | 27 (25.2%) | 80 (74.8%) |
| Computers, Engineering & Science | 59 (100.0%) | 0 (0.0%) |
| Computers & Mathematics | 9 (100.0%) | 0 (0.0%) |
| Architecture & Engineering | 8 (100.0%) | 0 (0.0%) |
| Life, Physical & Social Science | 42 (100.0%) | 0 (0.0%) |
| Community & Social Service | 66 (17.6%) | 309 (82.4%) |
| Education, Arts & Media | 0 (0.0%) | 55 (100.0%) |
| Legal Services & Support | 11 (50.0%) | 11 (50.0%) |
| Education Instruction & Library | 53 (18.5%) | 233 (81.5%) |
| Arts, Media & Entertainment | 2 (16.7%) | 10 (83.3%) |
| Health Diagnosing & Treating | 8 (3.6%) | 216 (96.4%) |
| Health Technologists | 5 (4.0%) | 120 (96.0%) |
| Total (Category) | 321 (28.3%) | 813 (71.7%) |
| Total (Overall) | 2,019 (47.4%) | 2,239 (52.6%) |
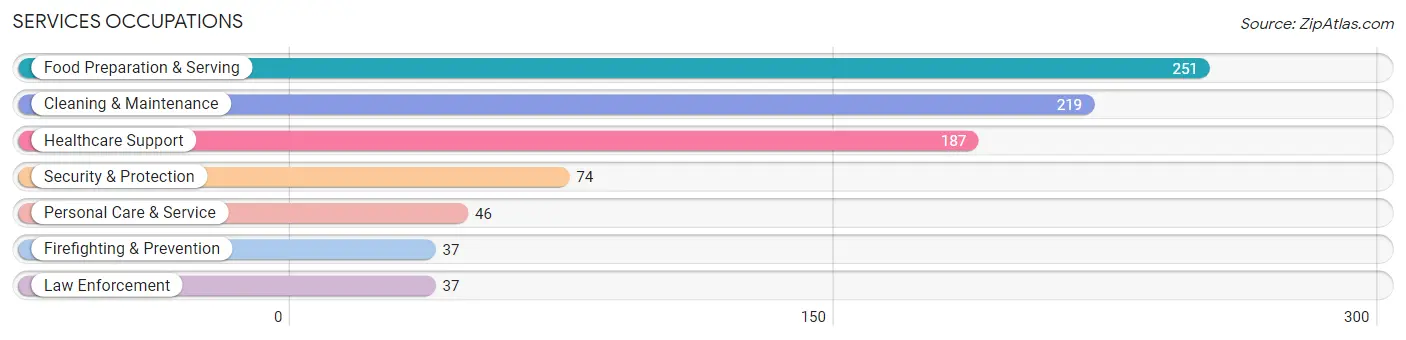
Services Occupations
The most common Services occupations in Early County are Food Preparation & Serving (251 | 5.9%), Cleaning & Maintenance (219 | 5.1%), Healthcare Support (187 | 4.4%), Security & Protection (74 | 1.7%), and Personal Care & Service (46 | 1.1%).
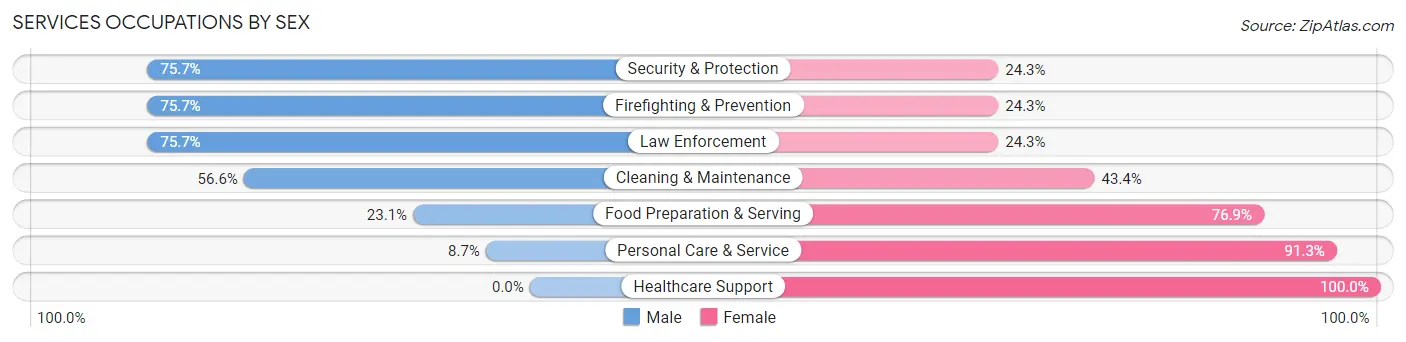
Services Occupations by Sex
Within the Services occupations in Early County, the most male-oriented occupations are Security & Protection (75.7%), Firefighting & Prevention (75.7%), and Law Enforcement (75.7%), while the most female-oriented occupations are Healthcare Support (100.0%), Personal Care & Service (91.3%), and Food Preparation & Serving (76.9%).
| Occupation | Male | Female |
| Healthcare Support | 0 (0.0%) | 187 (100.0%) |
| Security & Protection | 56 (75.7%) | 18 (24.3%) |
| Firefighting & Prevention | 28 (75.7%) | 9 (24.3%) |
| Law Enforcement | 28 (75.7%) | 9 (24.3%) |
| Food Preparation & Serving | 58 (23.1%) | 193 (76.9%) |
| Cleaning & Maintenance | 124 (56.6%) | 95 (43.4%) |
| Personal Care & Service | 4 (8.7%) | 42 (91.3%) |
| Total (Category) | 242 (31.1%) | 535 (68.9%) |
| Total (Overall) | 2,019 (47.4%) | 2,239 (52.6%) |
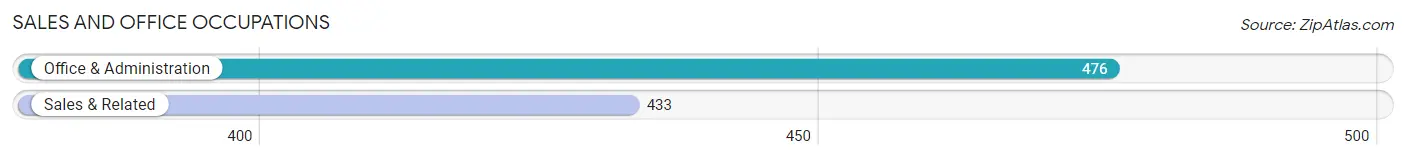
Sales and Office Occupations
The most common Sales and Office occupations in Early County are Office & Administration (476 | 11.2%), and Sales & Related (433 | 10.2%).
Sales and Office Occupations by Sex
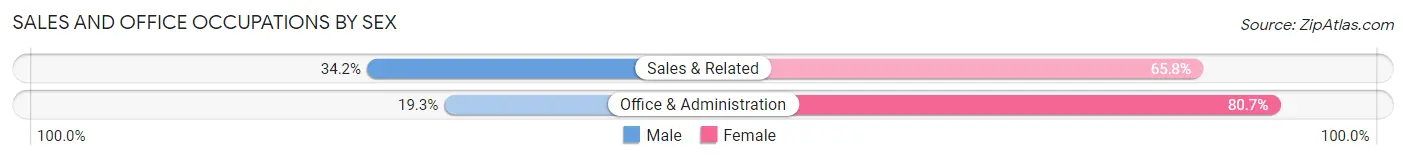
| Occupation | Male | Female |
| Sales & Related | 148 (34.2%) | 285 (65.8%) |
| Office & Administration | 92 (19.3%) | 384 (80.7%) |
| Total (Category) | 240 (26.4%) | 669 (73.6%) |
| Total (Overall) | 2,019 (47.4%) | 2,239 (52.6%) |
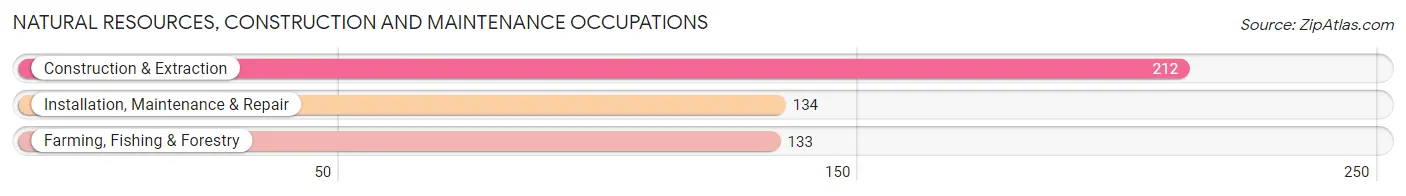
Natural Resources, Construction and Maintenance Occupations
The most common Natural Resources, Construction and Maintenance occupations in Early County are Construction & Extraction (212 | 5.0%), Installation, Maintenance & Repair (134 | 3.2%), and Farming, Fishing & Forestry (133 | 3.1%).
Natural Resources, Construction and Maintenance Occupations by Sex
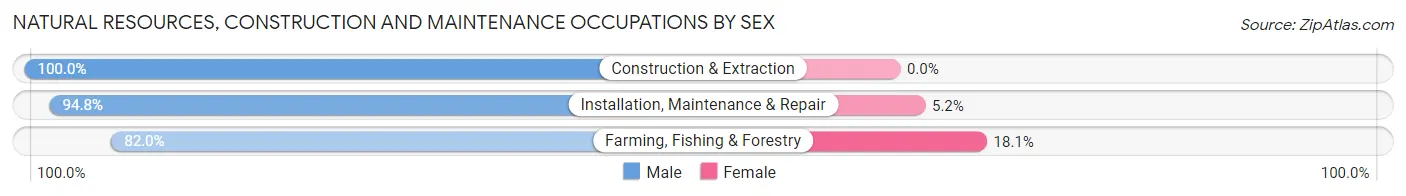
| Occupation | Male | Female |
| Farming, Fishing & Forestry | 109 (82.0%) | 24 (18.0%) |
| Construction & Extraction | 212 (100.0%) | 0 (0.0%) |
| Installation, Maintenance & Repair | 127 (94.8%) | 7 (5.2%) |
| Total (Category) | 448 (93.5%) | 31 (6.5%) |
| Total (Overall) | 2,019 (47.4%) | 2,239 (52.6%) |
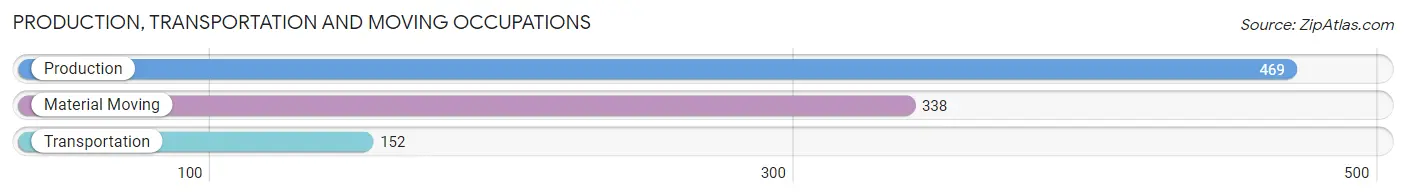
Production, Transportation and Moving Occupations
The most common Production, Transportation and Moving occupations in Early County are Production (469 | 11.0%), Material Moving (338 | 7.9%), and Transportation (152 | 3.6%).
Production, Transportation and Moving Occupations by Sex
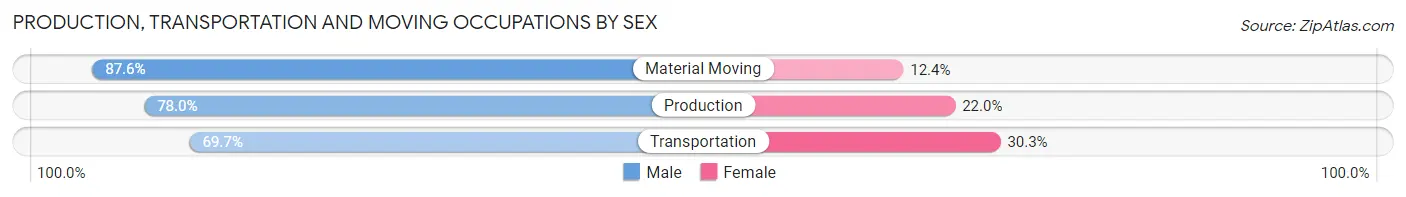
| Occupation | Male | Female |
| Production | 366 (78.0%) | 103 (22.0%) |
| Transportation | 106 (69.7%) | 46 (30.3%) |
| Material Moving | 296 (87.6%) | 42 (12.4%) |
| Total (Category) | 768 (80.1%) | 191 (19.9%) |
| Total (Overall) | 2,019 (47.4%) | 2,239 (52.6%) |
Employment Industries by Sex in Early County
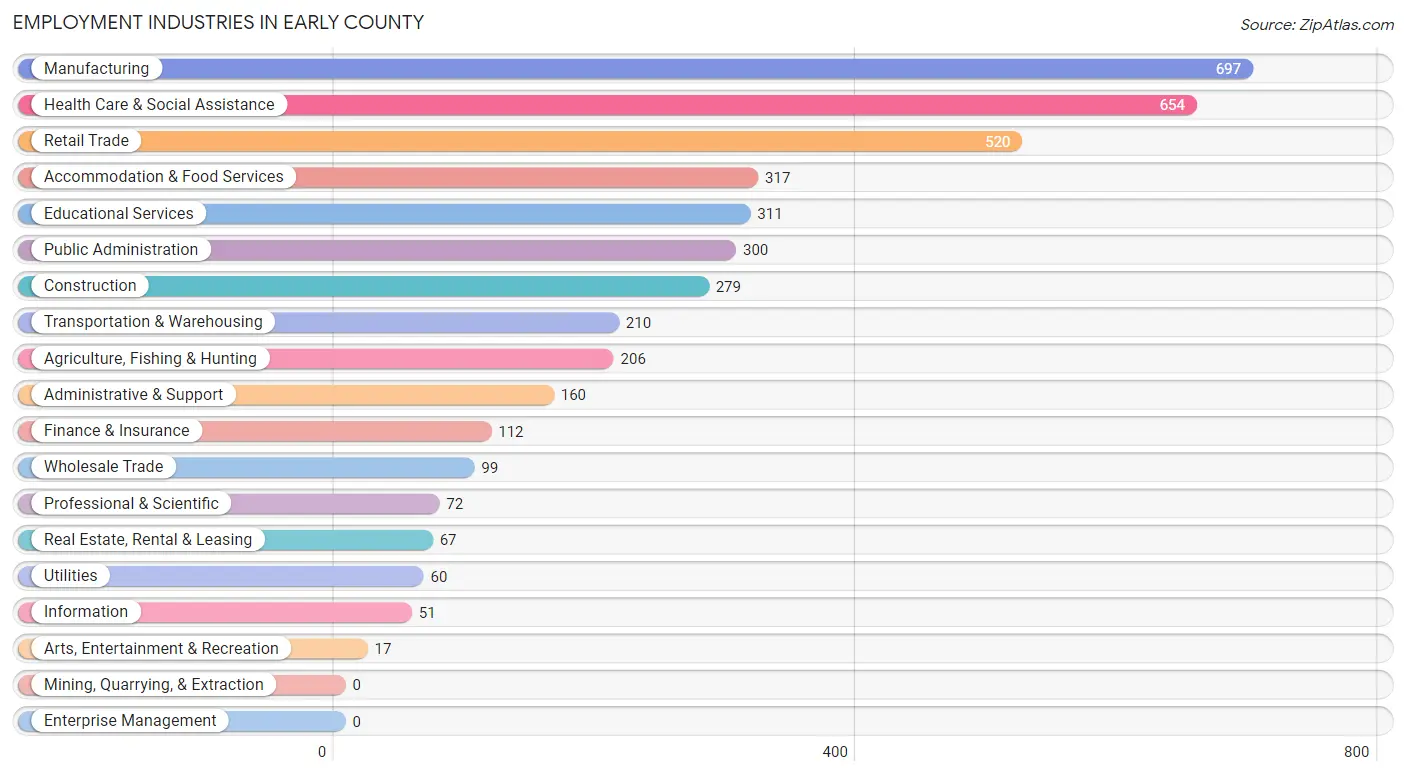
Employment Industries in Early County
The major employment industries in Early County include Manufacturing (697 | 16.4%), Health Care & Social Assistance (654 | 15.4%), Retail Trade (520 | 12.2%), Accommodation & Food Services (317 | 7.4%), and Educational Services (311 | 7.3%).
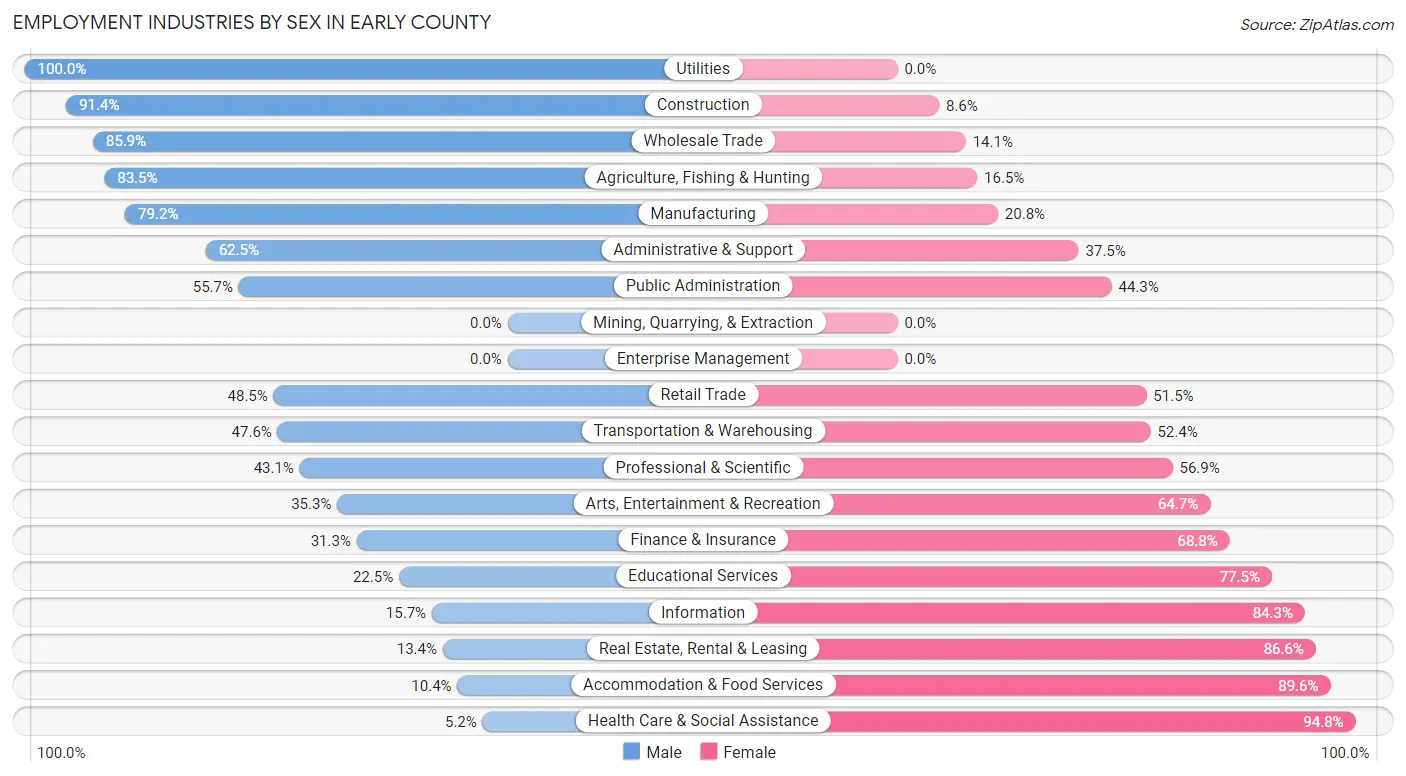
Employment Industries by Sex in Early County
The Early County industries that see more men than women are Utilities (100.0%), Construction (91.4%), and Wholesale Trade (85.9%), whereas the industries that tend to have a higher number of women are Health Care & Social Assistance (94.8%), Accommodation & Food Services (89.6%), and Real Estate, Rental & Leasing (86.6%).
| Industry | Male | Female |
| Agriculture, Fishing & Hunting | 172 (83.5%) | 34 (16.5%) |
| Mining, Quarrying, & Extraction | 0 (0.0%) | 0 (0.0%) |
| Construction | 255 (91.4%) | 24 (8.6%) |
| Manufacturing | 552 (79.2%) | 145 (20.8%) |
| Wholesale Trade | 85 (85.9%) | 14 (14.1%) |
| Retail Trade | 252 (48.5%) | 268 (51.5%) |
| Transportation & Warehousing | 100 (47.6%) | 110 (52.4%) |
| Utilities | 60 (100.0%) | 0 (0.0%) |
| Information | 8 (15.7%) | 43 (84.3%) |
| Finance & Insurance | 35 (31.2%) | 77 (68.8%) |
| Real Estate, Rental & Leasing | 9 (13.4%) | 58 (86.6%) |
| Professional & Scientific | 31 (43.1%) | 41 (56.9%) |
| Enterprise Management | 0 (0.0%) | 0 (0.0%) |
| Administrative & Support | 100 (62.5%) | 60 (37.5%) |
| Educational Services | 70 (22.5%) | 241 (77.5%) |
| Health Care & Social Assistance | 34 (5.2%) | 620 (94.8%) |
| Arts, Entertainment & Recreation | 6 (35.3%) | 11 (64.7%) |
| Accommodation & Food Services | 33 (10.4%) | 284 (89.6%) |
| Public Administration | 167 (55.7%) | 133 (44.3%) |
| Total | 2,019 (47.4%) | 2,239 (52.6%) |
Education in Early County
School Enrollment in Early County
The most common levels of schooling among the 2,667 students in Early County are high school (790 | 29.6%), middle school (732 | 27.5%), and elementary school (430 | 16.1%).
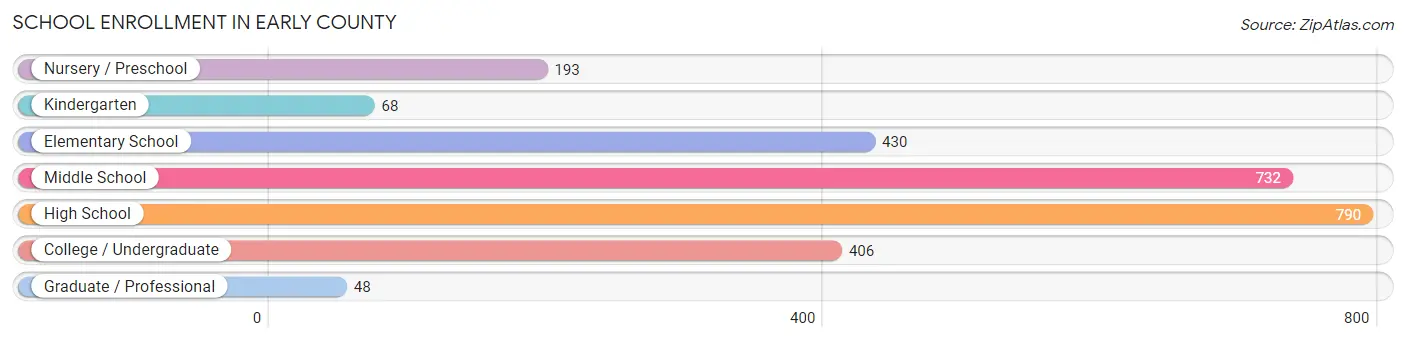
| School Level | # Students | % Students |
| Nursery / Preschool | 193 | 7.2% |
| Kindergarten | 68 | 2.5% |
| Elementary School | 430 | 16.1% |
| Middle School | 732 | 27.5% |
| High School | 790 | 29.6% |
| College / Undergraduate | 406 | 15.2% |
| Graduate / Professional | 48 | 1.8% |
| Total | 2,667 | 100.0% |
School Enrollment by Age by Funding Source in Early County
Out of a total of 2,667 students who are enrolled in schools in Early County, 344 (12.9%) attend a private institution, while the remaining 2,323 (87.1%) are enrolled in public schools. The age group of 3 to 4 year olds has the highest likelihood of being enrolled in private schools, with 35 (27.8% in the age bracket) enrolled. Conversely, the age group of 18 to 19 year olds has the lowest likelihood of being enrolled in a private school, with 275 (100.0% in the age bracket) attending a public institution.
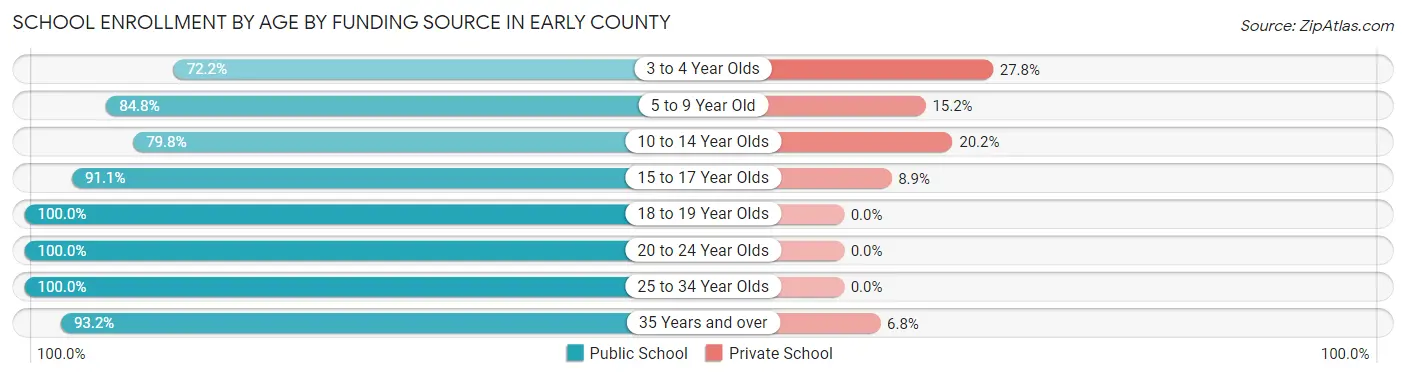
| Age Bracket | Public School | Private School |
| 3 to 4 Year Olds | 91 (72.2%) | 35 (27.8%) |
| 5 to 9 Year Old | 451 (84.8%) | 81 (15.2%) |
| 10 to 14 Year Olds | 721 (79.8%) | 183 (20.2%) |
| 15 to 17 Year Olds | 432 (91.1%) | 42 (8.9%) |
| 18 to 19 Year Olds | 275 (100.0%) | 0 (0.0%) |
| 20 to 24 Year Olds | 215 (100.0%) | 0 (0.0%) |
| 25 to 34 Year Olds | 82 (100.0%) | 0 (0.0%) |
| 35 Years and over | 55 (93.2%) | 4 (6.8%) |
| Total | 2,323 (87.1%) | 344 (12.9%) |
Educational Attainment by Field of Study in Early County
Education (332 | 32.8%), business (168 | 16.6%), psychology (101 | 10.0%), bio, nature & agricultural (93 | 9.2%), and science & technology (78 | 7.7%) are the most common fields of study among 1,012 individuals in Early County who have obtained a bachelor's degree or higher.
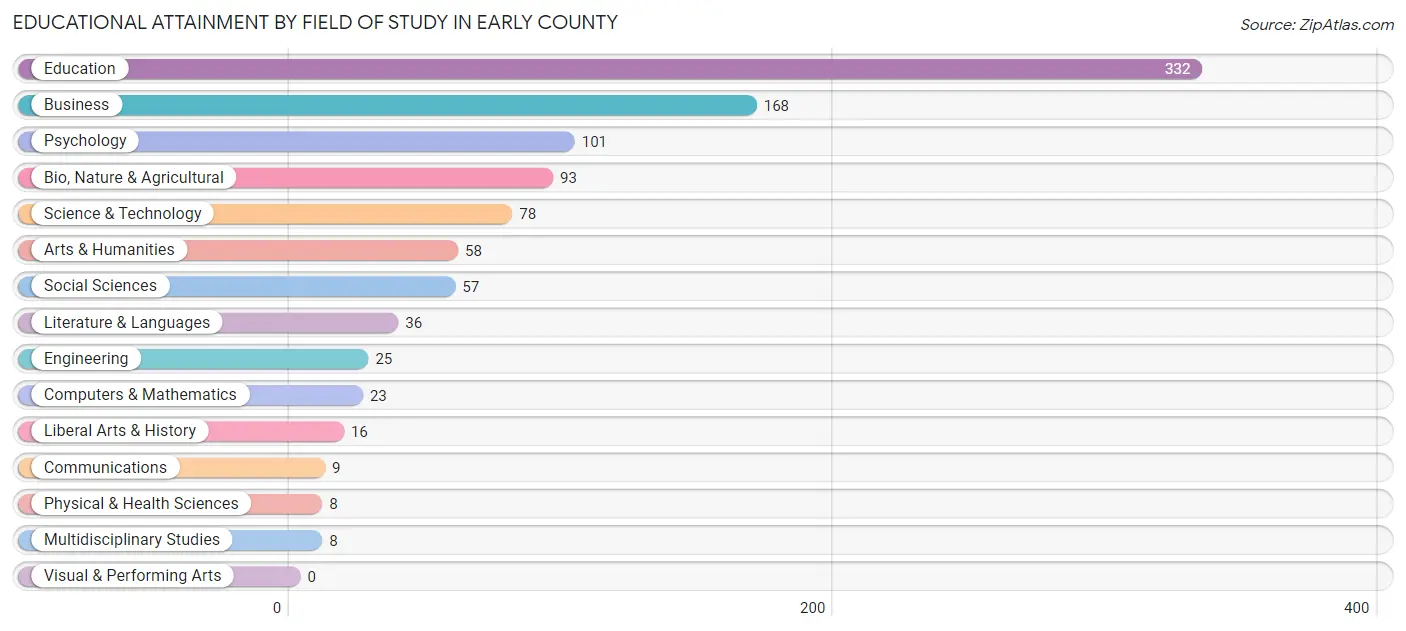
| Field of Study | # Graduates | % Graduates |
| Computers & Mathematics | 23 | 2.3% |
| Bio, Nature & Agricultural | 93 | 9.2% |
| Physical & Health Sciences | 8 | 0.8% |
| Psychology | 101 | 10.0% |
| Social Sciences | 57 | 5.6% |
| Engineering | 25 | 2.5% |
| Multidisciplinary Studies | 8 | 0.8% |
| Science & Technology | 78 | 7.7% |
| Business | 168 | 16.6% |
| Education | 332 | 32.8% |
| Literature & Languages | 36 | 3.6% |
| Liberal Arts & History | 16 | 1.6% |
| Visual & Performing Arts | 0 | 0.0% |
| Communications | 9 | 0.9% |
| Arts & Humanities | 58 | 5.7% |
| Total | 1,012 | 100.0% |
Transportation & Commute in Early County
Vehicle Availability by Sex in Early County
The most prevalent vehicle ownership categories in Early County are males with 3 vehicles (595, accounting for 29.8%) and females with 3 vehicles (643, making up 26.7%).
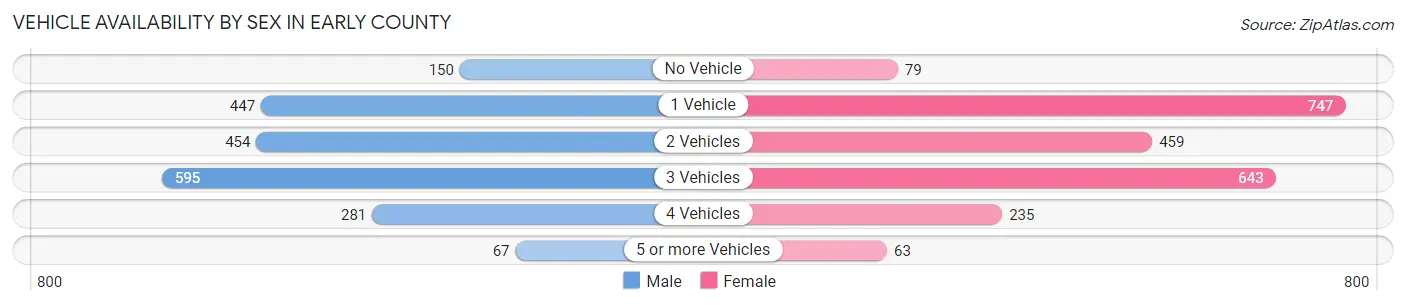
| Vehicles Available | Male | Female |
| No Vehicle | 150 (7.5%) | 79 (3.5%) |
| 1 Vehicle | 447 (22.4%) | 747 (33.6%) |
| 2 Vehicles | 454 (22.8%) | 459 (20.6%) |
| 3 Vehicles | 595 (29.8%) | 643 (28.9%) |
| 4 Vehicles | 281 (14.1%) | 235 (10.6%) |
| 5 or more Vehicles | 67 (3.4%) | 63 (2.8%) |
| Total | 1,994 (100.0%) | 2,226 (100.0%) |
Commute Time in Early County
The most frequently occuring commute durations in Early County are 15 to 19 minutes (681 commuters, 16.8%), 10 to 14 minutes (627 commuters, 15.5%), and 5 to 9 minutes (529 commuters, 13.1%).
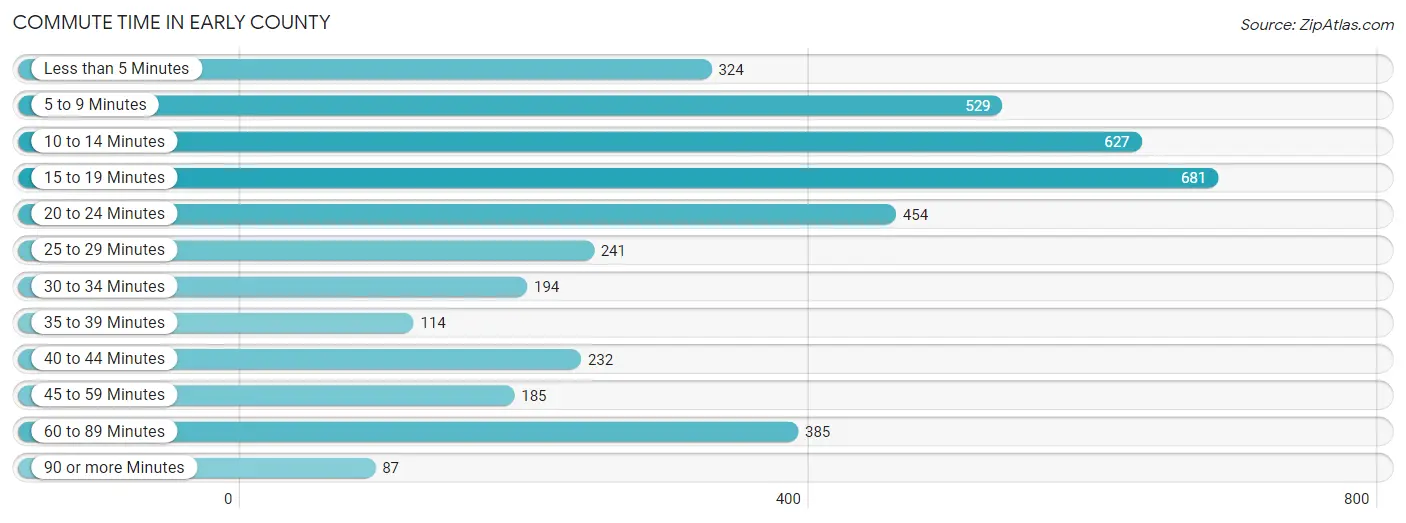
| Commute Time | # Commuters | % Commuters |
| Less than 5 Minutes | 324 | 8.0% |
| 5 to 9 Minutes | 529 | 13.1% |
| 10 to 14 Minutes | 627 | 15.5% |
| 15 to 19 Minutes | 681 | 16.8% |
| 20 to 24 Minutes | 454 | 11.2% |
| 25 to 29 Minutes | 241 | 5.9% |
| 30 to 34 Minutes | 194 | 4.8% |
| 35 to 39 Minutes | 114 | 2.8% |
| 40 to 44 Minutes | 232 | 5.7% |
| 45 to 59 Minutes | 185 | 4.6% |
| 60 to 89 Minutes | 385 | 9.5% |
| 90 or more Minutes | 87 | 2.1% |
Commute Time by Sex in Early County
The most common commute times in Early County are 5 to 9 minutes (340 commuters, 17.2%) for males and 15 to 19 minutes (352 commuters, 16.9%) for females.
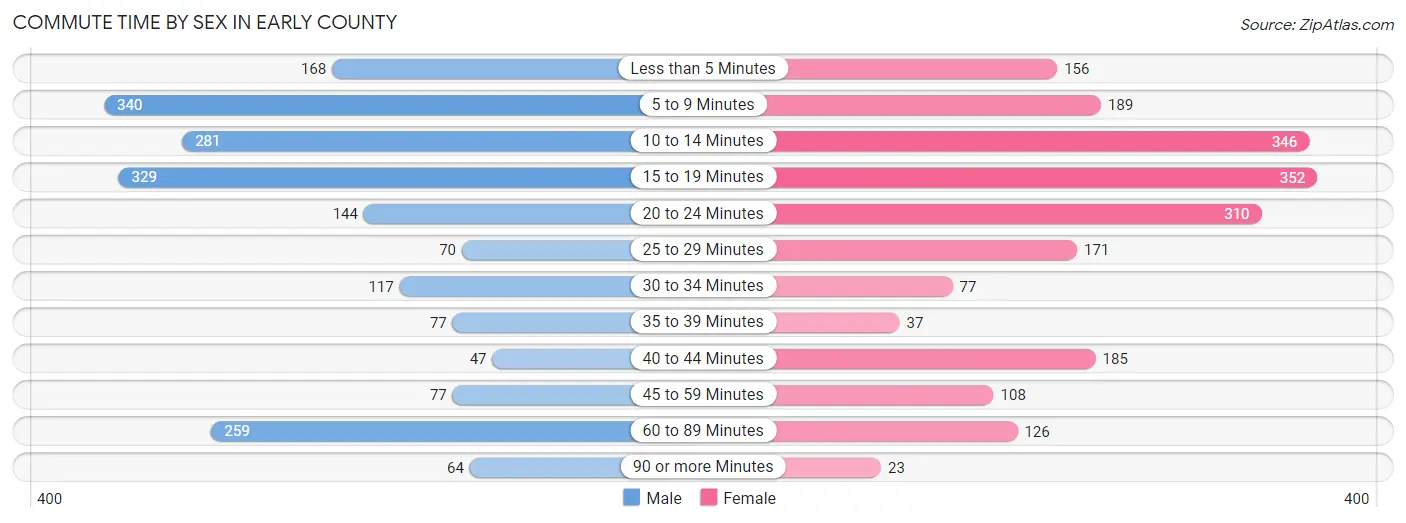
| Commute Time | Male | Female |
| Less than 5 Minutes | 168 (8.5%) | 156 (7.5%) |
| 5 to 9 Minutes | 340 (17.2%) | 189 (9.1%) |
| 10 to 14 Minutes | 281 (14.2%) | 346 (16.6%) |
| 15 to 19 Minutes | 329 (16.7%) | 352 (16.9%) |
| 20 to 24 Minutes | 144 (7.3%) | 310 (14.9%) |
| 25 to 29 Minutes | 70 (3.5%) | 171 (8.2%) |
| 30 to 34 Minutes | 117 (5.9%) | 77 (3.7%) |
| 35 to 39 Minutes | 77 (3.9%) | 37 (1.8%) |
| 40 to 44 Minutes | 47 (2.4%) | 185 (8.9%) |
| 45 to 59 Minutes | 77 (3.9%) | 108 (5.2%) |
| 60 to 89 Minutes | 259 (13.1%) | 126 (6.1%) |
| 90 or more Minutes | 64 (3.2%) | 23 (1.1%) |
Time of Departure to Work by Sex in Early County
The most frequent times of departure to work in Early County are 7:00 AM to 7:29 AM (369, 18.7%) for males and 7:30 AM to 7:59 AM (455, 21.9%) for females.
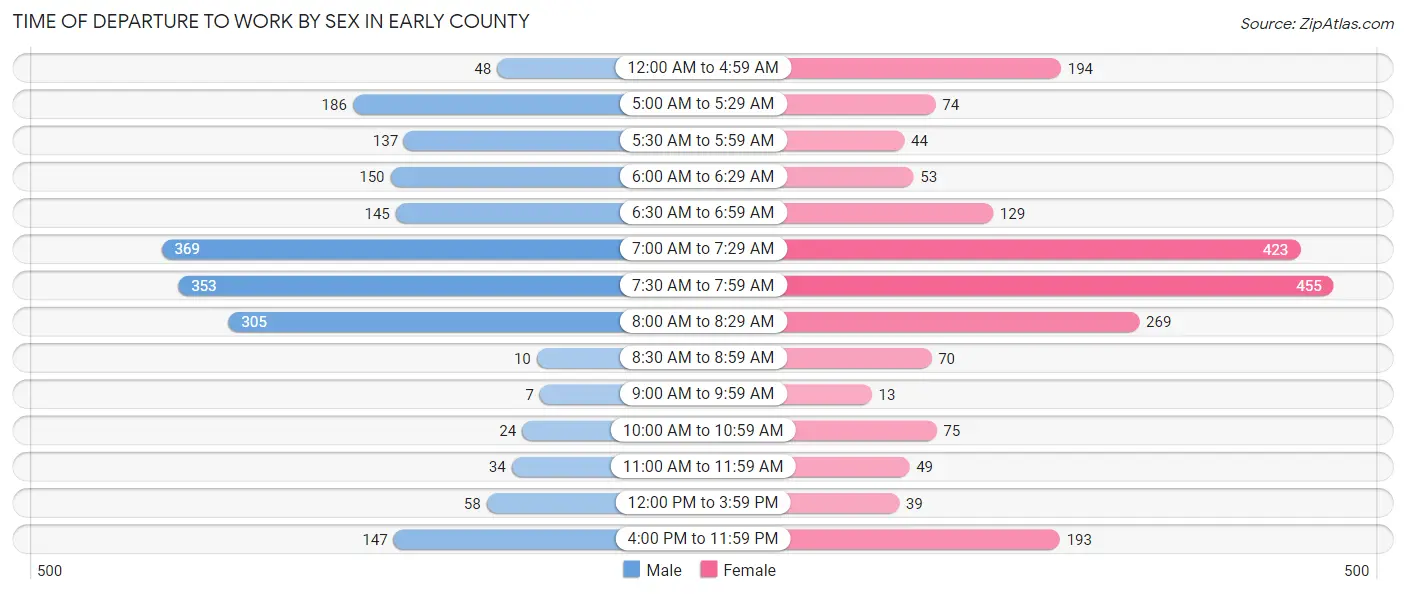
| Time of Departure | Male | Female |
| 12:00 AM to 4:59 AM | 48 (2.4%) | 194 (9.3%) |
| 5:00 AM to 5:29 AM | 186 (9.4%) | 74 (3.6%) |
| 5:30 AM to 5:59 AM | 137 (6.9%) | 44 (2.1%) |
| 6:00 AM to 6:29 AM | 150 (7.6%) | 53 (2.5%) |
| 6:30 AM to 6:59 AM | 145 (7.3%) | 129 (6.2%) |
| 7:00 AM to 7:29 AM | 369 (18.7%) | 423 (20.3%) |
| 7:30 AM to 7:59 AM | 353 (17.9%) | 455 (21.9%) |
| 8:00 AM to 8:29 AM | 305 (15.5%) | 269 (12.9%) |
| 8:30 AM to 8:59 AM | 10 (0.5%) | 70 (3.4%) |
| 9:00 AM to 9:59 AM | 7 (0.4%) | 13 (0.6%) |
| 10:00 AM to 10:59 AM | 24 (1.2%) | 75 (3.6%) |
| 11:00 AM to 11:59 AM | 34 (1.7%) | 49 (2.4%) |
| 12:00 PM to 3:59 PM | 58 (2.9%) | 39 (1.9%) |
| 4:00 PM to 11:59 PM | 147 (7.4%) | 193 (9.3%) |
| Total | 1,973 (100.0%) | 2,080 (100.0%) |
Housing Occupancy in Early County
Occupancy by Ownership in Early County
Of the total 4,016 dwellings in Early County, owner-occupied units account for 2,714 (67.6%), while renter-occupied units make up 1,302 (32.4%).
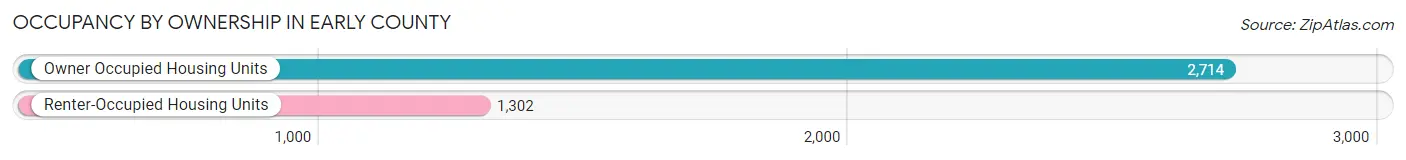
| Occupancy | # Housing Units | % Housing Units |
| Owner Occupied Housing Units | 2,714 | 67.6% |
| Renter-Occupied Housing Units | 1,302 | 32.4% |
| Total Occupied Housing Units | 4,016 | 100.0% |
Occupancy by Household Size in Early County
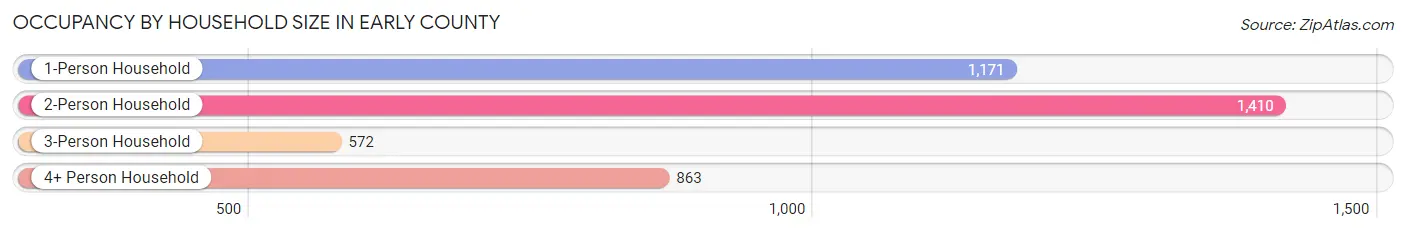
| Household Size | # Housing Units | % Housing Units |
| 1-Person Household | 1,171 | 29.2% |
| 2-Person Household | 1,410 | 35.1% |
| 3-Person Household | 572 | 14.2% |
| 4+ Person Household | 863 | 21.5% |
| Total Housing Units | 4,016 | 100.0% |
Occupancy by Ownership by Household Size in Early County
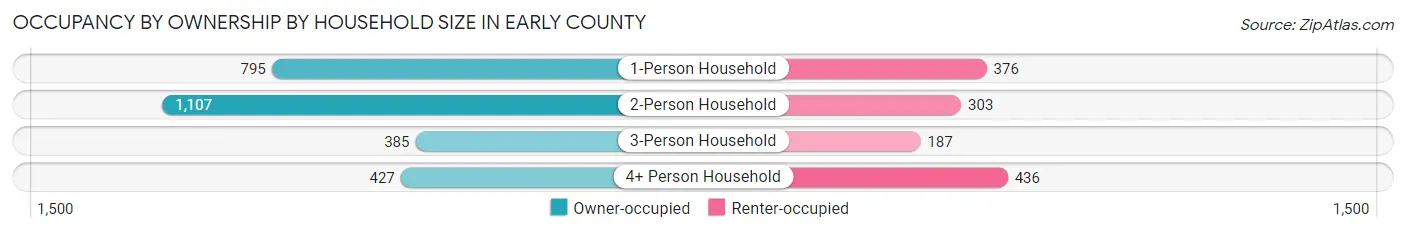
| Household Size | Owner-occupied | Renter-occupied |
| 1-Person Household | 795 (67.9%) | 376 (32.1%) |
| 2-Person Household | 1,107 (78.5%) | 303 (21.5%) |
| 3-Person Household | 385 (67.3%) | 187 (32.7%) |
| 4+ Person Household | 427 (49.5%) | 436 (50.5%) |
| Total Housing Units | 2,714 (67.6%) | 1,302 (32.4%) |
Occupancy by Educational Attainment in Early County
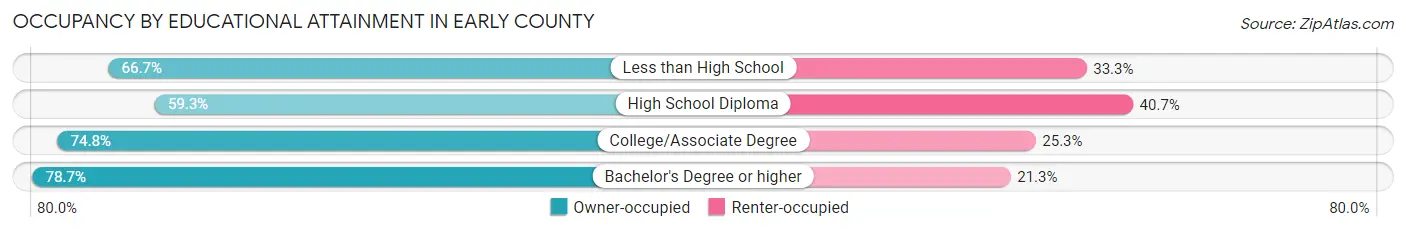
| Household Size | Owner-occupied | Renter-occupied |
| Less than High School | 494 (66.7%) | 247 (33.3%) |
| High School Diploma | 964 (59.3%) | 661 (40.7%) |
| College/Associate Degree | 808 (74.8%) | 273 (25.3%) |
| Bachelor's Degree or higher | 448 (78.7%) | 121 (21.3%) |
Occupancy by Age of Householder in Early County
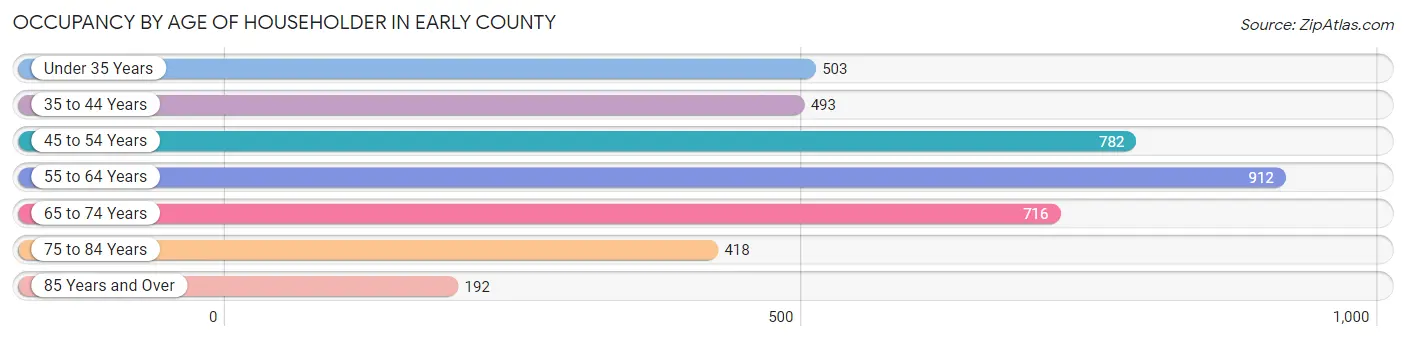
| Age Bracket | # Households | % Households |
| Under 35 Years | 503 | 12.5% |
| 35 to 44 Years | 493 | 12.3% |
| 45 to 54 Years | 782 | 19.5% |
| 55 to 64 Years | 912 | 22.7% |
| 65 to 74 Years | 716 | 17.8% |
| 75 to 84 Years | 418 | 10.4% |
| 85 Years and Over | 192 | 4.8% |
| Total | 4,016 | 100.0% |
Housing Finances in Early County
Median Income by Occupancy in Early County
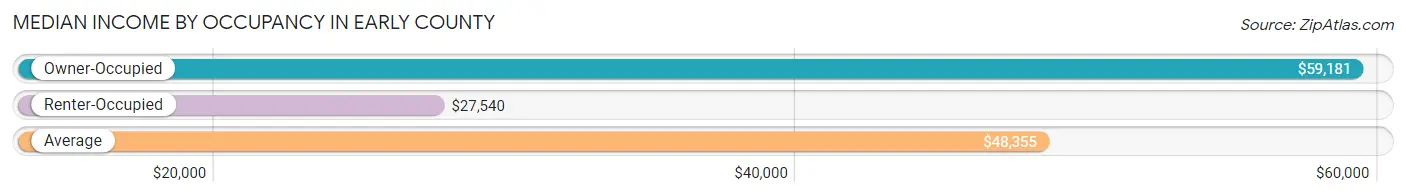
| Occupancy Type | # Households | Median Income |
| Owner-Occupied | 2,714 (67.6%) | $59,181 |
| Renter-Occupied | 1,302 (32.4%) | $27,540 |
| Average | 4,016 (100.0%) | $48,355 |
Occupancy by Householder Income Bracket in Early County
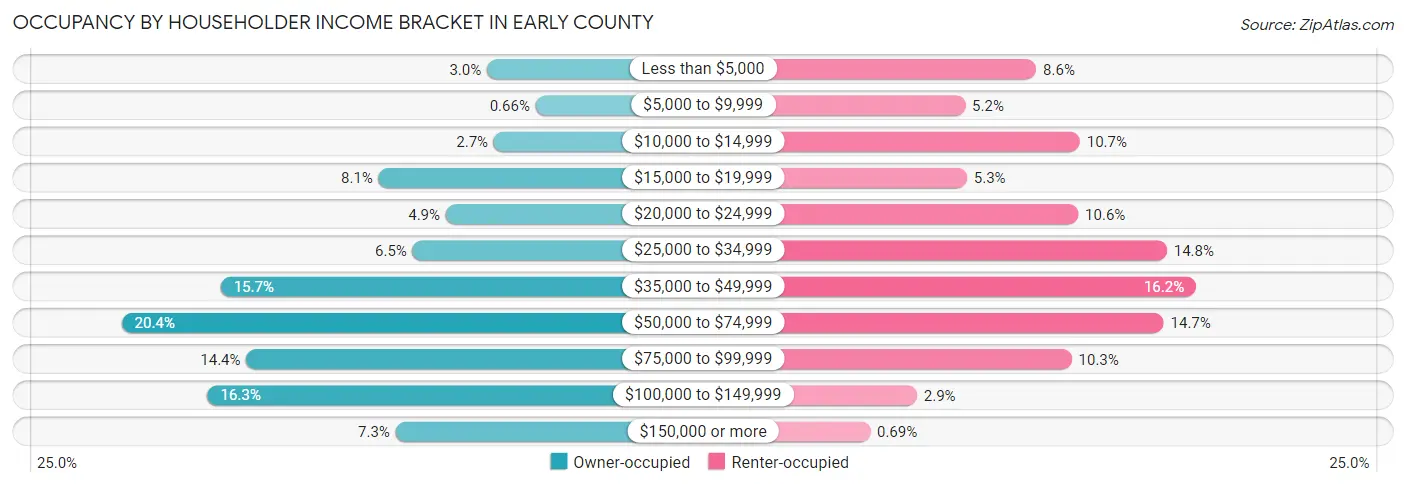
| Income Bracket | Owner-occupied | Renter-occupied |
| Less than $5,000 | 81 (3.0%) | 112 (8.6%) |
| $5,000 to $9,999 | 18 (0.7%) | 68 (5.2%) |
| $10,000 to $14,999 | 72 (2.6%) | 139 (10.7%) |
| $15,000 to $19,999 | 221 (8.1%) | 69 (5.3%) |
| $20,000 to $24,999 | 134 (4.9%) | 138 (10.6%) |
| $25,000 to $34,999 | 177 (6.5%) | 193 (14.8%) |
| $35,000 to $49,999 | 425 (15.7%) | 211 (16.2%) |
| $50,000 to $74,999 | 553 (20.4%) | 191 (14.7%) |
| $75,000 to $99,999 | 392 (14.4%) | 134 (10.3%) |
| $100,000 to $149,999 | 442 (16.3%) | 38 (2.9%) |
| $150,000 or more | 199 (7.3%) | 9 (0.7%) |
| Total | 2,714 (100.0%) | 1,302 (100.0%) |
Monthly Housing Cost Tiers in Early County
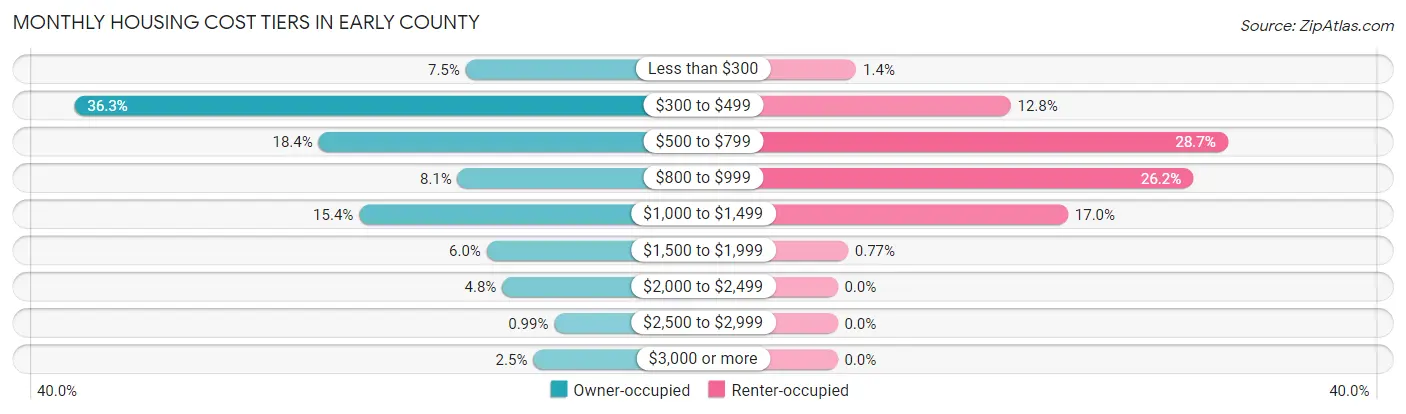
| Monthly Cost | Owner-occupied | Renter-occupied |
| Less than $300 | 204 (7.5%) | 18 (1.4%) |
| $300 to $499 | 986 (36.3%) | 166 (12.8%) |
| $500 to $799 | 498 (18.3%) | 374 (28.7%) |
| $800 to $999 | 220 (8.1%) | 341 (26.2%) |
| $1,000 to $1,499 | 417 (15.4%) | 221 (17.0%) |
| $1,500 to $1,999 | 162 (6.0%) | 10 (0.8%) |
| $2,000 to $2,499 | 131 (4.8%) | 0 (0.0%) |
| $2,500 to $2,999 | 27 (1.0%) | 0 (0.0%) |
| $3,000 or more | 69 (2.5%) | 0 (0.0%) |
| Total | 2,714 (100.0%) | 1,302 (100.0%) |
Physical Housing Characteristics in Early County
Housing Structures in Early County
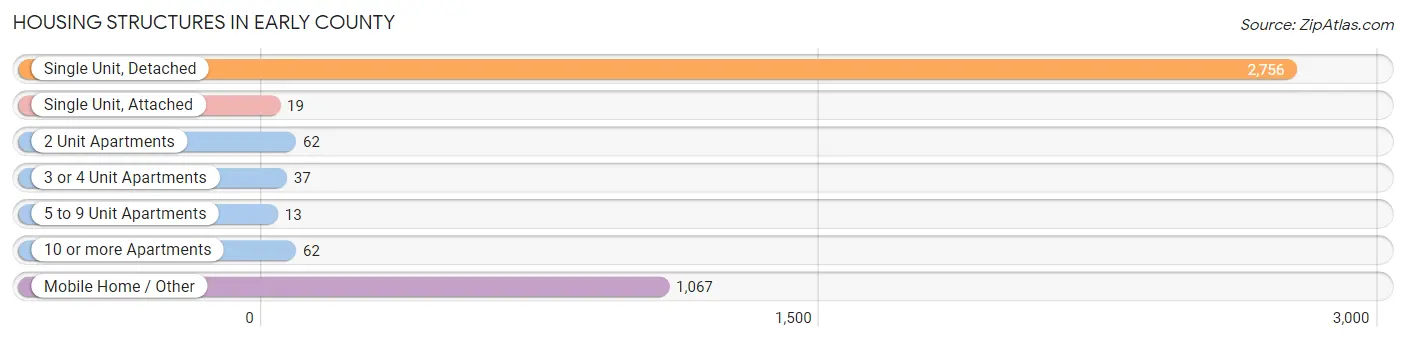
| Structure Type | # Housing Units | % Housing Units |
| Single Unit, Detached | 2,756 | 68.6% |
| Single Unit, Attached | 19 | 0.5% |
| 2 Unit Apartments | 62 | 1.5% |
| 3 or 4 Unit Apartments | 37 | 0.9% |
| 5 to 9 Unit Apartments | 13 | 0.3% |
| 10 or more Apartments | 62 | 1.5% |
| Mobile Home / Other | 1,067 | 26.6% |
| Total | 4,016 | 100.0% |
Housing Structures by Occupancy in Early County
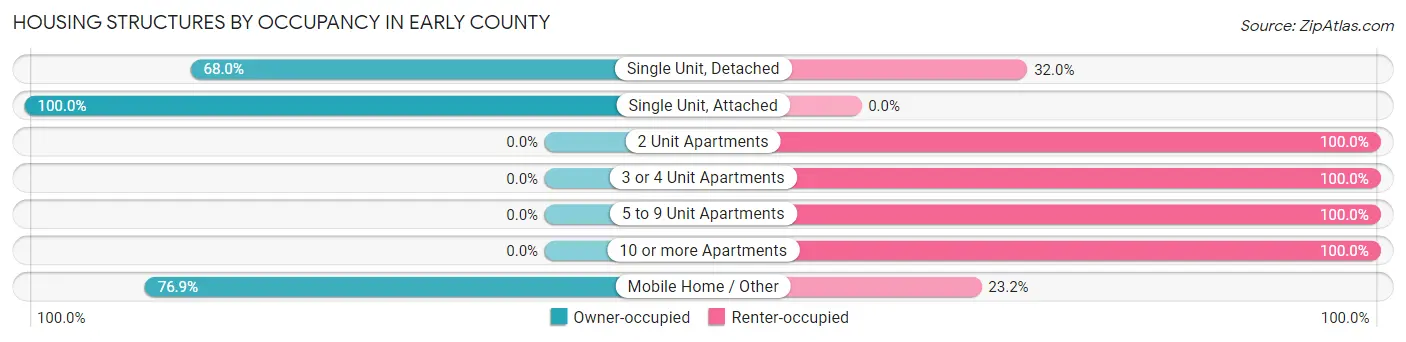
| Structure Type | Owner-occupied | Renter-occupied |
| Single Unit, Detached | 1,875 (68.0%) | 881 (32.0%) |
| Single Unit, Attached | 19 (100.0%) | 0 (0.0%) |
| 2 Unit Apartments | 0 (0.0%) | 62 (100.0%) |
| 3 or 4 Unit Apartments | 0 (0.0%) | 37 (100.0%) |
| 5 to 9 Unit Apartments | 0 (0.0%) | 13 (100.0%) |
| 10 or more Apartments | 0 (0.0%) | 62 (100.0%) |
| Mobile Home / Other | 820 (76.8%) | 247 (23.2%) |
| Total | 2,714 (67.6%) | 1,302 (32.4%) |
Housing Structures by Number of Rooms in Early County
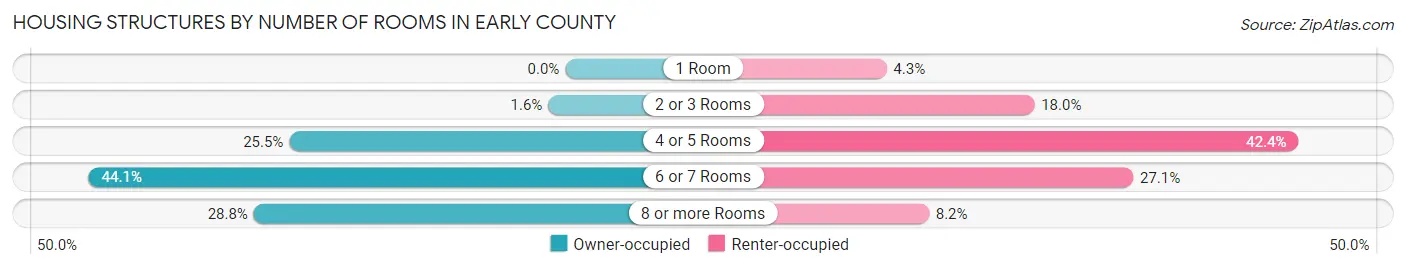
| Number of Rooms | Owner-occupied | Renter-occupied |
| 1 Room | 0 (0.0%) | 56 (4.3%) |
| 2 or 3 Rooms | 43 (1.6%) | 234 (18.0%) |
| 4 or 5 Rooms | 693 (25.5%) | 552 (42.4%) |
| 6 or 7 Rooms | 1,196 (44.1%) | 353 (27.1%) |
| 8 or more Rooms | 782 (28.8%) | 107 (8.2%) |
| Total | 2,714 (100.0%) | 1,302 (100.0%) |
Housing Structure by Heating Type in Early County
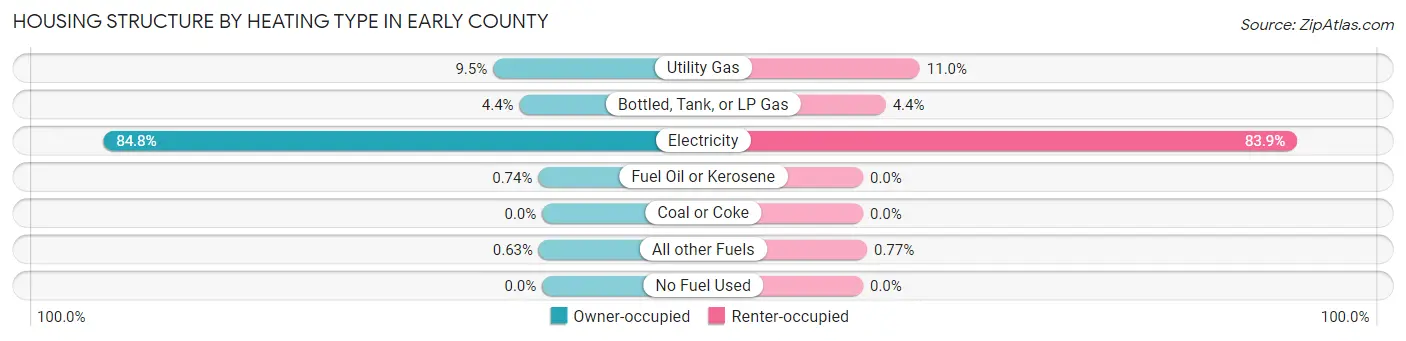
| Heating Type | Owner-occupied | Renter-occupied |
| Utility Gas | 257 (9.5%) | 143 (11.0%) |
| Bottled, Tank, or LP Gas | 119 (4.4%) | 57 (4.4%) |
| Electricity | 2,301 (84.8%) | 1,092 (83.9%) |
| Fuel Oil or Kerosene | 20 (0.7%) | 0 (0.0%) |
| Coal or Coke | 0 (0.0%) | 0 (0.0%) |
| All other Fuels | 17 (0.6%) | 10 (0.8%) |
| No Fuel Used | 0 (0.0%) | 0 (0.0%) |
| Total | 2,714 (100.0%) | 1,302 (100.0%) |
Household Vehicle Usage in Early County
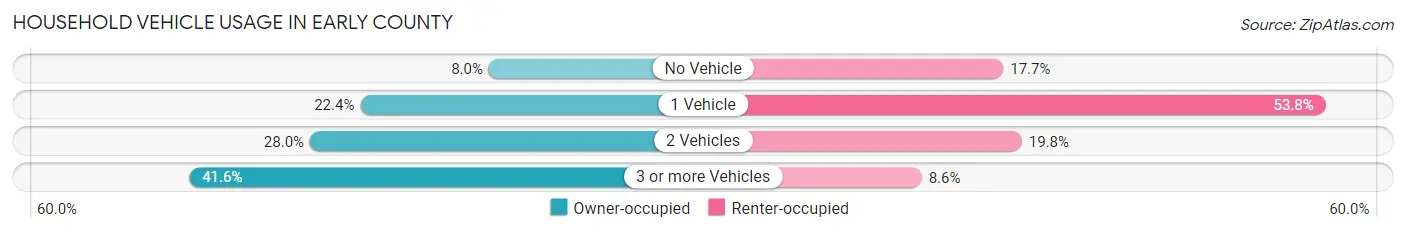
| Vehicles per Household | Owner-occupied | Renter-occupied |
| No Vehicle | 217 (8.0%) | 231 (17.7%) |
| 1 Vehicle | 608 (22.4%) | 701 (53.8%) |
| 2 Vehicles | 761 (28.0%) | 258 (19.8%) |
| 3 or more Vehicles | 1,128 (41.6%) | 112 (8.6%) |
| Total | 2,714 (100.0%) | 1,302 (100.0%) |
Real Estate & Mortgages in Early County
Real Estate and Mortgage Overview in Early County
| Characteristic | Without Mortgage | With Mortgage |
| Housing Units | 1,694 | 1,020 |
| Median Property Value | $118,500 | $133,700 |
| Median Household Income | $51,149 | $103 |
| Monthly Housing Costs | $451 | $69 |
| Real Estate Taxes | $882 | $36 |
Property Value by Mortgage Status in Early County
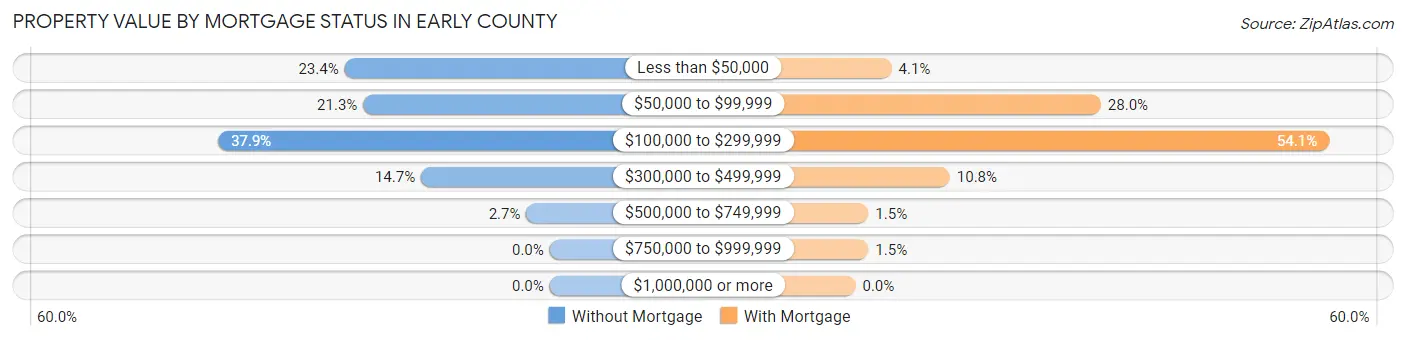
| Property Value | Without Mortgage | With Mortgage |
| Less than $50,000 | 397 (23.4%) | 42 (4.1%) |
| $50,000 to $99,999 | 361 (21.3%) | 286 (28.0%) |
| $100,000 to $299,999 | 642 (37.9%) | 552 (54.1%) |
| $300,000 to $499,999 | 249 (14.7%) | 110 (10.8%) |
| $500,000 to $749,999 | 45 (2.7%) | 15 (1.5%) |
| $750,000 to $999,999 | 0 (0.0%) | 15 (1.5%) |
| $1,000,000 or more | 0 (0.0%) | 0 (0.0%) |
| Total | 1,694 (100.0%) | 1,020 (100.0%) |
Household Income by Mortgage Status in Early County
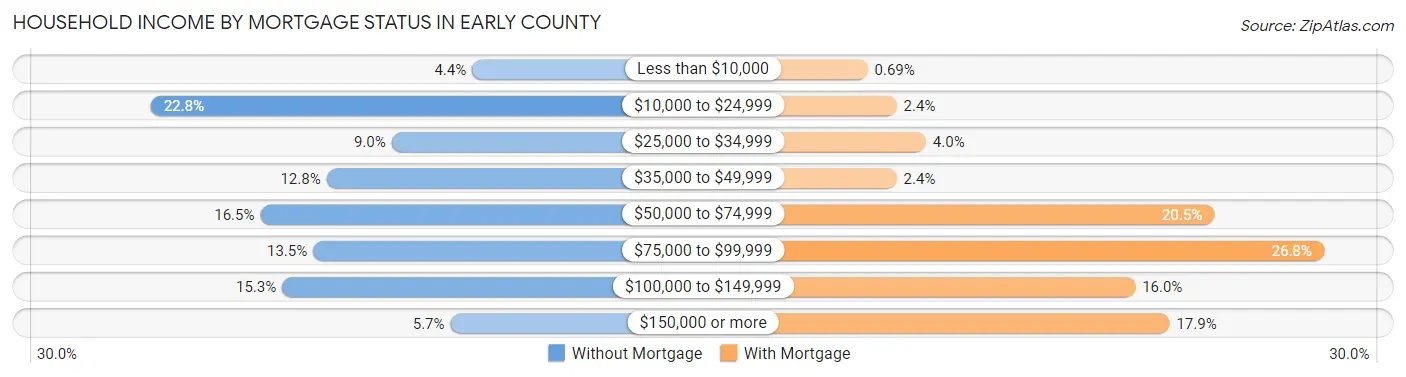
| Household Income | Without Mortgage | With Mortgage |
| Less than $10,000 | 75 (4.4%) | 7 (0.7%) |
| $10,000 to $24,999 | 386 (22.8%) | 24 (2.4%) |
| $25,000 to $34,999 | 153 (9.0%) | 41 (4.0%) |
| $35,000 to $49,999 | 216 (12.8%) | 24 (2.4%) |
| $50,000 to $74,999 | 280 (16.5%) | 209 (20.5%) |
| $75,000 to $99,999 | 229 (13.5%) | 273 (26.8%) |
| $100,000 to $149,999 | 259 (15.3%) | 163 (16.0%) |
| $150,000 or more | 96 (5.7%) | 183 (17.9%) |
| Total | 1,694 (100.0%) | 1,020 (100.0%) |
Property Value to Household Income Ratio in Early County
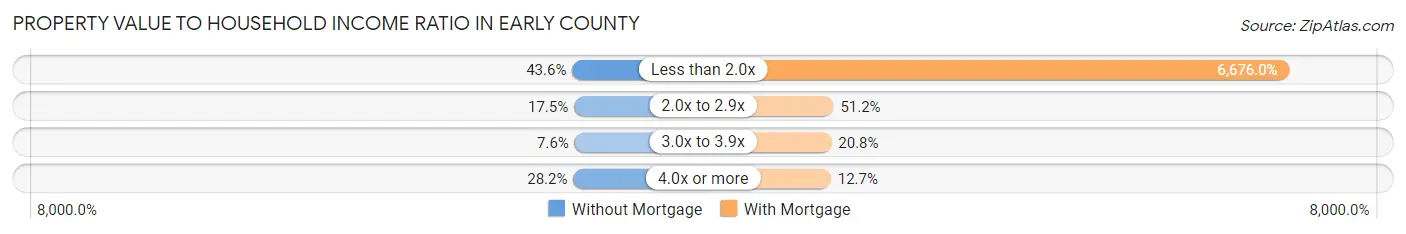
| Value-to-Income Ratio | Without Mortgage | With Mortgage |
| Less than 2.0x | 738 (43.6%) | 68,095 (6,676.0%) |
| 2.0x to 2.9x | 297 (17.5%) | 522 (51.2%) |
| 3.0x to 3.9x | 129 (7.6%) | 212 (20.8%) |
| 4.0x or more | 478 (28.2%) | 129 (12.7%) |
| Total | 1,694 (100.0%) | 1,020 (100.0%) |
Real Estate Taxes by Mortgage Status in Early County
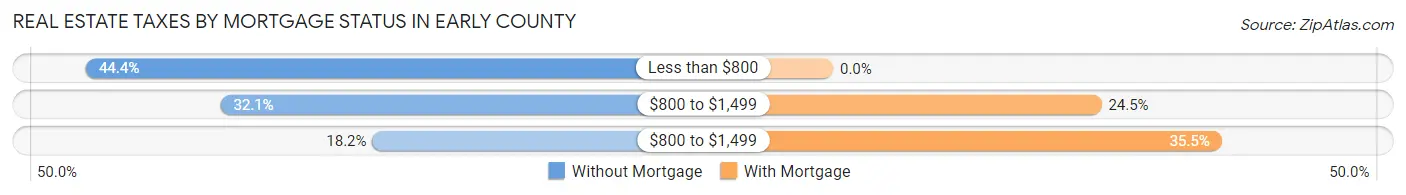
| Property Taxes | Without Mortgage | With Mortgage |
| Less than $800 | 752 (44.4%) | 0 (0.0%) |
| $800 to $1,499 | 544 (32.1%) | 250 (24.5%) |
| $800 to $1,499 | 309 (18.2%) | 362 (35.5%) |
| Total | 1,694 (100.0%) | 1,020 (100.0%) |
Health & Disability in Early County
Health Insurance Coverage by Age in Early County
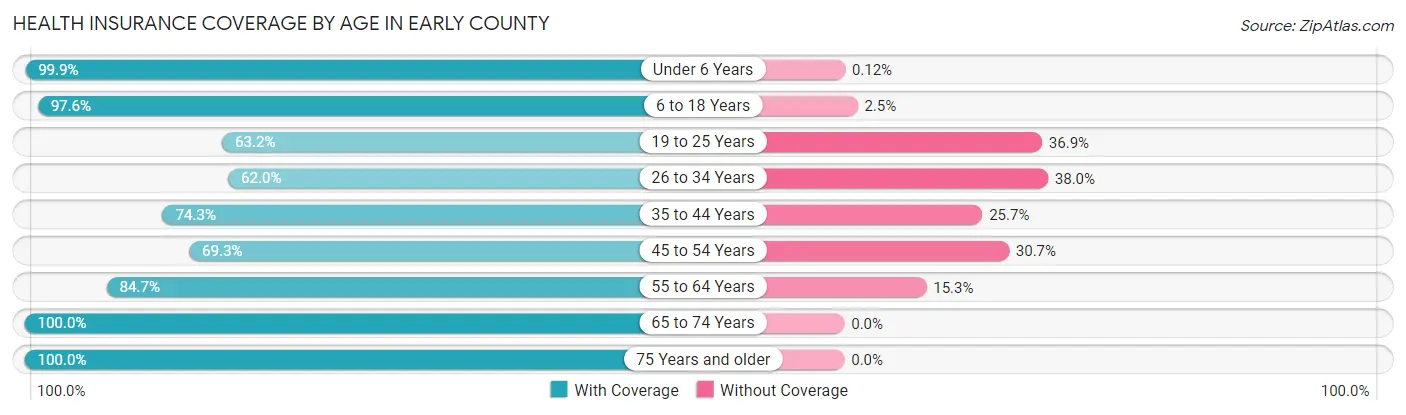
| Age Bracket | With Coverage | Without Coverage |
| Under 6 Years | 801 (99.9%) | 1 (0.1%) |
| 6 to 18 Years | 2,034 (97.6%) | 51 (2.5%) |
| 19 to 25 Years | 641 (63.1%) | 374 (36.8%) |
| 26 to 34 Years | 487 (62.0%) | 298 (38.0%) |
| 35 to 44 Years | 875 (74.3%) | 303 (25.7%) |
| 45 to 54 Years | 908 (69.3%) | 402 (30.7%) |
| 55 to 64 Years | 1,219 (84.7%) | 220 (15.3%) |
| 65 to 74 Years | 1,144 (100.0%) | 0 (0.0%) |
| 75 Years and older | 831 (100.0%) | 0 (0.0%) |
| Total | 8,940 (84.4%) | 1,649 (15.6%) |
Health Insurance Coverage by Citizenship Status in Early County
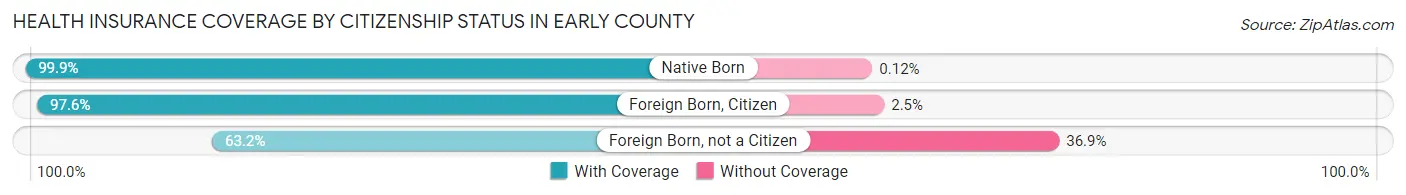
| Citizenship Status | With Coverage | Without Coverage |
| Native Born | 801 (99.9%) | 1 (0.1%) |
| Foreign Born, Citizen | 2,034 (97.6%) | 51 (2.5%) |
| Foreign Born, not a Citizen | 641 (63.1%) | 374 (36.8%) |
Health Insurance Coverage by Household Income in Early County
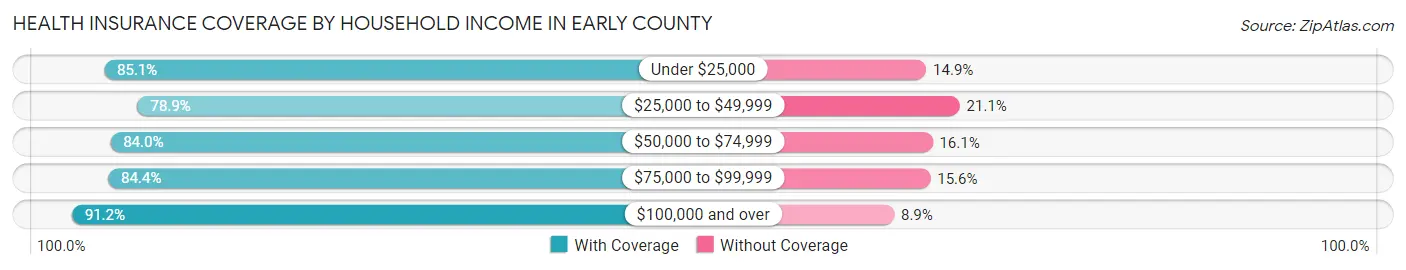
| Household Income | With Coverage | Without Coverage |
| Under $25,000 | 1,924 (85.1%) | 336 (14.9%) |
| $25,000 to $49,999 | 1,932 (78.9%) | 518 (21.1%) |
| $50,000 to $74,999 | 1,883 (84.0%) | 360 (16.1%) |
| $75,000 to $99,999 | 1,408 (84.4%) | 261 (15.6%) |
| $100,000 and over | 1,793 (91.1%) | 174 (8.8%) |
Public vs Private Health Insurance Coverage by Age in Early County
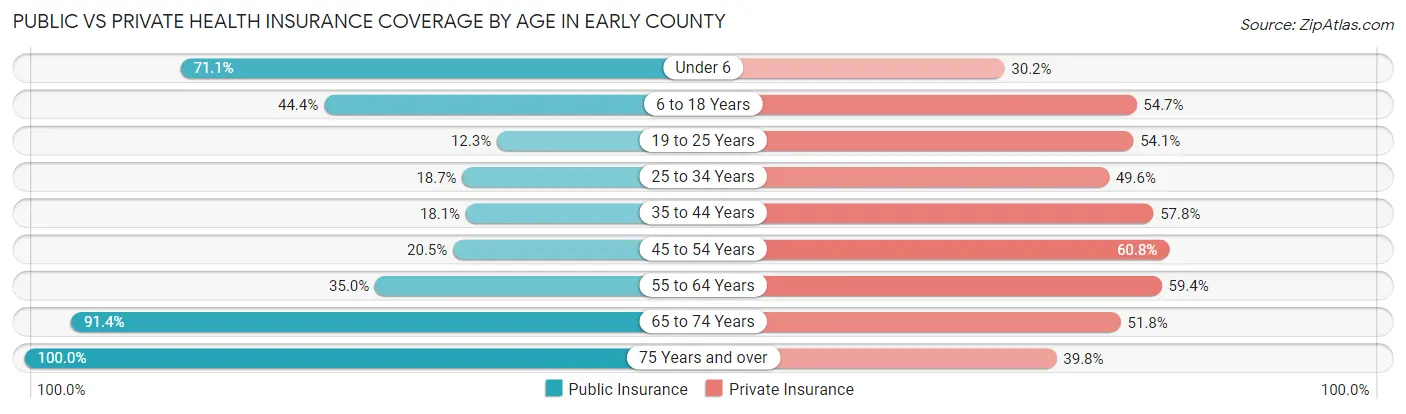
| Age Bracket | Public Insurance | Private Insurance |
| Under 6 | 570 (71.1%) | 242 (30.2%) |
| 6 to 18 Years | 926 (44.4%) | 1,140 (54.7%) |
| 19 to 25 Years | 125 (12.3%) | 549 (54.1%) |
| 25 to 34 Years | 147 (18.7%) | 389 (49.5%) |
| 35 to 44 Years | 213 (18.1%) | 681 (57.8%) |
| 45 to 54 Years | 268 (20.5%) | 796 (60.8%) |
| 55 to 64 Years | 503 (34.9%) | 854 (59.4%) |
| 65 to 74 Years | 1,045 (91.3%) | 592 (51.7%) |
| 75 Years and over | 831 (100.0%) | 331 (39.8%) |
| Total | 4,628 (43.7%) | 5,574 (52.6%) |
Disability Status by Sex by Age in Early County
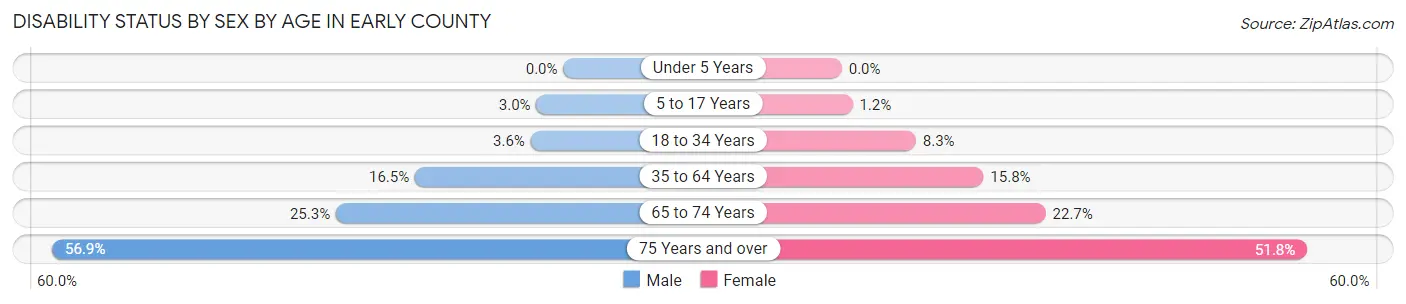
| Age Bracket | Male | Female |
| Under 5 Years | 0 (0.0%) | 0 (0.0%) |
| 5 to 17 Years | 31 (3.0%) | 11 (1.2%) |
| 18 to 34 Years | 37 (3.6%) | 87 (8.3%) |
| 35 to 64 Years | 301 (16.5%) | 332 (15.8%) |
| 65 to 74 Years | 138 (25.3%) | 136 (22.7%) |
| 75 Years and over | 160 (56.9%) | 285 (51.8%) |
Disability Class by Sex by Age in Early County
Disability Class: Hearing Difficulty
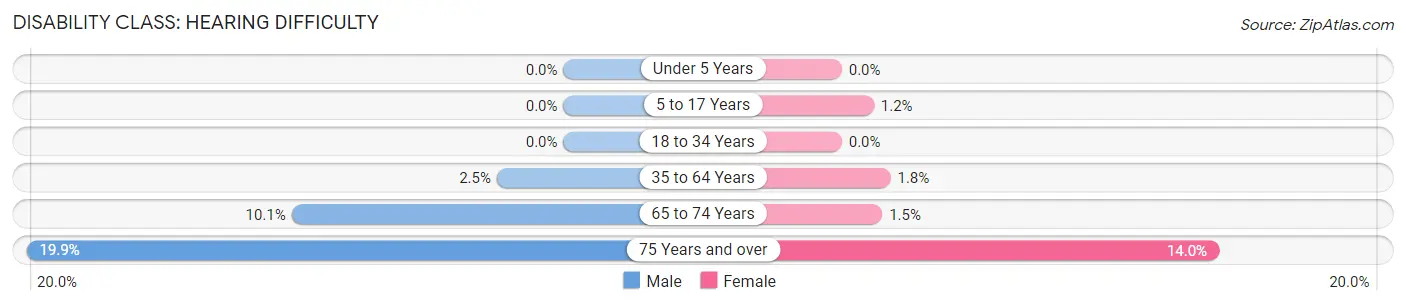
| Age Bracket | Male | Female |
| Under 5 Years | 0 (0.0%) | 0 (0.0%) |
| 5 to 17 Years | 0 (0.0%) | 11 (1.2%) |
| 18 to 34 Years | 0 (0.0%) | 0 (0.0%) |
| 35 to 64 Years | 45 (2.5%) | 38 (1.8%) |
| 65 to 74 Years | 55 (10.1%) | 9 (1.5%) |
| 75 Years and over | 56 (19.9%) | 77 (14.0%) |
Disability Class: Vision Difficulty
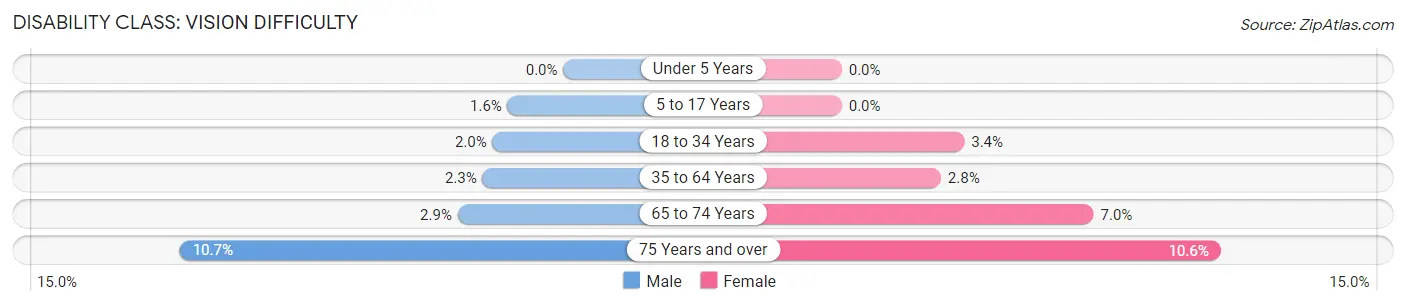
| Age Bracket | Male | Female |
| Under 5 Years | 0 (0.0%) | 0 (0.0%) |
| 5 to 17 Years | 16 (1.5%) | 0 (0.0%) |
| 18 to 34 Years | 20 (2.0%) | 36 (3.4%) |
| 35 to 64 Years | 41 (2.2%) | 58 (2.8%) |
| 65 to 74 Years | 16 (2.9%) | 42 (7.0%) |
| 75 Years and over | 30 (10.7%) | 58 (10.5%) |
Disability Class: Cognitive Difficulty
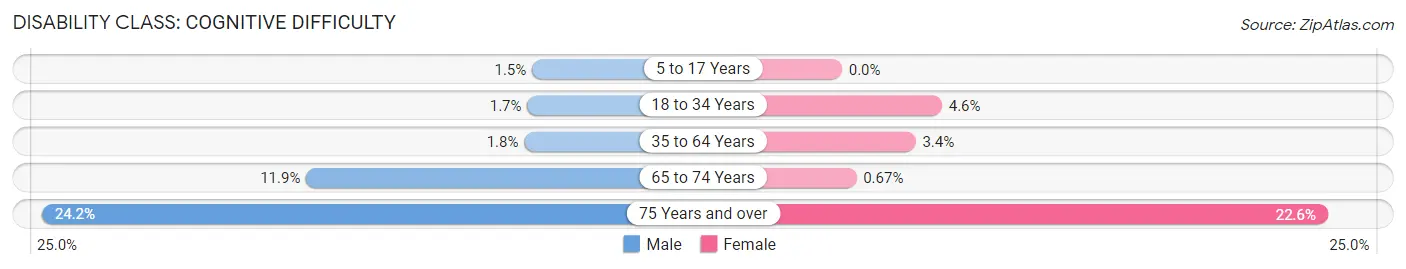
| Age Bracket | Male | Female |
| 5 to 17 Years | 15 (1.5%) | 0 (0.0%) |
| 18 to 34 Years | 17 (1.7%) | 49 (4.6%) |
| 35 to 64 Years | 33 (1.8%) | 72 (3.4%) |
| 65 to 74 Years | 65 (11.9%) | 4 (0.7%) |
| 75 Years and over | 68 (24.2%) | 124 (22.6%) |
Disability Class: Ambulatory Difficulty
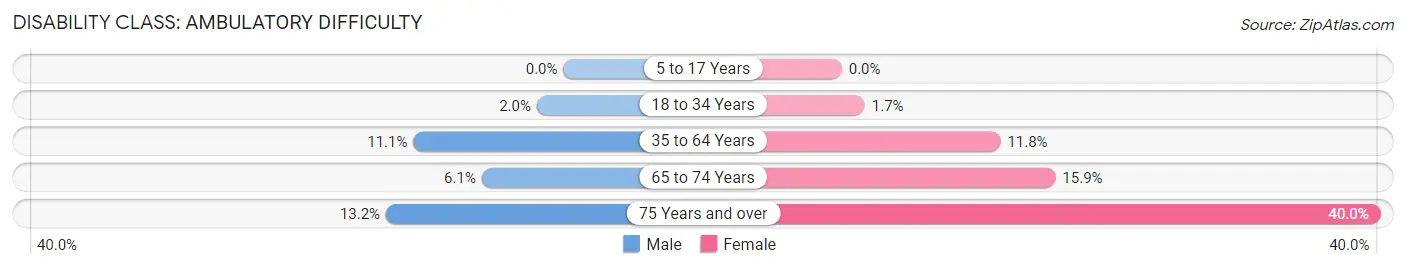
| Age Bracket | Male | Female |
| 5 to 17 Years | 0 (0.0%) | 0 (0.0%) |
| 18 to 34 Years | 20 (2.0%) | 18 (1.7%) |
| 35 to 64 Years | 203 (11.1%) | 248 (11.8%) |
| 65 to 74 Years | 33 (6.1%) | 95 (15.9%) |
| 75 Years and over | 37 (13.2%) | 220 (40.0%) |
Disability Class: Self-Care Difficulty
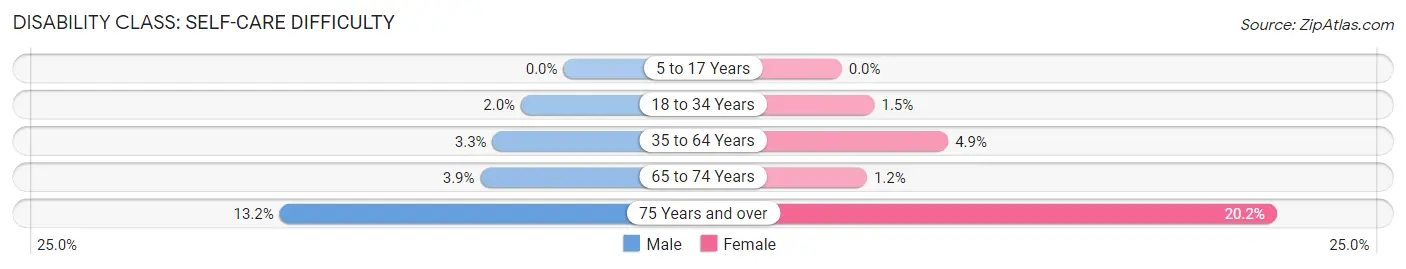
| Age Bracket | Male | Female |
| 5 to 17 Years | 0 (0.0%) | 0 (0.0%) |
| 18 to 34 Years | 20 (2.0%) | 16 (1.5%) |
| 35 to 64 Years | 60 (3.3%) | 104 (4.9%) |
| 65 to 74 Years | 21 (3.8%) | 7 (1.2%) |
| 75 Years and over | 37 (13.2%) | 111 (20.2%) |
Technology Access in Early County
Computing Device Access in Early County
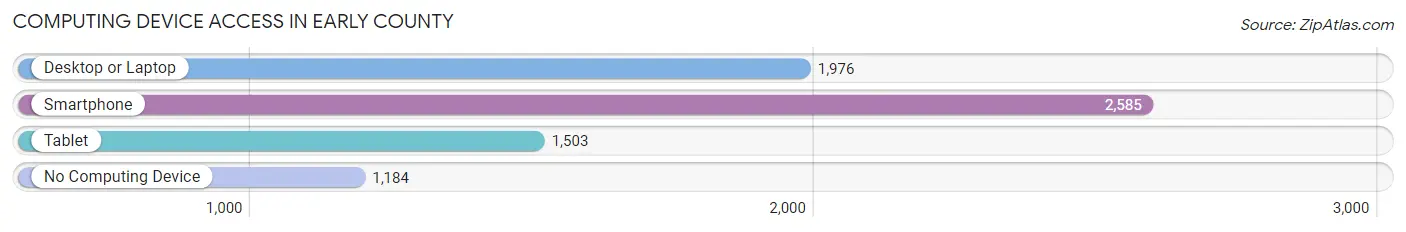
| Device Type | # Households | % Households |
| Desktop or Laptop | 1,976 | 49.2% |
| Smartphone | 2,585 | 64.4% |
| Tablet | 1,503 | 37.4% |
| No Computing Device | 1,184 | 29.5% |
| Total | 4,016 | 100.0% |
Internet Access in Early County
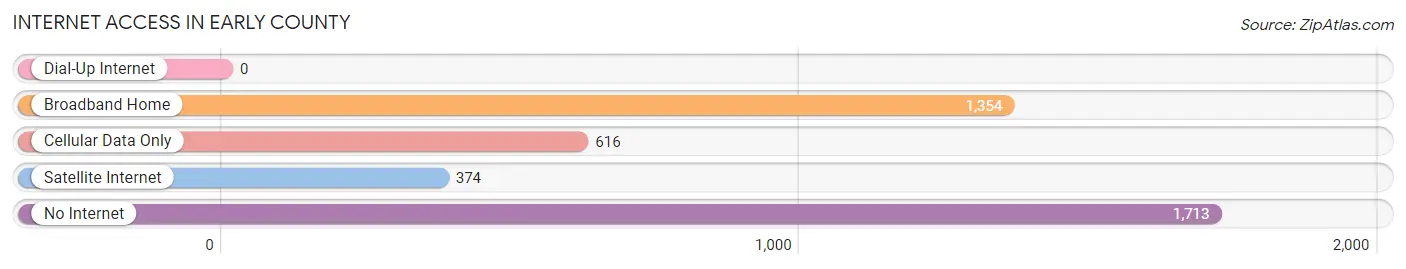
| Internet Type | # Households | % Households |
| Dial-Up Internet | 0 | 0.0% |
| Broadband Home | 1,354 | 33.7% |
| Cellular Data Only | 616 | 15.3% |
| Satellite Internet | 374 | 9.3% |
| No Internet | 1,713 | 42.6% |
| Total | 4,016 | 100.0% |
Early County Summary
Early County is a county located in the southwestern part of the U.S. state of Georgia. As of the 2010 census, the population was 11,008. The county seat is Blakely. The county was created on December 15, 1818.
Geography
Early County is located in the southwestern corner of Georgia, and is bordered by Miller County, Georgia to the north, Seminole County, Georgia to the east, Houston County, Alabama to the south, and Dale County, Alabama to the west. The county has a total area of 441 square miles, of which 439 square miles is land and 2.2 square miles (0.5%) is water.
The county is located in the Lower Flint River sub-basin of the ACF River Basin (Apalachicola-Chattahoochee-Flint River Basin). The western portion of Early County is located in the Lower Chattahoochee River sub-basin of the same ACF River Basin.
Demographics
As of the 2010 United States Census, there were 11,008 people, 4,072 households, and 2,845 families residing in the county. The population density was 25.0 inhabitants per square mile (9.7/km2). There were 4,817 housing units at an average density of 11.0 per square mile (4.3/km2). The racial makeup of the county was 57.2% white, 40.2% black or African American, 0.3% Asian, 0.2% American Indian, 0.7% from other races, and 1.4% from two or more races. Those of Hispanic or Latino origin made up 1.7% of the population. In terms of ancestry, 15.2% were American, 8.2% were English, and 6.2% were Irish.
Of the 4,072 households, 33.2% had children under the age of 18 living with them, 44.2% were married couples living together, 19.7% had a female householder with no husband present, 30.7% were non-families, and 27.2% of all households were made up of individuals. The average household size was 2.54 and the average family size was 3.09. The median age was 38.7 years.
The median income for a household in the county was $30,945 and the median income for a family was $37,945. Males had a median income of $30,945 versus $25,945 for females. The per capita income for the county was $15,945. About 17.2% of families and 20.7% of the population were below the poverty line, including 28.2% of those under age 18 and 17.2% of those age 65 or over.
Economy
Early County is a rural county with a largely agricultural economy. The county is home to several large farms, including the Early County Farm, which is one of the largest in the state. The county also has a number of small businesses, including a number of restaurants, convenience stores, and other retail establishments.
The county is also home to a number of manufacturing companies, including a paper mill, a furniture factory, and a number of other small businesses. The county is also home to a number of tourist attractions, including the Early County Museum, the Early County Historical Society, and the Early County Courthouse.
The county is served by the Early County Airport, which is located in Blakely. The airport is used primarily for general aviation, but also serves as a hub for air cargo operations.
Conclusion
Early County is a rural county located in the southwestern corner of Georgia. The county has a population of 11,008, and is home to a largely agricultural economy. The county is also home to a number of small businesses, manufacturing companies, and tourist attractions. The county is served by the Early County Airport, which is located in Blakely.
Common Questions
What is Per Capita Income in Early County?
Per Capita income in Early County is $25,929.
What is the Median Family Income in Early County?
Median Family Income in Early County is $57,030.
What is the Median Household income in Early County?
Median Household Income in Early County is $48,355.
What is Income or Wage Gap in Early County?
Income or Wage Gap in Early County is 21.9%.
Women in Early County earn 78.1 cents for every dollar earned by a man.
What is Family Income Deficit in Early County?
Family Income Deficit in Early County is $10,641.
Families that are below poverty line in Early County earn $10,641 less on average than the poverty threshold level.
What is Inequality or Gini Index in Early County?
Inequality or Gini Index in Early County is 0.48.
What is the Total Population of Early County?
Total Population of Early County is 10,753.
What is the Total Male Population of Early County?
Total Male Population of Early County is 5,082.
What is the Total Female Population of Early County?
Total Female Population of Early County is 5,671.
What is the Ratio of Males per 100 Females in Early County?
There are 89.61 Males per 100 Females in Early County.
What is the Ratio of Females per 100 Males in Early County?
There are 111.59 Females per 100 Males in Early County.
What is the Median Population Age in Early County?
Median Population Age in Early County is 40.4 Years.
What is the Average Family Size in Early County
Average Family Size in Early County is 3.3 People.
What is the Average Household Size in Early County
Average Household Size in Early County is 2.6 People.
How Large is the Labor Force in Early County?
There are 4,557 People in the Labor Forcein in Early County.
What is the Percentage of People in the Labor Force in Early County?
53.8% of People are in the Labor Force in Early County.
What is the Unemployment Rate in Early County?
Unemployment Rate in Early County is 6.0%.