Clay County, GA Map & Demographics
Clay County Map
Clay County Overview
$22,191
PER CAPITA INCOME
$53,750
AVG FAMILY INCOME
$43,264
AVG HOUSEHOLD INCOME
26.5%
WAGE / INCOME GAP [ % ]
73.5¢/ $1
WAGE / INCOME GAP [ $ ]
0.40
INEQUALITY / GINI INDEX
2,855
TOTAL POPULATION
1,335
MALE POPULATION
1,520
FEMALE POPULATION
87.83
MALES / 100 FEMALES
113.86
FEMALES / 100 MALES
42.7
MEDIAN AGE
3.4
AVG FAMILY SIZE
2.5
AVG HOUSEHOLD SIZE
1,174
LABOR FORCE [ PEOPLE ]
49.5%
PERCENT IN LABOR FORCE
3.5%
UNEMPLOYMENT RATE
Clay County Area Codes
Income in Clay County
Income Overview in Clay County
Per Capita Income in Clay County is $22,191, while median incomes of families and households are $53,750 and $43,264 respectively.
| Characteristic | Number | Measure |
| Per Capita Income | 2,855 | $22,191 |
| Median Family Income | 655 | $53,750 |
| Mean Family Income | 655 | $60,306 |
| Median Household Income | 1,143 | $43,264 |
| Mean Household Income | 1,143 | $48,429 |
| Income Deficit | 655 | $0 |
| Wage / Income Gap (%) | 2,855 | 26.49% |
| Wage / Income Gap ($) | 2,855 | 73.51¢ per $1 |
| Gini / Inequality Index | 2,855 | 0.40 |
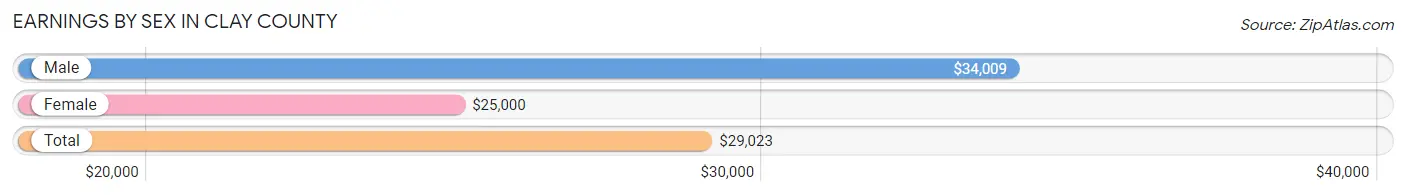
Earnings by Sex in Clay County
Average Earnings in Clay County are $29,023, $34,009 for men and $25,000 for women, a difference of 26.5%.
| Sex | Number | Average Earnings |
| Male | 633 (52.8%) | $34,009 |
| Female | 566 (47.2%) | $25,000 |
| Total | 1,199 (100.0%) | $29,023 |
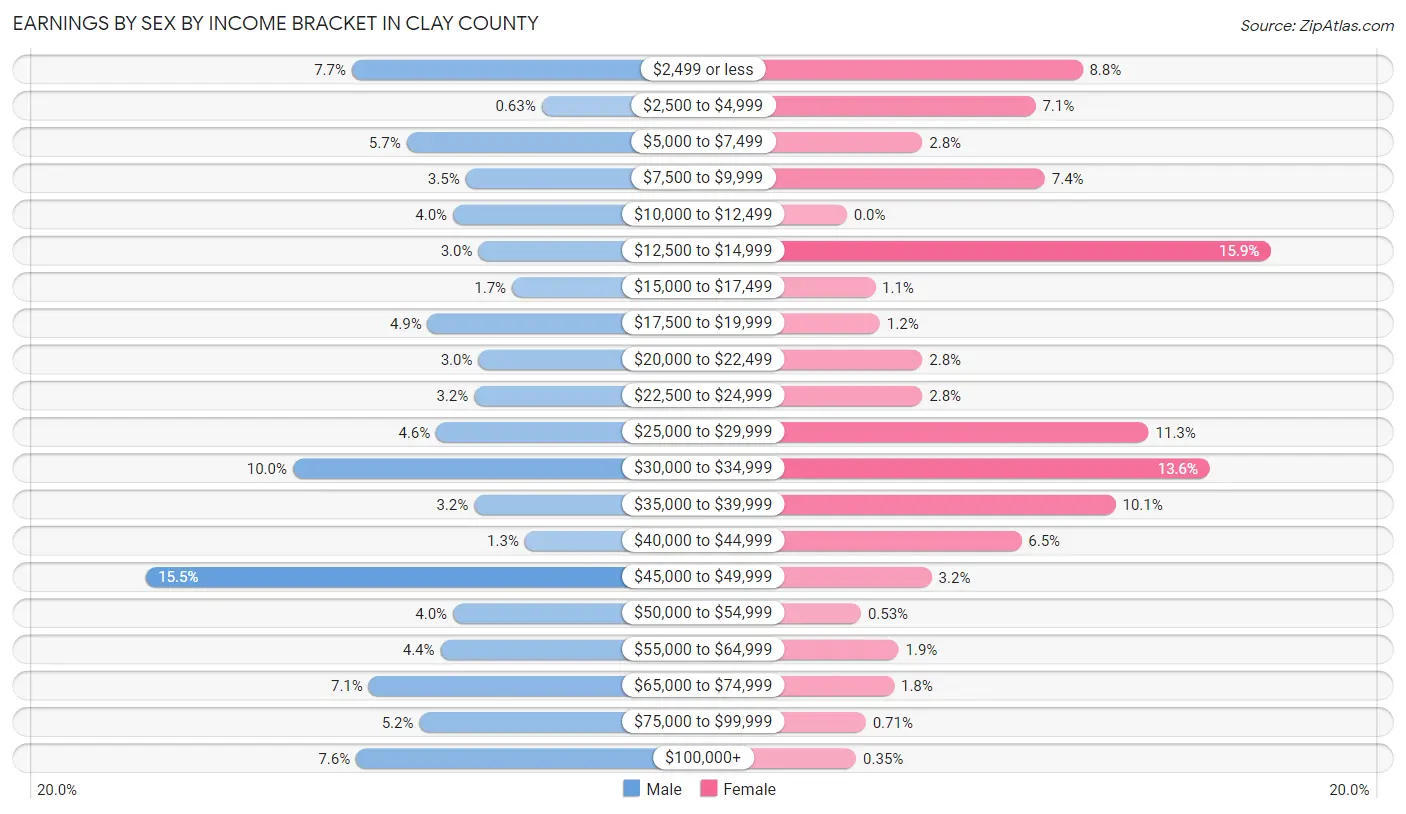
Earnings by Sex by Income Bracket in Clay County
The most common earnings brackets in Clay County are $45,000 to $49,999 for men (98 | 15.5%) and $12,500 to $14,999 for women (90 | 15.9%).
| Income | Male | Female |
| $2,499 or less | 49 (7.7%) | 50 (8.8%) |
| $2,500 to $4,999 | 4 (0.6%) | 40 (7.1%) |
| $5,000 to $7,499 | 36 (5.7%) | 16 (2.8%) |
| $7,500 to $9,999 | 22 (3.5%) | 42 (7.4%) |
| $10,000 to $12,499 | 25 (4.0%) | 0 (0.0%) |
| $12,500 to $14,999 | 19 (3.0%) | 90 (15.9%) |
| $15,000 to $17,499 | 11 (1.7%) | 6 (1.1%) |
| $17,500 to $19,999 | 31 (4.9%) | 7 (1.2%) |
| $20,000 to $22,499 | 19 (3.0%) | 16 (2.8%) |
| $22,500 to $24,999 | 20 (3.2%) | 16 (2.8%) |
| $25,000 to $29,999 | 29 (4.6%) | 64 (11.3%) |
| $30,000 to $34,999 | 63 (10.0%) | 77 (13.6%) |
| $35,000 to $39,999 | 20 (3.2%) | 57 (10.1%) |
| $40,000 to $44,999 | 8 (1.3%) | 37 (6.5%) |
| $45,000 to $49,999 | 98 (15.5%) | 18 (3.2%) |
| $50,000 to $54,999 | 25 (4.0%) | 3 (0.5%) |
| $55,000 to $64,999 | 28 (4.4%) | 11 (1.9%) |
| $65,000 to $74,999 | 45 (7.1%) | 10 (1.8%) |
| $75,000 to $99,999 | 33 (5.2%) | 4 (0.7%) |
| $100,000+ | 48 (7.6%) | 2 (0.4%) |
| Total | 633 (100.0%) | 566 (100.0%) |
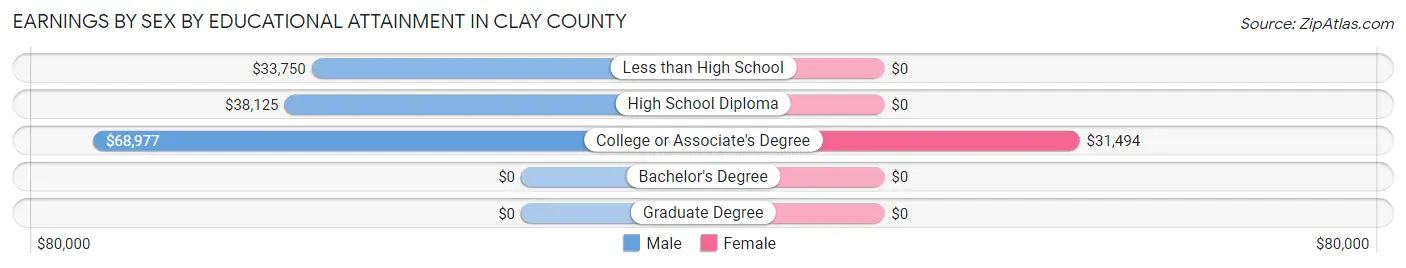
Earnings by Sex by Educational Attainment in Clay County
Average earnings in Clay County are $45,057 for men and $30,000 for women, a difference of 33.4%. Men with an educational attainment of college or associate's degree enjoy the highest average annual earnings of $68,977, while those with less than high school education earn the least with $33,750. Women with an educational attainment of college or associate's degree earn the most with the average annual earnings of $31,494, while those with college or associate's degree education have the smallest earnings of $31,494.
| Educational Attainment | Male Income | Female Income |
| Less than High School | $33,750 | $0 |
| High School Diploma | $38,125 | $0 |
| College or Associate's Degree | $68,977 | $31,494 |
| Bachelor's Degree | - | - |
| Graduate Degree | - | - |
| Total | $45,057 | $30,000 |
Family Income in Clay County
Family Income Brackets in Clay County
According to the Clay County family income data, there are 210 families falling into the $75,000 to $99,999 income range, which is the most common income bracket and makes up 32.1% of all families. Conversely, the $200,000+ income bracket is the least frequent group with only 2 families (0.3%) belonging to this category.
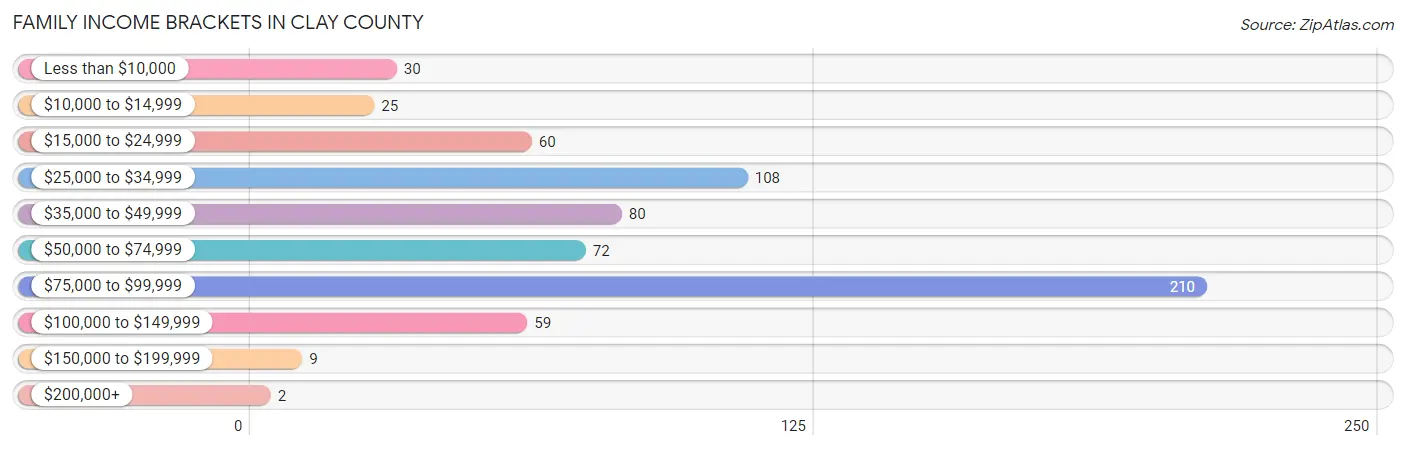
| Income Bracket | # Families | % Families |
| Less than $10,000 | 30 | 4.6% |
| $10,000 to $14,999 | 25 | 3.8% |
| $15,000 to $24,999 | 60 | 9.2% |
| $25,000 to $34,999 | 108 | 16.5% |
| $35,000 to $49,999 | 80 | 12.2% |
| $50,000 to $74,999 | 72 | 11.0% |
| $75,000 to $99,999 | 210 | 32.1% |
| $100,000 to $149,999 | 59 | 9.0% |
| $150,000 to $199,999 | 9 | 1.4% |
| $200,000+ | 2 | 0.3% |
Family Income by Famaliy Size in Clay County
2-person families (458 | 69.9%) account for the highest median family income in Clay County with $55,455 per family, while 2-person families (458 | 69.9%) have the highest median income of $27,728 per family member.
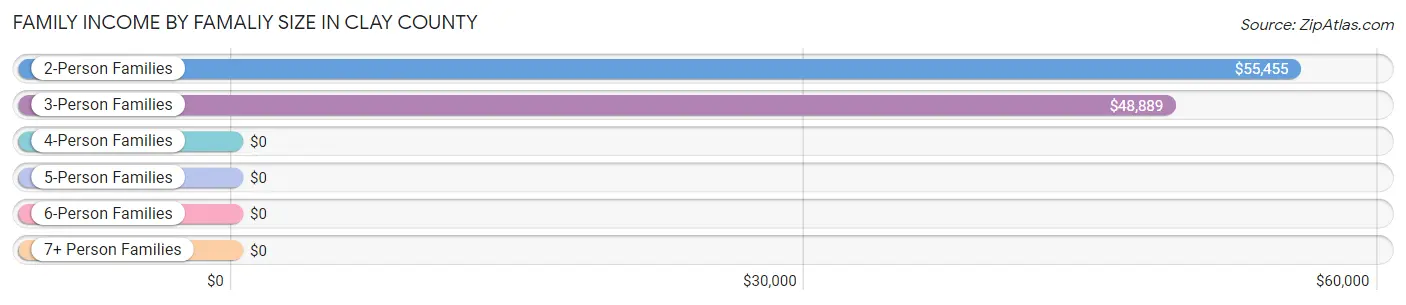
| Income Bracket | # Families | Median Income |
| 2-Person Families | 458 (69.9%) | $55,455 |
| 3-Person Families | 76 (11.6%) | $48,889 |
| 4-Person Families | 75 (11.5%) | $0 |
| 5-Person Families | 26 (4.0%) | $0 |
| 6-Person Families | 7 (1.1%) | $0 |
| 7+ Person Families | 13 (2.0%) | $0 |
| Total | 655 (100.0%) | $53,750 |
Family Income by Number of Earners in Clay County
The median family income in Clay County is $53,750, with families comprising 3+ earners (39) having the highest median family income of $96,146, while families with 1 earner (287) have the lowest median family income of $36,518, accounting for 5.9% and 43.8% of families, respectively.
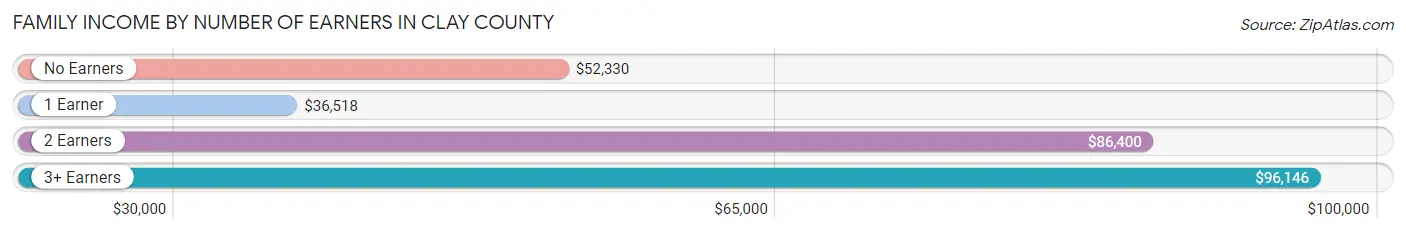
| Number of Earners | # Families | Median Income |
| No Earners | 199 (30.4%) | $52,330 |
| 1 Earner | 287 (43.8%) | $36,518 |
| 2 Earners | 130 (19.9%) | $86,400 |
| 3+ Earners | 39 (5.9%) | $96,146 |
| Total | 655 (100.0%) | $53,750 |
Household Income in Clay County
Household Income Brackets in Clay County
With 237 households falling in the category, the $75,000 to $99,999 income range is the most frequent in Clay County, accounting for 20.7% of all households. In contrast, only 2 households (0.2%) fall into the $200,000+ income bracket, making it the least populous group.
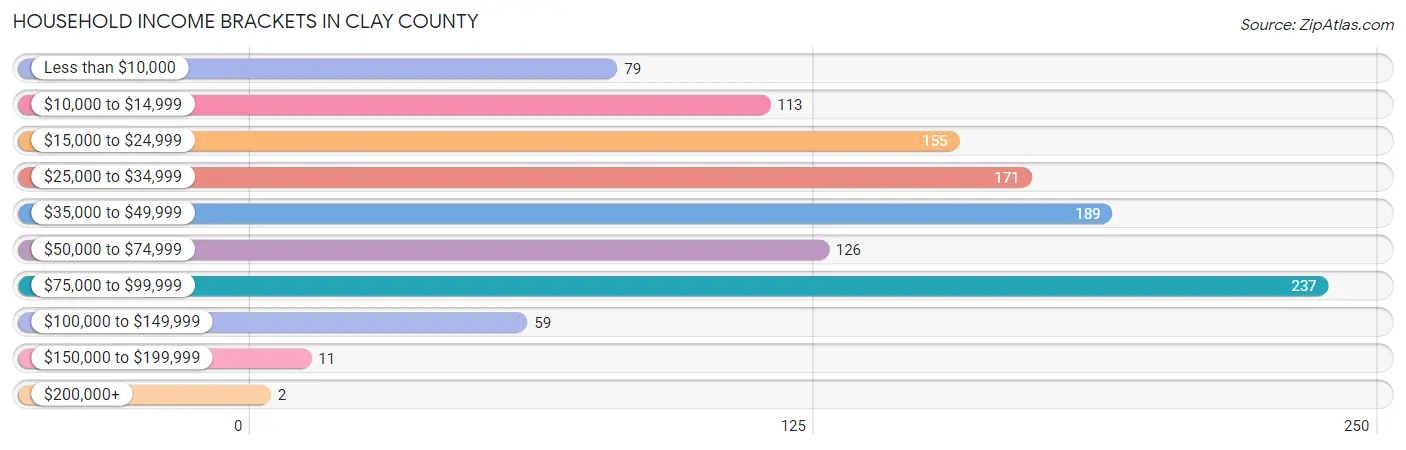
| Income Bracket | # Households | % Households |
| Less than $10,000 | 79 | 6.9% |
| $10,000 to $14,999 | 113 | 9.9% |
| $15,000 to $24,999 | 155 | 13.6% |
| $25,000 to $34,999 | 171 | 15.0% |
| $35,000 to $49,999 | 189 | 16.5% |
| $50,000 to $74,999 | 126 | 11.0% |
| $75,000 to $99,999 | 237 | 20.7% |
| $100,000 to $149,999 | 59 | 5.2% |
| $150,000 to $199,999 | 11 | 1.0% |
| $200,000+ | 2 | 0.2% |
Household Income by Householder Age in Clay County
The median household income in Clay County is $43,264, with the highest median household income of $46,552 found in the 45 to 64 years age bracket for the primary householder. A total of 406 households (35.5%) fall into this category. Meanwhile, the 25 to 44 years age bracket for the primary householder has the lowest median household income of $26,000, with 290 households (25.4%) in this group.
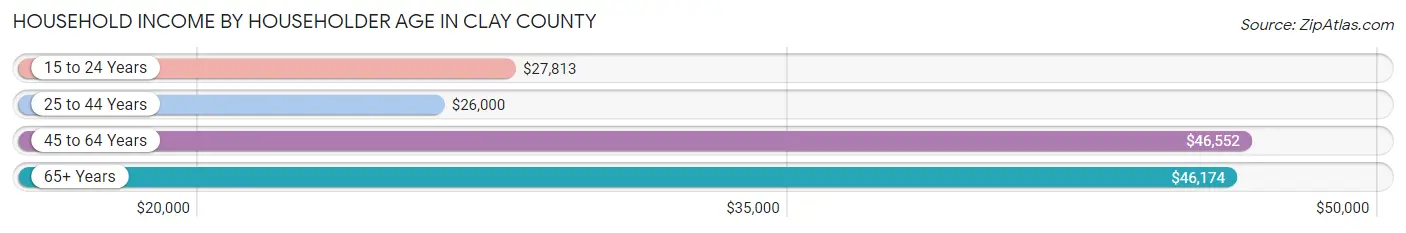
| Income Bracket | # Households | Median Income |
| 15 to 24 Years | 14 (1.2%) | $27,813 |
| 25 to 44 Years | 290 (25.4%) | $26,000 |
| 45 to 64 Years | 406 (35.5%) | $46,552 |
| 65+ Years | 433 (37.9%) | $46,174 |
| Total | 1,143 (100.0%) | $43,264 |
Poverty in Clay County
Income Below Poverty by Sex and Age in Clay County
With 20.0% poverty level for males and 30.7% for females among the residents of Clay County, 15 year old males and 18 to 24 year old females are the most vulnerable to poverty, with 33 males (50.8%) and 119 females (65.0%) in their respective age groups living below the poverty level.
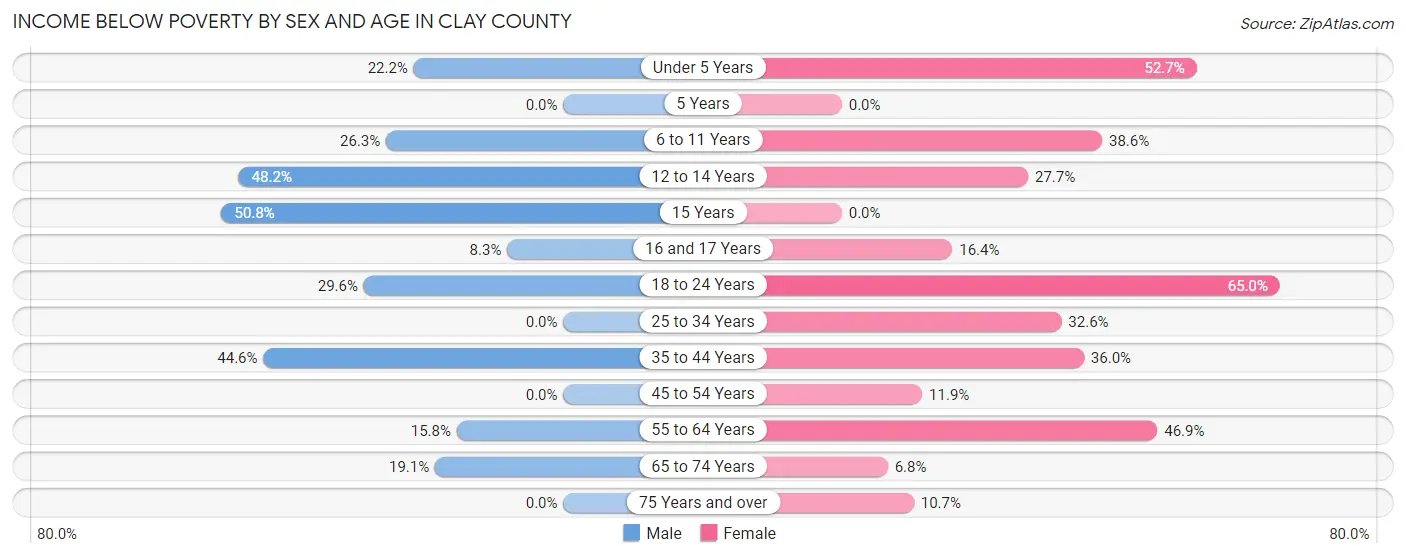
| Age Bracket | Male | Female |
| Under 5 Years | 10 (22.2%) | 69 (52.7%) |
| 5 Years | 0 (0.0%) | 0 (0.0%) |
| 6 to 11 Years | 10 (26.3%) | 34 (38.6%) |
| 12 to 14 Years | 27 (48.2%) | 13 (27.7%) |
| 15 Years | 33 (50.8%) | 0 (0.0%) |
| 16 and 17 Years | 4 (8.3%) | 21 (16.4%) |
| 18 to 24 Years | 24 (29.6%) | 119 (65.0%) |
| 25 to 34 Years | 0 (0.0%) | 30 (32.6%) |
| 35 to 44 Years | 94 (44.6%) | 55 (35.9%) |
| 45 to 54 Years | 0 (0.0%) | 21 (11.9%) |
| 55 to 64 Years | 28 (15.8%) | 67 (46.9%) |
| 65 to 74 Years | 32 (19.1%) | 12 (6.8%) |
| 75 Years and over | 0 (0.0%) | 17 (10.7%) |
| Total | 262 (20.0%) | 458 (30.7%) |
Income Above Poverty by Sex and Age in Clay County
According to the poverty statistics in Clay County, males aged 25 to 34 years and females aged 5 years are the age groups that are most secure financially, with 100.0% of males and 100.0% of females in these age groups living above the poverty line.
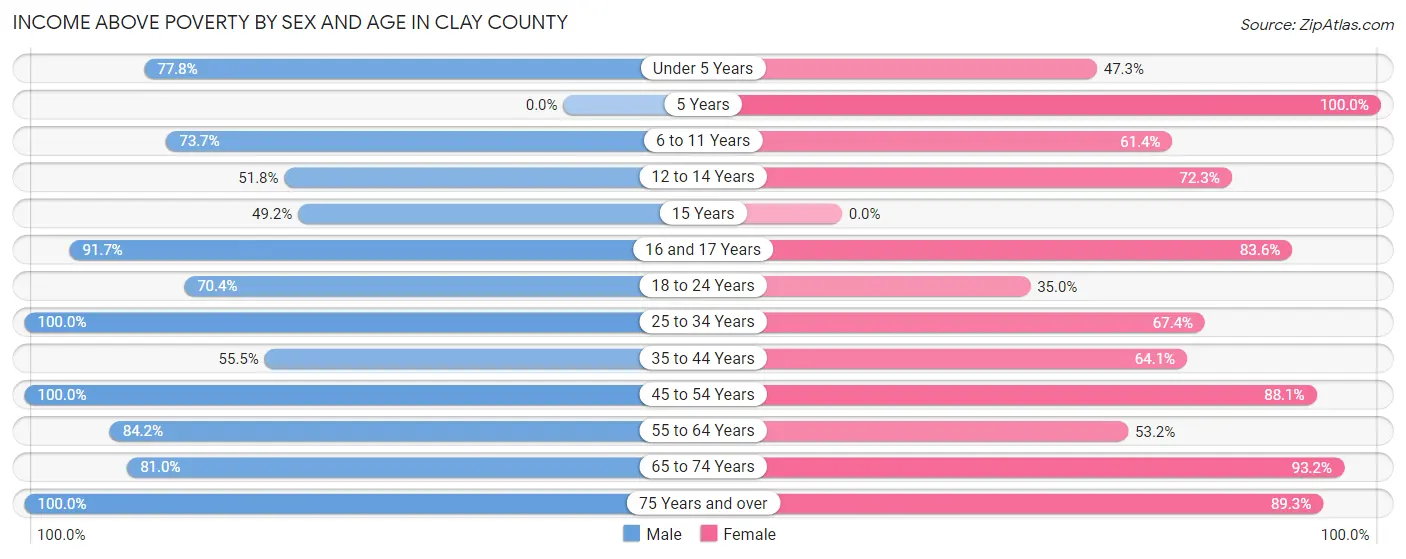
| Age Bracket | Male | Female |
| Under 5 Years | 35 (77.8%) | 62 (47.3%) |
| 5 Years | 0 (0.0%) | 14 (100.0%) |
| 6 to 11 Years | 28 (73.7%) | 54 (61.4%) |
| 12 to 14 Years | 29 (51.8%) | 34 (72.3%) |
| 15 Years | 32 (49.2%) | 0 (0.0%) |
| 16 and 17 Years | 44 (91.7%) | 107 (83.6%) |
| 18 to 24 Years | 57 (70.4%) | 64 (35.0%) |
| 25 to 34 Years | 155 (100.0%) | 62 (67.4%) |
| 35 to 44 Years | 117 (55.4%) | 98 (64.0%) |
| 45 to 54 Years | 99 (100.0%) | 155 (88.1%) |
| 55 to 64 Years | 149 (84.2%) | 76 (53.1%) |
| 65 to 74 Years | 136 (80.9%) | 164 (93.2%) |
| 75 Years and over | 165 (100.0%) | 142 (89.3%) |
| Total | 1,046 (80.0%) | 1,032 (69.3%) |
Income Below Poverty Among Married-Couple Families in Clay County
The poverty statistics for married-couple families in Clay County show that 7.4% or 27 of the total 365 families live below the poverty line. Families with 1 or 2 children have the highest poverty rate of 10.5%, comprising of 6 families. On the other hand, families with 3 or 4 children have the lowest poverty rate of 0.0%, which includes 0 families.
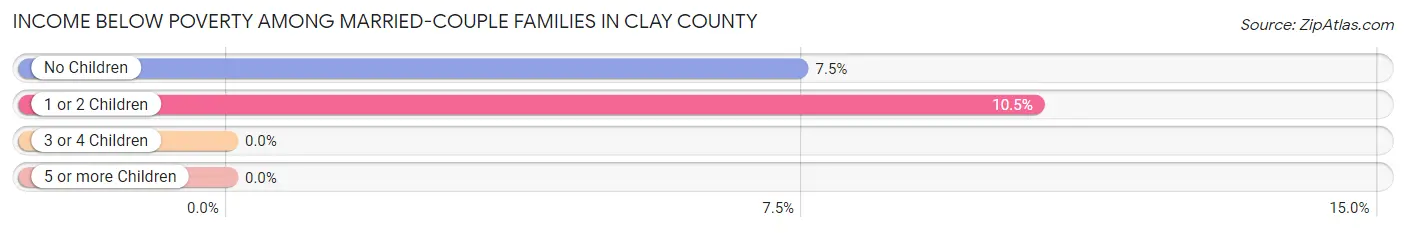
| Children | Above Poverty | Below Poverty |
| No Children | 261 (92.5%) | 21 (7.4%) |
| 1 or 2 Children | 51 (89.5%) | 6 (10.5%) |
| 3 or 4 Children | 26 (100.0%) | 0 (0.0%) |
| 5 or more Children | 0 (0.0%) | 0 (0.0%) |
| Total | 338 (92.6%) | 27 (7.4%) |
Income Below Poverty Among Single-Parent Households in Clay County
According to the poverty data in Clay County, 8.2% or 4 single-father households and 30.7% or 74 single-mother households are living below the poverty line. Among single-father households, those with no children have the highest poverty rate, with 4 households (9.5%) experiencing poverty. Likewise, among single-mother households, those with 5 or more children have the highest poverty rate, with 7 households (100.0%) falling below the poverty line.
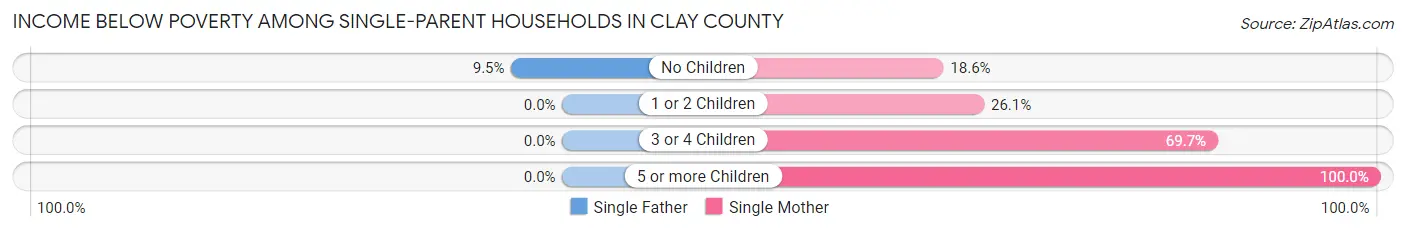
| Children | Single Father | Single Mother |
| No Children | 4 (9.5%) | 21 (18.6%) |
| 1 or 2 Children | 0 (0.0%) | 23 (26.1%) |
| 3 or 4 Children | 0 (0.0%) | 23 (69.7%) |
| 5 or more Children | 0 (0.0%) | 7 (100.0%) |
| Total | 4 (8.2%) | 74 (30.7%) |
Income Below Poverty Among Married-Couple vs Single-Parent Households in Clay County
The poverty data for Clay County shows that 27 of the married-couple family households (7.4%) and 78 of the single-parent households (26.9%) are living below the poverty level. Within the married-couple family households, those with 1 or 2 children have the highest poverty rate, with 6 households (10.5%) falling below the poverty line. Among the single-parent households, those with 5 or more children have the highest poverty rate, with 7 household (100.0%) living below poverty.
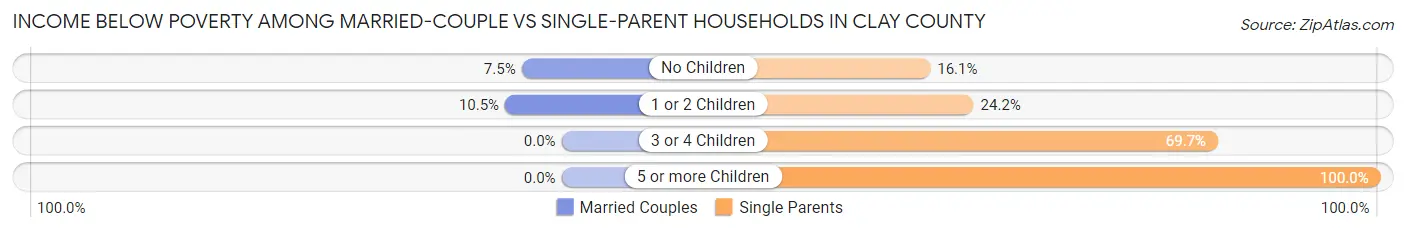
| Children | Married-Couple Families | Single-Parent Households |
| No Children | 21 (7.4%) | 25 (16.1%) |
| 1 or 2 Children | 6 (10.5%) | 23 (24.2%) |
| 3 or 4 Children | 0 (0.0%) | 23 (69.7%) |
| 5 or more Children | 0 (0.0%) | 7 (100.0%) |
| Total | 27 (7.4%) | 78 (26.9%) |
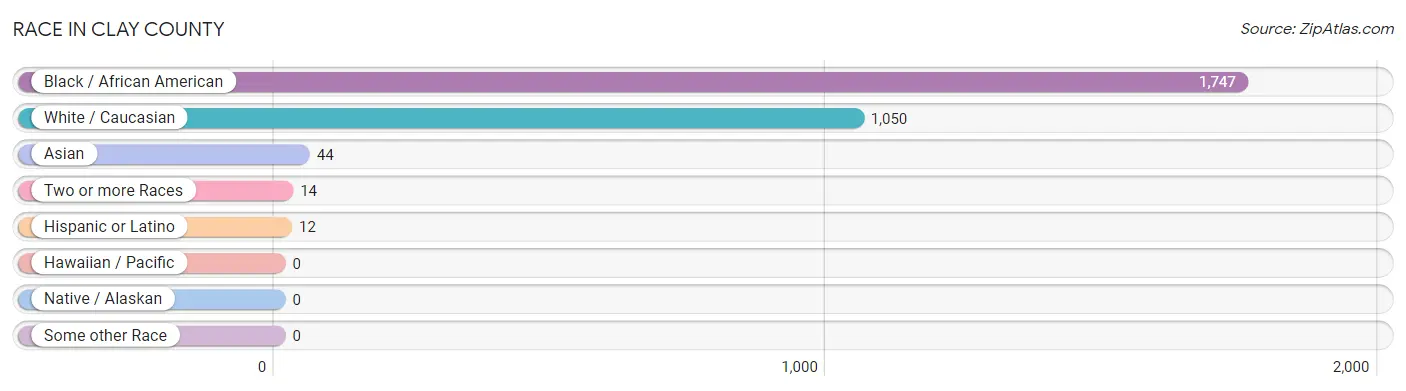
Race in Clay County
The most populous races in Clay County are Black / African American (1,747 | 61.2%), White / Caucasian (1,050 | 36.8%), and Asian (44 | 1.5%).
| Race | # Population | % Population |
| Asian | 44 | 1.5% |
| Black / African American | 1,747 | 61.2% |
| Hawaiian / Pacific | 0 | 0.0% |
| Hispanic or Latino | 12 | 0.4% |
| Native / Alaskan | 0 | 0.0% |
| White / Caucasian | 1,050 | 36.8% |
| Two or more Races | 14 | 0.5% |
| Some other Race | 0 | 0.0% |
| Total | 2,855 | 100.0% |
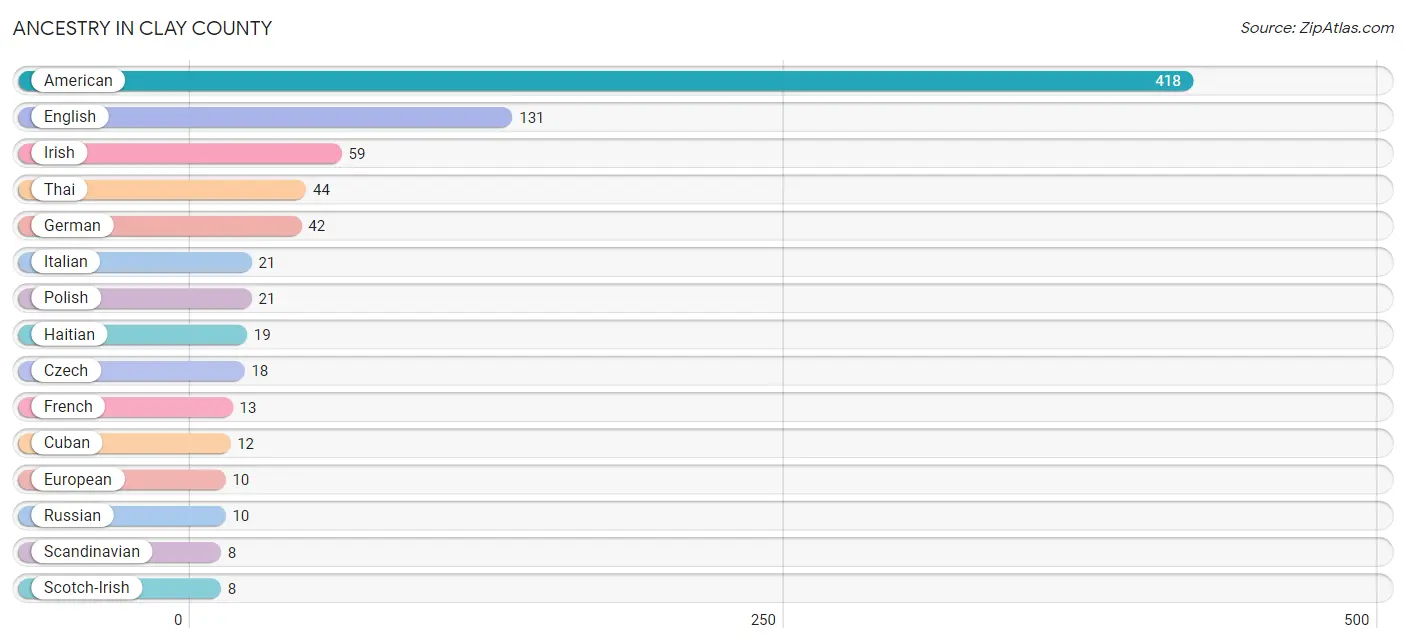
Ancestry in Clay County
The most populous ancestries reported in Clay County are American (418 | 14.6%), English (131 | 4.6%), Irish (59 | 2.1%), Thai (44 | 1.5%), and German (42 | 1.5%), together accounting for 24.3% of all Clay County residents.
| Ancestry | # Population | % Population |
| American | 418 | 14.6% |
| Austrian | 2 | 0.1% |
| British | 4 | 0.1% |
| Cherokee | 1 | 0.0% |
| Cuban | 12 | 0.4% |
| Czech | 18 | 0.6% |
| English | 131 | 4.6% |
| European | 10 | 0.4% |
| French | 13 | 0.5% |
| German | 42 | 1.5% |
| Haitian | 19 | 0.7% |
| Irish | 59 | 2.1% |
| Italian | 21 | 0.7% |
| Polish | 21 | 0.7% |
| Portuguese | 2 | 0.1% |
| Russian | 10 | 0.4% |
| Scandinavian | 8 | 0.3% |
| Scotch-Irish | 8 | 0.3% |
| Scottish | 8 | 0.3% |
| Thai | 44 | 1.5% | View All 20 Rows |
Immigrants in Clay County
The most numerous immigrant groups reported in Clay County came from Caribbean (31 | 1.1%), Latin America (31 | 1.1%), Asia (26 | 0.9%), India (26 | 0.9%), and South Central Asia (26 | 0.9%), together accounting for 4.9% of all Clay County residents.
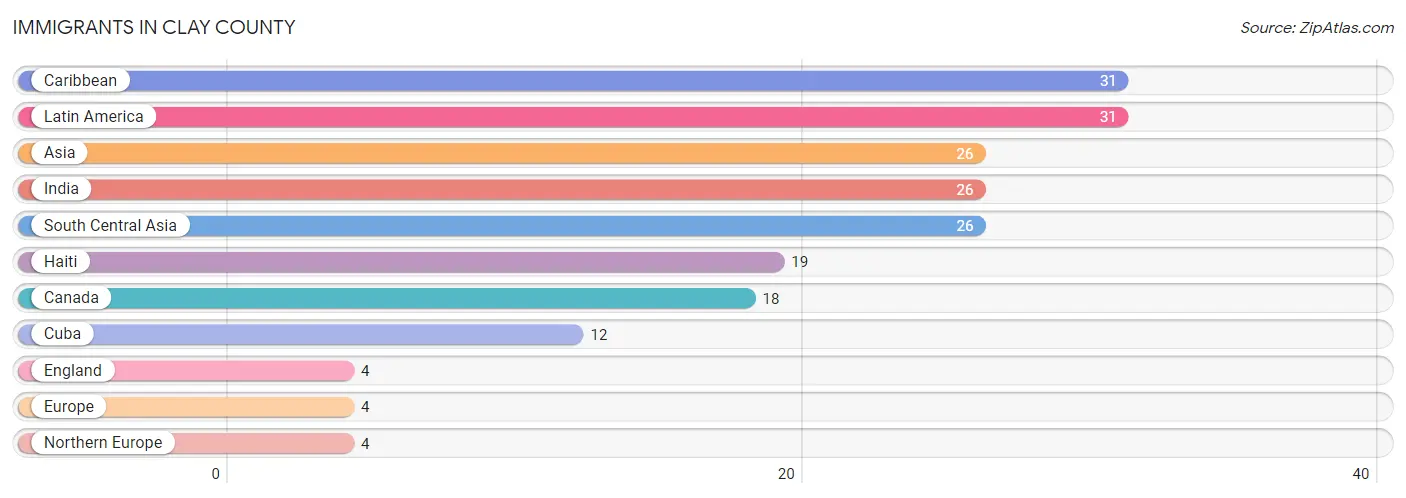
| Immigration Origin | # Population | % Population |
| Asia | 26 | 0.9% |
| Canada | 18 | 0.6% |
| Caribbean | 31 | 1.1% |
| Cuba | 12 | 0.4% |
| England | 4 | 0.1% |
| Europe | 4 | 0.1% |
| Haiti | 19 | 0.7% |
| India | 26 | 0.9% |
| Latin America | 31 | 1.1% |
| Northern Europe | 4 | 0.1% |
| South Central Asia | 26 | 0.9% | View All 11 Rows |
Sex and Age in Clay County
Sex and Age in Clay County
The most populous age groups in Clay County are 40 to 44 Years (168 | 12.6%) for men and 15 to 19 Years (156 | 10.3%) for women.
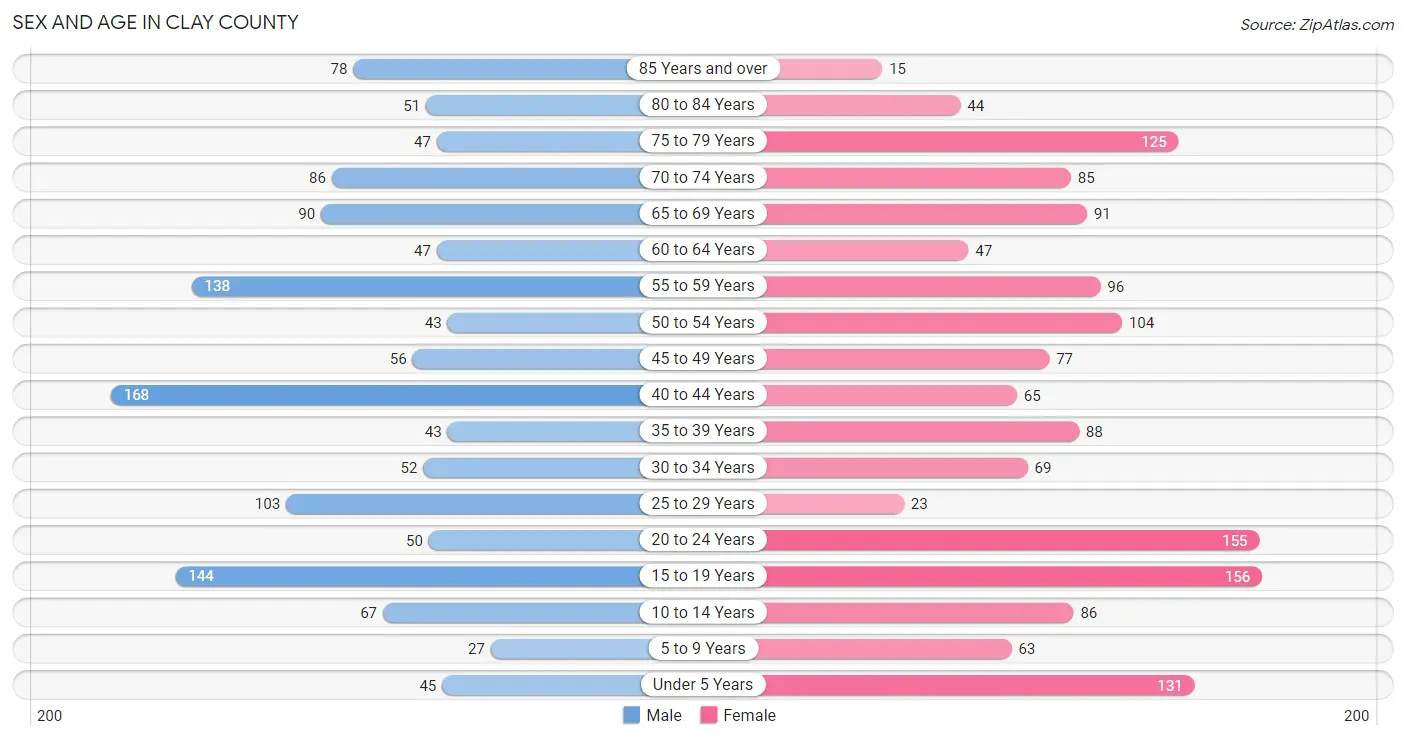
| Age Bracket | Male | Female |
| Under 5 Years | 45 (3.4%) | 131 (8.6%) |
| 5 to 9 Years | 27 (2.0%) | 63 (4.1%) |
| 10 to 14 Years | 67 (5.0%) | 86 (5.7%) |
| 15 to 19 Years | 144 (10.8%) | 156 (10.3%) |
| 20 to 24 Years | 50 (3.7%) | 155 (10.2%) |
| 25 to 29 Years | 103 (7.7%) | 23 (1.5%) |
| 30 to 34 Years | 52 (3.9%) | 69 (4.5%) |
| 35 to 39 Years | 43 (3.2%) | 88 (5.8%) |
| 40 to 44 Years | 168 (12.6%) | 65 (4.3%) |
| 45 to 49 Years | 56 (4.2%) | 77 (5.1%) |
| 50 to 54 Years | 43 (3.2%) | 104 (6.8%) |
| 55 to 59 Years | 138 (10.3%) | 96 (6.3%) |
| 60 to 64 Years | 47 (3.5%) | 47 (3.1%) |
| 65 to 69 Years | 90 (6.7%) | 91 (6.0%) |
| 70 to 74 Years | 86 (6.4%) | 85 (5.6%) |
| 75 to 79 Years | 47 (3.5%) | 125 (8.2%) |
| 80 to 84 Years | 51 (3.8%) | 44 (2.9%) |
| 85 Years and over | 78 (5.8%) | 15 (1.0%) |
| Total | 1,335 (100.0%) | 1,520 (100.0%) |
Families and Households in Clay County
Median Family Size in Clay County
The median family size in Clay County is 3.40 persons per family, with single female/mother families (241 | 36.8%) accounting for the largest median family size of 3.92 persons per family. On the other hand, single male/father families (49 | 7.5%) represent the smallest median family size with 2.31 persons per family.
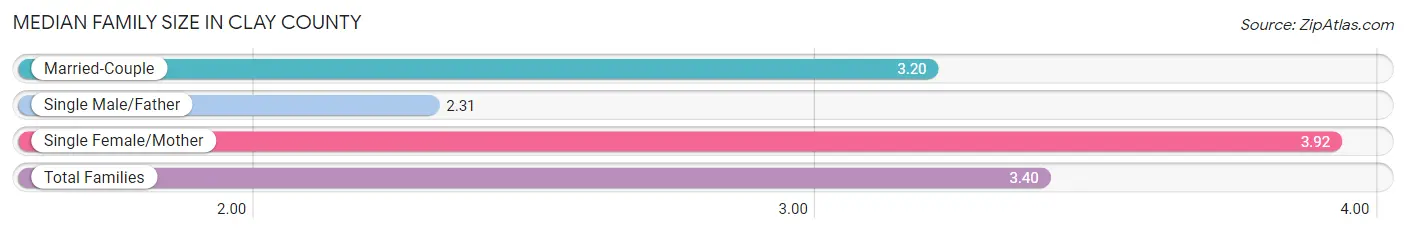
| Family Type | # Families | Family Size |
| Married-Couple | 365 (55.7%) | 3.20 |
| Single Male/Father | 49 (7.5%) | 2.31 |
| Single Female/Mother | 241 (36.8%) | 3.92 |
| Total Families | 655 (100.0%) | 3.40 |
Median Household Size in Clay County
The median household size in Clay County is 2.45 persons per household, with single female/mother households (241 | 21.1%) accounting for the largest median household size of 4.05 persons per household. non-family households (488 | 42.7%) represent the smallest median household size with 1.11 persons per household.
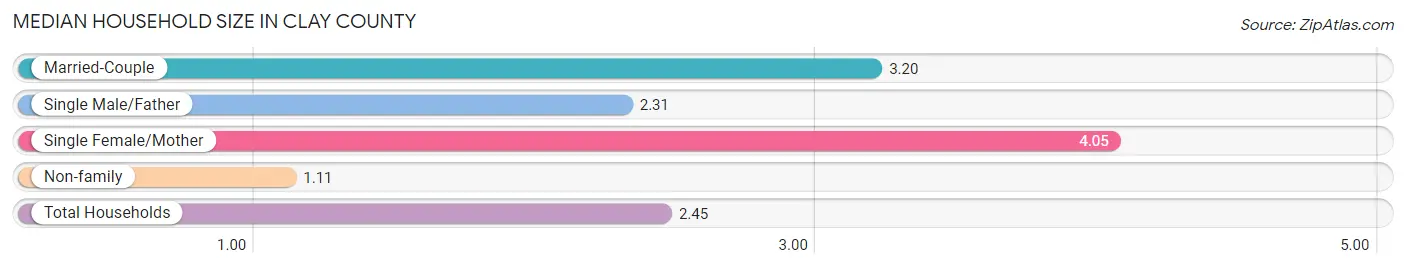
| Household Type | # Households | Household Size |
| Married-Couple | 365 (31.9%) | 3.20 |
| Single Male/Father | 49 (4.3%) | 2.31 |
| Single Female/Mother | 241 (21.1%) | 4.05 |
| Non-family | 488 (42.7%) | 1.11 |
| Total Households | 1,143 (100.0%) | 2.45 |
Household Size by Marriage Status in Clay County
Out of a total of 1,143 households in Clay County, 655 (57.3%) are family households, while 488 (42.7%) are nonfamily households. The most numerous type of family households are 2-person households, comprising 450, and the most common type of nonfamily households are 1-person households, comprising 439.
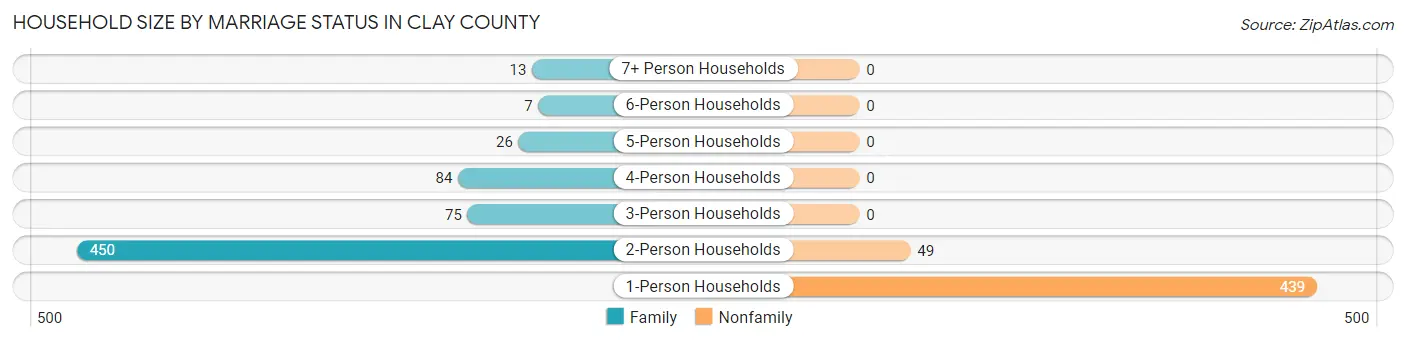
| Household Size | Family Households | Nonfamily Households |
| 1-Person Households | - | 439 (38.4%) |
| 2-Person Households | 450 (39.4%) | 49 (4.3%) |
| 3-Person Households | 75 (6.6%) | 0 (0.0%) |
| 4-Person Households | 84 (7.3%) | 0 (0.0%) |
| 5-Person Households | 26 (2.3%) | 0 (0.0%) |
| 6-Person Households | 7 (0.6%) | 0 (0.0%) |
| 7+ Person Households | 13 (1.1%) | 0 (0.0%) |
| Total | 655 (57.3%) | 488 (42.7%) |
Female Fertility in Clay County
Fertility by Age in Clay County
| Age Bracket | Women with Births | Births / 1,000 Women |
| 15 to 19 years | 0 (0.0%) | 0.0 |
| 20 to 34 years | 0 (0.0%) | 0.0 |
| 35 to 50 years | 0 (0.0%) | 0.0 |
| Total | 0 (0.0%) | 0.0 |
Fertility by Age by Marriage Status in Clay County
| Age Bracket | Married | Unmarried |
| 15 to 19 years | 0 (0.0%) | 0 (0.0%) |
| 20 to 34 years | 0 (0.0%) | 0 (0.0%) |
| 35 to 50 years | 0 (0.0%) | 0 (0.0%) |
| Total | 0 (0.0%) | 0 (0.0%) |
Fertility by Education in Clay County
| Educational Attainment | Women with Births | Births / 1,000 Women |
| Less than High School | 0 (0.0%) | 0.0 |
| High School Diploma | 0 (0.0%) | 0.0 |
| College or Associate's Degree | 0 (0.0%) | 0.0 |
| Bachelor's Degree | 0 (0.0%) | 0.0 |
| Graduate Degree | 0 (0.0%) | 0.0 |
| Total | 0 (0.0%) | 0.0 |
Fertility by Education by Marriage Status in Clay County
| Educational Attainment | Married | Unmarried |
| Less than High School | 0 (0.0%) | 0 (0.0%) |
| High School Diploma | 0 (0.0%) | 0 (0.0%) |
| College or Associate's Degree | 0 (0.0%) | 0 (0.0%) |
| Bachelor's Degree | 0 (0.0%) | 0 (0.0%) |
| Graduate Degree | 0 (0.0%) | 0 (0.0%) |
| Total | 0 (0.0%) | 0 (0.0%) |
Employment Characteristics in Clay County
Employment by Class of Employer in Clay County
Among the 1,101 employed individuals in Clay County, private company employees (826 | 75.0%), local government employees (87 | 7.9%), and state government employees (64 | 5.8%) make up the most common classes of employment.
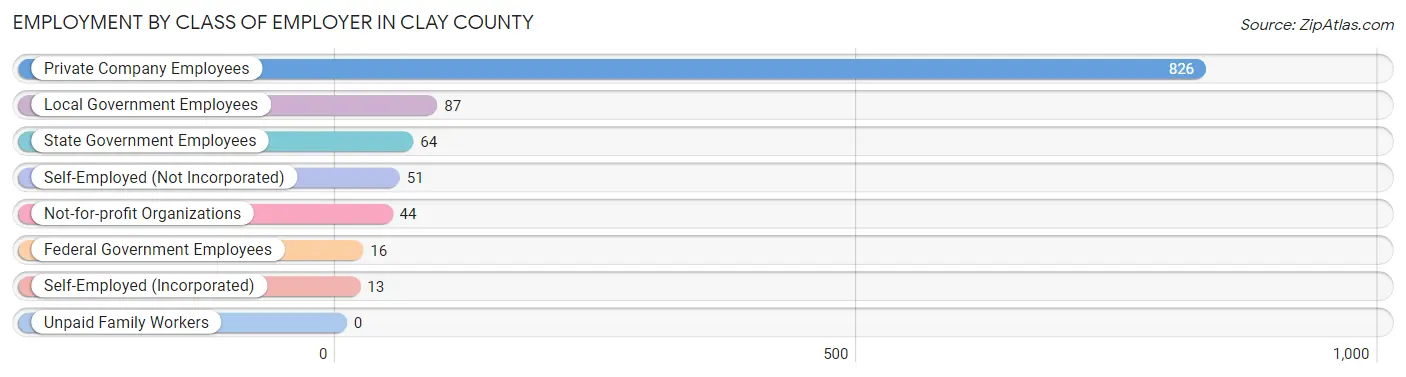
| Employer Class | # Employees | % Employees |
| Private Company Employees | 826 | 75.0% |
| Self-Employed (Incorporated) | 13 | 1.2% |
| Self-Employed (Not Incorporated) | 51 | 4.6% |
| Not-for-profit Organizations | 44 | 4.0% |
| Local Government Employees | 87 | 7.9% |
| State Government Employees | 64 | 5.8% |
| Federal Government Employees | 16 | 1.5% |
| Unpaid Family Workers | 0 | 0.0% |
| Total | 1,101 | 100.0% |
Employment Status by Age in Clay County
According to the labor force statistics for Clay County, out of the total population over 16 years of age (2,371), 49.5% or 1,174 individuals are in the labor force, with 3.5% or 41 of them unemployed. The age group with the highest labor force participation rate is 30 to 34 years, with 94.2% or 114 individuals in the labor force. Within the labor force, the 16 to 19 years age range has the highest percentage of unemployed individuals, with 15.2% or 7 of them being unemployed.
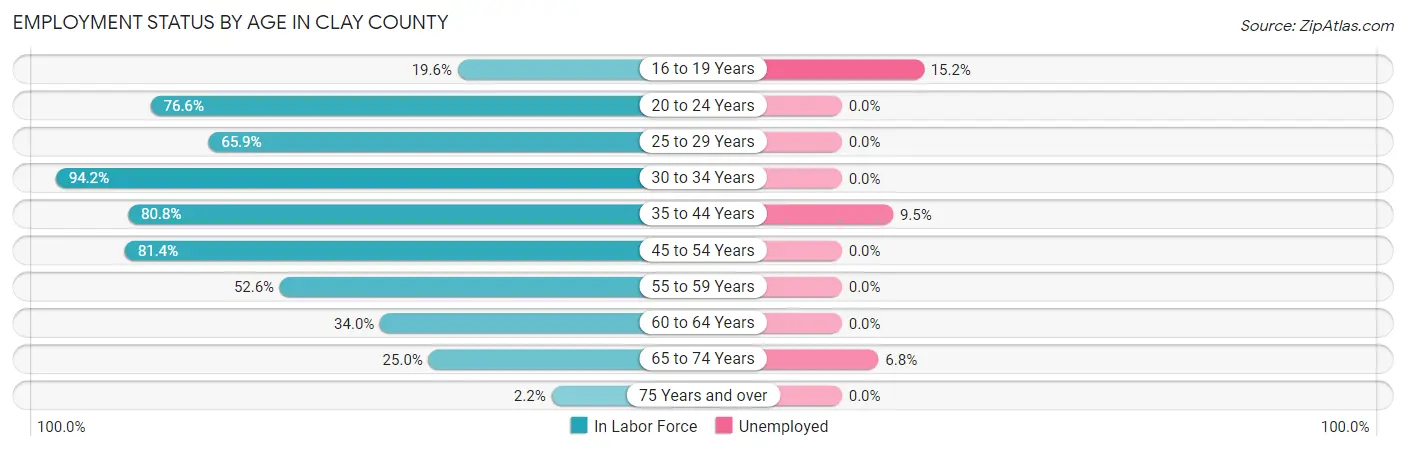
| Age Bracket | In Labor Force | Unemployed |
| 16 to 19 Years | 46 (19.6%) | 7 (15.2%) |
| 20 to 24 Years | 157 (76.6%) | 0 (0.0%) |
| 25 to 29 Years | 83 (65.9%) | 0 (0.0%) |
| 30 to 34 Years | 114 (94.2%) | 0 (0.0%) |
| 35 to 44 Years | 294 (80.8%) | 28 (9.5%) |
| 45 to 54 Years | 228 (81.4%) | 0 (0.0%) |
| 55 to 59 Years | 123 (52.6%) | 0 (0.0%) |
| 60 to 64 Years | 32 (34.0%) | 0 (0.0%) |
| 65 to 74 Years | 88 (25.0%) | 6 (6.8%) |
| 75 Years and over | 8 (2.2%) | 0 (0.0%) |
| Total | 1,174 (49.5%) | 41 (3.5%) |
Employment Status by Educational Attainment in Clay County
According to labor force statistics for Clay County, 71.7% of individuals (874) out of the total population between 25 and 64 years of age (1,219) are in the labor force, with 3.2% or 28 of them being unemployed. The group with the highest labor force participation rate are those with the educational attainment of college / associate degree, with 79.9% or 426 individuals in the labor force. Within the labor force, individuals with less than high school education have the highest percentage of unemployment, with 7.8% or 10 of them being unemployed.
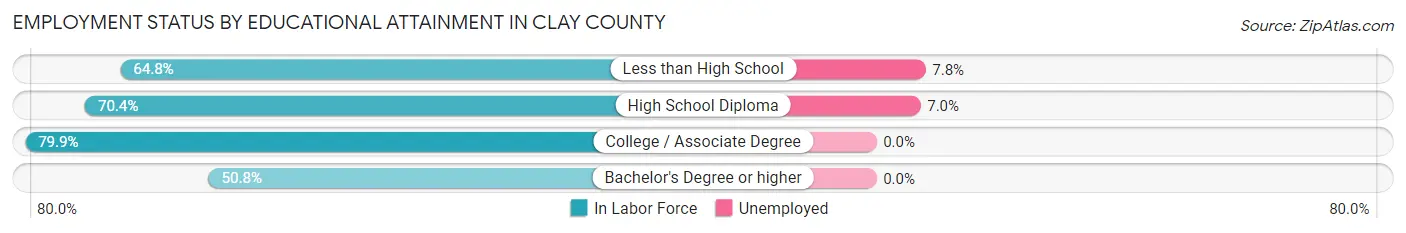
| Educational Attainment | In Labor Force | Unemployed |
| Less than High School | 129 (64.8%) | 16 (7.8%) |
| High School Diploma | 257 (70.4%) | 26 (7.0%) |
| College / Associate Degree | 426 (79.9%) | 0 (0.0%) |
| Bachelor's Degree or higher | 62 (50.8%) | 0 (0.0%) |
| Total | 874 (71.7%) | 39 (3.2%) |
Employment Occupations by Sex in Clay County
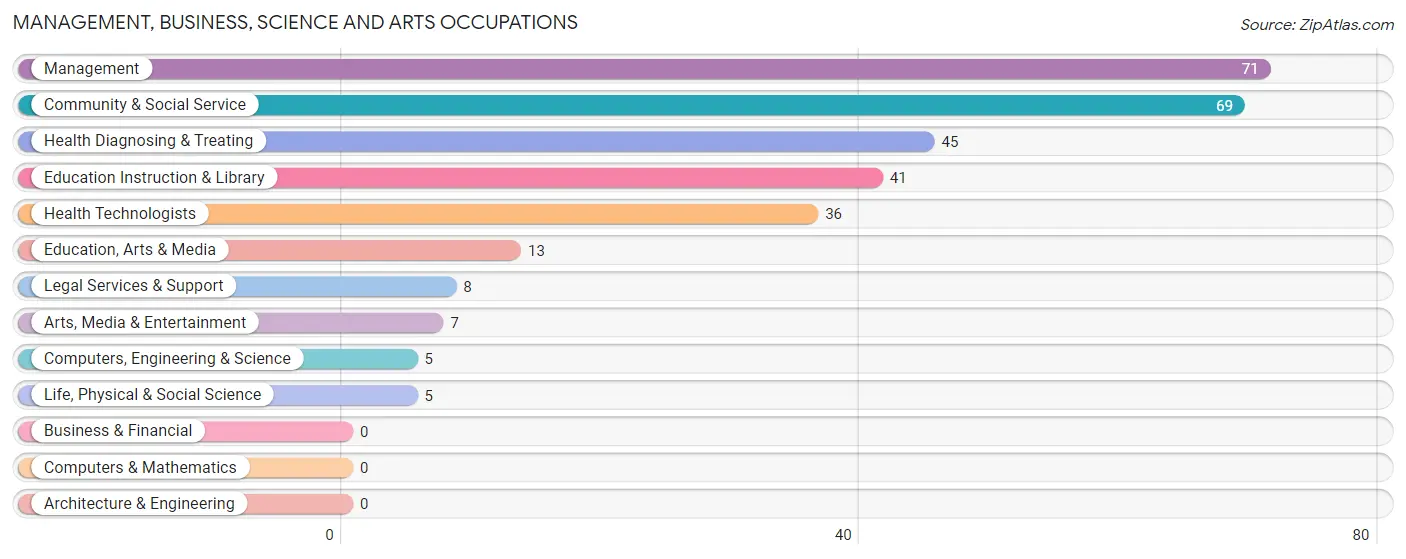
Management, Business, Science and Arts Occupations
The most common Management, Business, Science and Arts occupations in Clay County are Management (71 | 6.3%), Community & Social Service (69 | 6.1%), Health Diagnosing & Treating (45 | 4.0%), Education Instruction & Library (41 | 3.6%), and Health Technologists (36 | 3.2%).
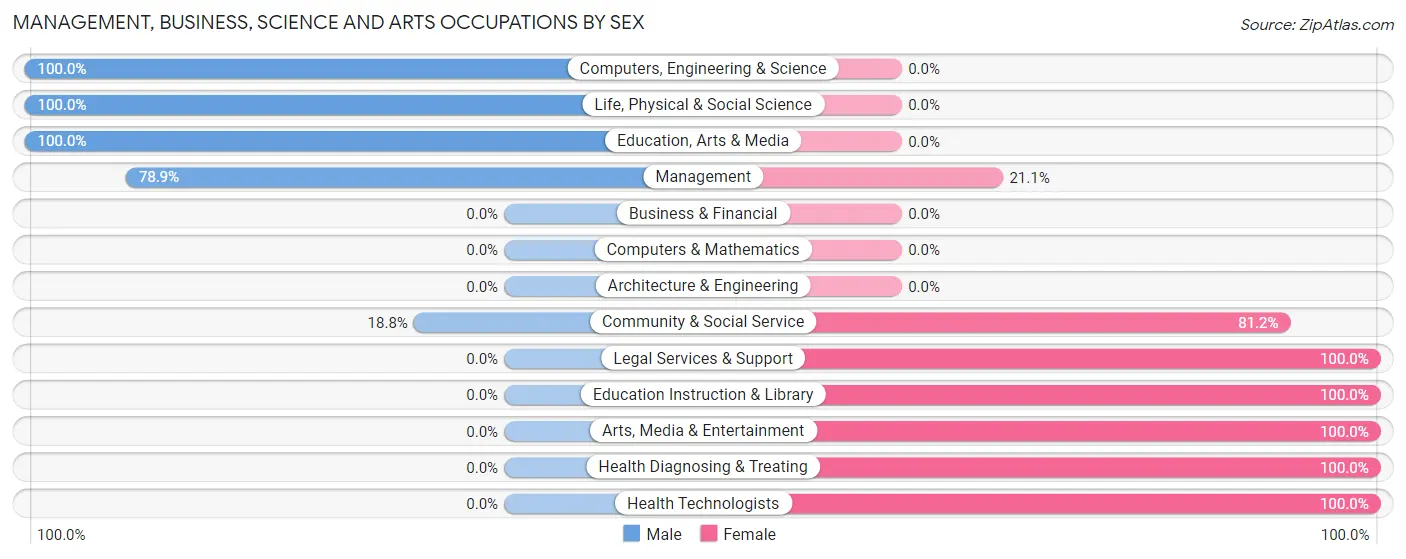
Management, Business, Science and Arts Occupations by Sex
Within the Management, Business, Science and Arts occupations in Clay County, the most male-oriented occupations are Computers, Engineering & Science (100.0%), Life, Physical & Social Science (100.0%), and Education, Arts & Media (100.0%), while the most female-oriented occupations are Legal Services & Support (100.0%), Education Instruction & Library (100.0%), and Arts, Media & Entertainment (100.0%).
| Occupation | Male | Female |
| Management | 56 (78.9%) | 15 (21.1%) |
| Business & Financial | 0 (0.0%) | 0 (0.0%) |
| Computers, Engineering & Science | 5 (100.0%) | 0 (0.0%) |
| Computers & Mathematics | 0 (0.0%) | 0 (0.0%) |
| Architecture & Engineering | 0 (0.0%) | 0 (0.0%) |
| Life, Physical & Social Science | 5 (100.0%) | 0 (0.0%) |
| Community & Social Service | 13 (18.8%) | 56 (81.2%) |
| Education, Arts & Media | 13 (100.0%) | 0 (0.0%) |
| Legal Services & Support | 0 (0.0%) | 8 (100.0%) |
| Education Instruction & Library | 0 (0.0%) | 41 (100.0%) |
| Arts, Media & Entertainment | 0 (0.0%) | 7 (100.0%) |
| Health Diagnosing & Treating | 0 (0.0%) | 45 (100.0%) |
| Health Technologists | 0 (0.0%) | 36 (100.0%) |
| Total (Category) | 74 (39.0%) | 116 (61.1%) |
| Total (Overall) | 597 (52.7%) | 535 (47.3%) |
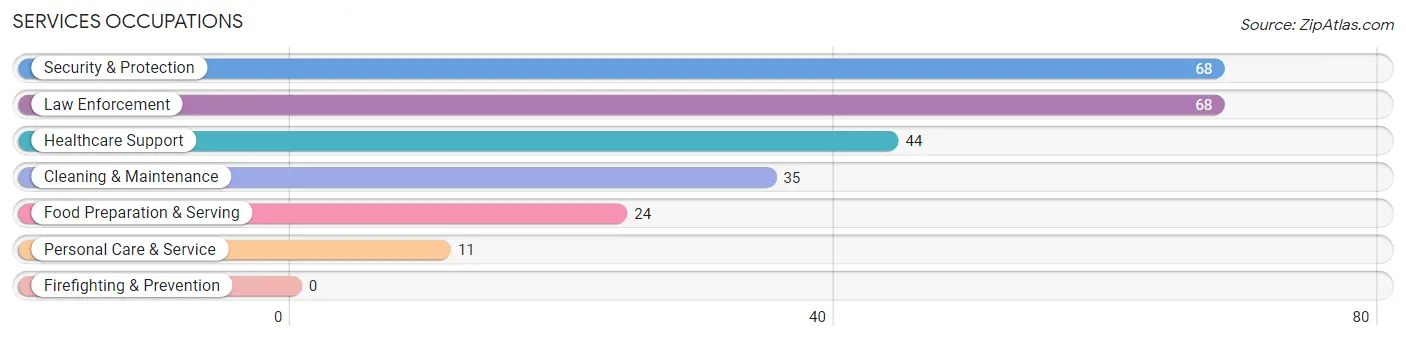
Services Occupations
The most common Services occupations in Clay County are Security & Protection (68 | 6.0%), Law Enforcement (68 | 6.0%), Healthcare Support (44 | 3.9%), Cleaning & Maintenance (35 | 3.1%), and Food Preparation & Serving (24 | 2.1%).
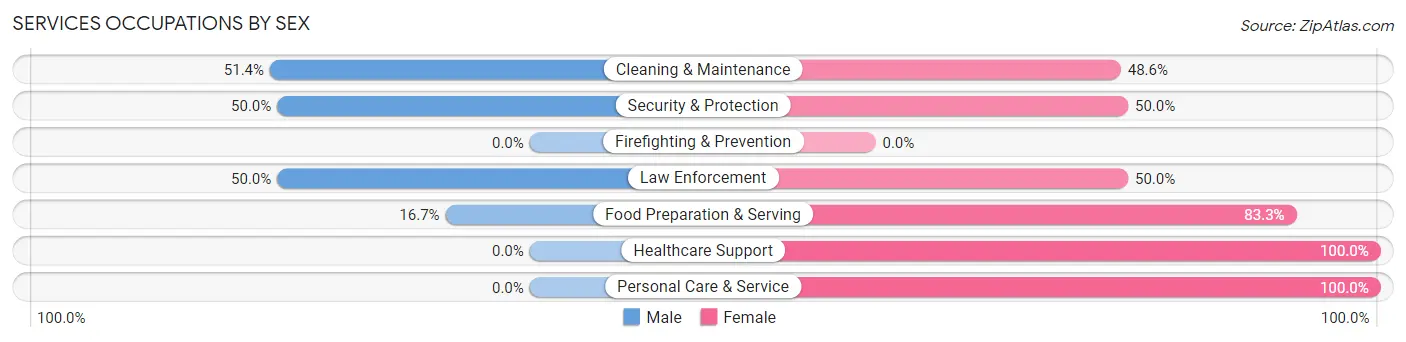
Services Occupations by Sex
Within the Services occupations in Clay County, the most male-oriented occupations are Cleaning & Maintenance (51.4%), Security & Protection (50.0%), and Law Enforcement (50.0%), while the most female-oriented occupations are Healthcare Support (100.0%), Personal Care & Service (100.0%), and Food Preparation & Serving (83.3%).
| Occupation | Male | Female |
| Healthcare Support | 0 (0.0%) | 44 (100.0%) |
| Security & Protection | 34 (50.0%) | 34 (50.0%) |
| Firefighting & Prevention | 0 (0.0%) | 0 (0.0%) |
| Law Enforcement | 34 (50.0%) | 34 (50.0%) |
| Food Preparation & Serving | 4 (16.7%) | 20 (83.3%) |
| Cleaning & Maintenance | 18 (51.4%) | 17 (48.6%) |
| Personal Care & Service | 0 (0.0%) | 11 (100.0%) |
| Total (Category) | 56 (30.8%) | 126 (69.2%) |
| Total (Overall) | 597 (52.7%) | 535 (47.3%) |
Sales and Office Occupations
The most common Sales and Office occupations in Clay County are Sales & Related (110 | 9.7%), and Office & Administration (99 | 8.7%).
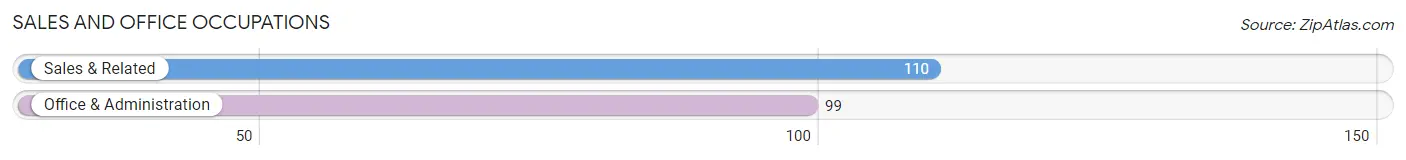
Sales and Office Occupations by Sex
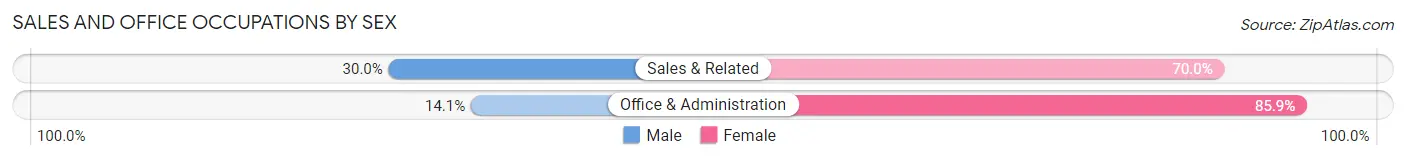
| Occupation | Male | Female |
| Sales & Related | 33 (30.0%) | 77 (70.0%) |
| Office & Administration | 14 (14.1%) | 85 (85.9%) |
| Total (Category) | 47 (22.5%) | 162 (77.5%) |
| Total (Overall) | 597 (52.7%) | 535 (47.3%) |
Natural Resources, Construction and Maintenance Occupations
The most common Natural Resources, Construction and Maintenance occupations in Clay County are Construction & Extraction (93 | 8.2%), Farming, Fishing & Forestry (83 | 7.3%), and Installation, Maintenance & Repair (45 | 4.0%).
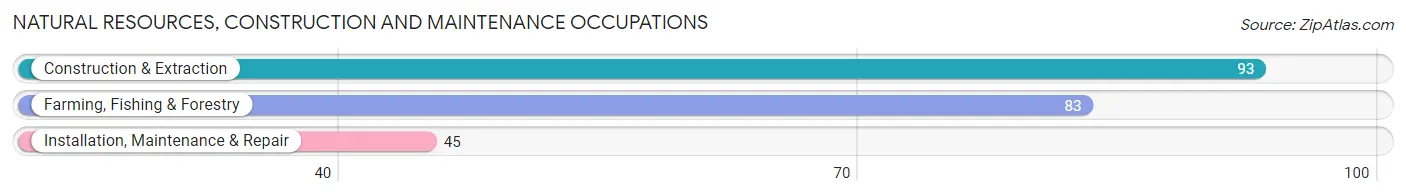
Natural Resources, Construction and Maintenance Occupations by Sex
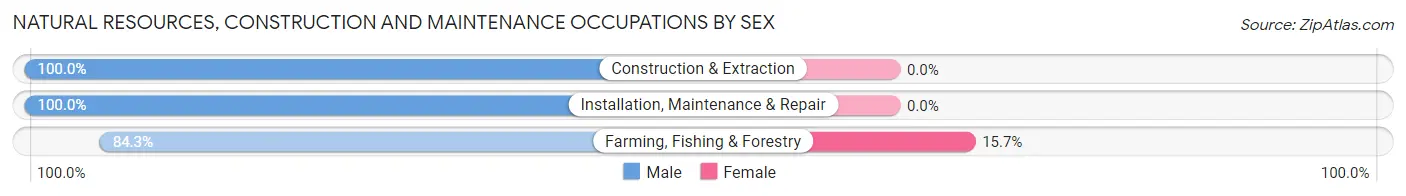
| Occupation | Male | Female |
| Farming, Fishing & Forestry | 70 (84.3%) | 13 (15.7%) |
| Construction & Extraction | 93 (100.0%) | 0 (0.0%) |
| Installation, Maintenance & Repair | 45 (100.0%) | 0 (0.0%) |
| Total (Category) | 208 (94.1%) | 13 (5.9%) |
| Total (Overall) | 597 (52.7%) | 535 (47.3%) |
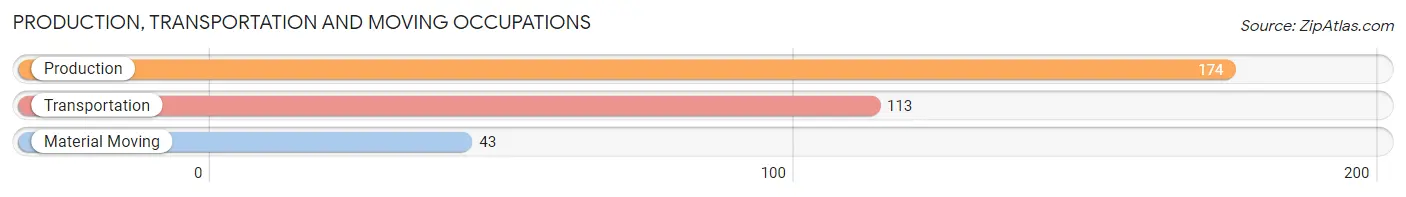
Production, Transportation and Moving Occupations
The most common Production, Transportation and Moving occupations in Clay County are Production (174 | 15.4%), Transportation (113 | 10.0%), and Material Moving (43 | 3.8%).
Production, Transportation and Moving Occupations by Sex
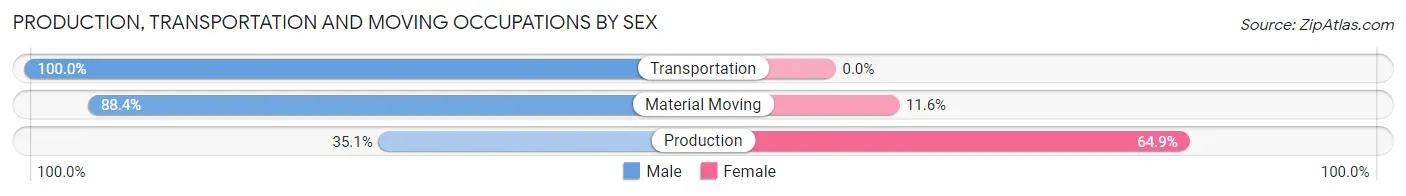
| Occupation | Male | Female |
| Production | 61 (35.1%) | 113 (64.9%) |
| Transportation | 113 (100.0%) | 0 (0.0%) |
| Material Moving | 38 (88.4%) | 5 (11.6%) |
| Total (Category) | 212 (64.2%) | 118 (35.8%) |
| Total (Overall) | 597 (52.7%) | 535 (47.3%) |
Employment Industries by Sex in Clay County
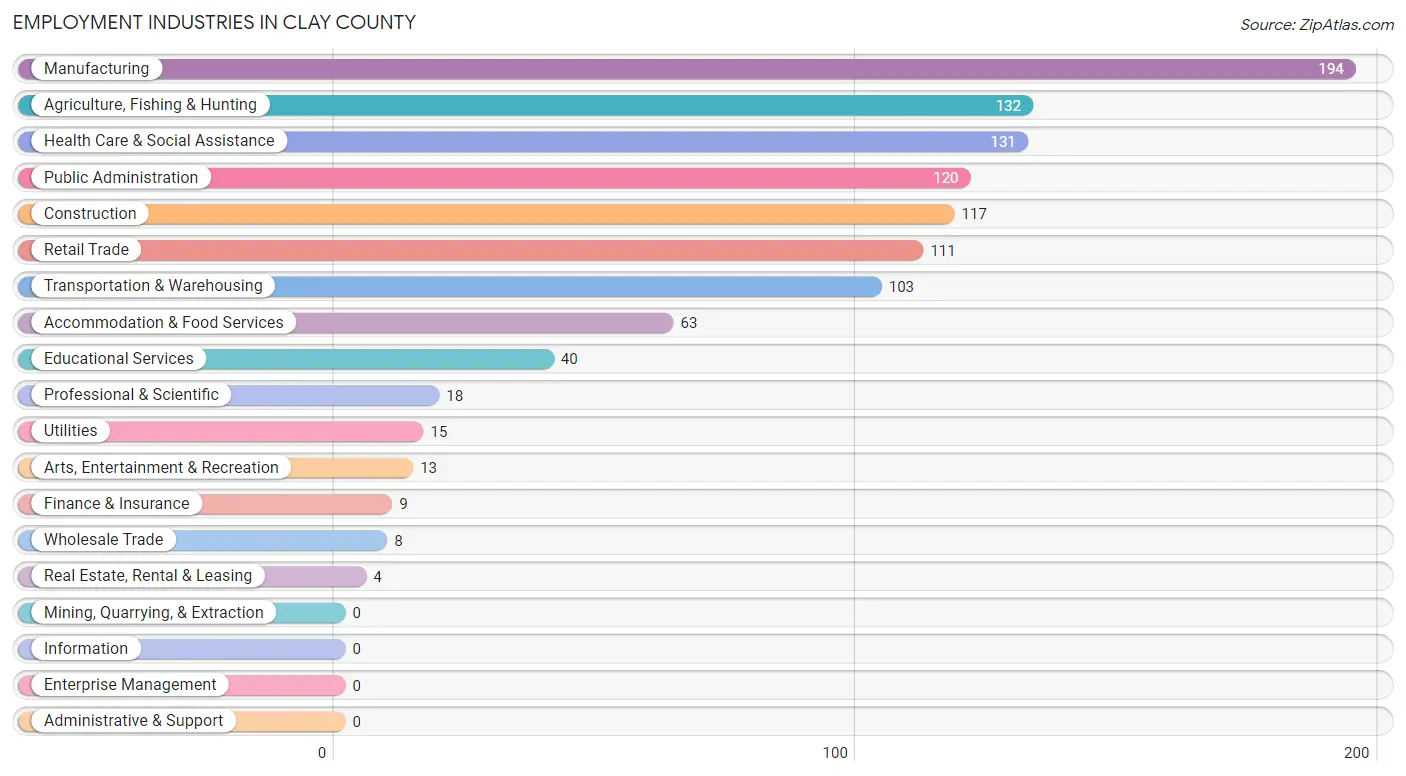
Employment Industries in Clay County
The major employment industries in Clay County include Manufacturing (194 | 17.1%), Agriculture, Fishing & Hunting (132 | 11.7%), Health Care & Social Assistance (131 | 11.6%), Public Administration (120 | 10.6%), and Construction (117 | 10.3%).
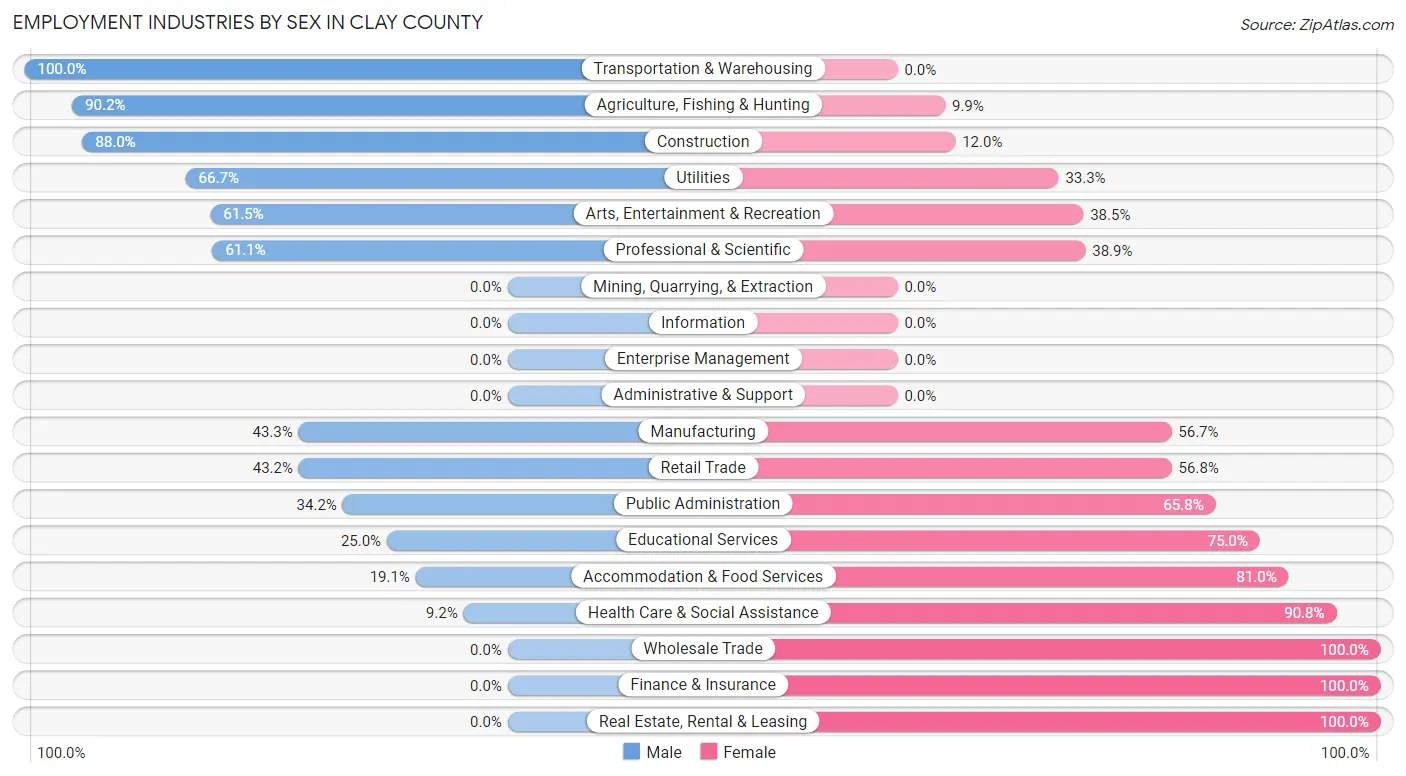
Employment Industries by Sex in Clay County
The Clay County industries that see more men than women are Transportation & Warehousing (100.0%), Agriculture, Fishing & Hunting (90.1%), and Construction (88.0%), whereas the industries that tend to have a higher number of women are Wholesale Trade (100.0%), Finance & Insurance (100.0%), and Real Estate, Rental & Leasing (100.0%).
| Industry | Male | Female |
| Agriculture, Fishing & Hunting | 119 (90.1%) | 13 (9.9%) |
| Mining, Quarrying, & Extraction | 0 (0.0%) | 0 (0.0%) |
| Construction | 103 (88.0%) | 14 (12.0%) |
| Manufacturing | 84 (43.3%) | 110 (56.7%) |
| Wholesale Trade | 0 (0.0%) | 8 (100.0%) |
| Retail Trade | 48 (43.2%) | 63 (56.8%) |
| Transportation & Warehousing | 103 (100.0%) | 0 (0.0%) |
| Utilities | 10 (66.7%) | 5 (33.3%) |
| Information | 0 (0.0%) | 0 (0.0%) |
| Finance & Insurance | 0 (0.0%) | 9 (100.0%) |
| Real Estate, Rental & Leasing | 0 (0.0%) | 4 (100.0%) |
| Professional & Scientific | 11 (61.1%) | 7 (38.9%) |
| Enterprise Management | 0 (0.0%) | 0 (0.0%) |
| Administrative & Support | 0 (0.0%) | 0 (0.0%) |
| Educational Services | 10 (25.0%) | 30 (75.0%) |
| Health Care & Social Assistance | 12 (9.2%) | 119 (90.8%) |
| Arts, Entertainment & Recreation | 8 (61.5%) | 5 (38.5%) |
| Accommodation & Food Services | 12 (19.1%) | 51 (80.9%) |
| Public Administration | 41 (34.2%) | 79 (65.8%) |
| Total | 597 (52.7%) | 535 (47.3%) |
Education in Clay County
School Enrollment in Clay County
The most common levels of schooling among the 731 students in Clay County are high school (288 | 39.4%), college / undergraduate (141 | 19.3%), and elementary school (107 | 14.6%).
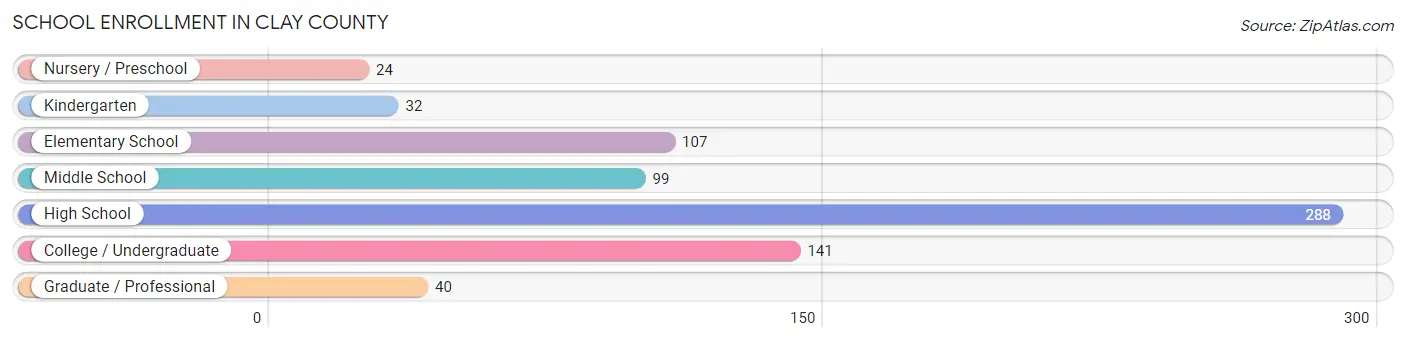
| School Level | # Students | % Students |
| Nursery / Preschool | 24 | 3.3% |
| Kindergarten | 32 | 4.4% |
| Elementary School | 107 | 14.6% |
| Middle School | 99 | 13.5% |
| High School | 288 | 39.4% |
| College / Undergraduate | 141 | 19.3% |
| Graduate / Professional | 40 | 5.5% |
| Total | 731 | 100.0% |
School Enrollment by Age by Funding Source in Clay County
Out of a total of 731 students who are enrolled in schools in Clay County, 51 (7.0%) attend a private institution, while the remaining 680 (93.0%) are enrolled in public schools. The age group of 25 to 34 year olds has the highest likelihood of being enrolled in private schools, with 42 (100.0% in the age bracket) enrolled. Conversely, the age group of 3 to 4 year olds has the lowest likelihood of being enrolled in a private school, with 24 (100.0% in the age bracket) attending a public institution.
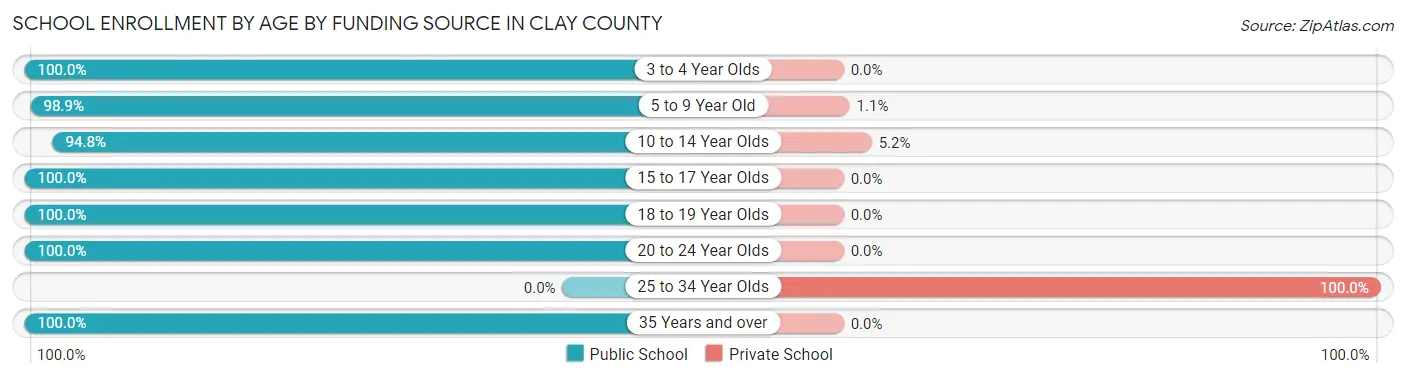
| Age Bracket | Public School | Private School |
| 3 to 4 Year Olds | 24 (100.0%) | 0 (0.0%) |
| 5 to 9 Year Old | 89 (98.9%) | 1 (1.1%) |
| 10 to 14 Year Olds | 145 (94.8%) | 8 (5.2%) |
| 15 to 17 Year Olds | 241 (100.0%) | 0 (0.0%) |
| 18 to 19 Year Olds | 51 (100.0%) | 0 (0.0%) |
| 20 to 24 Year Olds | 99 (100.0%) | 0 (0.0%) |
| 25 to 34 Year Olds | 0 (0.0%) | 42 (100.0%) |
| 35 Years and over | 31 (100.0%) | 0 (0.0%) |
| Total | 680 (93.0%) | 51 (7.0%) |
Educational Attainment by Field of Study in Clay County
Education (112 | 34.9%), business (51 | 15.9%), bio, nature & agricultural (43 | 13.4%), literature & languages (24 | 7.5%), and arts & humanities (22 | 6.9%) are the most common fields of study among 321 individuals in Clay County who have obtained a bachelor's degree or higher.
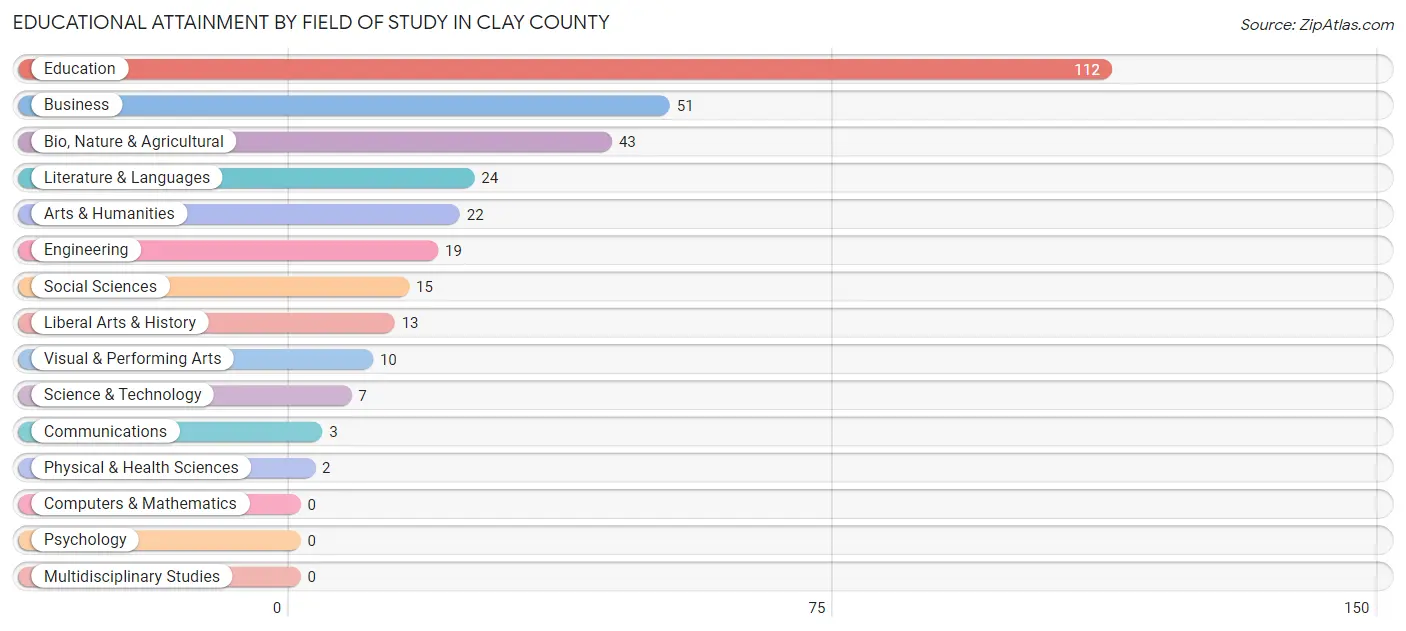
| Field of Study | # Graduates | % Graduates |
| Computers & Mathematics | 0 | 0.0% |
| Bio, Nature & Agricultural | 43 | 13.4% |
| Physical & Health Sciences | 2 | 0.6% |
| Psychology | 0 | 0.0% |
| Social Sciences | 15 | 4.7% |
| Engineering | 19 | 5.9% |
| Multidisciplinary Studies | 0 | 0.0% |
| Science & Technology | 7 | 2.2% |
| Business | 51 | 15.9% |
| Education | 112 | 34.9% |
| Literature & Languages | 24 | 7.5% |
| Liberal Arts & History | 13 | 4.1% |
| Visual & Performing Arts | 10 | 3.1% |
| Communications | 3 | 0.9% |
| Arts & Humanities | 22 | 6.9% |
| Total | 321 | 100.0% |
Transportation & Commute in Clay County
Vehicle Availability by Sex in Clay County
The most prevalent vehicle ownership categories in Clay County are males with 2 vehicles (193, accounting for 32.6%) and females with 2 vehicles (159, making up 37.9%).
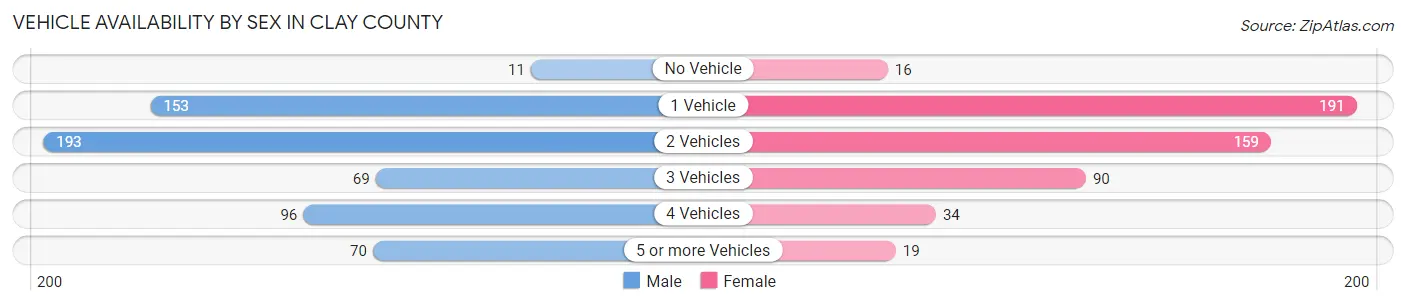
| Vehicles Available | Male | Female |
| No Vehicle | 11 (1.9%) | 16 (3.1%) |
| 1 Vehicle | 153 (25.8%) | 191 (37.5%) |
| 2 Vehicles | 193 (32.6%) | 159 (31.2%) |
| 3 Vehicles | 69 (11.7%) | 90 (17.7%) |
| 4 Vehicles | 96 (16.2%) | 34 (6.7%) |
| 5 or more Vehicles | 70 (11.8%) | 19 (3.7%) |
| Total | 592 (100.0%) | 509 (100.0%) |
Commute Time in Clay County
The most frequently occuring commute durations in Clay County are 10 to 14 minutes (259 commuters, 24.2%), less than 5 minutes (139 commuters, 13.0%), and 15 to 19 minutes (126 commuters, 11.8%).
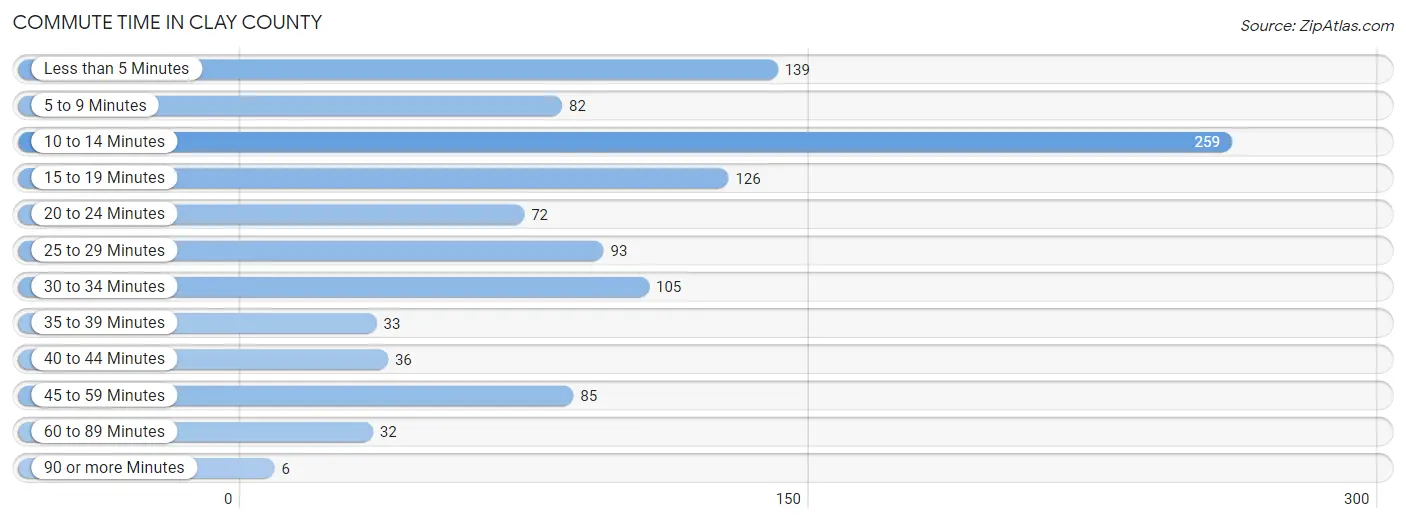
| Commute Time | # Commuters | % Commuters |
| Less than 5 Minutes | 139 | 13.0% |
| 5 to 9 Minutes | 82 | 7.7% |
| 10 to 14 Minutes | 259 | 24.2% |
| 15 to 19 Minutes | 126 | 11.8% |
| 20 to 24 Minutes | 72 | 6.7% |
| 25 to 29 Minutes | 93 | 8.7% |
| 30 to 34 Minutes | 105 | 9.8% |
| 35 to 39 Minutes | 33 | 3.1% |
| 40 to 44 Minutes | 36 | 3.4% |
| 45 to 59 Minutes | 85 | 8.0% |
| 60 to 89 Minutes | 32 | 3.0% |
| 90 or more Minutes | 6 | 0.6% |
Commute Time by Sex in Clay County
The most common commute times in Clay County are 10 to 14 minutes (191 commuters, 34.1%) for males and 15 to 19 minutes (118 commuters, 23.2%) for females.
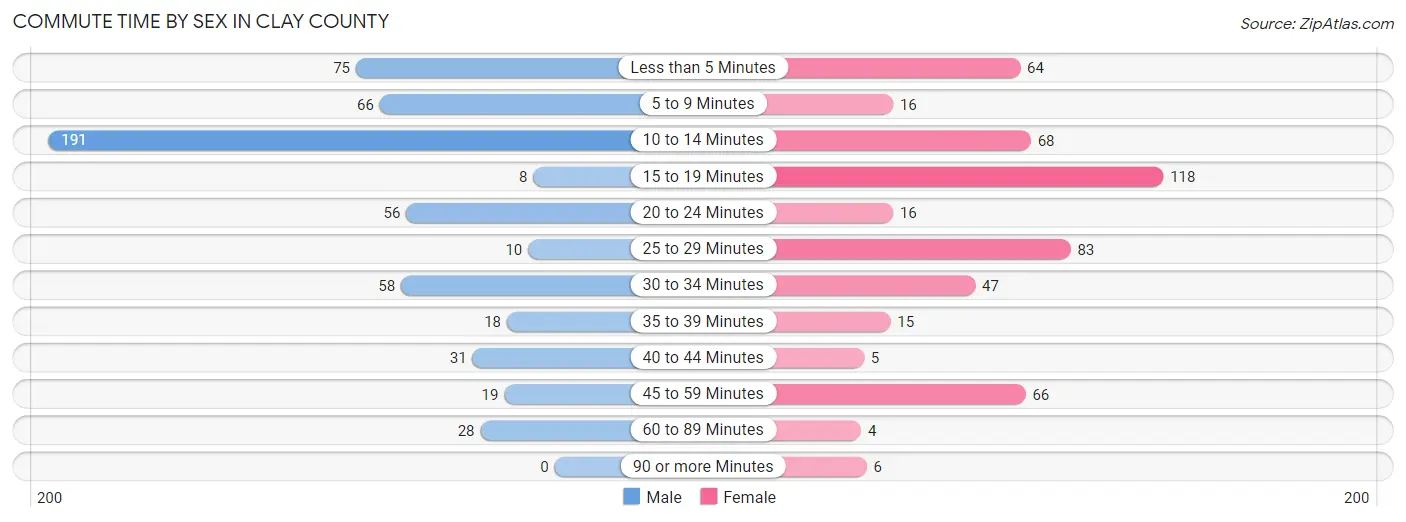
| Commute Time | Male | Female |
| Less than 5 Minutes | 75 (13.4%) | 64 (12.6%) |
| 5 to 9 Minutes | 66 (11.8%) | 16 (3.2%) |
| 10 to 14 Minutes | 191 (34.1%) | 68 (13.4%) |
| 15 to 19 Minutes | 8 (1.4%) | 118 (23.2%) |
| 20 to 24 Minutes | 56 (10.0%) | 16 (3.2%) |
| 25 to 29 Minutes | 10 (1.8%) | 83 (16.3%) |
| 30 to 34 Minutes | 58 (10.4%) | 47 (9.2%) |
| 35 to 39 Minutes | 18 (3.2%) | 15 (2.9%) |
| 40 to 44 Minutes | 31 (5.5%) | 5 (1.0%) |
| 45 to 59 Minutes | 19 (3.4%) | 66 (13.0%) |
| 60 to 89 Minutes | 28 (5.0%) | 4 (0.8%) |
| 90 or more Minutes | 0 (0.0%) | 6 (1.2%) |
Time of Departure to Work by Sex in Clay County
The most frequent times of departure to work in Clay County are 12:00 AM to 4:59 AM (132, 23.6%) for males and 8:00 AM to 8:29 AM (101, 19.9%) for females.
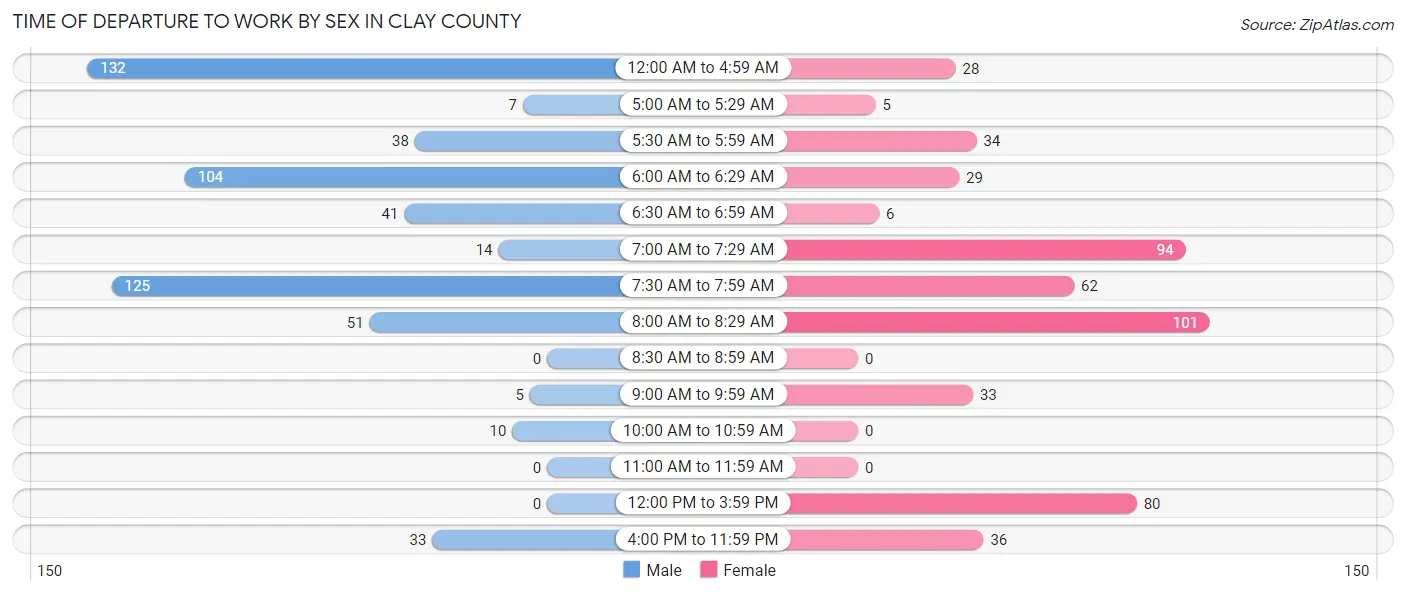
| Time of Departure | Male | Female |
| 12:00 AM to 4:59 AM | 132 (23.6%) | 28 (5.5%) |
| 5:00 AM to 5:29 AM | 7 (1.3%) | 5 (1.0%) |
| 5:30 AM to 5:59 AM | 38 (6.8%) | 34 (6.7%) |
| 6:00 AM to 6:29 AM | 104 (18.6%) | 29 (5.7%) |
| 6:30 AM to 6:59 AM | 41 (7.3%) | 6 (1.2%) |
| 7:00 AM to 7:29 AM | 14 (2.5%) | 94 (18.5%) |
| 7:30 AM to 7:59 AM | 125 (22.3%) | 62 (12.2%) |
| 8:00 AM to 8:29 AM | 51 (9.1%) | 101 (19.9%) |
| 8:30 AM to 8:59 AM | 0 (0.0%) | 0 (0.0%) |
| 9:00 AM to 9:59 AM | 5 (0.9%) | 33 (6.5%) |
| 10:00 AM to 10:59 AM | 10 (1.8%) | 0 (0.0%) |
| 11:00 AM to 11:59 AM | 0 (0.0%) | 0 (0.0%) |
| 12:00 PM to 3:59 PM | 0 (0.0%) | 80 (15.8%) |
| 4:00 PM to 11:59 PM | 33 (5.9%) | 36 (7.1%) |
| Total | 560 (100.0%) | 508 (100.0%) |
Housing Occupancy in Clay County
Occupancy by Ownership in Clay County
Of the total 1,143 dwellings in Clay County, owner-occupied units account for 781 (68.3%), while renter-occupied units make up 362 (31.7%).
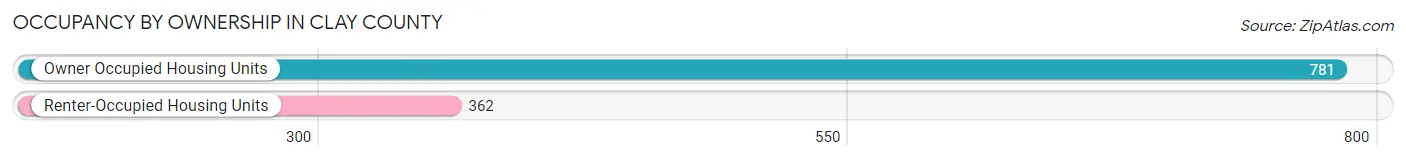
| Occupancy | # Housing Units | % Housing Units |
| Owner Occupied Housing Units | 781 | 68.3% |
| Renter-Occupied Housing Units | 362 | 31.7% |
| Total Occupied Housing Units | 1,143 | 100.0% |
Occupancy by Household Size in Clay County
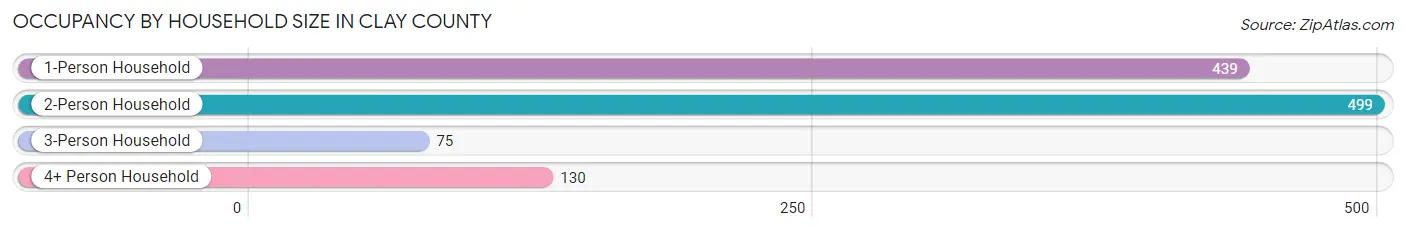
| Household Size | # Housing Units | % Housing Units |
| 1-Person Household | 439 | 38.4% |
| 2-Person Household | 499 | 43.7% |
| 3-Person Household | 75 | 6.6% |
| 4+ Person Household | 130 | 11.4% |
| Total Housing Units | 1,143 | 100.0% |
Occupancy by Ownership by Household Size in Clay County
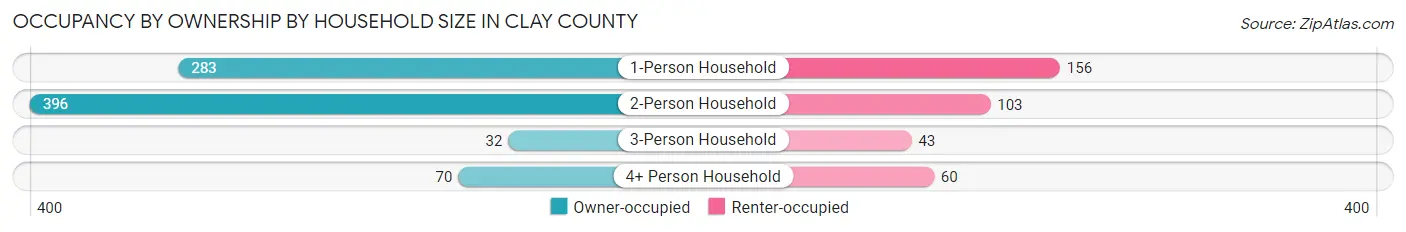
| Household Size | Owner-occupied | Renter-occupied |
| 1-Person Household | 283 (64.5%) | 156 (35.5%) |
| 2-Person Household | 396 (79.4%) | 103 (20.6%) |
| 3-Person Household | 32 (42.7%) | 43 (57.3%) |
| 4+ Person Household | 70 (53.8%) | 60 (46.2%) |
| Total Housing Units | 781 (68.3%) | 362 (31.7%) |
Occupancy by Educational Attainment in Clay County
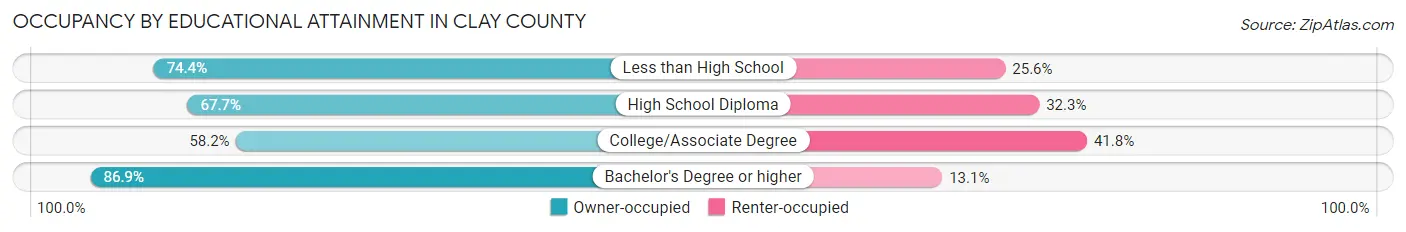
| Household Size | Owner-occupied | Renter-occupied |
| Less than High School | 122 (74.4%) | 42 (25.6%) |
| High School Diploma | 293 (67.7%) | 140 (32.3%) |
| College/Associate Degree | 220 (58.2%) | 158 (41.8%) |
| Bachelor's Degree or higher | 146 (86.9%) | 22 (13.1%) |
Occupancy by Age of Householder in Clay County
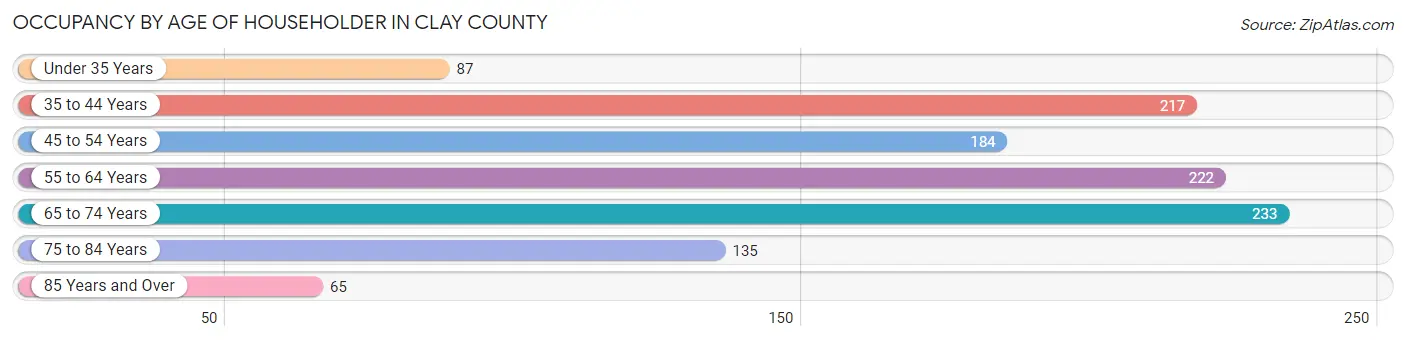
| Age Bracket | # Households | % Households |
| Under 35 Years | 87 | 7.6% |
| 35 to 44 Years | 217 | 19.0% |
| 45 to 54 Years | 184 | 16.1% |
| 55 to 64 Years | 222 | 19.4% |
| 65 to 74 Years | 233 | 20.4% |
| 75 to 84 Years | 135 | 11.8% |
| 85 Years and Over | 65 | 5.7% |
| Total | 1,143 | 100.0% |
Housing Finances in Clay County
Median Income by Occupancy in Clay County
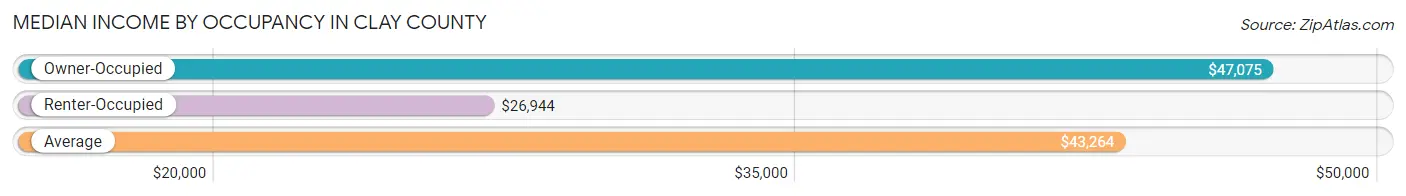
| Occupancy Type | # Households | Median Income |
| Owner-Occupied | 781 (68.3%) | $47,075 |
| Renter-Occupied | 362 (31.7%) | $26,944 |
| Average | 1,143 (100.0%) | $43,264 |
Occupancy by Householder Income Bracket in Clay County
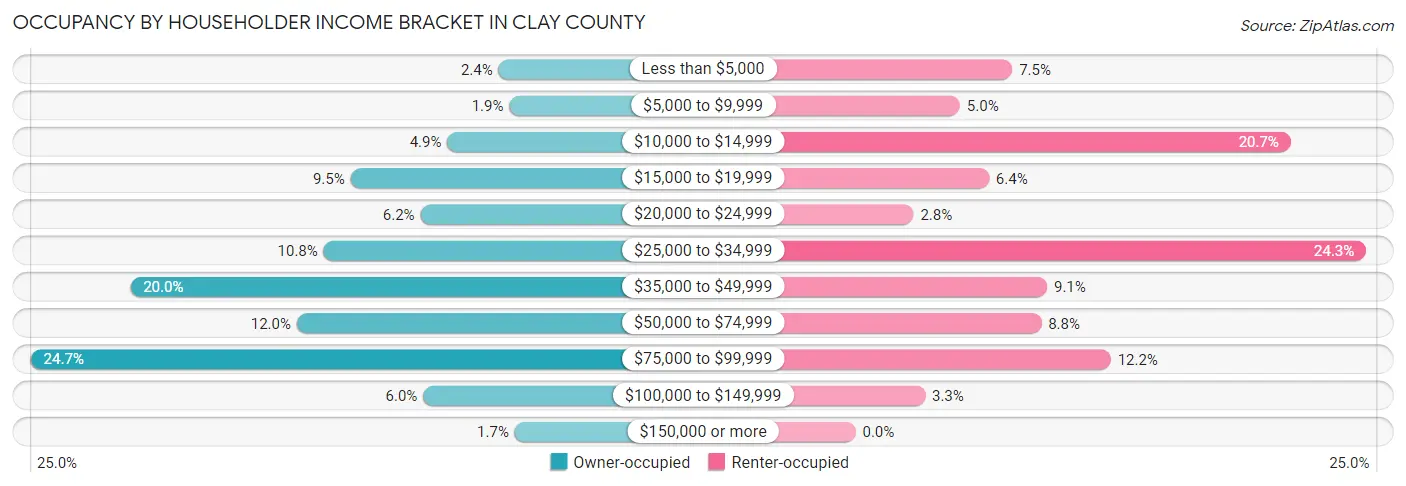
| Income Bracket | Owner-occupied | Renter-occupied |
| Less than $5,000 | 19 (2.4%) | 27 (7.5%) |
| $5,000 to $9,999 | 15 (1.9%) | 18 (5.0%) |
| $10,000 to $14,999 | 38 (4.9%) | 75 (20.7%) |
| $15,000 to $19,999 | 74 (9.5%) | 23 (6.4%) |
| $20,000 to $24,999 | 48 (6.1%) | 10 (2.8%) |
| $25,000 to $34,999 | 84 (10.8%) | 88 (24.3%) |
| $35,000 to $49,999 | 156 (20.0%) | 33 (9.1%) |
| $50,000 to $74,999 | 94 (12.0%) | 32 (8.8%) |
| $75,000 to $99,999 | 193 (24.7%) | 44 (12.1%) |
| $100,000 to $149,999 | 47 (6.0%) | 12 (3.3%) |
| $150,000 or more | 13 (1.7%) | 0 (0.0%) |
| Total | 781 (100.0%) | 362 (100.0%) |
Monthly Housing Cost Tiers in Clay County
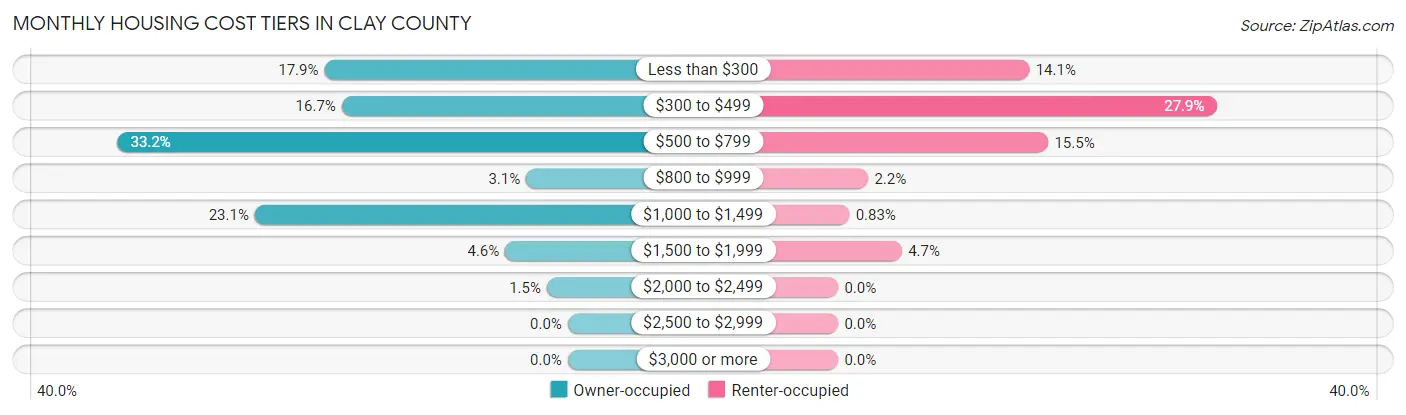
| Monthly Cost | Owner-occupied | Renter-occupied |
| Less than $300 | 140 (17.9%) | 51 (14.1%) |
| $300 to $499 | 130 (16.7%) | 101 (27.9%) |
| $500 to $799 | 259 (33.2%) | 56 (15.5%) |
| $800 to $999 | 24 (3.1%) | 8 (2.2%) |
| $1,000 to $1,499 | 180 (23.1%) | 3 (0.8%) |
| $1,500 to $1,999 | 36 (4.6%) | 17 (4.7%) |
| $2,000 to $2,499 | 12 (1.5%) | 0 (0.0%) |
| $2,500 to $2,999 | 0 (0.0%) | 0 (0.0%) |
| $3,000 or more | 0 (0.0%) | 0 (0.0%) |
| Total | 781 (100.0%) | 362 (100.0%) |
Physical Housing Characteristics in Clay County
Housing Structures in Clay County
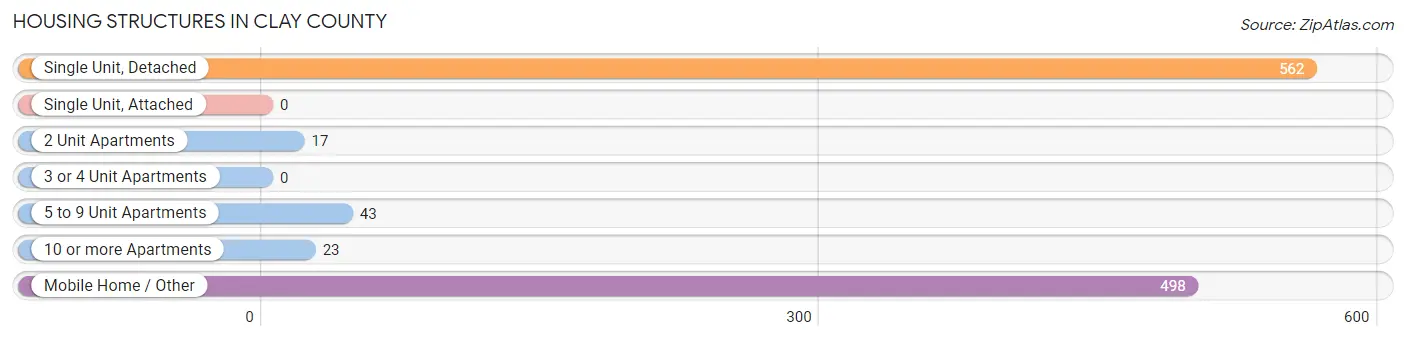
| Structure Type | # Housing Units | % Housing Units |
| Single Unit, Detached | 562 | 49.2% |
| Single Unit, Attached | 0 | 0.0% |
| 2 Unit Apartments | 17 | 1.5% |
| 3 or 4 Unit Apartments | 0 | 0.0% |
| 5 to 9 Unit Apartments | 43 | 3.8% |
| 10 or more Apartments | 23 | 2.0% |
| Mobile Home / Other | 498 | 43.6% |
| Total | 1,143 | 100.0% |
Housing Structures by Occupancy in Clay County
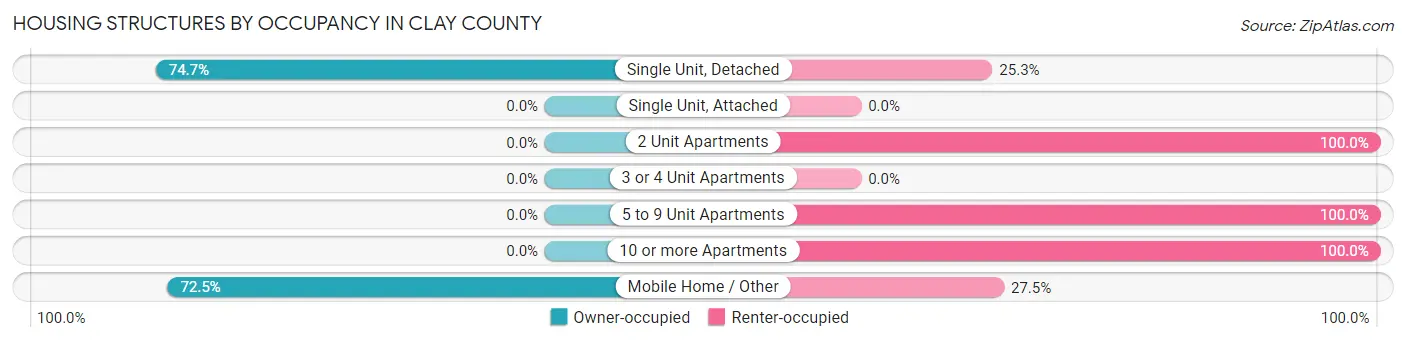
| Structure Type | Owner-occupied | Renter-occupied |
| Single Unit, Detached | 420 (74.7%) | 142 (25.3%) |
| Single Unit, Attached | 0 (0.0%) | 0 (0.0%) |
| 2 Unit Apartments | 0 (0.0%) | 17 (100.0%) |
| 3 or 4 Unit Apartments | 0 (0.0%) | 0 (0.0%) |
| 5 to 9 Unit Apartments | 0 (0.0%) | 43 (100.0%) |
| 10 or more Apartments | 0 (0.0%) | 23 (100.0%) |
| Mobile Home / Other | 361 (72.5%) | 137 (27.5%) |
| Total | 781 (68.3%) | 362 (31.7%) |
Housing Structures by Number of Rooms in Clay County
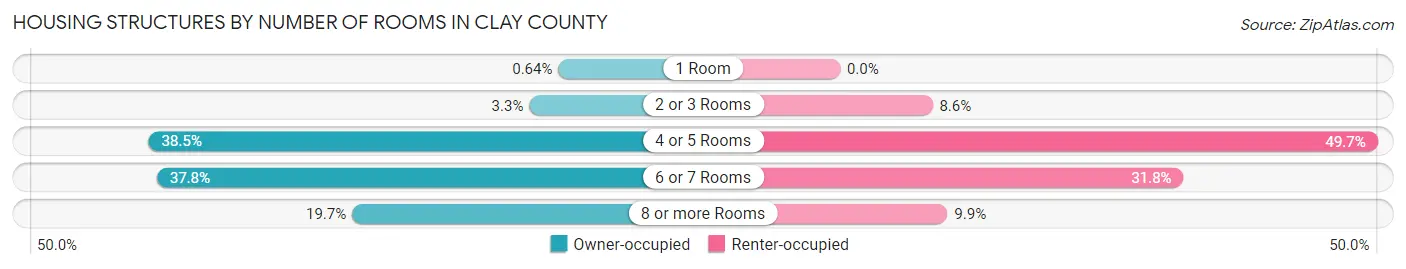
| Number of Rooms | Owner-occupied | Renter-occupied |
| 1 Room | 5 (0.6%) | 0 (0.0%) |
| 2 or 3 Rooms | 26 (3.3%) | 31 (8.6%) |
| 4 or 5 Rooms | 301 (38.5%) | 180 (49.7%) |
| 6 or 7 Rooms | 295 (37.8%) | 115 (31.8%) |
| 8 or more Rooms | 154 (19.7%) | 36 (9.9%) |
| Total | 781 (100.0%) | 362 (100.0%) |
Housing Structure by Heating Type in Clay County
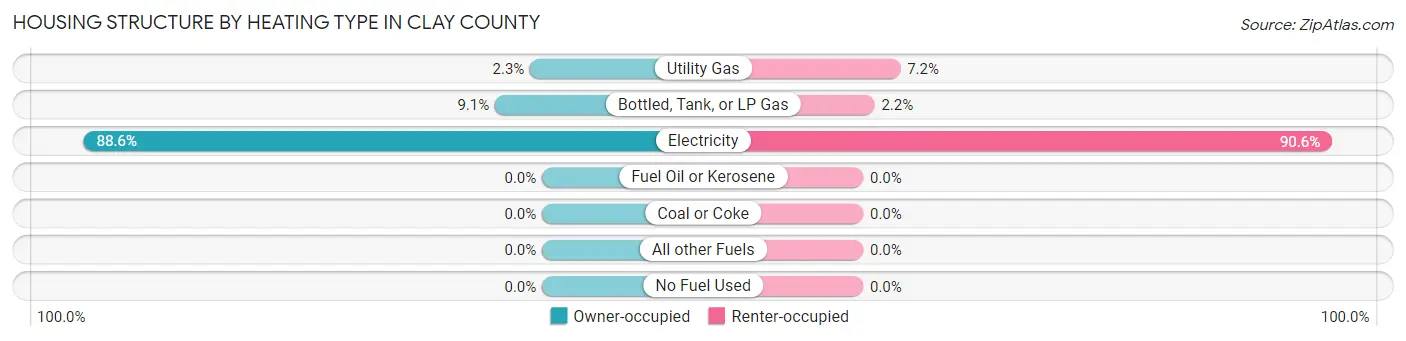
| Heating Type | Owner-occupied | Renter-occupied |
| Utility Gas | 18 (2.3%) | 26 (7.2%) |
| Bottled, Tank, or LP Gas | 71 (9.1%) | 8 (2.2%) |
| Electricity | 692 (88.6%) | 328 (90.6%) |
| Fuel Oil or Kerosene | 0 (0.0%) | 0 (0.0%) |
| Coal or Coke | 0 (0.0%) | 0 (0.0%) |
| All other Fuels | 0 (0.0%) | 0 (0.0%) |
| No Fuel Used | 0 (0.0%) | 0 (0.0%) |
| Total | 781 (100.0%) | 362 (100.0%) |
Household Vehicle Usage in Clay County
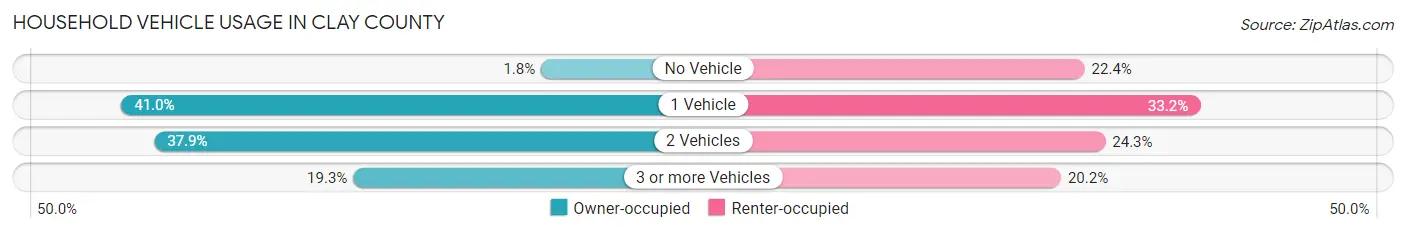
| Vehicles per Household | Owner-occupied | Renter-occupied |
| No Vehicle | 14 (1.8%) | 81 (22.4%) |
| 1 Vehicle | 320 (41.0%) | 120 (33.2%) |
| 2 Vehicles | 296 (37.9%) | 88 (24.3%) |
| 3 or more Vehicles | 151 (19.3%) | 73 (20.2%) |
| Total | 781 (100.0%) | 362 (100.0%) |
Real Estate & Mortgages in Clay County
Real Estate and Mortgage Overview in Clay County
| Characteristic | Without Mortgage | With Mortgage |
| Housing Units | 525 | 256 |
| Median Property Value | $59,800 | $125,000 |
| Median Household Income | $46,224 | $1 |
| Monthly Housing Costs | $487 | $0 |
| Real Estate Taxes | $567 | $0 |
Property Value by Mortgage Status in Clay County
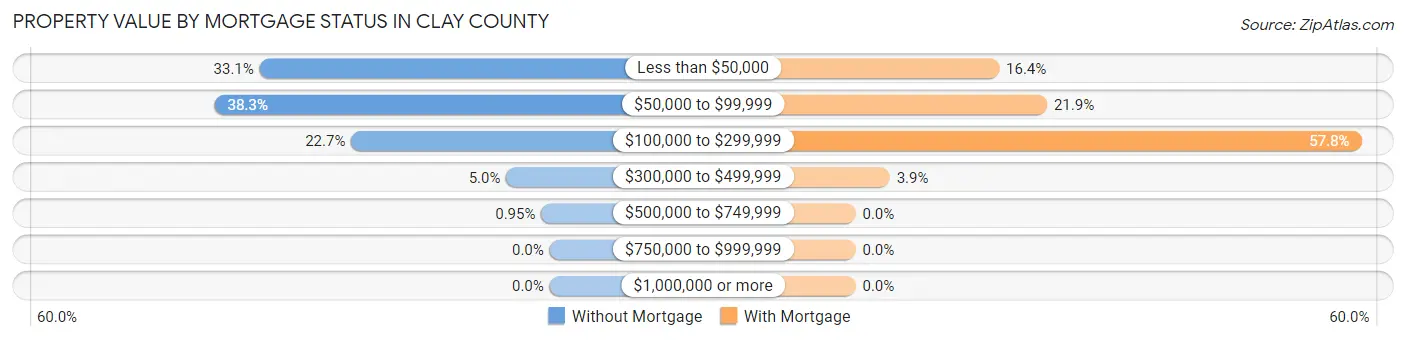
| Property Value | Without Mortgage | With Mortgage |
| Less than $50,000 | 174 (33.1%) | 42 (16.4%) |
| $50,000 to $99,999 | 201 (38.3%) | 56 (21.9%) |
| $100,000 to $299,999 | 119 (22.7%) | 148 (57.8%) |
| $300,000 to $499,999 | 26 (5.0%) | 10 (3.9%) |
| $500,000 to $749,999 | 5 (0.9%) | 0 (0.0%) |
| $750,000 to $999,999 | 0 (0.0%) | 0 (0.0%) |
| $1,000,000 or more | 0 (0.0%) | 0 (0.0%) |
| Total | 525 (100.0%) | 256 (100.0%) |
Household Income by Mortgage Status in Clay County
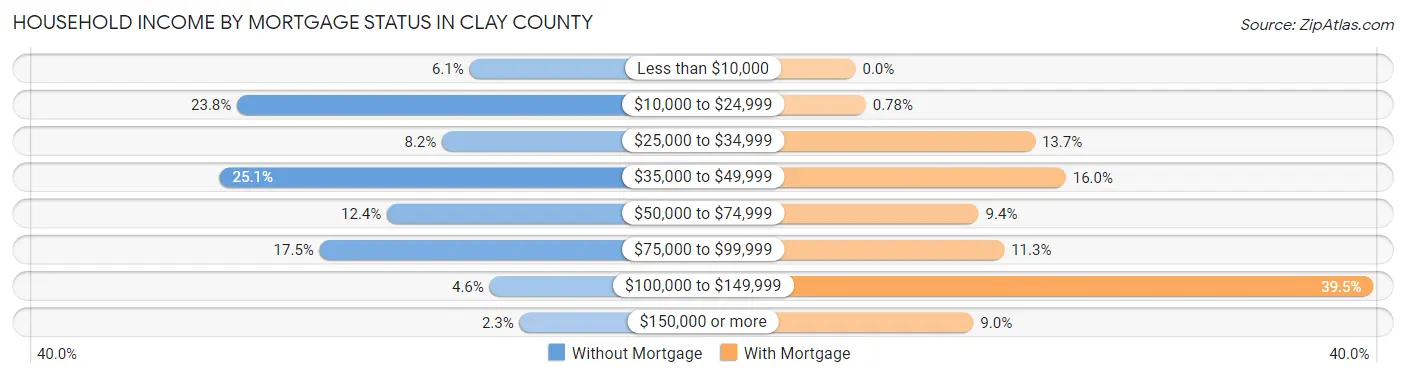
| Household Income | Without Mortgage | With Mortgage |
| Less than $10,000 | 32 (6.1%) | 0 (0.0%) |
| $10,000 to $24,999 | 125 (23.8%) | 2 (0.8%) |
| $25,000 to $34,999 | 43 (8.2%) | 35 (13.7%) |
| $35,000 to $49,999 | 132 (25.1%) | 41 (16.0%) |
| $50,000 to $74,999 | 65 (12.4%) | 24 (9.4%) |
| $75,000 to $99,999 | 92 (17.5%) | 29 (11.3%) |
| $100,000 to $149,999 | 24 (4.6%) | 101 (39.5%) |
| $150,000 or more | 12 (2.3%) | 23 (9.0%) |
| Total | 525 (100.0%) | 256 (100.0%) |
Property Value to Household Income Ratio in Clay County
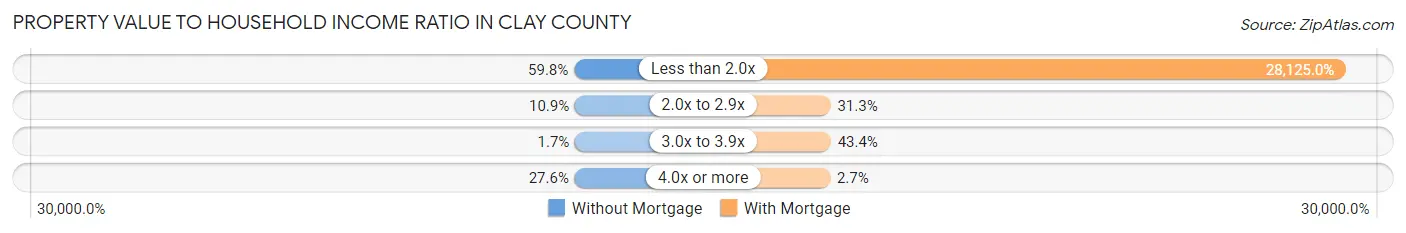
| Value-to-Income Ratio | Without Mortgage | With Mortgage |
| Less than 2.0x | 314 (59.8%) | 72,000 (28,125.0%) |
| 2.0x to 2.9x | 57 (10.9%) | 80 (31.2%) |
| 3.0x to 3.9x | 9 (1.7%) | 111 (43.4%) |
| 4.0x or more | 145 (27.6%) | 7 (2.7%) |
| Total | 525 (100.0%) | 256 (100.0%) |
Real Estate Taxes by Mortgage Status in Clay County

| Property Taxes | Without Mortgage | With Mortgage |
| Less than $800 | 305 (58.1%) | 0 (0.0%) |
| $800 to $1,499 | 67 (12.8%) | 32 (12.5%) |
| $800 to $1,499 | 136 (25.9%) | 109 (42.6%) |
| Total | 525 (100.0%) | 256 (100.0%) |
Health & Disability in Clay County
Health Insurance Coverage by Age in Clay County
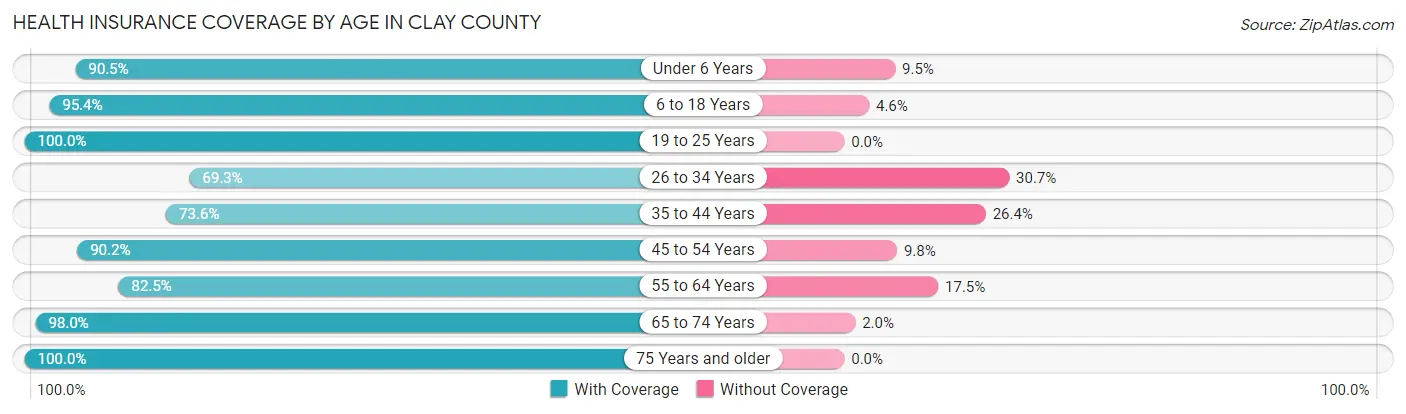
| Age Bracket | With Coverage | Without Coverage |
| Under 6 Years | 172 (90.5%) | 18 (9.5%) |
| 6 to 18 Years | 497 (95.4%) | 24 (4.6%) |
| 19 to 25 Years | 268 (100.0%) | 0 (0.0%) |
| 26 to 34 Years | 133 (69.3%) | 59 (30.7%) |
| 35 to 44 Years | 268 (73.6%) | 96 (26.4%) |
| 45 to 54 Years | 248 (90.2%) | 27 (9.8%) |
| 55 to 64 Years | 264 (82.5%) | 56 (17.5%) |
| 65 to 74 Years | 337 (98.0%) | 7 (2.0%) |
| 75 Years and older | 324 (100.0%) | 0 (0.0%) |
| Total | 2,511 (89.7%) | 287 (10.3%) |
Health Insurance Coverage by Citizenship Status in Clay County
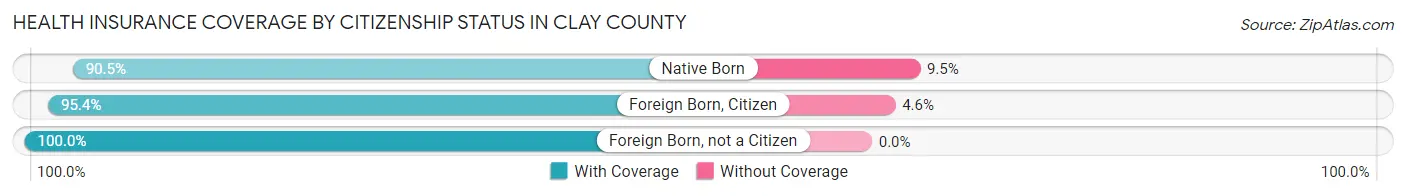
| Citizenship Status | With Coverage | Without Coverage |
| Native Born | 172 (90.5%) | 18 (9.5%) |
| Foreign Born, Citizen | 497 (95.4%) | 24 (4.6%) |
| Foreign Born, not a Citizen | 268 (100.0%) | 0 (0.0%) |
Health Insurance Coverage by Household Income in Clay County
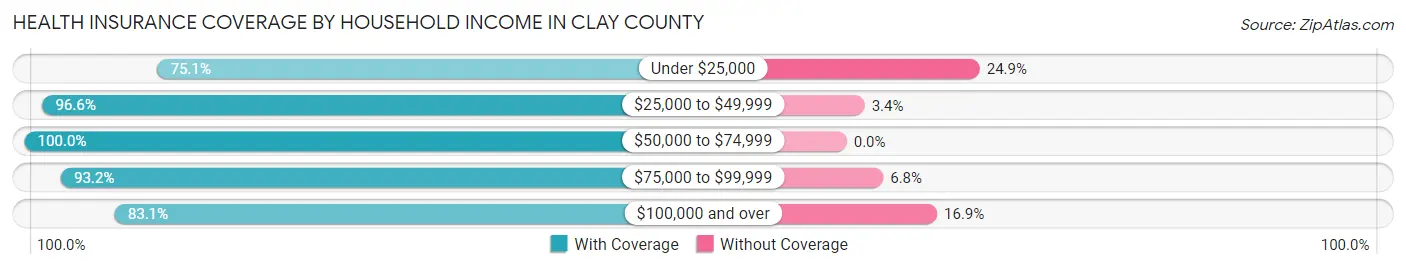
| Household Income | With Coverage | Without Coverage |
| Under $25,000 | 473 (75.1%) | 157 (24.9%) |
| $25,000 to $49,999 | 805 (96.6%) | 28 (3.4%) |
| $50,000 to $74,999 | 323 (100.0%) | 0 (0.0%) |
| $75,000 to $99,999 | 640 (93.2%) | 47 (6.8%) |
| $100,000 and over | 270 (83.1%) | 55 (16.9%) |
Public vs Private Health Insurance Coverage by Age in Clay County
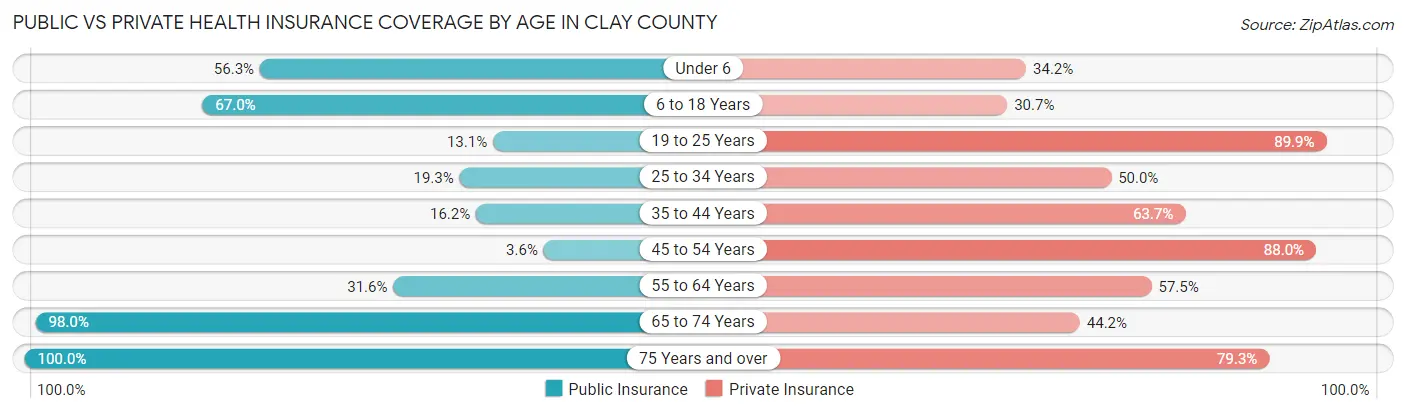
| Age Bracket | Public Insurance | Private Insurance |
| Under 6 | 107 (56.3%) | 65 (34.2%) |
| 6 to 18 Years | 349 (67.0%) | 160 (30.7%) |
| 19 to 25 Years | 35 (13.1%) | 241 (89.9%) |
| 25 to 34 Years | 37 (19.3%) | 96 (50.0%) |
| 35 to 44 Years | 59 (16.2%) | 232 (63.7%) |
| 45 to 54 Years | 10 (3.6%) | 242 (88.0%) |
| 55 to 64 Years | 101 (31.6%) | 184 (57.5%) |
| 65 to 74 Years | 337 (98.0%) | 152 (44.2%) |
| 75 Years and over | 324 (100.0%) | 257 (79.3%) |
| Total | 1,359 (48.6%) | 1,629 (58.2%) |
Disability Status by Sex by Age in Clay County
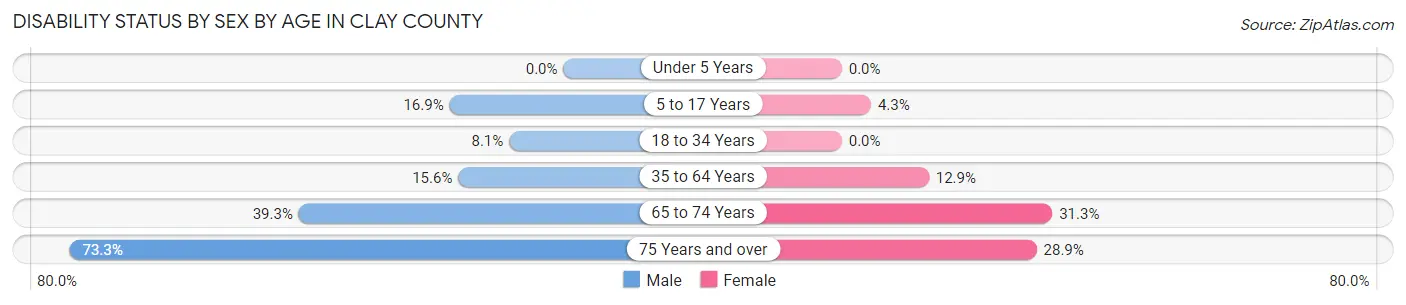
| Age Bracket | Male | Female |
| Under 5 Years | 0 (0.0%) | 0 (0.0%) |
| 5 to 17 Years | 35 (16.9%) | 12 (4.3%) |
| 18 to 34 Years | 19 (8.1%) | 0 (0.0%) |
| 35 to 64 Years | 76 (15.6%) | 61 (12.9%) |
| 65 to 74 Years | 66 (39.3%) | 55 (31.2%) |
| 75 Years and over | 121 (73.3%) | 46 (28.9%) |
Disability Class by Sex by Age in Clay County
Disability Class: Hearing Difficulty
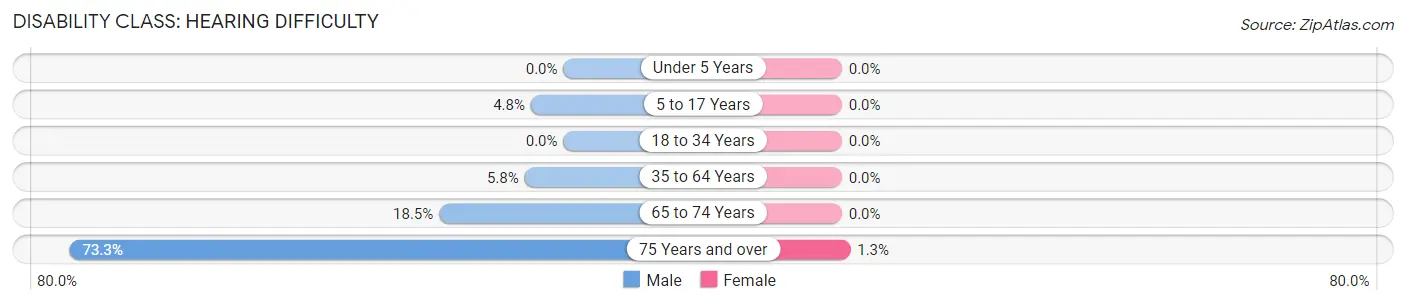
| Age Bracket | Male | Female |
| Under 5 Years | 0 (0.0%) | 0 (0.0%) |
| 5 to 17 Years | 10 (4.8%) | 0 (0.0%) |
| 18 to 34 Years | 0 (0.0%) | 0 (0.0%) |
| 35 to 64 Years | 28 (5.8%) | 0 (0.0%) |
| 65 to 74 Years | 31 (18.4%) | 0 (0.0%) |
| 75 Years and over | 121 (73.3%) | 2 (1.3%) |
Disability Class: Vision Difficulty
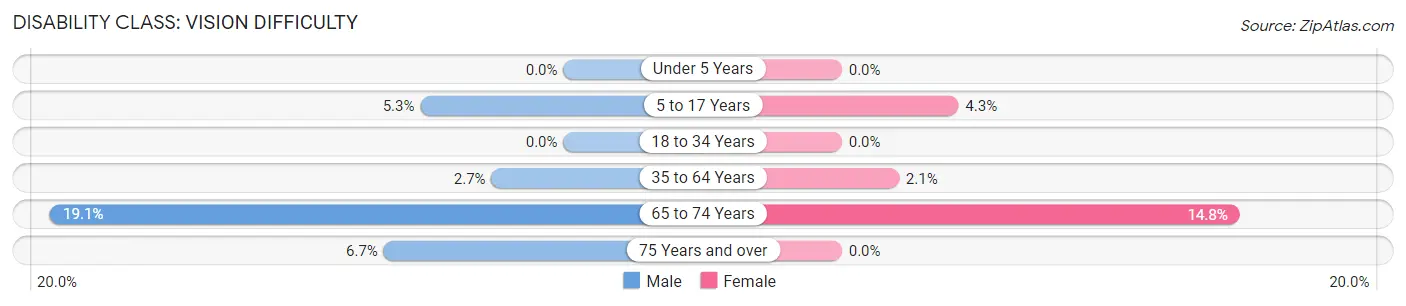
| Age Bracket | Male | Female |
| Under 5 Years | 0 (0.0%) | 0 (0.0%) |
| 5 to 17 Years | 11 (5.3%) | 12 (4.3%) |
| 18 to 34 Years | 0 (0.0%) | 0 (0.0%) |
| 35 to 64 Years | 13 (2.7%) | 10 (2.1%) |
| 65 to 74 Years | 32 (19.1%) | 26 (14.8%) |
| 75 Years and over | 11 (6.7%) | 0 (0.0%) |
Disability Class: Cognitive Difficulty
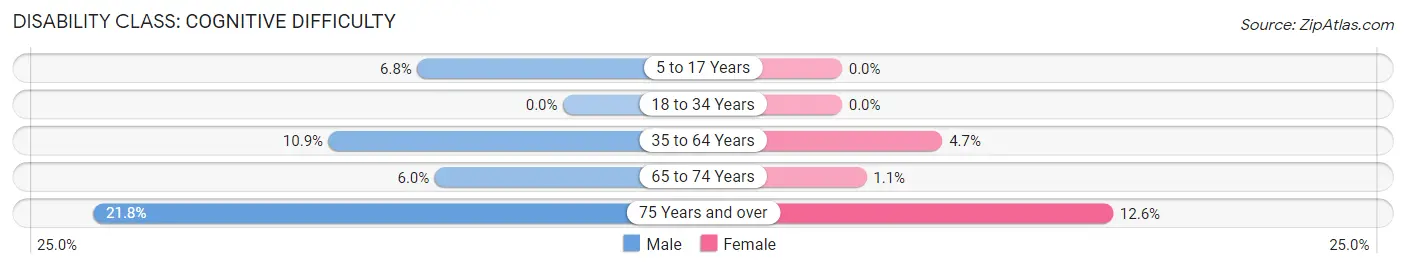
| Age Bracket | Male | Female |
| 5 to 17 Years | 14 (6.8%) | 0 (0.0%) |
| 18 to 34 Years | 0 (0.0%) | 0 (0.0%) |
| 35 to 64 Years | 53 (10.9%) | 22 (4.7%) |
| 65 to 74 Years | 10 (5.9%) | 2 (1.1%) |
| 75 Years and over | 36 (21.8%) | 20 (12.6%) |
Disability Class: Ambulatory Difficulty
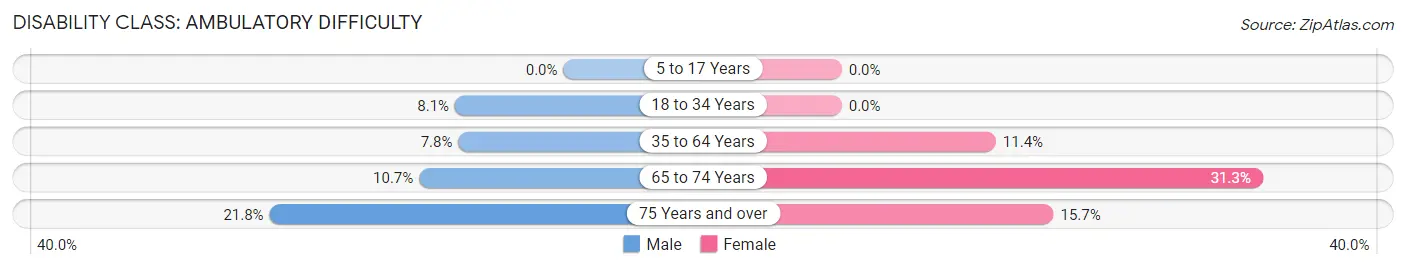
| Age Bracket | Male | Female |
| 5 to 17 Years | 0 (0.0%) | 0 (0.0%) |
| 18 to 34 Years | 19 (8.1%) | 0 (0.0%) |
| 35 to 64 Years | 38 (7.8%) | 54 (11.4%) |
| 65 to 74 Years | 18 (10.7%) | 55 (31.2%) |
| 75 Years and over | 36 (21.8%) | 25 (15.7%) |
Disability Class: Self-Care Difficulty
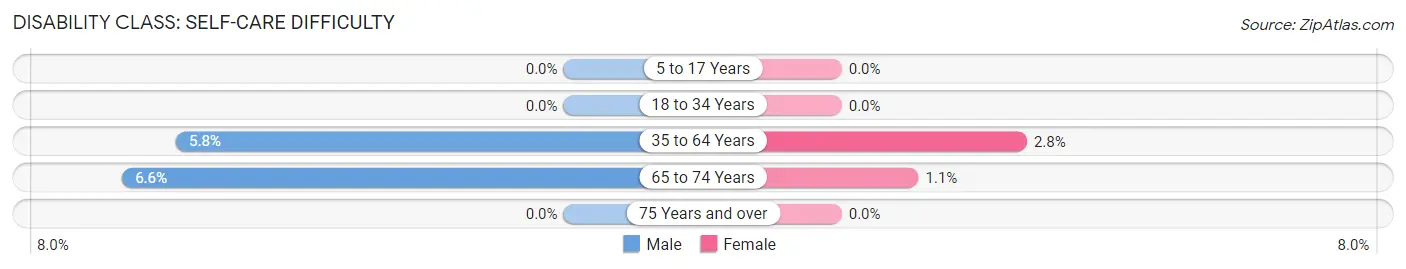
| Age Bracket | Male | Female |
| 5 to 17 Years | 0 (0.0%) | 0 (0.0%) |
| 18 to 34 Years | 0 (0.0%) | 0 (0.0%) |
| 35 to 64 Years | 28 (5.8%) | 13 (2.8%) |
| 65 to 74 Years | 11 (6.6%) | 2 (1.1%) |
| 75 Years and over | 0 (0.0%) | 0 (0.0%) |
Technology Access in Clay County
Computing Device Access in Clay County
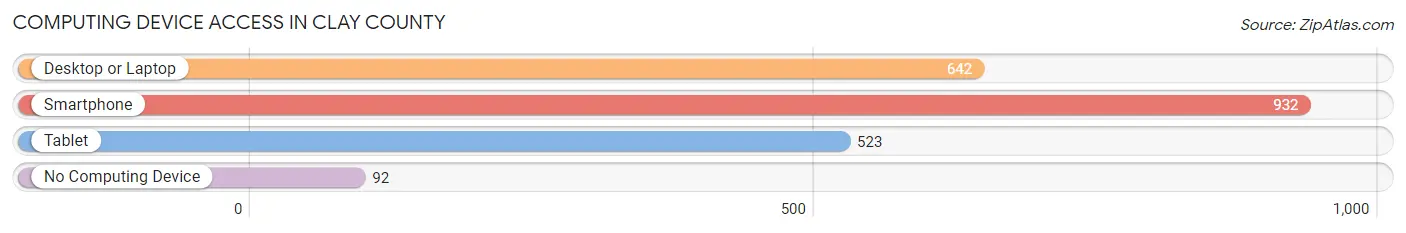
| Device Type | # Households | % Households |
| Desktop or Laptop | 642 | 56.2% |
| Smartphone | 932 | 81.5% |
| Tablet | 523 | 45.8% |
| No Computing Device | 92 | 8.1% |
| Total | 1,143 | 100.0% |
Internet Access in Clay County
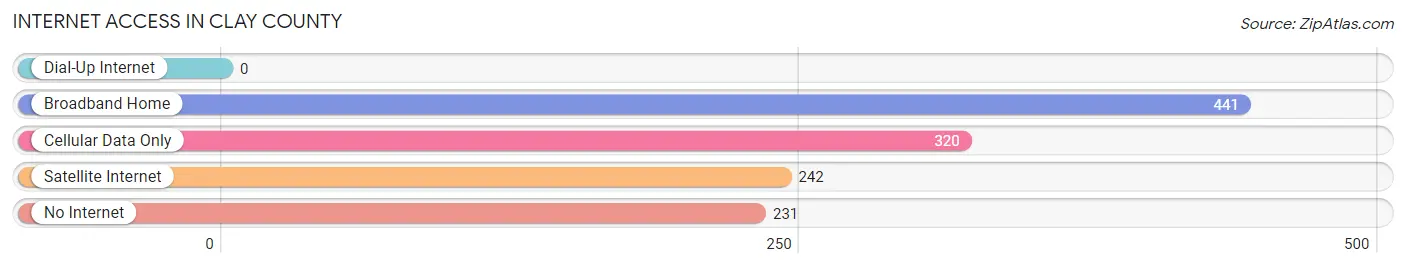
| Internet Type | # Households | % Households |
| Dial-Up Internet | 0 | 0.0% |
| Broadband Home | 441 | 38.6% |
| Cellular Data Only | 320 | 28.0% |
| Satellite Internet | 242 | 21.2% |
| No Internet | 231 | 20.2% |
| Total | 1,143 | 100.0% |
Clay County Summary
Clay County is located in the southwestern corner of Georgia, and is bordered by Alabama to the west, Florida to the south, and Georgia's other counties to the north and east. The county seat is Fort Gaines, and the county is named for Henry Clay, a prominent statesman from Kentucky. Clay County covers an area of 441 square miles, and has a population of approximately 10,000 people.
Geography
Clay County is located in the Appalachian foothills, and is characterized by rolling hills and valleys. The county is drained by the Chattahoochee River, which forms its western border with Alabama. The county is also home to several small lakes, including Lake Seminole, which is located in the southeastern corner of the county. The county is mostly rural, with the majority of the population living in small towns and villages.
Economy
The economy of Clay County is largely based on agriculture, with the majority of the population employed in farming and related activities. The county is also home to several small manufacturing companies, as well as a few larger companies such as Georgia-Pacific and Georgia Power. Tourism is also an important part of the local economy, with visitors coming to the area to enjoy the natural beauty of the county.
Demographics
As of the 2010 census, Clay County had a population of 10,068 people. The racial makeup of the county was 79.2% White, 17.7% African American, 0.4% Native American, 0.3% Asian, 0.1% Pacific Islander, 1.2% from other races, and 1.2% from two or more races. Hispanic or Latino of any race were 2.7% of the population.
The median income for a household in the county was $30,945, and the median income for a family was $37,917. The per capita income for the county was $15,945. About 18.2% of families and 22.2% of the population were below the poverty line, including 28.2% of those under age 18 and 16.2% of those age 65 or over.
Conclusion
Clay County is a rural county located in the southwestern corner of Georgia. The county is characterized by rolling hills and valleys, and is home to several small lakes. The economy of the county is largely based on agriculture, with the majority of the population employed in farming and related activities. The population of the county is mostly White, with a small percentage of African Americans and other racial groups. The median income for a household in the county is lower than the state average, and the poverty rate is higher than the state average.
Common Questions
What is Per Capita Income in Clay County?
Per Capita income in Clay County is $22,191.
What is the Median Family Income in Clay County?
Median Family Income in Clay County is $53,750.
What is the Median Household income in Clay County?
Median Household Income in Clay County is $43,264.
What is Income or Wage Gap in Clay County?
Income or Wage Gap in Clay County is 26.5%.
Women in Clay County earn 73.5 cents for every dollar earned by a man.
What is Inequality or Gini Index in Clay County?
Inequality or Gini Index in Clay County is 0.40.
What is the Total Population of Clay County?
Total Population of Clay County is 2,855.
What is the Total Male Population of Clay County?
Total Male Population of Clay County is 1,335.
What is the Total Female Population of Clay County?
Total Female Population of Clay County is 1,520.
What is the Ratio of Males per 100 Females in Clay County?
There are 87.83 Males per 100 Females in Clay County.
What is the Ratio of Females per 100 Males in Clay County?
There are 113.86 Females per 100 Males in Clay County.
What is the Median Population Age in Clay County?
Median Population Age in Clay County is 42.7 Years.
What is the Average Family Size in Clay County
Average Family Size in Clay County is 3.4 People.
What is the Average Household Size in Clay County
Average Household Size in Clay County is 2.5 People.
How Large is the Labor Force in Clay County?
There are 1,174 People in the Labor Forcein in Clay County.
What is the Percentage of People in the Labor Force in Clay County?
49.5% of People are in the Labor Force in Clay County.
What is the Unemployment Rate in Clay County?
Unemployment Rate in Clay County is 3.5%.