Calhoun County, GA Map & Demographics
Calhoun County Map
Calhoun County Overview
$18,074
PER CAPITA INCOME
$56,071
AVG FAMILY INCOME
$48,663
AVG HOUSEHOLD INCOME
19.1%
WAGE / INCOME GAP [ % ]
80.9¢/ $1
WAGE / INCOME GAP [ $ ]
$14,084
FAMILY INCOME DEFICIT
0.49
INEQUALITY / GINI INDEX
5,594
TOTAL POPULATION
3,461
MALE POPULATION
2,133
FEMALE POPULATION
162.26
MALES / 100 FEMALES
61.63
FEMALES / 100 MALES
39.2
MEDIAN AGE
3.1
AVG FAMILY SIZE
2.6
AVG HOUSEHOLD SIZE
1,809
LABOR FORCE [ PEOPLE ]
37.4%
PERCENT IN LABOR FORCE
11.4%
UNEMPLOYMENT RATE
Calhoun County Area Codes
Income in Calhoun County
Income Overview in Calhoun County
Per Capita Income in Calhoun County is $18,074, while median incomes of families and households are $56,071 and $48,663 respectively.
| Characteristic | Number | Measure |
| Per Capita Income | 5,594 | $18,074 |
| Median Family Income | 1,040 | $56,071 |
| Mean Family Income | 1,040 | $71,009 |
| Median Household Income | 1,497 | $48,663 |
| Mean Household Income | 1,497 | $63,633 |
| Income Deficit | 1,040 | $14,084 |
| Wage / Income Gap (%) | 5,594 | 19.14% |
| Wage / Income Gap ($) | 5,594 | 80.86¢ per $1 |
| Gini / Inequality Index | 5,594 | 0.49 |
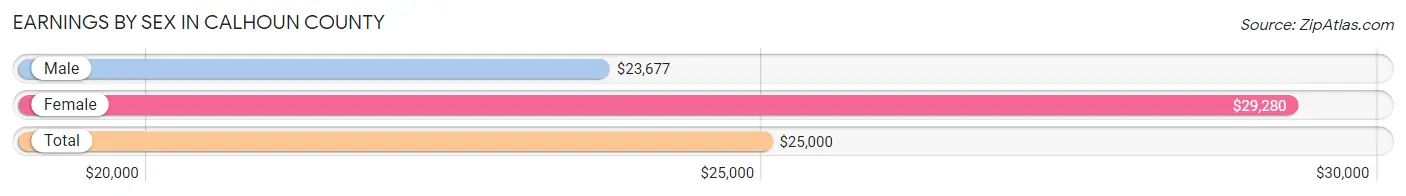
Earnings by Sex in Calhoun County
Average Earnings in Calhoun County are $25,000, $23,677 for men and $29,280 for women, a difference of 19.1%.
| Sex | Number | Average Earnings |
| Male | 1,201 (59.2%) | $23,677 |
| Female | 829 (40.8%) | $29,280 |
| Total | 2,030 (100.0%) | $25,000 |
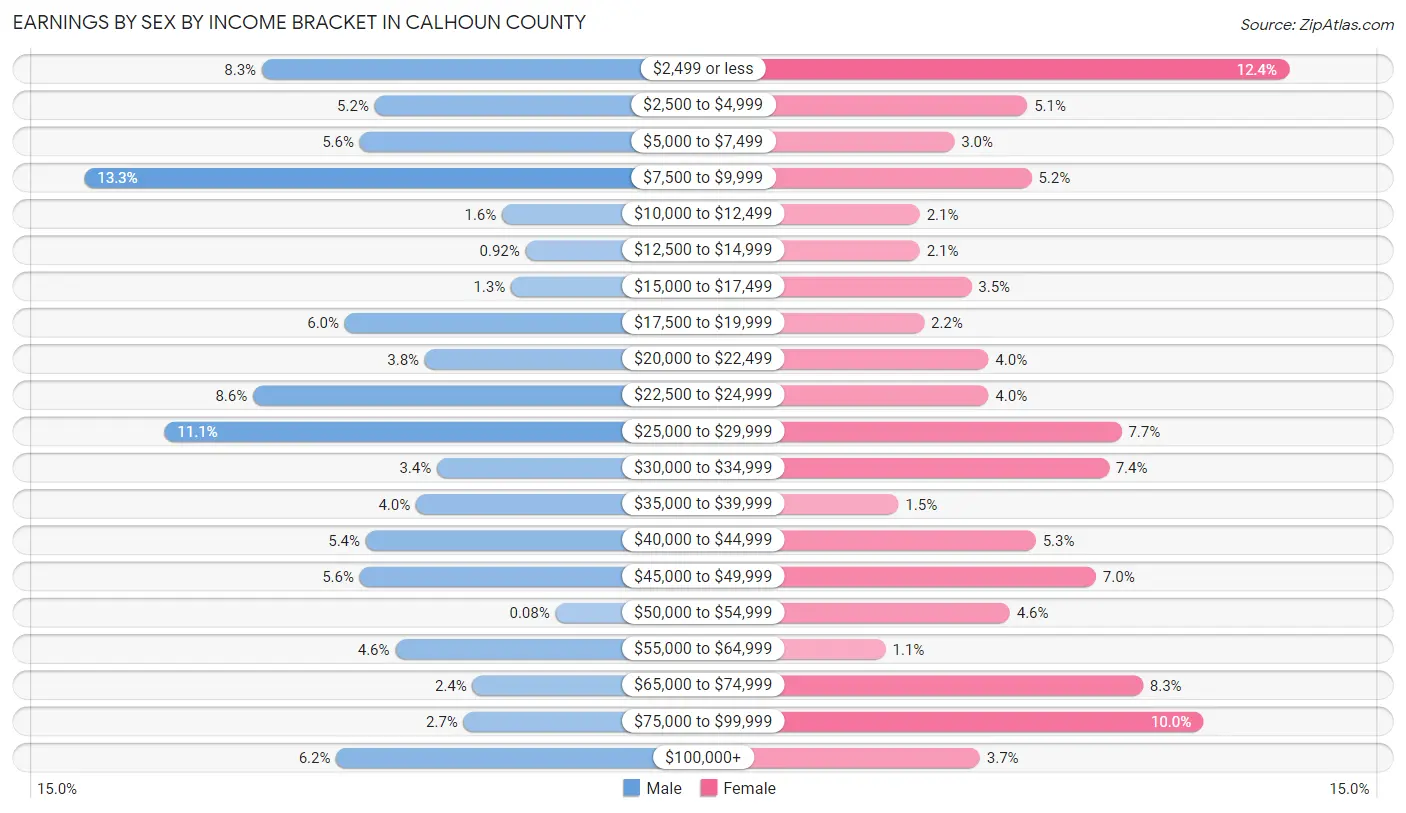
Earnings by Sex by Income Bracket in Calhoun County
The most common earnings brackets in Calhoun County are $7,500 to $9,999 for men (160 | 13.3%) and $2,499 or less for women (103 | 12.4%).
| Income | Male | Female |
| $2,499 or less | 100 (8.3%) | 103 (12.4%) |
| $2,500 to $4,999 | 62 (5.2%) | 42 (5.1%) |
| $5,000 to $7,499 | 67 (5.6%) | 25 (3.0%) |
| $7,500 to $9,999 | 160 (13.3%) | 43 (5.2%) |
| $10,000 to $12,499 | 19 (1.6%) | 17 (2.1%) |
| $12,500 to $14,999 | 11 (0.9%) | 17 (2.1%) |
| $15,000 to $17,499 | 16 (1.3%) | 29 (3.5%) |
| $17,500 to $19,999 | 72 (6.0%) | 18 (2.2%) |
| $20,000 to $22,499 | 45 (3.7%) | 33 (4.0%) |
| $22,500 to $24,999 | 103 (8.6%) | 33 (4.0%) |
| $25,000 to $29,999 | 133 (11.1%) | 64 (7.7%) |
| $30,000 to $34,999 | 41 (3.4%) | 61 (7.4%) |
| $35,000 to $39,999 | 48 (4.0%) | 12 (1.5%) |
| $40,000 to $44,999 | 65 (5.4%) | 44 (5.3%) |
| $45,000 to $49,999 | 67 (5.6%) | 58 (7.0%) |
| $50,000 to $54,999 | 1 (0.1%) | 38 (4.6%) |
| $55,000 to $64,999 | 55 (4.6%) | 9 (1.1%) |
| $65,000 to $74,999 | 29 (2.4%) | 69 (8.3%) |
| $75,000 to $99,999 | 32 (2.7%) | 83 (10.0%) |
| $100,000+ | 75 (6.2%) | 31 (3.7%) |
| Total | 1,201 (100.0%) | 829 (100.0%) |
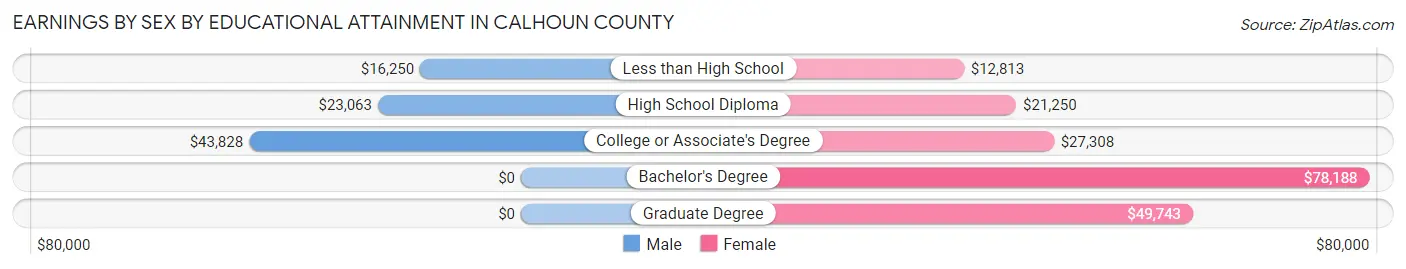
Earnings by Sex by Educational Attainment in Calhoun County
Average earnings in Calhoun County are $24,135 for men and $33,021 for women, a difference of 26.9%. Men with an educational attainment of college or associate's degree enjoy the highest average annual earnings of $43,828, while those with less than high school education earn the least with $16,250. Women with an educational attainment of bachelor's degree earn the most with the average annual earnings of $78,188, while those with less than high school education have the smallest earnings of $12,813.
| Educational Attainment | Male Income | Female Income |
| Less than High School | $16,250 | $12,813 |
| High School Diploma | $23,063 | $21,250 |
| College or Associate's Degree | $43,828 | $27,308 |
| Bachelor's Degree | - | - |
| Graduate Degree | - | - |
| Total | $24,135 | $33,021 |
Family Income in Calhoun County
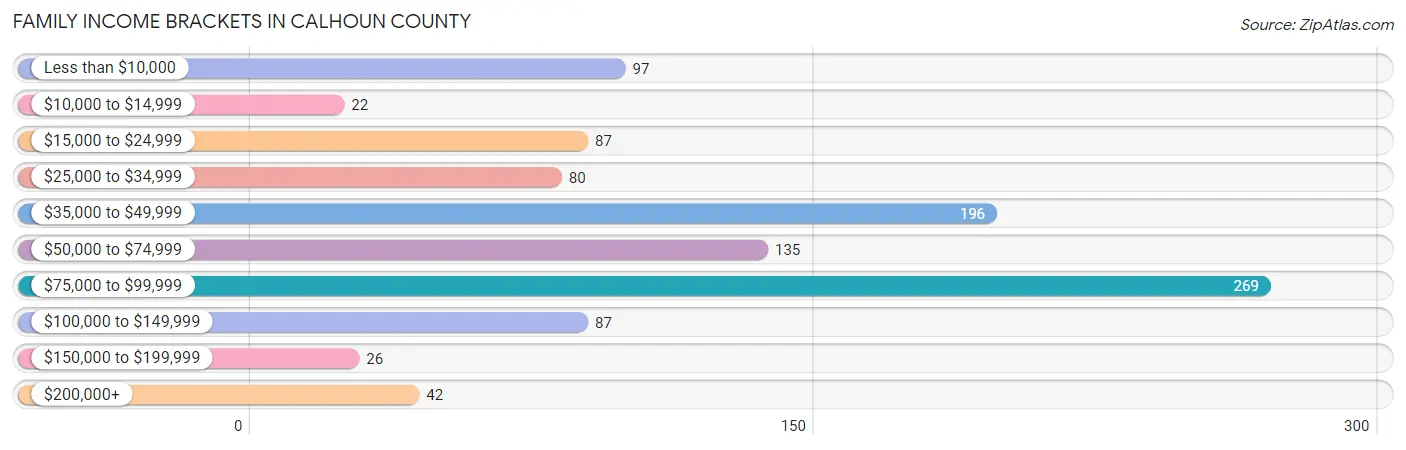
Family Income Brackets in Calhoun County
According to the Calhoun County family income data, there are 269 families falling into the $75,000 to $99,999 income range, which is the most common income bracket and makes up 25.9% of all families. Conversely, the $10,000 to $14,999 income bracket is the least frequent group with only 22 families (2.1%) belonging to this category.
| Income Bracket | # Families | % Families |
| Less than $10,000 | 97 | 9.3% |
| $10,000 to $14,999 | 22 | 2.1% |
| $15,000 to $24,999 | 87 | 8.4% |
| $25,000 to $34,999 | 80 | 7.7% |
| $35,000 to $49,999 | 196 | 18.8% |
| $50,000 to $74,999 | 135 | 13.0% |
| $75,000 to $99,999 | 269 | 25.9% |
| $100,000 to $149,999 | 87 | 8.4% |
| $150,000 to $199,999 | 26 | 2.5% |
| $200,000+ | 42 | 4.0% |
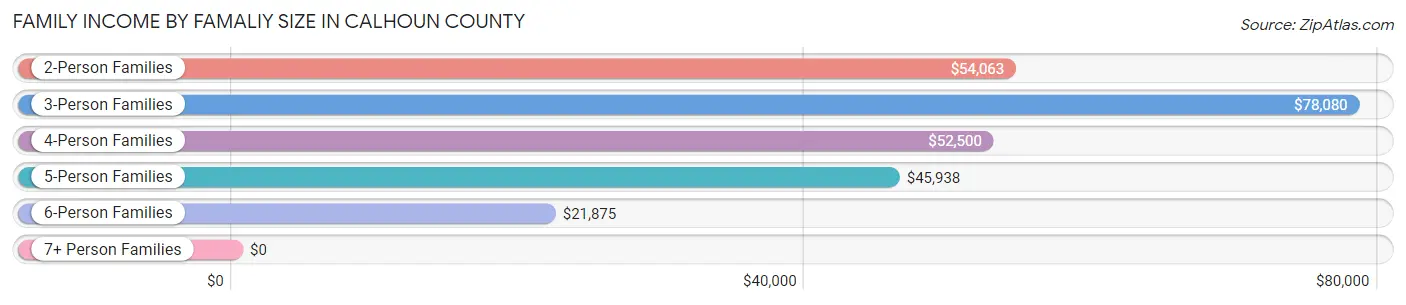
Family Income by Famaliy Size in Calhoun County
3-person families (296 | 28.5%) account for the highest median family income in Calhoun County with $78,080 per family, while 2-person families (489 | 47.0%) have the highest median income of $27,032 per family member.
| Income Bracket | # Families | Median Income |
| 2-Person Families | 489 (47.0%) | $54,063 |
| 3-Person Families | 296 (28.5%) | $78,080 |
| 4-Person Families | 88 (8.5%) | $52,500 |
| 5-Person Families | 95 (9.1%) | $45,938 |
| 6-Person Families | 45 (4.3%) | $21,875 |
| 7+ Person Families | 27 (2.6%) | $0 |
| Total | 1,040 (100.0%) | $56,071 |
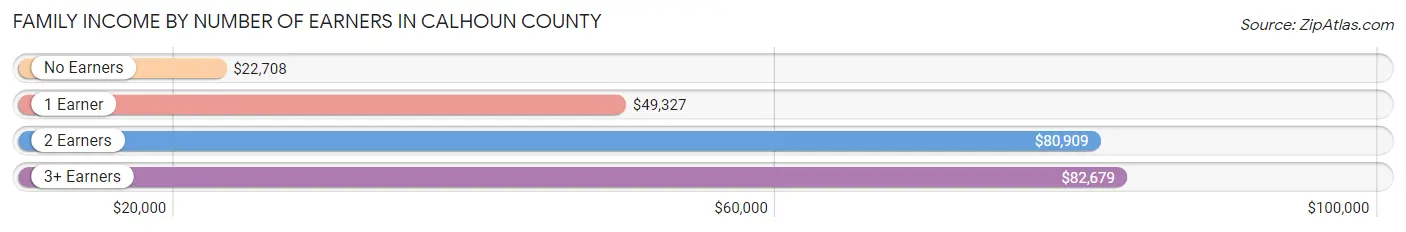
Family Income by Number of Earners in Calhoun County
The median family income in Calhoun County is $56,071, with families comprising 3+ earners (83) having the highest median family income of $82,679, while families with no earners (101) have the lowest median family income of $22,708, accounting for 8.0% and 9.7% of families, respectively.
| Number of Earners | # Families | Median Income |
| No Earners | 101 (9.7%) | $22,708 |
| 1 Earner | 582 (56.0%) | $49,327 |
| 2 Earners | 274 (26.4%) | $80,909 |
| 3+ Earners | 83 (8.0%) | $82,679 |
| Total | 1,040 (100.0%) | $56,071 |
Household Income in Calhoun County
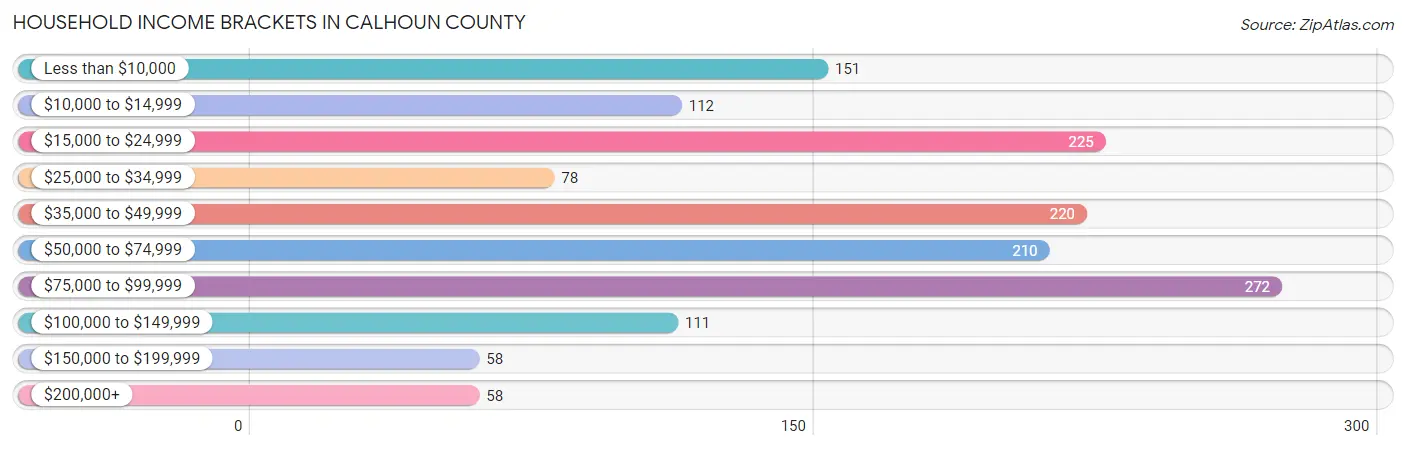
Household Income Brackets in Calhoun County
With 272 households falling in the category, the $75,000 to $99,999 income range is the most frequent in Calhoun County, accounting for 18.2% of all households. In contrast, only 58 households (3.9%) fall into the $150,000 to $199,999 income bracket, making it the least populous group.
| Income Bracket | # Households | % Households |
| Less than $10,000 | 151 | 10.1% |
| $10,000 to $14,999 | 112 | 7.5% |
| $15,000 to $24,999 | 225 | 15.0% |
| $25,000 to $34,999 | 78 | 5.2% |
| $35,000 to $49,999 | 220 | 14.7% |
| $50,000 to $74,999 | 210 | 14.0% |
| $75,000 to $99,999 | 272 | 18.2% |
| $100,000 to $149,999 | 111 | 7.4% |
| $150,000 to $199,999 | 58 | 3.9% |
| $200,000+ | 58 | 3.9% |
Household Income by Householder Age in Calhoun County
The median household income in Calhoun County is $48,663, with the highest median household income of $65,962 found in the 25 to 44 years age bracket for the primary householder. A total of 482 households (32.2%) fall into this category. Meanwhile, the 15 to 24 years age bracket for the primary householder has the lowest median household income of $0, with 38 households (2.5%) in this group.
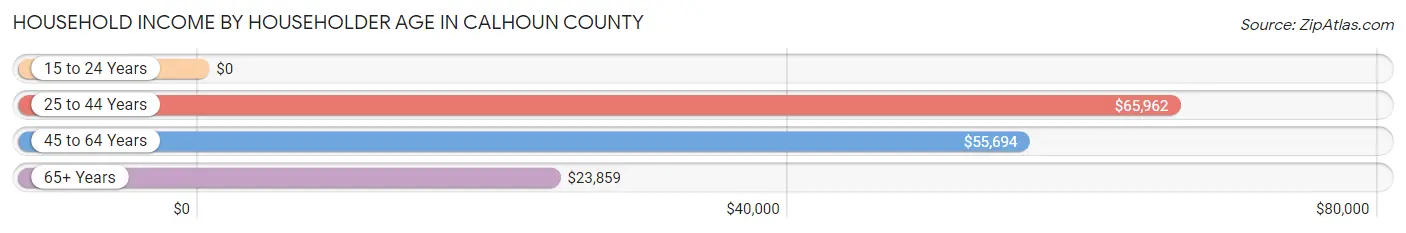
| Income Bracket | # Households | Median Income |
| 15 to 24 Years | 38 (2.5%) | $0 |
| 25 to 44 Years | 482 (32.2%) | $65,962 |
| 45 to 64 Years | 468 (31.3%) | $55,694 |
| 65+ Years | 509 (34.0%) | $23,859 |
| Total | 1,497 (100.0%) | $48,663 |
Poverty in Calhoun County
Income Below Poverty by Sex and Age in Calhoun County
With 19.5% poverty level for males and 31.3% for females among the residents of Calhoun County, under 5 year old males and 18 to 24 year old females are the most vulnerable to poverty, with 60 males (58.8%) and 118 females (63.1%) in their respective age groups living below the poverty level.
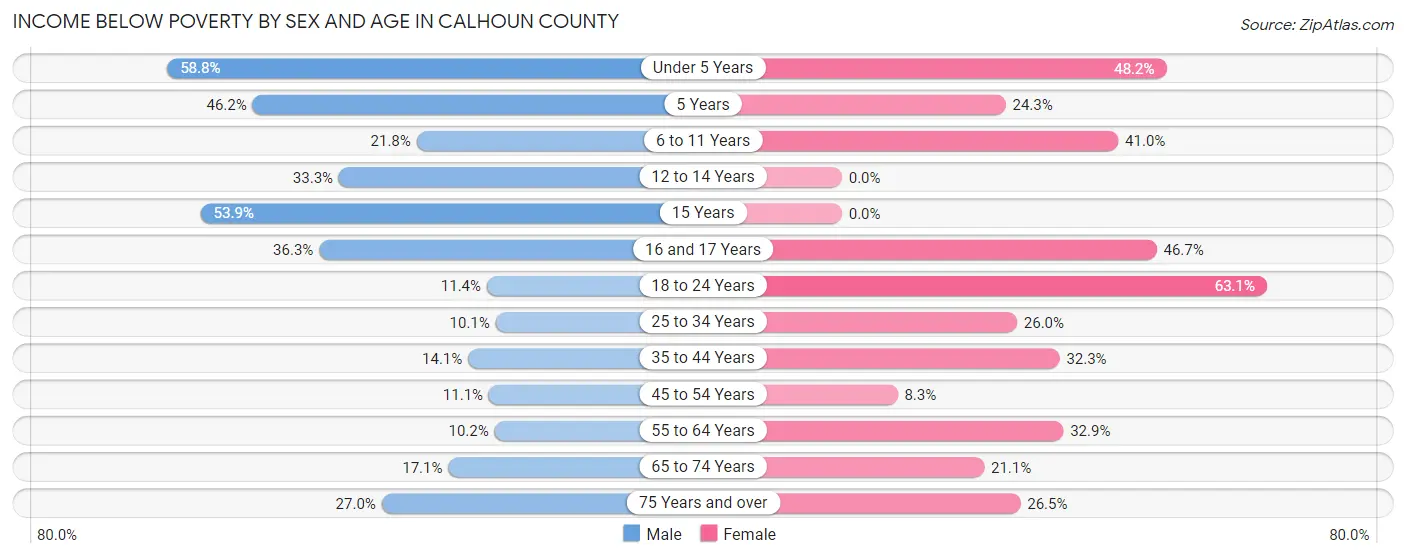
| Age Bracket | Male | Female |
| Under 5 Years | 60 (58.8%) | 53 (48.2%) |
| 5 Years | 6 (46.2%) | 9 (24.3%) |
| 6 to 11 Years | 39 (21.8%) | 71 (41.0%) |
| 12 to 14 Years | 19 (33.3%) | 0 (0.0%) |
| 15 Years | 14 (53.8%) | 0 (0.0%) |
| 16 and 17 Years | 33 (36.3%) | 43 (46.7%) |
| 18 to 24 Years | 15 (11.4%) | 118 (63.1%) |
| 25 to 34 Years | 16 (10.1%) | 52 (26.0%) |
| 35 to 44 Years | 41 (14.1%) | 85 (32.3%) |
| 45 to 54 Years | 21 (11.1%) | 18 (8.3%) |
| 55 to 64 Years | 23 (10.2%) | 96 (32.9%) |
| 65 to 74 Years | 47 (17.1%) | 49 (21.1%) |
| 75 Years and over | 17 (27.0%) | 62 (26.5%) |
| Total | 351 (19.5%) | 656 (31.3%) |
Income Above Poverty by Sex and Age in Calhoun County
According to the poverty statistics in Calhoun County, males aged 25 to 34 years and females aged 12 to 14 years are the age groups that are most secure financially, with 89.9% of males and 100.0% of females in these age groups living above the poverty line.
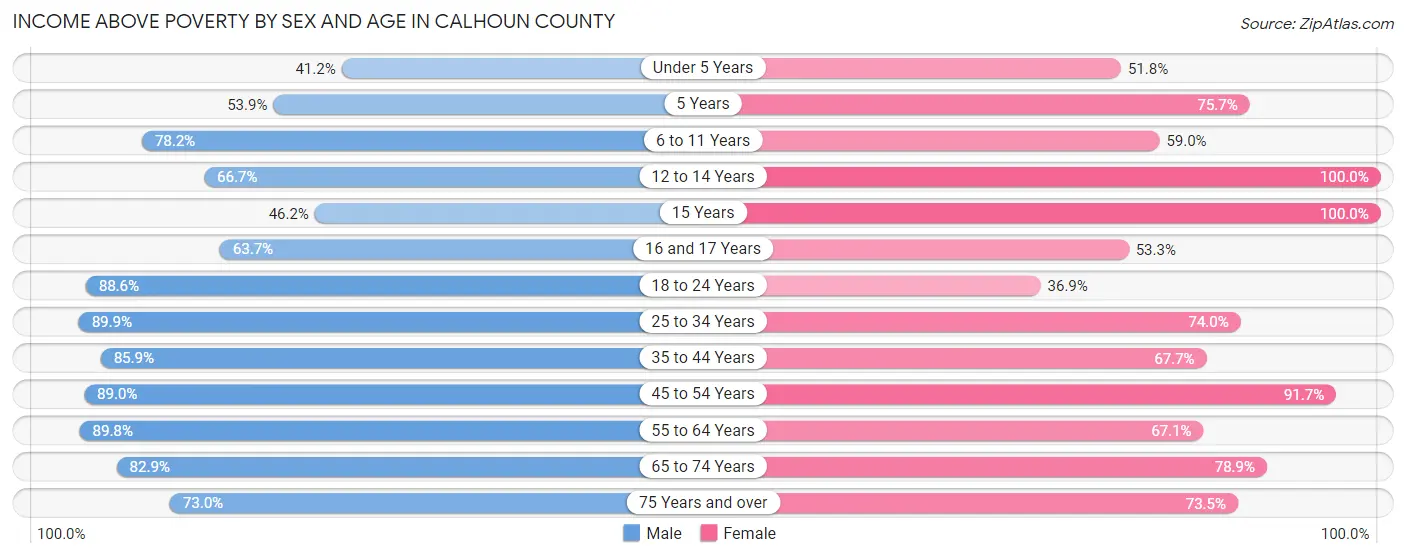
| Age Bracket | Male | Female |
| Under 5 Years | 42 (41.2%) | 57 (51.8%) |
| 5 Years | 7 (53.8%) | 28 (75.7%) |
| 6 to 11 Years | 140 (78.2%) | 102 (59.0%) |
| 12 to 14 Years | 38 (66.7%) | 44 (100.0%) |
| 15 Years | 12 (46.2%) | 16 (100.0%) |
| 16 and 17 Years | 58 (63.7%) | 49 (53.3%) |
| 18 to 24 Years | 117 (88.6%) | 69 (36.9%) |
| 25 to 34 Years | 143 (89.9%) | 148 (74.0%) |
| 35 to 44 Years | 249 (85.9%) | 178 (67.7%) |
| 45 to 54 Years | 169 (88.9%) | 200 (91.7%) |
| 55 to 64 Years | 202 (89.8%) | 196 (67.1%) |
| 65 to 74 Years | 228 (82.9%) | 183 (78.9%) |
| 75 Years and over | 46 (73.0%) | 172 (73.5%) |
| Total | 1,451 (80.5%) | 1,442 (68.7%) |
Income Below Poverty Among Married-Couple Families in Calhoun County
The poverty statistics for married-couple families in Calhoun County show that 15.0% or 80 of the total 533 families live below the poverty line. Families with 3 or 4 children have the highest poverty rate of 33.3%, comprising of 30 families. On the other hand, families with 1 or 2 children have the lowest poverty rate of 2.3%, which includes 3 families.
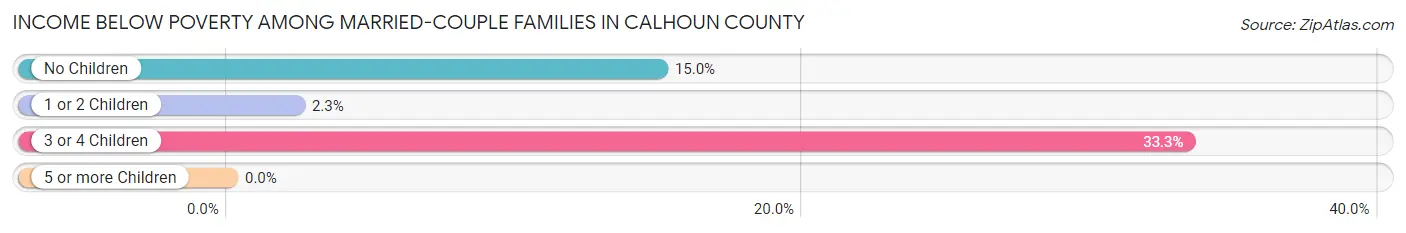
| Children | Above Poverty | Below Poverty |
| No Children | 267 (85.0%) | 47 (15.0%) |
| 1 or 2 Children | 126 (97.7%) | 3 (2.3%) |
| 3 or 4 Children | 60 (66.7%) | 30 (33.3%) |
| 5 or more Children | 0 (0.0%) | 0 (0.0%) |
| Total | 453 (85.0%) | 80 (15.0%) |
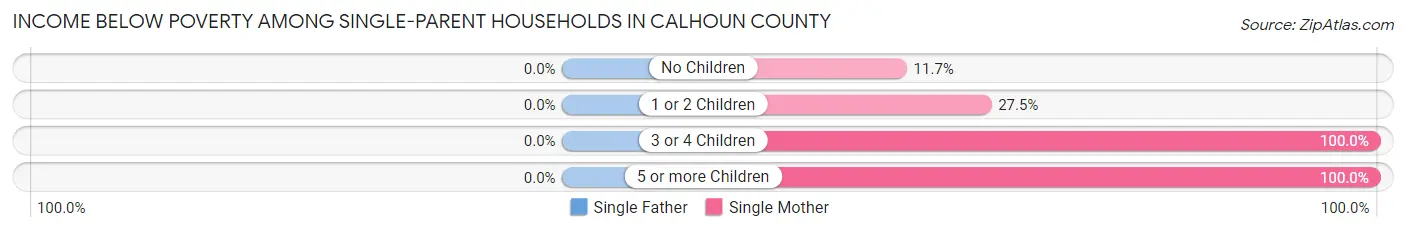
Income Below Poverty Among Single-Parent Households in Calhoun County
| Children | Single Father | Single Mother |
| No Children | 0 (0.0%) | 19 (11.7%) |
| 1 or 2 Children | 0 (0.0%) | 61 (27.5%) |
| 3 or 4 Children | 0 (0.0%) | 39 (100.0%) |
| 5 or more Children | 0 (0.0%) | 7 (100.0%) |
| Total | 0 (0.0%) | 126 (29.3%) |
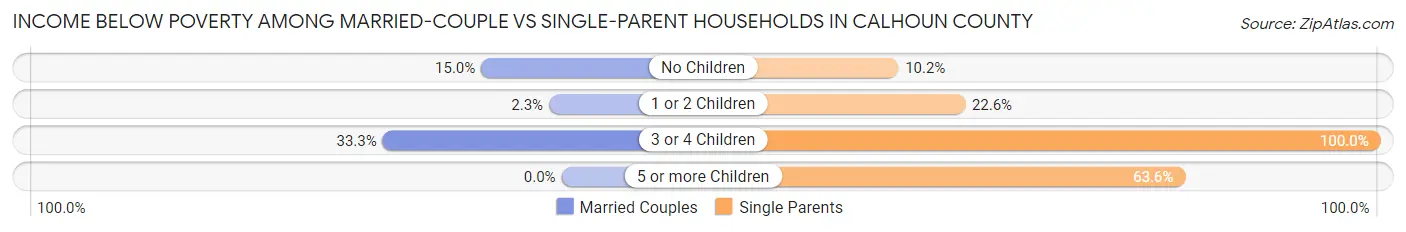
Income Below Poverty Among Married-Couple vs Single-Parent Households in Calhoun County
The poverty data for Calhoun County shows that 80 of the married-couple family households (15.0%) and 126 of the single-parent households (24.8%) are living below the poverty level. Within the married-couple family households, those with 3 or 4 children have the highest poverty rate, with 30 households (33.3%) falling below the poverty line. Among the single-parent households, those with 3 or 4 children have the highest poverty rate, with 39 household (100.0%) living below poverty.
| Children | Married-Couple Families | Single-Parent Households |
| No Children | 47 (15.0%) | 19 (10.2%) |
| 1 or 2 Children | 3 (2.3%) | 61 (22.6%) |
| 3 or 4 Children | 30 (33.3%) | 39 (100.0%) |
| 5 or more Children | 0 (0.0%) | 7 (63.6%) |
| Total | 80 (15.0%) | 126 (24.8%) |
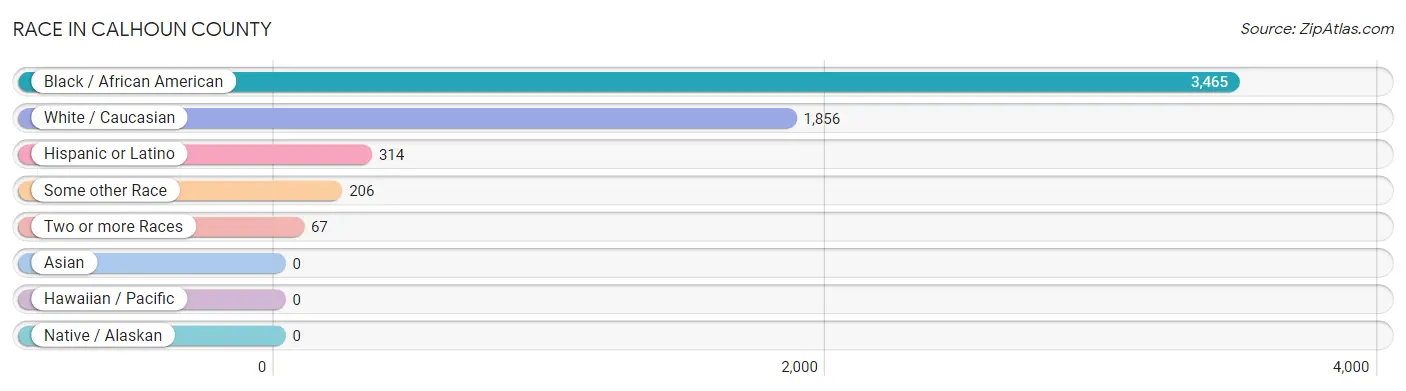
Race in Calhoun County
The most populous races in Calhoun County are Black / African American (3,465 | 61.9%), White / Caucasian (1,856 | 33.2%), and Hispanic or Latino (314 | 5.6%).
| Race | # Population | % Population |
| Asian | 0 | 0.0% |
| Black / African American | 3,465 | 61.9% |
| Hawaiian / Pacific | 0 | 0.0% |
| Hispanic or Latino | 314 | 5.6% |
| Native / Alaskan | 0 | 0.0% |
| White / Caucasian | 1,856 | 33.2% |
| Two or more Races | 67 | 1.2% |
| Some other Race | 206 | 3.7% |
| Total | 5,594 | 100.0% |
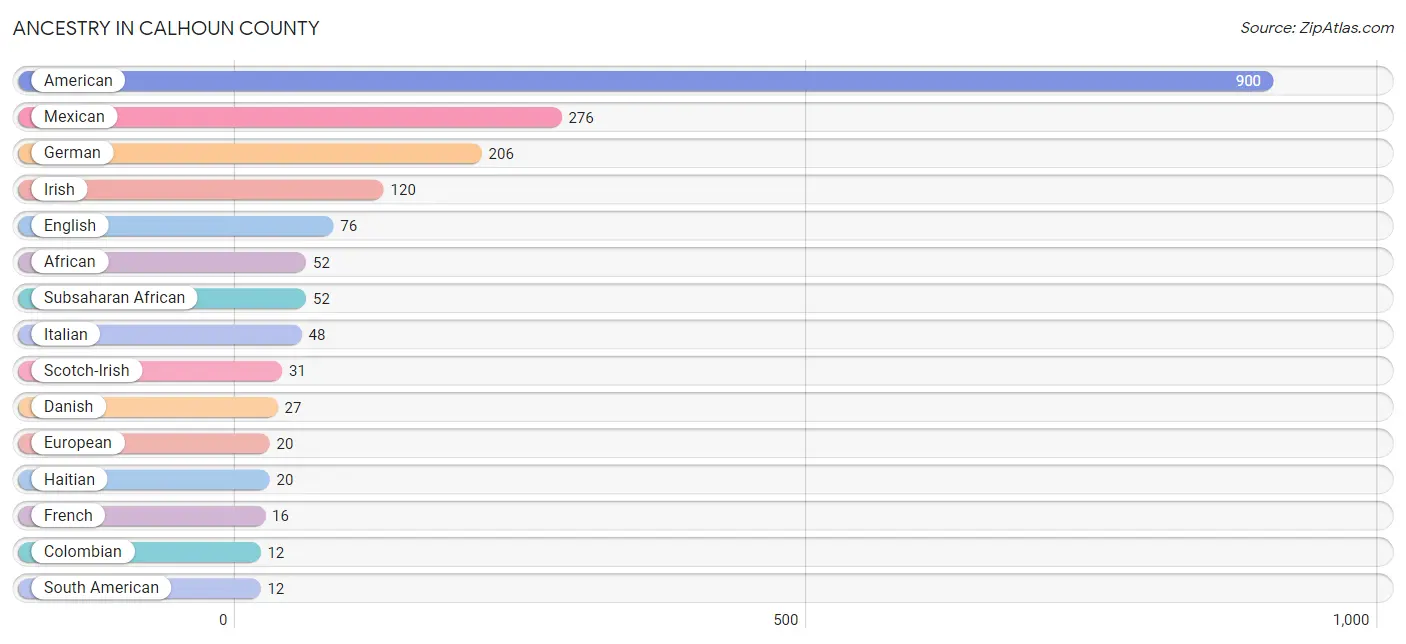
Ancestry in Calhoun County
The most populous ancestries reported in Calhoun County are American (900 | 16.1%), Mexican (276 | 4.9%), German (206 | 3.7%), Irish (120 | 2.1%), and English (76 | 1.4%), together accounting for 28.2% of all Calhoun County residents.
| Ancestry | # Population | % Population |
| African | 52 | 0.9% |
| American | 900 | 16.1% |
| Belgian | 1 | 0.0% |
| Bhutanese | 4 | 0.1% |
| British | 6 | 0.1% |
| Central American | 9 | 0.2% |
| Colombian | 12 | 0.2% |
| Danish | 27 | 0.5% |
| Dominican | 6 | 0.1% |
| Dutch | 3 | 0.1% |
| English | 76 | 1.4% |
| European | 20 | 0.4% |
| French | 16 | 0.3% |
| German | 206 | 3.7% |
| Haitian | 20 | 0.4% |
| Honduran | 9 | 0.2% |
| Irish | 120 | 2.1% |
| Italian | 48 | 0.9% |
| Mexican | 276 | 4.9% |
| Northern European | 5 | 0.1% |
| Puerto Rican | 5 | 0.1% |
| Scotch-Irish | 31 | 0.5% |
| Scottish | 3 | 0.1% |
| South American | 12 | 0.2% |
| Spaniard | 6 | 0.1% |
| Subsaharan African | 52 | 0.9% |
| Swiss | 2 | 0.0% |
| Welsh | 2 | 0.0% | View All 28 Rows |
Immigrants in Calhoun County
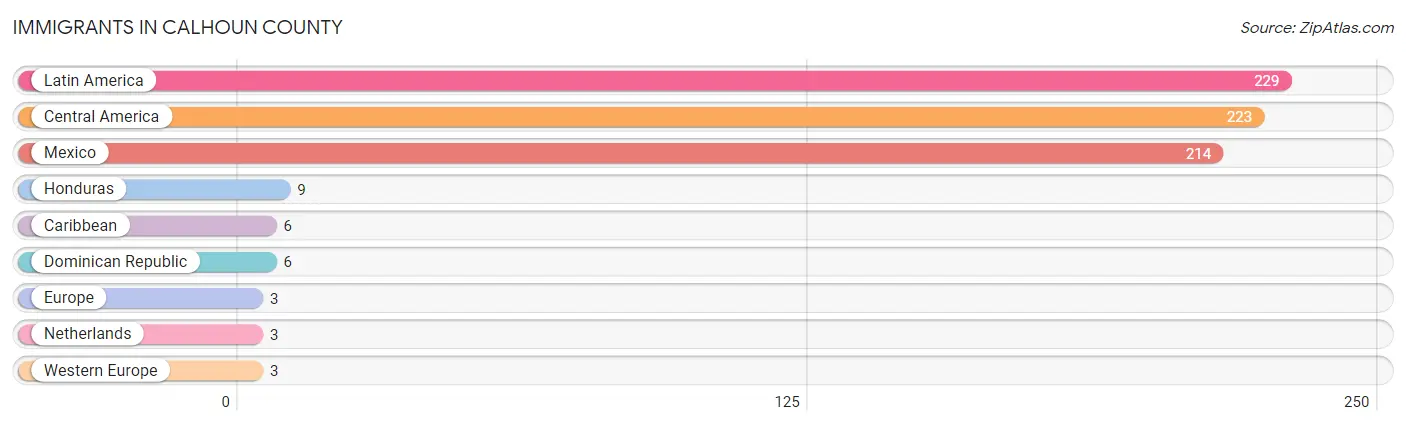
The most numerous immigrant groups reported in Calhoun County came from Latin America (229 | 4.1%), Central America (223 | 4.0%), Mexico (214 | 3.8%), Honduras (9 | 0.2%), and Caribbean (6 | 0.1%), together accounting for 12.2% of all Calhoun County residents.
| Immigration Origin | # Population | % Population |
| Caribbean | 6 | 0.1% |
| Central America | 223 | 4.0% |
| Dominican Republic | 6 | 0.1% |
| Europe | 3 | 0.1% |
| Honduras | 9 | 0.2% |
| Latin America | 229 | 4.1% |
| Mexico | 214 | 3.8% |
| Netherlands | 3 | 0.1% |
| Western Europe | 3 | 0.1% | View All 9 Rows |
Sex and Age in Calhoun County
Sex and Age in Calhoun County
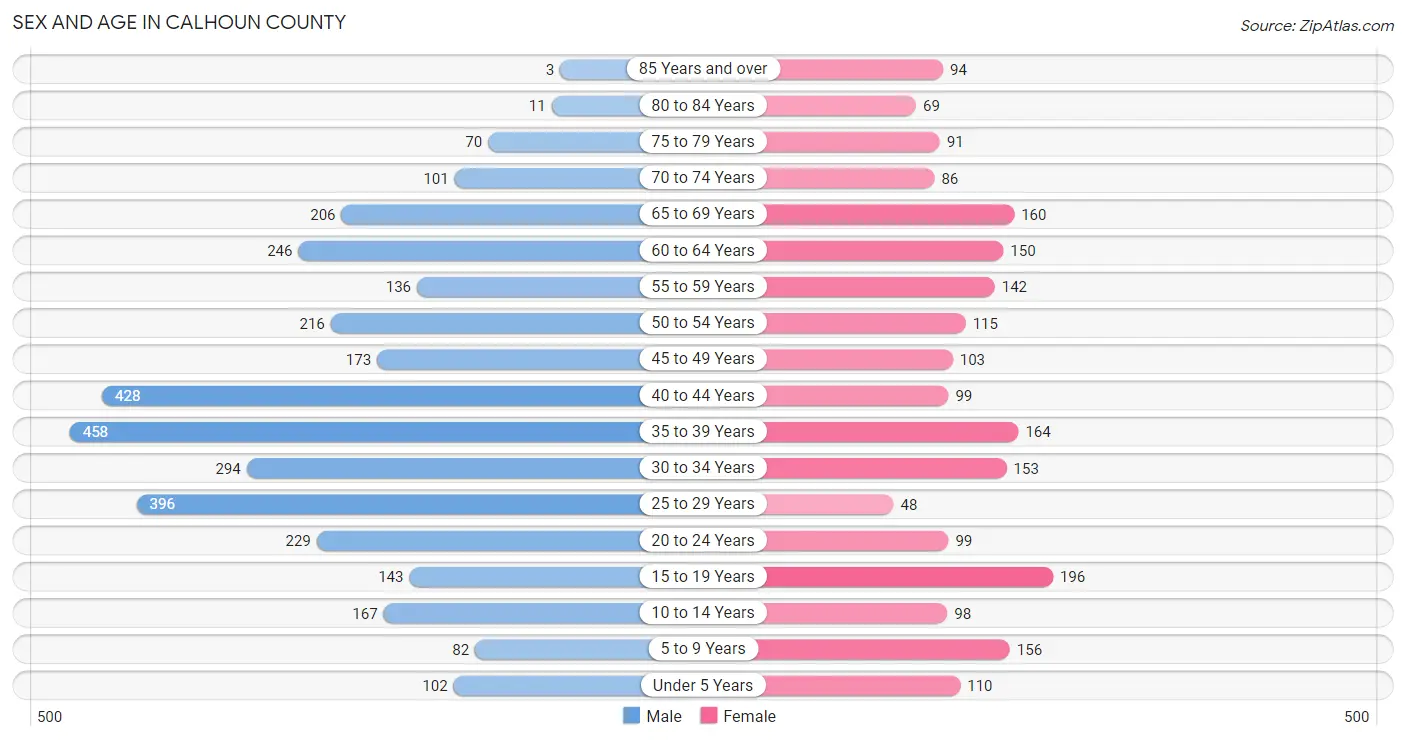
The most populous age groups in Calhoun County are 35 to 39 Years (458 | 13.2%) for men and 15 to 19 Years (196 | 9.2%) for women.
| Age Bracket | Male | Female |
| Under 5 Years | 102 (2.9%) | 110 (5.2%) |
| 5 to 9 Years | 82 (2.4%) | 156 (7.3%) |
| 10 to 14 Years | 167 (4.8%) | 98 (4.6%) |
| 15 to 19 Years | 143 (4.1%) | 196 (9.2%) |
| 20 to 24 Years | 229 (6.6%) | 99 (4.6%) |
| 25 to 29 Years | 396 (11.4%) | 48 (2.2%) |
| 30 to 34 Years | 294 (8.5%) | 153 (7.2%) |
| 35 to 39 Years | 458 (13.2%) | 164 (7.7%) |
| 40 to 44 Years | 428 (12.4%) | 99 (4.6%) |
| 45 to 49 Years | 173 (5.0%) | 103 (4.8%) |
| 50 to 54 Years | 216 (6.2%) | 115 (5.4%) |
| 55 to 59 Years | 136 (3.9%) | 142 (6.7%) |
| 60 to 64 Years | 246 (7.1%) | 150 (7.0%) |
| 65 to 69 Years | 206 (5.9%) | 160 (7.5%) |
| 70 to 74 Years | 101 (2.9%) | 86 (4.0%) |
| 75 to 79 Years | 70 (2.0%) | 91 (4.3%) |
| 80 to 84 Years | 11 (0.3%) | 69 (3.2%) |
| 85 Years and over | 3 (0.1%) | 94 (4.4%) |
| Total | 3,461 (100.0%) | 2,133 (100.0%) |
Families and Households in Calhoun County
Median Family Size in Calhoun County
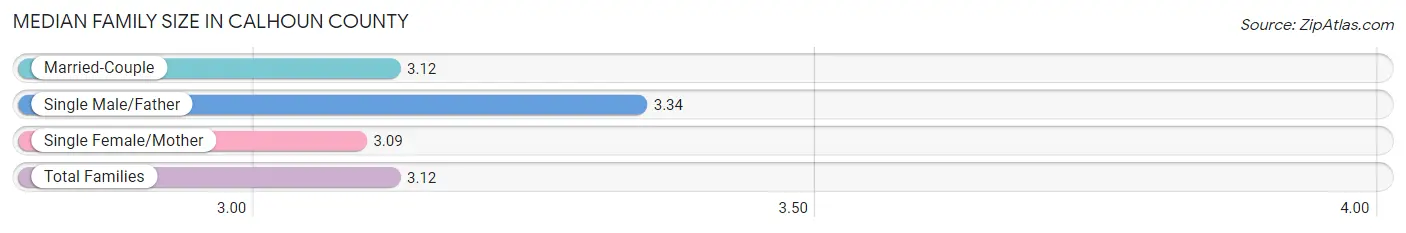
The median family size in Calhoun County is 3.12 persons per family, with single male/father families (77 | 7.4%) accounting for the largest median family size of 3.34 persons per family. On the other hand, single female/mother families (430 | 41.3%) represent the smallest median family size with 3.09 persons per family.
| Family Type | # Families | Family Size |
| Married-Couple | 533 (51.2%) | 3.12 |
| Single Male/Father | 77 (7.4%) | 3.34 |
| Single Female/Mother | 430 (41.3%) | 3.09 |
| Total Families | 1,040 (100.0%) | 3.12 |
Median Household Size in Calhoun County
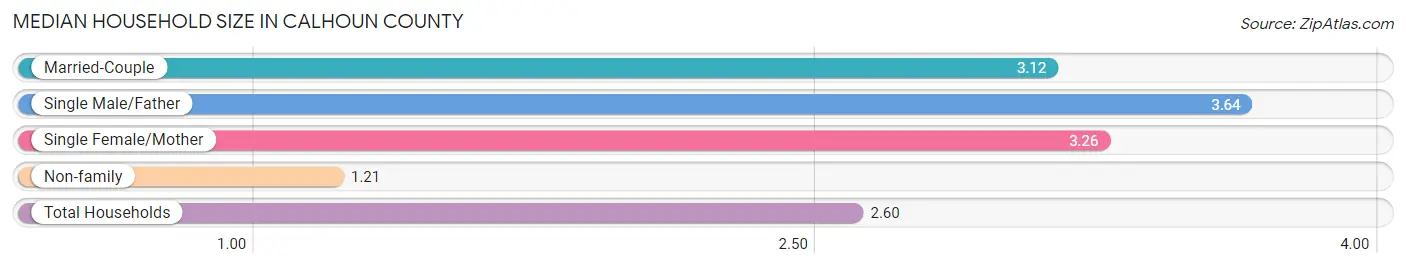
The median household size in Calhoun County is 2.60 persons per household, with single male/father households (77 | 5.1%) accounting for the largest median household size of 3.64 persons per household. non-family households (457 | 30.5%) represent the smallest median household size with 1.21 persons per household.
| Household Type | # Households | Household Size |
| Married-Couple | 533 (35.6%) | 3.12 |
| Single Male/Father | 77 (5.1%) | 3.64 |
| Single Female/Mother | 430 (28.7%) | 3.26 |
| Non-family | 457 (30.5%) | 1.21 |
| Total Households | 1,497 (100.0%) | 2.60 |
Household Size by Marriage Status in Calhoun County
Out of a total of 1,497 households in Calhoun County, 1,040 (69.5%) are family households, while 457 (30.5%) are nonfamily households. The most numerous type of family households are 2-person households, comprising 450, and the most common type of nonfamily households are 1-person households, comprising 406.
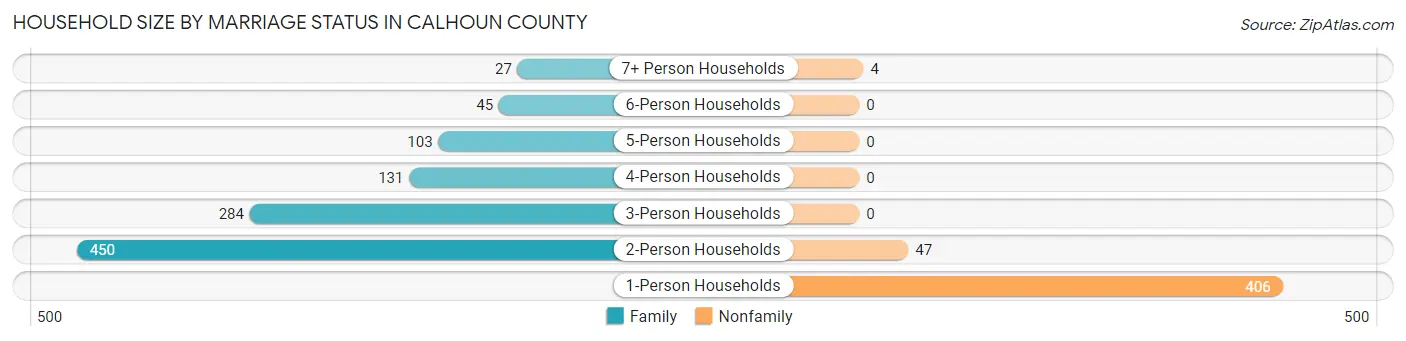
| Household Size | Family Households | Nonfamily Households |
| 1-Person Households | - | 406 (27.1%) |
| 2-Person Households | 450 (30.1%) | 47 (3.1%) |
| 3-Person Households | 284 (19.0%) | 0 (0.0%) |
| 4-Person Households | 131 (8.7%) | 0 (0.0%) |
| 5-Person Households | 103 (6.9%) | 0 (0.0%) |
| 6-Person Households | 45 (3.0%) | 0 (0.0%) |
| 7+ Person Households | 27 (1.8%) | 4 (0.3%) |
| Total | 1,040 (69.5%) | 457 (30.5%) |
Female Fertility in Calhoun County
Fertility by Age in Calhoun County
Average fertility rate in Calhoun County is 20.0 births per 1,000 women. Women in the age bracket of 20 to 34 years have the highest fertility rate with 43.0 births per 1,000 women. Women in the age bracket of 20 to 34 years acount for 72.2% of all women with births.
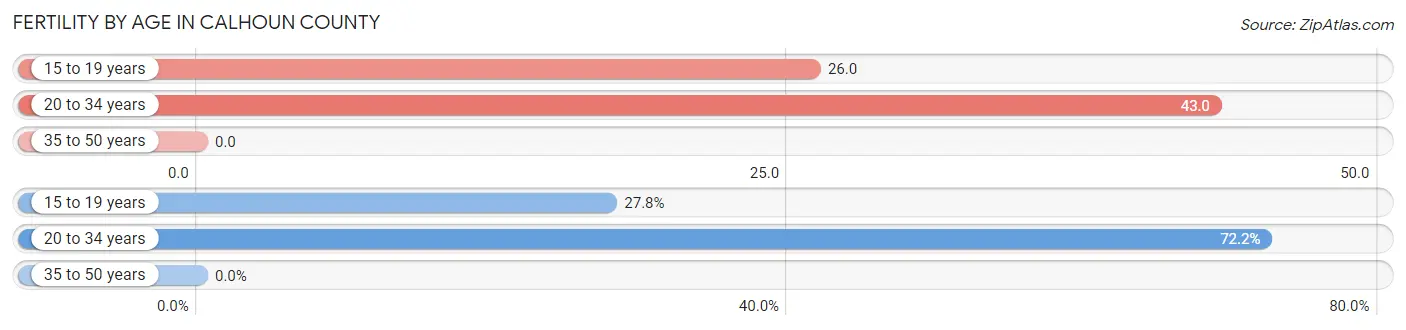
| Age Bracket | Women with Births | Births / 1,000 Women |
| 15 to 19 years | 5 (27.8%) | 26.0 |
| 20 to 34 years | 13 (72.2%) | 43.0 |
| 35 to 50 years | 0 (0.0%) | 0.0 |
| Total | 18 (100.0%) | 20.0 |
Fertility by Age by Marriage Status in Calhoun County
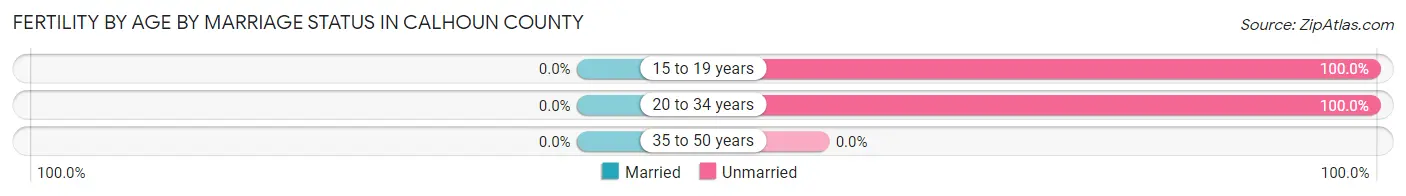
| Age Bracket | Married | Unmarried |
| 15 to 19 years | 0 (0.0%) | 5 (100.0%) |
| 20 to 34 years | 0 (0.0%) | 13 (100.0%) |
| 35 to 50 years | 0 (0.0%) | 0 (0.0%) |
| Total | 0 (0.0%) | 18 (100.0%) |
Fertility by Education in Calhoun County
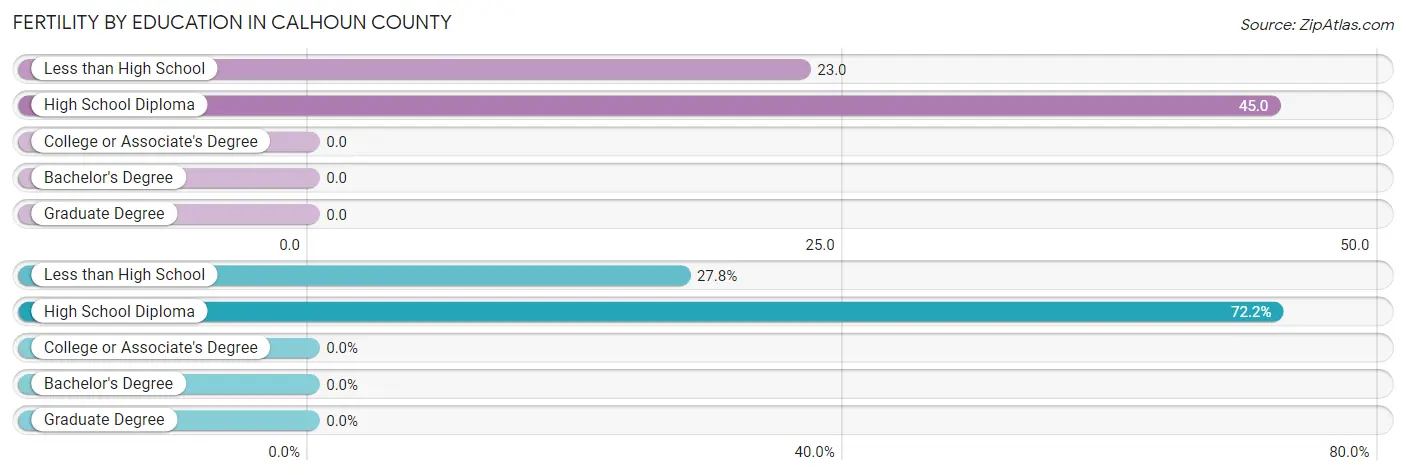
| Educational Attainment | Women with Births | Births / 1,000 Women |
| Less than High School | 5 (27.8%) | 23.0 |
| High School Diploma | 13 (72.2%) | 45.0 |
| College or Associate's Degree | 0 (0.0%) | 0.0 |
| Bachelor's Degree | 0 (0.0%) | 0.0 |
| Graduate Degree | 0 (0.0%) | 0.0 |
| Total | 18 (100.0%) | 20.0 |
Fertility by Education by Marriage Status in Calhoun County
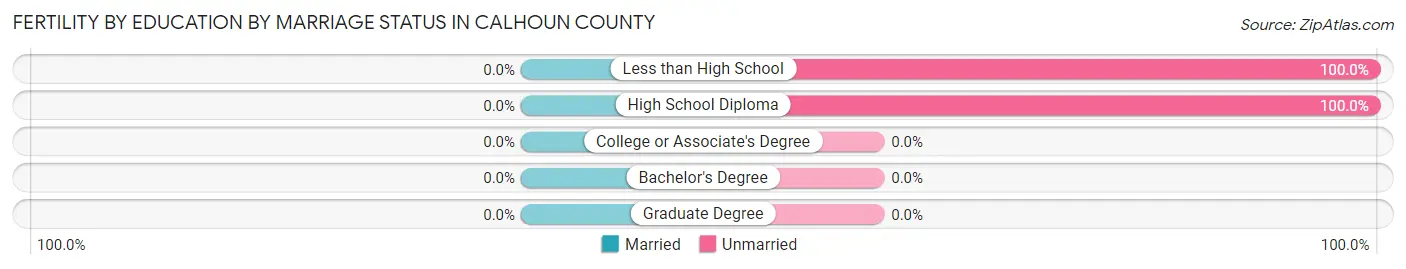
| Educational Attainment | Married | Unmarried |
| Less than High School | 0 (0.0%) | 5 (100.0%) |
| High School Diploma | 0 (0.0%) | 13 (100.0%) |
| College or Associate's Degree | 0 (0.0%) | 0 (0.0%) |
| Bachelor's Degree | 0 (0.0%) | 0 (0.0%) |
| Graduate Degree | 0 (0.0%) | 0 (0.0%) |
| Total | 0 (0.0%) | 18 (100.0%) |
Employment Characteristics in Calhoun County
Employment by Class of Employer in Calhoun County
Among the 1,574 employed individuals in Calhoun County, private company employees (991 | 63.0%), local government employees (211 | 13.4%), and state government employees (142 | 9.0%) make up the most common classes of employment.
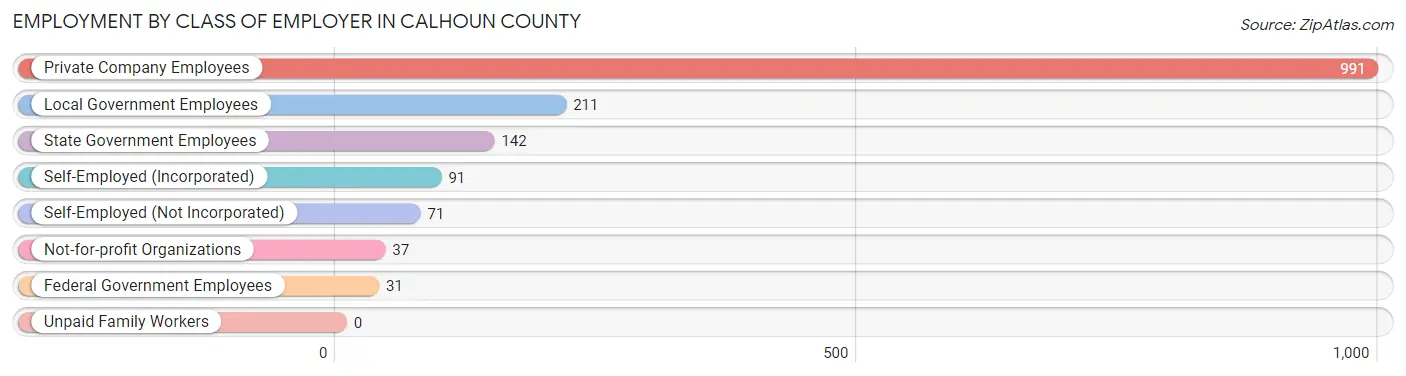
| Employer Class | # Employees | % Employees |
| Private Company Employees | 991 | 63.0% |
| Self-Employed (Incorporated) | 91 | 5.8% |
| Self-Employed (Not Incorporated) | 71 | 4.5% |
| Not-for-profit Organizations | 37 | 2.4% |
| Local Government Employees | 211 | 13.4% |
| State Government Employees | 142 | 9.0% |
| Federal Government Employees | 31 | 2.0% |
| Unpaid Family Workers | 0 | 0.0% |
| Total | 1,574 | 100.0% |
Employment Status by Age in Calhoun County
According to the labor force statistics for Calhoun County, out of the total population over 16 years of age (4,837), 37.4% or 1,809 individuals are in the labor force, with 11.4% or 206 of them unemployed. The age group with the highest labor force participation rate is 45 to 54 years, with 55.5% or 337 individuals in the labor force. Within the labor force, the 60 to 64 years age range has the highest percentage of unemployed individuals, with 38.2% or 55 of them being unemployed.
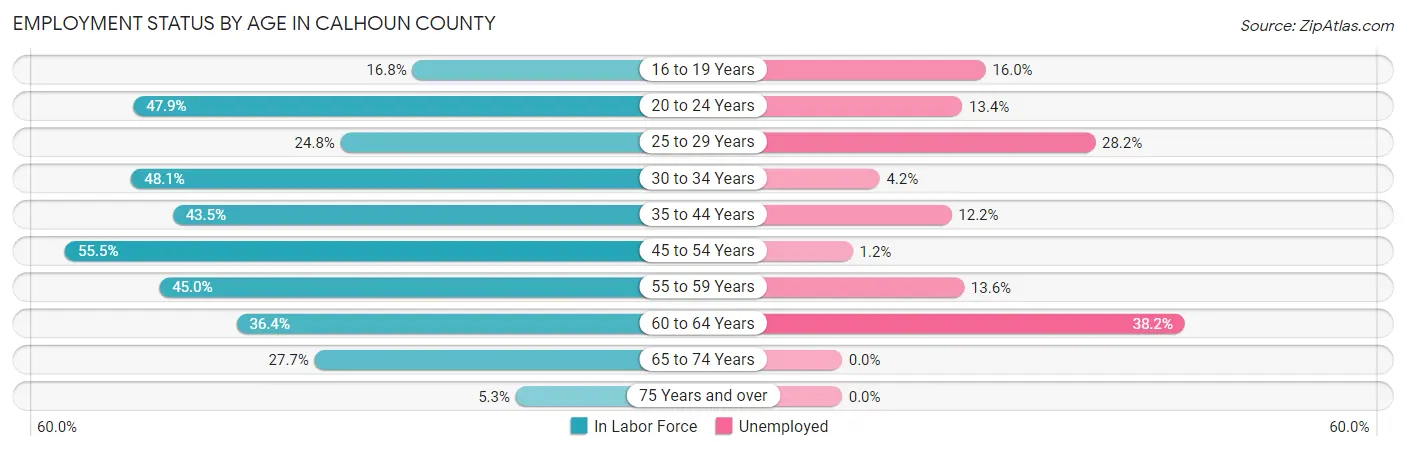
| Age Bracket | In Labor Force | Unemployed |
| 16 to 19 Years | 50 (16.8%) | 8 (16.0%) |
| 20 to 24 Years | 157 (47.9%) | 21 (13.4%) |
| 25 to 29 Years | 110 (24.8%) | 31 (28.2%) |
| 30 to 34 Years | 215 (48.1%) | 9 (4.2%) |
| 35 to 44 Years | 500 (43.5%) | 61 (12.2%) |
| 45 to 54 Years | 337 (55.5%) | 4 (1.2%) |
| 55 to 59 Years | 125 (45.0%) | 17 (13.6%) |
| 60 to 64 Years | 144 (36.4%) | 55 (38.2%) |
| 65 to 74 Years | 153 (27.7%) | 0 (0.0%) |
| 75 Years and over | 18 (5.3%) | 0 (0.0%) |
| Total | 1,809 (37.4%) | 206 (11.4%) |
Employment Status by Educational Attainment in Calhoun County
According to labor force statistics for Calhoun County, 43.1% of individuals (1,431) out of the total population between 25 and 64 years of age (3,321) are in the labor force, with 12.4% or 177 of them being unemployed. The group with the highest labor force participation rate are those with the educational attainment of bachelor's degree or higher, with 85.4% or 315 individuals in the labor force. Within the labor force, individuals with less than high school education have the highest percentage of unemployment, with 34.2% or 92 of them being unemployed.
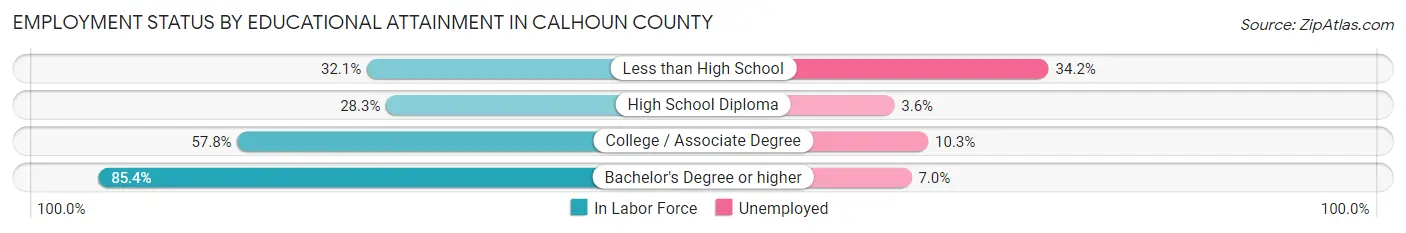
| Educational Attainment | In Labor Force | Unemployed |
| Less than High School | 269 (32.1%) | 286 (34.2%) |
| High School Diploma | 360 (28.3%) | 46 (3.6%) |
| College / Associate Degree | 487 (57.8%) | 87 (10.3%) |
| Bachelor's Degree or higher | 315 (85.4%) | 26 (7.0%) |
| Total | 1,431 (43.1%) | 412 (12.4%) |
Employment Occupations by Sex in Calhoun County
Management, Business, Science and Arts Occupations
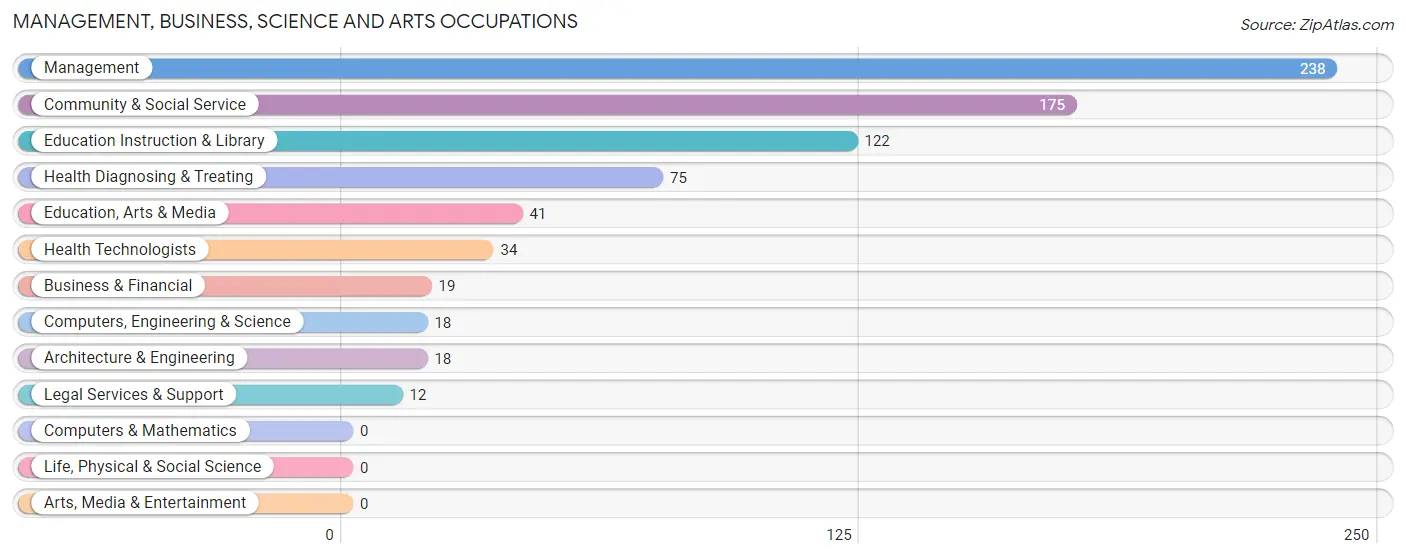
The most common Management, Business, Science and Arts occupations in Calhoun County are Management (238 | 14.8%), Community & Social Service (175 | 10.9%), Education Instruction & Library (122 | 7.6%), Health Diagnosing & Treating (75 | 4.7%), and Education, Arts & Media (41 | 2.6%).
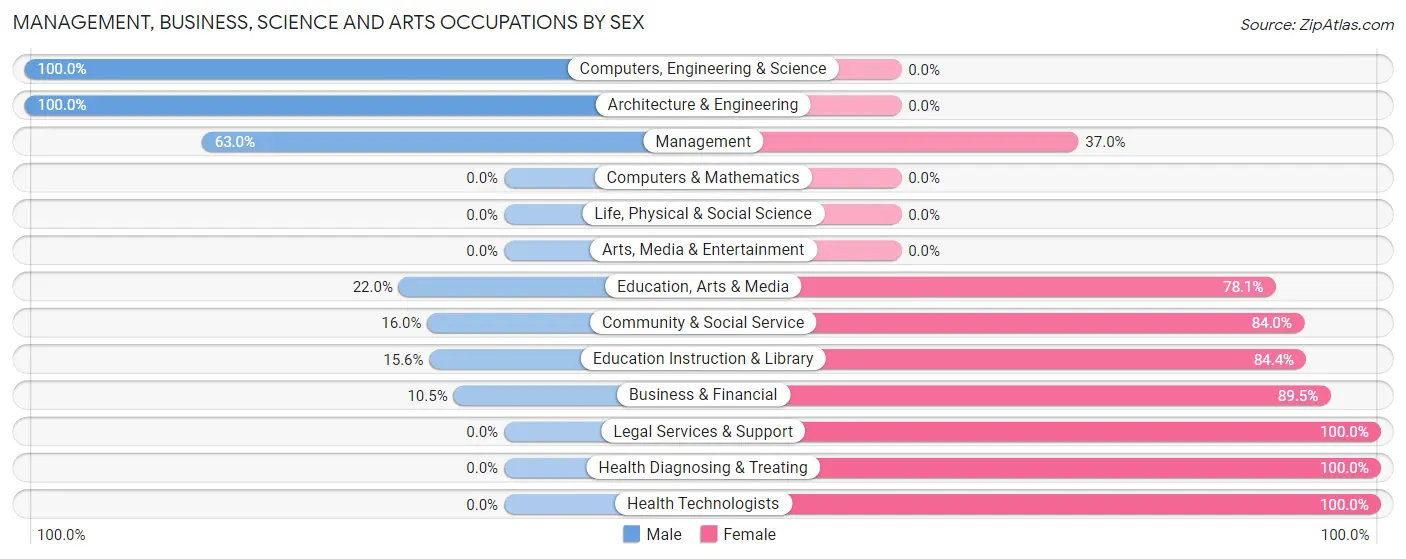
Management, Business, Science and Arts Occupations by Sex
Within the Management, Business, Science and Arts occupations in Calhoun County, the most male-oriented occupations are Computers, Engineering & Science (100.0%), Architecture & Engineering (100.0%), and Management (63.0%), while the most female-oriented occupations are Legal Services & Support (100.0%), Health Diagnosing & Treating (100.0%), and Health Technologists (100.0%).
| Occupation | Male | Female |
| Management | 150 (63.0%) | 88 (37.0%) |
| Business & Financial | 2 (10.5%) | 17 (89.5%) |
| Computers, Engineering & Science | 18 (100.0%) | 0 (0.0%) |
| Computers & Mathematics | 0 (0.0%) | 0 (0.0%) |
| Architecture & Engineering | 18 (100.0%) | 0 (0.0%) |
| Life, Physical & Social Science | 0 (0.0%) | 0 (0.0%) |
| Community & Social Service | 28 (16.0%) | 147 (84.0%) |
| Education, Arts & Media | 9 (22.0%) | 32 (78.0%) |
| Legal Services & Support | 0 (0.0%) | 12 (100.0%) |
| Education Instruction & Library | 19 (15.6%) | 103 (84.4%) |
| Arts, Media & Entertainment | 0 (0.0%) | 0 (0.0%) |
| Health Diagnosing & Treating | 0 (0.0%) | 75 (100.0%) |
| Health Technologists | 0 (0.0%) | 34 (100.0%) |
| Total (Category) | 198 (37.7%) | 327 (62.3%) |
| Total (Overall) | 861 (53.7%) | 742 (46.3%) |
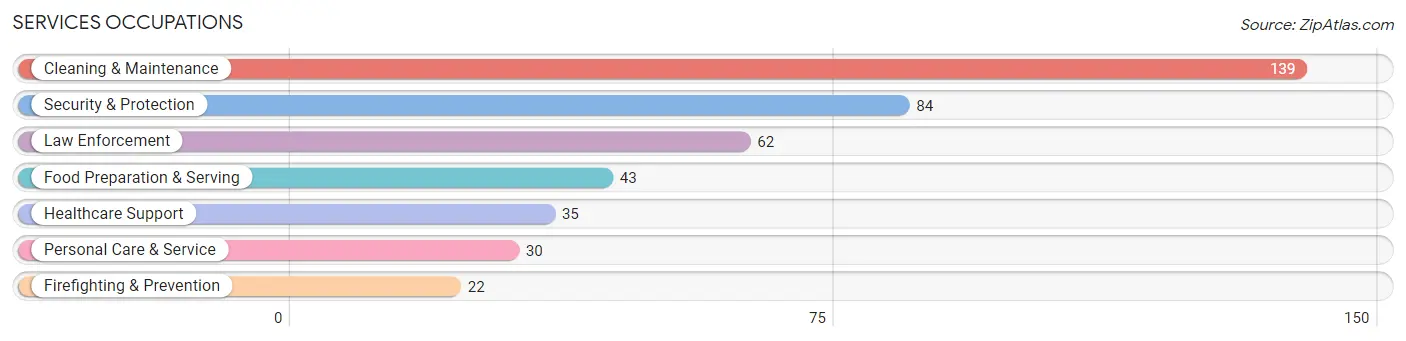
Services Occupations
The most common Services occupations in Calhoun County are Cleaning & Maintenance (139 | 8.7%), Security & Protection (84 | 5.2%), Law Enforcement (62 | 3.9%), Food Preparation & Serving (43 | 2.7%), and Healthcare Support (35 | 2.2%).
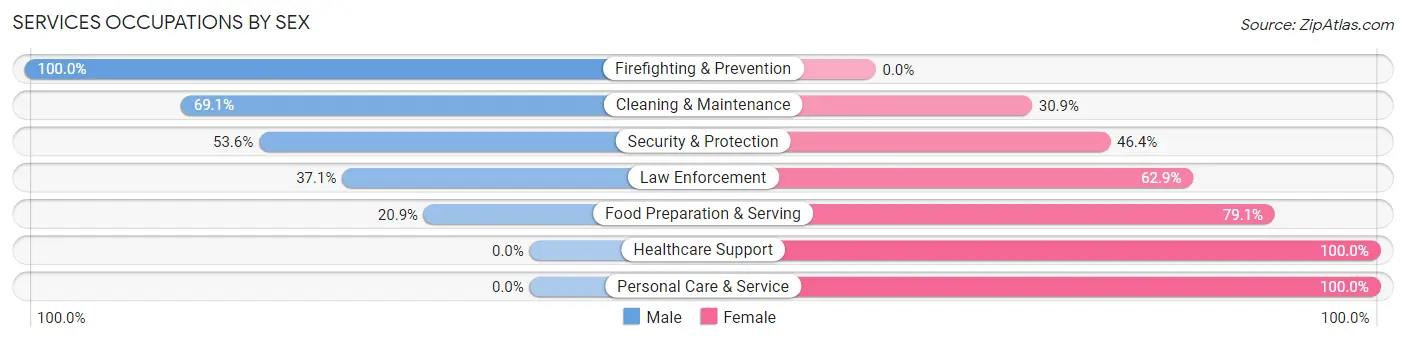
Services Occupations by Sex
Within the Services occupations in Calhoun County, the most male-oriented occupations are Firefighting & Prevention (100.0%), Cleaning & Maintenance (69.1%), and Security & Protection (53.6%), while the most female-oriented occupations are Healthcare Support (100.0%), Personal Care & Service (100.0%), and Food Preparation & Serving (79.1%).
| Occupation | Male | Female |
| Healthcare Support | 0 (0.0%) | 35 (100.0%) |
| Security & Protection | 45 (53.6%) | 39 (46.4%) |
| Firefighting & Prevention | 22 (100.0%) | 0 (0.0%) |
| Law Enforcement | 23 (37.1%) | 39 (62.9%) |
| Food Preparation & Serving | 9 (20.9%) | 34 (79.1%) |
| Cleaning & Maintenance | 96 (69.1%) | 43 (30.9%) |
| Personal Care & Service | 0 (0.0%) | 30 (100.0%) |
| Total (Category) | 150 (45.3%) | 181 (54.7%) |
| Total (Overall) | 861 (53.7%) | 742 (46.3%) |
Sales and Office Occupations
The most common Sales and Office occupations in Calhoun County are Sales & Related (183 | 11.4%), and Office & Administration (139 | 8.7%).

Sales and Office Occupations by Sex

| Occupation | Male | Female |
| Sales & Related | 116 (63.4%) | 67 (36.6%) |
| Office & Administration | 34 (24.5%) | 105 (75.5%) |
| Total (Category) | 150 (46.6%) | 172 (53.4%) |
| Total (Overall) | 861 (53.7%) | 742 (46.3%) |
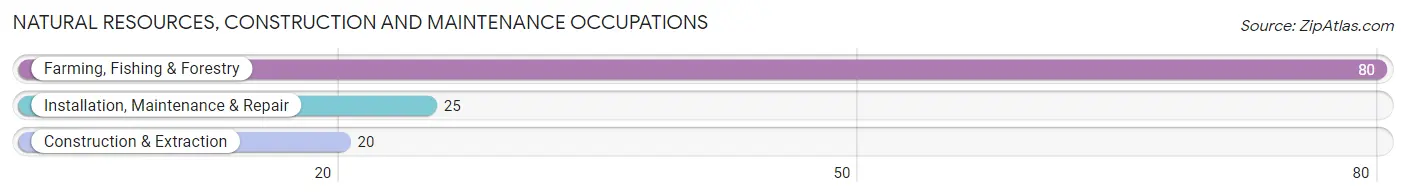
Natural Resources, Construction and Maintenance Occupations
The most common Natural Resources, Construction and Maintenance occupations in Calhoun County are Farming, Fishing & Forestry (80 | 5.0%), Installation, Maintenance & Repair (25 | 1.6%), and Construction & Extraction (20 | 1.3%).
Natural Resources, Construction and Maintenance Occupations by Sex

| Occupation | Male | Female |
| Farming, Fishing & Forestry | 80 (100.0%) | 0 (0.0%) |
| Construction & Extraction | 20 (100.0%) | 0 (0.0%) |
| Installation, Maintenance & Repair | 25 (100.0%) | 0 (0.0%) |
| Total (Category) | 125 (100.0%) | 0 (0.0%) |
| Total (Overall) | 861 (53.7%) | 742 (46.3%) |
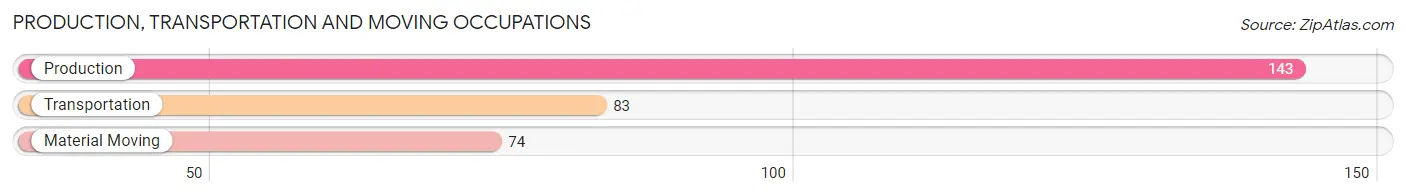
Production, Transportation and Moving Occupations
The most common Production, Transportation and Moving occupations in Calhoun County are Production (143 | 8.9%), Transportation (83 | 5.2%), and Material Moving (74 | 4.6%).
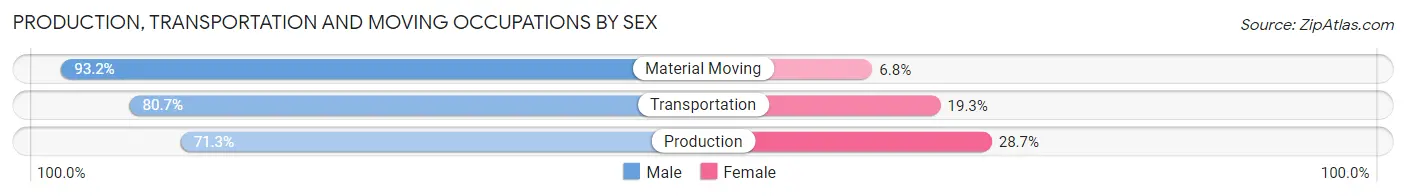
Production, Transportation and Moving Occupations by Sex
| Occupation | Male | Female |
| Production | 102 (71.3%) | 41 (28.7%) |
| Transportation | 67 (80.7%) | 16 (19.3%) |
| Material Moving | 69 (93.2%) | 5 (6.8%) |
| Total (Category) | 238 (79.3%) | 62 (20.7%) |
| Total (Overall) | 861 (53.7%) | 742 (46.3%) |
Employment Industries by Sex in Calhoun County
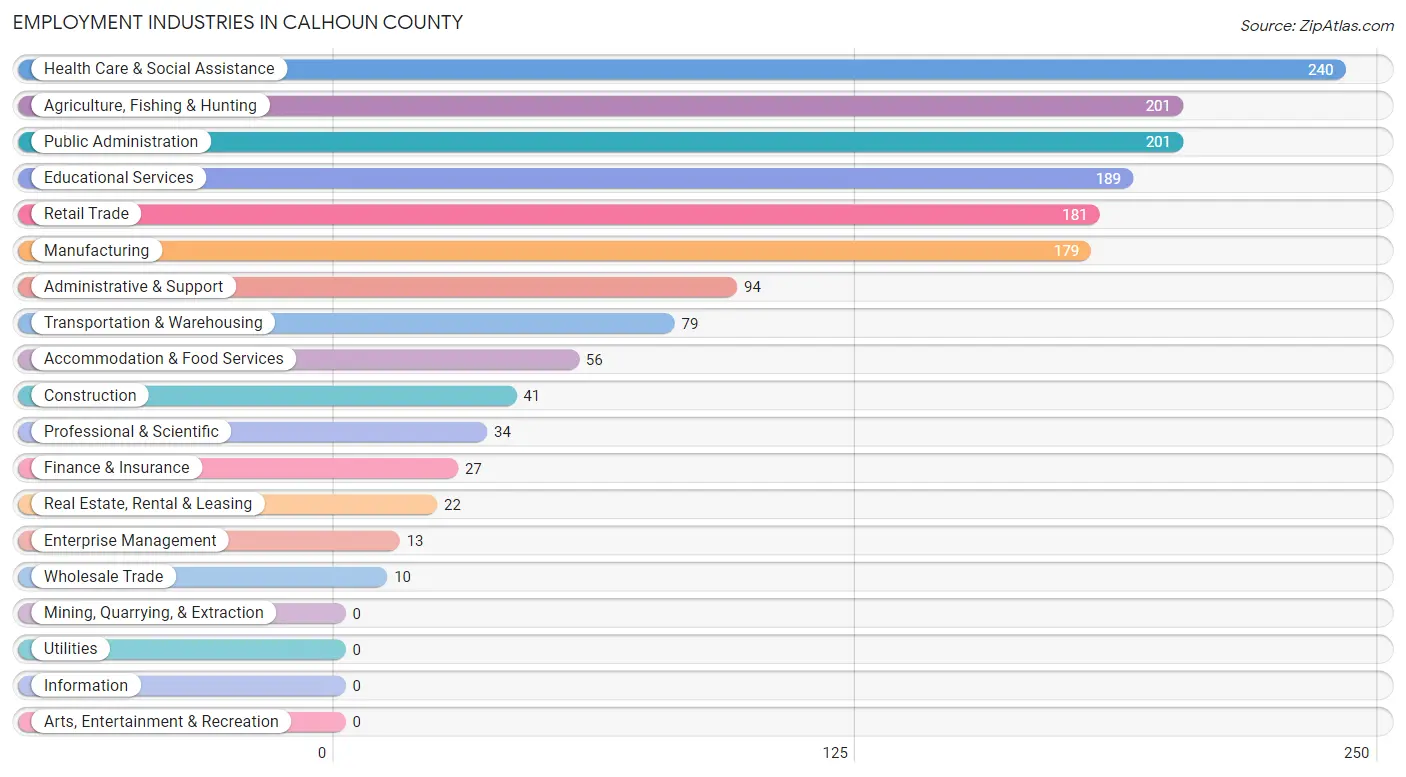
Employment Industries in Calhoun County
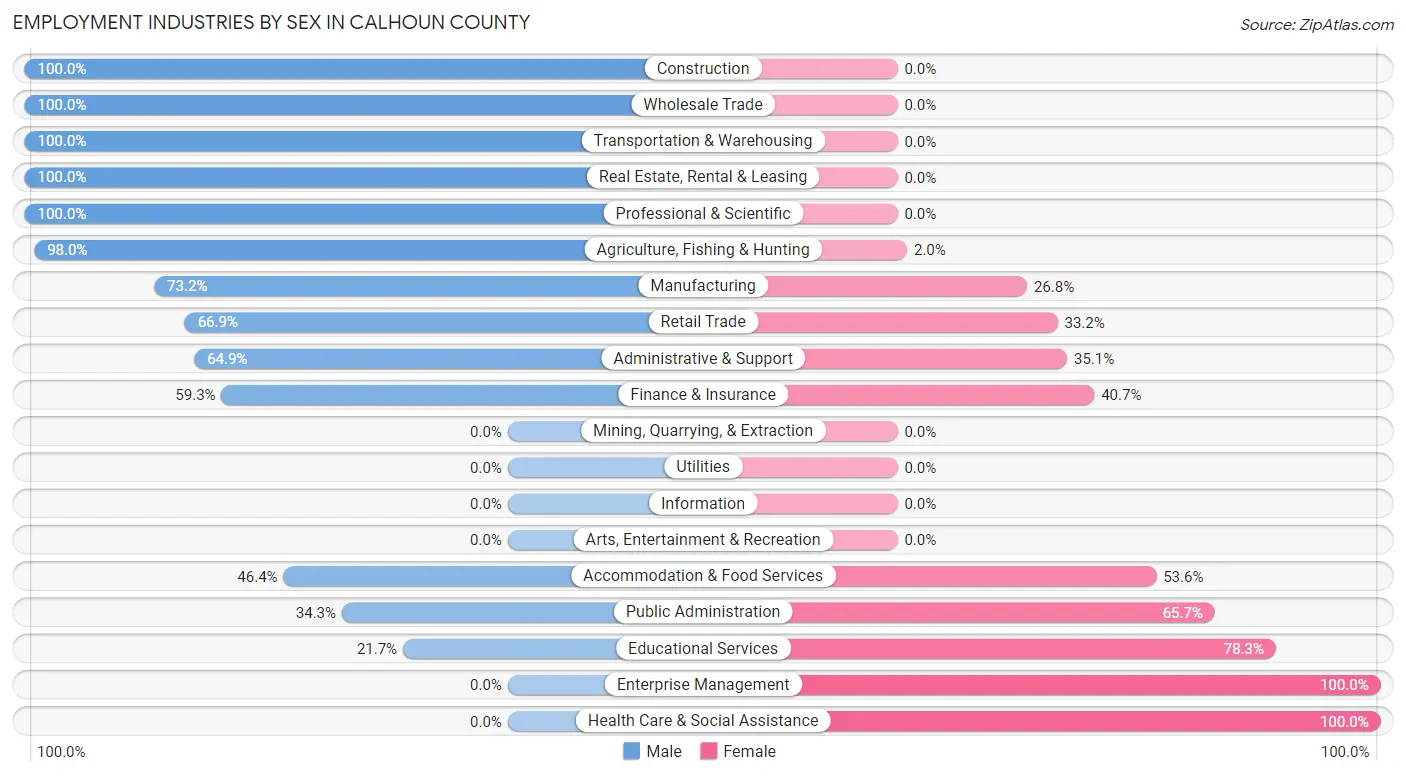
The major employment industries in Calhoun County include Health Care & Social Assistance (240 | 15.0%), Agriculture, Fishing & Hunting (201 | 12.5%), Public Administration (201 | 12.5%), Educational Services (189 | 11.8%), and Retail Trade (181 | 11.3%).
Employment Industries by Sex in Calhoun County
The Calhoun County industries that see more men than women are Construction (100.0%), Wholesale Trade (100.0%), and Transportation & Warehousing (100.0%), whereas the industries that tend to have a higher number of women are Enterprise Management (100.0%), Health Care & Social Assistance (100.0%), and Educational Services (78.3%).
| Industry | Male | Female |
| Agriculture, Fishing & Hunting | 197 (98.0%) | 4 (2.0%) |
| Mining, Quarrying, & Extraction | 0 (0.0%) | 0 (0.0%) |
| Construction | 41 (100.0%) | 0 (0.0%) |
| Manufacturing | 131 (73.2%) | 48 (26.8%) |
| Wholesale Trade | 10 (100.0%) | 0 (0.0%) |
| Retail Trade | 121 (66.8%) | 60 (33.2%) |
| Transportation & Warehousing | 79 (100.0%) | 0 (0.0%) |
| Utilities | 0 (0.0%) | 0 (0.0%) |
| Information | 0 (0.0%) | 0 (0.0%) |
| Finance & Insurance | 16 (59.3%) | 11 (40.7%) |
| Real Estate, Rental & Leasing | 22 (100.0%) | 0 (0.0%) |
| Professional & Scientific | 34 (100.0%) | 0 (0.0%) |
| Enterprise Management | 0 (0.0%) | 13 (100.0%) |
| Administrative & Support | 61 (64.9%) | 33 (35.1%) |
| Educational Services | 41 (21.7%) | 148 (78.3%) |
| Health Care & Social Assistance | 0 (0.0%) | 240 (100.0%) |
| Arts, Entertainment & Recreation | 0 (0.0%) | 0 (0.0%) |
| Accommodation & Food Services | 26 (46.4%) | 30 (53.6%) |
| Public Administration | 69 (34.3%) | 132 (65.7%) |
| Total | 861 (53.7%) | 742 (46.3%) |
Education in Calhoun County
School Enrollment in Calhoun County
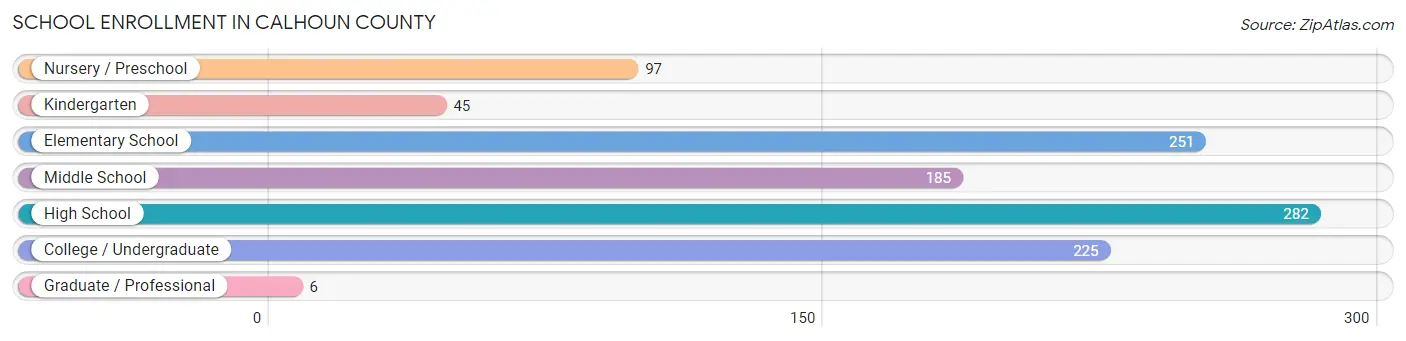
The most common levels of schooling among the 1,091 students in Calhoun County are high school (282 | 25.9%), elementary school (251 | 23.0%), and college / undergraduate (225 | 20.6%).
| School Level | # Students | % Students |
| Nursery / Preschool | 97 | 8.9% |
| Kindergarten | 45 | 4.1% |
| Elementary School | 251 | 23.0% |
| Middle School | 185 | 17.0% |
| High School | 282 | 25.9% |
| College / Undergraduate | 225 | 20.6% |
| Graduate / Professional | 6 | 0.5% |
| Total | 1,091 | 100.0% |
School Enrollment by Age by Funding Source in Calhoun County
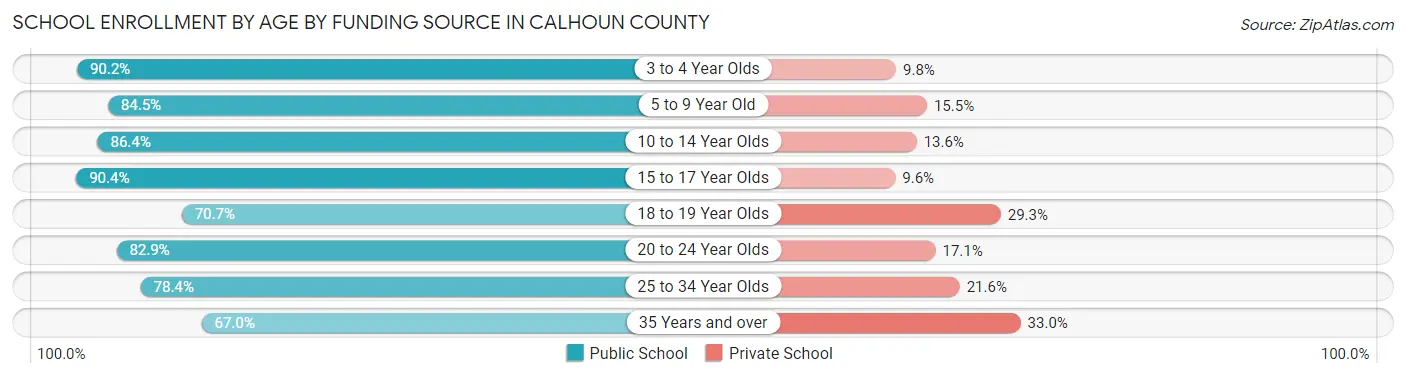
Out of a total of 1,091 students who are enrolled in schools in Calhoun County, 177 (16.2%) attend a private institution, while the remaining 914 (83.8%) are enrolled in public schools. The age group of 35 years and over has the highest likelihood of being enrolled in private schools, with 30 (33.0% in the age bracket) enrolled. Conversely, the age group of 15 to 17 year olds has the lowest likelihood of being enrolled in a private school, with 188 (90.4% in the age bracket) attending a public institution.
| Age Bracket | Public School | Private School |
| 3 to 4 Year Olds | 74 (90.2%) | 8 (9.8%) |
| 5 to 9 Year Old | 196 (84.5%) | 36 (15.5%) |
| 10 to 14 Year Olds | 216 (86.4%) | 34 (13.6%) |
| 15 to 17 Year Olds | 188 (90.4%) | 20 (9.6%) |
| 18 to 19 Year Olds | 29 (70.7%) | 12 (29.3%) |
| 20 to 24 Year Olds | 63 (82.9%) | 13 (17.1%) |
| 25 to 34 Year Olds | 87 (78.4%) | 24 (21.6%) |
| 35 Years and over | 61 (67.0%) | 30 (33.0%) |
| Total | 914 (83.8%) | 177 (16.2%) |
Educational Attainment by Field of Study in Calhoun County
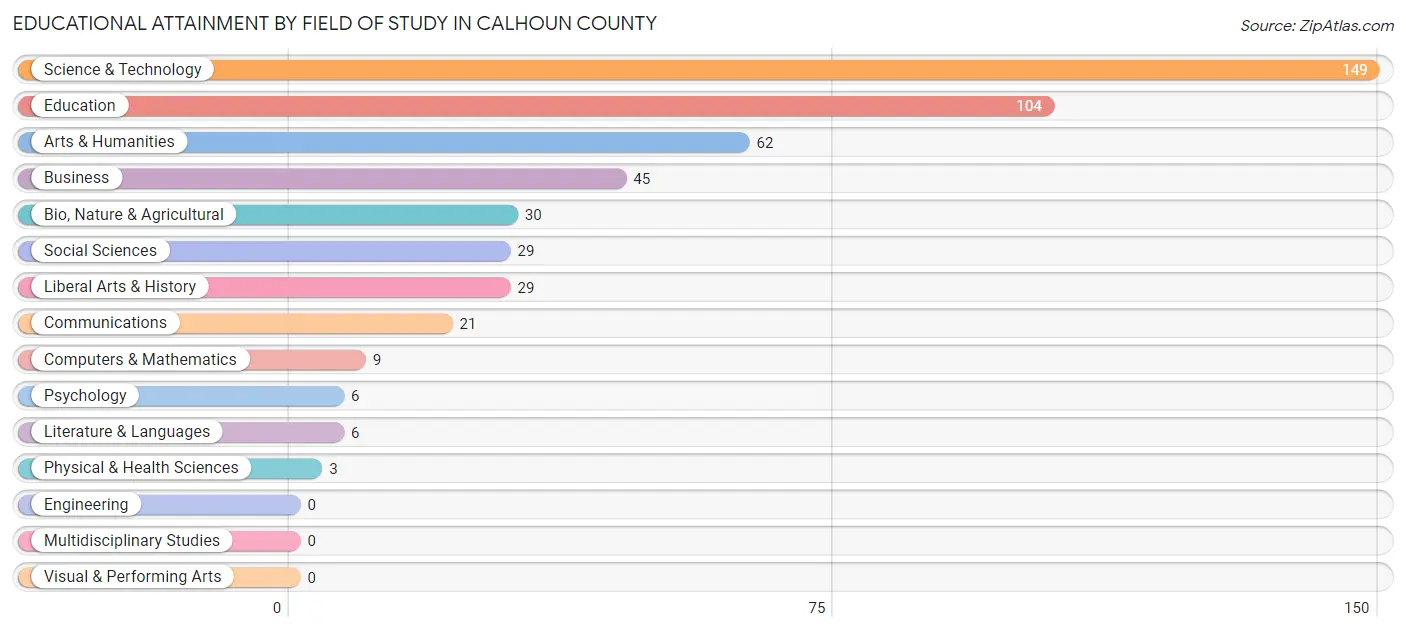
Science & technology (149 | 30.2%), education (104 | 21.1%), arts & humanities (62 | 12.6%), business (45 | 9.1%), and bio, nature & agricultural (30 | 6.1%) are the most common fields of study among 493 individuals in Calhoun County who have obtained a bachelor's degree or higher.
| Field of Study | # Graduates | % Graduates |
| Computers & Mathematics | 9 | 1.8% |
| Bio, Nature & Agricultural | 30 | 6.1% |
| Physical & Health Sciences | 3 | 0.6% |
| Psychology | 6 | 1.2% |
| Social Sciences | 29 | 5.9% |
| Engineering | 0 | 0.0% |
| Multidisciplinary Studies | 0 | 0.0% |
| Science & Technology | 149 | 30.2% |
| Business | 45 | 9.1% |
| Education | 104 | 21.1% |
| Literature & Languages | 6 | 1.2% |
| Liberal Arts & History | 29 | 5.9% |
| Visual & Performing Arts | 0 | 0.0% |
| Communications | 21 | 4.3% |
| Arts & Humanities | 62 | 12.6% |
| Total | 493 | 100.0% |
Transportation & Commute in Calhoun County
Vehicle Availability by Sex in Calhoun County
The most prevalent vehicle ownership categories in Calhoun County are males with 3 vehicles (224, accounting for 26.1%) and females with 3 vehicles (163, making up 31.2%).
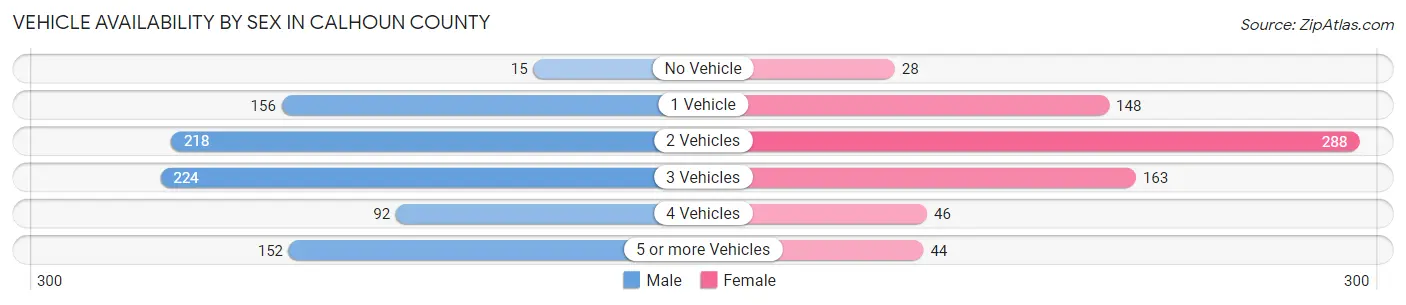
| Vehicles Available | Male | Female |
| No Vehicle | 15 (1.8%) | 28 (3.9%) |
| 1 Vehicle | 156 (18.2%) | 148 (20.6%) |
| 2 Vehicles | 218 (25.4%) | 288 (40.2%) |
| 3 Vehicles | 224 (26.1%) | 163 (22.7%) |
| 4 Vehicles | 92 (10.7%) | 46 (6.4%) |
| 5 or more Vehicles | 152 (17.7%) | 44 (6.1%) |
| Total | 857 (100.0%) | 717 (100.0%) |
Commute Time in Calhoun County
The most frequently occuring commute durations in Calhoun County are 10 to 14 minutes (288 commuters, 20.0%), 5 to 9 minutes (245 commuters, 17.0%), and 15 to 19 minutes (137 commuters, 9.5%).
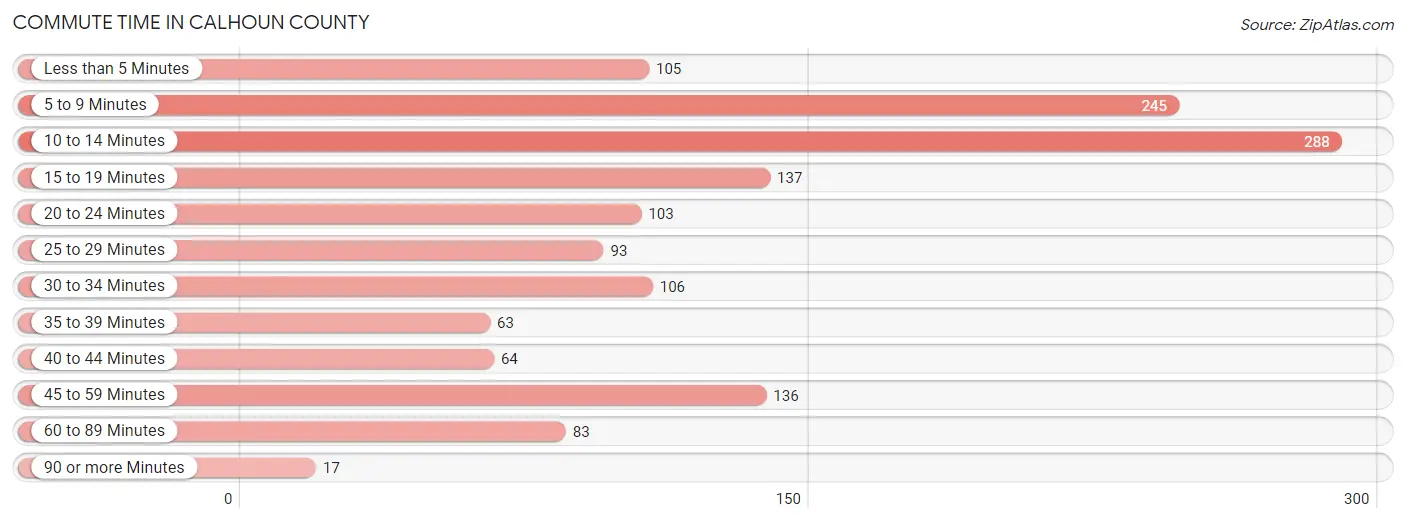
| Commute Time | # Commuters | % Commuters |
| Less than 5 Minutes | 105 | 7.3% |
| 5 to 9 Minutes | 245 | 17.0% |
| 10 to 14 Minutes | 288 | 20.0% |
| 15 to 19 Minutes | 137 | 9.5% |
| 20 to 24 Minutes | 103 | 7.1% |
| 25 to 29 Minutes | 93 | 6.5% |
| 30 to 34 Minutes | 106 | 7.4% |
| 35 to 39 Minutes | 63 | 4.4% |
| 40 to 44 Minutes | 64 | 4.4% |
| 45 to 59 Minutes | 136 | 9.4% |
| 60 to 89 Minutes | 83 | 5.8% |
| 90 or more Minutes | 17 | 1.2% |
Commute Time by Sex in Calhoun County
The most common commute times in Calhoun County are 5 to 9 minutes (162 commuters, 22.1%) for males and 10 to 14 minutes (197 commuters, 27.8%) for females.
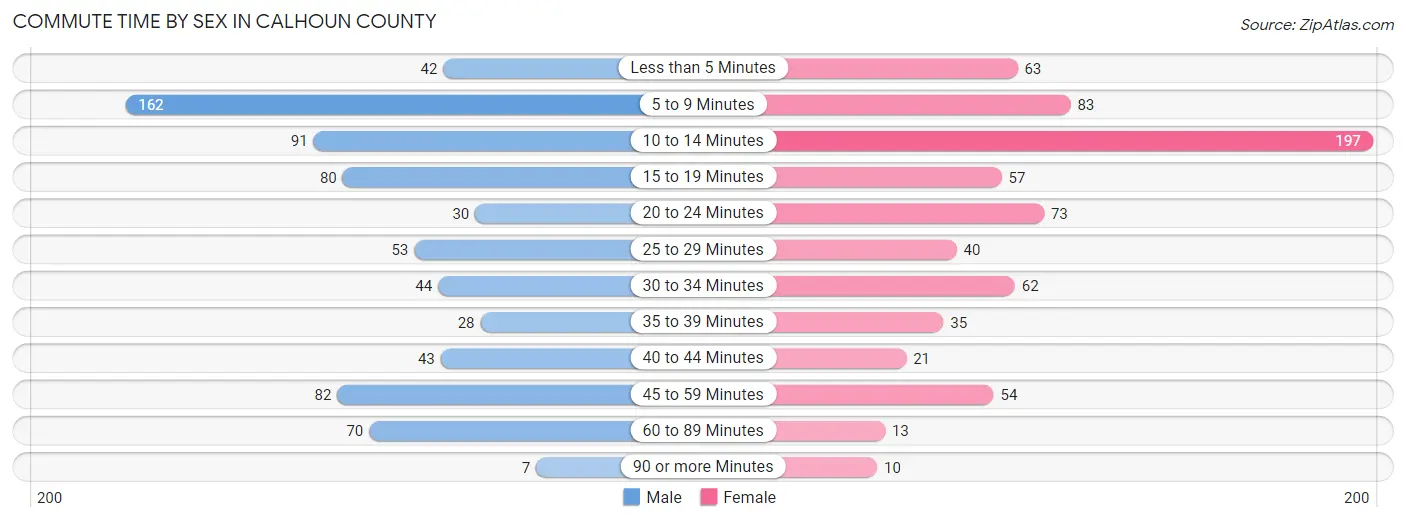
| Commute Time | Male | Female |
| Less than 5 Minutes | 42 (5.7%) | 63 (8.9%) |
| 5 to 9 Minutes | 162 (22.1%) | 83 (11.7%) |
| 10 to 14 Minutes | 91 (12.4%) | 197 (27.8%) |
| 15 to 19 Minutes | 80 (10.9%) | 57 (8.1%) |
| 20 to 24 Minutes | 30 (4.1%) | 73 (10.3%) |
| 25 to 29 Minutes | 53 (7.2%) | 40 (5.7%) |
| 30 to 34 Minutes | 44 (6.0%) | 62 (8.8%) |
| 35 to 39 Minutes | 28 (3.8%) | 35 (4.9%) |
| 40 to 44 Minutes | 43 (5.9%) | 21 (3.0%) |
| 45 to 59 Minutes | 82 (11.2%) | 54 (7.6%) |
| 60 to 89 Minutes | 70 (9.6%) | 13 (1.8%) |
| 90 or more Minutes | 7 (1.0%) | 10 (1.4%) |
Time of Departure to Work by Sex in Calhoun County
The most frequent times of departure to work in Calhoun County are 7:00 AM to 7:29 AM (154, 21.0%) for males and 7:00 AM to 7:29 AM (173, 24.4%) for females.
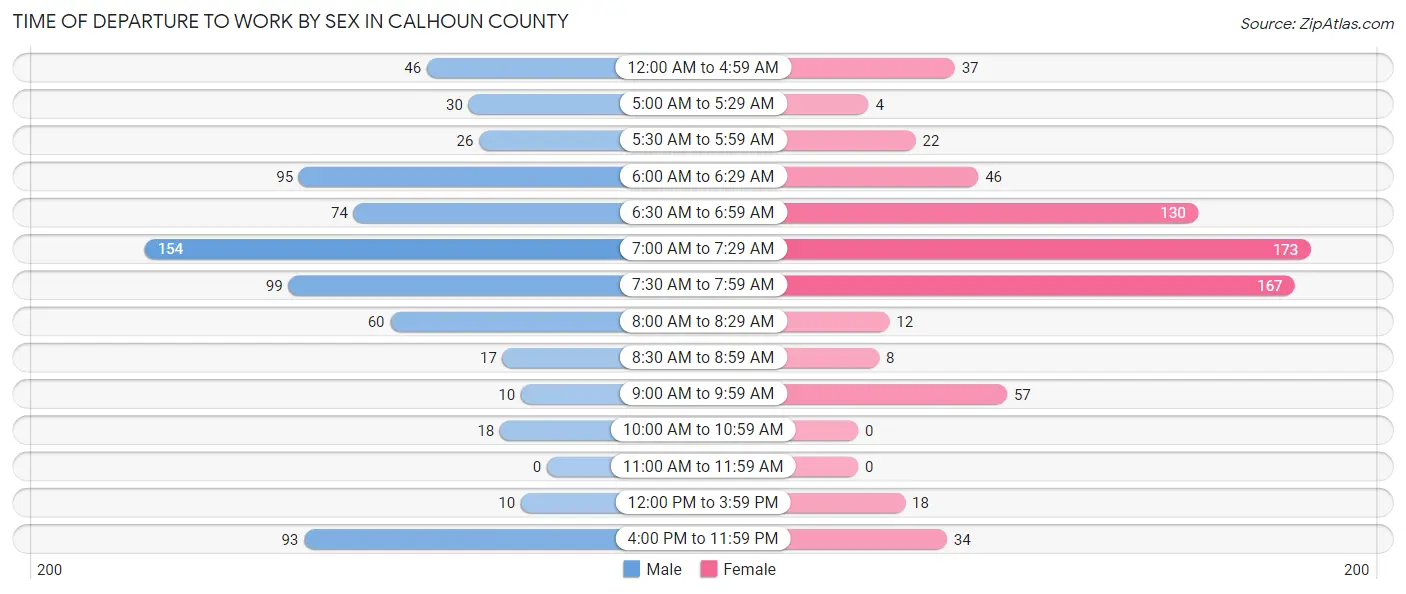
| Time of Departure | Male | Female |
| 12:00 AM to 4:59 AM | 46 (6.3%) | 37 (5.2%) |
| 5:00 AM to 5:29 AM | 30 (4.1%) | 4 (0.6%) |
| 5:30 AM to 5:59 AM | 26 (3.5%) | 22 (3.1%) |
| 6:00 AM to 6:29 AM | 95 (13.0%) | 46 (6.5%) |
| 6:30 AM to 6:59 AM | 74 (10.1%) | 130 (18.4%) |
| 7:00 AM to 7:29 AM | 154 (21.0%) | 173 (24.4%) |
| 7:30 AM to 7:59 AM | 99 (13.5%) | 167 (23.6%) |
| 8:00 AM to 8:29 AM | 60 (8.2%) | 12 (1.7%) |
| 8:30 AM to 8:59 AM | 17 (2.3%) | 8 (1.1%) |
| 9:00 AM to 9:59 AM | 10 (1.4%) | 57 (8.1%) |
| 10:00 AM to 10:59 AM | 18 (2.5%) | 0 (0.0%) |
| 11:00 AM to 11:59 AM | 0 (0.0%) | 0 (0.0%) |
| 12:00 PM to 3:59 PM | 10 (1.4%) | 18 (2.5%) |
| 4:00 PM to 11:59 PM | 93 (12.7%) | 34 (4.8%) |
| Total | 732 (100.0%) | 708 (100.0%) |
Housing Occupancy in Calhoun County
Occupancy by Ownership in Calhoun County
Of the total 1,497 dwellings in Calhoun County, owner-occupied units account for 980 (65.5%), while renter-occupied units make up 517 (34.5%).
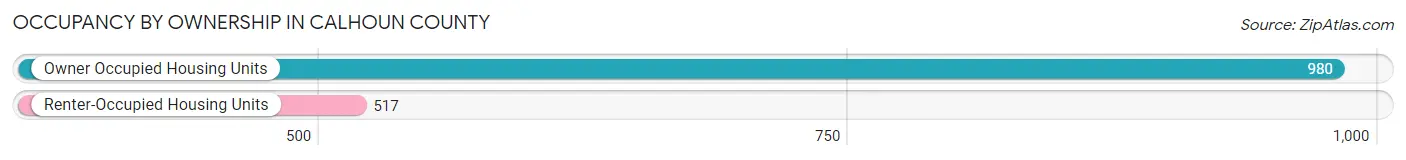
| Occupancy | # Housing Units | % Housing Units |
| Owner Occupied Housing Units | 980 | 65.5% |
| Renter-Occupied Housing Units | 517 | 34.5% |
| Total Occupied Housing Units | 1,497 | 100.0% |
Occupancy by Household Size in Calhoun County
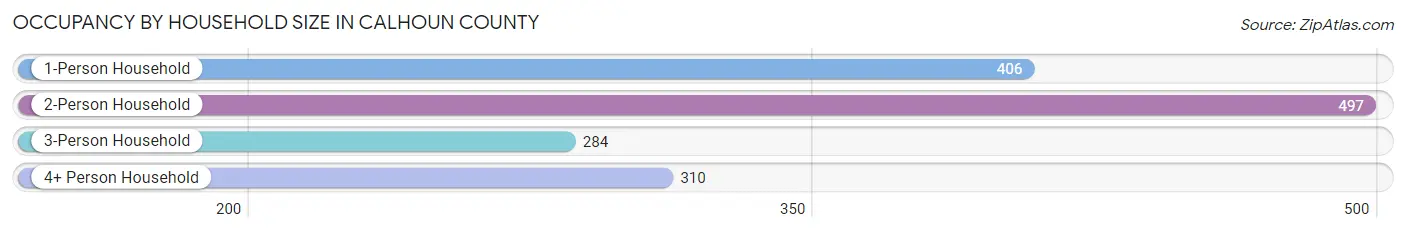
| Household Size | # Housing Units | % Housing Units |
| 1-Person Household | 406 | 27.1% |
| 2-Person Household | 497 | 33.2% |
| 3-Person Household | 284 | 19.0% |
| 4+ Person Household | 310 | 20.7% |
| Total Housing Units | 1,497 | 100.0% |
Occupancy by Ownership by Household Size in Calhoun County
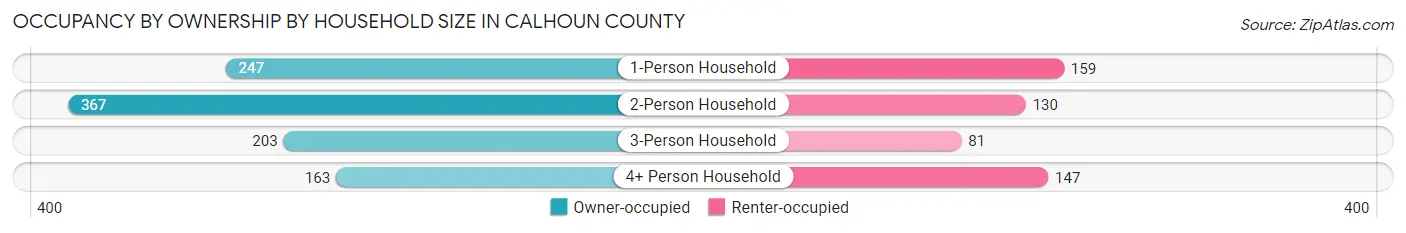
| Household Size | Owner-occupied | Renter-occupied |
| 1-Person Household | 247 (60.8%) | 159 (39.2%) |
| 2-Person Household | 367 (73.8%) | 130 (26.2%) |
| 3-Person Household | 203 (71.5%) | 81 (28.5%) |
| 4+ Person Household | 163 (52.6%) | 147 (47.4%) |
| Total Housing Units | 980 (65.5%) | 517 (34.5%) |
Occupancy by Educational Attainment in Calhoun County
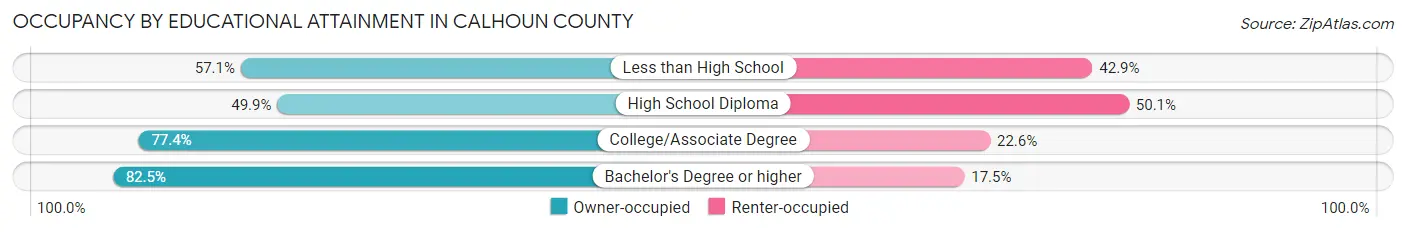
| Household Size | Owner-occupied | Renter-occupied |
| Less than High School | 144 (57.1%) | 108 (42.9%) |
| High School Diploma | 259 (49.9%) | 260 (50.1%) |
| College/Associate Degree | 336 (77.4%) | 98 (22.6%) |
| Bachelor's Degree or higher | 241 (82.5%) | 51 (17.5%) |
Occupancy by Age of Householder in Calhoun County
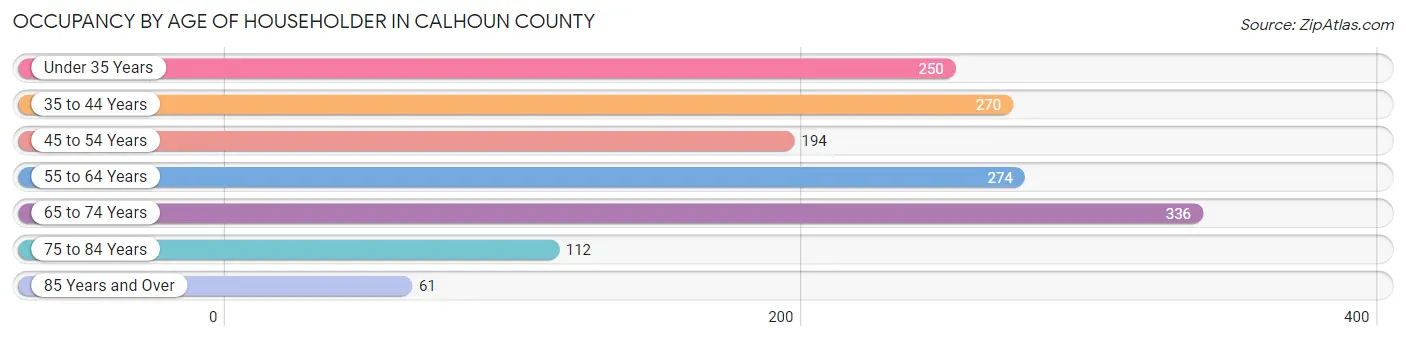
| Age Bracket | # Households | % Households |
| Under 35 Years | 250 | 16.7% |
| 35 to 44 Years | 270 | 18.0% |
| 45 to 54 Years | 194 | 13.0% |
| 55 to 64 Years | 274 | 18.3% |
| 65 to 74 Years | 336 | 22.4% |
| 75 to 84 Years | 112 | 7.5% |
| 85 Years and Over | 61 | 4.1% |
| Total | 1,497 | 100.0% |
Housing Finances in Calhoun County
Median Income by Occupancy in Calhoun County
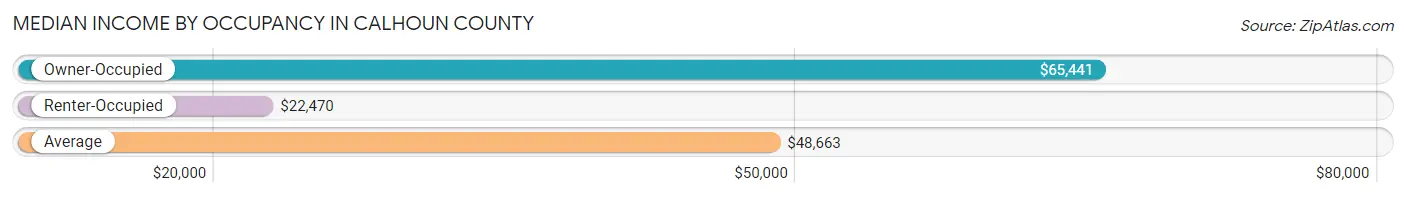
| Occupancy Type | # Households | Median Income |
| Owner-Occupied | 980 (65.5%) | $65,441 |
| Renter-Occupied | 517 (34.5%) | $22,470 |
| Average | 1,497 (100.0%) | $48,663 |
Occupancy by Householder Income Bracket in Calhoun County
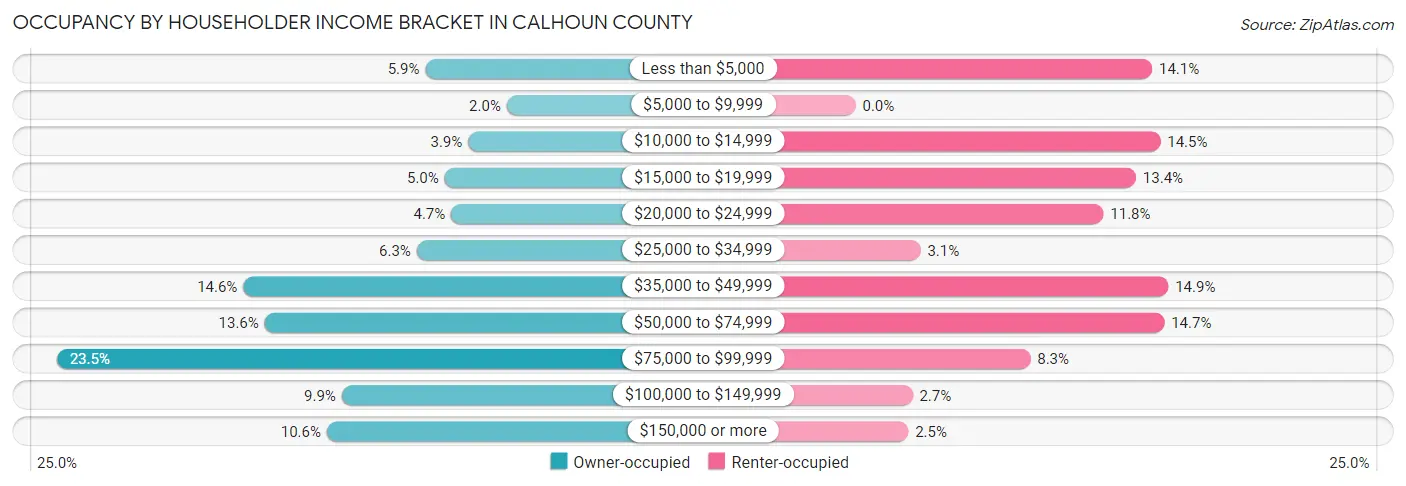
| Income Bracket | Owner-occupied | Renter-occupied |
| Less than $5,000 | 58 (5.9%) | 73 (14.1%) |
| $5,000 to $9,999 | 20 (2.0%) | 0 (0.0%) |
| $10,000 to $14,999 | 38 (3.9%) | 75 (14.5%) |
| $15,000 to $19,999 | 49 (5.0%) | 69 (13.4%) |
| $20,000 to $24,999 | 46 (4.7%) | 61 (11.8%) |
| $25,000 to $34,999 | 62 (6.3%) | 16 (3.1%) |
| $35,000 to $49,999 | 143 (14.6%) | 77 (14.9%) |
| $50,000 to $74,999 | 133 (13.6%) | 76 (14.7%) |
| $75,000 to $99,999 | 230 (23.5%) | 43 (8.3%) |
| $100,000 to $149,999 | 97 (9.9%) | 14 (2.7%) |
| $150,000 or more | 104 (10.6%) | 13 (2.5%) |
| Total | 980 (100.0%) | 517 (100.0%) |
Monthly Housing Cost Tiers in Calhoun County
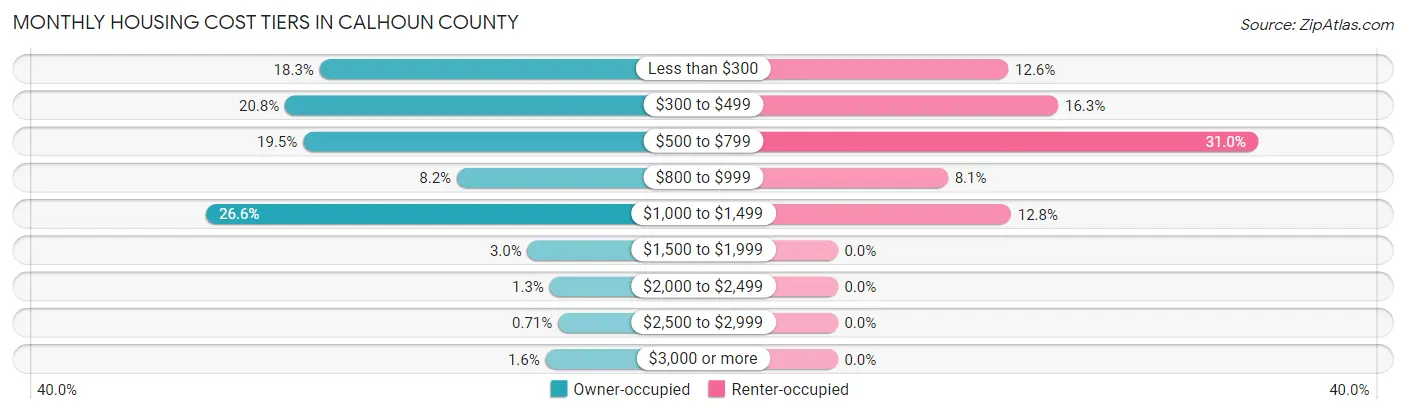
| Monthly Cost | Owner-occupied | Renter-occupied |
| Less than $300 | 179 (18.3%) | 65 (12.6%) |
| $300 to $499 | 204 (20.8%) | 84 (16.3%) |
| $500 to $799 | 191 (19.5%) | 160 (30.9%) |
| $800 to $999 | 80 (8.2%) | 42 (8.1%) |
| $1,000 to $1,499 | 261 (26.6%) | 66 (12.8%) |
| $1,500 to $1,999 | 29 (3.0%) | 0 (0.0%) |
| $2,000 to $2,499 | 13 (1.3%) | 0 (0.0%) |
| $2,500 to $2,999 | 7 (0.7%) | 0 (0.0%) |
| $3,000 or more | 16 (1.6%) | 0 (0.0%) |
| Total | 980 (100.0%) | 517 (100.0%) |
Physical Housing Characteristics in Calhoun County
Housing Structures in Calhoun County
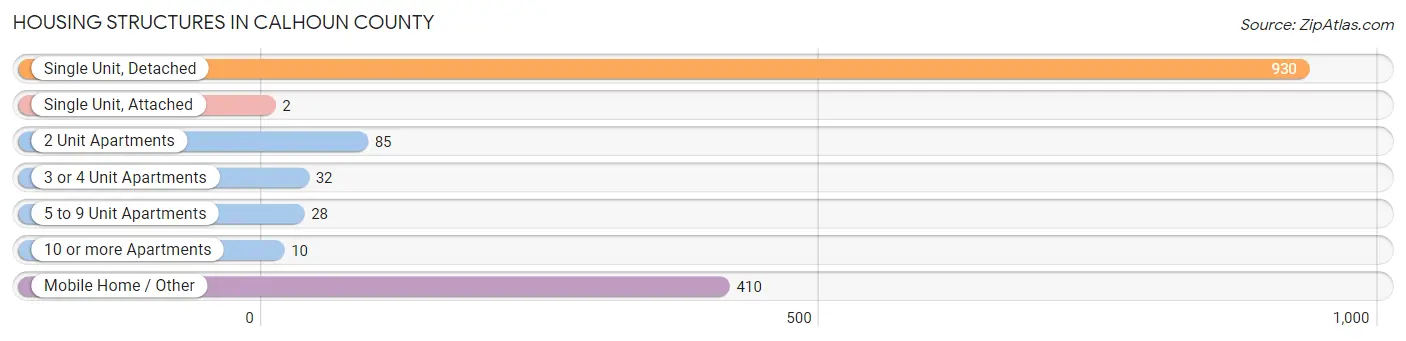
| Structure Type | # Housing Units | % Housing Units |
| Single Unit, Detached | 930 | 62.1% |
| Single Unit, Attached | 2 | 0.1% |
| 2 Unit Apartments | 85 | 5.7% |
| 3 or 4 Unit Apartments | 32 | 2.1% |
| 5 to 9 Unit Apartments | 28 | 1.9% |
| 10 or more Apartments | 10 | 0.7% |
| Mobile Home / Other | 410 | 27.4% |
| Total | 1,497 | 100.0% |
Housing Structures by Occupancy in Calhoun County
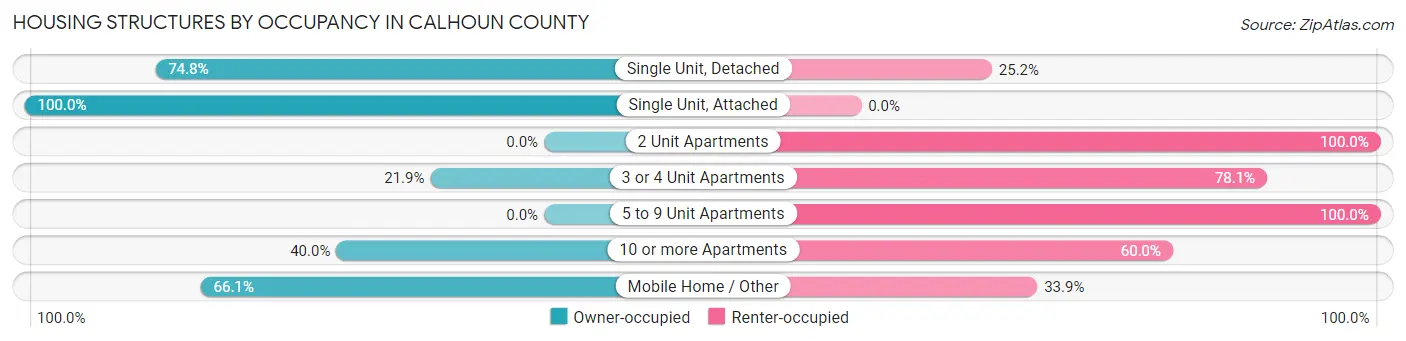
| Structure Type | Owner-occupied | Renter-occupied |
| Single Unit, Detached | 696 (74.8%) | 234 (25.2%) |
| Single Unit, Attached | 2 (100.0%) | 0 (0.0%) |
| 2 Unit Apartments | 0 (0.0%) | 85 (100.0%) |
| 3 or 4 Unit Apartments | 7 (21.9%) | 25 (78.1%) |
| 5 to 9 Unit Apartments | 0 (0.0%) | 28 (100.0%) |
| 10 or more Apartments | 4 (40.0%) | 6 (60.0%) |
| Mobile Home / Other | 271 (66.1%) | 139 (33.9%) |
| Total | 980 (65.5%) | 517 (34.5%) |
Housing Structures by Number of Rooms in Calhoun County
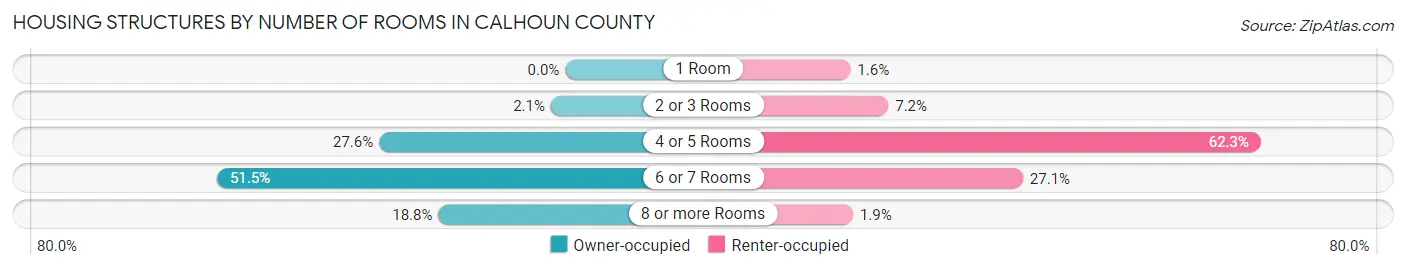
| Number of Rooms | Owner-occupied | Renter-occupied |
| 1 Room | 0 (0.0%) | 8 (1.5%) |
| 2 or 3 Rooms | 21 (2.1%) | 37 (7.2%) |
| 4 or 5 Rooms | 270 (27.6%) | 322 (62.3%) |
| 6 or 7 Rooms | 505 (51.5%) | 140 (27.1%) |
| 8 or more Rooms | 184 (18.8%) | 10 (1.9%) |
| Total | 980 (100.0%) | 517 (100.0%) |
Housing Structure by Heating Type in Calhoun County
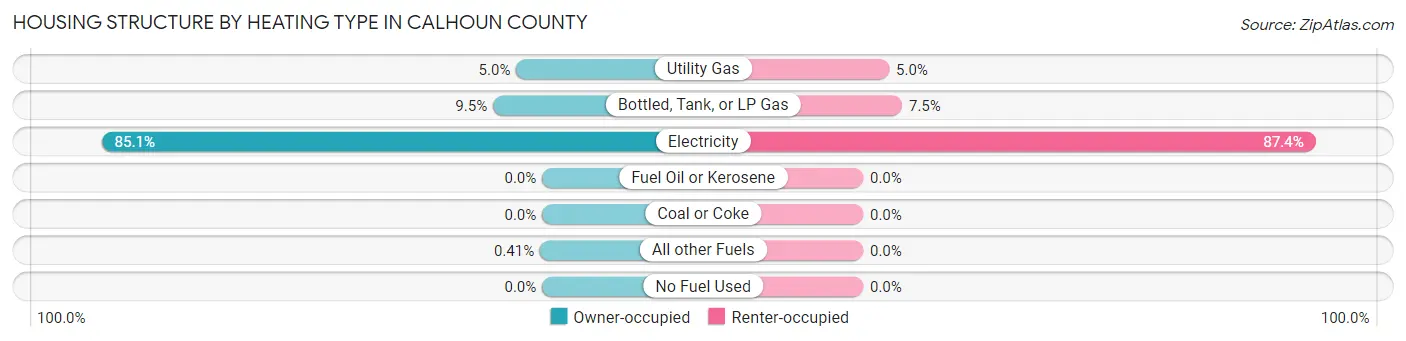
| Heating Type | Owner-occupied | Renter-occupied |
| Utility Gas | 49 (5.0%) | 26 (5.0%) |
| Bottled, Tank, or LP Gas | 93 (9.5%) | 39 (7.5%) |
| Electricity | 834 (85.1%) | 452 (87.4%) |
| Fuel Oil or Kerosene | 0 (0.0%) | 0 (0.0%) |
| Coal or Coke | 0 (0.0%) | 0 (0.0%) |
| All other Fuels | 4 (0.4%) | 0 (0.0%) |
| No Fuel Used | 0 (0.0%) | 0 (0.0%) |
| Total | 980 (100.0%) | 517 (100.0%) |
Household Vehicle Usage in Calhoun County
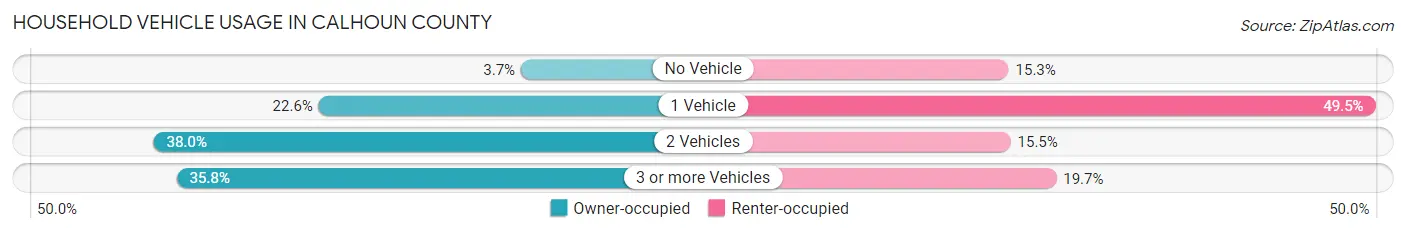
| Vehicles per Household | Owner-occupied | Renter-occupied |
| No Vehicle | 36 (3.7%) | 79 (15.3%) |
| 1 Vehicle | 221 (22.6%) | 256 (49.5%) |
| 2 Vehicles | 372 (38.0%) | 80 (15.5%) |
| 3 or more Vehicles | 351 (35.8%) | 102 (19.7%) |
| Total | 980 (100.0%) | 517 (100.0%) |
Real Estate & Mortgages in Calhoun County
Real Estate and Mortgage Overview in Calhoun County
| Characteristic | Without Mortgage | With Mortgage |
| Housing Units | 523 | 457 |
| Median Property Value | $78,500 | $76,000 |
| Median Household Income | $61,369 | $57 |
| Monthly Housing Costs | $410 | $16 |
| Real Estate Taxes | $781 | $16 |
Property Value by Mortgage Status in Calhoun County
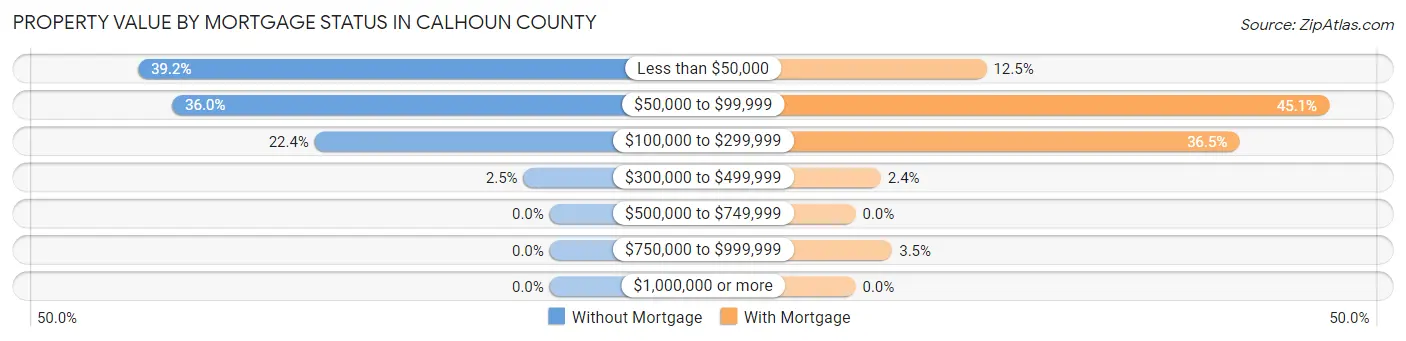
| Property Value | Without Mortgage | With Mortgage |
| Less than $50,000 | 205 (39.2%) | 57 (12.5%) |
| $50,000 to $99,999 | 188 (35.9%) | 206 (45.1%) |
| $100,000 to $299,999 | 117 (22.4%) | 167 (36.5%) |
| $300,000 to $499,999 | 13 (2.5%) | 11 (2.4%) |
| $500,000 to $749,999 | 0 (0.0%) | 0 (0.0%) |
| $750,000 to $999,999 | 0 (0.0%) | 16 (3.5%) |
| $1,000,000 or more | 0 (0.0%) | 0 (0.0%) |
| Total | 523 (100.0%) | 457 (100.0%) |
Household Income by Mortgage Status in Calhoun County
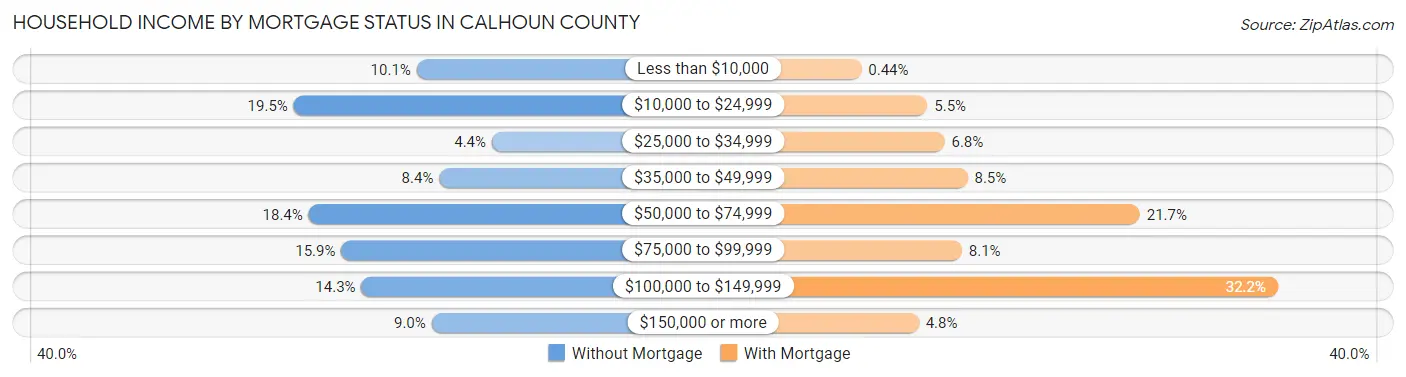
| Household Income | Without Mortgage | With Mortgage |
| Less than $10,000 | 53 (10.1%) | 2 (0.4%) |
| $10,000 to $24,999 | 102 (19.5%) | 25 (5.5%) |
| $25,000 to $34,999 | 23 (4.4%) | 31 (6.8%) |
| $35,000 to $49,999 | 44 (8.4%) | 39 (8.5%) |
| $50,000 to $74,999 | 96 (18.4%) | 99 (21.7%) |
| $75,000 to $99,999 | 83 (15.9%) | 37 (8.1%) |
| $100,000 to $149,999 | 75 (14.3%) | 147 (32.2%) |
| $150,000 or more | 47 (9.0%) | 22 (4.8%) |
| Total | 523 (100.0%) | 457 (100.0%) |
Property Value to Household Income Ratio in Calhoun County
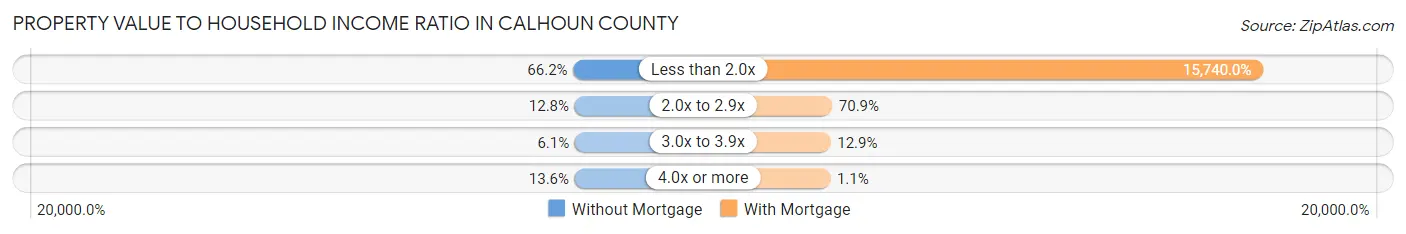
| Value-to-Income Ratio | Without Mortgage | With Mortgage |
| Less than 2.0x | 346 (66.2%) | 71,932 (15,740.0%) |
| 2.0x to 2.9x | 67 (12.8%) | 324 (70.9%) |
| 3.0x to 3.9x | 32 (6.1%) | 59 (12.9%) |
| 4.0x or more | 71 (13.6%) | 5 (1.1%) |
| Total | 523 (100.0%) | 457 (100.0%) |
Real Estate Taxes by Mortgage Status in Calhoun County
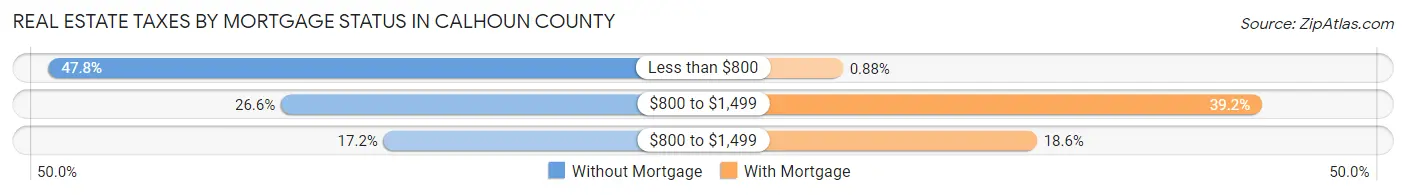
| Property Taxes | Without Mortgage | With Mortgage |
| Less than $800 | 250 (47.8%) | 4 (0.9%) |
| $800 to $1,499 | 139 (26.6%) | 179 (39.2%) |
| $800 to $1,499 | 90 (17.2%) | 85 (18.6%) |
| Total | 523 (100.0%) | 457 (100.0%) |
Health & Disability in Calhoun County
Health Insurance Coverage by Age in Calhoun County
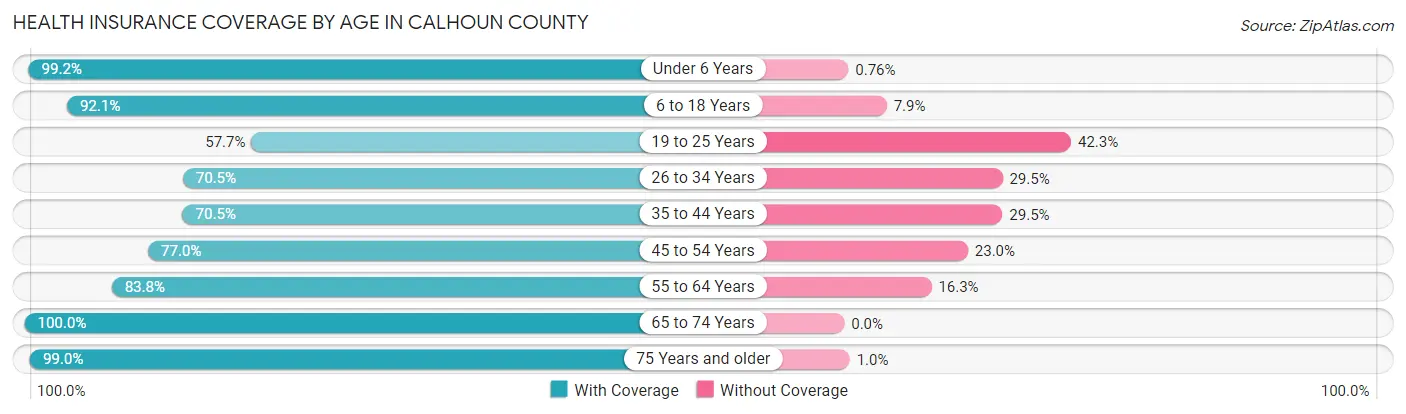
| Age Bracket | With Coverage | Without Coverage |
| Under 6 Years | 260 (99.2%) | 2 (0.8%) |
| 6 to 18 Years | 710 (92.1%) | 61 (7.9%) |
| 19 to 25 Years | 142 (57.7%) | 104 (42.3%) |
| 26 to 34 Years | 239 (70.5%) | 100 (29.5%) |
| 35 to 44 Years | 390 (70.5%) | 163 (29.5%) |
| 45 to 54 Years | 314 (77.0%) | 94 (23.0%) |
| 55 to 64 Years | 433 (83.8%) | 84 (16.3%) |
| 65 to 74 Years | 507 (100.0%) | 0 (0.0%) |
| 75 Years and older | 294 (99.0%) | 3 (1.0%) |
| Total | 3,289 (84.3%) | 611 (15.7%) |
Health Insurance Coverage by Citizenship Status in Calhoun County
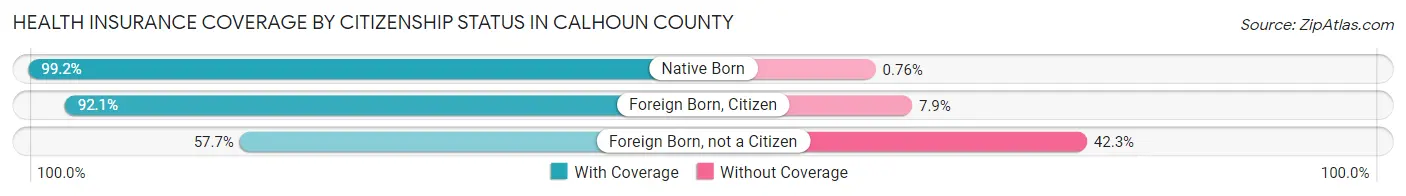
| Citizenship Status | With Coverage | Without Coverage |
| Native Born | 260 (99.2%) | 2 (0.8%) |
| Foreign Born, Citizen | 710 (92.1%) | 61 (7.9%) |
| Foreign Born, not a Citizen | 142 (57.7%) | 104 (42.3%) |
Health Insurance Coverage by Household Income in Calhoun County
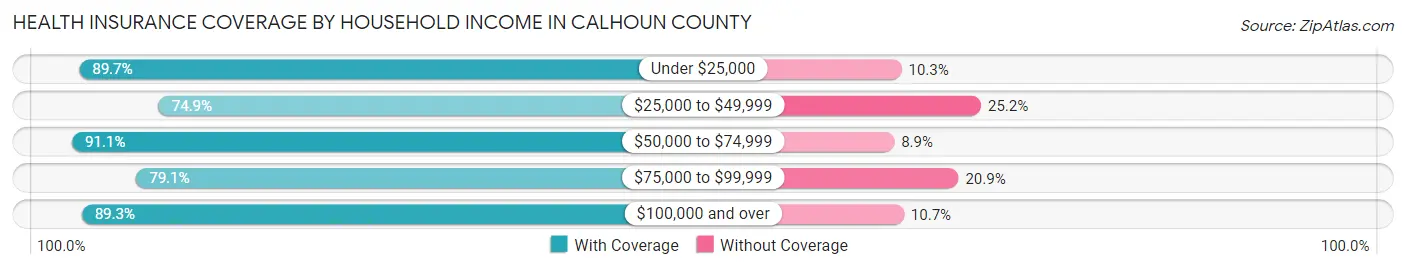
| Household Income | With Coverage | Without Coverage |
| Under $25,000 | 892 (89.7%) | 102 (10.3%) |
| $25,000 to $49,999 | 640 (74.9%) | 215 (25.2%) |
| $50,000 to $74,999 | 543 (91.1%) | 53 (8.9%) |
| $75,000 to $99,999 | 661 (79.1%) | 175 (20.9%) |
| $100,000 and over | 551 (89.3%) | 66 (10.7%) |
Public vs Private Health Insurance Coverage by Age in Calhoun County
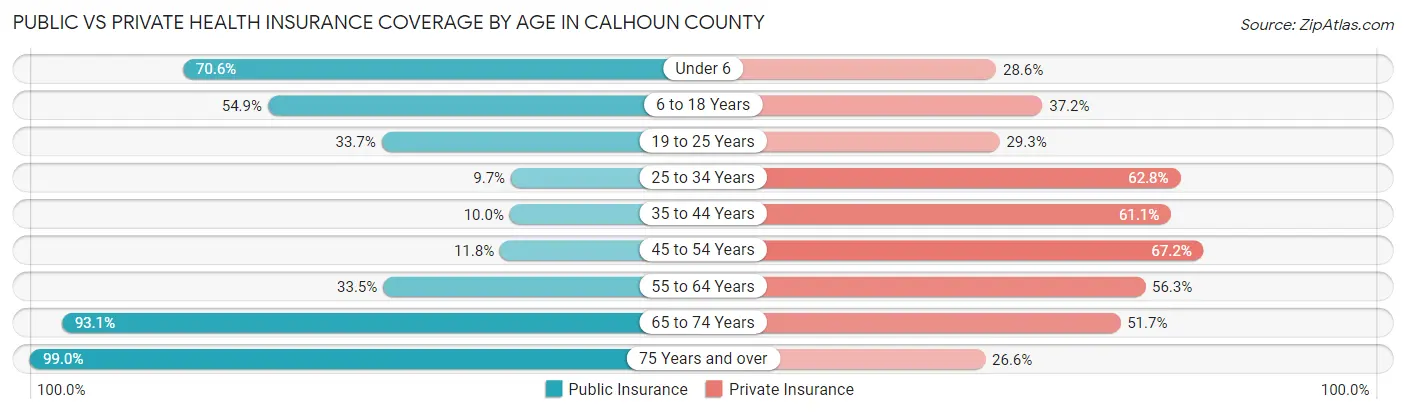
| Age Bracket | Public Insurance | Private Insurance |
| Under 6 | 185 (70.6%) | 75 (28.6%) |
| 6 to 18 Years | 423 (54.9%) | 287 (37.2%) |
| 19 to 25 Years | 83 (33.7%) | 72 (29.3%) |
| 25 to 34 Years | 33 (9.7%) | 213 (62.8%) |
| 35 to 44 Years | 55 (10.0%) | 338 (61.1%) |
| 45 to 54 Years | 48 (11.8%) | 274 (67.2%) |
| 55 to 64 Years | 173 (33.5%) | 291 (56.3%) |
| 65 to 74 Years | 472 (93.1%) | 262 (51.7%) |
| 75 Years and over | 294 (99.0%) | 79 (26.6%) |
| Total | 1,766 (45.3%) | 1,891 (48.5%) |
Disability Status by Sex by Age in Calhoun County
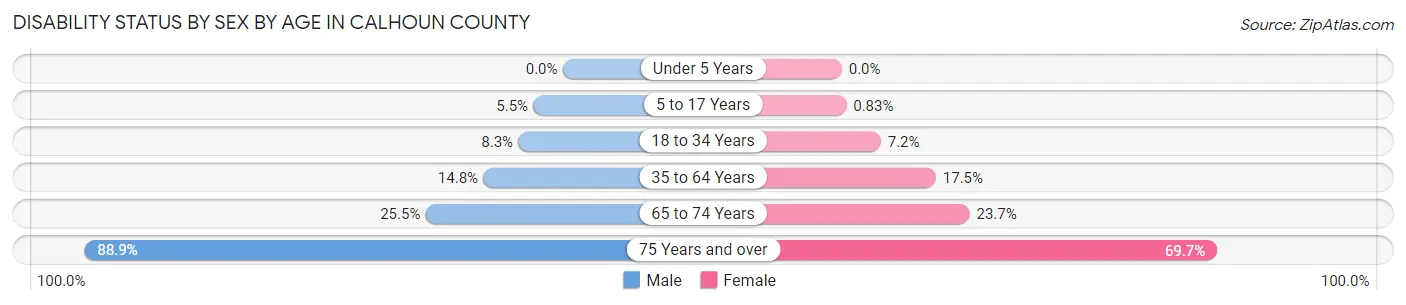
| Age Bracket | Male | Female |
| Under 5 Years | 0 (0.0%) | 0 (0.0%) |
| 5 to 17 Years | 20 (5.5%) | 3 (0.8%) |
| 18 to 34 Years | 24 (8.3%) | 28 (7.2%) |
| 35 to 64 Years | 104 (14.7%) | 135 (17.5%) |
| 65 to 74 Years | 70 (25.5%) | 55 (23.7%) |
| 75 Years and over | 56 (88.9%) | 163 (69.7%) |
Disability Class by Sex by Age in Calhoun County
Disability Class: Hearing Difficulty
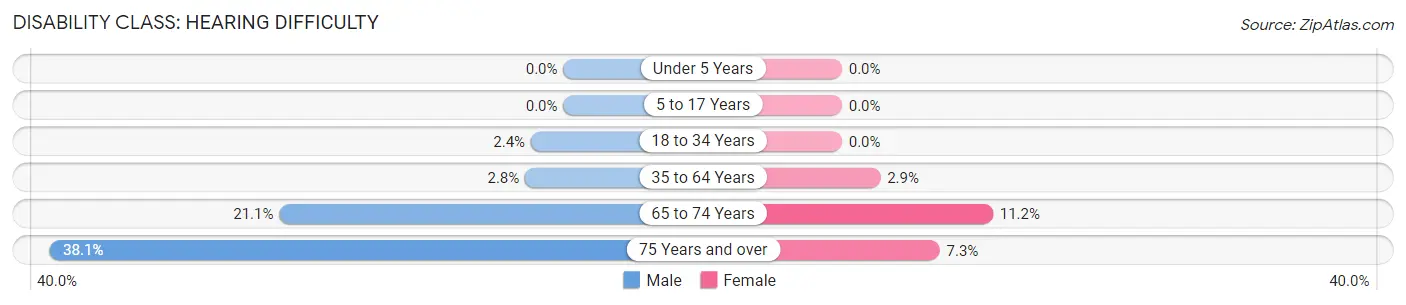
| Age Bracket | Male | Female |
| Under 5 Years | 0 (0.0%) | 0 (0.0%) |
| 5 to 17 Years | 0 (0.0%) | 0 (0.0%) |
| 18 to 34 Years | 7 (2.4%) | 0 (0.0%) |
| 35 to 64 Years | 20 (2.8%) | 22 (2.9%) |
| 65 to 74 Years | 58 (21.1%) | 26 (11.2%) |
| 75 Years and over | 24 (38.1%) | 17 (7.3%) |
Disability Class: Vision Difficulty
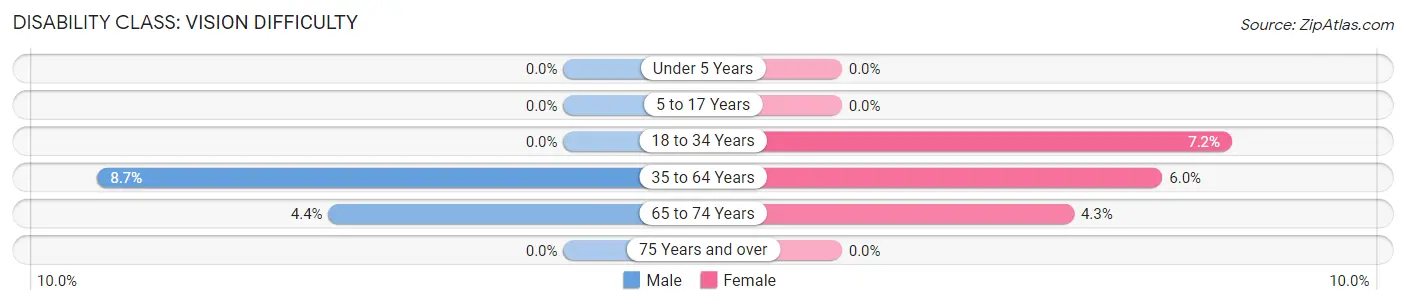
| Age Bracket | Male | Female |
| Under 5 Years | 0 (0.0%) | 0 (0.0%) |
| 5 to 17 Years | 0 (0.0%) | 0 (0.0%) |
| 18 to 34 Years | 0 (0.0%) | 28 (7.2%) |
| 35 to 64 Years | 61 (8.6%) | 46 (5.9%) |
| 65 to 74 Years | 12 (4.4%) | 10 (4.3%) |
| 75 Years and over | 0 (0.0%) | 0 (0.0%) |
Disability Class: Cognitive Difficulty
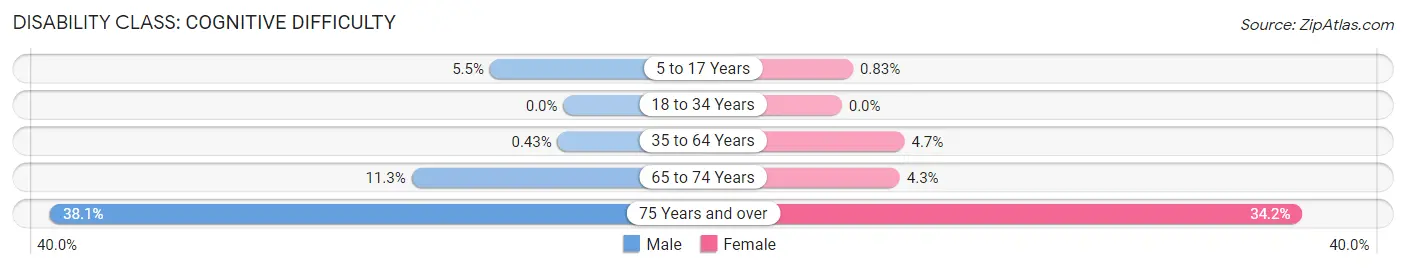
| Age Bracket | Male | Female |
| 5 to 17 Years | 20 (5.5%) | 3 (0.8%) |
| 18 to 34 Years | 0 (0.0%) | 0 (0.0%) |
| 35 to 64 Years | 3 (0.4%) | 36 (4.7%) |
| 65 to 74 Years | 31 (11.3%) | 10 (4.3%) |
| 75 Years and over | 24 (38.1%) | 80 (34.2%) |
Disability Class: Ambulatory Difficulty
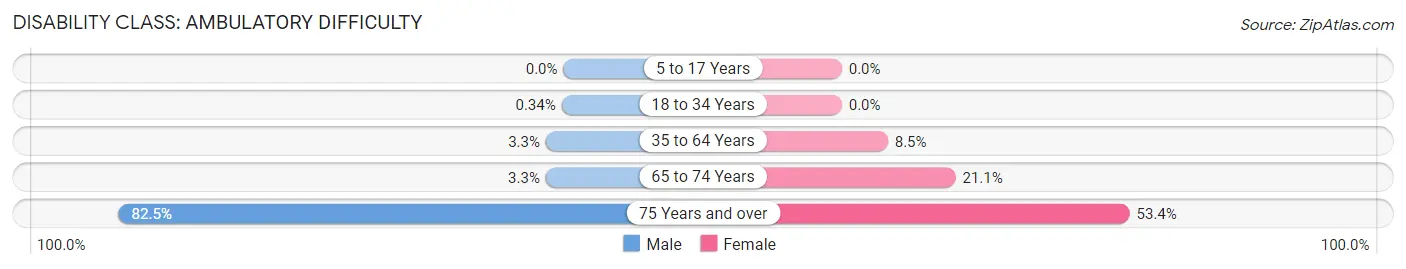
| Age Bracket | Male | Female |
| 5 to 17 Years | 0 (0.0%) | 0 (0.0%) |
| 18 to 34 Years | 1 (0.3%) | 0 (0.0%) |
| 35 to 64 Years | 23 (3.3%) | 66 (8.5%) |
| 65 to 74 Years | 9 (3.3%) | 49 (21.1%) |
| 75 Years and over | 52 (82.5%) | 125 (53.4%) |
Disability Class: Self-Care Difficulty
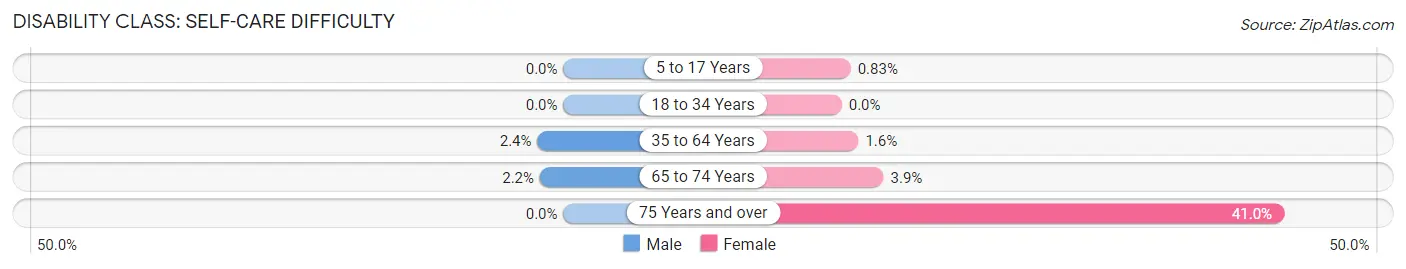
| Age Bracket | Male | Female |
| 5 to 17 Years | 0 (0.0%) | 3 (0.8%) |
| 18 to 34 Years | 0 (0.0%) | 0 (0.0%) |
| 35 to 64 Years | 17 (2.4%) | 12 (1.5%) |
| 65 to 74 Years | 6 (2.2%) | 9 (3.9%) |
| 75 Years and over | 0 (0.0%) | 96 (41.0%) |
Technology Access in Calhoun County
Computing Device Access in Calhoun County
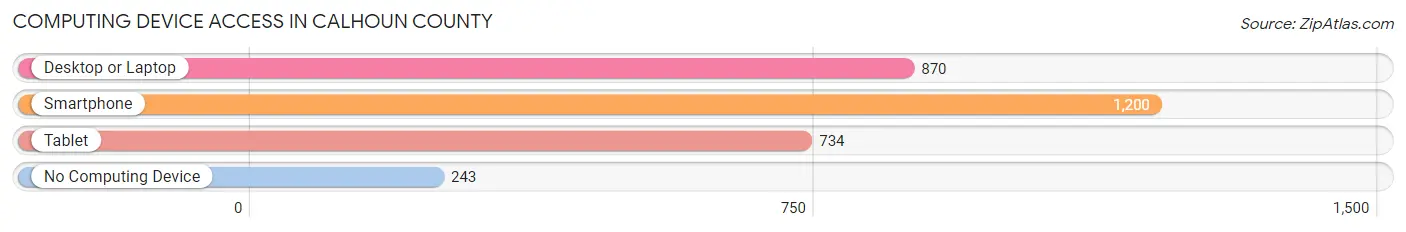
| Device Type | # Households | % Households |
| Desktop or Laptop | 870 | 58.1% |
| Smartphone | 1,200 | 80.2% |
| Tablet | 734 | 49.0% |
| No Computing Device | 243 | 16.2% |
| Total | 1,497 | 100.0% |
Internet Access in Calhoun County
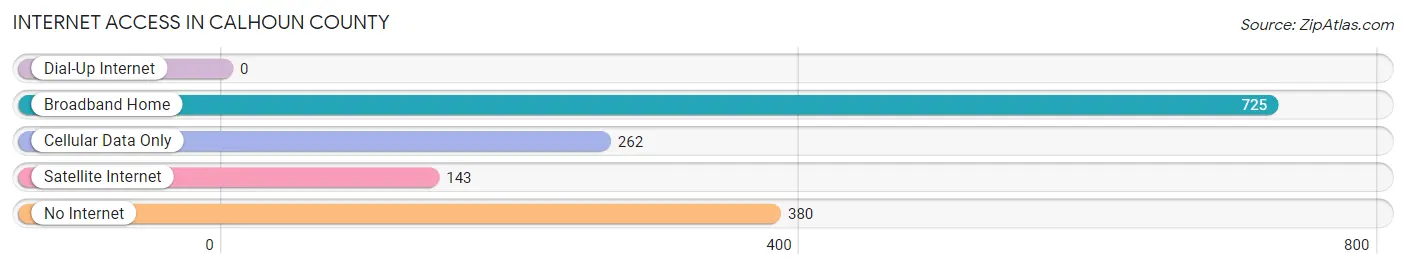
| Internet Type | # Households | % Households |
| Dial-Up Internet | 0 | 0.0% |
| Broadband Home | 725 | 48.4% |
| Cellular Data Only | 262 | 17.5% |
| Satellite Internet | 143 | 9.6% |
| No Internet | 380 | 25.4% |
| Total | 1,497 | 100.0% |
Calhoun County Summary
Calhoun County is located in the southwestern corner of Georgia, and is part of the Albany metropolitan area. The county was created in 1854 from parts of Early and Randolph counties. It is named for John C. Calhoun, a prominent politician and statesman from South Carolina. The county seat is Morgan, and the largest city is Edison.
Geography
Calhoun County covers an area of 441 square miles, of which 437 square miles is land and 4 square miles is water. The county is located in the Coastal Plain region of Georgia, and is bordered by Early County to the north, Randolph County to the east, Clay County to the south, and Miller County to the west. The Flint River runs through the county, and there are several small lakes and ponds. The terrain is mostly flat, with some rolling hills in the northern part of the county.
Demographics
As of the 2010 census, there were 6,694 people, 2,541 households, and 1,817 families living in the county. The population density was 15.3 people per square mile. The racial makeup of the county was 68.3% White, 28.3% Black or African American, 0.3% Native American, 0.3% Asian, 0.1% Pacific Islander, 1.2% from other races, and 1.5% from two or more races. 2.7% of the population were Hispanic or Latino of any race.
The median income for a household in the county was $30,945, and the median income for a family was $37,917. The per capita income for the county was $15,845. About 20.3% of the population were below the poverty line.
Economy
Calhoun County is largely rural, and the economy is based on agriculture and forestry. The main crops grown in the county are cotton, corn, peanuts, and soybeans. The county is also home to several timber companies, and there are several sawmills in the area.
The county is home to several small businesses, including a few restaurants, convenience stores, and gas stations. There are also several small manufacturing companies in the county, including a furniture factory and a paper mill.
Education
Calhoun County is served by the Calhoun County School District, which operates seven elementary schools, two middle schools, and one high school. The county is also home to several private schools, including a Christian school and a Montessori school.
Conclusion
Calhoun County is a rural county located in the southwestern corner of Georgia. The county is home to a diverse population, and the economy is based on agriculture and forestry. The county is served by the Calhoun County School District, which operates seven elementary schools, two middle schools, and one high school. The county is also home to several small businesses, including restaurants, convenience stores, and manufacturing companies.
Common Questions
What is Per Capita Income in Calhoun County?
Per Capita income in Calhoun County is $18,074.
What is the Median Family Income in Calhoun County?
Median Family Income in Calhoun County is $56,071.
What is the Median Household income in Calhoun County?
Median Household Income in Calhoun County is $48,663.
What is Income or Wage Gap in Calhoun County?
Income or Wage Gap in Calhoun County is 19.1%.
Women in Calhoun County earn 80.9 cents for every dollar earned by a man.
What is Family Income Deficit in Calhoun County?
Family Income Deficit in Calhoun County is $14,084.
Families that are below poverty line in Calhoun County earn $14,084 less on average than the poverty threshold level.
What is Inequality or Gini Index in Calhoun County?
Inequality or Gini Index in Calhoun County is 0.49.
What is the Total Population of Calhoun County?
Total Population of Calhoun County is 5,594.
What is the Total Male Population of Calhoun County?
Total Male Population of Calhoun County is 3,461.
What is the Total Female Population of Calhoun County?
Total Female Population of Calhoun County is 2,133.
What is the Ratio of Males per 100 Females in Calhoun County?
There are 162.26 Males per 100 Females in Calhoun County.
What is the Ratio of Females per 100 Males in Calhoun County?
There are 61.63 Females per 100 Males in Calhoun County.
What is the Median Population Age in Calhoun County?
Median Population Age in Calhoun County is 39.2 Years.
What is the Average Family Size in Calhoun County
Average Family Size in Calhoun County is 3.1 People.
What is the Average Household Size in Calhoun County
Average Household Size in Calhoun County is 2.6 People.
How Large is the Labor Force in Calhoun County?
There are 1,809 People in the Labor Forcein in Calhoun County.
What is the Percentage of People in the Labor Force in Calhoun County?
37.4% of People are in the Labor Force in Calhoun County.
What is the Unemployment Rate in Calhoun County?
Unemployment Rate in Calhoun County is 11.4%.