Ben Hill County, GA Map & Demographics
Ben Hill County Map
Ben Hill County Overview
$22,625
PER CAPITA INCOME
$42,861
AVG FAMILY INCOME
$38,255
AVG HOUSEHOLD INCOME
19.4%
WAGE / INCOME GAP [ % ]
80.6¢/ $1
WAGE / INCOME GAP [ $ ]
$12,051
FAMILY INCOME DEFICIT
0.50
INEQUALITY / GINI INDEX
17,169
TOTAL POPULATION
8,075
MALE POPULATION
9,094
FEMALE POPULATION
88.79
MALES / 100 FEMALES
112.62
FEMALES / 100 MALES
38.7
MEDIAN AGE
3.0
AVG FAMILY SIZE
2.4
AVG HOUSEHOLD SIZE
7,501
LABOR FORCE [ PEOPLE ]
55.4%
PERCENT IN LABOR FORCE
5.0%
UNEMPLOYMENT RATE
Ben Hill County Area Codes
Income in Ben Hill County
Income Overview in Ben Hill County
Per Capita Income in Ben Hill County is $22,625, while median incomes of families and households are $42,861 and $38,255 respectively.
| Characteristic | Number | Measure |
| Per Capita Income | 17,169 | $22,625 |
| Median Family Income | 4,586 | $42,861 |
| Mean Family Income | 4,586 | $62,438 |
| Median Household Income | 7,126 | $38,255 |
| Mean Household Income | 7,126 | $54,433 |
| Income Deficit | 4,586 | $12,051 |
| Wage / Income Gap (%) | 17,169 | 19.41% |
| Wage / Income Gap ($) | 17,169 | 80.59¢ per $1 |
| Gini / Inequality Index | 17,169 | 0.50 |
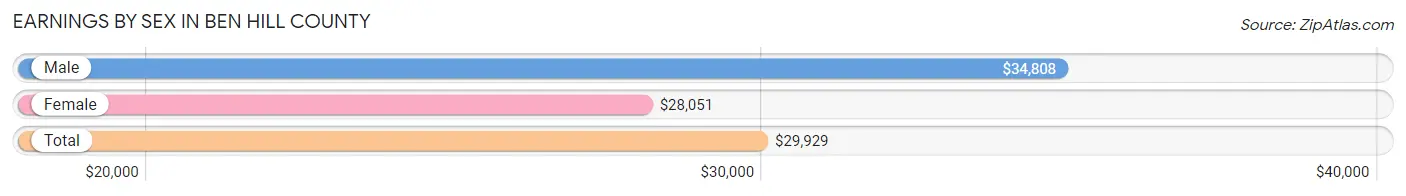
Earnings by Sex in Ben Hill County
Average Earnings in Ben Hill County are $29,929, $34,808 for men and $28,051 for women, a difference of 19.4%.
| Sex | Number | Average Earnings |
| Male | 3,844 (50.0%) | $34,808 |
| Female | 3,840 (50.0%) | $28,051 |
| Total | 7,684 (100.0%) | $29,929 |
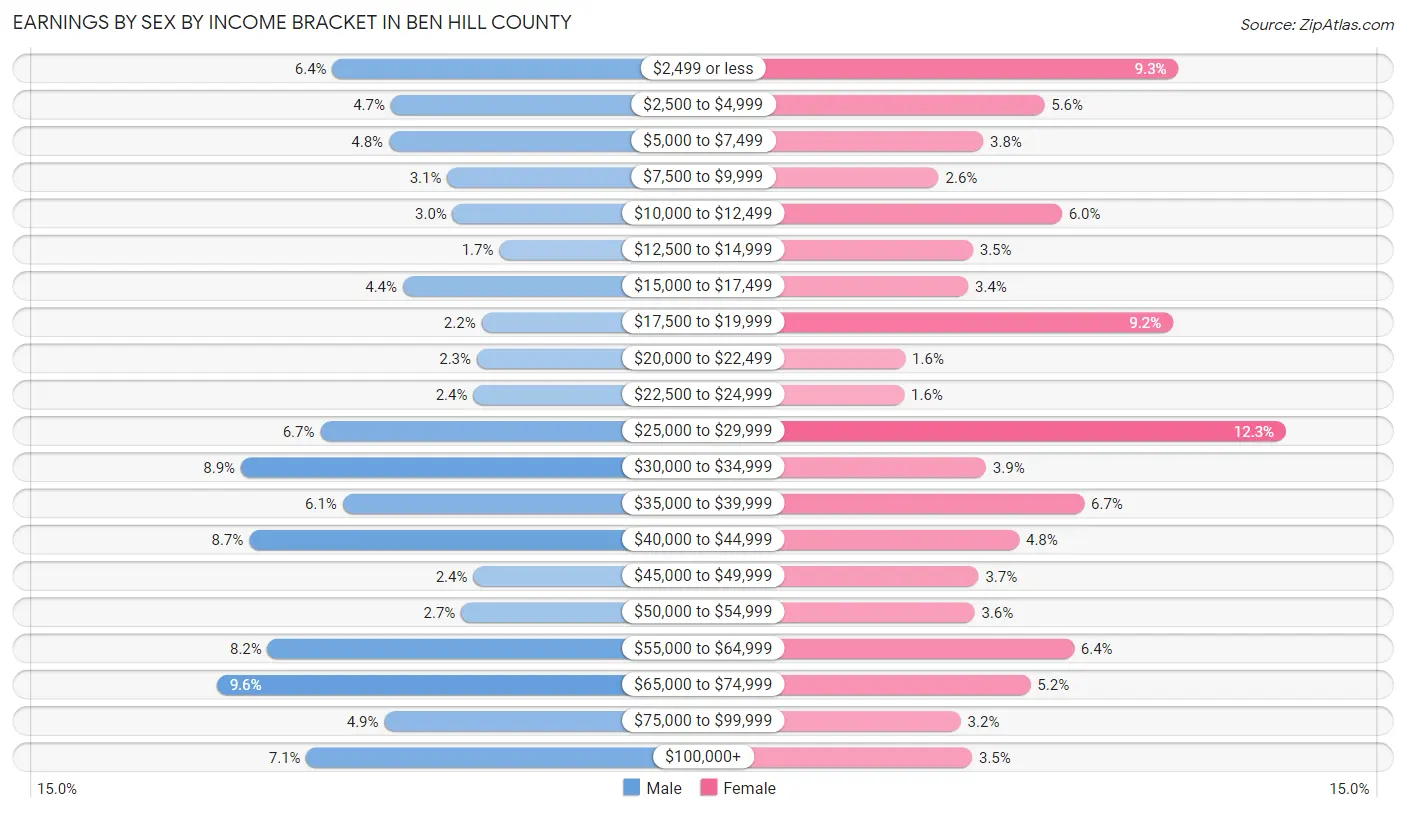
Earnings by Sex by Income Bracket in Ben Hill County
The most common earnings brackets in Ben Hill County are $65,000 to $74,999 for men (369 | 9.6%) and $25,000 to $29,999 for women (474 | 12.3%).
| Income | Male | Female |
| $2,499 or less | 244 (6.4%) | 358 (9.3%) |
| $2,500 to $4,999 | 181 (4.7%) | 213 (5.6%) |
| $5,000 to $7,499 | 183 (4.8%) | 147 (3.8%) |
| $7,500 to $9,999 | 120 (3.1%) | 99 (2.6%) |
| $10,000 to $12,499 | 114 (3.0%) | 232 (6.0%) |
| $12,500 to $14,999 | 64 (1.7%) | 136 (3.5%) |
| $15,000 to $17,499 | 168 (4.4%) | 131 (3.4%) |
| $17,500 to $19,999 | 83 (2.2%) | 352 (9.2%) |
| $20,000 to $22,499 | 88 (2.3%) | 63 (1.6%) |
| $22,500 to $24,999 | 92 (2.4%) | 62 (1.6%) |
| $25,000 to $29,999 | 257 (6.7%) | 474 (12.3%) |
| $30,000 to $34,999 | 343 (8.9%) | 150 (3.9%) |
| $35,000 to $39,999 | 233 (6.1%) | 256 (6.7%) |
| $40,000 to $44,999 | 334 (8.7%) | 186 (4.8%) |
| $45,000 to $49,999 | 92 (2.4%) | 142 (3.7%) |
| $50,000 to $54,999 | 105 (2.7%) | 138 (3.6%) |
| $55,000 to $64,999 | 314 (8.2%) | 245 (6.4%) |
| $65,000 to $74,999 | 369 (9.6%) | 198 (5.2%) |
| $75,000 to $99,999 | 188 (4.9%) | 123 (3.2%) |
| $100,000+ | 272 (7.1%) | 135 (3.5%) |
| Total | 3,844 (100.0%) | 3,840 (100.0%) |
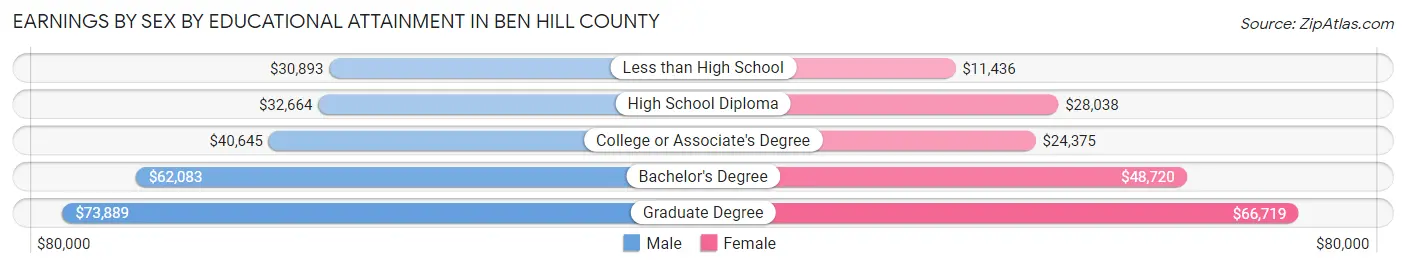
Earnings by Sex by Educational Attainment in Ben Hill County
Average earnings in Ben Hill County are $37,434 for men and $29,057 for women, a difference of 22.4%. Men with an educational attainment of graduate degree enjoy the highest average annual earnings of $73,889, while those with less than high school education earn the least with $30,893. Women with an educational attainment of graduate degree earn the most with the average annual earnings of $66,719, while those with less than high school education have the smallest earnings of $11,436.
| Educational Attainment | Male Income | Female Income |
| Less than High School | $30,893 | $11,436 |
| High School Diploma | $32,664 | $28,038 |
| College or Associate's Degree | $40,645 | $24,375 |
| Bachelor's Degree | $62,083 | $48,720 |
| Graduate Degree | $73,889 | $66,719 |
| Total | $37,434 | $29,057 |
Family Income in Ben Hill County
Family Income Brackets in Ben Hill County
According to the Ben Hill County family income data, there are 798 families falling into the $50,000 to $74,999 income range, which is the most common income bracket and makes up 17.4% of all families. Conversely, the $200,000+ income bracket is the least frequent group with only 170 families (3.7%) belonging to this category.
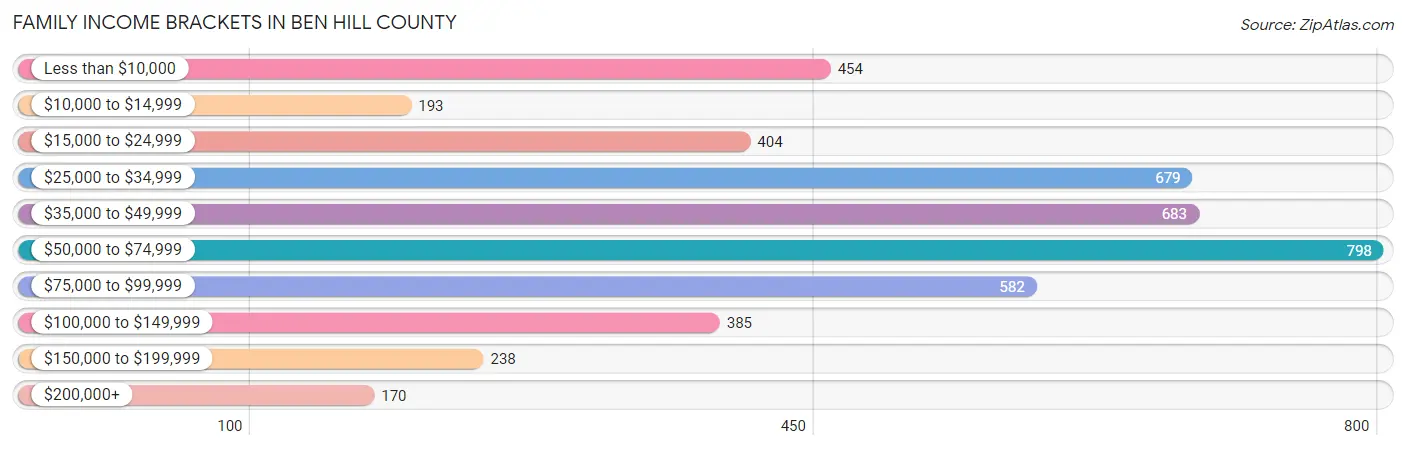
| Income Bracket | # Families | % Families |
| Less than $10,000 | 454 | 9.9% |
| $10,000 to $14,999 | 193 | 4.2% |
| $15,000 to $24,999 | 404 | 8.8% |
| $25,000 to $34,999 | 679 | 14.8% |
| $35,000 to $49,999 | 683 | 14.9% |
| $50,000 to $74,999 | 798 | 17.4% |
| $75,000 to $99,999 | 582 | 12.7% |
| $100,000 to $149,999 | 385 | 8.4% |
| $150,000 to $199,999 | 238 | 5.2% |
| $200,000+ | 170 | 3.7% |
Family Income by Famaliy Size in Ben Hill County
5-person families (291 | 6.4%) account for the highest median family income in Ben Hill County with $113,604 per family, while 5-person families (291 | 6.4%) have the highest median income of $22,721 per family member.
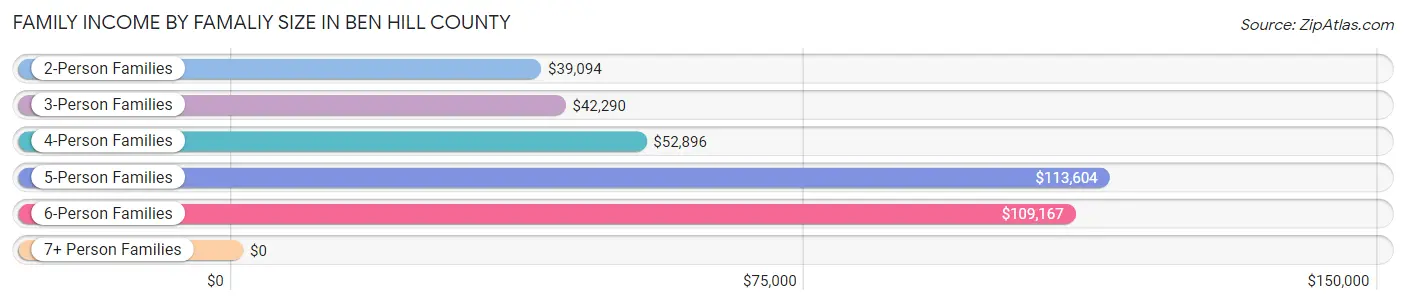
| Income Bracket | # Families | Median Income |
| 2-Person Families | 2,496 (54.4%) | $39,094 |
| 3-Person Families | 1,034 (22.6%) | $42,290 |
| 4-Person Families | 675 (14.7%) | $52,896 |
| 5-Person Families | 291 (6.4%) | $113,604 |
| 6-Person Families | 46 (1.0%) | $109,167 |
| 7+ Person Families | 44 (1.0%) | $0 |
| Total | 4,586 (100.0%) | $42,861 |
Family Income by Number of Earners in Ben Hill County
The median family income in Ben Hill County is $42,861, with families comprising 3+ earners (423) having the highest median family income of $113,784, while families with no earners (1,029) have the lowest median family income of $28,229, accounting for 9.2% and 22.4% of families, respectively.
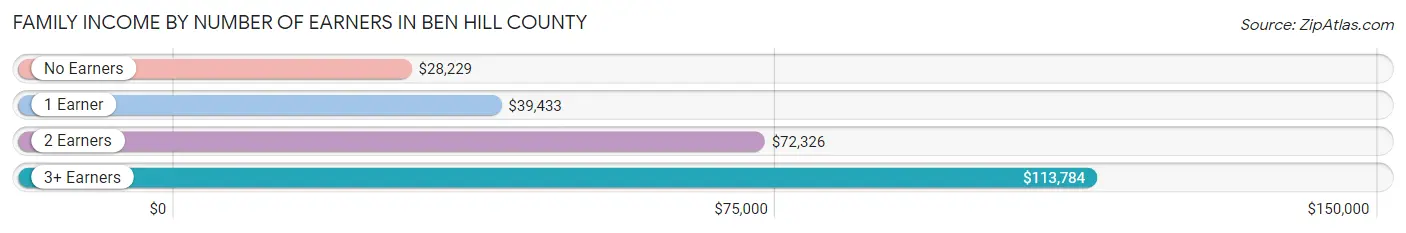
| Number of Earners | # Families | Median Income |
| No Earners | 1,029 (22.4%) | $28,229 |
| 1 Earner | 1,680 (36.6%) | $39,433 |
| 2 Earners | 1,454 (31.7%) | $72,326 |
| 3+ Earners | 423 (9.2%) | $113,784 |
| Total | 4,586 (100.0%) | $42,861 |
Household Income in Ben Hill County
Household Income Brackets in Ben Hill County
With 1,183 households falling in the category, the $50,000 to $74,999 income range is the most frequent in Ben Hill County, accounting for 16.6% of all households. In contrast, only 185 households (2.6%) fall into the $200,000+ income bracket, making it the least populous group.
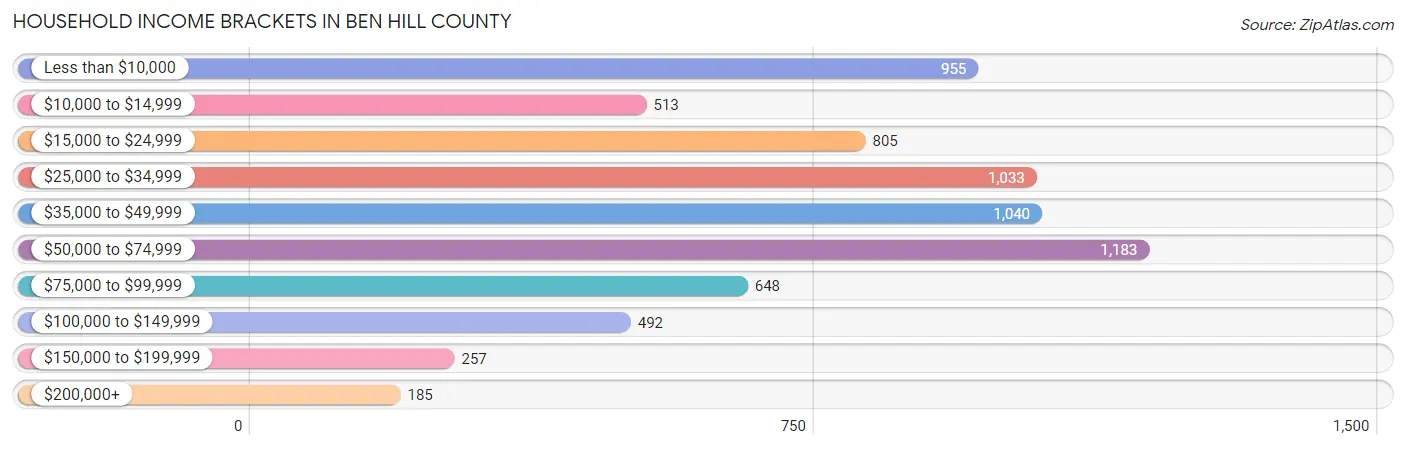
| Income Bracket | # Households | % Households |
| Less than $10,000 | 955 | 13.4% |
| $10,000 to $14,999 | 513 | 7.2% |
| $15,000 to $24,999 | 805 | 11.3% |
| $25,000 to $34,999 | 1,033 | 14.5% |
| $35,000 to $49,999 | 1,040 | 14.6% |
| $50,000 to $74,999 | 1,183 | 16.6% |
| $75,000 to $99,999 | 648 | 9.1% |
| $100,000 to $149,999 | 492 | 6.9% |
| $150,000 to $199,999 | 257 | 3.6% |
| $200,000+ | 185 | 2.6% |
Household Income by Householder Age in Ben Hill County
The median household income in Ben Hill County is $38,255, with the highest median household income of $46,705 found in the 45 to 64 years age bracket for the primary householder. A total of 2,679 households (37.6%) fall into this category. Meanwhile, the 15 to 24 years age bracket for the primary householder has the lowest median household income of $28,853, with 516 households (7.2%) in this group.
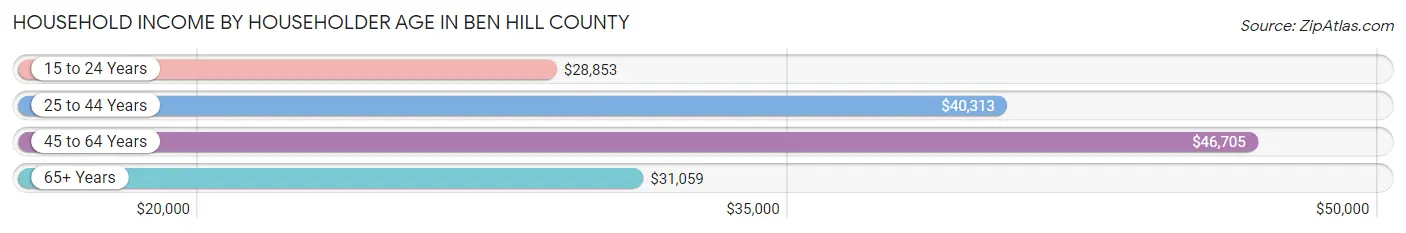
| Income Bracket | # Households | Median Income |
| 15 to 24 Years | 516 (7.2%) | $28,853 |
| 25 to 44 Years | 2,109 (29.6%) | $40,313 |
| 45 to 64 Years | 2,679 (37.6%) | $46,705 |
| 65+ Years | 1,822 (25.6%) | $31,059 |
| Total | 7,126 (100.0%) | $38,255 |
Poverty in Ben Hill County
Income Below Poverty by Sex and Age in Ben Hill County
With 21.7% poverty level for males and 30.8% for females among the residents of Ben Hill County, 16 and 17 year old males and 15 year old females are the most vulnerable to poverty, with 101 males (50.7%) and 44 females (67.7%) in their respective age groups living below the poverty level.
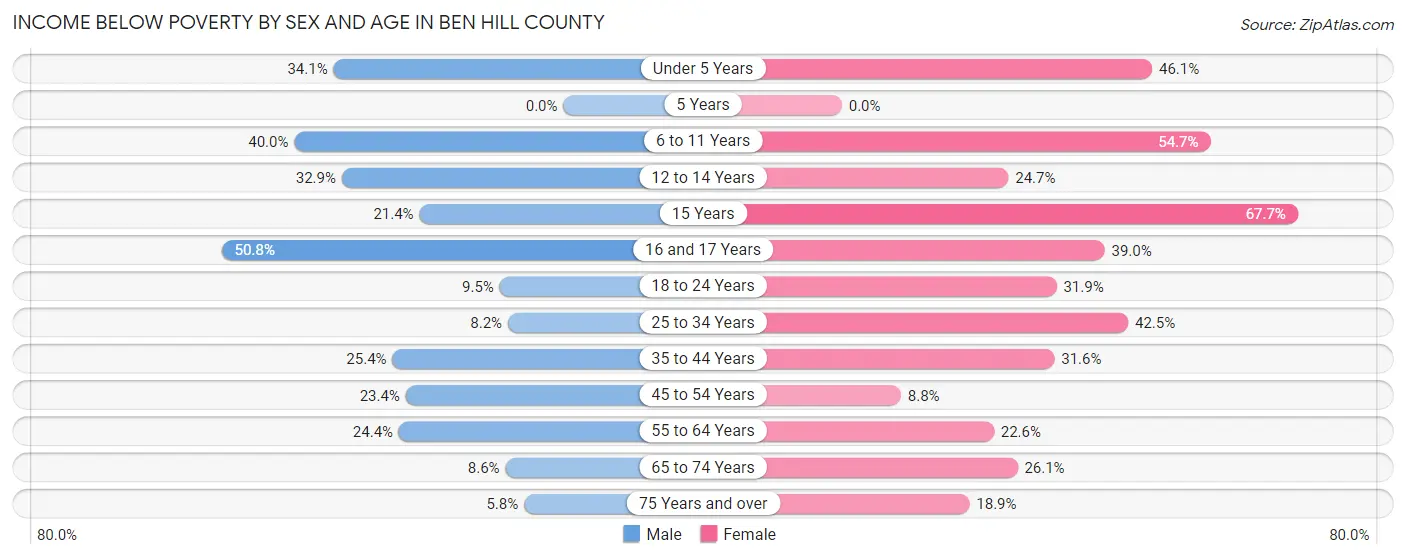
| Age Bracket | Male | Female |
| Under 5 Years | 185 (34.1%) | 223 (46.1%) |
| 5 Years | 0 (0.0%) | 0 (0.0%) |
| 6 to 11 Years | 296 (40.0%) | 435 (54.7%) |
| 12 to 14 Years | 126 (32.9%) | 67 (24.7%) |
| 15 Years | 25 (21.4%) | 44 (67.7%) |
| 16 and 17 Years | 101 (50.7%) | 151 (39.0%) |
| 18 to 24 Years | 60 (9.5%) | 255 (31.9%) |
| 25 to 34 Years | 70 (8.2%) | 460 (42.5%) |
| 35 to 44 Years | 248 (25.4%) | 343 (31.6%) |
| 45 to 54 Years | 254 (23.4%) | 85 (8.8%) |
| 55 to 64 Years | 263 (24.4%) | 272 (22.6%) |
| 65 to 74 Years | 66 (8.6%) | 266 (26.1%) |
| 75 Years and over | 26 (5.8%) | 121 (18.9%) |
| Total | 1,720 (21.7%) | 2,722 (30.8%) |
Income Above Poverty by Sex and Age in Ben Hill County
According to the poverty statistics in Ben Hill County, males aged 5 years and females aged 5 years are the age groups that are most secure financially, with 100.0% of males and 100.0% of females in these age groups living above the poverty line.
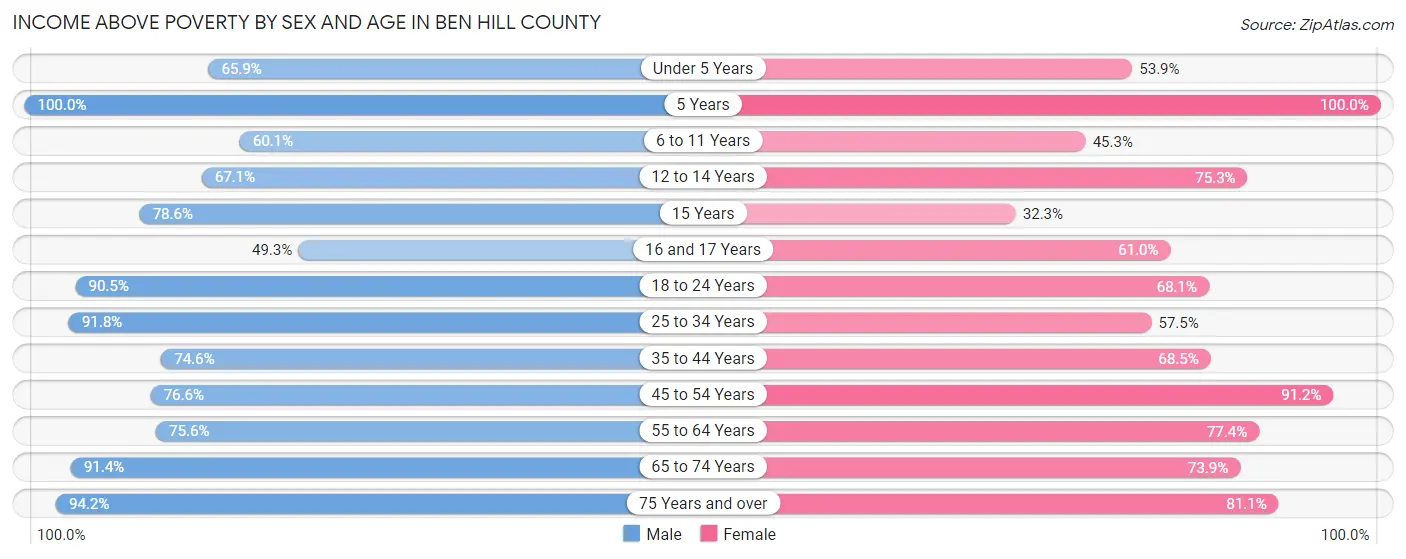
| Age Bracket | Male | Female |
| Under 5 Years | 357 (65.9%) | 261 (53.9%) |
| 5 Years | 113 (100.0%) | 33 (100.0%) |
| 6 to 11 Years | 445 (60.1%) | 360 (45.3%) |
| 12 to 14 Years | 257 (67.1%) | 204 (75.3%) |
| 15 Years | 92 (78.6%) | 21 (32.3%) |
| 16 and 17 Years | 98 (49.2%) | 236 (61.0%) |
| 18 to 24 Years | 574 (90.5%) | 545 (68.1%) |
| 25 to 34 Years | 781 (91.8%) | 622 (57.5%) |
| 35 to 44 Years | 729 (74.6%) | 744 (68.4%) |
| 45 to 54 Years | 831 (76.6%) | 884 (91.2%) |
| 55 to 64 Years | 814 (75.6%) | 933 (77.4%) |
| 65 to 74 Years | 701 (91.4%) | 754 (73.9%) |
| 75 Years and over | 419 (94.2%) | 518 (81.1%) |
| Total | 6,211 (78.3%) | 6,115 (69.2%) |
Income Below Poverty Among Married-Couple Families in Ben Hill County
The poverty statistics for married-couple families in Ben Hill County show that 6.9% or 183 of the total 2,673 families live below the poverty line. Families with 5 or more children have the highest poverty rate of 100.0%, comprising of 11 families. On the other hand, families with no children have the lowest poverty rate of 5.4%, which includes 95 families.
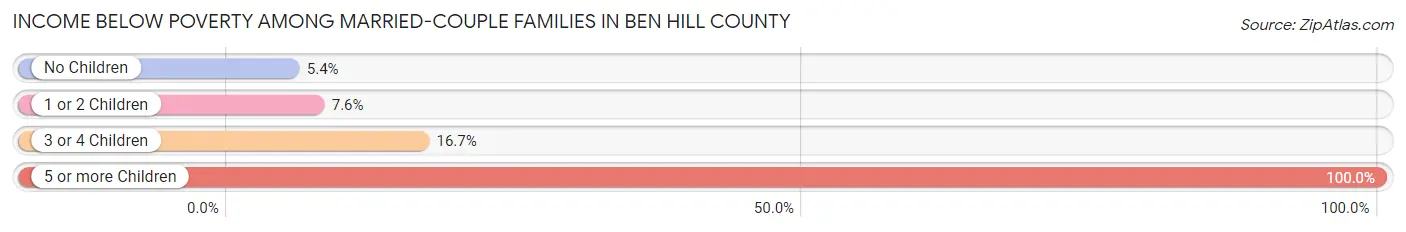
| Children | Above Poverty | Below Poverty |
| No Children | 1,670 (94.6%) | 95 (5.4%) |
| 1 or 2 Children | 735 (92.4%) | 60 (7.5%) |
| 3 or 4 Children | 85 (83.3%) | 17 (16.7%) |
| 5 or more Children | 0 (0.0%) | 11 (100.0%) |
| Total | 2,490 (93.1%) | 183 (6.9%) |
Income Below Poverty Among Single-Parent Households in Ben Hill County
According to the poverty data in Ben Hill County, 18.2% or 70 single-father households and 46.3% or 708 single-mother households are living below the poverty line. Among single-father households, those with no children have the highest poverty rate, with 58 households (41.4%) experiencing poverty. Likewise, among single-mother households, those with 5 or more children have the highest poverty rate, with 33 households (100.0%) falling below the poverty line.
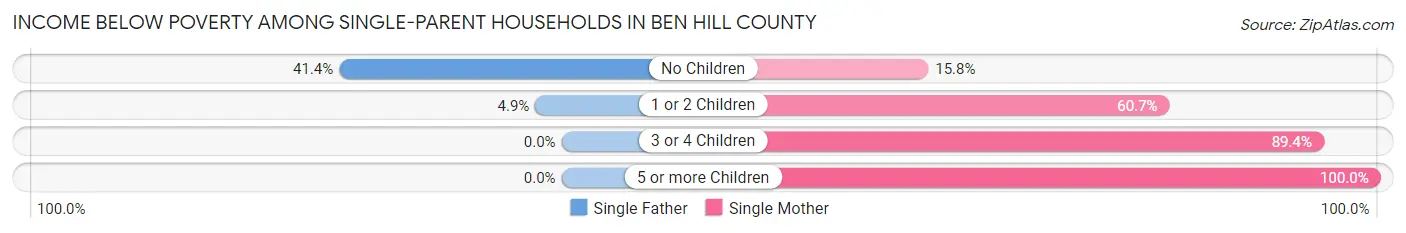
| Children | Single Father | Single Mother |
| No Children | 58 (41.4%) | 90 (15.8%) |
| 1 or 2 Children | 12 (4.9%) | 509 (60.7%) |
| 3 or 4 Children | 0 (0.0%) | 76 (89.4%) |
| 5 or more Children | 0 (0.0%) | 33 (100.0%) |
| Total | 70 (18.2%) | 708 (46.3%) |
Income Below Poverty Among Married-Couple vs Single-Parent Households in Ben Hill County
The poverty data for Ben Hill County shows that 183 of the married-couple family households (6.9%) and 778 of the single-parent households (40.7%) are living below the poverty level. Within the married-couple family households, those with 5 or more children have the highest poverty rate, with 11 households (100.0%) falling below the poverty line. Among the single-parent households, those with 5 or more children have the highest poverty rate, with 33 household (100.0%) living below poverty.
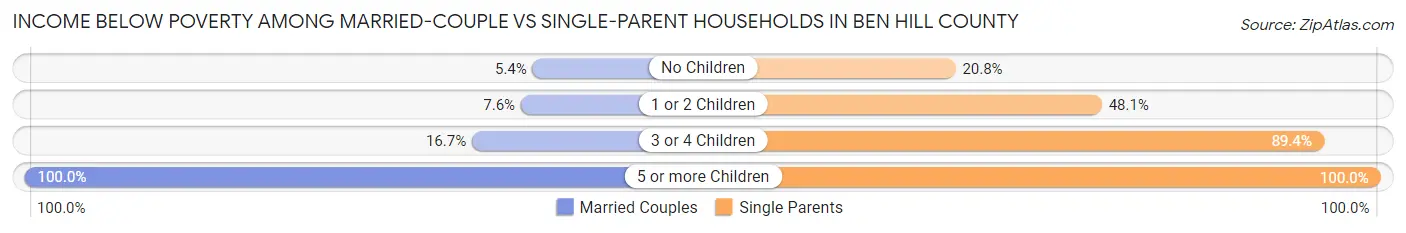
| Children | Married-Couple Families | Single-Parent Households |
| No Children | 95 (5.4%) | 148 (20.8%) |
| 1 or 2 Children | 60 (7.5%) | 521 (48.1%) |
| 3 or 4 Children | 17 (16.7%) | 76 (89.4%) |
| 5 or more Children | 11 (100.0%) | 33 (100.0%) |
| Total | 183 (6.9%) | 778 (40.7%) |
Race in Ben Hill County
The most populous races in Ben Hill County are White / Caucasian (9,917 | 57.8%), Black / African American (6,411 | 37.3%), and Hispanic or Latino (1,121 | 6.5%).
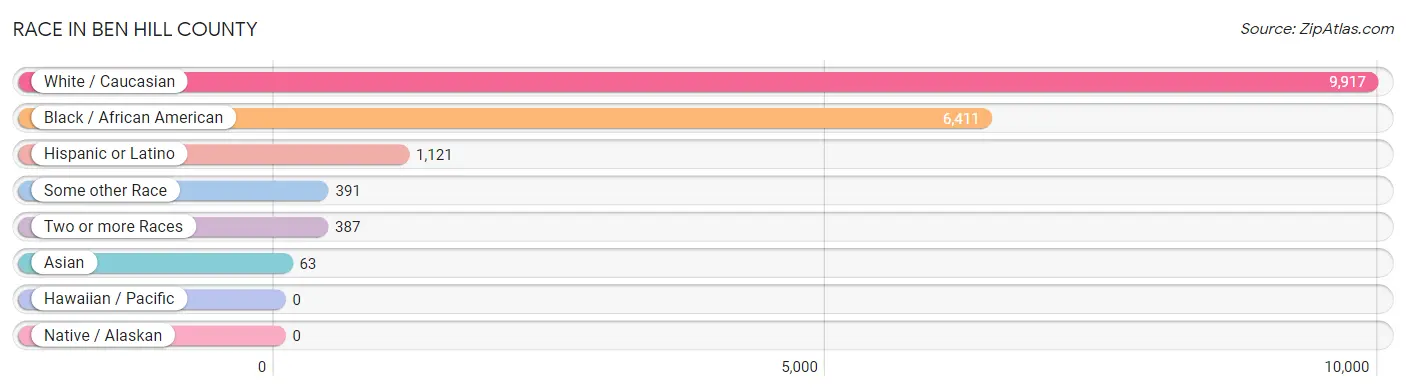
| Race | # Population | % Population |
| Asian | 63 | 0.4% |
| Black / African American | 6,411 | 37.3% |
| Hawaiian / Pacific | 0 | 0.0% |
| Hispanic or Latino | 1,121 | 6.5% |
| Native / Alaskan | 0 | 0.0% |
| White / Caucasian | 9,917 | 57.8% |
| Two or more Races | 387 | 2.2% |
| Some other Race | 391 | 2.3% |
| Total | 17,169 | 100.0% |
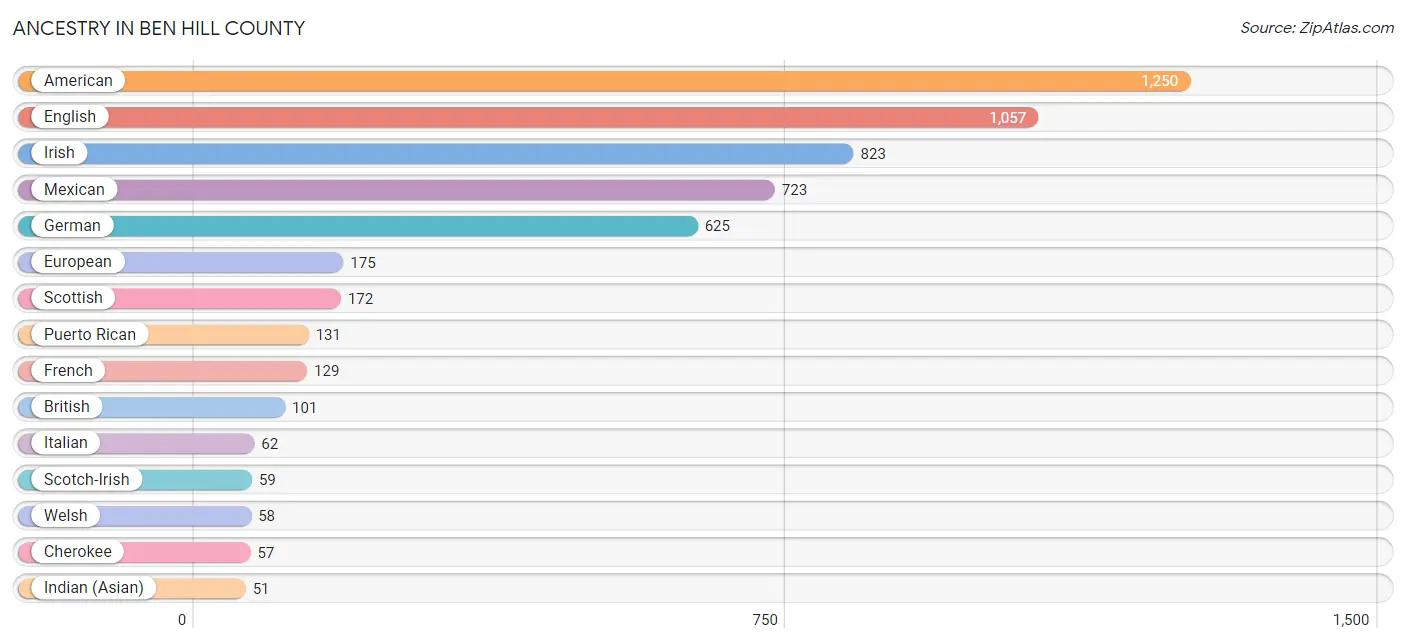
Ancestry in Ben Hill County
The most populous ancestries reported in Ben Hill County are American (1,250 | 7.3%), English (1,057 | 6.2%), Irish (823 | 4.8%), Mexican (723 | 4.2%), and German (625 | 3.6%), together accounting for 26.1% of all Ben Hill County residents.
| Ancestry | # Population | % Population |
| African | 38 | 0.2% |
| American | 1,250 | 7.3% |
| Austrian | 6 | 0.0% |
| Belgian | 17 | 0.1% |
| Bhutanese | 32 | 0.2% |
| Blackfeet | 3 | 0.0% |
| British | 101 | 0.6% |
| Burmese | 9 | 0.1% |
| Central American | 9 | 0.1% |
| Cherokee | 57 | 0.3% |
| Chippewa | 37 | 0.2% |
| Colombian | 14 | 0.1% |
| Creek | 40 | 0.2% |
| Croatian | 20 | 0.1% |
| Cuban | 6 | 0.0% |
| Czechoslovakian | 9 | 0.1% |
| Dominican | 36 | 0.2% |
| Dutch | 27 | 0.2% |
| Eastern European | 10 | 0.1% |
| English | 1,057 | 6.2% |
| European | 175 | 1.0% |
| French | 129 | 0.7% |
| French Canadian | 22 | 0.1% |
| German | 625 | 3.6% |
| Greek | 25 | 0.2% |
| Honduran | 9 | 0.1% |
| Hungarian | 13 | 0.1% |
| Indian (Asian) | 51 | 0.3% |
| Irish | 823 | 4.8% |
| Italian | 62 | 0.4% |
| Jamaican | 12 | 0.1% |
| Korean | 14 | 0.1% |
| Lithuanian | 12 | 0.1% |
| Mexican | 723 | 4.2% |
| Polish | 38 | 0.2% |
| Puerto Rican | 131 | 0.8% |
| Scandinavian | 42 | 0.2% |
| Scotch-Irish | 59 | 0.3% |
| Scottish | 172 | 1.0% |
| Sioux | 14 | 0.1% |
| South American | 14 | 0.1% |
| Subsaharan African | 41 | 0.2% |
| Welsh | 58 | 0.3% | View All 43 Rows |
Immigrants in Ben Hill County
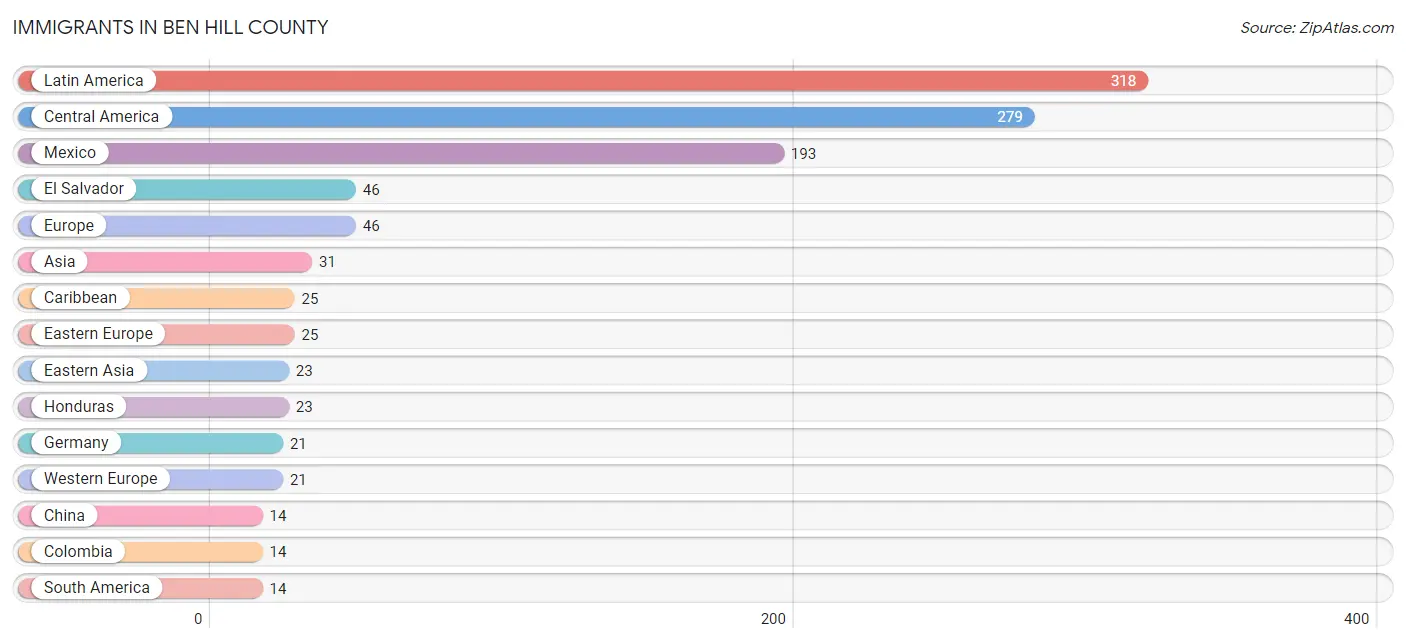
The most numerous immigrant groups reported in Ben Hill County came from Latin America (318 | 1.8%), Central America (279 | 1.6%), Mexico (193 | 1.1%), El Salvador (46 | 0.3%), and Europe (46 | 0.3%), together accounting for 5.1% of all Ben Hill County residents.
| Immigration Origin | # Population | % Population |
| Asia | 31 | 0.2% |
| Caribbean | 25 | 0.2% |
| Central America | 279 | 1.6% |
| China | 14 | 0.1% |
| Colombia | 14 | 0.1% |
| Dominican Republic | 13 | 0.1% |
| Eastern Asia | 23 | 0.1% |
| Eastern Europe | 25 | 0.2% |
| El Salvador | 46 | 0.3% |
| Europe | 46 | 0.3% |
| Germany | 21 | 0.1% |
| Honduras | 23 | 0.1% |
| Hungary | 13 | 0.1% |
| Jamaica | 12 | 0.1% |
| Korea | 9 | 0.1% |
| Latin America | 318 | 1.8% |
| Lithuania | 12 | 0.1% |
| Mexico | 193 | 1.1% |
| Pakistan | 8 | 0.1% |
| South America | 14 | 0.1% |
| South Central Asia | 8 | 0.1% |
| Western Europe | 21 | 0.1% | View All 22 Rows |
Sex and Age in Ben Hill County
Sex and Age in Ben Hill County
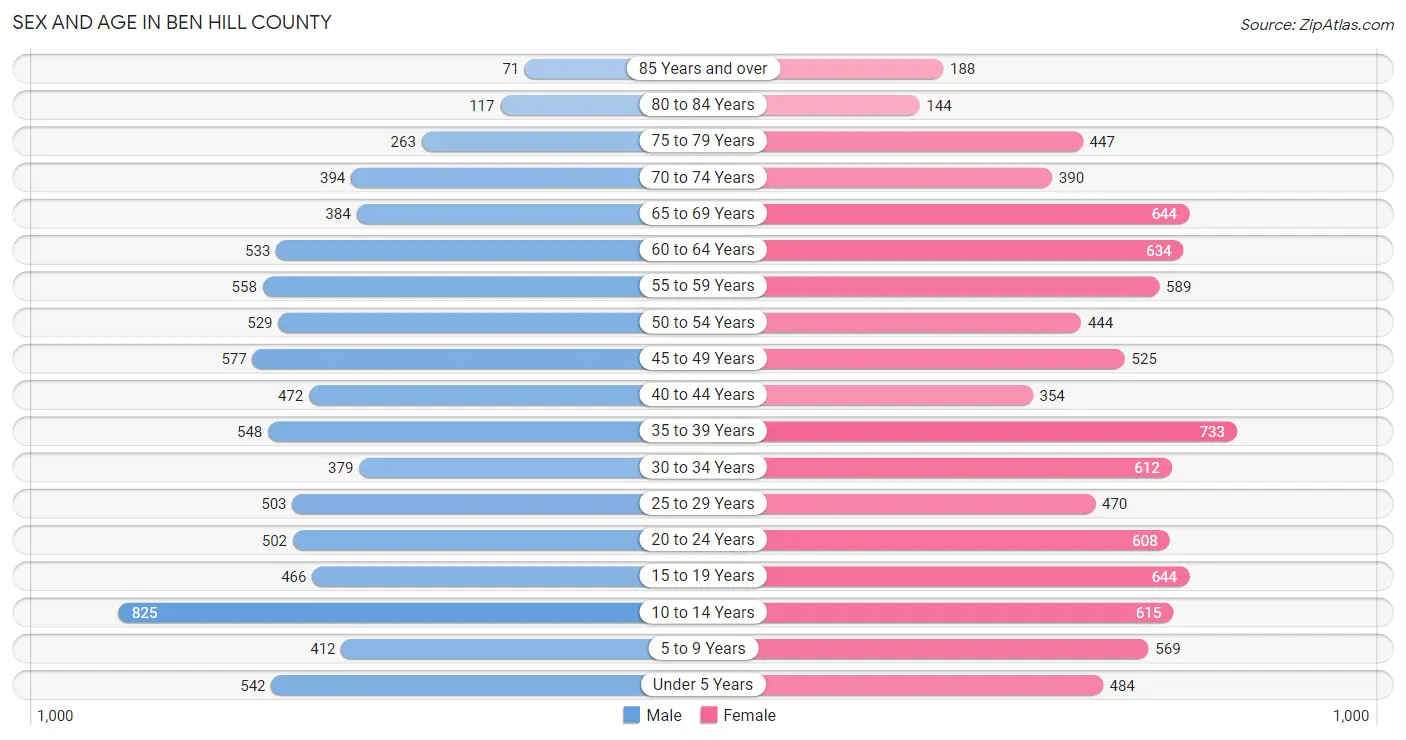
The most populous age groups in Ben Hill County are 10 to 14 Years (825 | 10.2%) for men and 35 to 39 Years (733 | 8.1%) for women.
| Age Bracket | Male | Female |
| Under 5 Years | 542 (6.7%) | 484 (5.3%) |
| 5 to 9 Years | 412 (5.1%) | 569 (6.3%) |
| 10 to 14 Years | 825 (10.2%) | 615 (6.8%) |
| 15 to 19 Years | 466 (5.8%) | 644 (7.1%) |
| 20 to 24 Years | 502 (6.2%) | 608 (6.7%) |
| 25 to 29 Years | 503 (6.2%) | 470 (5.2%) |
| 30 to 34 Years | 379 (4.7%) | 612 (6.7%) |
| 35 to 39 Years | 548 (6.8%) | 733 (8.1%) |
| 40 to 44 Years | 472 (5.9%) | 354 (3.9%) |
| 45 to 49 Years | 577 (7.1%) | 525 (5.8%) |
| 50 to 54 Years | 529 (6.6%) | 444 (4.9%) |
| 55 to 59 Years | 558 (6.9%) | 589 (6.5%) |
| 60 to 64 Years | 533 (6.6%) | 634 (7.0%) |
| 65 to 69 Years | 384 (4.8%) | 644 (7.1%) |
| 70 to 74 Years | 394 (4.9%) | 390 (4.3%) |
| 75 to 79 Years | 263 (3.3%) | 447 (4.9%) |
| 80 to 84 Years | 117 (1.5%) | 144 (1.6%) |
| 85 Years and over | 71 (0.9%) | 188 (2.1%) |
| Total | 8,075 (100.0%) | 9,094 (100.0%) |
Families and Households in Ben Hill County
Median Family Size in Ben Hill County
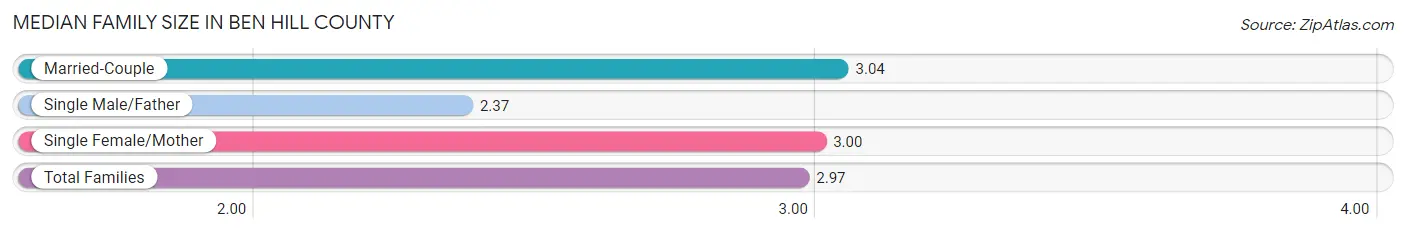
The median family size in Ben Hill County is 2.97 persons per family, with married-couple families (2,673 | 58.3%) accounting for the largest median family size of 3.04 persons per family. On the other hand, single male/father families (385 | 8.4%) represent the smallest median family size with 2.37 persons per family.
| Family Type | # Families | Family Size |
| Married-Couple | 2,673 (58.3%) | 3.04 |
| Single Male/Father | 385 (8.4%) | 2.37 |
| Single Female/Mother | 1,528 (33.3%) | 3.00 |
| Total Families | 4,586 (100.0%) | 2.97 |
Median Household Size in Ben Hill County
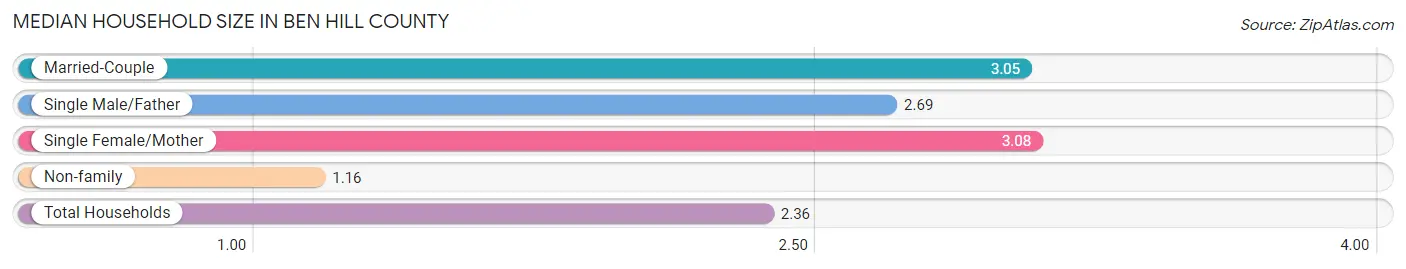
The median household size in Ben Hill County is 2.36 persons per household, with single female/mother households (1,528 | 21.4%) accounting for the largest median household size of 3.08 persons per household. non-family households (2,540 | 35.6%) represent the smallest median household size with 1.16 persons per household.
| Household Type | # Households | Household Size |
| Married-Couple | 2,673 (37.5%) | 3.05 |
| Single Male/Father | 385 (5.4%) | 2.69 |
| Single Female/Mother | 1,528 (21.4%) | 3.08 |
| Non-family | 2,540 (35.6%) | 1.16 |
| Total Households | 7,126 (100.0%) | 2.36 |
Household Size by Marriage Status in Ben Hill County
Out of a total of 7,126 households in Ben Hill County, 4,586 (64.4%) are family households, while 2,540 (35.6%) are nonfamily households. The most numerous type of family households are 2-person households, comprising 2,397, and the most common type of nonfamily households are 1-person households, comprising 2,263.
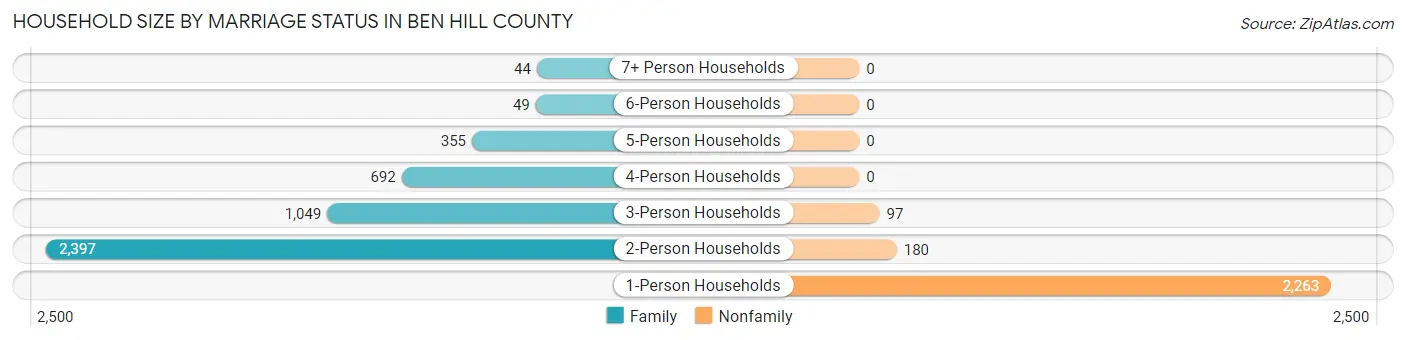
| Household Size | Family Households | Nonfamily Households |
| 1-Person Households | - | 2,263 (31.8%) |
| 2-Person Households | 2,397 (33.6%) | 180 (2.5%) |
| 3-Person Households | 1,049 (14.7%) | 97 (1.4%) |
| 4-Person Households | 692 (9.7%) | 0 (0.0%) |
| 5-Person Households | 355 (5.0%) | 0 (0.0%) |
| 6-Person Households | 49 (0.7%) | 0 (0.0%) |
| 7+ Person Households | 44 (0.6%) | 0 (0.0%) |
| Total | 4,586 (64.4%) | 2,540 (35.6%) |
Female Fertility in Ben Hill County
Fertility by Age in Ben Hill County
Average fertility rate in Ben Hill County is 51.0 births per 1,000 women. Women in the age bracket of 20 to 34 years have the highest fertility rate with 104.0 births per 1,000 women. Women in the age bracket of 20 to 34 years acount for 87.6% of all women with births.
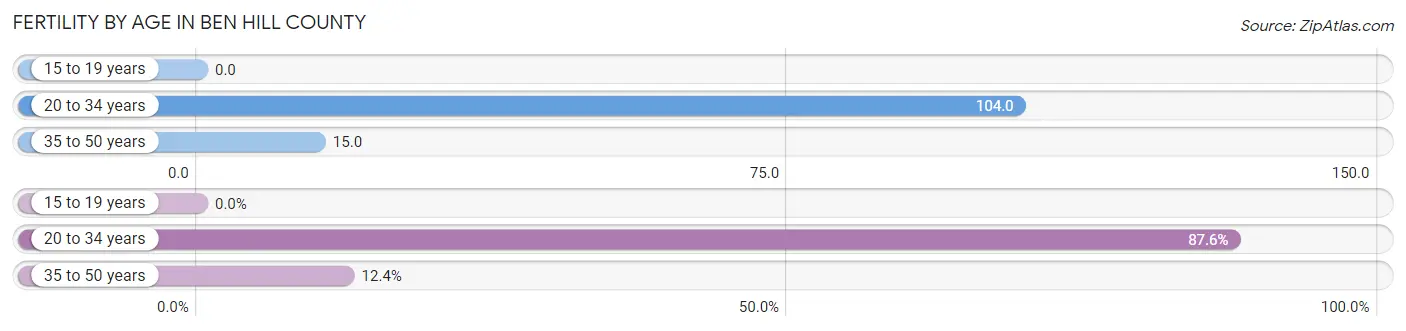
| Age Bracket | Women with Births | Births / 1,000 Women |
| 15 to 19 years | 0 (0.0%) | 0.0 |
| 20 to 34 years | 176 (87.6%) | 104.0 |
| 35 to 50 years | 25 (12.4%) | 15.0 |
| Total | 201 (100.0%) | 51.0 |
Fertility by Age by Marriage Status in Ben Hill County
54.7% of women with births (201) in Ben Hill County are married. The highest percentage of unmarried women with births falls into 35 to 50 years age bracket with 64.0% of them unmarried at the time of birth, while the lowest percentage of unmarried women with births belong to 20 to 34 years age bracket with 42.6% of them unmarried.
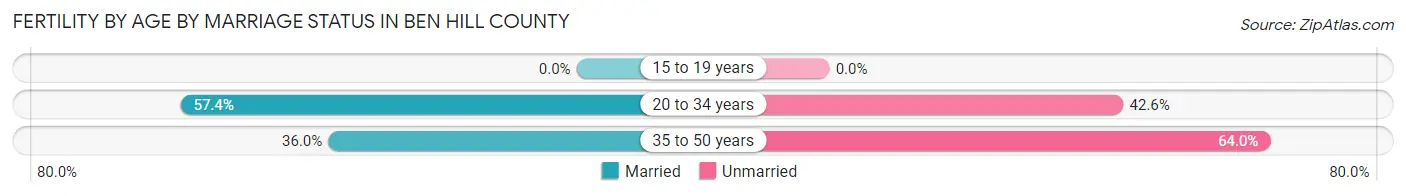
| Age Bracket | Married | Unmarried |
| 15 to 19 years | 0 (0.0%) | 0 (0.0%) |
| 20 to 34 years | 101 (57.4%) | 75 (42.6%) |
| 35 to 50 years | 9 (36.0%) | 16 (64.0%) |
| Total | 110 (54.7%) | 91 (45.3%) |
Fertility by Education in Ben Hill County
Average fertility rate in Ben Hill County is 51.0 births per 1,000 women. Women with the education attainment of graduate degree have the highest fertility rate of 100.0 births per 1,000 women, while women with the education attainment of bachelor's degree have the lowest fertility at 13.0 births per 1,000 women. Women with the education attainment of high school diploma represent 55.7% of all women with births.
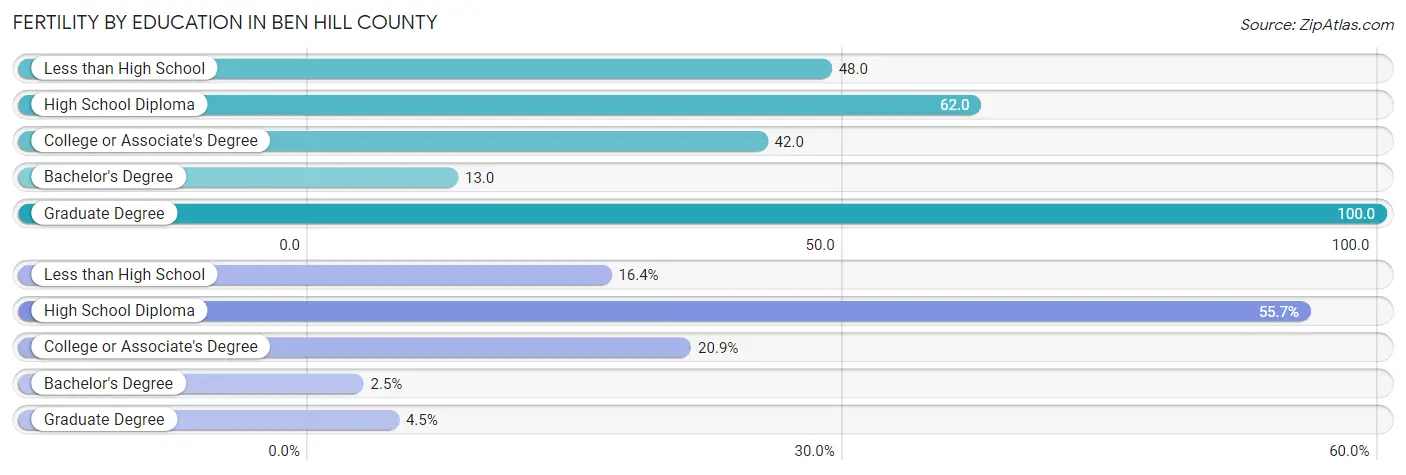
| Educational Attainment | Women with Births | Births / 1,000 Women |
| Less than High School | 33 (16.4%) | 48.0 |
| High School Diploma | 112 (55.7%) | 62.0 |
| College or Associate's Degree | 42 (20.9%) | 42.0 |
| Bachelor's Degree | 5 (2.5%) | 13.0 |
| Graduate Degree | 9 (4.5%) | 100.0 |
| Total | 201 (100.0%) | 51.0 |
Fertility by Education by Marriage Status in Ben Hill County
45.3% of women with births in Ben Hill County are unmarried. Women with the educational attainment of bachelor's degree are most likely to be married with 100.0% of them married at childbirth, while women with the educational attainment of less than high school are least likely to be married with 100.0% of them unmarried at childbirth.
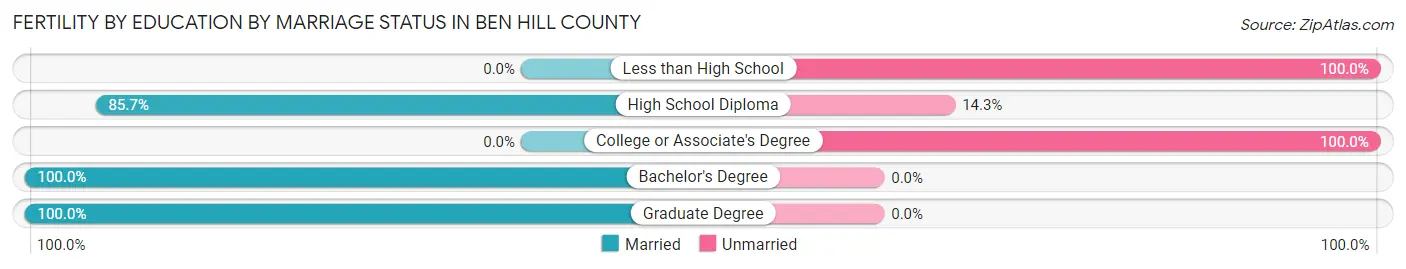
| Educational Attainment | Married | Unmarried |
| Less than High School | 0 (0.0%) | 33 (100.0%) |
| High School Diploma | 96 (85.7%) | 16 (14.3%) |
| College or Associate's Degree | 0 (0.0%) | 42 (100.0%) |
| Bachelor's Degree | 5 (100.0%) | 0 (0.0%) |
| Graduate Degree | 9 (100.0%) | 0 (0.0%) |
| Total | 110 (54.7%) | 91 (45.3%) |
Employment Characteristics in Ben Hill County
Employment by Class of Employer in Ben Hill County
Among the 7,099 employed individuals in Ben Hill County, private company employees (4,912 | 69.2%), local government employees (680 | 9.6%), and self-employed (incorporated) (333 | 4.7%) make up the most common classes of employment.
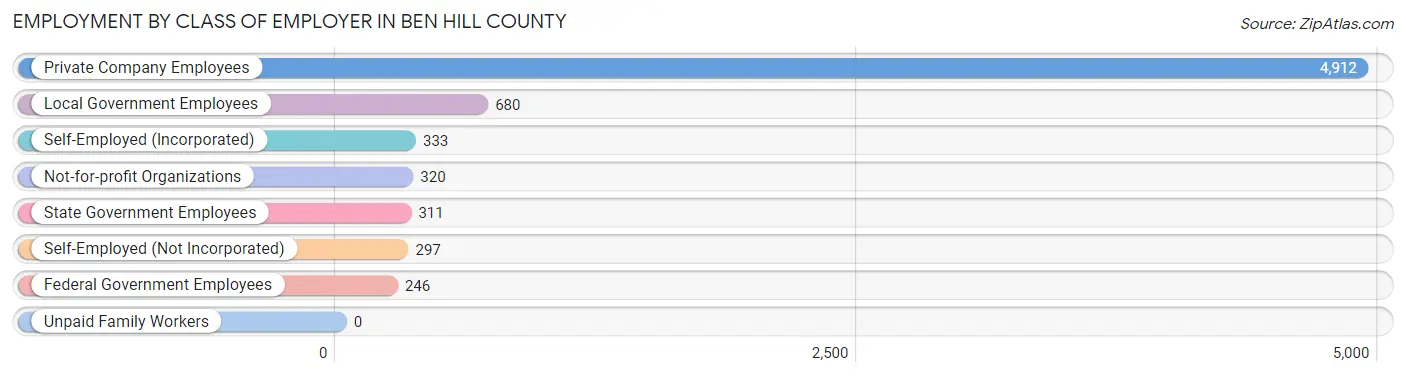
| Employer Class | # Employees | % Employees |
| Private Company Employees | 4,912 | 69.2% |
| Self-Employed (Incorporated) | 333 | 4.7% |
| Self-Employed (Not Incorporated) | 297 | 4.2% |
| Not-for-profit Organizations | 320 | 4.5% |
| Local Government Employees | 680 | 9.6% |
| State Government Employees | 311 | 4.4% |
| Federal Government Employees | 246 | 3.5% |
| Unpaid Family Workers | 0 | 0.0% |
| Total | 7,099 | 100.0% |
Employment Status by Age in Ben Hill County
According to the labor force statistics for Ben Hill County, out of the total population over 16 years of age (13,540), 55.4% or 7,501 individuals are in the labor force, with 5.0% or 375 of them unemployed. The age group with the highest labor force participation rate is 45 to 54 years, with 79.3% or 1,645 individuals in the labor force. Within the labor force, the 16 to 19 years age range has the highest percentage of unemployed individuals, with 12.3% or 46 of them being unemployed.
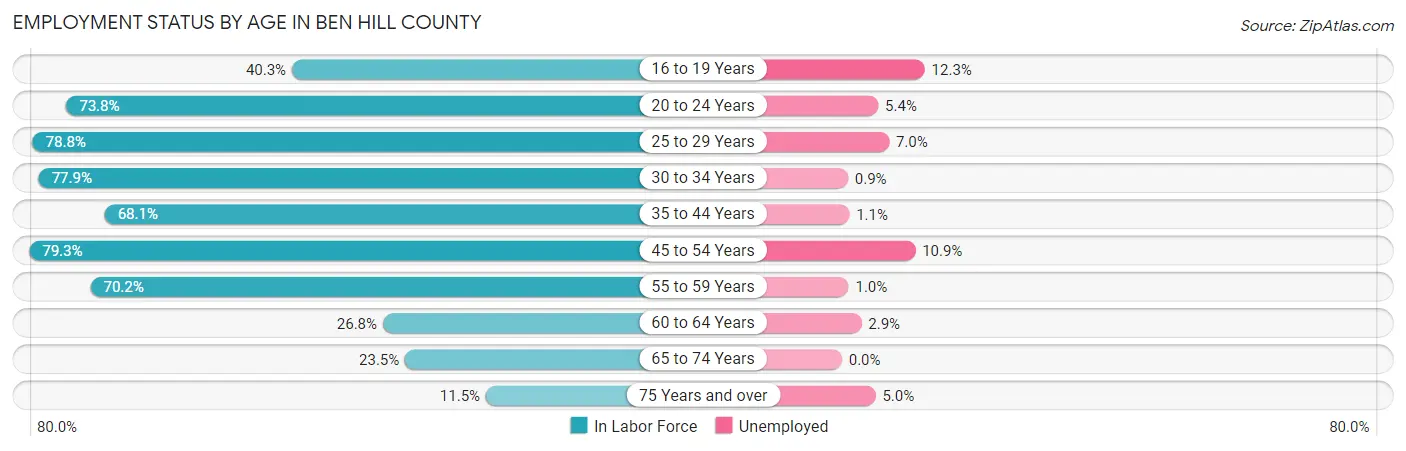
| Age Bracket | In Labor Force | Unemployed |
| 16 to 19 Years | 374 (40.3%) | 46 (12.3%) |
| 20 to 24 Years | 819 (73.8%) | 44 (5.4%) |
| 25 to 29 Years | 767 (78.8%) | 54 (7.0%) |
| 30 to 34 Years | 772 (77.9%) | 7 (0.9%) |
| 35 to 44 Years | 1,435 (68.1%) | 16 (1.1%) |
| 45 to 54 Years | 1,645 (79.3%) | 179 (10.9%) |
| 55 to 59 Years | 805 (70.2%) | 8 (1.0%) |
| 60 to 64 Years | 313 (26.8%) | 9 (2.9%) |
| 65 to 74 Years | 426 (23.5%) | 0 (0.0%) |
| 75 Years and over | 141 (11.5%) | 7 (5.0%) |
| Total | 7,501 (55.4%) | 375 (5.0%) |
Employment Status by Educational Attainment in Ben Hill County
According to labor force statistics for Ben Hill County, 67.8% of individuals (5,736) out of the total population between 25 and 64 years of age (8,460) are in the labor force, with 4.8% or 275 of them being unemployed. The group with the highest labor force participation rate are those with the educational attainment of bachelor's degree or higher, with 83.8% or 878 individuals in the labor force. Within the labor force, individuals with college / associate degree education have the highest percentage of unemployment, with 7.5% or 103 of them being unemployed.
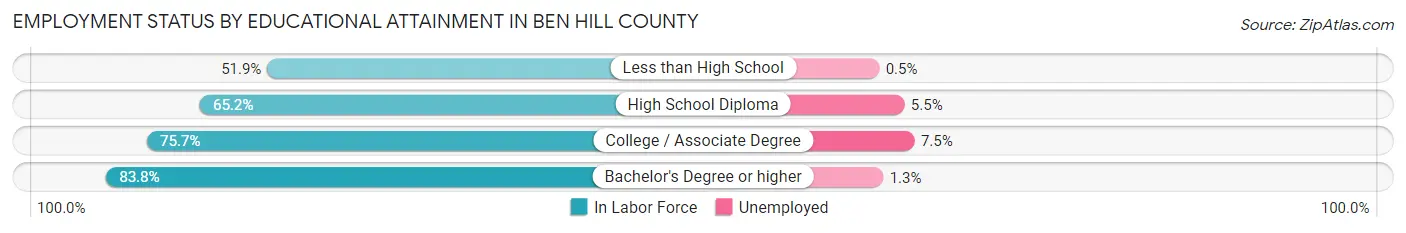
| Educational Attainment | In Labor Force | Unemployed |
| Less than High School | 647 (51.9%) | 6 (0.5%) |
| High School Diploma | 2,837 (65.2%) | 239 (5.5%) |
| College / Associate Degree | 1,374 (75.7%) | 136 (7.5%) |
| Bachelor's Degree or higher | 878 (83.8%) | 14 (1.3%) |
| Total | 5,736 (67.8%) | 406 (4.8%) |
Employment Occupations by Sex in Ben Hill County
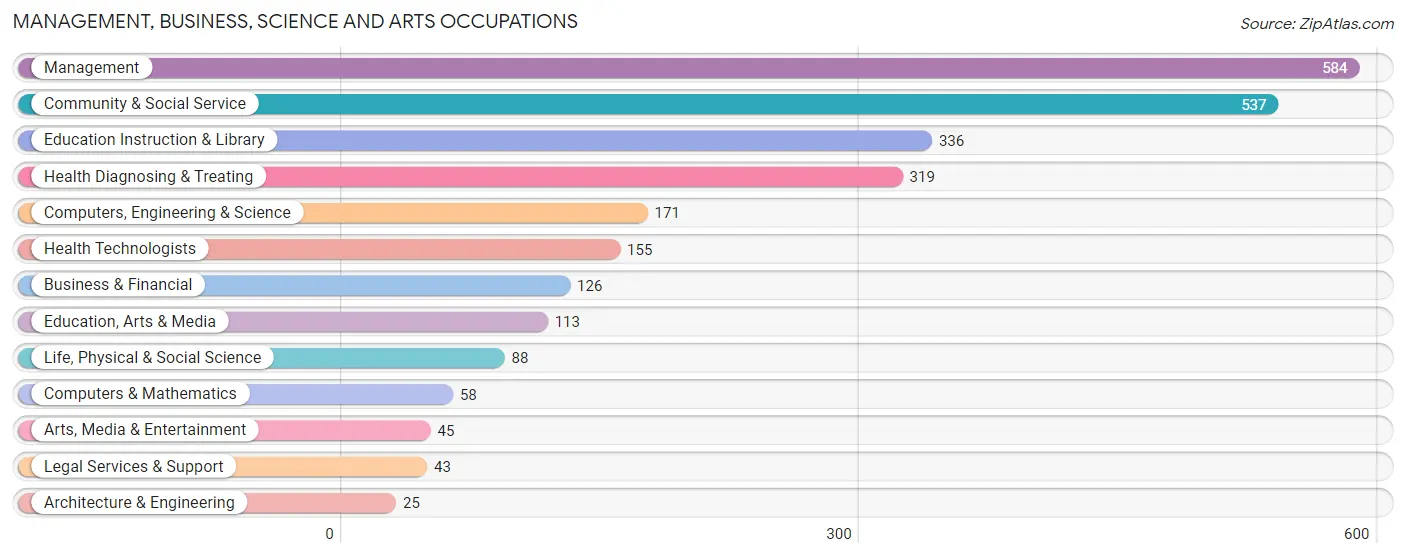
Management, Business, Science and Arts Occupations
The most common Management, Business, Science and Arts occupations in Ben Hill County are Management (584 | 8.2%), Community & Social Service (537 | 7.6%), Education Instruction & Library (336 | 4.7%), Health Diagnosing & Treating (319 | 4.5%), and Computers, Engineering & Science (171 | 2.4%).
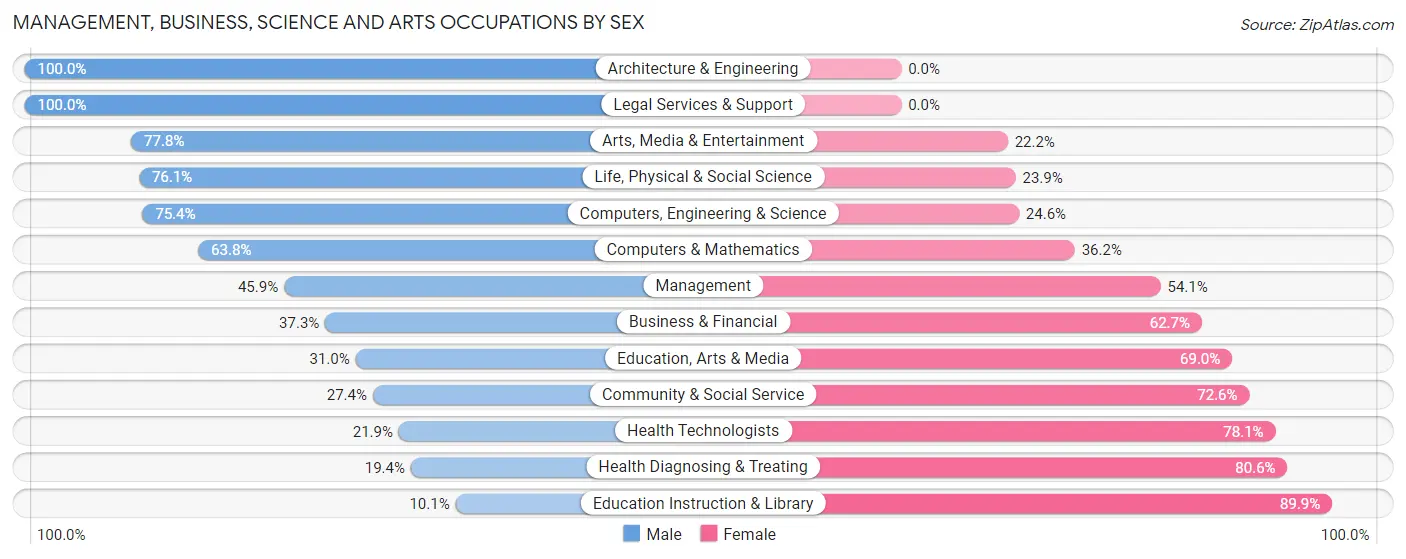
Management, Business, Science and Arts Occupations by Sex
Within the Management, Business, Science and Arts occupations in Ben Hill County, the most male-oriented occupations are Architecture & Engineering (100.0%), Legal Services & Support (100.0%), and Arts, Media & Entertainment (77.8%), while the most female-oriented occupations are Education Instruction & Library (89.9%), Health Diagnosing & Treating (80.6%), and Health Technologists (78.1%).
| Occupation | Male | Female |
| Management | 268 (45.9%) | 316 (54.1%) |
| Business & Financial | 47 (37.3%) | 79 (62.7%) |
| Computers, Engineering & Science | 129 (75.4%) | 42 (24.6%) |
| Computers & Mathematics | 37 (63.8%) | 21 (36.2%) |
| Architecture & Engineering | 25 (100.0%) | 0 (0.0%) |
| Life, Physical & Social Science | 67 (76.1%) | 21 (23.9%) |
| Community & Social Service | 147 (27.4%) | 390 (72.6%) |
| Education, Arts & Media | 35 (31.0%) | 78 (69.0%) |
| Legal Services & Support | 43 (100.0%) | 0 (0.0%) |
| Education Instruction & Library | 34 (10.1%) | 302 (89.9%) |
| Arts, Media & Entertainment | 35 (77.8%) | 10 (22.2%) |
| Health Diagnosing & Treating | 62 (19.4%) | 257 (80.6%) |
| Health Technologists | 34 (21.9%) | 121 (78.1%) |
| Total (Category) | 653 (37.6%) | 1,084 (62.4%) |
| Total (Overall) | 3,410 (48.1%) | 3,679 (51.9%) |
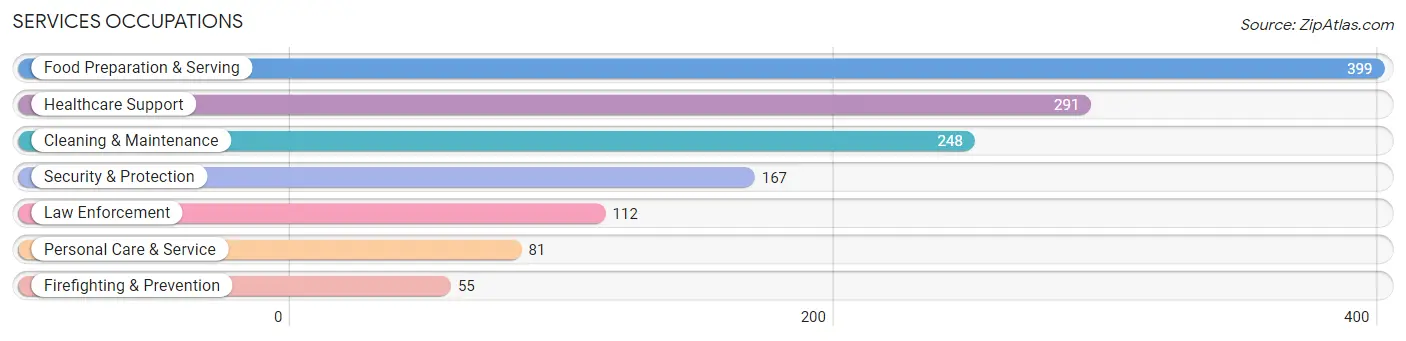
Services Occupations
The most common Services occupations in Ben Hill County are Food Preparation & Serving (399 | 5.6%), Healthcare Support (291 | 4.1%), Cleaning & Maintenance (248 | 3.5%), Security & Protection (167 | 2.4%), and Law Enforcement (112 | 1.6%).
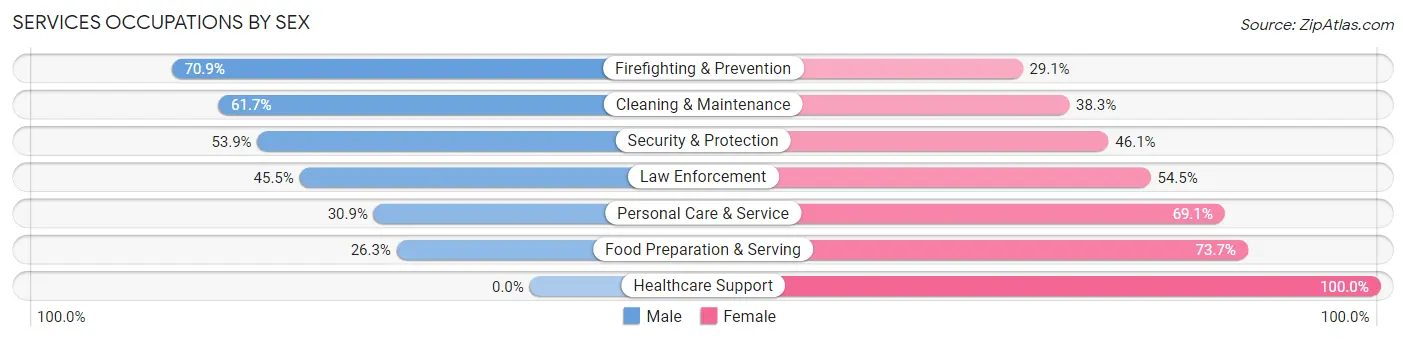
Services Occupations by Sex
Within the Services occupations in Ben Hill County, the most male-oriented occupations are Firefighting & Prevention (70.9%), Cleaning & Maintenance (61.7%), and Security & Protection (53.9%), while the most female-oriented occupations are Healthcare Support (100.0%), Food Preparation & Serving (73.7%), and Personal Care & Service (69.1%).
| Occupation | Male | Female |
| Healthcare Support | 0 (0.0%) | 291 (100.0%) |
| Security & Protection | 90 (53.9%) | 77 (46.1%) |
| Firefighting & Prevention | 39 (70.9%) | 16 (29.1%) |
| Law Enforcement | 51 (45.5%) | 61 (54.5%) |
| Food Preparation & Serving | 105 (26.3%) | 294 (73.7%) |
| Cleaning & Maintenance | 153 (61.7%) | 95 (38.3%) |
| Personal Care & Service | 25 (30.9%) | 56 (69.1%) |
| Total (Category) | 373 (31.5%) | 813 (68.5%) |
| Total (Overall) | 3,410 (48.1%) | 3,679 (51.9%) |
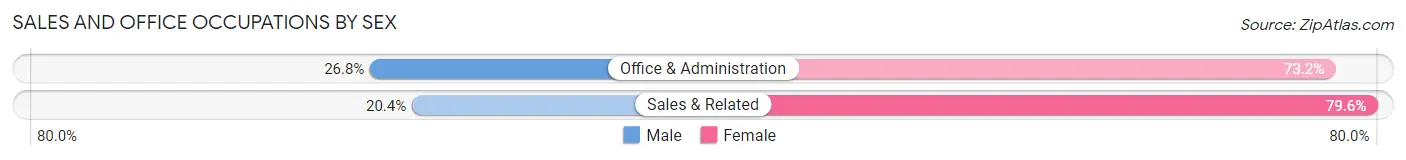
Sales and Office Occupations
The most common Sales and Office occupations in Ben Hill County are Office & Administration (887 | 12.5%), and Sales & Related (775 | 10.9%).

Sales and Office Occupations by Sex
| Occupation | Male | Female |
| Sales & Related | 158 (20.4%) | 617 (79.6%) |
| Office & Administration | 238 (26.8%) | 649 (73.2%) |
| Total (Category) | 396 (23.8%) | 1,266 (76.2%) |
| Total (Overall) | 3,410 (48.1%) | 3,679 (51.9%) |
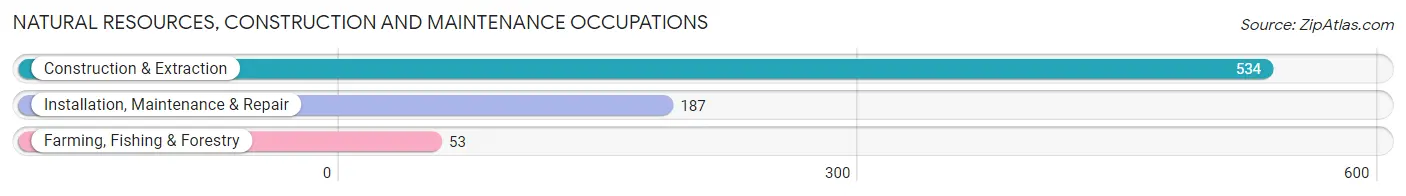
Natural Resources, Construction and Maintenance Occupations
The most common Natural Resources, Construction and Maintenance occupations in Ben Hill County are Construction & Extraction (534 | 7.5%), Installation, Maintenance & Repair (187 | 2.6%), and Farming, Fishing & Forestry (53 | 0.7%).
Natural Resources, Construction and Maintenance Occupations by Sex
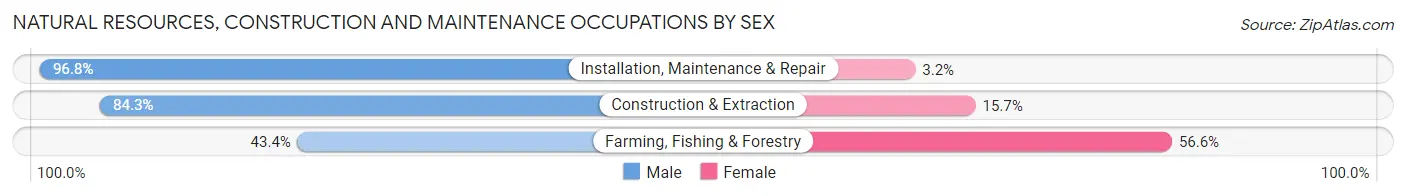
| Occupation | Male | Female |
| Farming, Fishing & Forestry | 23 (43.4%) | 30 (56.6%) |
| Construction & Extraction | 450 (84.3%) | 84 (15.7%) |
| Installation, Maintenance & Repair | 181 (96.8%) | 6 (3.2%) |
| Total (Category) | 654 (84.5%) | 120 (15.5%) |
| Total (Overall) | 3,410 (48.1%) | 3,679 (51.9%) |
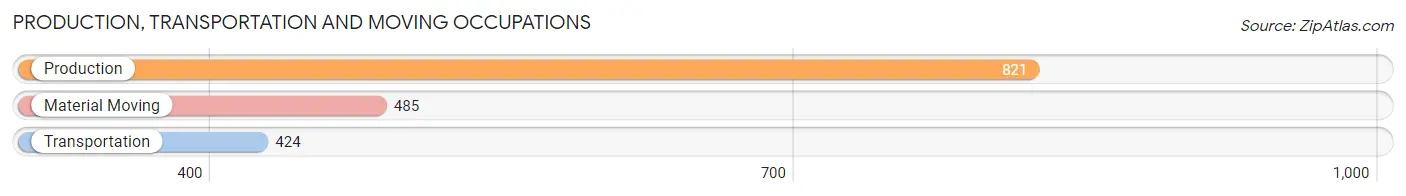
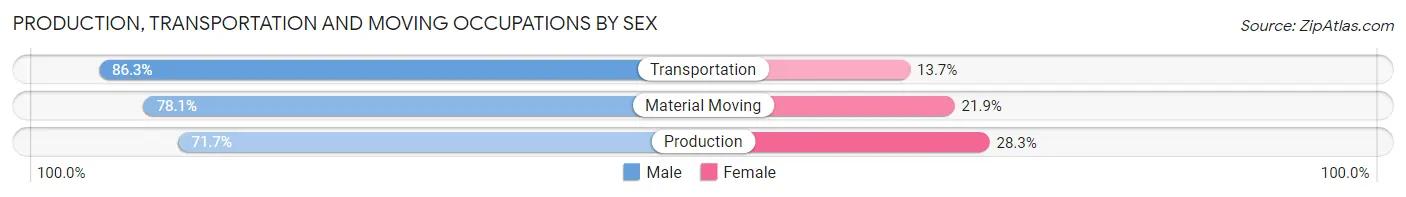
Production, Transportation and Moving Occupations
The most common Production, Transportation and Moving occupations in Ben Hill County are Production (821 | 11.6%), Material Moving (485 | 6.8%), and Transportation (424 | 6.0%).
Production, Transportation and Moving Occupations by Sex
| Occupation | Male | Female |
| Production | 589 (71.7%) | 232 (28.3%) |
| Transportation | 366 (86.3%) | 58 (13.7%) |
| Material Moving | 379 (78.1%) | 106 (21.9%) |
| Total (Category) | 1,334 (77.1%) | 396 (22.9%) |
| Total (Overall) | 3,410 (48.1%) | 3,679 (51.9%) |
Employment Industries by Sex in Ben Hill County
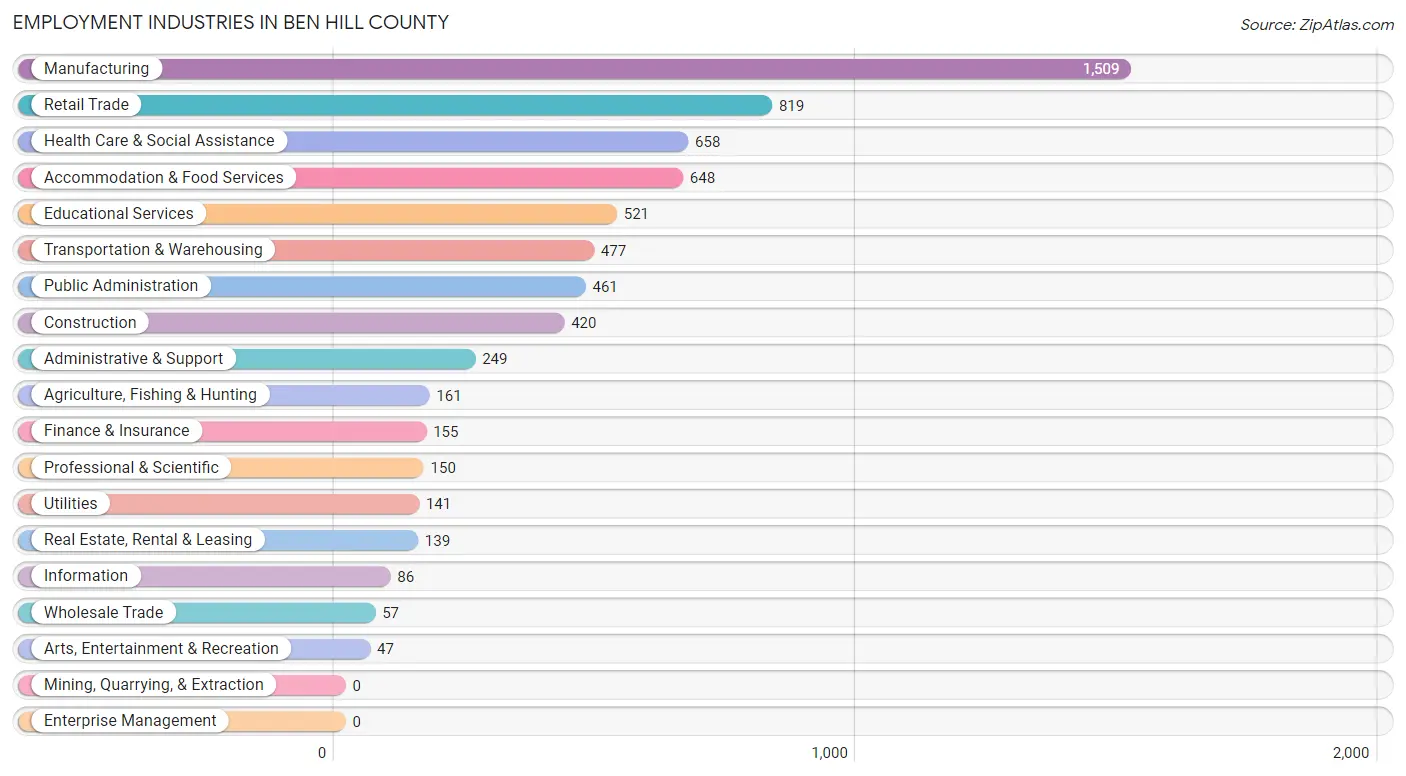
Employment Industries in Ben Hill County
The major employment industries in Ben Hill County include Manufacturing (1,509 | 21.3%), Retail Trade (819 | 11.6%), Health Care & Social Assistance (658 | 9.3%), Accommodation & Food Services (648 | 9.1%), and Educational Services (521 | 7.3%).
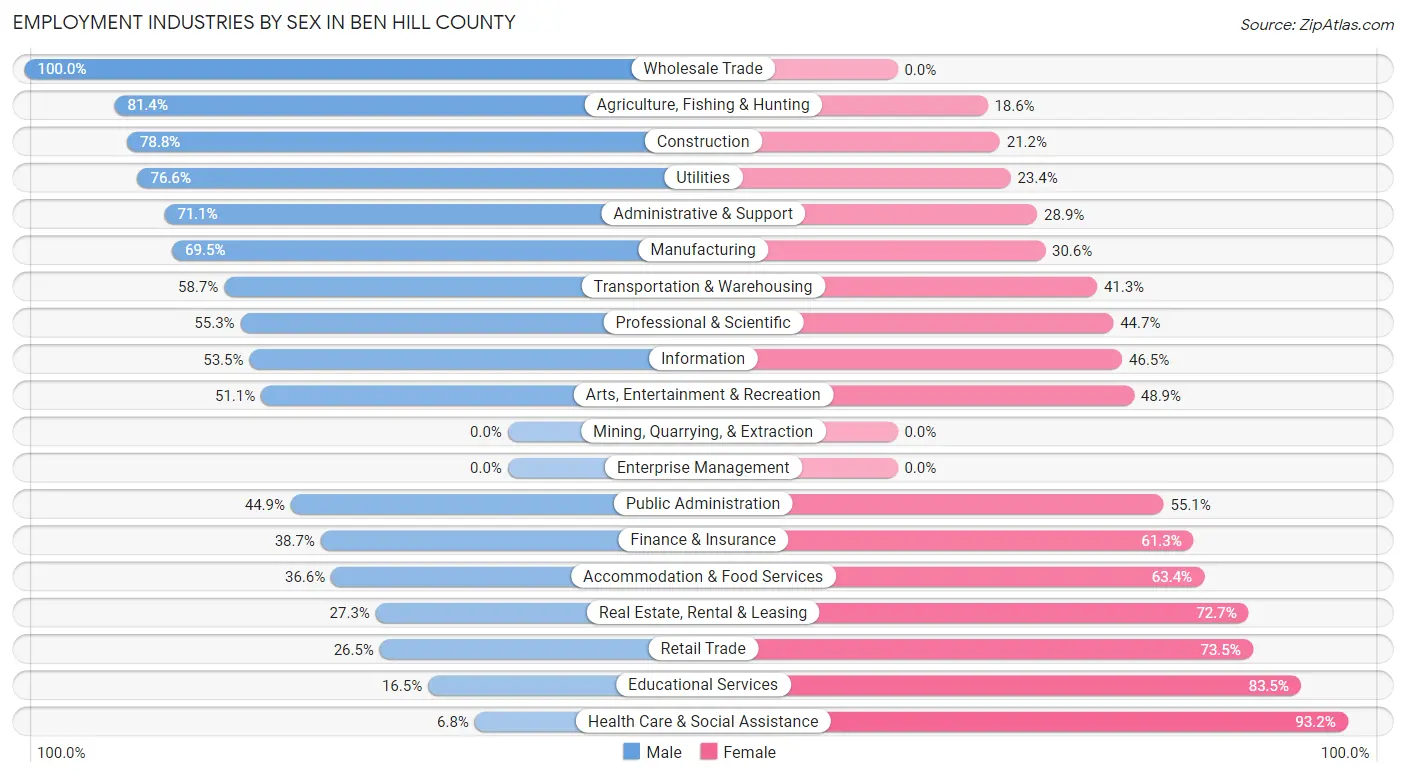
Employment Industries by Sex in Ben Hill County
The Ben Hill County industries that see more men than women are Wholesale Trade (100.0%), Agriculture, Fishing & Hunting (81.4%), and Construction (78.8%), whereas the industries that tend to have a higher number of women are Health Care & Social Assistance (93.2%), Educational Services (83.5%), and Retail Trade (73.5%).
| Industry | Male | Female |
| Agriculture, Fishing & Hunting | 131 (81.4%) | 30 (18.6%) |
| Mining, Quarrying, & Extraction | 0 (0.0%) | 0 (0.0%) |
| Construction | 331 (78.8%) | 89 (21.2%) |
| Manufacturing | 1,048 (69.5%) | 461 (30.5%) |
| Wholesale Trade | 57 (100.0%) | 0 (0.0%) |
| Retail Trade | 217 (26.5%) | 602 (73.5%) |
| Transportation & Warehousing | 280 (58.7%) | 197 (41.3%) |
| Utilities | 108 (76.6%) | 33 (23.4%) |
| Information | 46 (53.5%) | 40 (46.5%) |
| Finance & Insurance | 60 (38.7%) | 95 (61.3%) |
| Real Estate, Rental & Leasing | 38 (27.3%) | 101 (72.7%) |
| Professional & Scientific | 83 (55.3%) | 67 (44.7%) |
| Enterprise Management | 0 (0.0%) | 0 (0.0%) |
| Administrative & Support | 177 (71.1%) | 72 (28.9%) |
| Educational Services | 86 (16.5%) | 435 (83.5%) |
| Health Care & Social Assistance | 45 (6.8%) | 613 (93.2%) |
| Arts, Entertainment & Recreation | 24 (51.1%) | 23 (48.9%) |
| Accommodation & Food Services | 237 (36.6%) | 411 (63.4%) |
| Public Administration | 207 (44.9%) | 254 (55.1%) |
| Total | 3,410 (48.1%) | 3,679 (51.9%) |
Education in Ben Hill County
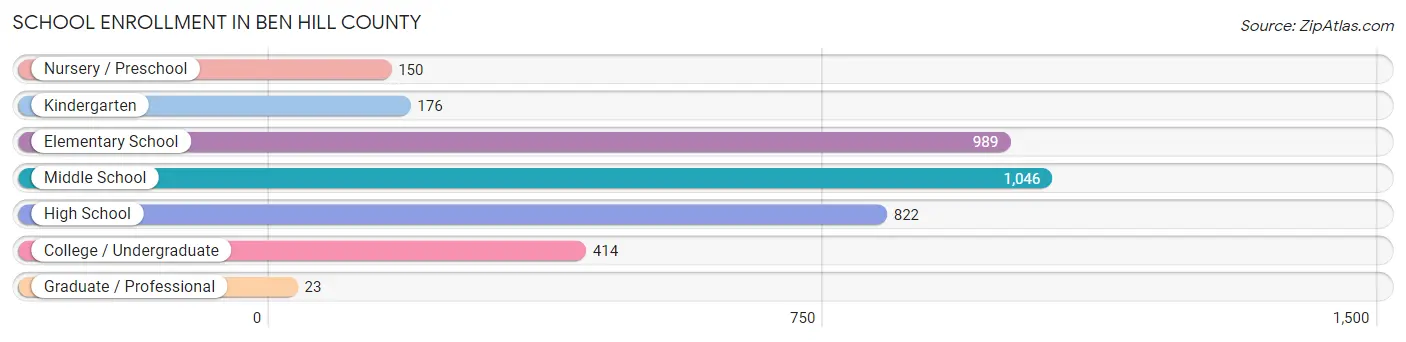
School Enrollment in Ben Hill County
The most common levels of schooling among the 3,620 students in Ben Hill County are middle school (1,046 | 28.9%), elementary school (989 | 27.3%), and high school (822 | 22.7%).
| School Level | # Students | % Students |
| Nursery / Preschool | 150 | 4.1% |
| Kindergarten | 176 | 4.9% |
| Elementary School | 989 | 27.3% |
| Middle School | 1,046 | 28.9% |
| High School | 822 | 22.7% |
| College / Undergraduate | 414 | 11.4% |
| Graduate / Professional | 23 | 0.6% |
| Total | 3,620 | 100.0% |
School Enrollment by Age by Funding Source in Ben Hill County
Out of a total of 3,620 students who are enrolled in schools in Ben Hill County, 329 (9.1%) attend a private institution, while the remaining 3,291 (90.9%) are enrolled in public schools. The age group of 25 to 34 year olds has the highest likelihood of being enrolled in private schools, with 54 (42.5% in the age bracket) enrolled. Conversely, the age group of 18 to 19 year olds has the lowest likelihood of being enrolled in a private school, with 151 (100.0% in the age bracket) attending a public institution.
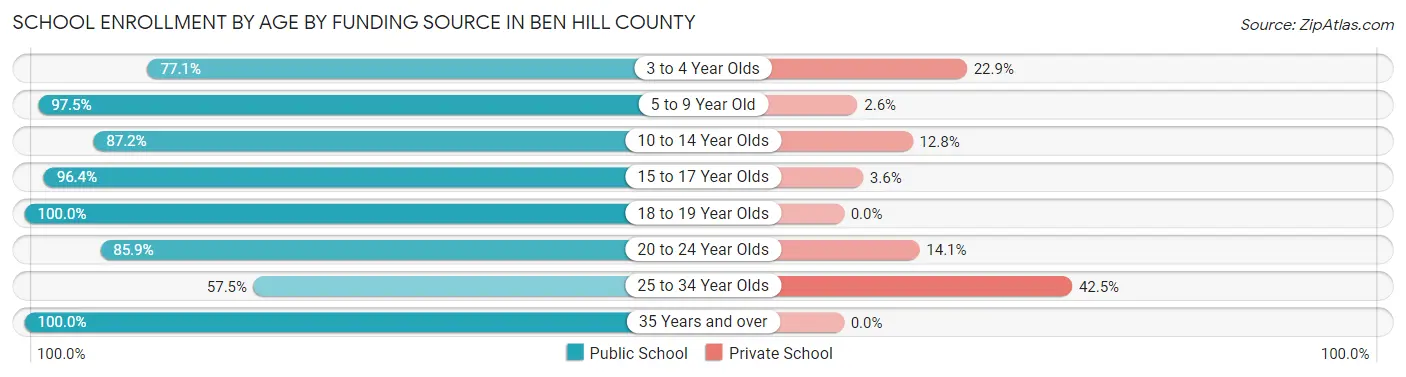
| Age Bracket | Public School | Private School |
| 3 to 4 Year Olds | 74 (77.1%) | 22 (22.9%) |
| 5 to 9 Year Old | 956 (97.5%) | 25 (2.5%) |
| 10 to 14 Year Olds | 1,156 (87.2%) | 170 (12.8%) |
| 15 to 17 Year Olds | 673 (96.4%) | 25 (3.6%) |
| 18 to 19 Year Olds | 151 (100.0%) | 0 (0.0%) |
| 20 to 24 Year Olds | 195 (85.9%) | 32 (14.1%) |
| 25 to 34 Year Olds | 73 (57.5%) | 54 (42.5%) |
| 35 Years and over | 14 (100.0%) | 0 (0.0%) |
| Total | 3,291 (90.9%) | 329 (9.1%) |
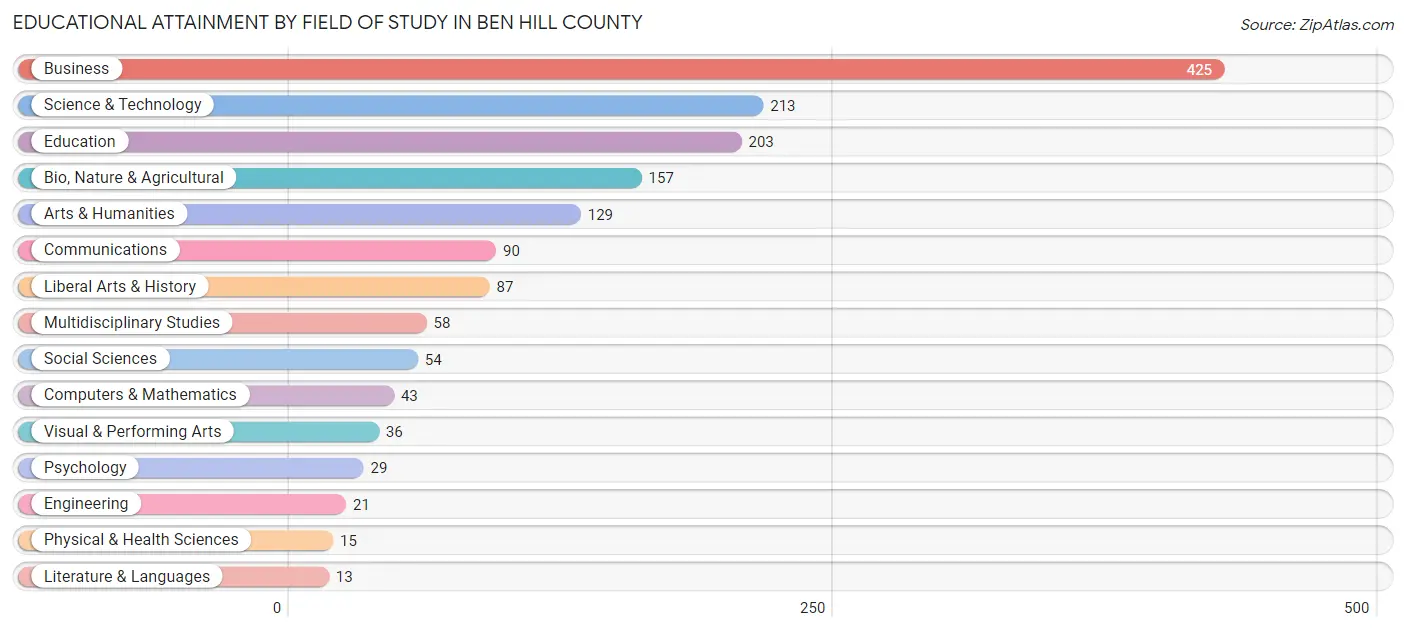
Educational Attainment by Field of Study in Ben Hill County
Business (425 | 27.0%), science & technology (213 | 13.5%), education (203 | 12.9%), bio, nature & agricultural (157 | 10.0%), and arts & humanities (129 | 8.2%) are the most common fields of study among 1,573 individuals in Ben Hill County who have obtained a bachelor's degree or higher.
| Field of Study | # Graduates | % Graduates |
| Computers & Mathematics | 43 | 2.7% |
| Bio, Nature & Agricultural | 157 | 10.0% |
| Physical & Health Sciences | 15 | 0.9% |
| Psychology | 29 | 1.8% |
| Social Sciences | 54 | 3.4% |
| Engineering | 21 | 1.3% |
| Multidisciplinary Studies | 58 | 3.7% |
| Science & Technology | 213 | 13.5% |
| Business | 425 | 27.0% |
| Education | 203 | 12.9% |
| Literature & Languages | 13 | 0.8% |
| Liberal Arts & History | 87 | 5.5% |
| Visual & Performing Arts | 36 | 2.3% |
| Communications | 90 | 5.7% |
| Arts & Humanities | 129 | 8.2% |
| Total | 1,573 | 100.0% |
Transportation & Commute in Ben Hill County
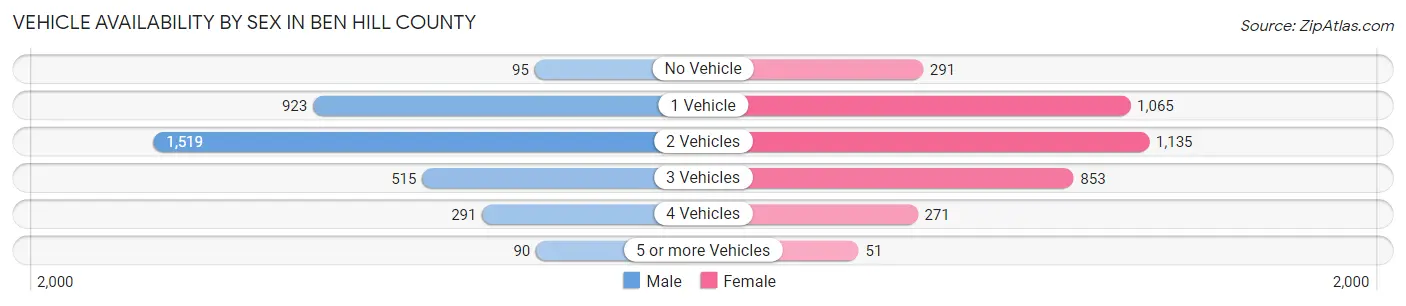
Vehicle Availability by Sex in Ben Hill County
The most prevalent vehicle ownership categories in Ben Hill County are males with 2 vehicles (1,519, accounting for 44.3%) and females with 2 vehicles (1,135, making up 41.4%).
| Vehicles Available | Male | Female |
| No Vehicle | 95 (2.8%) | 291 (7.9%) |
| 1 Vehicle | 923 (26.9%) | 1,065 (29.0%) |
| 2 Vehicles | 1,519 (44.3%) | 1,135 (31.0%) |
| 3 Vehicles | 515 (15.0%) | 853 (23.3%) |
| 4 Vehicles | 291 (8.5%) | 271 (7.4%) |
| 5 or more Vehicles | 90 (2.6%) | 51 (1.4%) |
| Total | 3,433 (100.0%) | 3,666 (100.0%) |
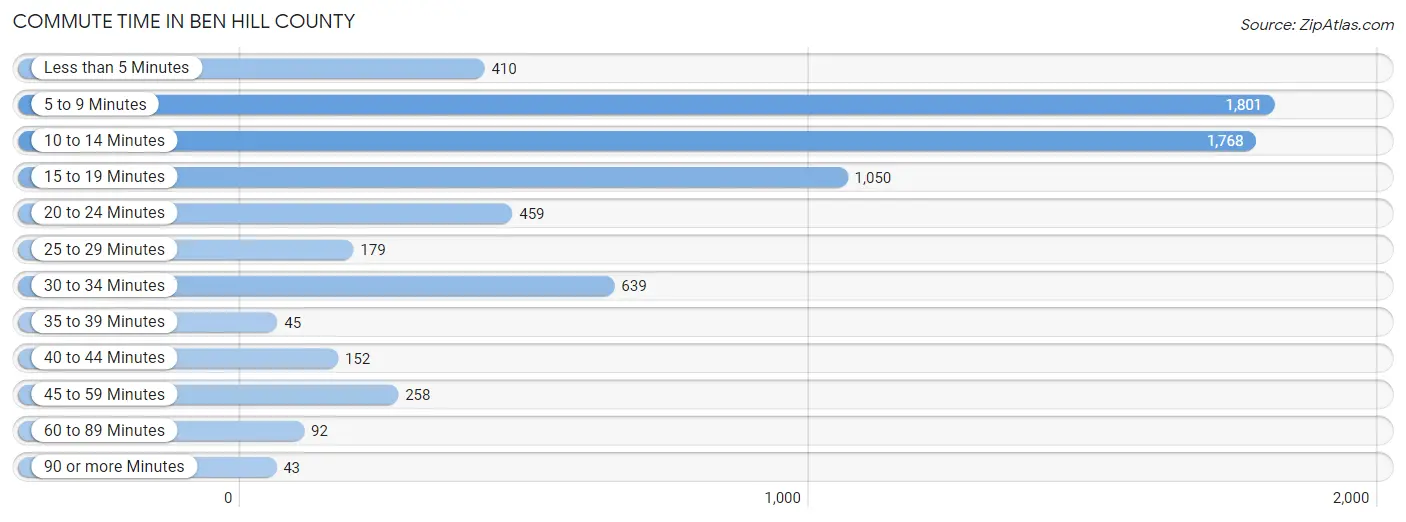
Commute Time in Ben Hill County
The most frequently occuring commute durations in Ben Hill County are 5 to 9 minutes (1,801 commuters, 26.1%), 10 to 14 minutes (1,768 commuters, 25.6%), and 15 to 19 minutes (1,050 commuters, 15.2%).
| Commute Time | # Commuters | % Commuters |
| Less than 5 Minutes | 410 | 5.9% |
| 5 to 9 Minutes | 1,801 | 26.1% |
| 10 to 14 Minutes | 1,768 | 25.6% |
| 15 to 19 Minutes | 1,050 | 15.2% |
| 20 to 24 Minutes | 459 | 6.7% |
| 25 to 29 Minutes | 179 | 2.6% |
| 30 to 34 Minutes | 639 | 9.3% |
| 35 to 39 Minutes | 45 | 0.6% |
| 40 to 44 Minutes | 152 | 2.2% |
| 45 to 59 Minutes | 258 | 3.7% |
| 60 to 89 Minutes | 92 | 1.3% |
| 90 or more Minutes | 43 | 0.6% |
Commute Time by Sex in Ben Hill County
The most common commute times in Ben Hill County are 5 to 9 minutes (1,016 commuters, 30.3%) for males and 10 to 14 minutes (907 commuters, 25.6%) for females.
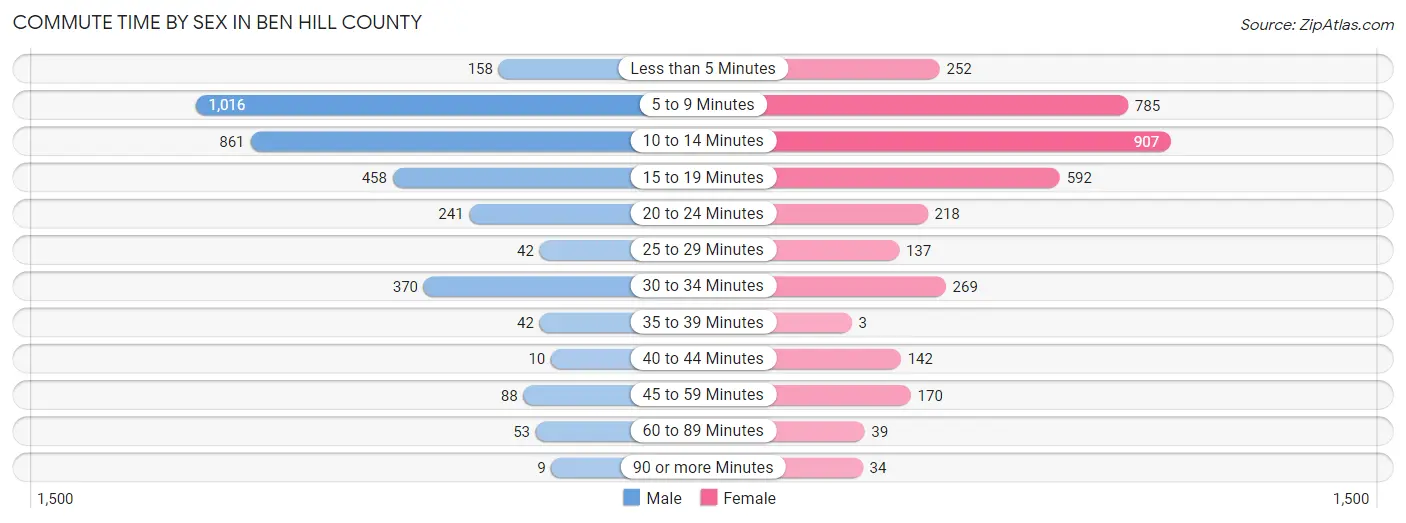
| Commute Time | Male | Female |
| Less than 5 Minutes | 158 (4.7%) | 252 (7.1%) |
| 5 to 9 Minutes | 1,016 (30.3%) | 785 (22.1%) |
| 10 to 14 Minutes | 861 (25.7%) | 907 (25.6%) |
| 15 to 19 Minutes | 458 (13.7%) | 592 (16.7%) |
| 20 to 24 Minutes | 241 (7.2%) | 218 (6.1%) |
| 25 to 29 Minutes | 42 (1.3%) | 137 (3.9%) |
| 30 to 34 Minutes | 370 (11.1%) | 269 (7.6%) |
| 35 to 39 Minutes | 42 (1.3%) | 3 (0.1%) |
| 40 to 44 Minutes | 10 (0.3%) | 142 (4.0%) |
| 45 to 59 Minutes | 88 (2.6%) | 170 (4.8%) |
| 60 to 89 Minutes | 53 (1.6%) | 39 (1.1%) |
| 90 or more Minutes | 9 (0.3%) | 34 (1.0%) |
Time of Departure to Work by Sex in Ben Hill County
The most frequent times of departure to work in Ben Hill County are 6:30 AM to 6:59 AM (761, 22.7%) for males and 6:30 AM to 6:59 AM (724, 20.4%) for females.
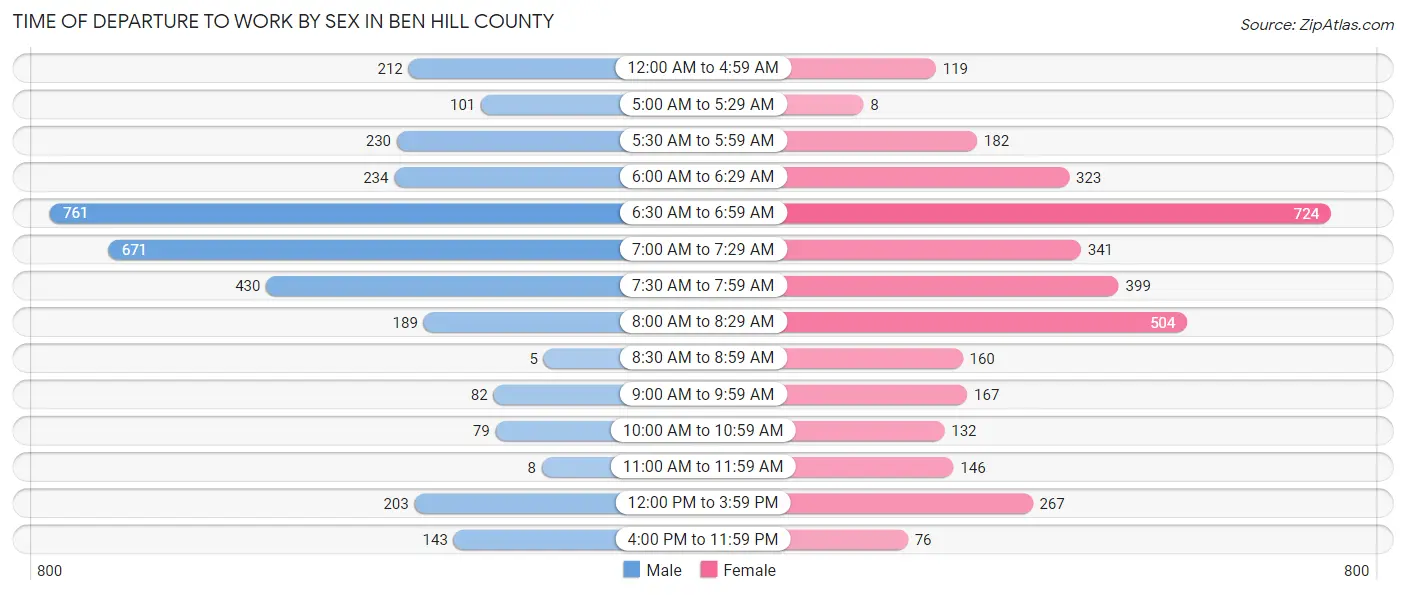
| Time of Departure | Male | Female |
| 12:00 AM to 4:59 AM | 212 (6.3%) | 119 (3.4%) |
| 5:00 AM to 5:29 AM | 101 (3.0%) | 8 (0.2%) |
| 5:30 AM to 5:59 AM | 230 (6.9%) | 182 (5.1%) |
| 6:00 AM to 6:29 AM | 234 (7.0%) | 323 (9.1%) |
| 6:30 AM to 6:59 AM | 761 (22.7%) | 724 (20.4%) |
| 7:00 AM to 7:29 AM | 671 (20.0%) | 341 (9.6%) |
| 7:30 AM to 7:59 AM | 430 (12.8%) | 399 (11.3%) |
| 8:00 AM to 8:29 AM | 189 (5.7%) | 504 (14.2%) |
| 8:30 AM to 8:59 AM | 5 (0.2%) | 160 (4.5%) |
| 9:00 AM to 9:59 AM | 82 (2.5%) | 167 (4.7%) |
| 10:00 AM to 10:59 AM | 79 (2.4%) | 132 (3.7%) |
| 11:00 AM to 11:59 AM | 8 (0.2%) | 146 (4.1%) |
| 12:00 PM to 3:59 PM | 203 (6.1%) | 267 (7.5%) |
| 4:00 PM to 11:59 PM | 143 (4.3%) | 76 (2.1%) |
| Total | 3,348 (100.0%) | 3,548 (100.0%) |
Housing Occupancy in Ben Hill County
Occupancy by Ownership in Ben Hill County
Of the total 7,126 dwellings in Ben Hill County, owner-occupied units account for 4,123 (57.9%), while renter-occupied units make up 3,003 (42.1%).
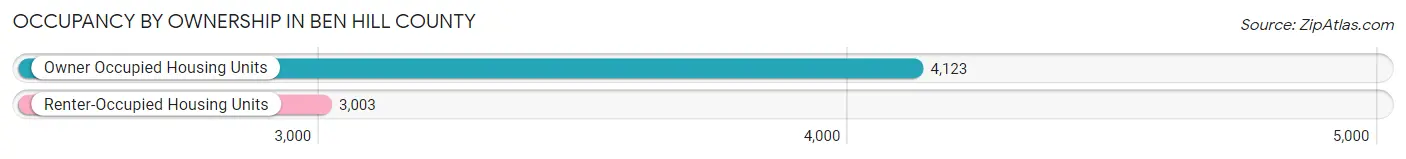
| Occupancy | # Housing Units | % Housing Units |
| Owner Occupied Housing Units | 4,123 | 57.9% |
| Renter-Occupied Housing Units | 3,003 | 42.1% |
| Total Occupied Housing Units | 7,126 | 100.0% |
Occupancy by Household Size in Ben Hill County
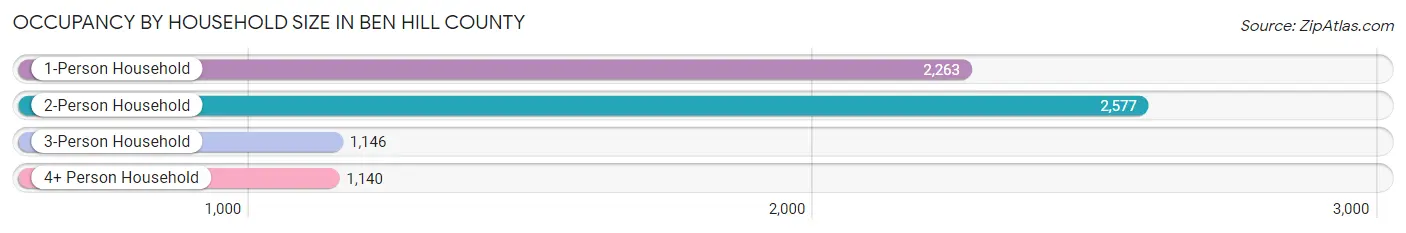
| Household Size | # Housing Units | % Housing Units |
| 1-Person Household | 2,263 | 31.8% |
| 2-Person Household | 2,577 | 36.2% |
| 3-Person Household | 1,146 | 16.1% |
| 4+ Person Household | 1,140 | 16.0% |
| Total Housing Units | 7,126 | 100.0% |
Occupancy by Ownership by Household Size in Ben Hill County
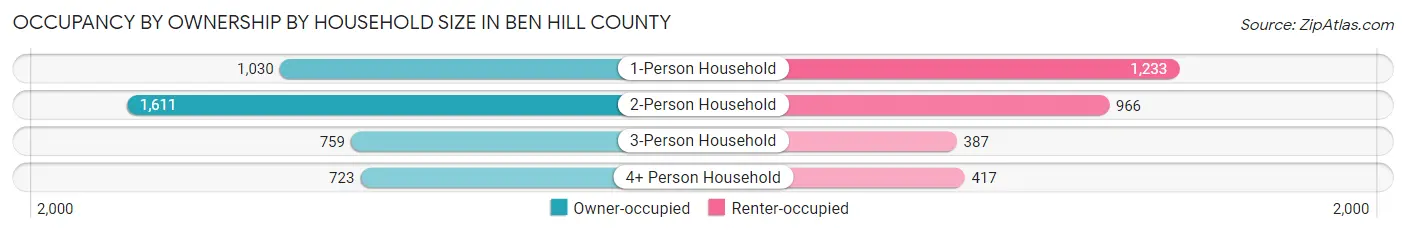
| Household Size | Owner-occupied | Renter-occupied |
| 1-Person Household | 1,030 (45.5%) | 1,233 (54.5%) |
| 2-Person Household | 1,611 (62.5%) | 966 (37.5%) |
| 3-Person Household | 759 (66.2%) | 387 (33.8%) |
| 4+ Person Household | 723 (63.4%) | 417 (36.6%) |
| Total Housing Units | 4,123 (57.9%) | 3,003 (42.1%) |
Occupancy by Educational Attainment in Ben Hill County
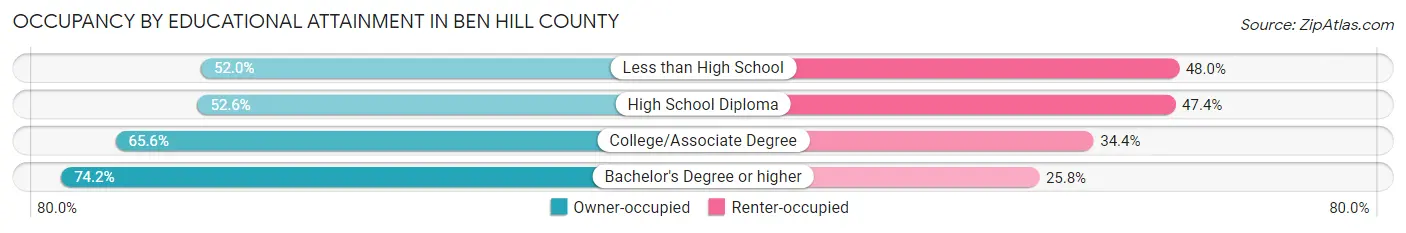
| Household Size | Owner-occupied | Renter-occupied |
| Less than High School | 492 (52.0%) | 454 (48.0%) |
| High School Diploma | 2,011 (52.6%) | 1,814 (47.4%) |
| College/Associate Degree | 965 (65.6%) | 507 (34.4%) |
| Bachelor's Degree or higher | 655 (74.2%) | 228 (25.8%) |
Occupancy by Age of Householder in Ben Hill County
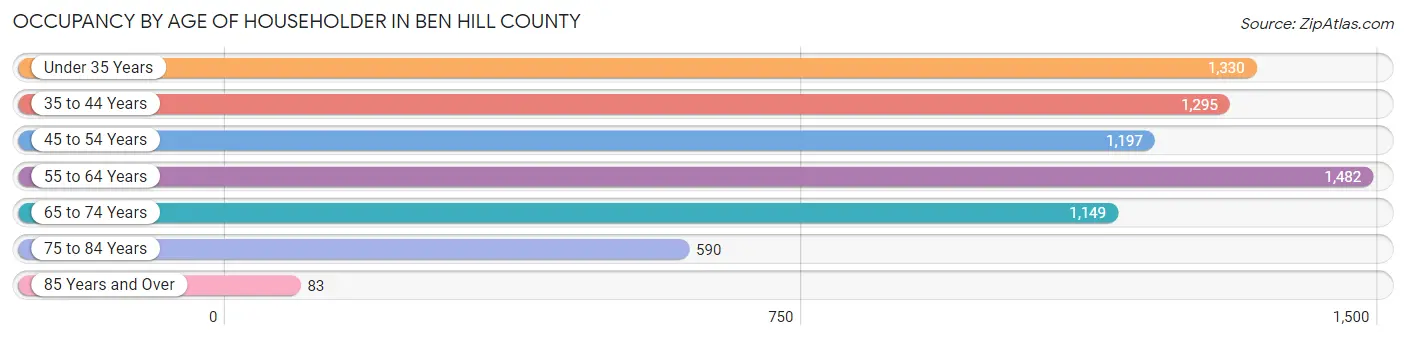
| Age Bracket | # Households | % Households |
| Under 35 Years | 1,330 | 18.7% |
| 35 to 44 Years | 1,295 | 18.2% |
| 45 to 54 Years | 1,197 | 16.8% |
| 55 to 64 Years | 1,482 | 20.8% |
| 65 to 74 Years | 1,149 | 16.1% |
| 75 to 84 Years | 590 | 8.3% |
| 85 Years and Over | 83 | 1.2% |
| Total | 7,126 | 100.0% |
Housing Finances in Ben Hill County
Median Income by Occupancy in Ben Hill County
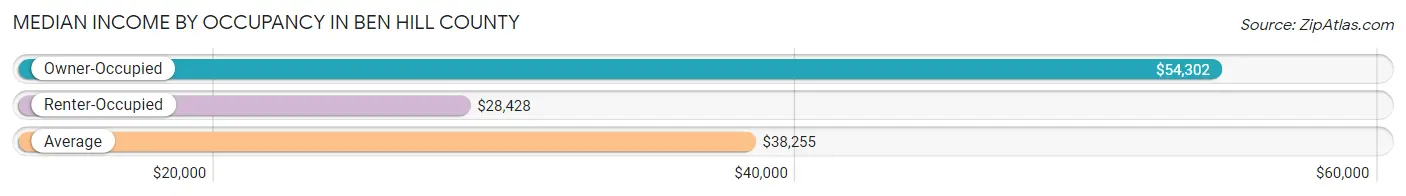
| Occupancy Type | # Households | Median Income |
| Owner-Occupied | 4,123 (57.9%) | $54,302 |
| Renter-Occupied | 3,003 (42.1%) | $28,428 |
| Average | 7,126 (100.0%) | $38,255 |
Occupancy by Householder Income Bracket in Ben Hill County
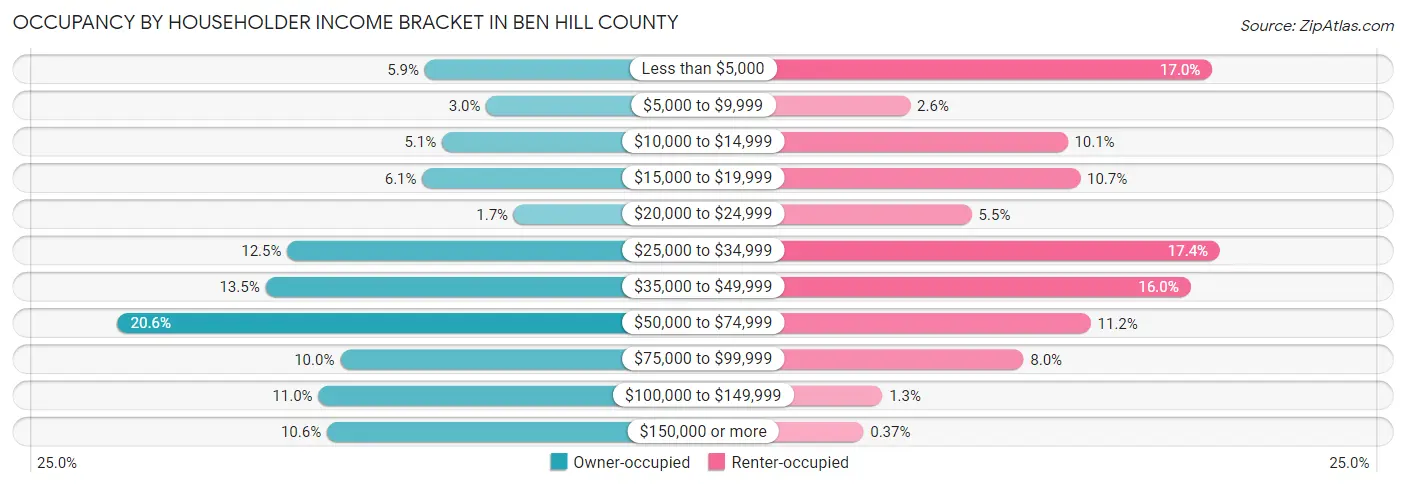
| Income Bracket | Owner-occupied | Renter-occupied |
| Less than $5,000 | 245 (5.9%) | 510 (17.0%) |
| $5,000 to $9,999 | 124 (3.0%) | 78 (2.6%) |
| $10,000 to $14,999 | 211 (5.1%) | 303 (10.1%) |
| $15,000 to $19,999 | 250 (6.1%) | 321 (10.7%) |
| $20,000 to $24,999 | 70 (1.7%) | 166 (5.5%) |
| $25,000 to $34,999 | 515 (12.5%) | 521 (17.3%) |
| $35,000 to $49,999 | 558 (13.5%) | 479 (16.0%) |
| $50,000 to $74,999 | 848 (20.6%) | 336 (11.2%) |
| $75,000 to $99,999 | 411 (10.0%) | 240 (8.0%) |
| $100,000 to $149,999 | 454 (11.0%) | 38 (1.3%) |
| $150,000 or more | 437 (10.6%) | 11 (0.4%) |
| Total | 4,123 (100.0%) | 3,003 (100.0%) |
Monthly Housing Cost Tiers in Ben Hill County
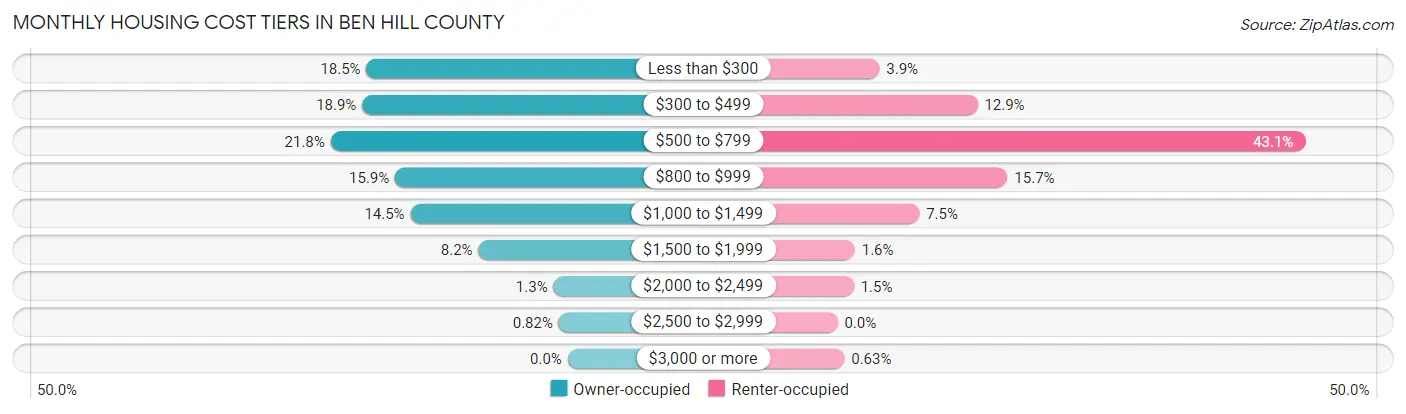
| Monthly Cost | Owner-occupied | Renter-occupied |
| Less than $300 | 764 (18.5%) | 116 (3.9%) |
| $300 to $499 | 780 (18.9%) | 387 (12.9%) |
| $500 to $799 | 900 (21.8%) | 1,293 (43.1%) |
| $800 to $999 | 655 (15.9%) | 470 (15.7%) |
| $1,000 to $1,499 | 597 (14.5%) | 226 (7.5%) |
| $1,500 to $1,999 | 339 (8.2%) | 48 (1.6%) |
| $2,000 to $2,499 | 54 (1.3%) | 45 (1.5%) |
| $2,500 to $2,999 | 34 (0.8%) | 0 (0.0%) |
| $3,000 or more | 0 (0.0%) | 19 (0.6%) |
| Total | 4,123 (100.0%) | 3,003 (100.0%) |
Physical Housing Characteristics in Ben Hill County
Housing Structures in Ben Hill County
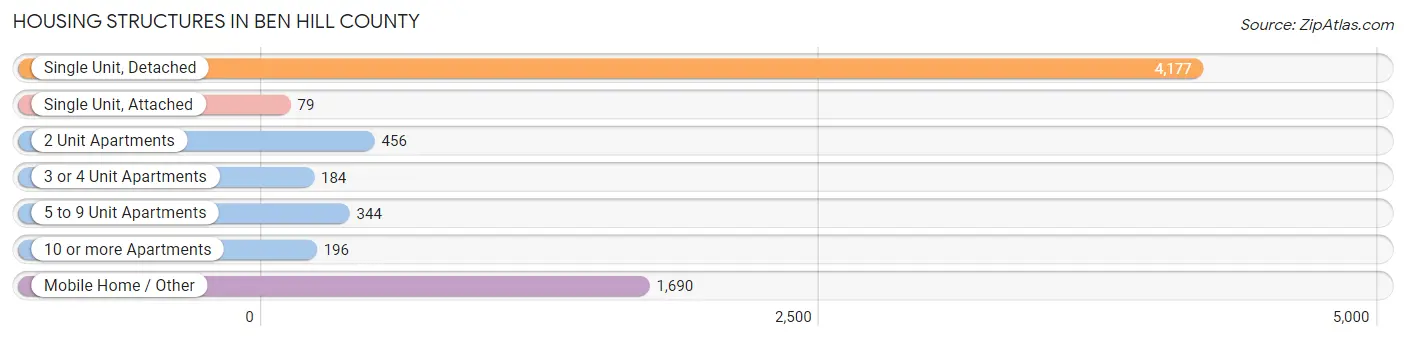
| Structure Type | # Housing Units | % Housing Units |
| Single Unit, Detached | 4,177 | 58.6% |
| Single Unit, Attached | 79 | 1.1% |
| 2 Unit Apartments | 456 | 6.4% |
| 3 or 4 Unit Apartments | 184 | 2.6% |
| 5 to 9 Unit Apartments | 344 | 4.8% |
| 10 or more Apartments | 196 | 2.8% |
| Mobile Home / Other | 1,690 | 23.7% |
| Total | 7,126 | 100.0% |
Housing Structures by Occupancy in Ben Hill County
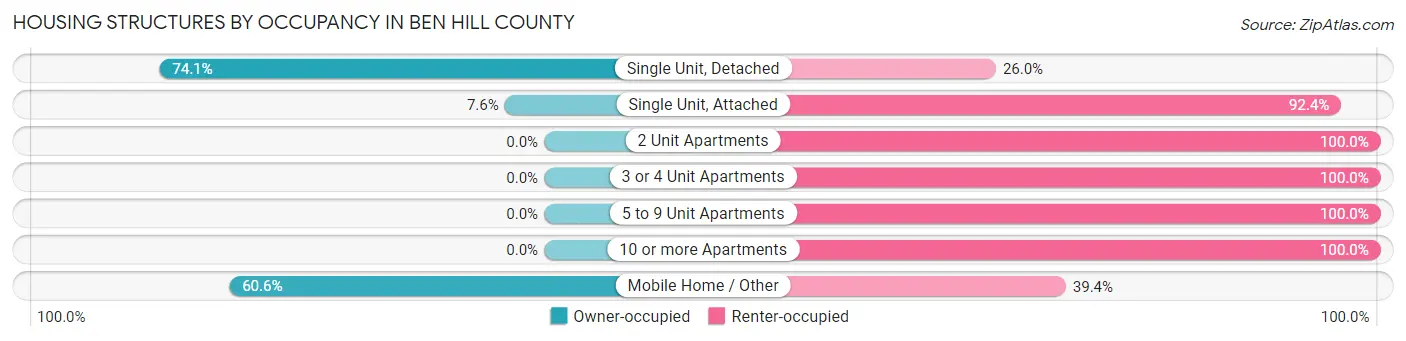
| Structure Type | Owner-occupied | Renter-occupied |
| Single Unit, Detached | 3,093 (74.1%) | 1,084 (26.0%) |
| Single Unit, Attached | 6 (7.6%) | 73 (92.4%) |
| 2 Unit Apartments | 0 (0.0%) | 456 (100.0%) |
| 3 or 4 Unit Apartments | 0 (0.0%) | 184 (100.0%) |
| 5 to 9 Unit Apartments | 0 (0.0%) | 344 (100.0%) |
| 10 or more Apartments | 0 (0.0%) | 196 (100.0%) |
| Mobile Home / Other | 1,024 (60.6%) | 666 (39.4%) |
| Total | 4,123 (57.9%) | 3,003 (42.1%) |
Housing Structures by Number of Rooms in Ben Hill County
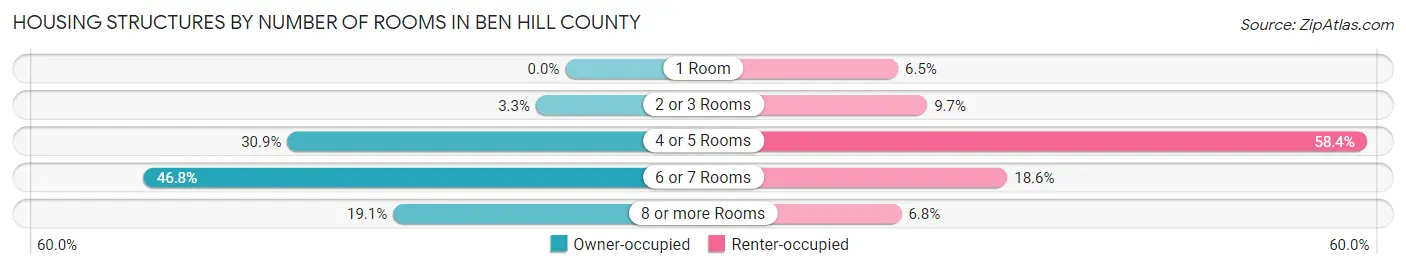
| Number of Rooms | Owner-occupied | Renter-occupied |
| 1 Room | 0 (0.0%) | 194 (6.5%) |
| 2 or 3 Rooms | 135 (3.3%) | 291 (9.7%) |
| 4 or 5 Rooms | 1,272 (30.8%) | 1,755 (58.4%) |
| 6 or 7 Rooms | 1,928 (46.8%) | 558 (18.6%) |
| 8 or more Rooms | 788 (19.1%) | 205 (6.8%) |
| Total | 4,123 (100.0%) | 3,003 (100.0%) |
Housing Structure by Heating Type in Ben Hill County
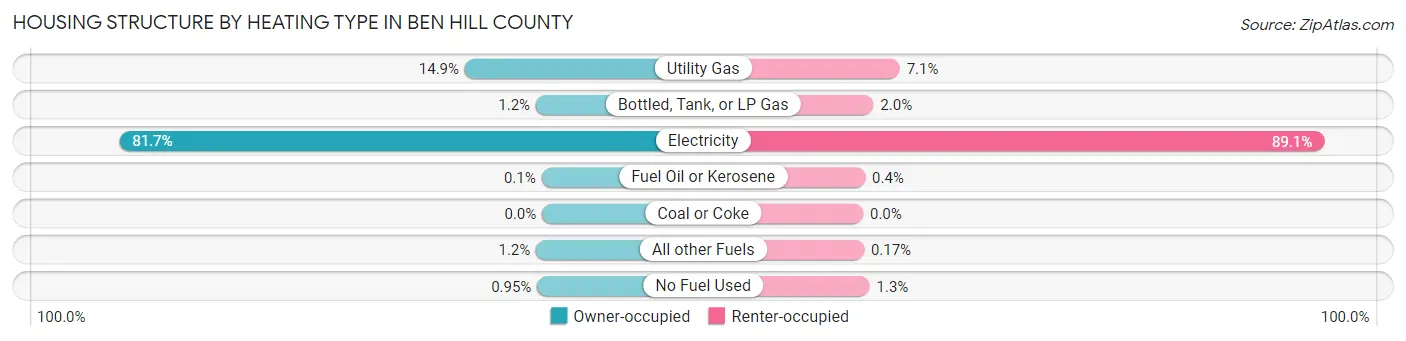
| Heating Type | Owner-occupied | Renter-occupied |
| Utility Gas | 615 (14.9%) | 213 (7.1%) |
| Bottled, Tank, or LP Gas | 49 (1.2%) | 60 (2.0%) |
| Electricity | 3,368 (81.7%) | 2,675 (89.1%) |
| Fuel Oil or Kerosene | 4 (0.1%) | 12 (0.4%) |
| Coal or Coke | 0 (0.0%) | 0 (0.0%) |
| All other Fuels | 48 (1.2%) | 5 (0.2%) |
| No Fuel Used | 39 (0.9%) | 38 (1.3%) |
| Total | 4,123 (100.0%) | 3,003 (100.0%) |
Household Vehicle Usage in Ben Hill County
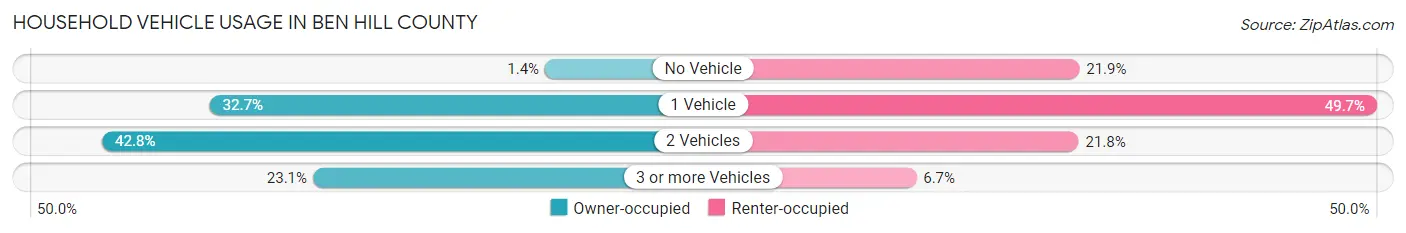
| Vehicles per Household | Owner-occupied | Renter-occupied |
| No Vehicle | 59 (1.4%) | 657 (21.9%) |
| 1 Vehicle | 1,349 (32.7%) | 1,491 (49.6%) |
| 2 Vehicles | 1,763 (42.8%) | 655 (21.8%) |
| 3 or more Vehicles | 952 (23.1%) | 200 (6.7%) |
| Total | 4,123 (100.0%) | 3,003 (100.0%) |
Real Estate & Mortgages in Ben Hill County
Real Estate and Mortgage Overview in Ben Hill County
| Characteristic | Without Mortgage | With Mortgage |
| Housing Units | 2,388 | 1,735 |
| Median Property Value | $85,900 | $122,900 |
| Median Household Income | $38,843 | $217 |
| Monthly Housing Costs | $421 | $0 |
| Real Estate Taxes | $752 | $36 |
Property Value by Mortgage Status in Ben Hill County
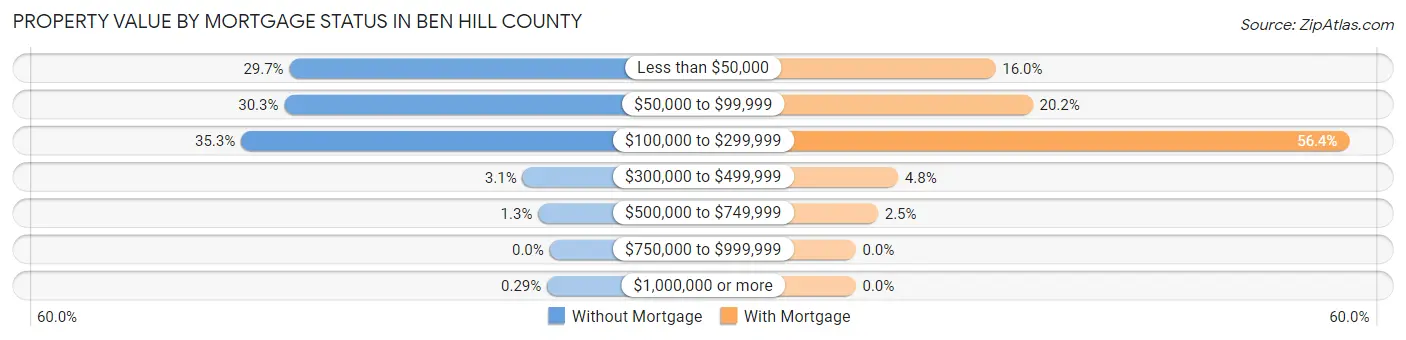
| Property Value | Without Mortgage | With Mortgage |
| Less than $50,000 | 710 (29.7%) | 277 (16.0%) |
| $50,000 to $99,999 | 724 (30.3%) | 351 (20.2%) |
| $100,000 to $299,999 | 842 (35.3%) | 979 (56.4%) |
| $300,000 to $499,999 | 74 (3.1%) | 84 (4.8%) |
| $500,000 to $749,999 | 31 (1.3%) | 44 (2.5%) |
| $750,000 to $999,999 | 0 (0.0%) | 0 (0.0%) |
| $1,000,000 or more | 7 (0.3%) | 0 (0.0%) |
| Total | 2,388 (100.0%) | 1,735 (100.0%) |
Household Income by Mortgage Status in Ben Hill County
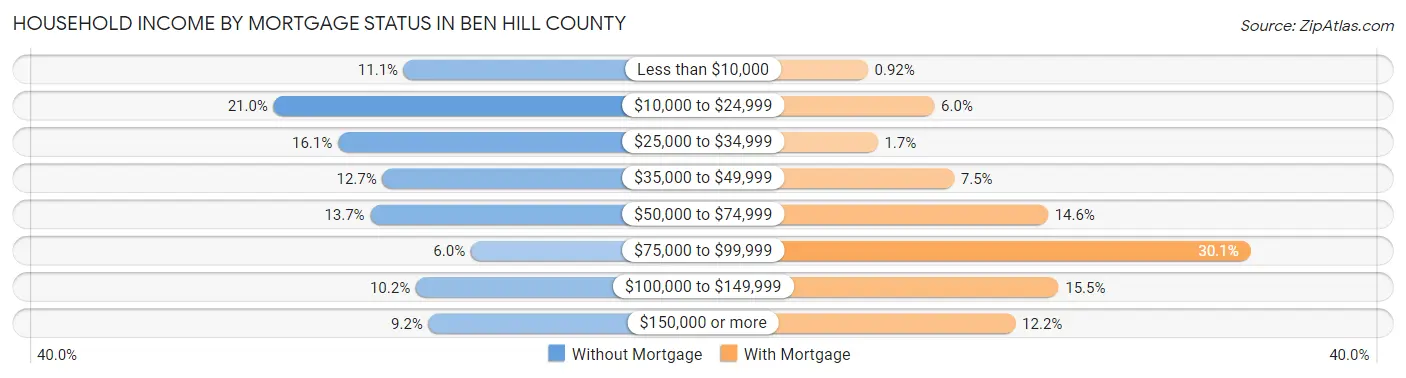
| Household Income | Without Mortgage | With Mortgage |
| Less than $10,000 | 265 (11.1%) | 16 (0.9%) |
| $10,000 to $24,999 | 502 (21.0%) | 104 (6.0%) |
| $25,000 to $34,999 | 385 (16.1%) | 29 (1.7%) |
| $35,000 to $49,999 | 304 (12.7%) | 130 (7.5%) |
| $50,000 to $74,999 | 326 (13.7%) | 254 (14.6%) |
| $75,000 to $99,999 | 143 (6.0%) | 522 (30.1%) |
| $100,000 to $149,999 | 243 (10.2%) | 268 (15.4%) |
| $150,000 or more | 220 (9.2%) | 211 (12.2%) |
| Total | 2,388 (100.0%) | 1,735 (100.0%) |
Property Value to Household Income Ratio in Ben Hill County
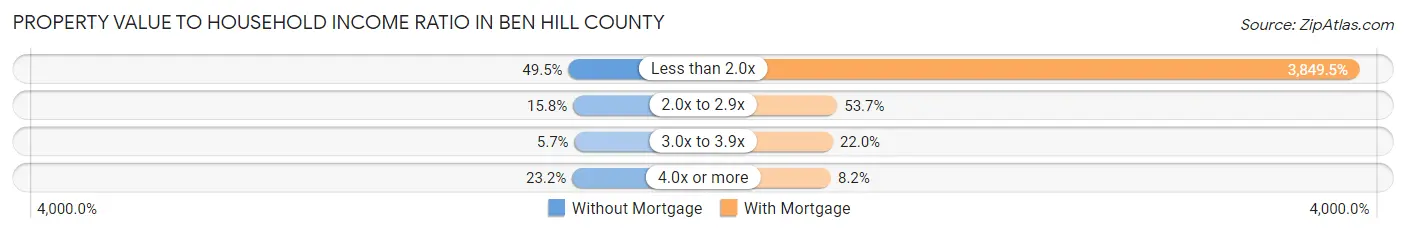
| Value-to-Income Ratio | Without Mortgage | With Mortgage |
| Less than 2.0x | 1,182 (49.5%) | 66,789 (3,849.5%) |
| 2.0x to 2.9x | 376 (15.8%) | 932 (53.7%) |
| 3.0x to 3.9x | 136 (5.7%) | 381 (22.0%) |
| 4.0x or more | 554 (23.2%) | 142 (8.2%) |
| Total | 2,388 (100.0%) | 1,735 (100.0%) |
Real Estate Taxes by Mortgage Status in Ben Hill County
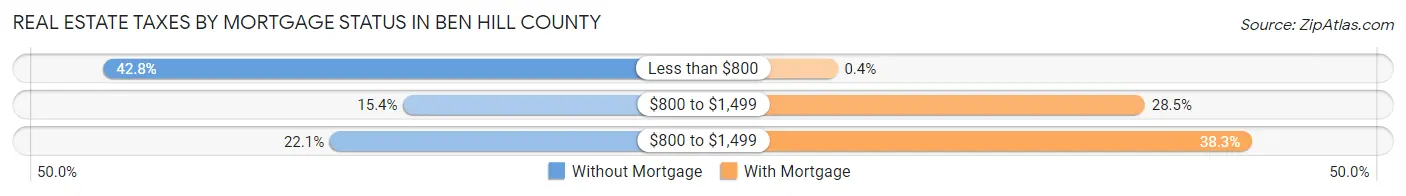
| Property Taxes | Without Mortgage | With Mortgage |
| Less than $800 | 1,022 (42.8%) | 7 (0.4%) |
| $800 to $1,499 | 368 (15.4%) | 494 (28.5%) |
| $800 to $1,499 | 528 (22.1%) | 664 (38.3%) |
| Total | 2,388 (100.0%) | 1,735 (100.0%) |
Health & Disability in Ben Hill County
Health Insurance Coverage by Age in Ben Hill County
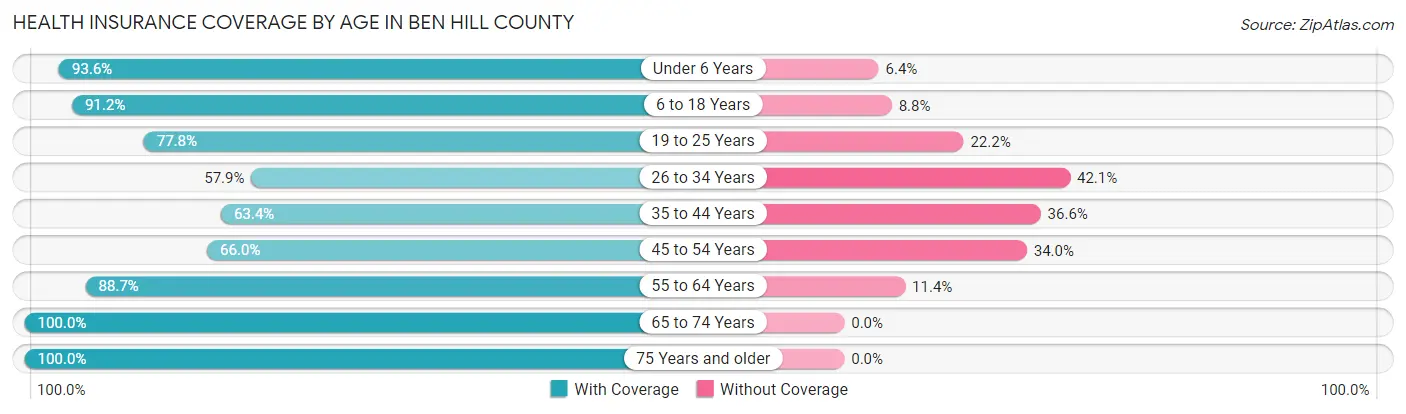
| Age Bracket | With Coverage | Without Coverage |
| Under 6 Years | 1,097 (93.6%) | 75 (6.4%) |
| 6 to 18 Years | 2,930 (91.2%) | 284 (8.8%) |
| 19 to 25 Years | 1,109 (77.8%) | 317 (22.2%) |
| 26 to 34 Years | 1,018 (57.9%) | 740 (42.1%) |
| 35 to 44 Years | 1,291 (63.4%) | 746 (36.6%) |
| 45 to 54 Years | 1,355 (66.0%) | 699 (34.0%) |
| 55 to 64 Years | 2,023 (88.6%) | 259 (11.4%) |
| 65 to 74 Years | 1,787 (100.0%) | 0 (0.0%) |
| 75 Years and older | 1,084 (100.0%) | 0 (0.0%) |
| Total | 13,694 (81.4%) | 3,120 (18.6%) |
Health Insurance Coverage by Citizenship Status in Ben Hill County
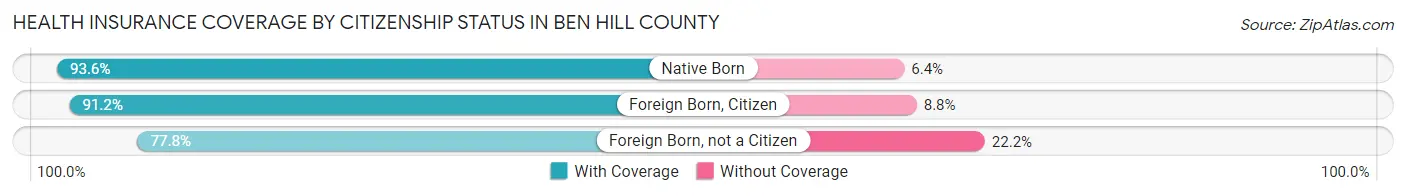
| Citizenship Status | With Coverage | Without Coverage |
| Native Born | 1,097 (93.6%) | 75 (6.4%) |
| Foreign Born, Citizen | 2,930 (91.2%) | 284 (8.8%) |
| Foreign Born, not a Citizen | 1,109 (77.8%) | 317 (22.2%) |
Health Insurance Coverage by Household Income in Ben Hill County
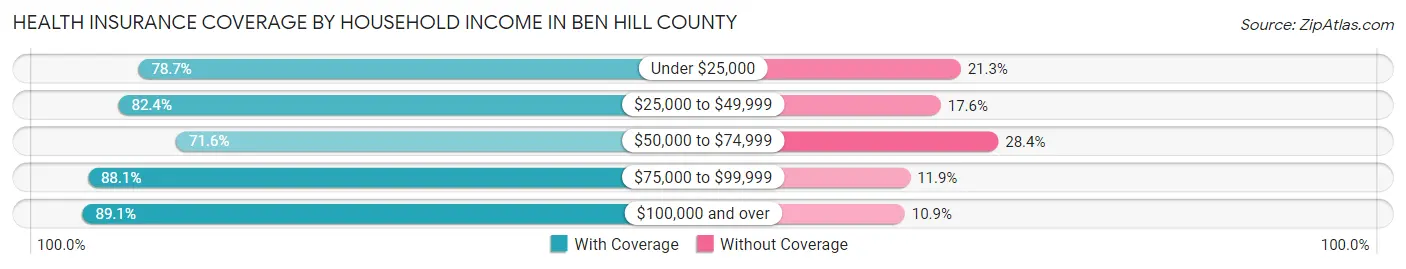
| Household Income | With Coverage | Without Coverage |
| Under $25,000 | 3,564 (78.7%) | 967 (21.3%) |
| $25,000 to $49,999 | 3,705 (82.4%) | 792 (17.6%) |
| $50,000 to $74,999 | 2,021 (71.6%) | 801 (28.4%) |
| $75,000 to $99,999 | 1,721 (88.1%) | 232 (11.9%) |
| $100,000 and over | 2,673 (89.1%) | 326 (10.9%) |
Public vs Private Health Insurance Coverage by Age in Ben Hill County
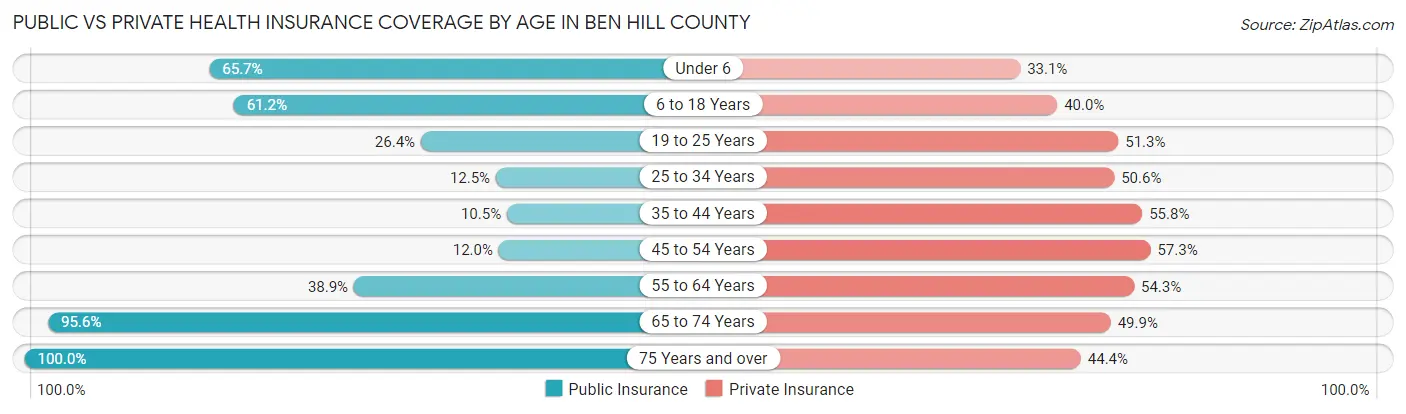
| Age Bracket | Public Insurance | Private Insurance |
| Under 6 | 770 (65.7%) | 388 (33.1%) |
| 6 to 18 Years | 1,966 (61.2%) | 1,285 (40.0%) |
| 19 to 25 Years | 377 (26.4%) | 732 (51.3%) |
| 25 to 34 Years | 220 (12.5%) | 889 (50.6%) |
| 35 to 44 Years | 213 (10.5%) | 1,136 (55.8%) |
| 45 to 54 Years | 246 (12.0%) | 1,177 (57.3%) |
| 55 to 64 Years | 887 (38.9%) | 1,238 (54.2%) |
| 65 to 74 Years | 1,709 (95.6%) | 892 (49.9%) |
| 75 Years and over | 1,084 (100.0%) | 481 (44.4%) |
| Total | 7,472 (44.4%) | 8,218 (48.9%) |
Disability Status by Sex by Age in Ben Hill County
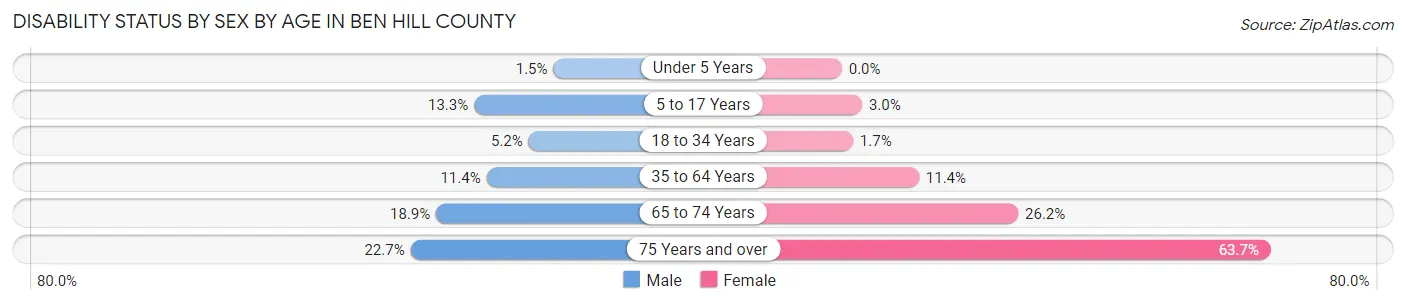
| Age Bracket | Male | Female |
| Under 5 Years | 8 (1.5%) | 0 (0.0%) |
| 5 to 17 Years | 206 (13.3%) | 49 (3.0%) |
| 18 to 34 Years | 76 (5.2%) | 31 (1.7%) |
| 35 to 64 Years | 355 (11.4%) | 373 (11.4%) |
| 65 to 74 Years | 145 (18.9%) | 267 (26.2%) |
| 75 Years and over | 101 (22.7%) | 407 (63.7%) |
Disability Class by Sex by Age in Ben Hill County
Disability Class: Hearing Difficulty
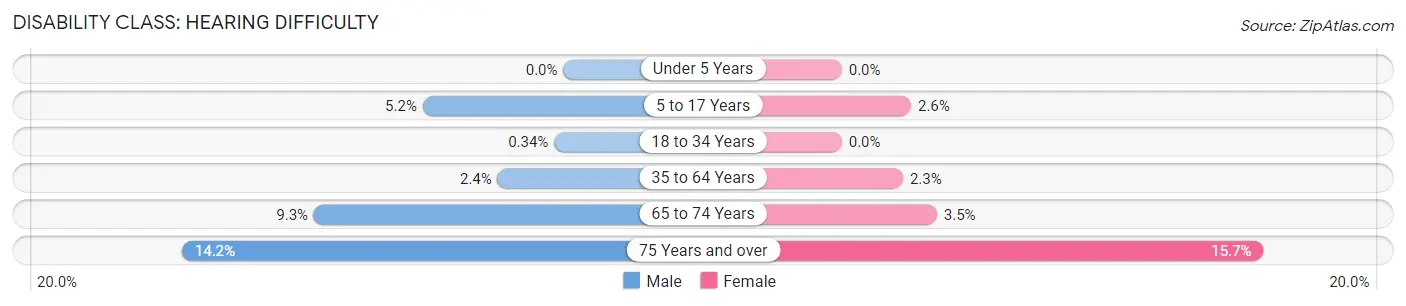
| Age Bracket | Male | Female |
| Under 5 Years | 0 (0.0%) | 0 (0.0%) |
| 5 to 17 Years | 81 (5.2%) | 42 (2.6%) |
| 18 to 34 Years | 5 (0.3%) | 0 (0.0%) |
| 35 to 64 Years | 76 (2.4%) | 74 (2.3%) |
| 65 to 74 Years | 71 (9.3%) | 36 (3.5%) |
| 75 Years and over | 63 (14.2%) | 100 (15.7%) |
Disability Class: Vision Difficulty
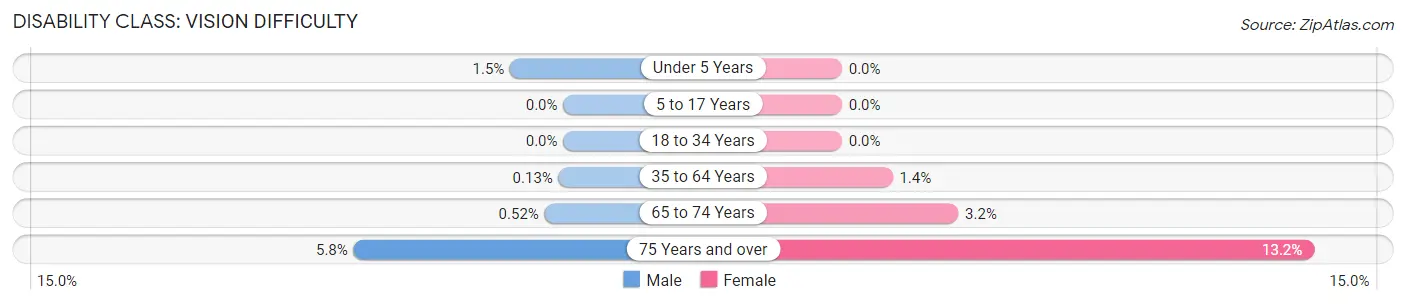
| Age Bracket | Male | Female |
| Under 5 Years | 8 (1.5%) | 0 (0.0%) |
| 5 to 17 Years | 0 (0.0%) | 0 (0.0%) |
| 18 to 34 Years | 0 (0.0%) | 0 (0.0%) |
| 35 to 64 Years | 4 (0.1%) | 46 (1.4%) |
| 65 to 74 Years | 4 (0.5%) | 33 (3.2%) |
| 75 Years and over | 26 (5.8%) | 84 (13.2%) |
Disability Class: Cognitive Difficulty
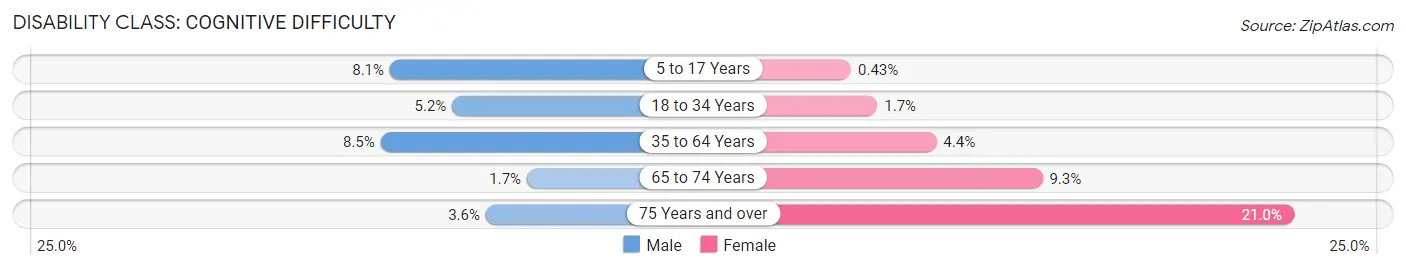
| Age Bracket | Male | Female |
| 5 to 17 Years | 125 (8.1%) | 7 (0.4%) |
| 18 to 34 Years | 76 (5.2%) | 31 (1.7%) |
| 35 to 64 Years | 264 (8.5%) | 143 (4.4%) |
| 65 to 74 Years | 13 (1.7%) | 95 (9.3%) |
| 75 Years and over | 16 (3.6%) | 134 (21.0%) |
Disability Class: Ambulatory Difficulty
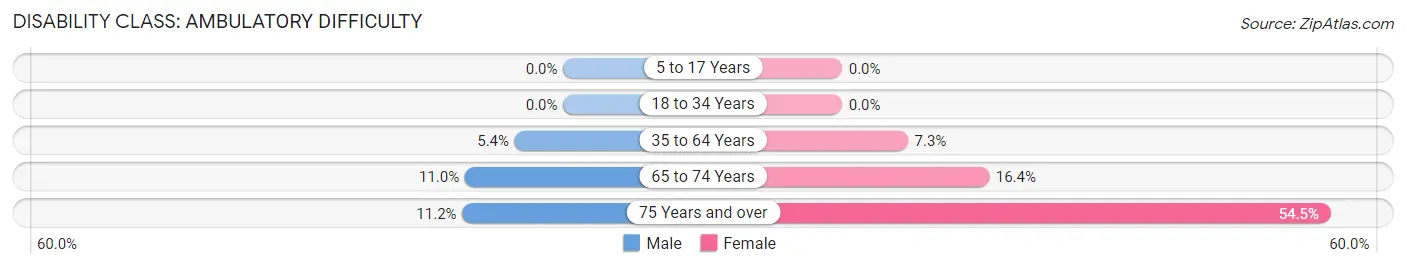
| Age Bracket | Male | Female |
| 5 to 17 Years | 0 (0.0%) | 0 (0.0%) |
| 18 to 34 Years | 0 (0.0%) | 0 (0.0%) |
| 35 to 64 Years | 168 (5.4%) | 239 (7.3%) |
| 65 to 74 Years | 84 (11.0%) | 167 (16.4%) |
| 75 Years and over | 50 (11.2%) | 348 (54.5%) |
Disability Class: Self-Care Difficulty
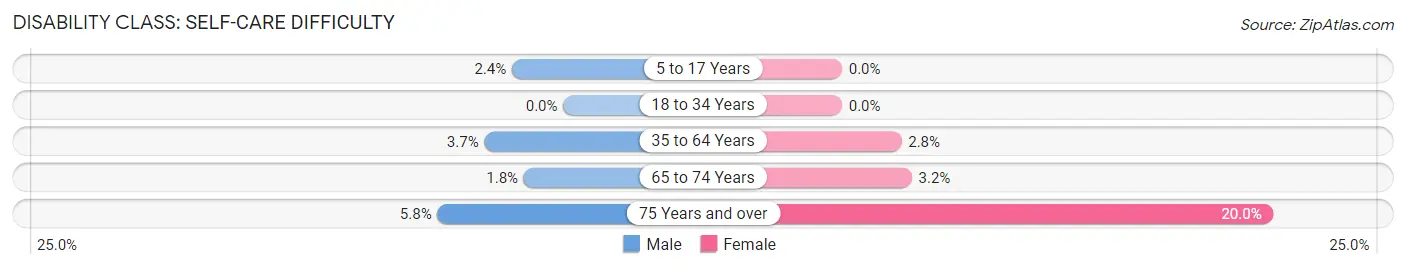
| Age Bracket | Male | Female |
| 5 to 17 Years | 37 (2.4%) | 0 (0.0%) |
| 18 to 34 Years | 0 (0.0%) | 0 (0.0%) |
| 35 to 64 Years | 114 (3.7%) | 90 (2.8%) |
| 65 to 74 Years | 14 (1.8%) | 33 (3.2%) |
| 75 Years and over | 26 (5.8%) | 128 (20.0%) |
Technology Access in Ben Hill County
Computing Device Access in Ben Hill County
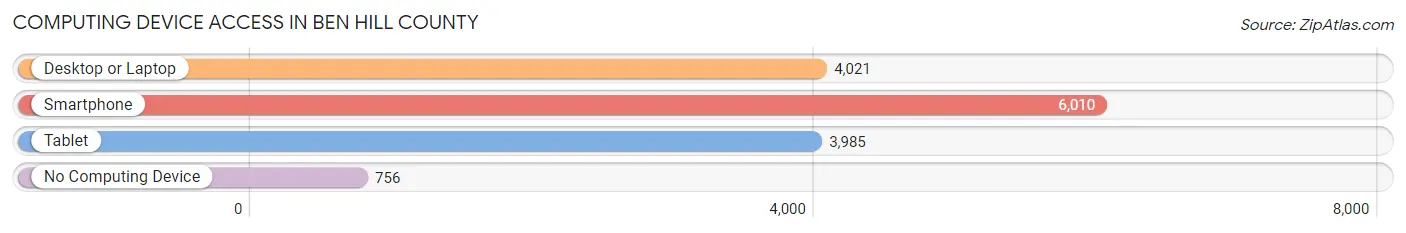
| Device Type | # Households | % Households |
| Desktop or Laptop | 4,021 | 56.4% |
| Smartphone | 6,010 | 84.3% |
| Tablet | 3,985 | 55.9% |
| No Computing Device | 756 | 10.6% |
| Total | 7,126 | 100.0% |
Internet Access in Ben Hill County
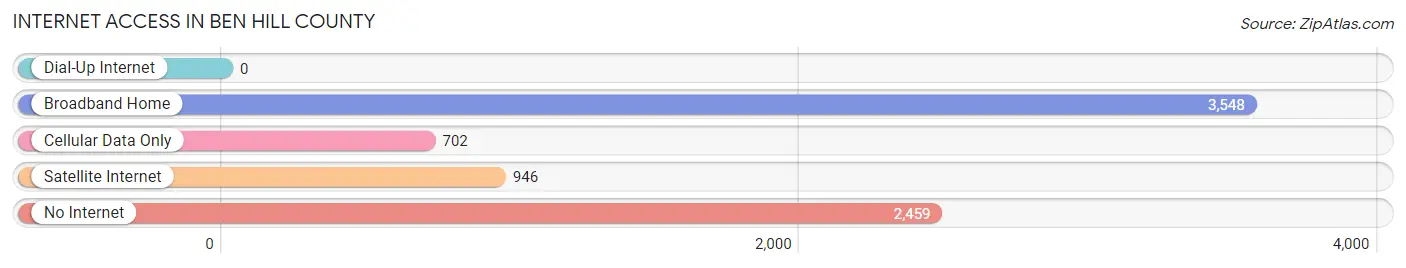
| Internet Type | # Households | % Households |
| Dial-Up Internet | 0 | 0.0% |
| Broadband Home | 3,548 | 49.8% |
| Cellular Data Only | 702 | 9.9% |
| Satellite Internet | 946 | 13.3% |
| No Internet | 2,459 | 34.5% |
| Total | 7,126 | 100.0% |
Ben Hill County Summary
Hill County, Georgia is located in the southwestern part of the state, and is bordered by Worth, Turner, Irwin, Ben Hill, and Wilcox counties. The county seat is Fitzgerald, and the county was named after Benjamin Harvey Hill, a former United States Senator from Georgia. The county has a total area of 441 square miles, and a population of 17,817 as of the 2010 census.
Geography
Hill County is located in the Coastal Plain region of Georgia, and is characterized by rolling hills and flat plains. The county is drained by the Ocmulgee River, which forms the western boundary of the county. The county is also home to several small lakes, including Lake Blackshear, Lake Chehaw, and Lake Wainwright. The county is mostly rural, with the majority of the population living in the small towns of Fitzgerald, Ocilla, and Rebecca.
History
Hill County was created in 1906 from parts of Irwin, Wilcox, and Worth counties. The county was named after Benjamin Harvey Hill, a former United States Senator from Georgia. The county seat of Fitzgerald was established in 1907, and the county was officially organized in 1908.
The county was largely agricultural in the early 20th century, with cotton and peanuts being the main crops. The county also had a thriving timber industry, and the town of Ocilla was known as the “Lumber Capital of the South”.
In the late 20th century, the county began to diversify its economy, with the establishment of several manufacturing plants. The county is also home to the Georgia Department of Corrections’ Ocilla State Prison, which opened in 1992.
Economy
Hill County’s economy is largely based on agriculture, with cotton, peanuts, and timber being the main crops. The county is also home to several manufacturing plants, including a paper mill, a furniture factory, and a plastics plant. The county is also home to the Georgia Department of Corrections’ Ocilla State Prison, which employs over 500 people.
Demographics
As of the 2010 census, Hill County had a population of 17,817. The racial makeup of the county was 57.3% White, 38.2% African American, 0.3% Native American, 0.7% Asian, 0.1% Pacific Islander, 2.2% from other races, and 1.4% from two or more races. Hispanic or Latino of any race were 4.2% of the population.
The median income for a household in the county was $30,945, and the median income for a family was $37,945. The per capita income for the county was $15,945. About 20.2% of the population was below the poverty line.
Conclusion
Hill County, Georgia is a rural county located in the southwestern part of the state. The county is largely agricultural, with cotton, peanuts, and timber being the main crops. The county is also home to several manufacturing plants, and the Georgia Department of Corrections’ Ocilla State Prison. The population of the county is 17,817, and the median income for a household is $30,945.
Common Questions
What is Per Capita Income in Ben Hill County?
Per Capita income in Ben Hill County is $22,625.
What is the Median Family Income in Ben Hill County?
Median Family Income in Ben Hill County is $42,861.
What is the Median Household income in Ben Hill County?
Median Household Income in Ben Hill County is $38,255.
What is Income or Wage Gap in Ben Hill County?
Income or Wage Gap in Ben Hill County is 19.4%.
Women in Ben Hill County earn 80.6 cents for every dollar earned by a man.
What is Family Income Deficit in Ben Hill County?
Family Income Deficit in Ben Hill County is $12,051.
Families that are below poverty line in Ben Hill County earn $12,051 less on average than the poverty threshold level.
What is Inequality or Gini Index in Ben Hill County?
Inequality or Gini Index in Ben Hill County is 0.50.
What is the Total Population of Ben Hill County?
Total Population of Ben Hill County is 17,169.
What is the Total Male Population of Ben Hill County?
Total Male Population of Ben Hill County is 8,075.
What is the Total Female Population of Ben Hill County?
Total Female Population of Ben Hill County is 9,094.
What is the Ratio of Males per 100 Females in Ben Hill County?
There are 88.79 Males per 100 Females in Ben Hill County.
What is the Ratio of Females per 100 Males in Ben Hill County?
There are 112.62 Females per 100 Males in Ben Hill County.
What is the Median Population Age in Ben Hill County?
Median Population Age in Ben Hill County is 38.7 Years.
What is the Average Family Size in Ben Hill County
Average Family Size in Ben Hill County is 3.0 People.
What is the Average Household Size in Ben Hill County
Average Household Size in Ben Hill County is 2.4 People.
How Large is the Labor Force in Ben Hill County?
There are 7,501 People in the Labor Forcein in Ben Hill County.
What is the Percentage of People in the Labor Force in Ben Hill County?
55.4% of People are in the Labor Force in Ben Hill County.
What is the Unemployment Rate in Ben Hill County?
Unemployment Rate in Ben Hill County is 5.0%.