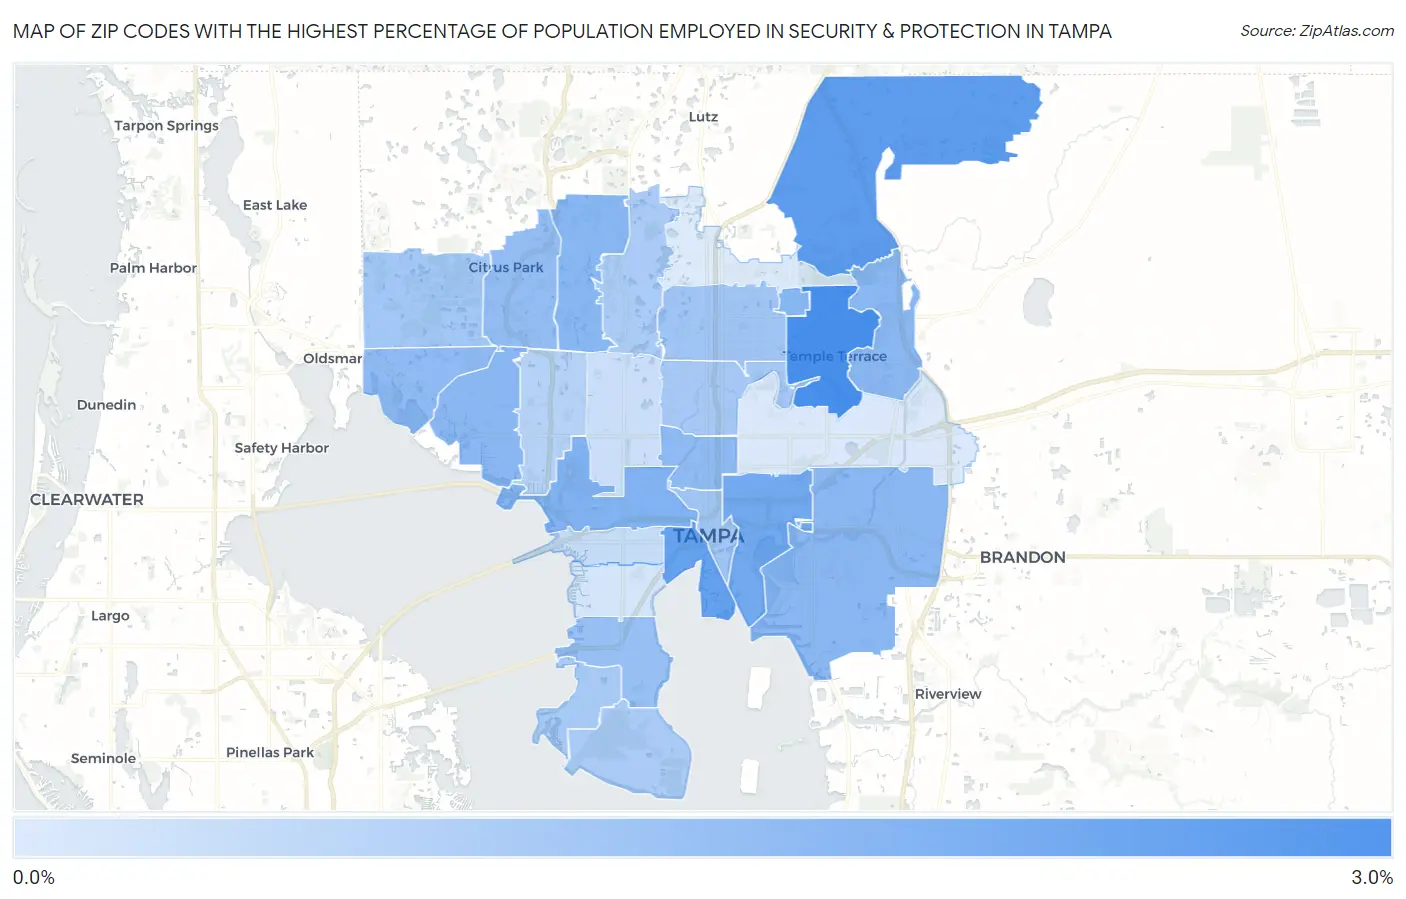
Zip Codes with the Highest Percentage of Population Employed in Security & Protection in Tampa, FL
RELATED REPORTS & OPTIONS
Security & Protection
Tampa
Compare Zip Codes
Map of Zip Codes with the Highest Percentage of Population Employed in Security & Protection in Tampa
0.61%
2.7%
Zip Codes with the Highest Percentage of Population Employed in Security & Protection in Tampa, FL
| Zip Code | % Employed | vs State | vs National | |
| 1. | 33617 | 2.7% | 2.4%(+0.310)#323 | 2.1%(+0.581)#8,402 |
| 2. | 33647 | 2.4% | 2.4%(-0.025)#405 | 2.1%(+0.247)#10,078 |
| 3. | 33606 | 2.3% | 2.4%(-0.102)#429 | 2.1%(+0.169)#10,530 |
| 4. | 33605 | 2.1% | 2.4%(-0.323)#498 | 2.1%(-0.051)#11,927 |
| 5. | 33607 | 1.9% | 2.4%(-0.502)#542 | 2.1%(-0.231)#13,099 |
| 6. | 33620 | 1.8% | 2.4%(-0.614)#578 | 2.1%(-0.342)#13,892 |
| 7. | 33624 | 1.8% | 2.4%(-0.621)#583 | 2.1%(-0.350)#13,964 |
| 8. | 33619 | 1.8% | 2.4%(-0.630)#587 | 2.1%(-0.358)#14,027 |
| 9. | 33637 | 1.8% | 2.4%(-0.635)#590 | 2.1%(-0.363)#14,065 |
| 10. | 33615 | 1.8% | 2.4%(-0.635)#591 | 2.1%(-0.364)#14,069 |
| 11. | 33635 | 1.7% | 2.4%(-0.717)#618 | 2.1%(-0.445)#14,663 |
| 12. | 33603 | 1.7% | 2.4%(-0.717)#619 | 2.1%(-0.446)#14,664 |
| 13. | 33625 | 1.6% | 2.4%(-0.786)#637 | 2.1%(-0.515)#15,160 |
| 14. | 33611 | 1.6% | 2.4%(-0.852)#656 | 2.1%(-0.580)#15,664 |
| 15. | 33612 | 1.5% | 2.4%(-0.966)#690 | 2.1%(-0.695)#16,546 |
| 16. | 33602 | 1.4% | 2.4%(-0.973)#691 | 2.1%(-0.701)#16,604 |
| 17. | 33626 | 1.4% | 2.4%(-1.00)#700 | 2.1%(-0.730)#16,818 |
| 18. | 33604 | 1.4% | 2.4%(-1.03)#707 | 2.1%(-0.761)#17,048 |
| 19. | 33616 | 1.4% | 2.4%(-1.05)#716 | 2.1%(-0.783)#17,214 |
| 20. | 33618 | 1.3% | 2.4%(-1.08)#726 | 2.1%(-0.812)#17,444 |
| 21. | 33621 | 1.3% | 2.4%(-1.10)#729 | 2.1%(-0.824)#17,542 |
| 22. | 33634 | 1.1% | 2.4%(-1.27)#785 | 2.1%(-1.00)#18,920 |
| 23. | 33609 | 0.93% | 2.4%(-1.49)#819 | 2.1%(-1.22)#20,575 |
| 24. | 33614 | 0.86% | 2.4%(-1.56)#829 | 2.1%(-1.29)#21,050 |
| 25. | 33629 | 0.75% | 2.4%(-1.67)#846 | 2.1%(-1.40)#21,747 |
| 26. | 33610 | 0.63% | 2.4%(-1.79)#863 | 2.1%(-1.52)#22,499 |
| 27. | 33613 | 0.61% | 2.4%(-1.81)#866 | 2.1%(-1.54)#22,620 |
1
Common Questions
What are the Top 10 Zip Codes with the Highest Percentage of Population Employed in Security & Protection in Tampa, FL?
Top 10 Zip Codes with the Highest Percentage of Population Employed in Security & Protection in Tampa, FL are:
What zip code has the Highest Percentage of Population Employed in Security & Protection in Tampa, FL?
33617 has the Highest Percentage of Population Employed in Security & Protection in Tampa, FL with 2.7%.
What is the Percentage of Population Employed in Security & Protection in Tampa, FL?
Percentage of Population Employed in Security & Protection in Tampa is 1.6%.
What is the Percentage of Population Employed in Security & Protection in Florida?
Percentage of Population Employed in Security & Protection in Florida is 2.4%.
What is the Percentage of Population Employed in Security & Protection in the United States?
Percentage of Population Employed in Security & Protection in the United States is 2.1%.