Zip Codes with the Highest Percentage of Population Employed in Security & Protection in Miami, FL

RELATED REPORTS & OPTIONS

Security & Protection
Population
Families and Households
Female Fertility
Female Fertility (Unmarried)
Race (Community Size)
Race (Percentage)
Ancestry (Community Size)
AfghanAfricanAlbanianAmericanApacheArabArgentineanArmenianAustralianAustrianBahamianBarbadianBasqueBelgianBelizeanBermudanBhutaneseBlackfeetBolivianBrazilianBritishBritish West IndianBulgarianBurmeseCanadianCelticCentral AmericanCentral American IndianCherokeeChickasawChileanChippewaChoctawColombianComancheCosta RicanCreekCroatianCubanCypriotCzechCzechoslovakianDanishDominicanDutchDutch West IndianEastern EuropeanEcuadorianEgyptianEnglishEstonianEthiopianEuropeanFilipinoFinnishFrenchFrench American IndianFrench CanadianGermanGreekGuamanian / ChamorroGuatemalanGuyaneseHaitianHonduranHungarianIcelanderIndian (Asian)IndonesianInupiatIranianIraqiIrishIroquoisIsraeliItalianJamaicanJapaneseJordanianKenyanKoreanLaotianLatvianLebaneseLithuanianMacedonianMalaysianMalteseMexicanMexican American IndianMongolianMoroccanNative HawaiianNavajoNew ZealanderNicaraguanNigerianNorthern EuropeanNorwegianPakistaniPalestinianPanamanianParaguayanPennsylvania GermanPeruvianPolishPortuguesePuerto RicanRomanianRussianSalvadoranSamoanScandinavianScotch-IrishScottishSeminoleSenegaleseSerbianSiouxSlavicSlovakSloveneSouth AfricanSouth AmericanSouth American IndianSpaniardSpanishSpanish AmericanSpanish American IndianSri LankanSubsaharan AfricanSudaneseSwedishSwissSyrianThaiTrinidadian and TobagonianTurkishU.S. Virgin IslanderUkrainianUruguayanVenezuelanVietnameseWelshWest IndianYugoslavianZimbabwean
Ancestry (Percentage)
AfghanAfricanAlbanianAmericanApacheArabArgentineanArmenianAustralianAustrianBahamianBarbadianBasqueBelgianBelizeanBermudanBhutaneseBlackfeetBolivianBrazilianBritishBritish West IndianBulgarianBurmeseCanadianCelticCentral AmericanCentral American IndianCherokeeChickasawChileanChippewaChoctawColombianComancheCosta RicanCreekCroatianCubanCypriotCzechCzechoslovakianDanishDominicanDutchDutch West IndianEastern EuropeanEcuadorianEgyptianEnglishEstonianEthiopianEuropeanFilipinoFinnishFrenchFrench American IndianFrench CanadianGermanGreekGuamanian / ChamorroGuatemalanGuyaneseHaitianHonduranHungarianIcelanderIndian (Asian)IndonesianInupiatIranianIraqiIrishIroquoisIsraeliItalianJamaicanJapaneseJordanianKenyanKoreanLaotianLatvianLebaneseLithuanianMacedonianMalaysianMalteseMexicanMexican American IndianMongolianMoroccanNative HawaiianNavajoNew ZealanderNicaraguanNigerianNorthern EuropeanNorwegianPakistaniPalestinianPanamanianParaguayanPennsylvania GermanPeruvianPolishPortuguesePuerto RicanRomanianRussianSalvadoranSamoanScandinavianScotch-IrishScottishSeminoleSenegaleseSerbianSiouxSlavicSlovakSloveneSouth AfricanSouth AmericanSouth American IndianSpaniardSpanishSpanish AmericanSpanish American IndianSri LankanSubsaharan AfricanSudaneseSwedishSwissSyrianThaiTrinidadian and TobagonianTurkishU.S. Virgin IslanderUkrainianUruguayanVenezuelanVietnameseWelshWest IndianYugoslavianZimbabwean
Immigrant Origin (Total)
AfghanistanAfricaAlbaniaArgentinaArmeniaAsiaAustraliaAustriaBahamasBangladeshBarbadosBelarusBelgiumBelizeBoliviaBosnia and HerzegovinaBrazilBulgariaBurma / MyanmarCambodiaCameroonCanadaCaribbeanCentral AmericaChileChinaColombiaCosta RicaCroatiaCubaCzechoslovakiaDenmarkDominicaDominican RepublicEastern AfricaEastern AsiaEastern EuropeEcuadorEgyptEl SalvadorEnglandEthiopiaEuropeFranceGermanyGreeceGrenadaGuatemalaGuyanaHaitiHondurasHong KongHungaryIndiaIndonesiaIranIraqIrelandIsraelItalyJamaicaJapanJordanKazakhstanKenyaKoreaKuwaitLaosLatin AmericaLatviaLebanonLithuaniaMalaysiaMexicoMiddle AfricaMoldovaMoroccoNepalNetherlandsNicaraguaNigeriaNorthern AfricaNorthern EuropeNorwayOceaniaPakistanPanamaPeruPhilippinesPolandPortugalRomaniaRussiaSaudi ArabiaScotlandSerbiaSingaporeSouth AfricaSouth AmericaSouth Central AsiaSouth Eastern AsiaSouthern EuropeSpainSri LankaSt. Vincent and the GrenadinesSudanSwedenSwitzerlandSyriaTaiwanThailandTrinidad and TobagoTurkeyUgandaUkraineUruguayUzbekistanVenezuelaVietnamWest IndiesWestern AfricaWestern AsiaWestern EuropeZaireZimbabwe
Immigrant Origin (Percentage)
AfghanistanAfricaAlbaniaArgentinaArmeniaAsiaAustraliaAustriaBahamasBangladeshBarbadosBelarusBelgiumBelizeBoliviaBosnia and HerzegovinaBrazilBulgariaBurma / MyanmarCambodiaCameroonCanadaCaribbeanCentral AmericaChileChinaColombiaCosta RicaCroatiaCubaCzechoslovakiaDenmarkDominicaDominican RepublicEastern AfricaEastern AsiaEastern EuropeEcuadorEgyptEl SalvadorEnglandEthiopiaEuropeFranceGermanyGreeceGrenadaGuatemalaGuyanaHaitiHondurasHong KongHungaryIndiaIndonesiaIranIraqIrelandIsraelItalyJamaicaJapanJordanKazakhstanKenyaKoreaKuwaitLaosLatin AmericaLatviaLebanonLithuaniaMalaysiaMexicoMiddle AfricaMoldovaMoroccoNepalNetherlandsNicaraguaNigeriaNorthern AfricaNorthern EuropeNorwayOceaniaPakistanPanamaPeruPhilippinesPolandPortugalRomaniaRussiaSaudi ArabiaScotlandSerbiaSingaporeSouth AfricaSouth AmericaSouth Central AsiaSouth Eastern AsiaSouthern EuropeSpainSri LankaSt. Vincent and the GrenadinesSudanSwedenSwitzerlandSyriaTaiwanThailandTrinidad and TobagoTurkeyUgandaUkraineUruguayUzbekistanVenezuelaVietnamWest IndiesWestern AfricaWestern AsiaWestern EuropeZaireZimbabwe
Income
Income (Families)
Income (Households)
Poverty
Poverty (Families)
Unemployment
Employment Occupations
Employment Industries
Employer Class
Commute Time
Commute Means
School Enrollment
Education by Degree Field
Occupancy
Finances
Physical Characteristics
Miami
States
Florida Cities
Altamonte SpringsApopkaArcadiaBoca RatonBonita SpringsBoynton BeachBradentonBrandonBrooksvilleCape CoralCasselberryClearwaterClermontCocoaCoral SpringsCrestviewCrystal RiverDade CityDavenportDaytona BeachDeerfield BeachDefuniak SpringsDelandDelray BeachDeltonaDunnellonEdgewaterEnglewoodEustisFort LauderdaleFort MyersFort PierceFort Walton BeachGainesvilleGulf BreezeHialeahHolidayHollywoodHomesteadHomosassaHudsonInvernessJacksonvilleJupiterKissimmeeLake CityLake WalesLake WorthLakelandLand O LakesLargoLeesburgLehigh AcresLive OakLongwoodLutzMariannaMelbourneMerritt IslandMiamiMiami BeachMiltonNaplesNew Port RicheyNew Smyrna BeachNorth Fort MyersNorth PortOcalaOkeechobeeOpa LockaOrange ParkOrlandoOrmond BeachOviedoPalm BayPalm Beach GardensPalm CoastPalm HarborPanama CityPanama City BeachPensacolaPerryPinellas ParkPlant CityPompano BeachPort CharlottePort OrangePort Saint LuciePunta GordaQuincyRiverviewSaint AugustineSaint CloudSaint PetersburgSanfordSarasotaSebastianSebringSeminoleSpring HillStuartTallahasseeTampaTarpon SpringsThe VillagesTitusvilleValricoVeniceVero BeachWesley ChapelWest Palm BeachWewahitchkaWinter HavenWinter ParkZephyrhills
Compare Zip Codes
Comparison Subject

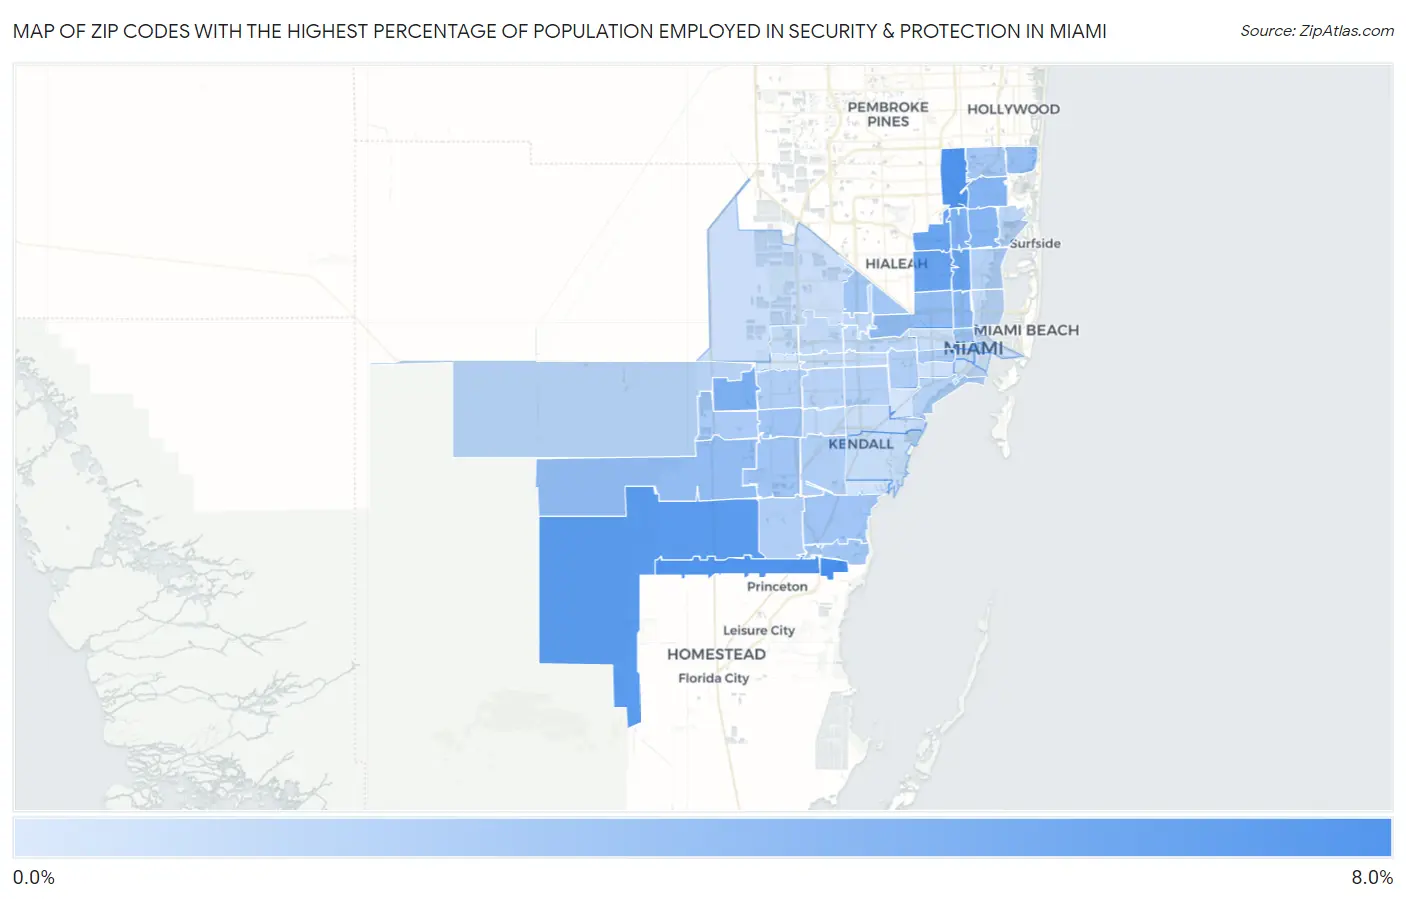
Map of Zip Codes with the Highest Percentage of Population Employed in Security & Protection in Miami

0.0%
8.0%
Zip Codes with the Highest Percentage of Population Employed in Security & Protection in Miami Map

Zip Codes with the Highest Percentage of Population Employed in Security & Protection in Miami, FL

Zip Code % Employed vs State vs National
1.331907.0%2.4%(+4.53)#422.1%(+4.80)#1,556
2.331696.7%2.4%(+4.25)#472.1%(+4.52)#1,696
3.331706.5%2.4%(+4.08)#492.1%(+4.35)#1,784
4.331876.1%2.4%(+3.67)#612.1%(+3.94)#2,020
5.331475.4%2.4%(+3.02)#852.1%(+3.29)#2,504
6.331675.4%2.4%(+2.93)#872.1%(+3.20)#2,580
7.331505.3%2.4%(+2.90)#892.1%(+3.17)#2,618
8.331854.5%2.4%(+2.12)#1192.1%(+2.39)#3,545
9.331684.4%2.4%(+1.98)#1322.1%(+2.25)#3,780
10.331624.1%2.4%(+1.68)#1462.1%(+1.96)#4,289
11.331614.1%2.4%(+1.67)#1512.1%(+1.94)#4,322
12.331273.9%2.4%(+1.43)#1742.1%(+1.70)#4,799
13.331423.5%2.4%(+1.12)#1992.1%(+1.40)#5,554
14.331963.5%2.4%(+1.10)#2012.1%(+1.38)#5,616
15.331803.3%2.4%(+0.854)#2262.1%(+1.13)#6,331
16.331363.2%2.4%(+0.809)#2322.1%(+1.08)#6,462
17.331862.9%2.4%(+0.499)#2802.1%(+0.771)#7,558
18.331832.9%2.4%(+0.439)#2912.1%(+0.711)#7,822
19.331572.8%2.4%(+0.416)#2992.1%(+0.688)#7,930
20.331662.8%2.4%(+0.345)#3142.1%(+0.617)#8,258
21.331892.7%2.4%(+0.322)#3202.1%(+0.593)#8,342
22.331792.6%2.4%(+0.220)#3462.1%(+0.491)#8,825
23.331352.5%2.4%(+0.062)#3812.1%(+0.333)#9,610
24.331932.5%2.4%(+0.035)#3922.1%(+0.306)#9,759
25.331752.2%2.4%(-0.170)#4432.1%(+0.101)#10,947
26.331772.2%2.4%(-0.241)#4692.1%(+0.030)#11,377
27.331762.2%2.4%(-0.250)#4742.1%(+0.022)#11,448
28.331342.1%2.4%(-0.289)#4892.1%(-0.018)#11,695
29.331552.1%2.4%(-0.322)#4962.1%(-0.050)#11,921
30.331382.0%2.4%(-0.434)#5212.1%(-0.162)#12,647
31.331332.0%2.4%(-0.455)#5302.1%(-0.184)#12,789
32.331941.9%2.4%(-0.507)#5432.1%(-0.236)#13,133
33.331651.8%2.4%(-0.577)#5662.1%(-0.305)#13,617
34.331811.7%2.4%(-0.742)#6252.1%(-0.470)#14,839
35.331221.6%2.4%(-0.805)#6422.1%(-0.534)#15,297
36.331731.6%2.4%(-0.869)#6602.1%(-0.598)#15,792
37.331261.5%2.4%(-0.884)#6672.1%(-0.613)#15,905
38.331441.5%2.4%(-0.918)#6782.1%(-0.647)#16,184
39.331721.5%2.4%(-0.945)#6842.1%(-0.674)#16,388
40.331371.4%2.4%(-0.974)#6932.1%(-0.703)#16,618
41.331741.4%2.4%(-1.01)#7022.1%(-0.743)#16,907
42.331821.3%2.4%(-1.08)#7252.1%(-0.808)#17,418
43.331301.3%2.4%(-1.11)#7342.1%(-0.838)#17,647
44.331561.3%2.4%(-1.17)#7532.1%(-0.894)#18,103
45.331431.2%2.4%(-1.23)#7672.1%(-0.955)#18,554
46.331251.1%2.4%(-1.29)#7882.1%(-1.02)#19,067
47.331291.1%2.4%(-1.34)#7962.1%(-1.07)#19,449
48.331781.0%2.4%(-1.38)#8012.1%(-1.10)#19,710
49.331451.0%2.4%(-1.42)#8092.1%(-1.15)#20,021
50.331320.74%2.4%(-1.68)#8482.1%(-1.40)#21,772
51.331580.73%2.4%(-1.69)#8492.1%(-1.42)#21,855
52.331840.70%2.4%(-1.72)#8552.1%(-1.45)#22,059
53.331460.65%2.4%(-1.77)#8602.1%(-1.50)#22,394
54.331280.36%2.4%(-2.06)#8922.1%(-1.79)#23,914
55.331310.26%2.4%(-2.16)#8992.1%(-1.89)#24,319

Common Questions

What are the Top 10 Zip Codes with the Highest Percentage of Population Employed in Security & Protection in Miami, FL?
Top 10 Zip Codes with the Highest Percentage of Population Employed in Security & Protection in Miami, FL are:
#1
7.0%
#2
6.7%
#3
6.5%
#4
6.1%
#5
5.4%
#6
5.4%
#7
5.3%
#8
4.5%
#9
4.4%
#10
4.1%
What zip code has the Highest Percentage of Population Employed in Security & Protection in Miami, FL?
33190 has the Highest Percentage of Population Employed in Security & Protection in Miami, FL with 7.0%.
What is the Percentage of Population Employed in Security & Protection in Miami, FL?
Percentage of Population Employed in Security & Protection in Miami is 1.8%.
What is the Percentage of Population Employed in Security & Protection in Florida?
Percentage of Population Employed in Security & Protection in Florida is 2.4%.
What is the Percentage of Population Employed in Security & Protection in the United States?
Percentage of Population Employed in Security & Protection in the United States is 2.1%.