Italian vs Immigrants from Nicaragua Married-couple Households
COMPARE
Italian
Immigrants from Nicaragua
Married-couple Households
Married-couple Households Comparison
Italians
Immigrants from Nicaragua
49.0%
MARRIED-COUPLE HOUSEHOLDS
99.7/ 100
METRIC RATING
34th/ 347
METRIC RANK
44.5%
MARRIED-COUPLE HOUSEHOLDS
1.2/ 100
METRIC RATING
235th/ 347
METRIC RANK
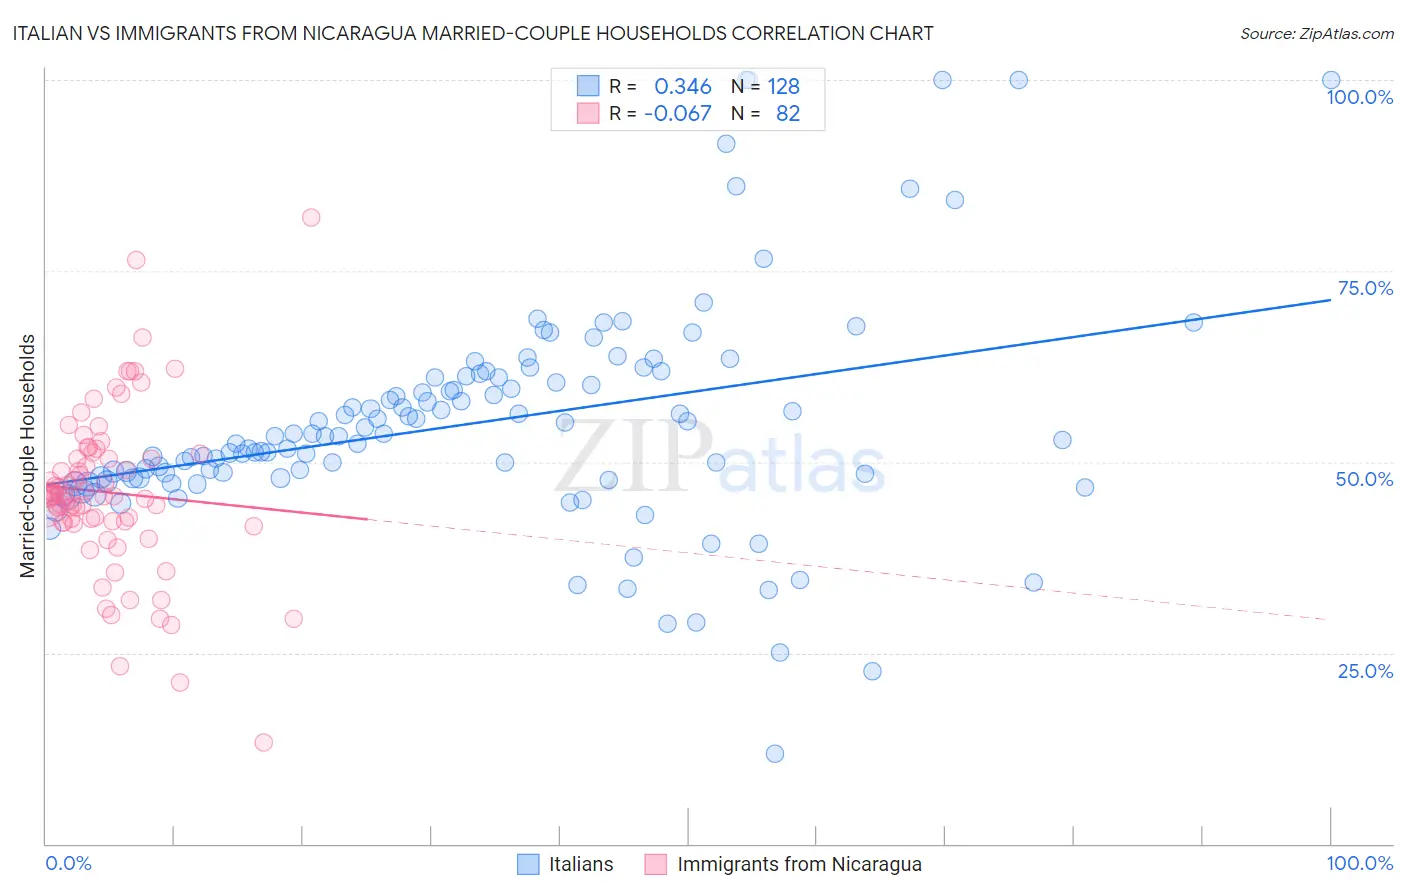
Italian vs Immigrants from Nicaragua Married-couple Households Correlation Chart
The statistical analysis conducted on geographies consisting of 574,410,066 people shows a mild positive correlation between the proportion of Italians and percentage of married-couple family households in the United States with a correlation coefficient (R) of 0.346 and weighted average of 49.0%. Similarly, the statistical analysis conducted on geographies consisting of 236,322,720 people shows a slight negative correlation between the proportion of Immigrants from Nicaragua and percentage of married-couple family households in the United States with a correlation coefficient (R) of -0.067 and weighted average of 44.5%, a difference of 10.1%.
Married-couple Households Correlation Summary
| Measurement | Italian | Immigrants from Nicaragua |
| Minimum | 11.8% | 13.2% |
| Maximum | 100.0% | 82.0% |
| Range | 88.2% | 68.8% |
| Mean | 55.1% | 46.0% |
| Median | 53.3% | 45.5% |
| Interquartile 25% (IQ1) | 47.9% | 42.1% |
| Interquartile 75% (IQ3) | 61.1% | 51.0% |
| Interquartile Range (IQR) | 13.2% | 9.0% |
| Standard Deviation (Sample) | 14.9% | 10.9% |
| Standard Deviation (Population) | 14.8% | 10.9% |
Similar Demographics by Married-couple Households
Demographics Similar to Italians by Married-couple Households
In terms of married-couple households, the demographic groups most similar to Italians are Scottish (49.0%, a difference of 0.020%), Immigrants from Asia (49.1%, a difference of 0.080%), Hungarian (49.1%, a difference of 0.11%), Iranian (49.0%, a difference of 0.11%), and Sri Lankan (49.0%, a difference of 0.11%).
| Demographics | Rating | Rank | Married-couple Households |
| Bhutanese | 99.8 /100 | #27 | Exceptional 49.3% |
| Germans | 99.8 /100 | #28 | Exceptional 49.2% |
| Maltese | 99.8 /100 | #29 | Exceptional 49.2% |
| Bolivians | 99.8 /100 | #30 | Exceptional 49.2% |
| Native Hawaiians | 99.8 /100 | #31 | Exceptional 49.1% |
| Hungarians | 99.8 /100 | #32 | Exceptional 49.1% |
| Immigrants | Asia | 99.7 /100 | #33 | Exceptional 49.1% |
| Italians | 99.7 /100 | #34 | Exceptional 49.0% |
| Scottish | 99.7 /100 | #35 | Exceptional 49.0% |
| Iranians | 99.7 /100 | #36 | Exceptional 49.0% |
| Sri Lankans | 99.7 /100 | #37 | Exceptional 49.0% |
| Greeks | 99.7 /100 | #38 | Exceptional 48.9% |
| Lithuanians | 99.6 /100 | #39 | Exceptional 48.9% |
| Immigrants | Bolivia | 99.6 /100 | #40 | Exceptional 48.9% |
| Immigrants | Lebanon | 99.6 /100 | #41 | Exceptional 48.9% |
Demographics Similar to Immigrants from Nicaragua by Married-couple Households
In terms of married-couple households, the demographic groups most similar to Immigrants from Nicaragua are Yaqui (44.5%, a difference of 0.0%), Comanche (44.5%, a difference of 0.040%), Immigrants from Panama (44.6%, a difference of 0.070%), Immigrants from Uruguay (44.5%, a difference of 0.090%), and Spanish American (44.5%, a difference of 0.10%).
| Demographics | Rating | Rank | Married-couple Households |
| Kenyans | 1.7 /100 | #228 | Tragic 44.7% |
| Immigrants | Latin America | 1.6 /100 | #229 | Tragic 44.7% |
| Soviet Union | 1.6 /100 | #230 | Tragic 44.6% |
| Houma | 1.5 /100 | #231 | Tragic 44.6% |
| Marshallese | 1.5 /100 | #232 | Tragic 44.6% |
| Immigrants | Uganda | 1.5 /100 | #233 | Tragic 44.6% |
| Immigrants | Panama | 1.3 /100 | #234 | Tragic 44.6% |
| Immigrants | Nicaragua | 1.2 /100 | #235 | Tragic 44.5% |
| Yaqui | 1.2 /100 | #236 | Tragic 44.5% |
| Comanche | 1.2 /100 | #237 | Tragic 44.5% |
| Immigrants | Uruguay | 1.1 /100 | #238 | Tragic 44.5% |
| Spanish Americans | 1.1 /100 | #239 | Tragic 44.5% |
| Ute | 1.0 /100 | #240 | Tragic 44.4% |
| Immigrants | Bosnia and Herzegovina | 1.0 /100 | #241 | Tragic 44.4% |
| Immigrants | Albania | 1.0 /100 | #242 | Tragic 44.4% |