Aleut vs Immigrants from Australia Married-couple Households
COMPARE
Aleut
Immigrants from Australia
Married-couple Households
Married-couple Households Comparison
Aleuts
Immigrants from Australia
45.6%
MARRIED-COUPLE HOUSEHOLDS
12.5/ 100
METRIC RATING
204th/ 347
METRIC RANK
46.5%
MARRIED-COUPLE HOUSEHOLDS
54.6/ 100
METRIC RATING
172nd/ 347
METRIC RANK
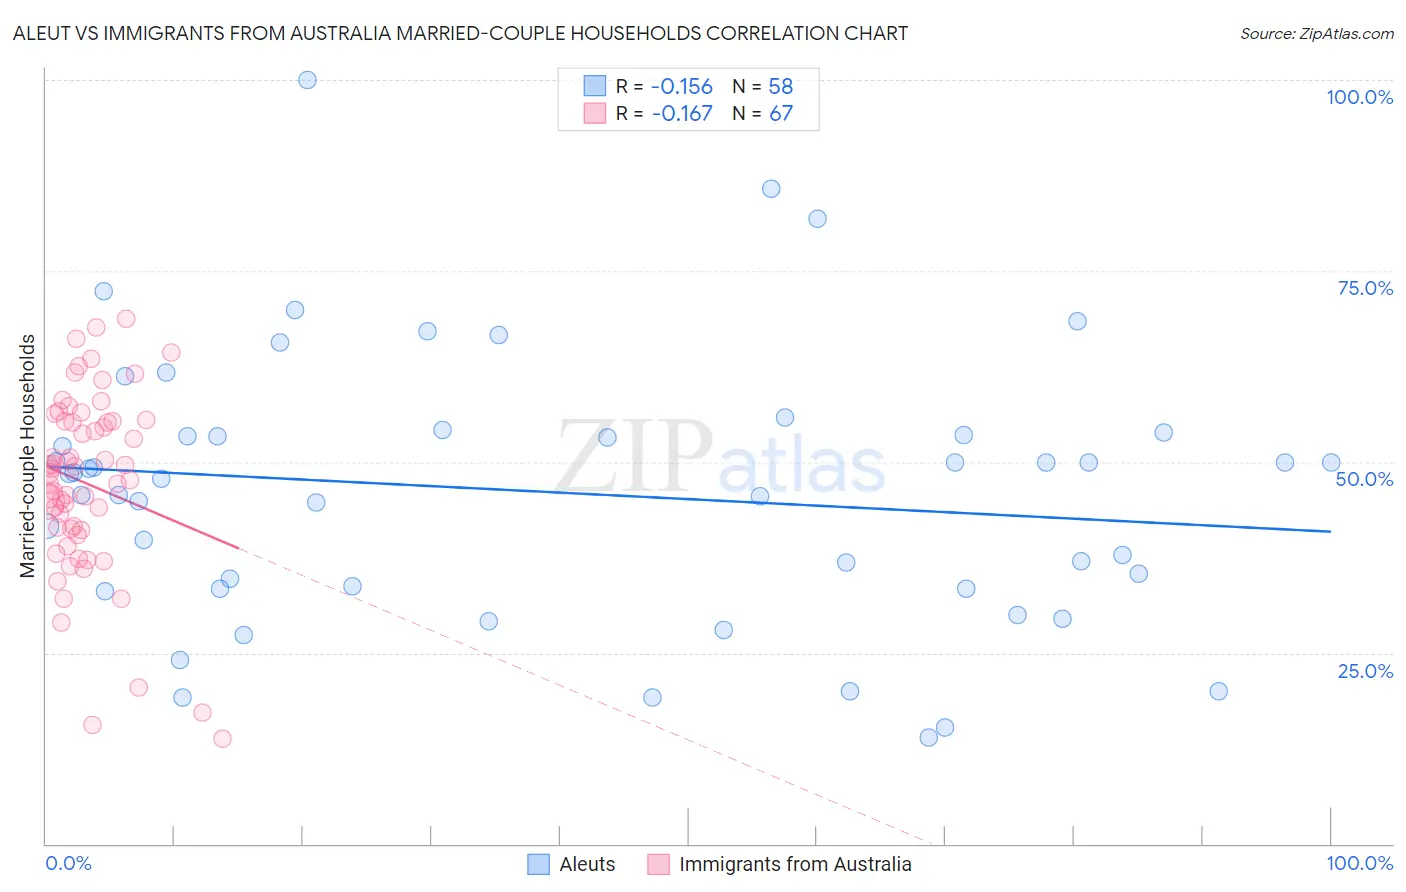
Aleut vs Immigrants from Australia Married-couple Households Correlation Chart
The statistical analysis conducted on geographies consisting of 61,773,976 people shows a poor negative correlation between the proportion of Aleuts and percentage of married-couple family households in the United States with a correlation coefficient (R) of -0.156 and weighted average of 45.6%. Similarly, the statistical analysis conducted on geographies consisting of 227,144,828 people shows a poor negative correlation between the proportion of Immigrants from Australia and percentage of married-couple family households in the United States with a correlation coefficient (R) of -0.167 and weighted average of 46.5%, a difference of 2.0%.
Married-couple Households Correlation Summary
| Measurement | Aleut | Immigrants from Australia |
| Minimum | 14.0% | 13.7% |
| Maximum | 100.0% | 68.8% |
| Range | 86.0% | 55.0% |
| Mean | 46.1% | 47.2% |
| Median | 48.2% | 48.5% |
| Interquartile 25% (IQ1) | 33.3% | 41.1% |
| Interquartile 75% (IQ3) | 53.6% | 55.3% |
| Interquartile Range (IQR) | 20.2% | 14.1% |
| Standard Deviation (Sample) | 17.7% | 12.0% |
| Standard Deviation (Population) | 17.5% | 11.9% |
Similar Demographics by Married-couple Households
Demographics Similar to Aleuts by Married-couple Households
In terms of married-couple households, the demographic groups most similar to Aleuts are Alaska Native (45.6%, a difference of 0.050%), Nepalese (45.6%, a difference of 0.050%), Immigrants from Central America (45.7%, a difference of 0.14%), Uruguayan (45.5%, a difference of 0.20%), and Immigrants from Serbia (45.7%, a difference of 0.22%).
| Demographics | Rating | Rank | Married-couple Households |
| Cambodians | 21.3 /100 | #197 | Fair 45.9% |
| Ottawa | 19.4 /100 | #198 | Poor 45.8% |
| Carpatho Rusyns | 15.7 /100 | #199 | Poor 45.7% |
| Potawatomi | 15.6 /100 | #200 | Poor 45.7% |
| Immigrants | Serbia | 15.2 /100 | #201 | Poor 45.7% |
| Immigrants | Central America | 14.2 /100 | #202 | Poor 45.7% |
| Alaska Natives | 13.0 /100 | #203 | Poor 45.6% |
| Aleuts | 12.5 /100 | #204 | Poor 45.6% |
| Nepalese | 11.9 /100 | #205 | Poor 45.6% |
| Uruguayans | 10.4 /100 | #206 | Poor 45.5% |
| Immigrants | France | 8.8 /100 | #207 | Tragic 45.4% |
| Hispanics or Latinos | 8.7 /100 | #208 | Tragic 45.4% |
| Immigrants | Uzbekistan | 8.4 /100 | #209 | Tragic 45.4% |
| Cubans | 7.7 /100 | #210 | Tragic 45.4% |
| Immigrants | Spain | 7.3 /100 | #211 | Tragic 45.3% |
Demographics Similar to Immigrants from Australia by Married-couple Households
In terms of married-couple households, the demographic groups most similar to Immigrants from Australia are Immigrants from Chile (46.5%, a difference of 0.040%), Immigrants from Norway (46.5%, a difference of 0.10%), South American (46.6%, a difference of 0.13%), Immigrants from Mexico (46.4%, a difference of 0.17%), and Spanish American Indian (46.6%, a difference of 0.18%).
| Demographics | Rating | Rank | Married-couple Households |
| Immigrants | Southern Europe | 69.9 /100 | #165 | Good 46.8% |
| Cherokee | 65.7 /100 | #166 | Good 46.7% |
| Immigrants | Croatia | 64.2 /100 | #167 | Good 46.7% |
| Israelis | 62.3 /100 | #168 | Good 46.7% |
| Spanish American Indians | 59.4 /100 | #169 | Average 46.6% |
| South Americans | 58.0 /100 | #170 | Average 46.6% |
| Immigrants | Chile | 55.7 /100 | #171 | Average 46.5% |
| Immigrants | Australia | 54.6 /100 | #172 | Average 46.5% |
| Immigrants | Norway | 52.0 /100 | #173 | Average 46.5% |
| Immigrants | Mexico | 50.0 /100 | #174 | Average 46.4% |
| Immigrants | Colombia | 46.1 /100 | #175 | Average 46.4% |
| Cajuns | 45.2 /100 | #176 | Average 46.4% |
| Immigrants | Immigrants | 43.8 /100 | #177 | Average 46.3% |
| Immigrants | Costa Rica | 43.4 /100 | #178 | Average 46.3% |
| Immigrants | Zimbabwe | 43.0 /100 | #179 | Average 46.3% |