Aleut vs Korean Married-couple Households
COMPARE
Aleut
Korean
Married-couple Households
Married-couple Households Comparison
Aleuts
Koreans
45.6%
MARRIED-COUPLE HOUSEHOLDS
12.5/ 100
METRIC RATING
204th/ 347
METRIC RANK
49.7%
MARRIED-COUPLE HOUSEHOLDS
99.9/ 100
METRIC RATING
15th/ 347
METRIC RANK
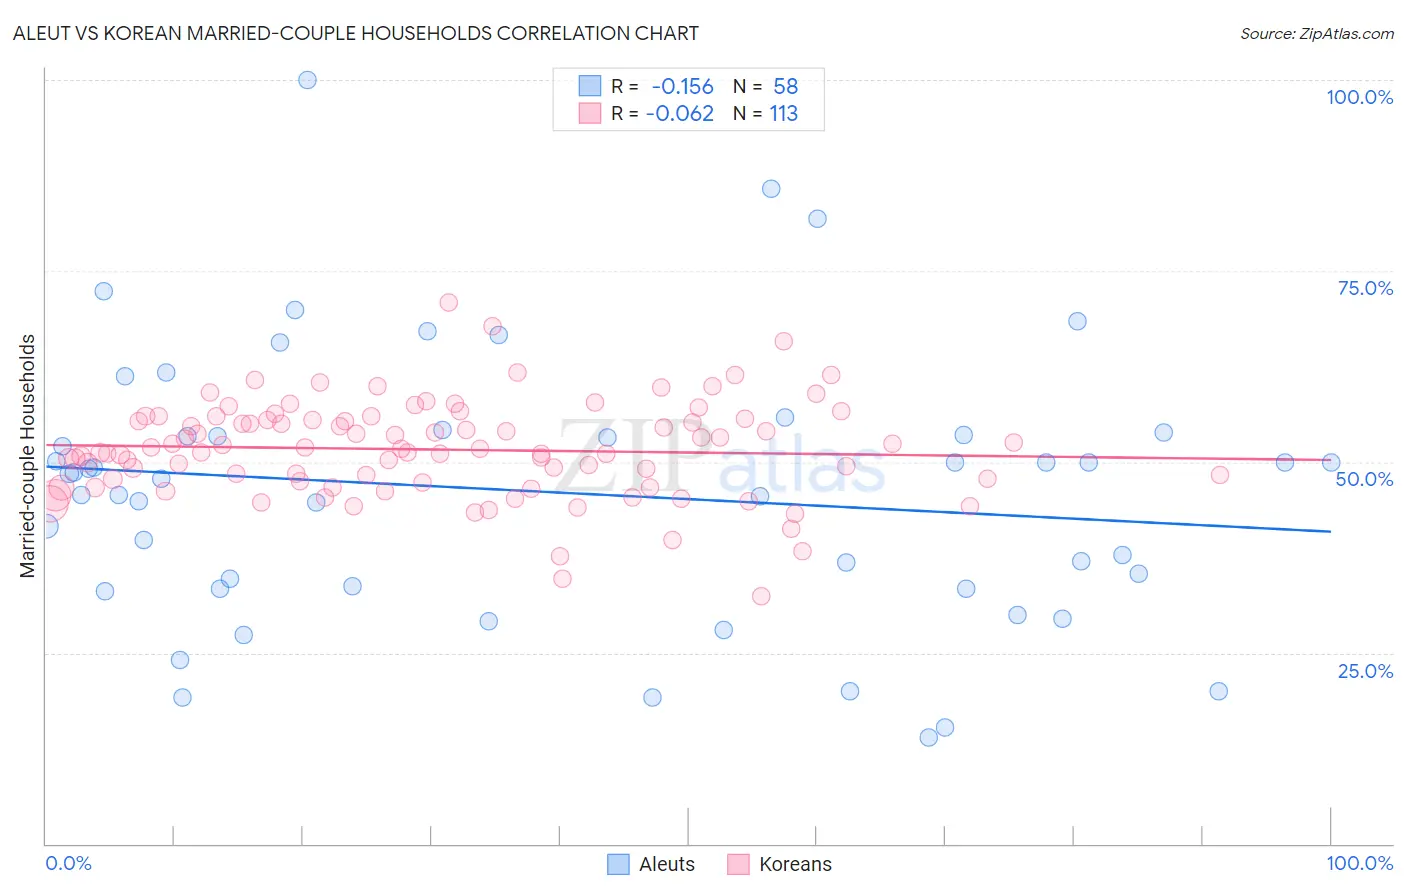
Aleut vs Korean Married-couple Households Correlation Chart
The statistical analysis conducted on geographies consisting of 61,773,976 people shows a poor negative correlation between the proportion of Aleuts and percentage of married-couple family households in the United States with a correlation coefficient (R) of -0.156 and weighted average of 45.6%. Similarly, the statistical analysis conducted on geographies consisting of 510,373,209 people shows a slight negative correlation between the proportion of Koreans and percentage of married-couple family households in the United States with a correlation coefficient (R) of -0.062 and weighted average of 49.7%, a difference of 9.1%.
Married-couple Households Correlation Summary
| Measurement | Aleut | Korean |
| Minimum | 14.0% | 32.4% |
| Maximum | 100.0% | 70.8% |
| Range | 86.0% | 38.4% |
| Mean | 46.1% | 51.6% |
| Median | 48.2% | 51.7% |
| Interquartile 25% (IQ1) | 33.3% | 47.4% |
| Interquartile 75% (IQ3) | 53.6% | 55.6% |
| Interquartile Range (IQR) | 20.2% | 8.2% |
| Standard Deviation (Sample) | 17.7% | 6.3% |
| Standard Deviation (Population) | 17.5% | 6.3% |
Similar Demographics by Married-couple Households
Demographics Similar to Aleuts by Married-couple Households
In terms of married-couple households, the demographic groups most similar to Aleuts are Alaska Native (45.6%, a difference of 0.050%), Nepalese (45.6%, a difference of 0.050%), Immigrants from Central America (45.7%, a difference of 0.14%), Uruguayan (45.5%, a difference of 0.20%), and Immigrants from Serbia (45.7%, a difference of 0.22%).
| Demographics | Rating | Rank | Married-couple Households |
| Cambodians | 21.3 /100 | #197 | Fair 45.9% |
| Ottawa | 19.4 /100 | #198 | Poor 45.8% |
| Carpatho Rusyns | 15.7 /100 | #199 | Poor 45.7% |
| Potawatomi | 15.6 /100 | #200 | Poor 45.7% |
| Immigrants | Serbia | 15.2 /100 | #201 | Poor 45.7% |
| Immigrants | Central America | 14.2 /100 | #202 | Poor 45.7% |
| Alaska Natives | 13.0 /100 | #203 | Poor 45.6% |
| Aleuts | 12.5 /100 | #204 | Poor 45.6% |
| Nepalese | 11.9 /100 | #205 | Poor 45.6% |
| Uruguayans | 10.4 /100 | #206 | Poor 45.5% |
| Immigrants | France | 8.8 /100 | #207 | Tragic 45.4% |
| Hispanics or Latinos | 8.7 /100 | #208 | Tragic 45.4% |
| Immigrants | Uzbekistan | 8.4 /100 | #209 | Tragic 45.4% |
| Cubans | 7.7 /100 | #210 | Tragic 45.4% |
| Immigrants | Spain | 7.3 /100 | #211 | Tragic 45.3% |
Demographics Similar to Koreans by Married-couple Households
In terms of married-couple households, the demographic groups most similar to Koreans are Swedish (49.7%, a difference of 0.030%), Burmese (49.8%, a difference of 0.14%), Immigrants from Hong Kong (49.6%, a difference of 0.18%), English (49.6%, a difference of 0.19%), and Immigrants from Korea (49.9%, a difference of 0.27%).
| Demographics | Rating | Rank | Married-couple Households |
| Immigrants | South Central Asia | 100.0 /100 | #8 | Exceptional 50.6% |
| Pennsylvania Germans | 100.0 /100 | #9 | Exceptional 50.4% |
| Chinese | 100.0 /100 | #10 | Exceptional 50.4% |
| Immigrants | Pakistan | 100.0 /100 | #11 | Exceptional 50.1% |
| Swiss | 100.0 /100 | #12 | Exceptional 49.9% |
| Immigrants | Korea | 100.0 /100 | #13 | Exceptional 49.9% |
| Burmese | 100.0 /100 | #14 | Exceptional 49.8% |
| Koreans | 99.9 /100 | #15 | Exceptional 49.7% |
| Swedes | 99.9 /100 | #16 | Exceptional 49.7% |
| Immigrants | Hong Kong | 99.9 /100 | #17 | Exceptional 49.6% |
| English | 99.9 /100 | #18 | Exceptional 49.6% |
| Europeans | 99.9 /100 | #19 | Exceptional 49.6% |
| Scandinavians | 99.9 /100 | #20 | Exceptional 49.6% |
| Norwegians | 99.9 /100 | #21 | Exceptional 49.5% |
| Asians | 99.9 /100 | #22 | Exceptional 49.5% |