Swiss vs Lebanese GED/Equivalency
COMPARE
Swiss
Lebanese
GED/Equivalency
GED/Equivalency Comparison
Swiss
Lebanese
87.0%
GED/EQUIVALENCY
94.5/ 100
METRIC RATING
116th/ 347
METRIC RANK
87.2%
GED/EQUIVALENCY
96.2/ 100
METRIC RATING
102nd/ 347
METRIC RANK
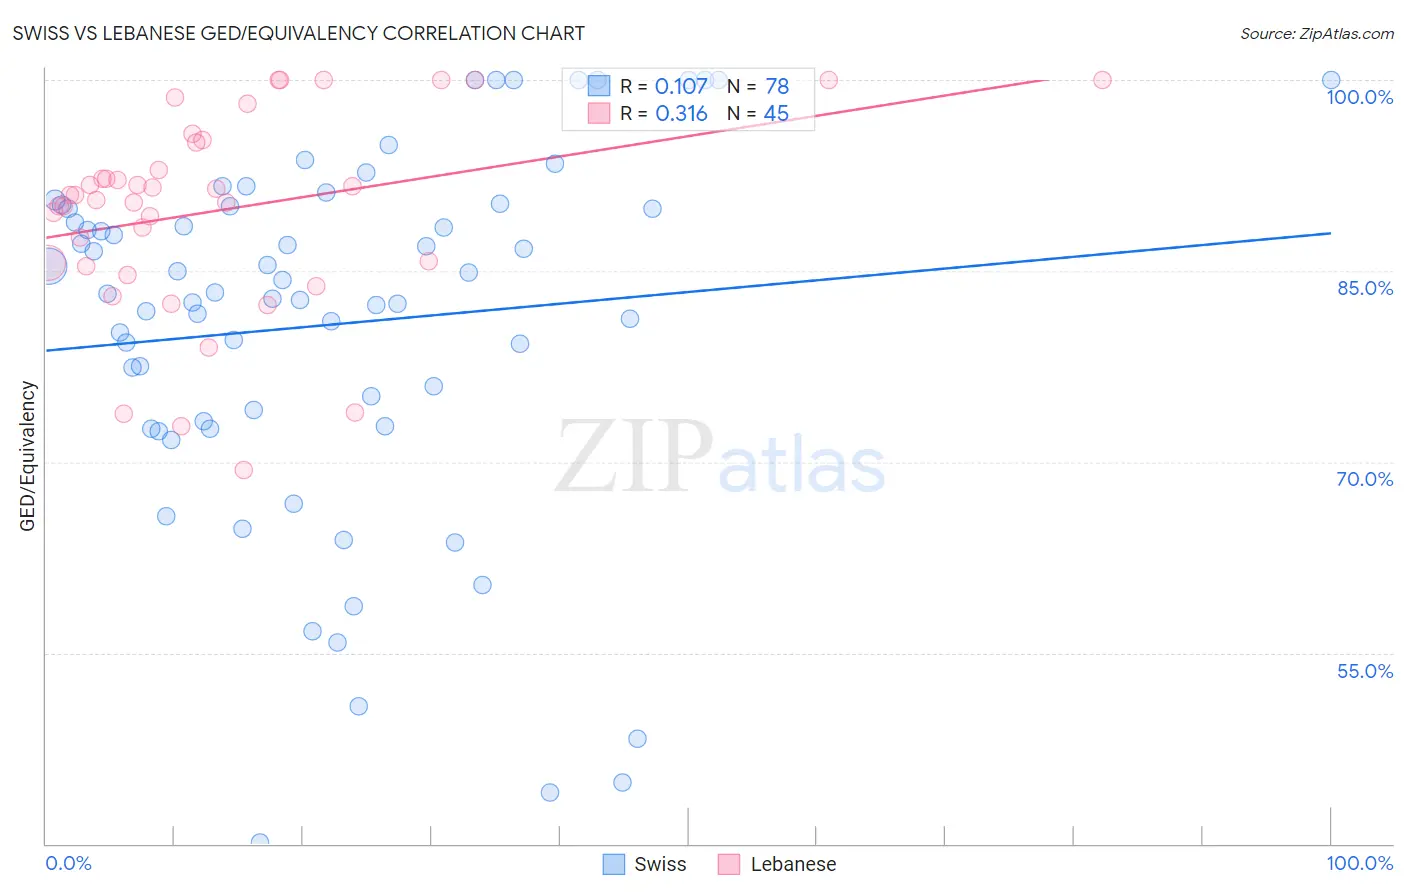
Swiss vs Lebanese GED/Equivalency Correlation Chart
The statistical analysis conducted on geographies consisting of 465,022,572 people shows a poor positive correlation between the proportion of Swiss and percentage of population with at least ged/equivalency education in the United States with a correlation coefficient (R) of 0.107 and weighted average of 87.0%. Similarly, the statistical analysis conducted on geographies consisting of 401,624,313 people shows a mild positive correlation between the proportion of Lebanese and percentage of population with at least ged/equivalency education in the United States with a correlation coefficient (R) of 0.316 and weighted average of 87.2%, a difference of 0.19%.
GED/Equivalency Correlation Summary
| Measurement | Swiss | Lebanese |
| Minimum | 40.1% | 69.4% |
| Maximum | 100.0% | 100.0% |
| Range | 59.9% | 30.6% |
| Mean | 80.8% | 89.8% |
| Median | 83.3% | 90.9% |
| Interquartile 25% (IQ1) | 73.2% | 85.5% |
| Interquartile 75% (IQ3) | 90.1% | 95.2% |
| Interquartile Range (IQR) | 16.9% | 9.8% |
| Standard Deviation (Sample) | 14.3% | 7.7% |
| Standard Deviation (Population) | 14.2% | 7.6% |
Demographics Similar to Swiss and Lebanese by GED/Equivalency
In terms of ged/equivalency, the demographic groups most similar to Swiss are Mongolian (87.0%, a difference of 0.010%), Immigrants from Kazakhstan (87.0%, a difference of 0.020%), Tlingit-Haida (87.0%, a difference of 0.030%), Assyrian/Chaldean/Syriac (87.0%, a difference of 0.030%), and French (87.1%, a difference of 0.070%). Similarly, the demographic groups most similar to Lebanese are Jordanian (87.2%, a difference of 0.010%), Immigrants from Hungary (87.2%, a difference of 0.020%), Indian (Asian) (87.1%, a difference of 0.030%), Immigrants from Zimbabwe (87.1%, a difference of 0.050%), and Syrian (87.2%, a difference of 0.060%).
| Demographics | Rating | Rank | GED/Equivalency |
| Immigrants | Belarus | 96.9 /100 | #99 | Exceptional 87.3% |
| Palestinians | 96.8 /100 | #100 | Exceptional 87.3% |
| Syrians | 96.6 /100 | #101 | Exceptional 87.2% |
| Lebanese | 96.2 /100 | #102 | Exceptional 87.2% |
| Jordanians | 96.1 /100 | #103 | Exceptional 87.2% |
| Immigrants | Hungary | 96.0 /100 | #104 | Exceptional 87.2% |
| Indians (Asian) | 95.9 /100 | #105 | Exceptional 87.1% |
| Immigrants | Zimbabwe | 95.8 /100 | #106 | Exceptional 87.1% |
| Icelanders | 95.7 /100 | #107 | Exceptional 87.1% |
| Canadians | 95.6 /100 | #108 | Exceptional 87.1% |
| Immigrants | Eastern Europe | 95.5 /100 | #109 | Exceptional 87.1% |
| Egyptians | 95.3 /100 | #110 | Exceptional 87.1% |
| French | 95.2 /100 | #111 | Exceptional 87.1% |
| Tlingit-Haida | 94.8 /100 | #112 | Exceptional 87.0% |
| Assyrians/Chaldeans/Syriacs | 94.8 /100 | #113 | Exceptional 87.0% |
| Immigrants | Kazakhstan | 94.7 /100 | #114 | Exceptional 87.0% |
| Mongolians | 94.6 /100 | #115 | Exceptional 87.0% |
| Swiss | 94.5 /100 | #116 | Exceptional 87.0% |
| Immigrants | Hong Kong | 93.8 /100 | #117 | Exceptional 86.9% |
| French Canadians | 93.2 /100 | #118 | Exceptional 86.9% |
| Immigrants | China | 93.2 /100 | #119 | Exceptional 86.9% |