Immigrants from Turkey vs Nepalese GED/Equivalency
COMPARE
Immigrants from Turkey
Nepalese
GED/Equivalency
GED/Equivalency Comparison
Immigrants from Turkey
Nepalese
87.9%
GED/EQUIVALENCY
99.2/ 100
METRIC RATING
63rd/ 347
METRIC RANK
81.9%
GED/EQUIVALENCY
0.0/ 100
METRIC RATING
295th/ 347
METRIC RANK
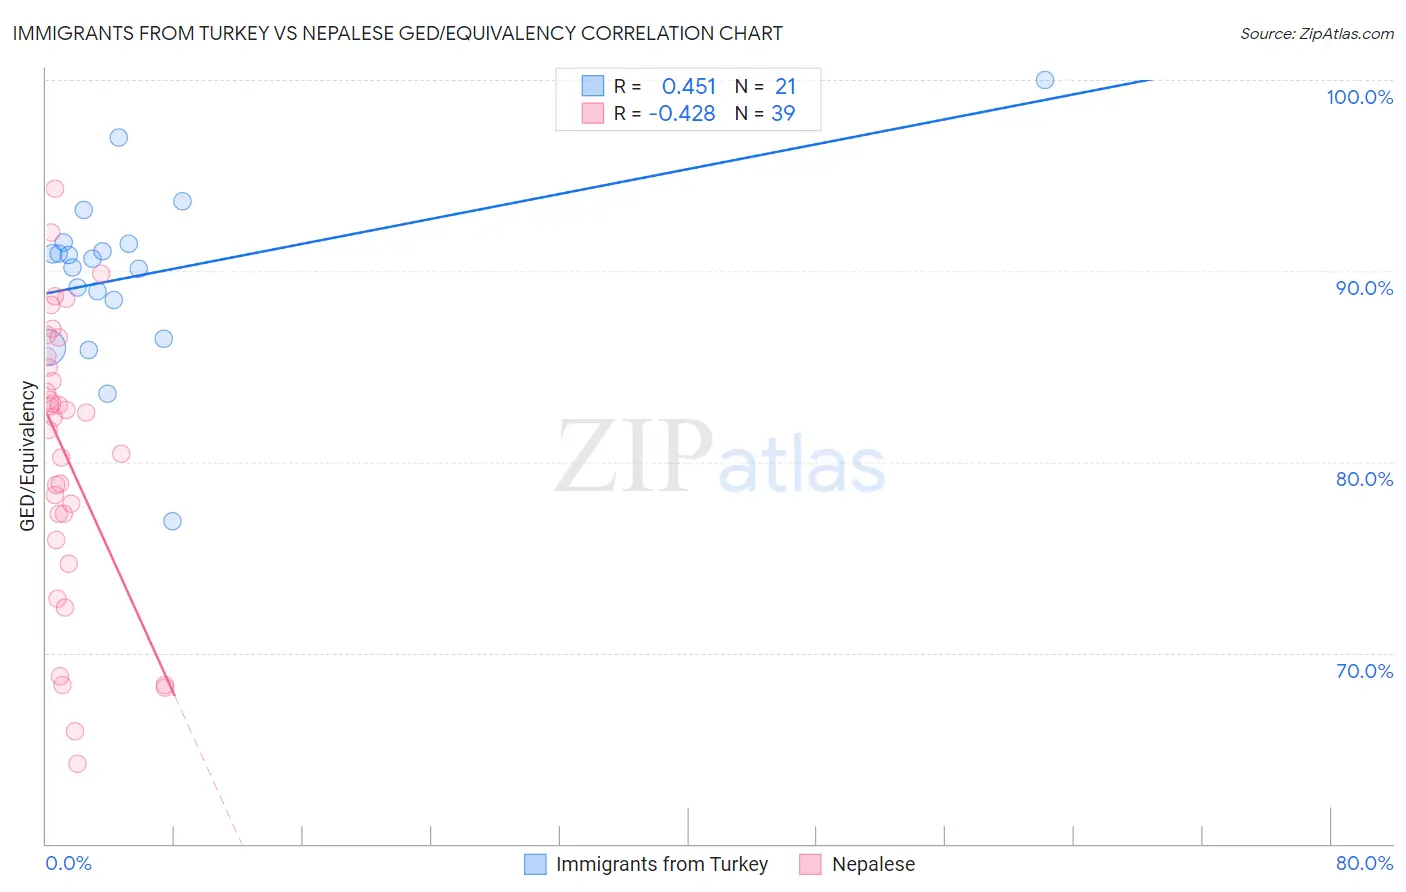
Immigrants from Turkey vs Nepalese GED/Equivalency Correlation Chart
The statistical analysis conducted on geographies consisting of 223,057,775 people shows a moderate positive correlation between the proportion of Immigrants from Turkey and percentage of population with at least ged/equivalency education in the United States with a correlation coefficient (R) of 0.451 and weighted average of 87.9%. Similarly, the statistical analysis conducted on geographies consisting of 24,519,269 people shows a moderate negative correlation between the proportion of Nepalese and percentage of population with at least ged/equivalency education in the United States with a correlation coefficient (R) of -0.428 and weighted average of 81.9%, a difference of 7.3%.
GED/Equivalency Correlation Summary
| Measurement | Immigrants from Turkey | Nepalese |
| Minimum | 76.9% | 64.2% |
| Maximum | 100.0% | 94.3% |
| Range | 23.1% | 30.1% |
| Mean | 89.8% | 80.3% |
| Median | 90.6% | 82.3% |
| Interquartile 25% (IQ1) | 87.5% | 75.9% |
| Interquartile 75% (IQ3) | 91.5% | 85.5% |
| Interquartile Range (IQR) | 4.0% | 9.6% |
| Standard Deviation (Sample) | 4.7% | 7.4% |
| Standard Deviation (Population) | 4.6% | 7.4% |
Similar Demographics by GED/Equivalency
Demographics Similar to Immigrants from Turkey by GED/Equivalency
In terms of ged/equivalency, the demographic groups most similar to Immigrants from Turkey are German (87.9%, a difference of 0.010%), Scandinavian (87.9%, a difference of 0.030%), European (87.9%, a difference of 0.030%), Serbian (87.9%, a difference of 0.040%), and Immigrants from Canada (87.9%, a difference of 0.040%).
| Demographics | Rating | Rank | GED/Equivalency |
| Immigrants | Denmark | 99.4 /100 | #56 | Exceptional 88.0% |
| Immigrants | Czechoslovakia | 99.3 /100 | #57 | Exceptional 87.9% |
| Northern Europeans | 99.3 /100 | #58 | Exceptional 87.9% |
| Serbians | 99.3 /100 | #59 | Exceptional 87.9% |
| Scandinavians | 99.3 /100 | #60 | Exceptional 87.9% |
| Europeans | 99.3 /100 | #61 | Exceptional 87.9% |
| Germans | 99.3 /100 | #62 | Exceptional 87.9% |
| Immigrants | Turkey | 99.2 /100 | #63 | Exceptional 87.9% |
| Immigrants | Canada | 99.2 /100 | #64 | Exceptional 87.9% |
| Immigrants | North America | 99.1 /100 | #65 | Exceptional 87.8% |
| Immigrants | Bulgaria | 99.1 /100 | #66 | Exceptional 87.8% |
| British | 99.1 /100 | #67 | Exceptional 87.8% |
| Immigrants | France | 99.1 /100 | #68 | Exceptional 87.8% |
| Immigrants | Saudi Arabia | 99.0 /100 | #69 | Exceptional 87.8% |
| Ukrainians | 98.8 /100 | #70 | Exceptional 87.7% |
Demographics Similar to Nepalese by GED/Equivalency
In terms of ged/equivalency, the demographic groups most similar to Nepalese are Vietnamese (81.9%, a difference of 0.030%), Immigrants from St. Vincent and the Grenadines (82.0%, a difference of 0.060%), Immigrants from Bangladesh (81.9%, a difference of 0.070%), British West Indian (82.0%, a difference of 0.080%), and Paiute (82.0%, a difference of 0.090%).
| Demographics | Rating | Rank | GED/Equivalency |
| Pueblo | 0.0 /100 | #288 | Tragic 82.3% |
| Immigrants | Cambodia | 0.0 /100 | #289 | Tragic 82.2% |
| Haitians | 0.0 /100 | #290 | Tragic 82.1% |
| Cubans | 0.0 /100 | #291 | Tragic 82.0% |
| Paiute | 0.0 /100 | #292 | Tragic 82.0% |
| British West Indians | 0.0 /100 | #293 | Tragic 82.0% |
| Immigrants | St. Vincent and the Grenadines | 0.0 /100 | #294 | Tragic 82.0% |
| Nepalese | 0.0 /100 | #295 | Tragic 81.9% |
| Vietnamese | 0.0 /100 | #296 | Tragic 81.9% |
| Immigrants | Bangladesh | 0.0 /100 | #297 | Tragic 81.9% |
| Ute | 0.0 /100 | #298 | Tragic 81.8% |
| Ecuadorians | 0.0 /100 | #299 | Tragic 81.7% |
| Fijians | 0.0 /100 | #300 | Tragic 81.6% |
| Dutch West Indians | 0.0 /100 | #301 | Tragic 81.6% |
| Immigrants | Haiti | 0.0 /100 | #302 | Tragic 81.6% |