Immigrants from Turkey vs Immigrants from Albania GED/Equivalency
COMPARE
Immigrants from Turkey
Immigrants from Albania
GED/Equivalency
GED/Equivalency Comparison
Immigrants from Turkey
Immigrants from Albania
87.9%
GED/EQUIVALENCY
99.2/ 100
METRIC RATING
63rd/ 347
METRIC RANK
86.0%
GED/EQUIVALENCY
64.2/ 100
METRIC RATING
166th/ 347
METRIC RANK
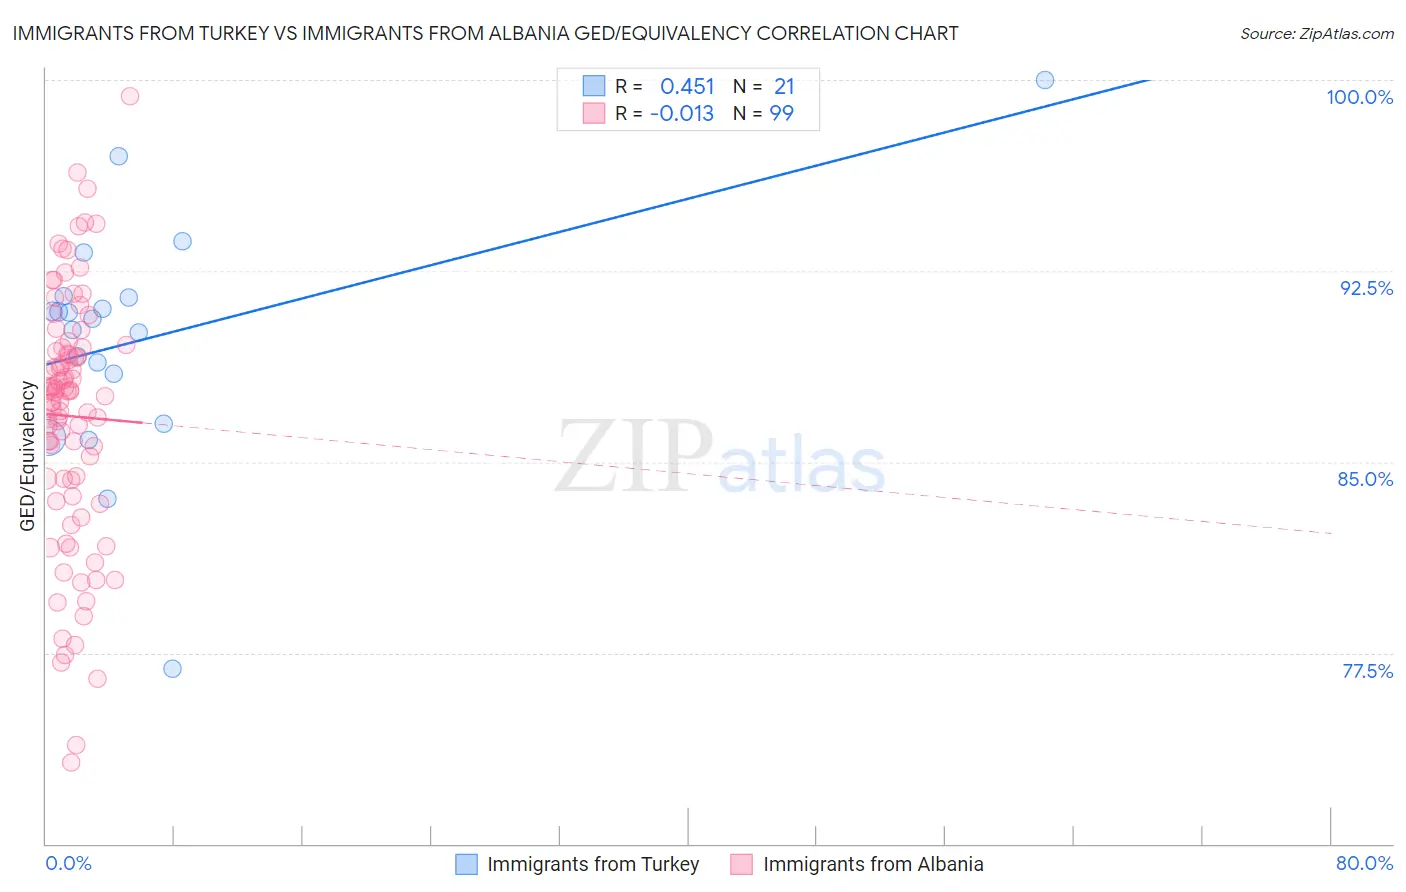
Immigrants from Turkey vs Immigrants from Albania GED/Equivalency Correlation Chart
The statistical analysis conducted on geographies consisting of 223,057,775 people shows a moderate positive correlation between the proportion of Immigrants from Turkey and percentage of population with at least ged/equivalency education in the United States with a correlation coefficient (R) of 0.451 and weighted average of 87.9%. Similarly, the statistical analysis conducted on geographies consisting of 119,401,336 people shows no correlation between the proportion of Immigrants from Albania and percentage of population with at least ged/equivalency education in the United States with a correlation coefficient (R) of -0.013 and weighted average of 86.0%, a difference of 2.2%.
GED/Equivalency Correlation Summary
| Measurement | Immigrants from Turkey | Immigrants from Albania |
| Minimum | 76.9% | 73.2% |
| Maximum | 100.0% | 99.4% |
| Range | 23.1% | 26.2% |
| Mean | 89.8% | 86.8% |
| Median | 90.6% | 87.8% |
| Interquartile 25% (IQ1) | 87.5% | 84.3% |
| Interquartile 75% (IQ3) | 91.5% | 89.5% |
| Interquartile Range (IQR) | 4.0% | 5.2% |
| Standard Deviation (Sample) | 4.7% | 4.9% |
| Standard Deviation (Population) | 4.6% | 4.9% |
Similar Demographics by GED/Equivalency
Demographics Similar to Immigrants from Turkey by GED/Equivalency
In terms of ged/equivalency, the demographic groups most similar to Immigrants from Turkey are German (87.9%, a difference of 0.010%), Scandinavian (87.9%, a difference of 0.030%), European (87.9%, a difference of 0.030%), Serbian (87.9%, a difference of 0.040%), and Immigrants from Canada (87.9%, a difference of 0.040%).
| Demographics | Rating | Rank | GED/Equivalency |
| Immigrants | Denmark | 99.4 /100 | #56 | Exceptional 88.0% |
| Immigrants | Czechoslovakia | 99.3 /100 | #57 | Exceptional 87.9% |
| Northern Europeans | 99.3 /100 | #58 | Exceptional 87.9% |
| Serbians | 99.3 /100 | #59 | Exceptional 87.9% |
| Scandinavians | 99.3 /100 | #60 | Exceptional 87.9% |
| Europeans | 99.3 /100 | #61 | Exceptional 87.9% |
| Germans | 99.3 /100 | #62 | Exceptional 87.9% |
| Immigrants | Turkey | 99.2 /100 | #63 | Exceptional 87.9% |
| Immigrants | Canada | 99.2 /100 | #64 | Exceptional 87.9% |
| Immigrants | North America | 99.1 /100 | #65 | Exceptional 87.8% |
| Immigrants | Bulgaria | 99.1 /100 | #66 | Exceptional 87.8% |
| British | 99.1 /100 | #67 | Exceptional 87.8% |
| Immigrants | France | 99.1 /100 | #68 | Exceptional 87.8% |
| Immigrants | Saudi Arabia | 99.0 /100 | #69 | Exceptional 87.8% |
| Ukrainians | 98.8 /100 | #70 | Exceptional 87.7% |
Demographics Similar to Immigrants from Albania by GED/Equivalency
In terms of ged/equivalency, the demographic groups most similar to Immigrants from Albania are Alsatian (86.0%, a difference of 0.0%), Ethiopian (86.0%, a difference of 0.010%), Venezuelan (86.0%, a difference of 0.030%), Ugandan (86.1%, a difference of 0.050%), and Sierra Leonean (86.0%, a difference of 0.050%).
| Demographics | Rating | Rank | GED/Equivalency |
| Immigrants | Kenya | 71.8 /100 | #159 | Good 86.2% |
| Immigrants | Morocco | 69.5 /100 | #160 | Good 86.1% |
| Immigrants | Syria | 69.3 /100 | #161 | Good 86.1% |
| Immigrants | Iraq | 68.1 /100 | #162 | Good 86.1% |
| Ugandans | 66.3 /100 | #163 | Good 86.1% |
| Venezuelans | 65.5 /100 | #164 | Good 86.0% |
| Alsatians | 64.3 /100 | #165 | Good 86.0% |
| Immigrants | Albania | 64.2 /100 | #166 | Good 86.0% |
| Ethiopians | 63.7 /100 | #167 | Good 86.0% |
| Sierra Leoneans | 61.8 /100 | #168 | Good 86.0% |
| Immigrants | Ethiopia | 61.2 /100 | #169 | Good 86.0% |
| Afghans | 59.7 /100 | #170 | Average 85.9% |
| Immigrants | Chile | 57.3 /100 | #171 | Average 85.9% |
| Bermudans | 55.1 /100 | #172 | Average 85.8% |
| Immigrants | Venezuela | 50.7 /100 | #173 | Average 85.8% |