Immigrants from Panama vs Immigrants from West Indies GED/Equivalency
COMPARE
Immigrants from Panama
Immigrants from West Indies
GED/Equivalency
GED/Equivalency Comparison
Immigrants from Panama
Immigrants from West Indies
84.4%
GED/EQUIVALENCY
4.1/ 100
METRIC RATING
233rd/ 347
METRIC RANK
82.4%
GED/EQUIVALENCY
0.0/ 100
METRIC RATING
286th/ 347
METRIC RANK
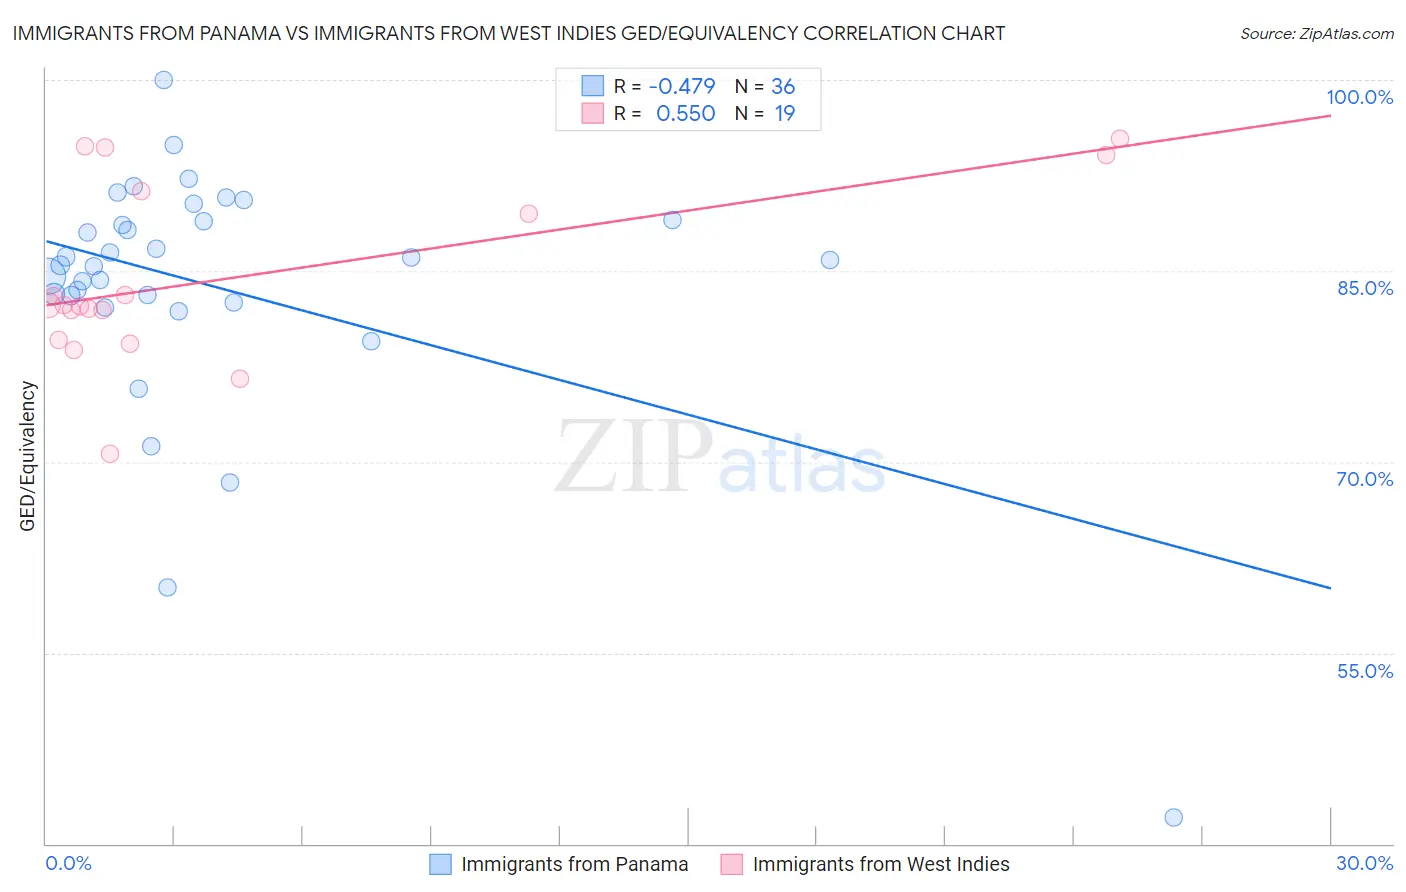
Immigrants from Panama vs Immigrants from West Indies GED/Equivalency Correlation Chart
The statistical analysis conducted on geographies consisting of 221,184,524 people shows a moderate negative correlation between the proportion of Immigrants from Panama and percentage of population with at least ged/equivalency education in the United States with a correlation coefficient (R) of -0.479 and weighted average of 84.4%. Similarly, the statistical analysis conducted on geographies consisting of 72,457,514 people shows a substantial positive correlation between the proportion of Immigrants from West Indies and percentage of population with at least ged/equivalency education in the United States with a correlation coefficient (R) of 0.550 and weighted average of 82.4%, a difference of 2.4%.
GED/Equivalency Correlation Summary
| Measurement | Immigrants from Panama | Immigrants from West Indies |
| Minimum | 42.1% | 70.7% |
| Maximum | 100.0% | 95.4% |
| Range | 57.9% | 24.7% |
| Mean | 83.8% | 84.4% |
| Median | 85.7% | 82.3% |
| Interquartile 25% (IQ1) | 82.8% | 79.6% |
| Interquartile 75% (IQ3) | 88.9% | 91.2% |
| Interquartile Range (IQR) | 6.1% | 11.7% |
| Standard Deviation (Sample) | 10.2% | 7.0% |
| Standard Deviation (Population) | 10.1% | 6.8% |
Similar Demographics by GED/Equivalency
Demographics Similar to Immigrants from Panama by GED/Equivalency
In terms of ged/equivalency, the demographic groups most similar to Immigrants from Panama are Immigrants from South America (84.4%, a difference of 0.010%), Immigrants from Middle Africa (84.4%, a difference of 0.030%), Immigrants from Colombia (84.4%, a difference of 0.050%), Immigrants from Uruguay (84.4%, a difference of 0.060%), and Immigrants from Nigeria (84.3%, a difference of 0.070%).
| Demographics | Rating | Rank | GED/Equivalency |
| Immigrants | Zaire | 5.5 /100 | #226 | Tragic 84.5% |
| Immigrants | Costa Rica | 5.4 /100 | #227 | Tragic 84.5% |
| Immigrants | Liberia | 4.9 /100 | #228 | Tragic 84.4% |
| Immigrants | Uruguay | 4.6 /100 | #229 | Tragic 84.4% |
| Immigrants | Colombia | 4.5 /100 | #230 | Tragic 84.4% |
| Immigrants | Middle Africa | 4.3 /100 | #231 | Tragic 84.4% |
| Immigrants | South America | 4.2 /100 | #232 | Tragic 84.4% |
| Immigrants | Panama | 4.1 /100 | #233 | Tragic 84.4% |
| Immigrants | Nigeria | 3.6 /100 | #234 | Tragic 84.3% |
| Ghanaians | 3.5 /100 | #235 | Tragic 84.3% |
| Immigrants | Eritrea | 3.5 /100 | #236 | Tragic 84.3% |
| Sub-Saharan Africans | 3.0 /100 | #237 | Tragic 84.2% |
| Immigrants | Peru | 2.7 /100 | #238 | Tragic 84.2% |
| Immigrants | Bahamas | 2.6 /100 | #239 | Tragic 84.2% |
| Immigrants | South Eastern Asia | 2.5 /100 | #240 | Tragic 84.1% |
Demographics Similar to Immigrants from West Indies by GED/Equivalency
In terms of ged/equivalency, the demographic groups most similar to Immigrants from West Indies are Cajun (82.4%, a difference of 0.020%), Japanese (82.4%, a difference of 0.020%), Immigrants from Barbados (82.4%, a difference of 0.060%), Pueblo (82.3%, a difference of 0.12%), and Indonesian (82.5%, a difference of 0.18%).
| Demographics | Rating | Rank | GED/Equivalency |
| Immigrants | Fiji | 0.1 /100 | #279 | Tragic 82.7% |
| Cheyenne | 0.1 /100 | #280 | Tragic 82.7% |
| Sioux | 0.1 /100 | #281 | Tragic 82.6% |
| Immigrants | Immigrants | 0.1 /100 | #282 | Tragic 82.6% |
| Indonesians | 0.1 /100 | #283 | Tragic 82.5% |
| Immigrants | Barbados | 0.1 /100 | #284 | Tragic 82.4% |
| Cajuns | 0.0 /100 | #285 | Tragic 82.4% |
| Immigrants | West Indies | 0.0 /100 | #286 | Tragic 82.4% |
| Japanese | 0.0 /100 | #287 | Tragic 82.4% |
| Pueblo | 0.0 /100 | #288 | Tragic 82.3% |
| Immigrants | Cambodia | 0.0 /100 | #289 | Tragic 82.2% |
| Haitians | 0.0 /100 | #290 | Tragic 82.1% |
| Cubans | 0.0 /100 | #291 | Tragic 82.0% |
| Paiute | 0.0 /100 | #292 | Tragic 82.0% |
| British West Indians | 0.0 /100 | #293 | Tragic 82.0% |