Immigrants from Panama vs Immigrants from South Eastern Asia GED/Equivalency
COMPARE
Immigrants from Panama
Immigrants from South Eastern Asia
GED/Equivalency
GED/Equivalency Comparison
Immigrants from Panama
Immigrants from South Eastern Asia
84.4%
GED/EQUIVALENCY
4.1/ 100
METRIC RATING
233rd/ 347
METRIC RANK
84.1%
GED/EQUIVALENCY
2.5/ 100
METRIC RATING
240th/ 347
METRIC RANK
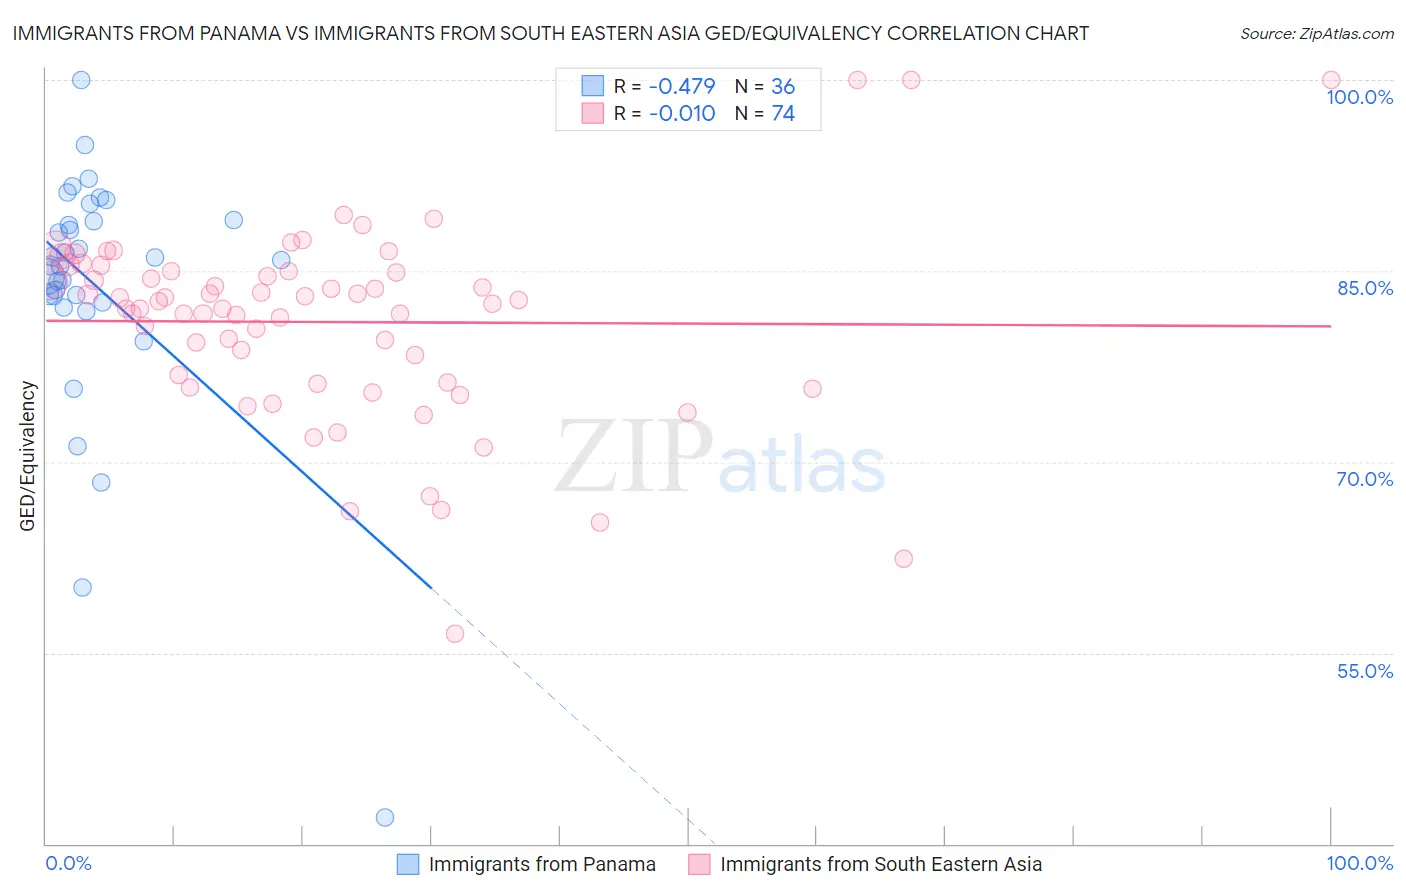
Immigrants from Panama vs Immigrants from South Eastern Asia GED/Equivalency Correlation Chart
The statistical analysis conducted on geographies consisting of 221,184,524 people shows a moderate negative correlation between the proportion of Immigrants from Panama and percentage of population with at least ged/equivalency education in the United States with a correlation coefficient (R) of -0.479 and weighted average of 84.4%. Similarly, the statistical analysis conducted on geographies consisting of 512,708,901 people shows no correlation between the proportion of Immigrants from South Eastern Asia and percentage of population with at least ged/equivalency education in the United States with a correlation coefficient (R) of -0.010 and weighted average of 84.1%, a difference of 0.27%.
GED/Equivalency Correlation Summary
| Measurement | Immigrants from Panama | Immigrants from South Eastern Asia |
| Minimum | 42.1% | 56.5% |
| Maximum | 100.0% | 100.0% |
| Range | 57.9% | 43.5% |
| Mean | 83.8% | 81.0% |
| Median | 85.7% | 82.5% |
| Interquartile 25% (IQ1) | 82.8% | 76.2% |
| Interquartile 75% (IQ3) | 88.9% | 84.9% |
| Interquartile Range (IQR) | 6.1% | 8.8% |
| Standard Deviation (Sample) | 10.2% | 7.6% |
| Standard Deviation (Population) | 10.1% | 7.6% |
Demographics Similar to Immigrants from Panama and Immigrants from South Eastern Asia by GED/Equivalency
In terms of ged/equivalency, the demographic groups most similar to Immigrants from Panama are Immigrants from South America (84.4%, a difference of 0.010%), Immigrants from Middle Africa (84.4%, a difference of 0.030%), Immigrants from Colombia (84.4%, a difference of 0.050%), Immigrants from Uruguay (84.4%, a difference of 0.060%), and Immigrants from Nigeria (84.3%, a difference of 0.070%). Similarly, the demographic groups most similar to Immigrants from South Eastern Asia are Immigrants from Bahamas (84.2%, a difference of 0.020%), Immigrants from Peru (84.2%, a difference of 0.040%), Subsaharan African (84.2%, a difference of 0.10%), Senegalese (84.0%, a difference of 0.14%), and Sri Lankan (84.0%, a difference of 0.16%).
| Demographics | Rating | Rank | GED/Equivalency |
| Immigrants | Zaire | 5.5 /100 | #226 | Tragic 84.5% |
| Immigrants | Costa Rica | 5.4 /100 | #227 | Tragic 84.5% |
| Immigrants | Liberia | 4.9 /100 | #228 | Tragic 84.4% |
| Immigrants | Uruguay | 4.6 /100 | #229 | Tragic 84.4% |
| Immigrants | Colombia | 4.5 /100 | #230 | Tragic 84.4% |
| Immigrants | Middle Africa | 4.3 /100 | #231 | Tragic 84.4% |
| Immigrants | South America | 4.2 /100 | #232 | Tragic 84.4% |
| Immigrants | Panama | 4.1 /100 | #233 | Tragic 84.4% |
| Immigrants | Nigeria | 3.6 /100 | #234 | Tragic 84.3% |
| Ghanaians | 3.5 /100 | #235 | Tragic 84.3% |
| Immigrants | Eritrea | 3.5 /100 | #236 | Tragic 84.3% |
| Sub-Saharan Africans | 3.0 /100 | #237 | Tragic 84.2% |
| Immigrants | Peru | 2.7 /100 | #238 | Tragic 84.2% |
| Immigrants | Bahamas | 2.6 /100 | #239 | Tragic 84.2% |
| Immigrants | South Eastern Asia | 2.5 /100 | #240 | Tragic 84.1% |
| Senegalese | 1.9 /100 | #241 | Tragic 84.0% |
| Sri Lankans | 1.9 /100 | #242 | Tragic 84.0% |
| Cherokee | 1.3 /100 | #243 | Tragic 83.9% |
| Immigrants | Ghana | 1.3 /100 | #244 | Tragic 83.9% |
| Immigrants | Senegal | 1.2 /100 | #245 | Tragic 83.8% |
| Chickasaw | 1.2 /100 | #246 | Tragic 83.8% |