Immigrants from Panama vs Scottish GED/Equivalency
COMPARE
Immigrants from Panama
Scottish
GED/Equivalency
GED/Equivalency Comparison
Immigrants from Panama
Scottish
84.4%
GED/EQUIVALENCY
4.1/ 100
METRIC RATING
233rd/ 347
METRIC RANK
87.7%
GED/EQUIVALENCY
98.7/ 100
METRIC RATING
75th/ 347
METRIC RANK
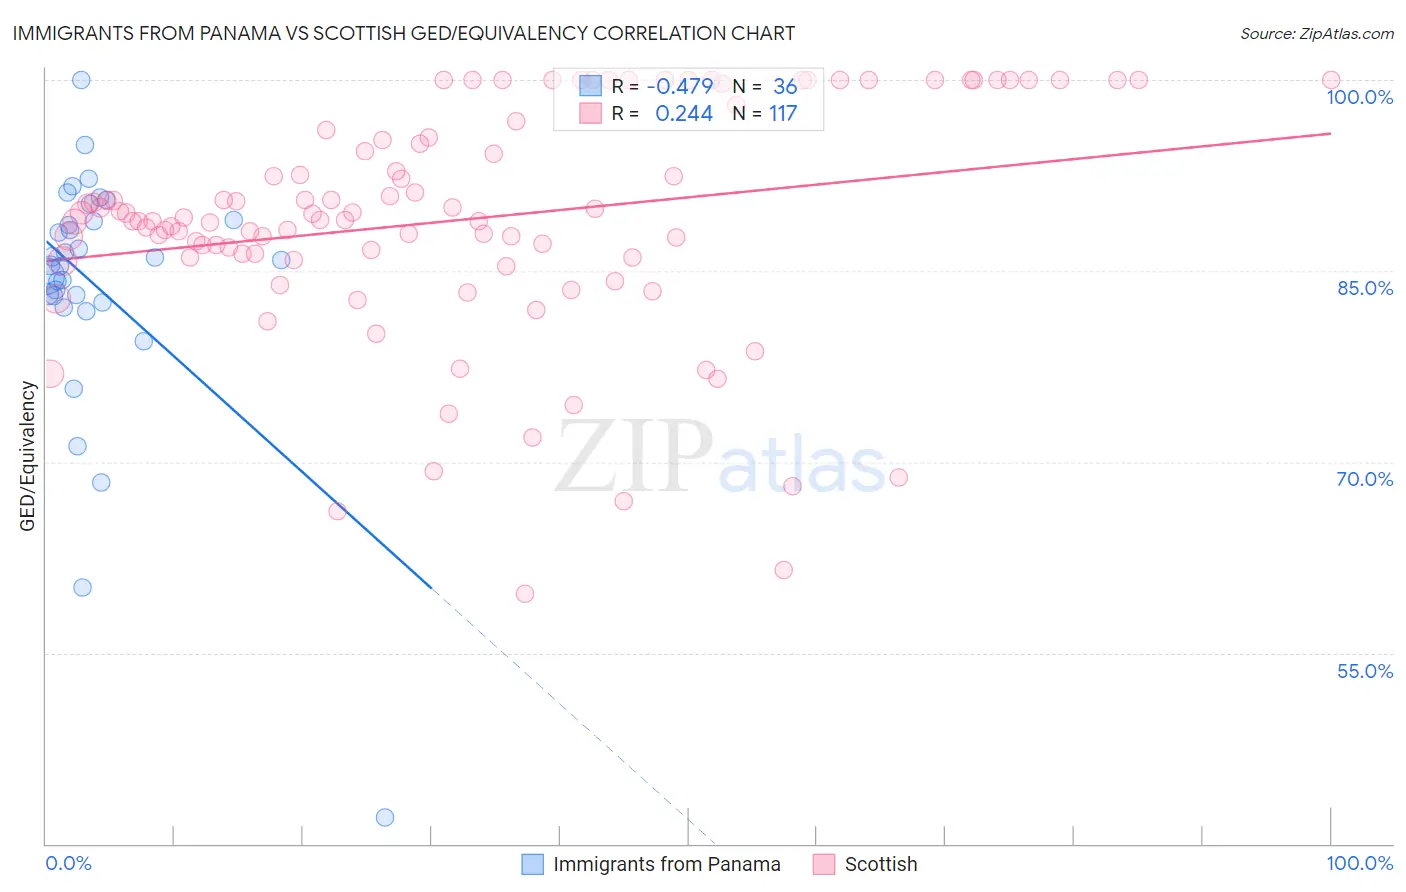
Immigrants from Panama vs Scottish GED/Equivalency Correlation Chart
The statistical analysis conducted on geographies consisting of 221,184,524 people shows a moderate negative correlation between the proportion of Immigrants from Panama and percentage of population with at least ged/equivalency education in the United States with a correlation coefficient (R) of -0.479 and weighted average of 84.4%. Similarly, the statistical analysis conducted on geographies consisting of 567,141,608 people shows a weak positive correlation between the proportion of Scottish and percentage of population with at least ged/equivalency education in the United States with a correlation coefficient (R) of 0.244 and weighted average of 87.7%, a difference of 3.9%.
GED/Equivalency Correlation Summary
| Measurement | Immigrants from Panama | Scottish |
| Minimum | 42.1% | 59.6% |
| Maximum | 100.0% | 100.0% |
| Range | 57.9% | 40.4% |
| Mean | 83.8% | 89.0% |
| Median | 85.7% | 89.0% |
| Interquartile 25% (IQ1) | 82.8% | 86.1% |
| Interquartile 75% (IQ3) | 88.9% | 95.8% |
| Interquartile Range (IQR) | 6.1% | 9.7% |
| Standard Deviation (Sample) | 10.2% | 9.0% |
| Standard Deviation (Population) | 10.1% | 9.0% |
Similar Demographics by GED/Equivalency
Demographics Similar to Immigrants from Panama by GED/Equivalency
In terms of ged/equivalency, the demographic groups most similar to Immigrants from Panama are Immigrants from South America (84.4%, a difference of 0.010%), Immigrants from Middle Africa (84.4%, a difference of 0.030%), Immigrants from Colombia (84.4%, a difference of 0.050%), Immigrants from Uruguay (84.4%, a difference of 0.060%), and Immigrants from Nigeria (84.3%, a difference of 0.070%).
| Demographics | Rating | Rank | GED/Equivalency |
| Immigrants | Zaire | 5.5 /100 | #226 | Tragic 84.5% |
| Immigrants | Costa Rica | 5.4 /100 | #227 | Tragic 84.5% |
| Immigrants | Liberia | 4.9 /100 | #228 | Tragic 84.4% |
| Immigrants | Uruguay | 4.6 /100 | #229 | Tragic 84.4% |
| Immigrants | Colombia | 4.5 /100 | #230 | Tragic 84.4% |
| Immigrants | Middle Africa | 4.3 /100 | #231 | Tragic 84.4% |
| Immigrants | South America | 4.2 /100 | #232 | Tragic 84.4% |
| Immigrants | Panama | 4.1 /100 | #233 | Tragic 84.4% |
| Immigrants | Nigeria | 3.6 /100 | #234 | Tragic 84.3% |
| Ghanaians | 3.5 /100 | #235 | Tragic 84.3% |
| Immigrants | Eritrea | 3.5 /100 | #236 | Tragic 84.3% |
| Sub-Saharan Africans | 3.0 /100 | #237 | Tragic 84.2% |
| Immigrants | Peru | 2.7 /100 | #238 | Tragic 84.2% |
| Immigrants | Bahamas | 2.6 /100 | #239 | Tragic 84.2% |
| Immigrants | South Eastern Asia | 2.5 /100 | #240 | Tragic 84.1% |
Demographics Similar to Scottish by GED/Equivalency
In terms of ged/equivalency, the demographic groups most similar to Scottish are Immigrants from Serbia (87.7%, a difference of 0.010%), Immigrants from Kuwait (87.7%, a difference of 0.020%), Slavic (87.7%, a difference of 0.020%), Belgian (87.7%, a difference of 0.030%), and Irish (87.6%, a difference of 0.040%).
| Demographics | Rating | Rank | GED/Equivalency |
| Immigrants | France | 99.1 /100 | #68 | Exceptional 87.8% |
| Immigrants | Saudi Arabia | 99.0 /100 | #69 | Exceptional 87.8% |
| Ukrainians | 98.8 /100 | #70 | Exceptional 87.7% |
| Austrians | 98.8 /100 | #71 | Exceptional 87.7% |
| Immigrants | Moldova | 98.8 /100 | #72 | Exceptional 87.7% |
| Belgians | 98.8 /100 | #73 | Exceptional 87.7% |
| Immigrants | Kuwait | 98.8 /100 | #74 | Exceptional 87.7% |
| Scottish | 98.7 /100 | #75 | Exceptional 87.7% |
| Immigrants | Serbia | 98.7 /100 | #76 | Exceptional 87.7% |
| Slavs | 98.7 /100 | #77 | Exceptional 87.7% |
| Irish | 98.6 /100 | #78 | Exceptional 87.6% |
| English | 98.6 /100 | #79 | Exceptional 87.6% |
| Immigrants | England | 98.5 /100 | #80 | Exceptional 87.6% |
| Immigrants | Sri Lanka | 98.3 /100 | #81 | Exceptional 87.5% |
| Romanians | 98.3 /100 | #82 | Exceptional 87.5% |