Immigrants from Micronesia vs Immigrants from Yemen GED/Equivalency
COMPARE
Immigrants from Micronesia
Immigrants from Yemen
GED/Equivalency
GED/Equivalency Comparison
Immigrants from Micronesia
Immigrants from Yemen
84.7%
GED/EQUIVALENCY
8.7/ 100
METRIC RATING
216th/ 347
METRIC RANK
77.9%
GED/EQUIVALENCY
0.0/ 100
METRIC RATING
337th/ 347
METRIC RANK
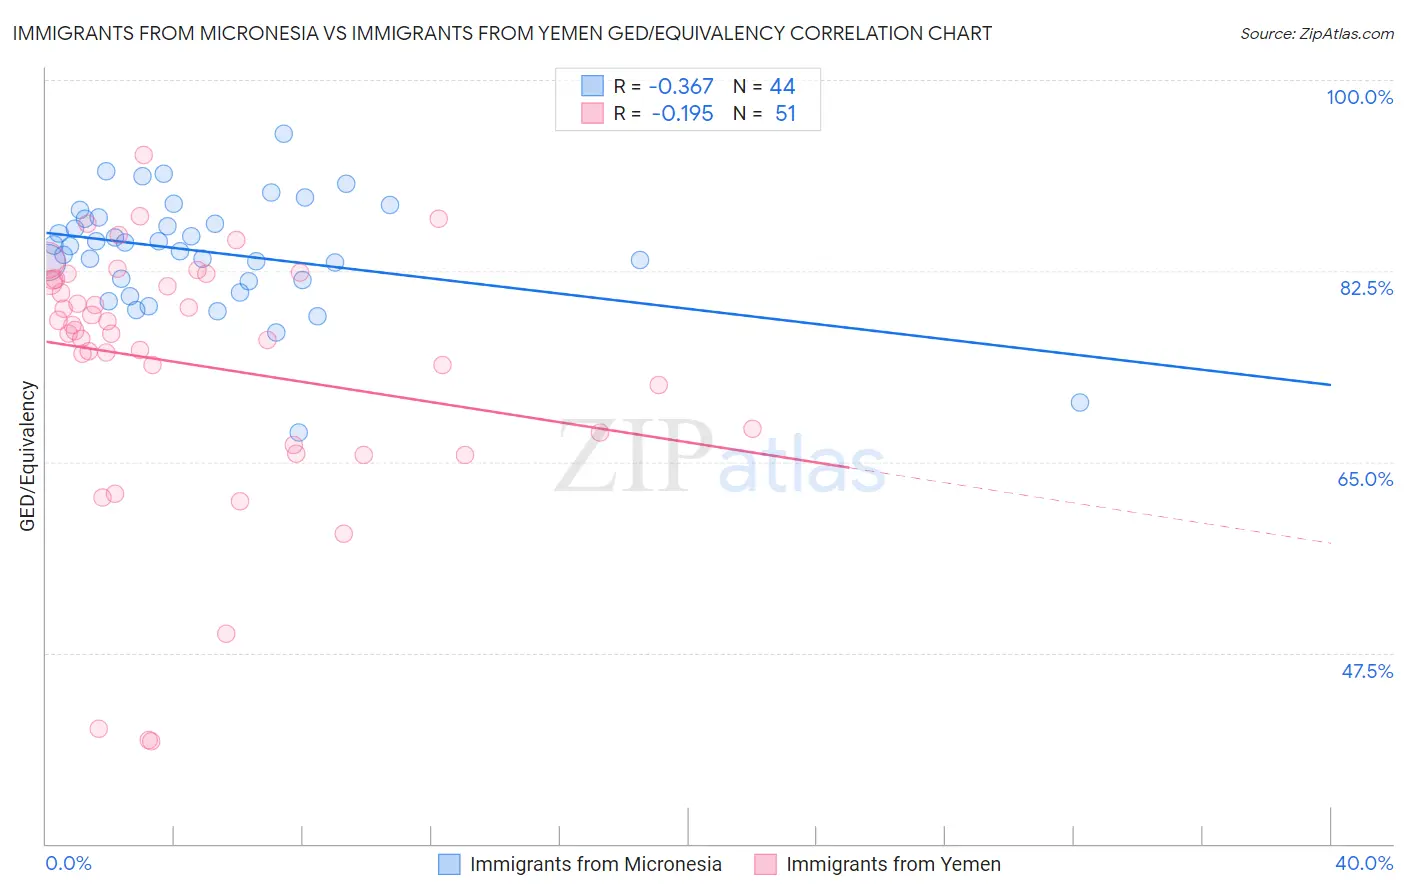
Immigrants from Micronesia vs Immigrants from Yemen GED/Equivalency Correlation Chart
The statistical analysis conducted on geographies consisting of 61,609,499 people shows a mild negative correlation between the proportion of Immigrants from Micronesia and percentage of population with at least ged/equivalency education in the United States with a correlation coefficient (R) of -0.367 and weighted average of 84.7%. Similarly, the statistical analysis conducted on geographies consisting of 82,433,611 people shows a poor negative correlation between the proportion of Immigrants from Yemen and percentage of population with at least ged/equivalency education in the United States with a correlation coefficient (R) of -0.195 and weighted average of 77.9%, a difference of 8.7%.
GED/Equivalency Correlation Summary
| Measurement | Immigrants from Micronesia | Immigrants from Yemen |
| Minimum | 67.7% | 39.4% |
| Maximum | 95.1% | 93.1% |
| Range | 27.3% | 53.7% |
| Mean | 84.2% | 73.9% |
| Median | 84.9% | 77.0% |
| Interquartile 25% (IQ1) | 81.6% | 67.7% |
| Interquartile 75% (IQ3) | 87.3% | 81.8% |
| Interquartile Range (IQR) | 5.7% | 14.1% |
| Standard Deviation (Sample) | 5.2% | 12.0% |
| Standard Deviation (Population) | 5.2% | 11.9% |
Similar Demographics by GED/Equivalency
Demographics Similar to Immigrants from Micronesia by GED/Equivalency
In terms of ged/equivalency, the demographic groups most similar to Immigrants from Micronesia are Nigerian (84.7%, a difference of 0.0%), Alaska Native (84.7%, a difference of 0.0%), Peruvian (84.7%, a difference of 0.030%), Potawatomi (84.7%, a difference of 0.030%), and American (84.7%, a difference of 0.030%).
| Demographics | Rating | Rank | GED/Equivalency |
| Colombians | 12.3 /100 | #209 | Poor 84.9% |
| Immigrants | Cameroon | 12.1 /100 | #210 | Poor 84.9% |
| South Americans | 10.9 /100 | #211 | Poor 84.8% |
| Immigrants | Somalia | 10.6 /100 | #212 | Poor 84.8% |
| Immigrants | Philippines | 10.0 /100 | #213 | Poor 84.8% |
| Osage | 9.5 /100 | #214 | Tragic 84.8% |
| Peruvians | 9.2 /100 | #215 | Tragic 84.7% |
| Immigrants | Micronesia | 8.7 /100 | #216 | Tragic 84.7% |
| Nigerians | 8.6 /100 | #217 | Tragic 84.7% |
| Alaska Natives | 8.6 /100 | #218 | Tragic 84.7% |
| Potawatomi | 8.2 /100 | #219 | Tragic 84.7% |
| Americans | 8.2 /100 | #220 | Tragic 84.7% |
| Taiwanese | 8.1 /100 | #221 | Tragic 84.7% |
| Iroquois | 7.5 /100 | #222 | Tragic 84.6% |
| Immigrants | Uzbekistan | 7.1 /100 | #223 | Tragic 84.6% |
Demographics Similar to Immigrants from Yemen by GED/Equivalency
In terms of ged/equivalency, the demographic groups most similar to Immigrants from Yemen are Immigrants from Guatemala (77.9%, a difference of 0.020%), Immigrants from Dominican Republic (78.0%, a difference of 0.060%), Immigrants from El Salvador (77.6%, a difference of 0.41%), Tohono O'odham (77.5%, a difference of 0.56%), and Mexican (77.4%, a difference of 0.65%).
| Demographics | Rating | Rank | GED/Equivalency |
| Immigrants | Cabo Verde | 0.0 /100 | #330 | Tragic 78.9% |
| Immigrants | Honduras | 0.0 /100 | #331 | Tragic 78.7% |
| Immigrants | Azores | 0.0 /100 | #332 | Tragic 78.7% |
| Salvadorans | 0.0 /100 | #333 | Tragic 78.6% |
| Guatemalans | 0.0 /100 | #334 | Tragic 78.5% |
| Immigrants | Latin America | 0.0 /100 | #335 | Tragic 78.5% |
| Immigrants | Dominican Republic | 0.0 /100 | #336 | Tragic 78.0% |
| Immigrants | Yemen | 0.0 /100 | #337 | Tragic 77.9% |
| Immigrants | Guatemala | 0.0 /100 | #338 | Tragic 77.9% |
| Immigrants | El Salvador | 0.0 /100 | #339 | Tragic 77.6% |
| Tohono O'odham | 0.0 /100 | #340 | Tragic 77.5% |
| Mexicans | 0.0 /100 | #341 | Tragic 77.4% |
| Pima | 0.0 /100 | #342 | Tragic 76.4% |
| Immigrants | Central America | 0.0 /100 | #343 | Tragic 76.4% |
| Spanish American Indians | 0.0 /100 | #344 | Tragic 76.3% |