Immigrants from Micronesia vs Arapaho GED/Equivalency
COMPARE
Immigrants from Micronesia
Arapaho
GED/Equivalency
GED/Equivalency Comparison
Immigrants from Micronesia
Arapaho
84.7%
GED/EQUIVALENCY
8.7/ 100
METRIC RATING
216th/ 347
METRIC RANK
82.8%
GED/EQUIVALENCY
0.1/ 100
METRIC RATING
277th/ 347
METRIC RANK
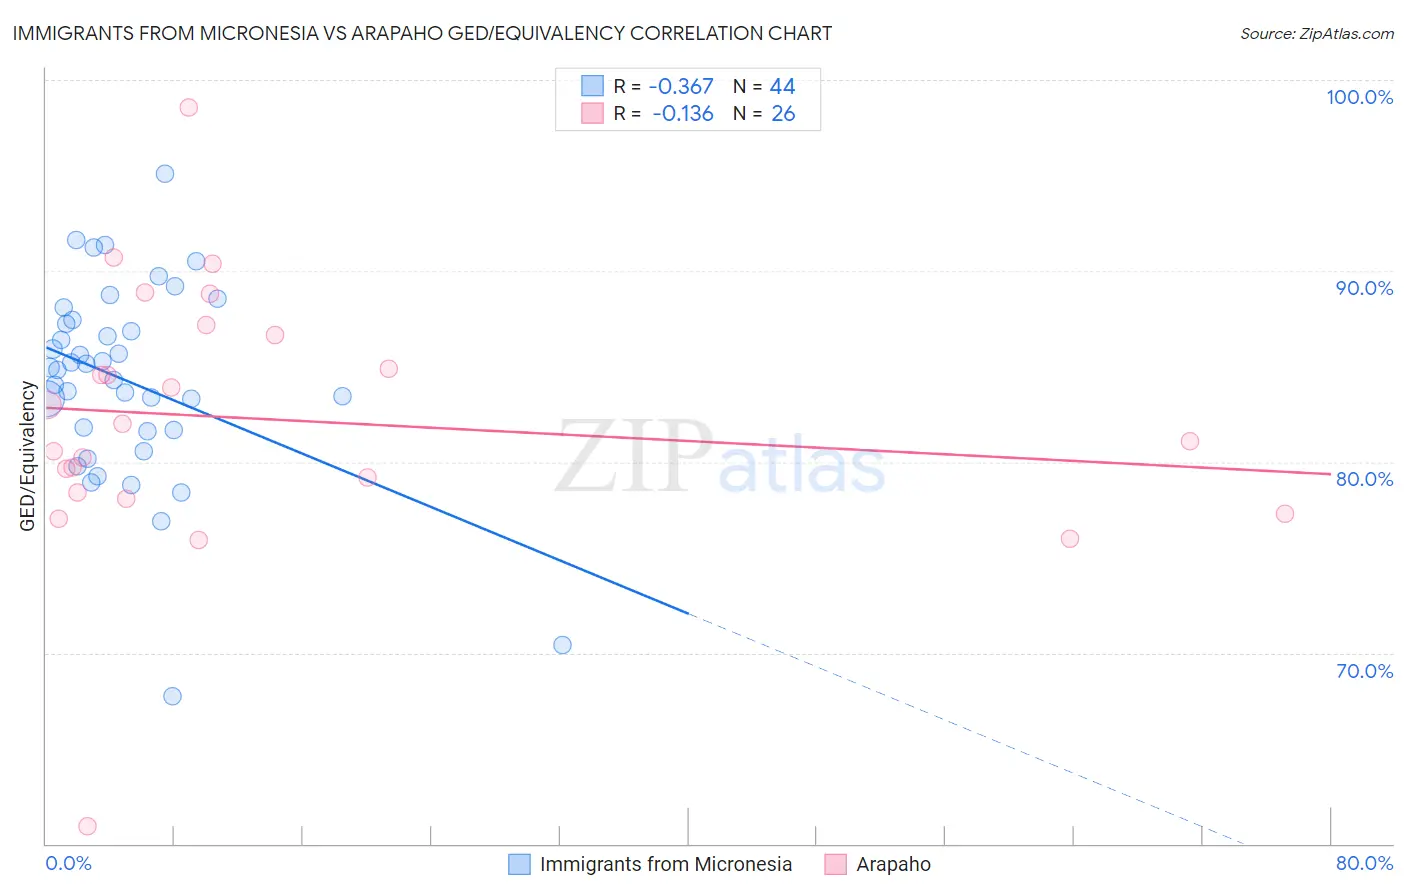
Immigrants from Micronesia vs Arapaho GED/Equivalency Correlation Chart
The statistical analysis conducted on geographies consisting of 61,609,499 people shows a mild negative correlation between the proportion of Immigrants from Micronesia and percentage of population with at least ged/equivalency education in the United States with a correlation coefficient (R) of -0.367 and weighted average of 84.7%. Similarly, the statistical analysis conducted on geographies consisting of 29,780,040 people shows a poor negative correlation between the proportion of Arapaho and percentage of population with at least ged/equivalency education in the United States with a correlation coefficient (R) of -0.136 and weighted average of 82.8%, a difference of 2.4%.
GED/Equivalency Correlation Summary
| Measurement | Immigrants from Micronesia | Arapaho |
| Minimum | 67.7% | 60.9% |
| Maximum | 95.1% | 98.5% |
| Range | 27.3% | 37.6% |
| Mean | 84.2% | 82.2% |
| Median | 84.9% | 81.5% |
| Interquartile 25% (IQ1) | 81.6% | 78.4% |
| Interquartile 75% (IQ3) | 87.3% | 86.6% |
| Interquartile Range (IQR) | 5.7% | 8.2% |
| Standard Deviation (Sample) | 5.2% | 6.9% |
| Standard Deviation (Population) | 5.2% | 6.8% |
Similar Demographics by GED/Equivalency
Demographics Similar to Immigrants from Micronesia by GED/Equivalency
In terms of ged/equivalency, the demographic groups most similar to Immigrants from Micronesia are Nigerian (84.7%, a difference of 0.0%), Alaska Native (84.7%, a difference of 0.0%), Peruvian (84.7%, a difference of 0.030%), Potawatomi (84.7%, a difference of 0.030%), and American (84.7%, a difference of 0.030%).
| Demographics | Rating | Rank | GED/Equivalency |
| Colombians | 12.3 /100 | #209 | Poor 84.9% |
| Immigrants | Cameroon | 12.1 /100 | #210 | Poor 84.9% |
| South Americans | 10.9 /100 | #211 | Poor 84.8% |
| Immigrants | Somalia | 10.6 /100 | #212 | Poor 84.8% |
| Immigrants | Philippines | 10.0 /100 | #213 | Poor 84.8% |
| Osage | 9.5 /100 | #214 | Tragic 84.8% |
| Peruvians | 9.2 /100 | #215 | Tragic 84.7% |
| Immigrants | Micronesia | 8.7 /100 | #216 | Tragic 84.7% |
| Nigerians | 8.6 /100 | #217 | Tragic 84.7% |
| Alaska Natives | 8.6 /100 | #218 | Tragic 84.7% |
| Potawatomi | 8.2 /100 | #219 | Tragic 84.7% |
| Americans | 8.2 /100 | #220 | Tragic 84.7% |
| Taiwanese | 8.1 /100 | #221 | Tragic 84.7% |
| Iroquois | 7.5 /100 | #222 | Tragic 84.6% |
| Immigrants | Uzbekistan | 7.1 /100 | #223 | Tragic 84.6% |
Demographics Similar to Arapaho by GED/Equivalency
In terms of ged/equivalency, the demographic groups most similar to Arapaho are Black/African American (82.8%, a difference of 0.020%), Immigrants from Laos (82.7%, a difference of 0.030%), Seminole (82.8%, a difference of 0.040%), Immigrants from Fiji (82.7%, a difference of 0.040%), and Cheyenne (82.7%, a difference of 0.050%).
| Demographics | Rating | Rank | GED/Equivalency |
| Immigrants | Jamaica | 0.2 /100 | #270 | Tragic 82.9% |
| U.S. Virgin Islanders | 0.2 /100 | #271 | Tragic 82.9% |
| Barbadians | 0.1 /100 | #272 | Tragic 82.9% |
| Pennsylvania Germans | 0.1 /100 | #273 | Tragic 82.9% |
| Immigrants | Trinidad and Tobago | 0.1 /100 | #274 | Tragic 82.8% |
| Seminole | 0.1 /100 | #275 | Tragic 82.8% |
| Blacks/African Americans | 0.1 /100 | #276 | Tragic 82.8% |
| Arapaho | 0.1 /100 | #277 | Tragic 82.8% |
| Immigrants | Laos | 0.1 /100 | #278 | Tragic 82.7% |
| Immigrants | Fiji | 0.1 /100 | #279 | Tragic 82.7% |
| Cheyenne | 0.1 /100 | #280 | Tragic 82.7% |
| Sioux | 0.1 /100 | #281 | Tragic 82.6% |
| Immigrants | Immigrants | 0.1 /100 | #282 | Tragic 82.6% |
| Indonesians | 0.1 /100 | #283 | Tragic 82.5% |
| Immigrants | Barbados | 0.1 /100 | #284 | Tragic 82.4% |