Immigrants from Micronesia vs White/Caucasian GED/Equivalency
COMPARE
Immigrants from Micronesia
White/Caucasian
GED/Equivalency
GED/Equivalency Comparison
Immigrants from Micronesia
Whites/Caucasians
84.7%
GED/EQUIVALENCY
8.7/ 100
METRIC RATING
216th/ 347
METRIC RANK
86.2%
GED/EQUIVALENCY
72.2/ 100
METRIC RATING
157th/ 347
METRIC RANK
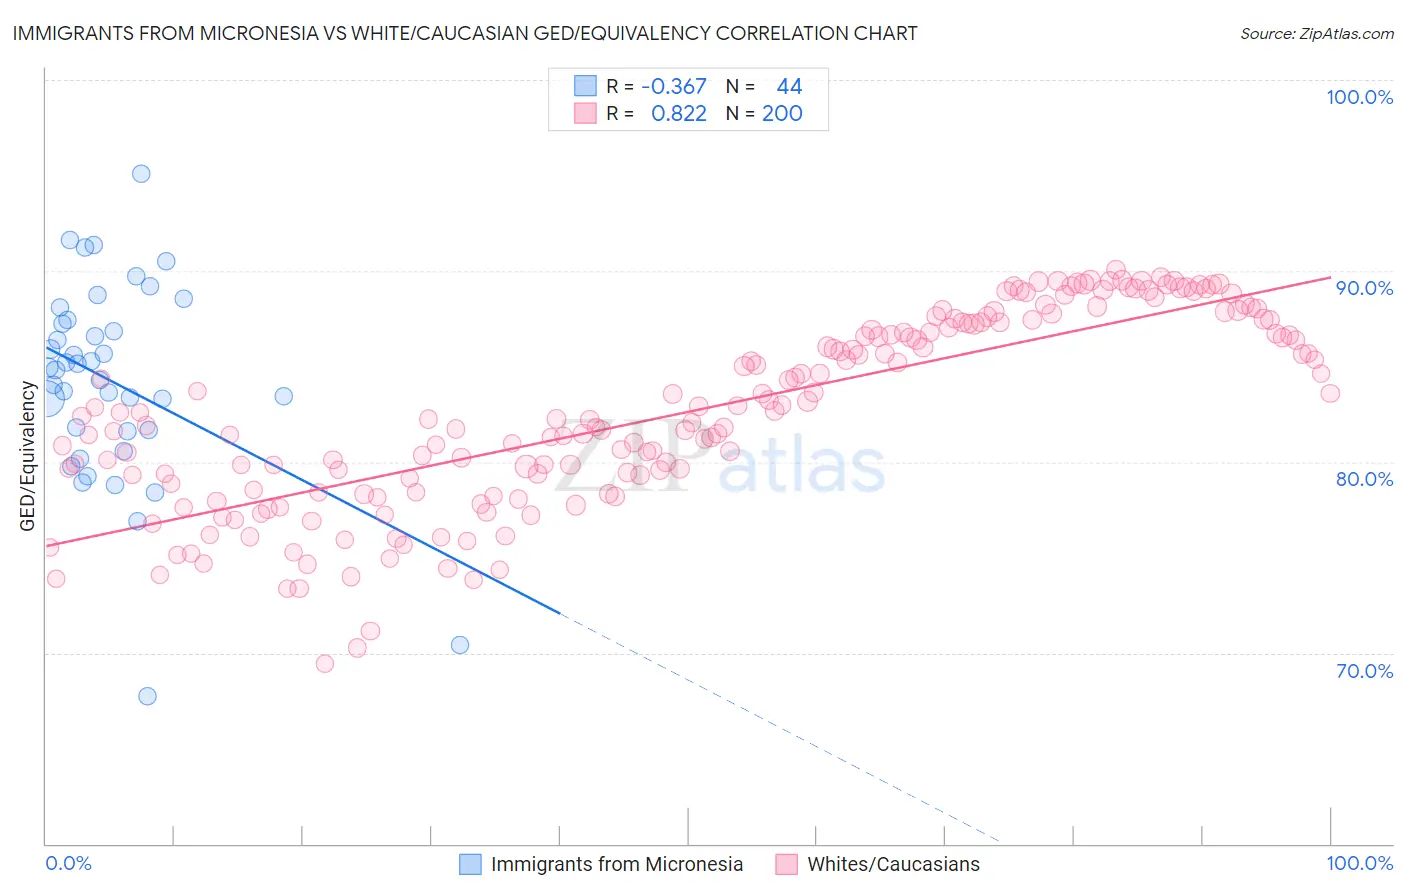
Immigrants from Micronesia vs White/Caucasian GED/Equivalency Correlation Chart
The statistical analysis conducted on geographies consisting of 61,609,499 people shows a mild negative correlation between the proportion of Immigrants from Micronesia and percentage of population with at least ged/equivalency education in the United States with a correlation coefficient (R) of -0.367 and weighted average of 84.7%. Similarly, the statistical analysis conducted on geographies consisting of 585,240,437 people shows a very strong positive correlation between the proportion of Whites/Caucasians and percentage of population with at least ged/equivalency education in the United States with a correlation coefficient (R) of 0.822 and weighted average of 86.2%, a difference of 1.7%.
GED/Equivalency Correlation Summary
| Measurement | Immigrants from Micronesia | White/Caucasian |
| Minimum | 67.7% | 69.4% |
| Maximum | 95.1% | 90.1% |
| Range | 27.3% | 20.6% |
| Mean | 84.2% | 82.6% |
| Median | 84.9% | 82.5% |
| Interquartile 25% (IQ1) | 81.6% | 79.0% |
| Interquartile 75% (IQ3) | 87.3% | 87.3% |
| Interquartile Range (IQR) | 5.7% | 8.3% |
| Standard Deviation (Sample) | 5.2% | 5.0% |
| Standard Deviation (Population) | 5.2% | 4.9% |
Similar Demographics by GED/Equivalency
Demographics Similar to Immigrants from Micronesia by GED/Equivalency
In terms of ged/equivalency, the demographic groups most similar to Immigrants from Micronesia are Nigerian (84.7%, a difference of 0.0%), Alaska Native (84.7%, a difference of 0.0%), Peruvian (84.7%, a difference of 0.030%), Potawatomi (84.7%, a difference of 0.030%), and American (84.7%, a difference of 0.030%).
| Demographics | Rating | Rank | GED/Equivalency |
| Colombians | 12.3 /100 | #209 | Poor 84.9% |
| Immigrants | Cameroon | 12.1 /100 | #210 | Poor 84.9% |
| South Americans | 10.9 /100 | #211 | Poor 84.8% |
| Immigrants | Somalia | 10.6 /100 | #212 | Poor 84.8% |
| Immigrants | Philippines | 10.0 /100 | #213 | Poor 84.8% |
| Osage | 9.5 /100 | #214 | Tragic 84.8% |
| Peruvians | 9.2 /100 | #215 | Tragic 84.7% |
| Immigrants | Micronesia | 8.7 /100 | #216 | Tragic 84.7% |
| Nigerians | 8.6 /100 | #217 | Tragic 84.7% |
| Alaska Natives | 8.6 /100 | #218 | Tragic 84.7% |
| Potawatomi | 8.2 /100 | #219 | Tragic 84.7% |
| Americans | 8.2 /100 | #220 | Tragic 84.7% |
| Taiwanese | 8.1 /100 | #221 | Tragic 84.7% |
| Iroquois | 7.5 /100 | #222 | Tragic 84.6% |
| Immigrants | Uzbekistan | 7.1 /100 | #223 | Tragic 84.6% |
Demographics Similar to Whites/Caucasians by GED/Equivalency
In terms of ged/equivalency, the demographic groups most similar to Whites/Caucasians are German Russian (86.2%, a difference of 0.0%), Immigrants from Kenya (86.2%, a difference of 0.010%), Immigrants from Nepal (86.2%, a difference of 0.030%), Immigrants from Morocco (86.1%, a difference of 0.070%), and Immigrants from Syria (86.1%, a difference of 0.070%).
| Demographics | Rating | Rank | GED/Equivalency |
| Immigrants | Western Asia | 78.8 /100 | #150 | Good 86.3% |
| Immigrants | Bosnia and Herzegovina | 77.9 /100 | #151 | Good 86.3% |
| Brazilians | 77.2 /100 | #152 | Good 86.3% |
| Kenyans | 76.6 /100 | #153 | Good 86.3% |
| Armenians | 76.4 /100 | #154 | Good 86.3% |
| Iraqis | 75.2 /100 | #155 | Good 86.2% |
| Immigrants | Nepal | 73.3 /100 | #156 | Good 86.2% |
| Whites/Caucasians | 72.2 /100 | #157 | Good 86.2% |
| German Russians | 72.1 /100 | #158 | Good 86.2% |
| Immigrants | Kenya | 71.8 /100 | #159 | Good 86.2% |
| Immigrants | Morocco | 69.5 /100 | #160 | Good 86.1% |
| Immigrants | Syria | 69.3 /100 | #161 | Good 86.1% |
| Immigrants | Iraq | 68.1 /100 | #162 | Good 86.1% |
| Ugandans | 66.3 /100 | #163 | Good 86.1% |
| Venezuelans | 65.5 /100 | #164 | Good 86.0% |