Immigrants from Ireland vs Immigrants from Guyana GED/Equivalency
COMPARE
Immigrants from Ireland
Immigrants from Guyana
GED/Equivalency
GED/Equivalency Comparison
Immigrants from Ireland
Immigrants from Guyana
88.6%
GED/EQUIVALENCY
99.8/ 100
METRIC RATING
22nd/ 347
METRIC RANK
81.0%
GED/EQUIVALENCY
0.0/ 100
METRIC RATING
310th/ 347
METRIC RANK
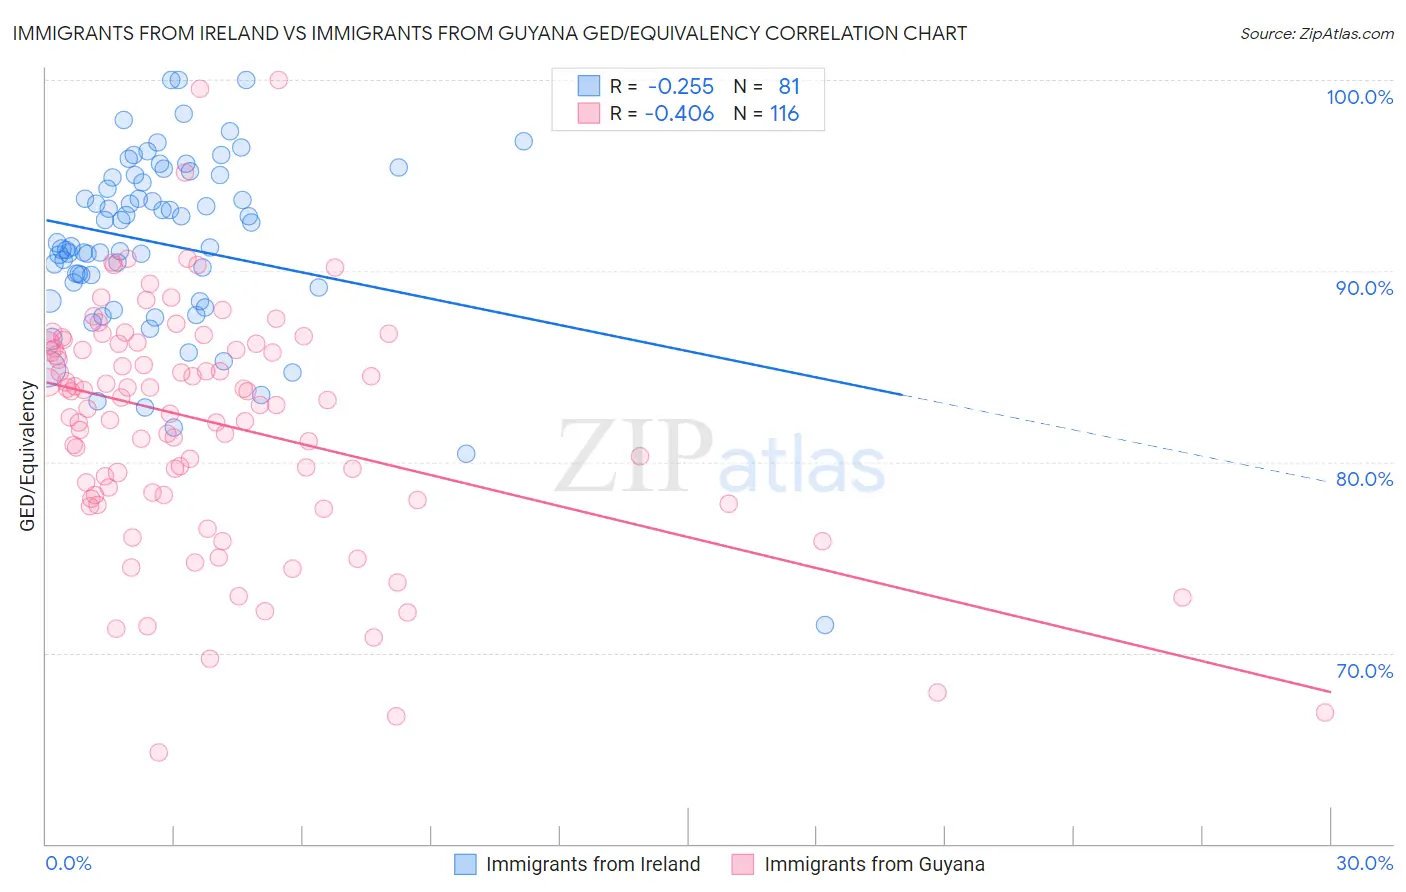
Immigrants from Ireland vs Immigrants from Guyana GED/Equivalency Correlation Chart
The statistical analysis conducted on geographies consisting of 240,784,498 people shows a weak negative correlation between the proportion of Immigrants from Ireland and percentage of population with at least ged/equivalency education in the United States with a correlation coefficient (R) of -0.255 and weighted average of 88.6%. Similarly, the statistical analysis conducted on geographies consisting of 183,746,342 people shows a moderate negative correlation between the proportion of Immigrants from Guyana and percentage of population with at least ged/equivalency education in the United States with a correlation coefficient (R) of -0.406 and weighted average of 81.0%, a difference of 9.5%.
GED/Equivalency Correlation Summary
| Measurement | Immigrants from Ireland | Immigrants from Guyana |
| Minimum | 71.4% | 64.8% |
| Maximum | 100.0% | 100.0% |
| Range | 28.6% | 35.2% |
| Mean | 91.4% | 82.0% |
| Median | 91.3% | 83.1% |
| Interquartile 25% (IQ1) | 88.8% | 78.3% |
| Interquartile 75% (IQ3) | 95.0% | 86.2% |
| Interquartile Range (IQR) | 6.2% | 7.9% |
| Standard Deviation (Sample) | 4.8% | 6.3% |
| Standard Deviation (Population) | 4.8% | 6.2% |
Similar Demographics by GED/Equivalency
Demographics Similar to Immigrants from Ireland by GED/Equivalency
In terms of ged/equivalency, the demographic groups most similar to Immigrants from Ireland are Luxembourger (88.6%, a difference of 0.010%), Maltese (88.6%, a difference of 0.020%), Russian (88.6%, a difference of 0.020%), Slovak (88.6%, a difference of 0.020%), and Estonian (88.6%, a difference of 0.020%).
| Demographics | Rating | Rank | GED/Equivalency |
| Okinawans | 99.9 /100 | #15 | Exceptional 88.9% |
| Immigrants | Taiwan | 99.9 /100 | #16 | Exceptional 88.8% |
| Croatians | 99.9 /100 | #17 | Exceptional 88.8% |
| Slovenes | 99.9 /100 | #18 | Exceptional 88.8% |
| Swedes | 99.9 /100 | #19 | Exceptional 88.8% |
| Maltese | 99.9 /100 | #20 | Exceptional 88.6% |
| Luxembourgers | 99.8 /100 | #21 | Exceptional 88.6% |
| Immigrants | Ireland | 99.8 /100 | #22 | Exceptional 88.6% |
| Russians | 99.8 /100 | #23 | Exceptional 88.6% |
| Slovaks | 99.8 /100 | #24 | Exceptional 88.6% |
| Estonians | 99.8 /100 | #25 | Exceptional 88.6% |
| Immigrants | Australia | 99.8 /100 | #26 | Exceptional 88.6% |
| Immigrants | Lithuania | 99.8 /100 | #27 | Exceptional 88.6% |
| Immigrants | Northern Europe | 99.8 /100 | #28 | Exceptional 88.5% |
| Poles | 99.8 /100 | #29 | Exceptional 88.5% |
Demographics Similar to Immigrants from Guyana by GED/Equivalency
In terms of ged/equivalency, the demographic groups most similar to Immigrants from Guyana are Native/Alaskan (80.9%, a difference of 0.0%), Nicaraguan (80.9%, a difference of 0.040%), Cape Verdean (80.9%, a difference of 0.040%), Immigrants from Ecuador (81.0%, a difference of 0.060%), and Belizean (80.9%, a difference of 0.060%).
| Demographics | Rating | Rank | GED/Equivalency |
| Immigrants | Portugal | 0.0 /100 | #303 | Tragic 81.6% |
| Navajo | 0.0 /100 | #304 | Tragic 81.5% |
| Immigrants | Grenada | 0.0 /100 | #305 | Tragic 81.3% |
| Guyanese | 0.0 /100 | #306 | Tragic 81.3% |
| Immigrants | Dominica | 0.0 /100 | #307 | Tragic 81.1% |
| Puerto Ricans | 0.0 /100 | #308 | Tragic 81.1% |
| Immigrants | Ecuador | 0.0 /100 | #309 | Tragic 81.0% |
| Immigrants | Guyana | 0.0 /100 | #310 | Tragic 81.0% |
| Natives/Alaskans | 0.0 /100 | #311 | Tragic 80.9% |
| Nicaraguans | 0.0 /100 | #312 | Tragic 80.9% |
| Cape Verdeans | 0.0 /100 | #313 | Tragic 80.9% |
| Belizeans | 0.0 /100 | #314 | Tragic 80.9% |
| Apache | 0.0 /100 | #315 | Tragic 80.7% |
| Central American Indians | 0.0 /100 | #316 | Tragic 80.6% |
| Immigrants | Caribbean | 0.0 /100 | #317 | Tragic 80.5% |