Immigrants from Ireland vs Fijian GED/Equivalency
COMPARE
Immigrants from Ireland
Fijian
GED/Equivalency
GED/Equivalency Comparison
Immigrants from Ireland
Fijians
88.6%
GED/EQUIVALENCY
99.8/ 100
METRIC RATING
22nd/ 347
METRIC RANK
81.6%
GED/EQUIVALENCY
0.0/ 100
METRIC RATING
300th/ 347
METRIC RANK
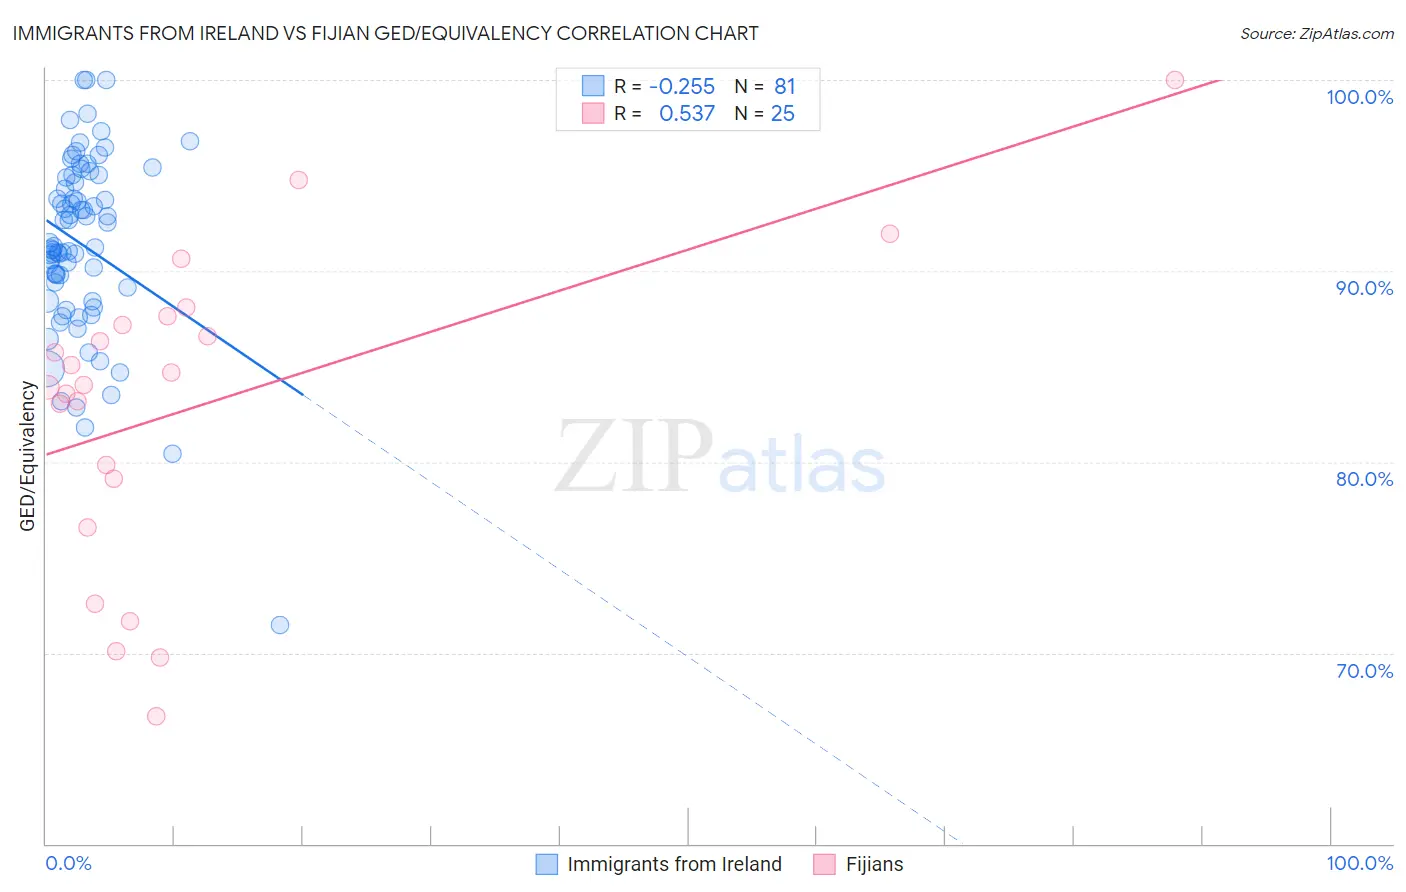
Immigrants from Ireland vs Fijian GED/Equivalency Correlation Chart
The statistical analysis conducted on geographies consisting of 240,784,498 people shows a weak negative correlation between the proportion of Immigrants from Ireland and percentage of population with at least ged/equivalency education in the United States with a correlation coefficient (R) of -0.255 and weighted average of 88.6%. Similarly, the statistical analysis conducted on geographies consisting of 55,948,842 people shows a substantial positive correlation between the proportion of Fijians and percentage of population with at least ged/equivalency education in the United States with a correlation coefficient (R) of 0.537 and weighted average of 81.6%, a difference of 8.5%.
GED/Equivalency Correlation Summary
| Measurement | Immigrants from Ireland | Fijian |
| Minimum | 71.4% | 66.7% |
| Maximum | 100.0% | 100.0% |
| Range | 28.6% | 33.3% |
| Mean | 91.4% | 82.9% |
| Median | 91.3% | 84.0% |
| Interquartile 25% (IQ1) | 88.8% | 77.9% |
| Interquartile 75% (IQ3) | 95.0% | 87.4% |
| Interquartile Range (IQR) | 6.2% | 9.6% |
| Standard Deviation (Sample) | 4.8% | 8.1% |
| Standard Deviation (Population) | 4.8% | 8.0% |
Similar Demographics by GED/Equivalency
Demographics Similar to Immigrants from Ireland by GED/Equivalency
In terms of ged/equivalency, the demographic groups most similar to Immigrants from Ireland are Luxembourger (88.6%, a difference of 0.010%), Maltese (88.6%, a difference of 0.020%), Russian (88.6%, a difference of 0.020%), Slovak (88.6%, a difference of 0.020%), and Estonian (88.6%, a difference of 0.020%).
| Demographics | Rating | Rank | GED/Equivalency |
| Okinawans | 99.9 /100 | #15 | Exceptional 88.9% |
| Immigrants | Taiwan | 99.9 /100 | #16 | Exceptional 88.8% |
| Croatians | 99.9 /100 | #17 | Exceptional 88.8% |
| Slovenes | 99.9 /100 | #18 | Exceptional 88.8% |
| Swedes | 99.9 /100 | #19 | Exceptional 88.8% |
| Maltese | 99.9 /100 | #20 | Exceptional 88.6% |
| Luxembourgers | 99.8 /100 | #21 | Exceptional 88.6% |
| Immigrants | Ireland | 99.8 /100 | #22 | Exceptional 88.6% |
| Russians | 99.8 /100 | #23 | Exceptional 88.6% |
| Slovaks | 99.8 /100 | #24 | Exceptional 88.6% |
| Estonians | 99.8 /100 | #25 | Exceptional 88.6% |
| Immigrants | Australia | 99.8 /100 | #26 | Exceptional 88.6% |
| Immigrants | Lithuania | 99.8 /100 | #27 | Exceptional 88.6% |
| Immigrants | Northern Europe | 99.8 /100 | #28 | Exceptional 88.5% |
| Poles | 99.8 /100 | #29 | Exceptional 88.5% |
Demographics Similar to Fijians by GED/Equivalency
In terms of ged/equivalency, the demographic groups most similar to Fijians are Dutch West Indian (81.6%, a difference of 0.060%), Ecuadorian (81.7%, a difference of 0.070%), Immigrants from Haiti (81.6%, a difference of 0.10%), Immigrants from Portugal (81.6%, a difference of 0.10%), and Ute (81.8%, a difference of 0.20%).
| Demographics | Rating | Rank | GED/Equivalency |
| British West Indians | 0.0 /100 | #293 | Tragic 82.0% |
| Immigrants | St. Vincent and the Grenadines | 0.0 /100 | #294 | Tragic 82.0% |
| Nepalese | 0.0 /100 | #295 | Tragic 81.9% |
| Vietnamese | 0.0 /100 | #296 | Tragic 81.9% |
| Immigrants | Bangladesh | 0.0 /100 | #297 | Tragic 81.9% |
| Ute | 0.0 /100 | #298 | Tragic 81.8% |
| Ecuadorians | 0.0 /100 | #299 | Tragic 81.7% |
| Fijians | 0.0 /100 | #300 | Tragic 81.6% |
| Dutch West Indians | 0.0 /100 | #301 | Tragic 81.6% |
| Immigrants | Haiti | 0.0 /100 | #302 | Tragic 81.6% |
| Immigrants | Portugal | 0.0 /100 | #303 | Tragic 81.6% |
| Navajo | 0.0 /100 | #304 | Tragic 81.5% |
| Immigrants | Grenada | 0.0 /100 | #305 | Tragic 81.3% |
| Guyanese | 0.0 /100 | #306 | Tragic 81.3% |
| Immigrants | Dominica | 0.0 /100 | #307 | Tragic 81.1% |