Immigrants from Colombia vs Belizean GED/Equivalency
COMPARE
Immigrants from Colombia
Belizean
GED/Equivalency
GED/Equivalency Comparison
Immigrants from Colombia
Belizeans
84.4%
GED/EQUIVALENCY
4.5/ 100
METRIC RATING
230th/ 347
METRIC RANK
80.9%
GED/EQUIVALENCY
0.0/ 100
METRIC RATING
314th/ 347
METRIC RANK
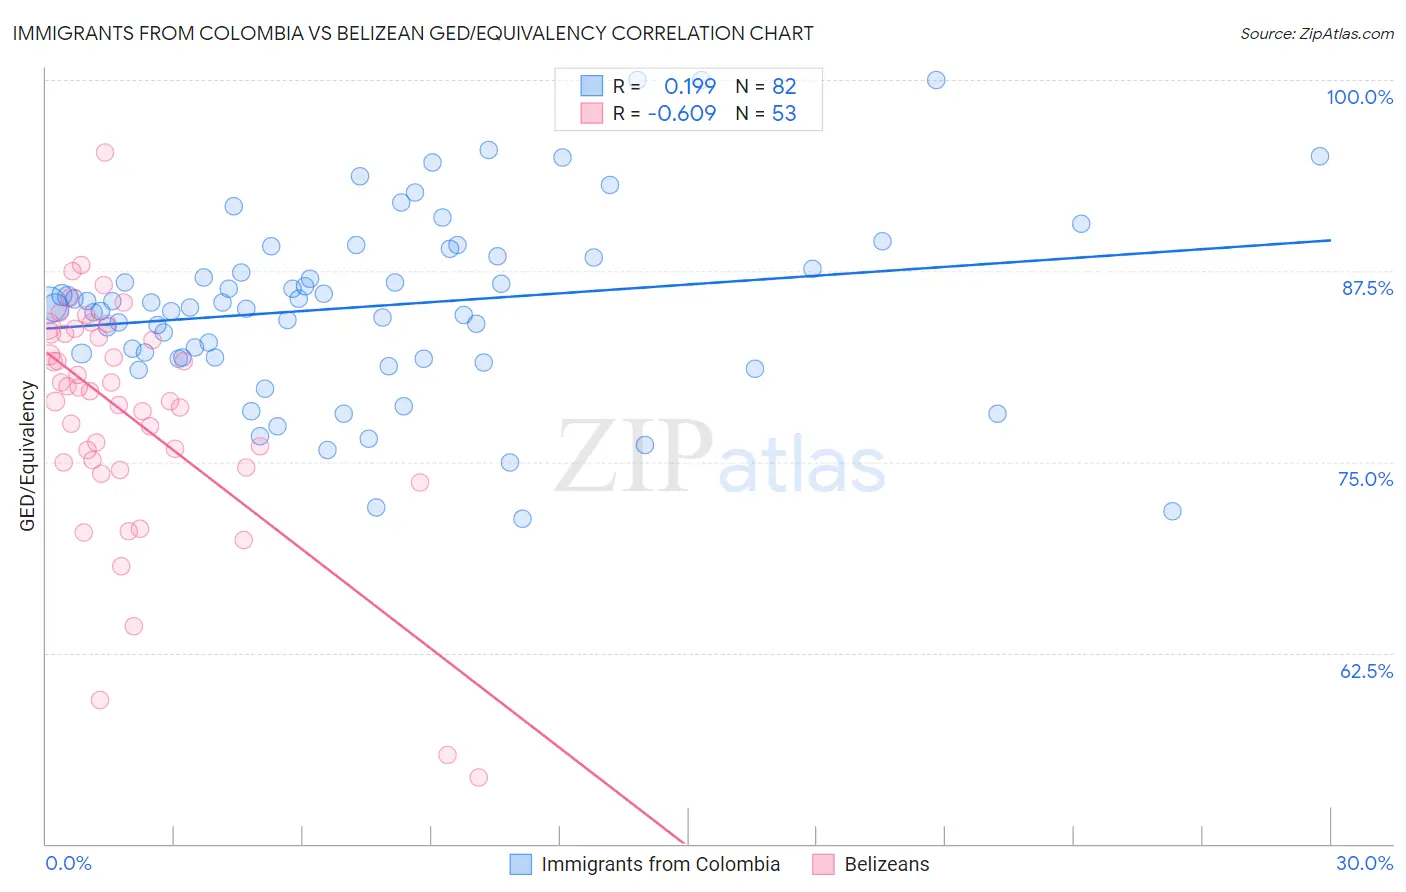
Immigrants from Colombia vs Belizean GED/Equivalency Correlation Chart
The statistical analysis conducted on geographies consisting of 378,643,668 people shows a poor positive correlation between the proportion of Immigrants from Colombia and percentage of population with at least ged/equivalency education in the United States with a correlation coefficient (R) of 0.199 and weighted average of 84.4%. Similarly, the statistical analysis conducted on geographies consisting of 144,224,111 people shows a significant negative correlation between the proportion of Belizeans and percentage of population with at least ged/equivalency education in the United States with a correlation coefficient (R) of -0.609 and weighted average of 80.9%, a difference of 4.3%.
GED/Equivalency Correlation Summary
| Measurement | Immigrants from Colombia | Belizean |
| Minimum | 71.2% | 54.3% |
| Maximum | 100.0% | 95.3% |
| Range | 28.8% | 40.9% |
| Mean | 85.2% | 78.1% |
| Median | 85.2% | 79.6% |
| Interquartile 25% (IQ1) | 81.9% | 74.8% |
| Interquartile 75% (IQ3) | 88.4% | 83.4% |
| Interquartile Range (IQR) | 6.5% | 8.6% |
| Standard Deviation (Sample) | 6.0% | 7.8% |
| Standard Deviation (Population) | 6.0% | 7.7% |
Similar Demographics by GED/Equivalency
Demographics Similar to Immigrants from Colombia by GED/Equivalency
In terms of ged/equivalency, the demographic groups most similar to Immigrants from Colombia are Immigrants from Uruguay (84.4%, a difference of 0.010%), Immigrants from Middle Africa (84.4%, a difference of 0.030%), Immigrants from Liberia (84.4%, a difference of 0.040%), Immigrants from South America (84.4%, a difference of 0.040%), and Immigrants from Panama (84.4%, a difference of 0.050%).
| Demographics | Rating | Rank | GED/Equivalency |
| Immigrants | Uzbekistan | 7.1 /100 | #223 | Tragic 84.6% |
| French American Indians | 6.3 /100 | #224 | Tragic 84.6% |
| Immigrants | Thailand | 5.8 /100 | #225 | Tragic 84.5% |
| Immigrants | Zaire | 5.5 /100 | #226 | Tragic 84.5% |
| Immigrants | Costa Rica | 5.4 /100 | #227 | Tragic 84.5% |
| Immigrants | Liberia | 4.9 /100 | #228 | Tragic 84.4% |
| Immigrants | Uruguay | 4.6 /100 | #229 | Tragic 84.4% |
| Immigrants | Colombia | 4.5 /100 | #230 | Tragic 84.4% |
| Immigrants | Middle Africa | 4.3 /100 | #231 | Tragic 84.4% |
| Immigrants | South America | 4.2 /100 | #232 | Tragic 84.4% |
| Immigrants | Panama | 4.1 /100 | #233 | Tragic 84.4% |
| Immigrants | Nigeria | 3.6 /100 | #234 | Tragic 84.3% |
| Ghanaians | 3.5 /100 | #235 | Tragic 84.3% |
| Immigrants | Eritrea | 3.5 /100 | #236 | Tragic 84.3% |
| Sub-Saharan Africans | 3.0 /100 | #237 | Tragic 84.2% |
Demographics Similar to Belizeans by GED/Equivalency
In terms of ged/equivalency, the demographic groups most similar to Belizeans are Nicaraguan (80.9%, a difference of 0.020%), Cape Verdean (80.9%, a difference of 0.020%), Immigrants from Guyana (81.0%, a difference of 0.060%), Native/Alaskan (80.9%, a difference of 0.060%), and Immigrants from Ecuador (81.0%, a difference of 0.13%).
| Demographics | Rating | Rank | GED/Equivalency |
| Immigrants | Dominica | 0.0 /100 | #307 | Tragic 81.1% |
| Puerto Ricans | 0.0 /100 | #308 | Tragic 81.1% |
| Immigrants | Ecuador | 0.0 /100 | #309 | Tragic 81.0% |
| Immigrants | Guyana | 0.0 /100 | #310 | Tragic 81.0% |
| Natives/Alaskans | 0.0 /100 | #311 | Tragic 80.9% |
| Nicaraguans | 0.0 /100 | #312 | Tragic 80.9% |
| Cape Verdeans | 0.0 /100 | #313 | Tragic 80.9% |
| Belizeans | 0.0 /100 | #314 | Tragic 80.9% |
| Apache | 0.0 /100 | #315 | Tragic 80.7% |
| Central American Indians | 0.0 /100 | #316 | Tragic 80.6% |
| Immigrants | Caribbean | 0.0 /100 | #317 | Tragic 80.5% |
| Yaqui | 0.0 /100 | #318 | Tragic 80.5% |
| Immigrants | Belize | 0.0 /100 | #319 | Tragic 80.5% |
| Immigrants | Cuba | 0.0 /100 | #320 | Tragic 80.2% |
| Yup'ik | 0.0 /100 | #321 | Tragic 80.0% |