Immigrants from Colombia vs Immigrants from Croatia GED/Equivalency
COMPARE
Immigrants from Colombia
Immigrants from Croatia
GED/Equivalency
GED/Equivalency Comparison
Immigrants from Colombia
Immigrants from Croatia
84.4%
GED/EQUIVALENCY
4.5/ 100
METRIC RATING
230th/ 347
METRIC RANK
87.3%
GED/EQUIVALENCY
96.9/ 100
METRIC RATING
98th/ 347
METRIC RANK
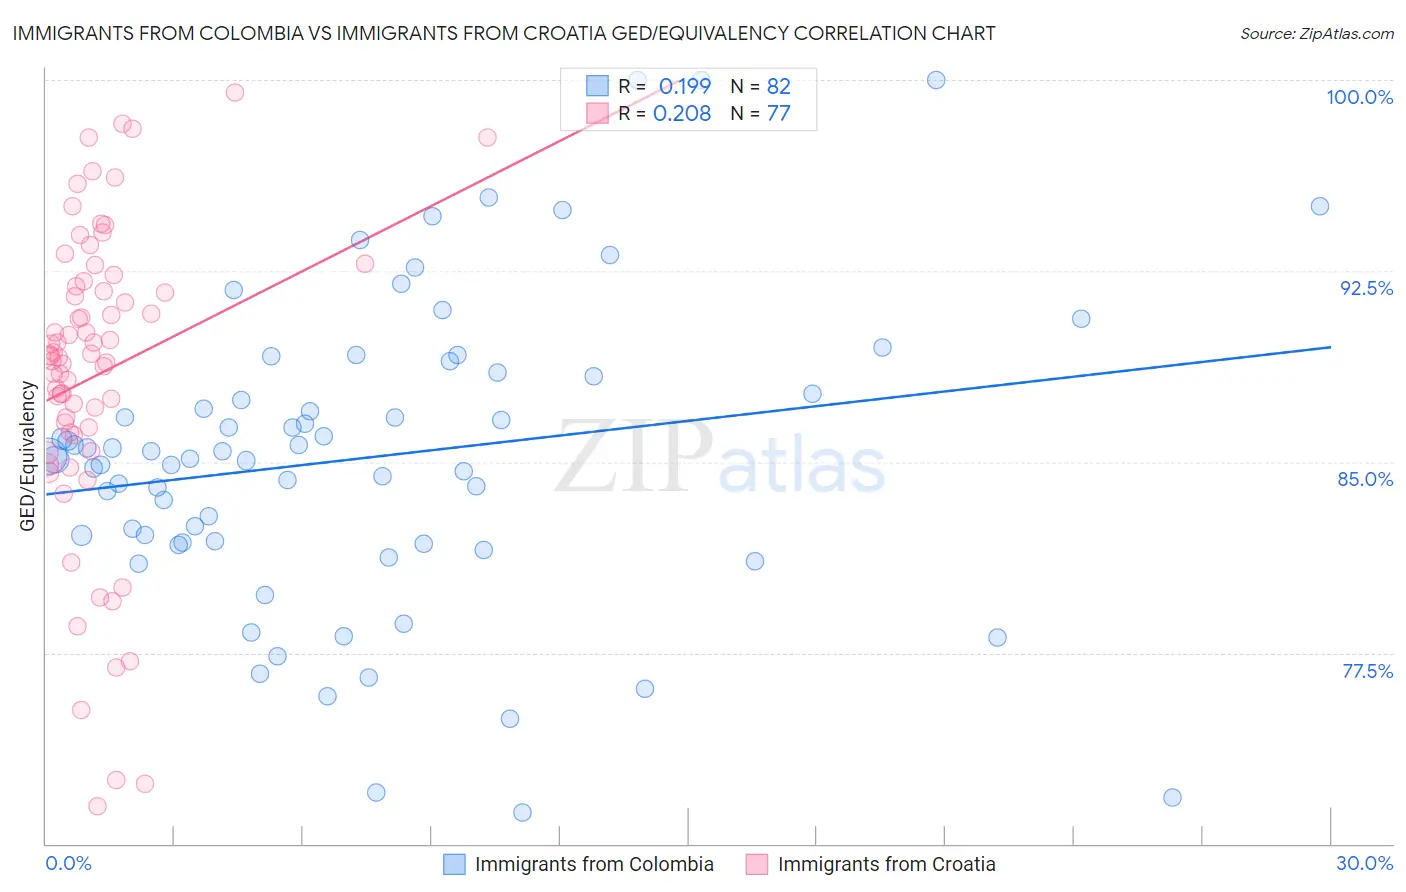
Immigrants from Colombia vs Immigrants from Croatia GED/Equivalency Correlation Chart
The statistical analysis conducted on geographies consisting of 378,643,668 people shows a poor positive correlation between the proportion of Immigrants from Colombia and percentage of population with at least ged/equivalency education in the United States with a correlation coefficient (R) of 0.199 and weighted average of 84.4%. Similarly, the statistical analysis conducted on geographies consisting of 132,577,989 people shows a weak positive correlation between the proportion of Immigrants from Croatia and percentage of population with at least ged/equivalency education in the United States with a correlation coefficient (R) of 0.208 and weighted average of 87.3%, a difference of 3.4%.
GED/Equivalency Correlation Summary
| Measurement | Immigrants from Colombia | Immigrants from Croatia |
| Minimum | 71.2% | 71.5% |
| Maximum | 100.0% | 99.5% |
| Range | 28.8% | 28.0% |
| Mean | 85.2% | 88.4% |
| Median | 85.2% | 89.2% |
| Interquartile 25% (IQ1) | 81.9% | 86.1% |
| Interquartile 75% (IQ3) | 88.4% | 92.0% |
| Interquartile Range (IQR) | 6.5% | 5.9% |
| Standard Deviation (Sample) | 6.0% | 6.0% |
| Standard Deviation (Population) | 6.0% | 6.0% |
Similar Demographics by GED/Equivalency
Demographics Similar to Immigrants from Colombia by GED/Equivalency
In terms of ged/equivalency, the demographic groups most similar to Immigrants from Colombia are Immigrants from Uruguay (84.4%, a difference of 0.010%), Immigrants from Middle Africa (84.4%, a difference of 0.030%), Immigrants from Liberia (84.4%, a difference of 0.040%), Immigrants from South America (84.4%, a difference of 0.040%), and Immigrants from Panama (84.4%, a difference of 0.050%).
| Demographics | Rating | Rank | GED/Equivalency |
| Immigrants | Uzbekistan | 7.1 /100 | #223 | Tragic 84.6% |
| French American Indians | 6.3 /100 | #224 | Tragic 84.6% |
| Immigrants | Thailand | 5.8 /100 | #225 | Tragic 84.5% |
| Immigrants | Zaire | 5.5 /100 | #226 | Tragic 84.5% |
| Immigrants | Costa Rica | 5.4 /100 | #227 | Tragic 84.5% |
| Immigrants | Liberia | 4.9 /100 | #228 | Tragic 84.4% |
| Immigrants | Uruguay | 4.6 /100 | #229 | Tragic 84.4% |
| Immigrants | Colombia | 4.5 /100 | #230 | Tragic 84.4% |
| Immigrants | Middle Africa | 4.3 /100 | #231 | Tragic 84.4% |
| Immigrants | South America | 4.2 /100 | #232 | Tragic 84.4% |
| Immigrants | Panama | 4.1 /100 | #233 | Tragic 84.4% |
| Immigrants | Nigeria | 3.6 /100 | #234 | Tragic 84.3% |
| Ghanaians | 3.5 /100 | #235 | Tragic 84.3% |
| Immigrants | Eritrea | 3.5 /100 | #236 | Tragic 84.3% |
| Sub-Saharan Africans | 3.0 /100 | #237 | Tragic 84.2% |
Demographics Similar to Immigrants from Croatia by GED/Equivalency
In terms of ged/equivalency, the demographic groups most similar to Immigrants from Croatia are Immigrants from Belarus (87.3%, a difference of 0.010%), Palestinian (87.3%, a difference of 0.030%), Syrian (87.2%, a difference of 0.060%), Immigrants from Western Europe (87.3%, a difference of 0.070%), and Lebanese (87.2%, a difference of 0.11%).
| Demographics | Rating | Rank | GED/Equivalency |
| Immigrants | Eastern Asia | 97.9 /100 | #91 | Exceptional 87.4% |
| Israelis | 97.8 /100 | #92 | Exceptional 87.4% |
| Immigrants | North Macedonia | 97.8 /100 | #93 | Exceptional 87.4% |
| Immigrants | Russia | 97.8 /100 | #94 | Exceptional 87.4% |
| Immigrants | Greece | 97.7 /100 | #95 | Exceptional 87.4% |
| Czechoslovakians | 97.6 /100 | #96 | Exceptional 87.4% |
| Immigrants | Western Europe | 97.3 /100 | #97 | Exceptional 87.3% |
| Immigrants | Croatia | 96.9 /100 | #98 | Exceptional 87.3% |
| Immigrants | Belarus | 96.9 /100 | #99 | Exceptional 87.3% |
| Palestinians | 96.8 /100 | #100 | Exceptional 87.3% |
| Syrians | 96.6 /100 | #101 | Exceptional 87.2% |
| Lebanese | 96.2 /100 | #102 | Exceptional 87.2% |
| Jordanians | 96.1 /100 | #103 | Exceptional 87.2% |
| Immigrants | Hungary | 96.0 /100 | #104 | Exceptional 87.2% |
| Indians (Asian) | 95.9 /100 | #105 | Exceptional 87.1% |