Area Code 304 Map & Demographics
Area Code 304 Map
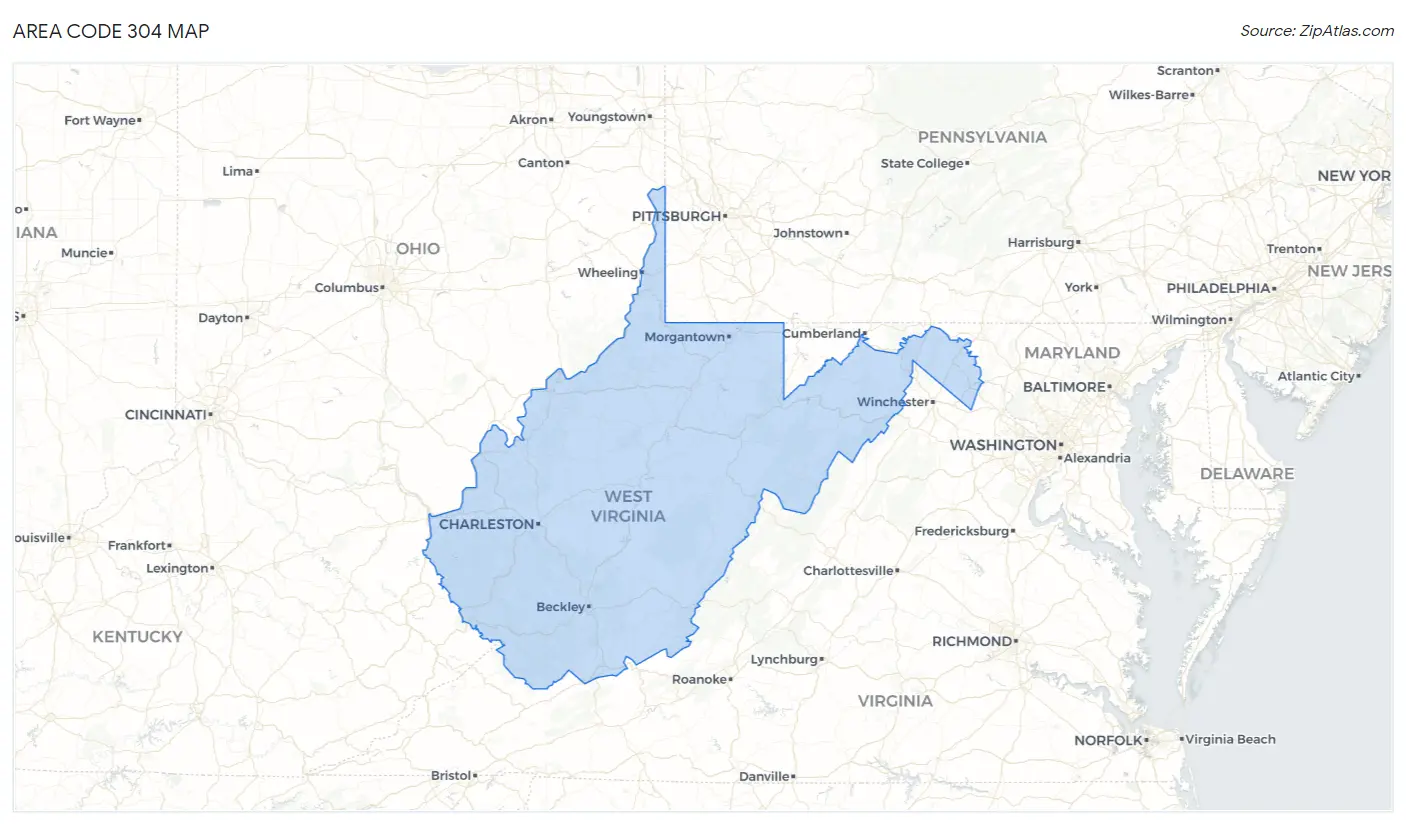
Area Code 304 Overview
$26,671
PER CAPITA INCOME
$67,501
AVG FAMILY INCOME
$54,001
AVG HOUSEHOLD INCOME
33.7%
WAGE / INCOME GAP [ % ]
66.3¢/ $1
WAGE / INCOME GAP [ $ ]
$10,300
FAMILY INCOME DEFICIT
268.66
INEQUALITY / GINI INDEX
1,784,945
TOTAL POPULATION
890,521
MALE POPULATION
894,424
FEMALE POPULATION
99.56
MALES / 100 FEMALES
100.44
FEMALES / 100 MALES
45.8
MEDIAN AGE
3.2
AVG FAMILY SIZE
2.6
AVG HOUSEHOLD SIZE
687,990
LABOR FORCE [ PEOPLE ]
46.8%
PERCENT IN LABOR FORCE
11.1%
UNEMPLOYMENT RATE
Nearby Area Codes
Income in Area Code 304
Income Overview in Area Code 304
Per Capita Income in Area Code 304 is $26,671, while median incomes of families and households are $67,501 and $54,001 respectively.
| Characteristic | Number | Measure |
| Per Capita Income | 1,784,945 | $26,671 |
| Median Family Income | 447,446 | $67,501 |
| Mean Family Income | 447,446 | $48,270,368 |
| Median Household Income | 712,741 | $54,001 |
| Mean Household Income | 712,741 | $43,352,204 |
| Income Deficit | 447,446 | $10,300 |
| Wage / Income Gap (%) | 1,784,945 | 33.74% |
| Wage / Income Gap ($) | 1,784,945 | 66.26¢ per $1 |
| Gini / Inequality Index | 1,784,945 | 268.66 |
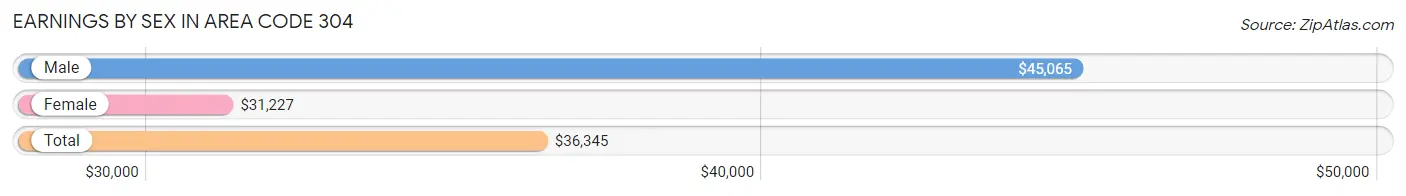
Earnings by Sex in Area Code 304
Average Earnings in Area Code 304 are $36,345, $45,065 for men and $31,227 for women, a difference of 30.7%.
| Sex | Number | Average Earnings |
| Male | 434,909 (53.0%) | $45,065 |
| Female | 385,241 (47.0%) | $31,227 |
| Total | 820,150 (100.0%) | $36,345 |
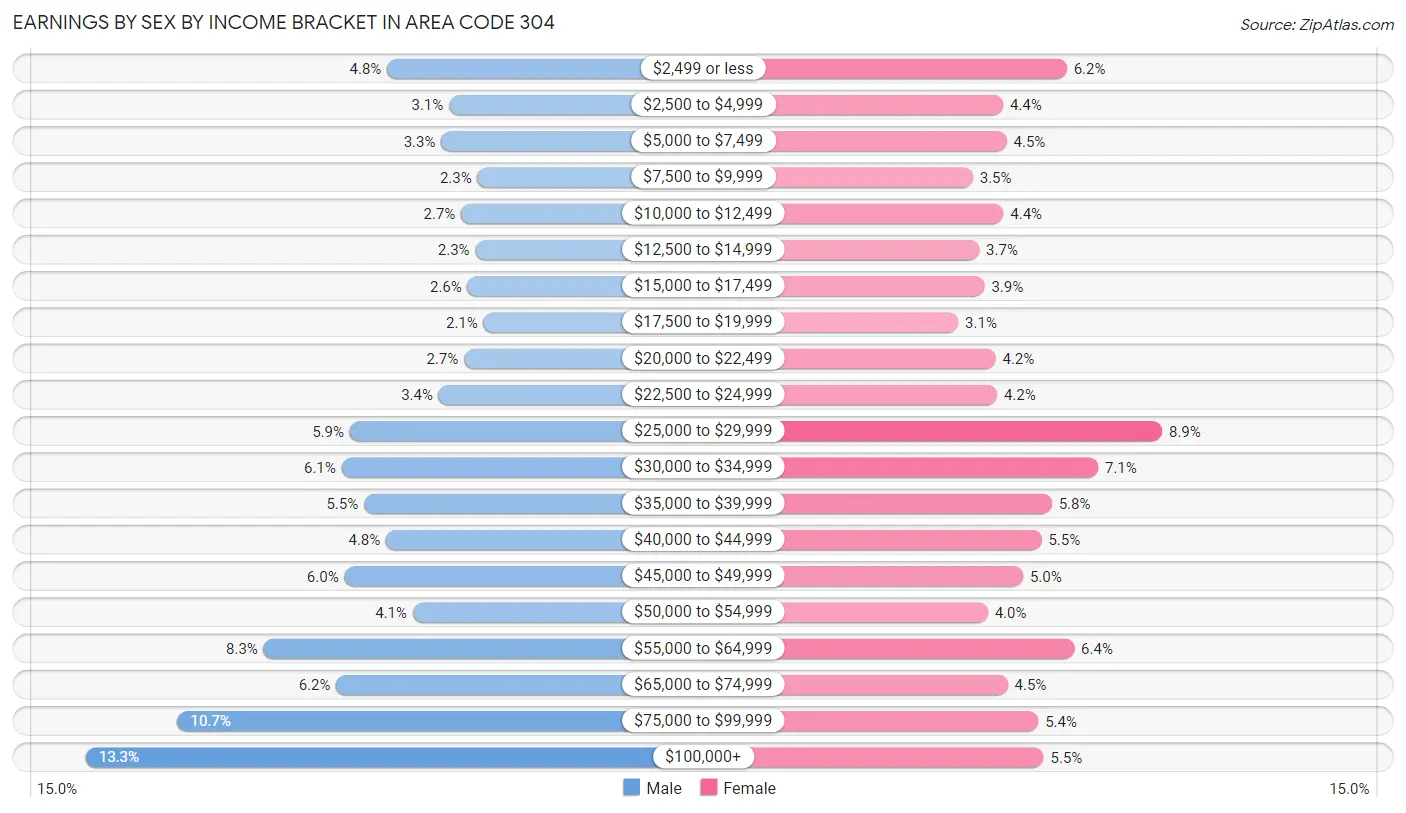
Earnings by Sex by Income Bracket in Area Code 304
The most common earnings brackets in Area Code 304 are $100,000+ for men (57,736 | 13.3%) and $25,000 to $29,999 for women (34,123 | 8.9%).
| Income | Male | Female |
| $2,499 or less | 20,931 (4.8%) | 23,823 (6.2%) |
| $2,500 to $4,999 | 13,341 (3.1%) | 16,910 (4.4%) |
| $5,000 to $7,499 | 14,289 (3.3%) | 17,284 (4.5%) |
| $7,500 to $9,999 | 9,861 (2.3%) | 13,647 (3.5%) |
| $10,000 to $12,499 | 11,869 (2.7%) | 16,939 (4.4%) |
| $12,500 to $14,999 | 10,147 (2.3%) | 14,318 (3.7%) |
| $15,000 to $17,499 | 11,076 (2.5%) | 14,927 (3.9%) |
| $17,500 to $19,999 | 9,130 (2.1%) | 12,068 (3.1%) |
| $20,000 to $22,499 | 11,516 (2.6%) | 16,119 (4.2%) |
| $22,500 to $24,999 | 14,626 (3.4%) | 16,247 (4.2%) |
| $25,000 to $29,999 | 25,489 (5.9%) | 34,123 (8.9%) |
| $30,000 to $34,999 | 26,499 (6.1%) | 27,205 (7.1%) |
| $35,000 to $39,999 | 23,761 (5.5%) | 22,206 (5.8%) |
| $40,000 to $44,999 | 21,032 (4.8%) | 21,076 (5.5%) |
| $45,000 to $49,999 | 26,150 (6.0%) | 19,053 (5.0%) |
| $50,000 to $54,999 | 17,793 (4.1%) | 15,259 (4.0%) |
| $55,000 to $64,999 | 36,014 (8.3%) | 24,607 (6.4%) |
| $65,000 to $74,999 | 27,121 (6.2%) | 17,394 (4.5%) |
| $75,000 to $99,999 | 46,528 (10.7%) | 20,741 (5.4%) |
| $100,000+ | 57,736 (13.3%) | 21,295 (5.5%) |
| Total | 434,909 (100.0%) | 385,241 (100.0%) |
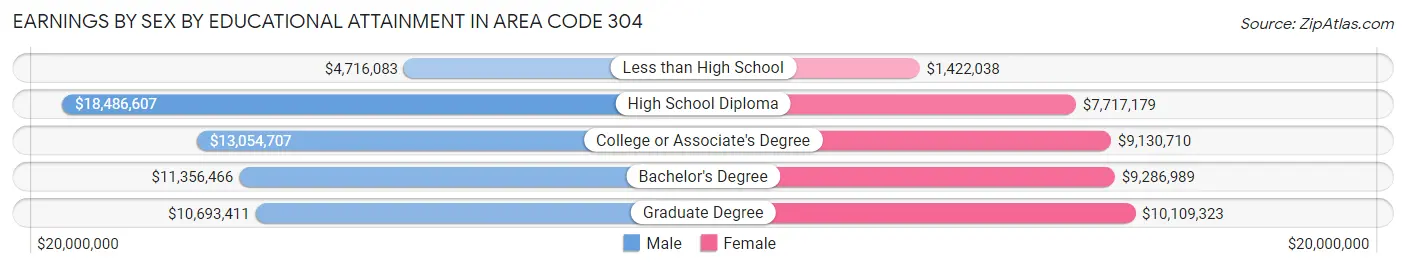
Earnings by Sex by Educational Attainment in Area Code 304
Average earnings in Area Code 304 are $23,188,230 for men and $14,523,020 for women, a difference of 37.4%. Men with an educational attainment of high school diploma enjoy the highest average annual earnings of $18,486,607, while those with less than high school education earn the least with $4,716,083. Women with an educational attainment of graduate degree earn the most with the average annual earnings of $10,109,323, while those with less than high school education have the smallest earnings of $1,422,038.
| Educational Attainment | Male Income | Female Income |
| Less than High School | $4,716,083 | $1,422,038 |
| High School Diploma | $18,486,607 | $7,717,179 |
| College or Associate's Degree | $13,054,707 | $9,130,710 |
| Bachelor's Degree | $11,356,466 | $9,286,989 |
| Graduate Degree | $10,693,411 | $10,109,323 |
| Total | $23,188,230 | $14,523,020 |
Family Income in Area Code 304
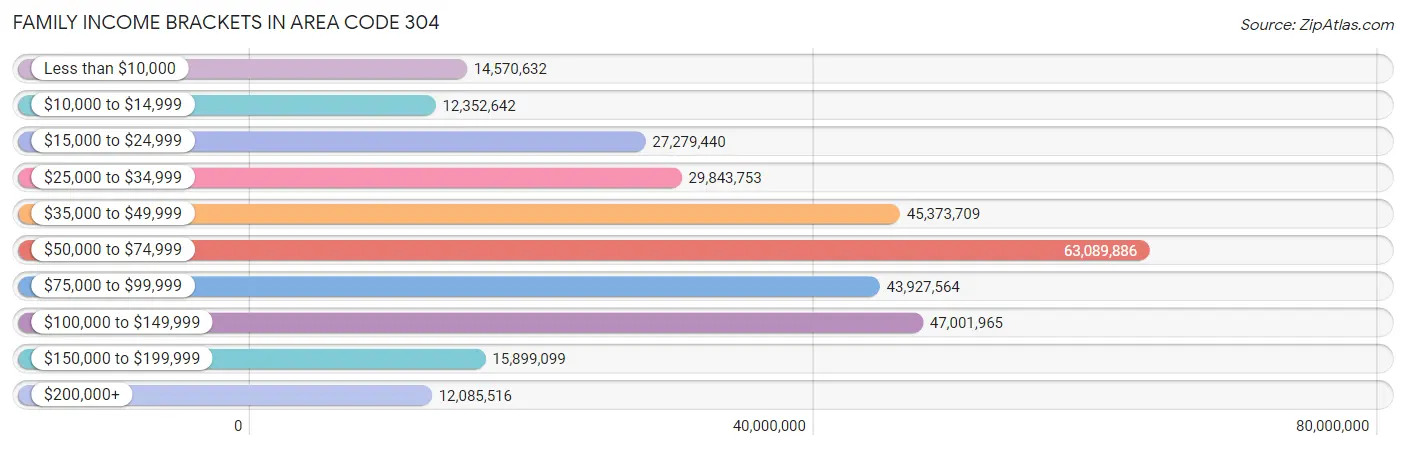
Family Income Brackets in Area Code 304
According to the Area Code 304 family income data, there are 63,089,886 families falling into the $50,000 to $74,999 income range, which is the most common income bracket and makes up 14,100.0% of all families. Conversely, the $200,000+ income bracket is the least frequent group with only 12,085,516 families (2,701.0%) belonging to this category.
| Income Bracket | # Families | % Families |
| Less than $10,000 | 14,570,632 | 3,256.4% |
| $10,000 to $14,999 | 12,352,642 | 2,760.7% |
| $15,000 to $24,999 | 27,279,440 | 6,096.7% |
| $25,000 to $34,999 | 29,843,753 | 6,669.8% |
| $35,000 to $49,999 | 45,373,709 | 10,140.6% |
| $50,000 to $74,999 | 63,089,886 | 14,100.0% |
| $75,000 to $99,999 | 43,927,564 | 9,817.4% |
| $100,000 to $149,999 | 47,001,965 | 10,504.5% |
| $150,000 to $199,999 | 15,899,099 | 3,553.3% |
| $200,000+ | 12,085,516 | 2,701.0% |
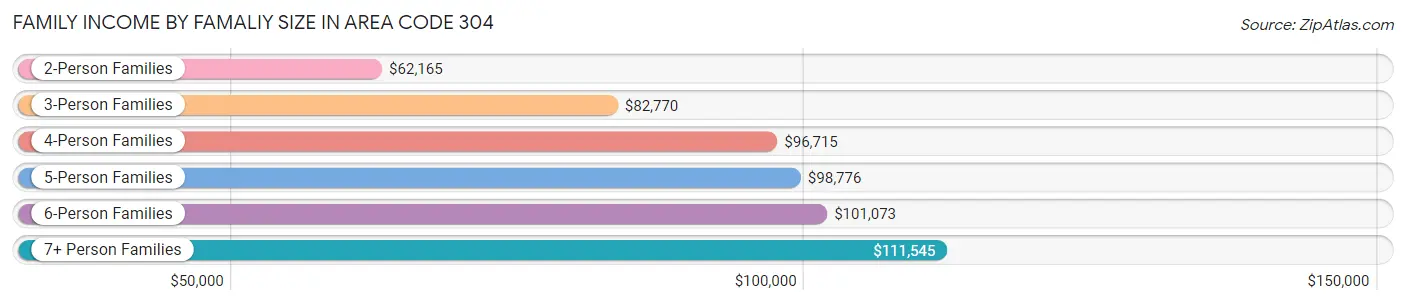
Family Income by Famaliy Size in Area Code 304
7+ person families (4,705 | 1.1%) account for the highest median family income in Area Code 304 with $111,545 per family, while 2-person families (239,800 | 53.6%) have the highest median income of $31,083 per family member.
| Income Bracket | # Families | Median Income |
| 2-Person Families | 239,800 (53.6%) | $62,165 |
| 3-Person Families | 100,184 (22.4%) | $82,770 |
| 4-Person Families | 67,476 (15.1%) | $96,715 |
| 5-Person Families | 26,561 (5.9%) | $98,776 |
| 6-Person Families | 8,720 (1.9%) | $101,073 |
| 7+ Person Families | 4,705 (1.1%) | $111,545 |
| Total | 447,446 (100.0%) | $67,501 |
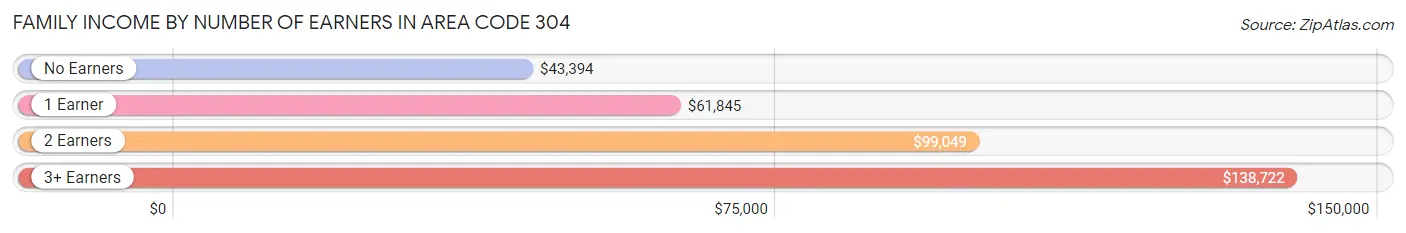
Family Income by Number of Earners in Area Code 304
The median family income in Area Code 304 is $67,501, with families comprising 3+ earners (31,886) having the highest median family income of $138,722, while families with no earners (106,512) have the lowest median family income of $43,394, accounting for 7.1% and 23.8% of families, respectively.
| Number of Earners | # Families | Median Income |
| No Earners | 106,512 (23.8%) | $43,394 |
| 1 Earner | 150,339 (33.6%) | $61,845 |
| 2 Earners | 158,709 (35.5%) | $99,049 |
| 3+ Earners | 31,886 (7.1%) | $138,722 |
| Total | 447,446 (100.0%) | $67,501 |
Household Income in Area Code 304
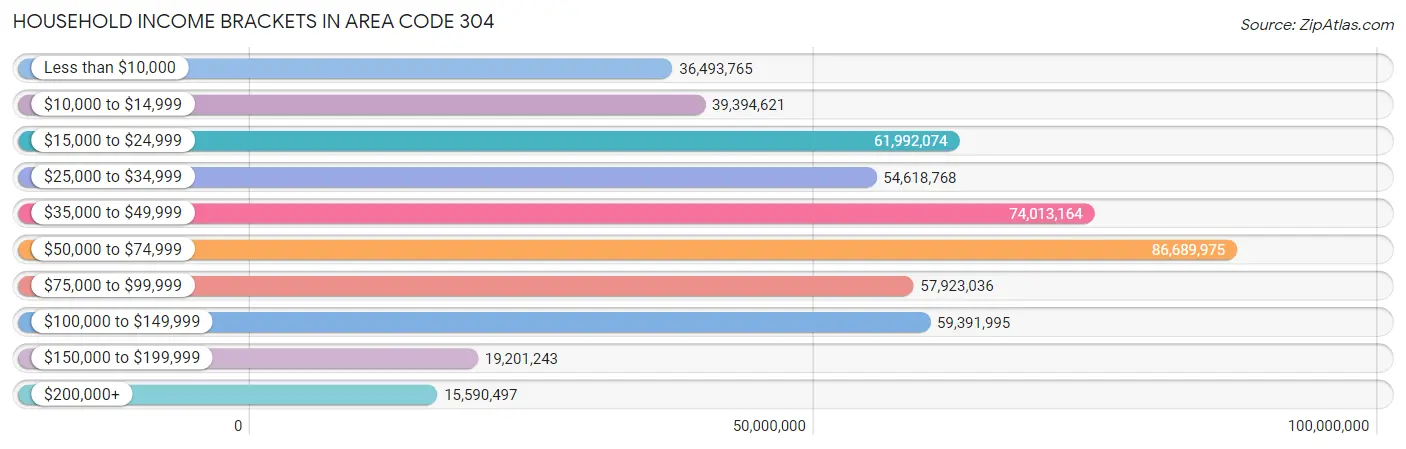
Household Income Brackets in Area Code 304
With 86,689,975 households falling in the category, the $50,000 to $74,999 income range is the most frequent in Area Code 304, accounting for 12,162.9% of all households. In contrast, only 15,590,497 households (2,187.4%) fall into the $200,000+ income bracket, making it the least populous group.
| Income Bracket | # Households | % Households |
| Less than $10,000 | 36,493,765 | 5,120.2% |
| $10,000 to $14,999 | 39,394,621 | 5,527.2% |
| $15,000 to $24,999 | 61,992,074 | 8,697.7% |
| $25,000 to $34,999 | 54,618,768 | 7,663.2% |
| $35,000 to $49,999 | 74,013,164 | 10,384.3% |
| $50,000 to $74,999 | 86,689,975 | 12,162.9% |
| $75,000 to $99,999 | 57,923,036 | 8,126.8% |
| $100,000 to $149,999 | 59,391,995 | 8,332.9% |
| $150,000 to $199,999 | 19,201,243 | 2,694.0% |
| $200,000+ | 15,590,497 | 2,187.4% |
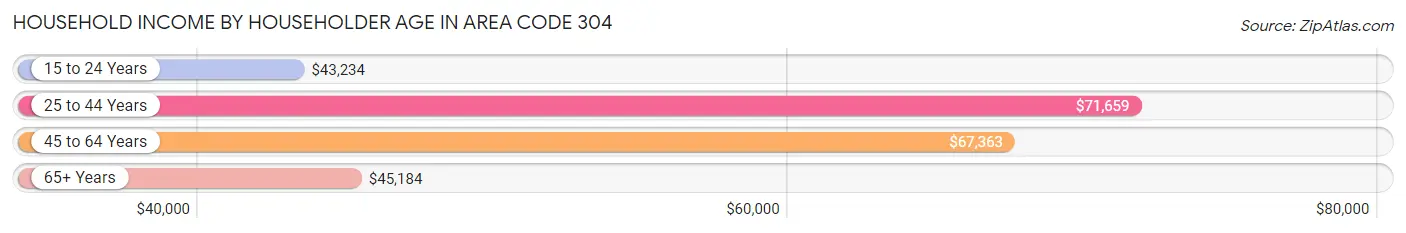
Household Income by Householder Age in Area Code 304
The median household income in Area Code 304 is $54,001, with the highest median household income of $71,659 found in the 25 to 44 years age bracket for the primary householder. A total of 189,494 households (26.6%) fall into this category. Meanwhile, the 15 to 24 years age bracket for the primary householder has the lowest median household income of $43,234, with 28,062 households (3.9%) in this group.
| Income Bracket | # Households | Median Income |
| 15 to 24 Years | 28,062 (3.9%) | $43,234 |
| 25 to 44 Years | 189,494 (26.6%) | $71,659 |
| 45 to 64 Years | 262,809 (36.9%) | $67,363 |
| 65+ Years | 232,376 (32.6%) | $45,184 |
| Total | 712,741 (100.0%) | $54,001 |
Poverty in Area Code 304
Income Below Poverty by Sex and Age in Area Code 304
With 15.2% poverty level for males and 18.4% for females among the residents of Area Code 304, under 5 year old males and 18 to 24 year old females are the most vulnerable to poverty, with 10,947 males (24.8%) and 21,110 females (30.8%) in their respective age groups living below the poverty level.
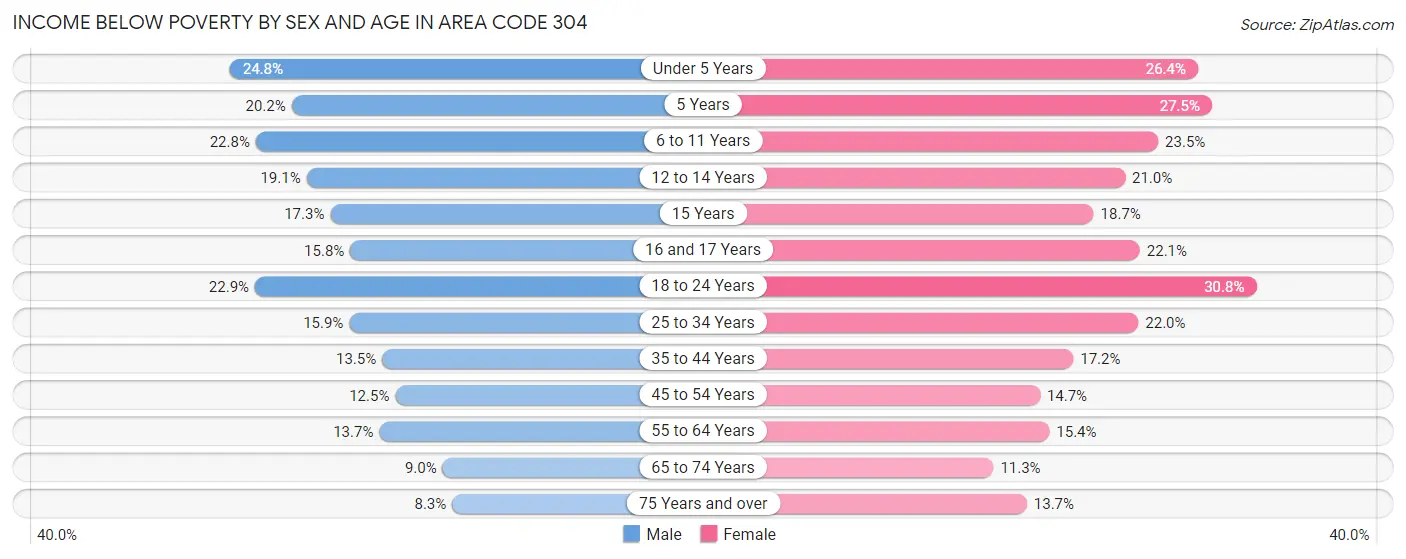
| Age Bracket | Male | Female |
| Under 5 Years | 10,947 (24.8%) | 11,246 (26.4%) |
| 5 Years | 1,859 (20.2%) | 2,378 (27.5%) |
| 6 to 11 Years | 14,211 (22.8%) | 13,486 (23.5%) |
| 12 to 14 Years | 5,926 (19.1%) | 6,317 (21.0%) |
| 15 Years | 1,881 (17.3%) | 1,873 (18.7%) |
| 16 and 17 Years | 3,480 (15.8%) | 4,626 (22.1%) |
| 18 to 24 Years | 17,102 (22.9%) | 21,110 (30.8%) |
| 25 to 34 Years | 16,342 (15.9%) | 22,055 (22.0%) |
| 35 to 44 Years | 13,968 (13.5%) | 17,864 (17.2%) |
| 45 to 54 Years | 14,064 (12.5%) | 16,340 (14.7%) |
| 55 to 64 Years | 16,551 (13.7%) | 19,458 (15.4%) |
| 65 to 74 Years | 9,263 (9.0%) | 12,640 (11.3%) |
| 75 Years and over | 4,898 (8.3%) | 10,964 (13.7%) |
| Total | 130,492 (15.2%) | 160,357 (18.4%) |
Income Above Poverty by Sex and Age in Area Code 304
According to the poverty statistics in Area Code 304, males aged 75 years and over and females aged 65 to 74 years are the age groups that are most secure financially, with 91.7% of males and 88.7% of females in these age groups living above the poverty line.
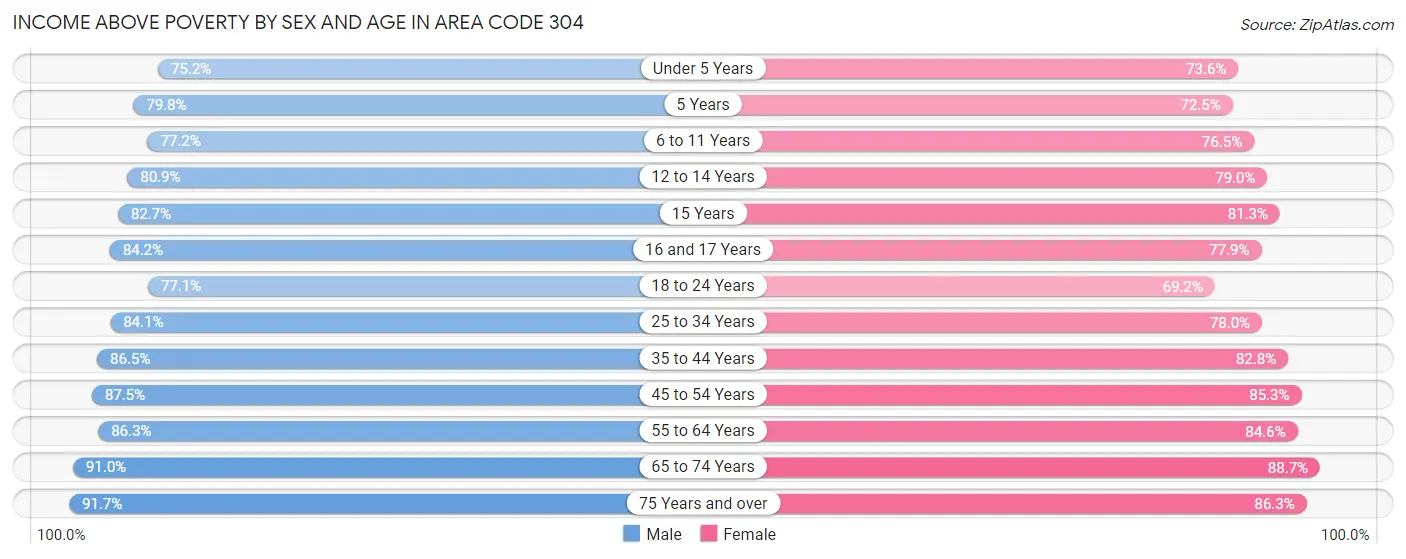
| Age Bracket | Male | Female |
| Under 5 Years | 33,271 (75.2%) | 31,312 (73.6%) |
| 5 Years | 7,355 (79.8%) | 6,278 (72.5%) |
| 6 to 11 Years | 48,000 (77.2%) | 43,917 (76.5%) |
| 12 to 14 Years | 25,141 (80.9%) | 23,720 (79.0%) |
| 15 Years | 8,988 (82.7%) | 8,144 (81.3%) |
| 16 and 17 Years | 18,506 (84.2%) | 16,277 (77.9%) |
| 18 to 24 Years | 57,594 (77.1%) | 47,488 (69.2%) |
| 25 to 34 Years | 86,446 (84.1%) | 78,084 (78.0%) |
| 35 to 44 Years | 89,834 (86.5%) | 86,035 (82.8%) |
| 45 to 54 Years | 98,650 (87.5%) | 94,762 (85.3%) |
| 55 to 64 Years | 104,520 (86.3%) | 106,797 (84.6%) |
| 65 to 74 Years | 94,024 (91.0%) | 99,655 (88.7%) |
| 75 Years and over | 54,396 (91.7%) | 68,855 (86.3%) |
| Total | 726,725 (84.8%) | 711,324 (81.6%) |
Income Below Poverty Among Married-Couple Families in Area Code 304
The poverty statistics for married-couple families in Area Code 304 show that 6.6% or 22,149 of the total 336,756 families live below the poverty line. Families with 5 or more children have the highest poverty rate of 28.9%, comprising of 487 families. On the other hand, families with no children have the lowest poverty rate of 4.9%, which includes 10,657 families.
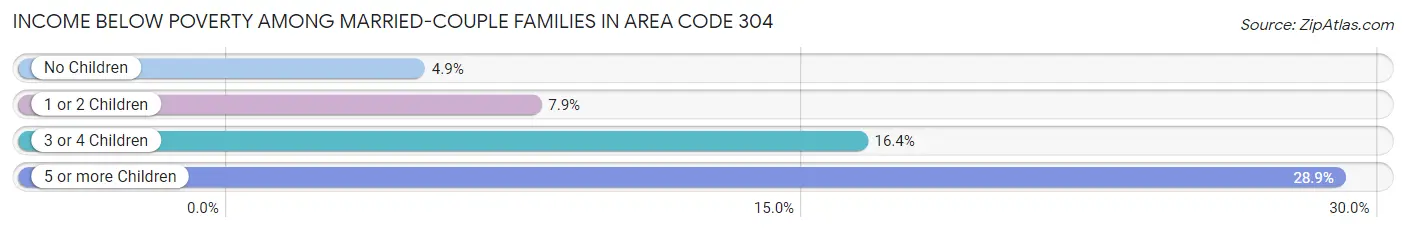
| Children | Above Poverty | Below Poverty |
| No Children | 207,605 (95.1%) | 10,657 (4.9%) |
| 1 or 2 Children | 88,601 (92.1%) | 7,619 (7.9%) |
| 3 or 4 Children | 17,204 (83.6%) | 3,386 (16.4%) |
| 5 or more Children | 1,197 (71.1%) | 487 (28.9%) |
| Total | 314,607 (93.4%) | 22,149 (6.6%) |
Income Below Poverty Among Single-Parent Households in Area Code 304
According to the poverty data in Area Code 304, 20.7% or 7,095 single-father households and 31.7% or 24,227 single-mother households are living below the poverty line. Among single-father households, those with 3 or 4 children have the highest poverty rate, with 1,034 households (43.7%) experiencing poverty. Likewise, among single-mother households, those with 5 or more children have the highest poverty rate, with 390 households (62.8%) falling below the poverty line.
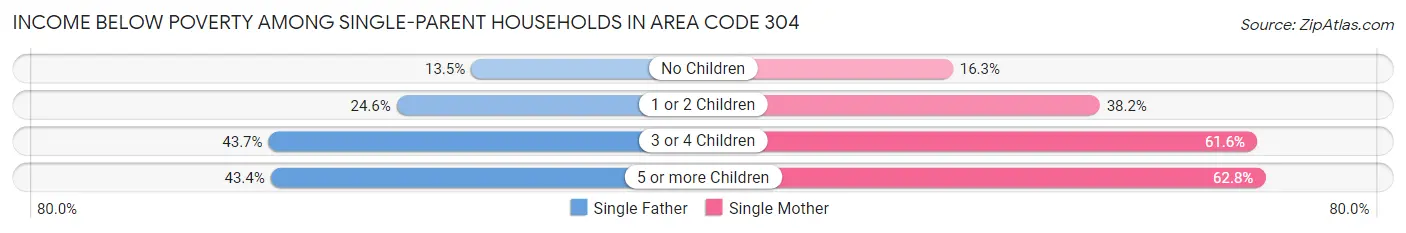
| Children | Single Father | Single Mother |
| No Children | 2,214 (13.5%) | 4,961 (16.3%) |
| 1 or 2 Children | 3,772 (24.6%) | 14,628 (38.2%) |
| 3 or 4 Children | 1,034 (43.7%) | 4,248 (61.6%) |
| 5 or more Children | 75 (43.3%) | 390 (62.8%) |
| Total | 7,095 (20.7%) | 24,227 (31.7%) |
Income Below Poverty Among Married-Couple vs Single-Parent Households in Area Code 304
The poverty data for Area Code 304 shows that 22,149 of the married-couple family households (6.6%) and 31,322 of the single-parent households (28.3%) are living below the poverty level. Within the married-couple family households, those with 5 or more children have the highest poverty rate, with 487 households (28.9%) falling below the poverty line. Among the single-parent households, those with 5 or more children have the highest poverty rate, with 465 household (58.6%) living below poverty.
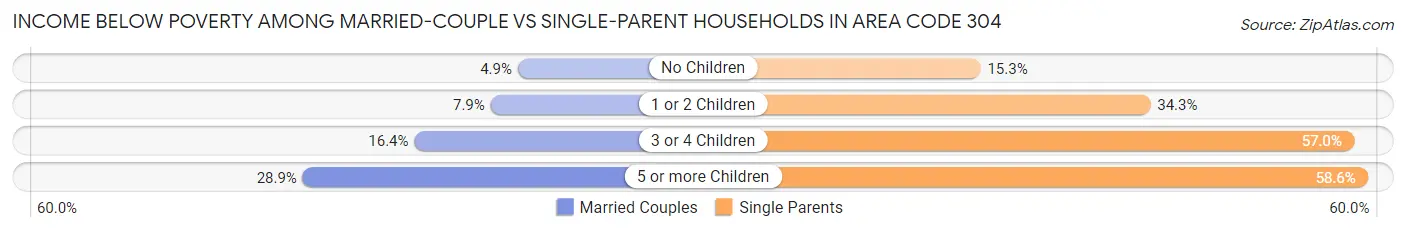
| Children | Married-Couple Families | Single-Parent Households |
| No Children | 10,657 (4.9%) | 7,175 (15.3%) |
| 1 or 2 Children | 7,619 (7.9%) | 18,400 (34.3%) |
| 3 or 4 Children | 3,386 (16.4%) | 5,282 (57.0%) |
| 5 or more Children | 487 (28.9%) | 465 (58.6%) |
| Total | 22,149 (6.6%) | 31,322 (28.3%) |
Race in Area Code 304
The most populous races in Area Code 304 are White / Caucasian (1,631,693 | 91.4%), Two or more Races (66,572 | 3.7%), and Black / African American (61,227 | 3.4%).
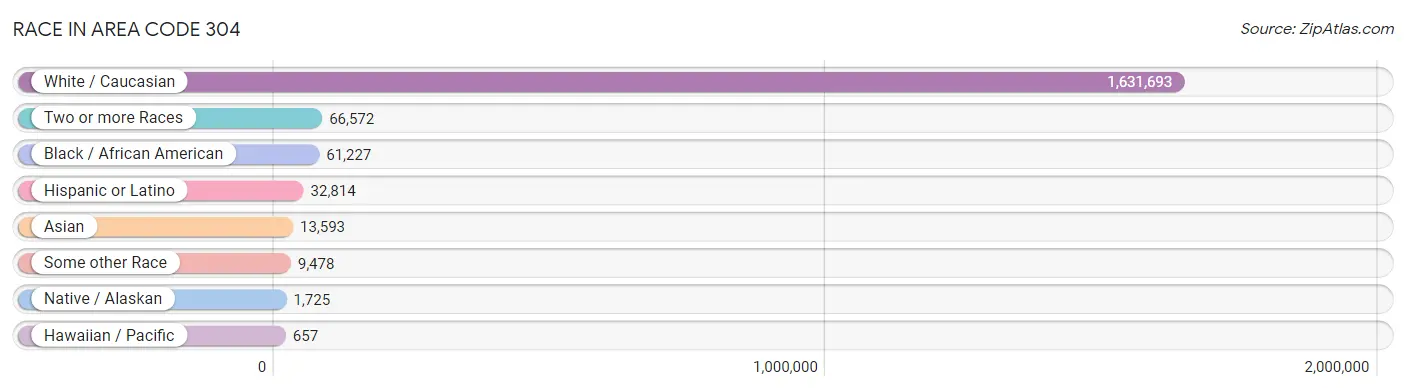
| Race | # Population | % Population |
| Asian | 13,593 | 0.8% |
| Black / African American | 61,227 | 3.4% |
| Hawaiian / Pacific | 657 | 0.0% |
| Hispanic or Latino | 32,814 | 1.8% |
| Native / Alaskan | 1,725 | 0.1% |
| White / Caucasian | 1,631,693 | 91.4% |
| Two or more Races | 66,572 | 3.7% |
| Some other Race | 9,478 | 0.5% |
| Total | 1,784,945 | 100.0% |
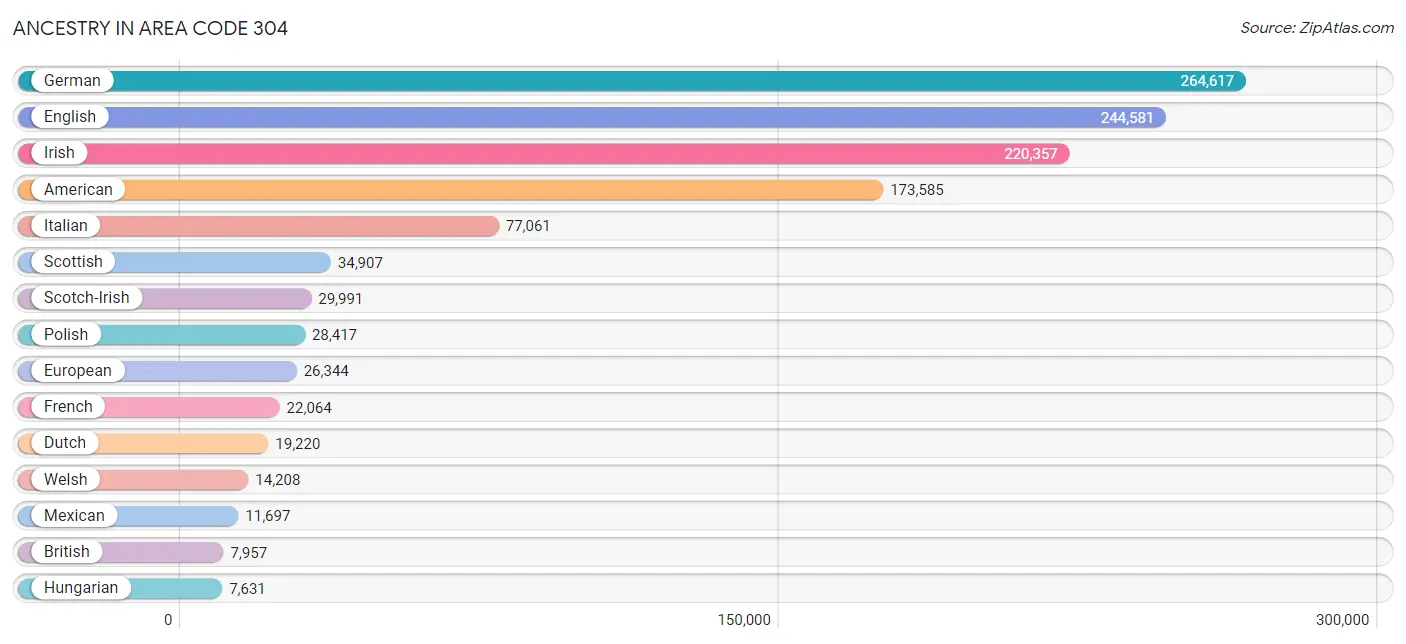
Ancestry in Area Code 304
The most populous ancestries reported in Area Code 304 are German (264,617 | 14.8%), English (244,581 | 13.7%), Irish (220,357 | 12.3%), American (173,585 | 9.7%), and Italian (77,061 | 4.3%), together accounting for 54.9% of all Area Code 304 residents.
| Ancestry | # Population | % Population |
| African | 3,670 | 0.2% |
| Alaska Native | 10 | 0.0% |
| Albanian | 57 | 0.0% |
| Aleut | 46 | 0.0% |
| Alsatian | 42 | 0.0% |
| American | 173,585 | 9.7% |
| Apache | 351 | 0.0% |
| Arab | 6,731 | 0.4% |
| Arapaho | 14 | 0.0% |
| Argentinean | 296 | 0.0% |
| Armenian | 114 | 0.0% |
| Assyrian / Chaldean / Syriac | 26 | 0.0% |
| Australian | 216 | 0.0% |
| Austrian | 1,681 | 0.1% |
| Bahamian | 113 | 0.0% |
| Basque | 21 | 0.0% |
| Belgian | 1,102 | 0.1% |
| Belizean | 7 | 0.0% |
| Bhutanese | 2,230 | 0.1% |
| Blackfeet | 1,211 | 0.1% |
| Bolivian | 71 | 0.0% |
| Brazilian | 507 | 0.0% |
| British | 7,957 | 0.4% |
| British West Indian | 48 | 0.0% |
| Bulgarian | 47 | 0.0% |
| Burmese | 1,876 | 0.1% |
| Cajun | 245 | 0.0% |
| Canadian | 1,197 | 0.1% |
| Carpatho Rusyn | 10 | 0.0% |
| Celtic | 752 | 0.0% |
| Central American | 4,503 | 0.3% |
| Central American Indian | 246 | 0.0% |
| Cherokee | 5,189 | 0.3% |
| Chickasaw | 43 | 0.0% |
| Chilean | 192 | 0.0% |
| Chinese | 27 | 0.0% |
| Chippewa | 61 | 0.0% |
| Choctaw | 191 | 0.0% |
| Colombian | 485 | 0.0% |
| Costa Rican | 312 | 0.0% |
| Cree | 19 | 0.0% |
| Creek | 37 | 0.0% |
| Croatian | 2,140 | 0.1% |
| Crow | 18 | 0.0% |
| Cuban | 1,187 | 0.1% |
| Cypriot | 28 | 0.0% |
| Czech | 2,730 | 0.2% |
| Czechoslovakian | 1,018 | 0.1% |
| Danish | 1,223 | 0.1% |
| Delaware | 76 | 0.0% |
| Dominican | 924 | 0.1% |
| Dutch | 19,220 | 1.1% |
| Dutch West Indian | 44 | 0.0% |
| Eastern European | 3,518 | 0.2% |
| Ecuadorian | 294 | 0.0% |
| Egyptian | 709 | 0.0% |
| English | 244,581 | 13.7% |
| Estonian | 39 | 0.0% |
| Ethiopian | 244 | 0.0% |
| European | 26,344 | 1.5% |
| Fijian | 10 | 0.0% |
| Filipino | 140 | 0.0% |
| Finnish | 1,139 | 0.1% |
| French | 22,064 | 1.2% |
| French American Indian | 37 | 0.0% |
| French Canadian | 2,290 | 0.1% |
| German | 264,617 | 14.8% |
| German Russian | 8 | 0.0% |
| Ghanaian | 165 | 0.0% |
| Greek | 4,246 | 0.2% |
| Guamanian / Chamorro | 140 | 0.0% |
| Guatemalan | 1,270 | 0.1% |
| Guyanese | 373 | 0.0% |
| Haitian | 264 | 0.0% |
| Honduran | 745 | 0.0% |
| Houma | 5 | 0.0% |
| Hungarian | 7,631 | 0.4% |
| Icelander | 89 | 0.0% |
| Indian (Asian) | 3,218 | 0.2% |
| Indonesian | 231 | 0.0% |
| Inupiat | 195 | 0.0% |
| Iranian | 723 | 0.0% |
| Iraqi | 90 | 0.0% |
| Irish | 220,357 | 12.3% |
| Iroquois | 125 | 0.0% |
| Israeli | 69 | 0.0% |
| Italian | 77,061 | 4.3% |
| Jamaican | 1,340 | 0.1% |
| Japanese | 42 | 0.0% |
| Jordanian | 68 | 0.0% |
| Kenyan | 94 | 0.0% |
| Korean | 4,906 | 0.3% |
| Laotian | 95 | 0.0% |
| Latvian | 81 | 0.0% |
| Lebanese | 3,004 | 0.2% |
| Liberian | 90 | 0.0% |
| Lithuanian | 1,200 | 0.1% |
| Lumbee | 21 | 0.0% |
| Luxembourger | 88 | 0.0% |
| Macedonian | 24 | 0.0% |
| Malaysian | 58 | 0.0% |
| Maltese | 14 | 0.0% |
| Menominee | 2 | 0.0% |
| Mexican | 11,697 | 0.7% |
| Mexican American Indian | 247 | 0.0% |
| Mongolian | 10 | 0.0% |
| Moroccan | 249 | 0.0% |
| Native Hawaiian | 759 | 0.0% |
| Navajo | 226 | 0.0% |
| Nicaraguan | 138 | 0.0% |
| Nigerian | 1,069 | 0.1% |
| Northern European | 1,848 | 0.1% |
| Norwegian | 4,969 | 0.3% |
| Pakistani | 644 | 0.0% |
| Palestinian | 441 | 0.0% |
| Panamanian | 338 | 0.0% |
| Pennsylvania German | 534 | 0.0% |
| Peruvian | 553 | 0.0% |
| Pima | 10 | 0.0% |
| Polish | 28,417 | 1.6% |
| Portuguese | 885 | 0.1% |
| Potawatomi | 13 | 0.0% |
| Pueblo | 43 | 0.0% |
| Puerto Rican | 5,885 | 0.3% |
| Romanian | 998 | 0.1% |
| Russian | 4,709 | 0.3% |
| Salvadoran | 1,700 | 0.1% |
| Samoan | 325 | 0.0% |
| Scandinavian | 3,466 | 0.2% |
| Scotch-Irish | 29,991 | 1.7% |
| Scottish | 34,907 | 2.0% |
| Seminole | 98 | 0.0% |
| Serbian | 947 | 0.1% |
| Shoshone | 9 | 0.0% |
| Sioux | 392 | 0.0% |
| Slavic | 954 | 0.1% |
| Slovak | 3,798 | 0.2% |
| Slovene | 582 | 0.0% |
| South African | 229 | 0.0% |
| South American | 2,320 | 0.1% |
| South American Indian | 15 | 0.0% |
| Spaniard | 1,473 | 0.1% |
| Spanish | 1,838 | 0.1% |
| Spanish American | 88 | 0.0% |
| Spanish American Indian | 17 | 0.0% |
| Sri Lankan | 1,864 | 0.1% |
| Subsaharan African | 6,229 | 0.4% |
| Sudanese | 186 | 0.0% |
| Swedish | 5,895 | 0.3% |
| Swiss | 2,951 | 0.2% |
| Syrian | 1,036 | 0.1% |
| Thai | 3,905 | 0.2% |
| Tlingit-Haida | 1 | 0.0% |
| Trinidadian and Tobagonian | 113 | 0.0% |
| Turkish | 300 | 0.0% |
| U.S. Virgin Islander | 18 | 0.0% |
| Ukrainian | 1,426 | 0.1% |
| Uruguayan | 61 | 0.0% |
| Ute | 8 | 0.0% |
| Venezuelan | 345 | 0.0% |
| Vietnamese | 131 | 0.0% |
| Welsh | 14,208 | 0.8% |
| West Indian | 168 | 0.0% |
| Yaqui | 25 | 0.0% |
| Yugoslavian | 478 | 0.0% |
| Zimbabwean | 99 | 0.0% | View All 166 Rows |
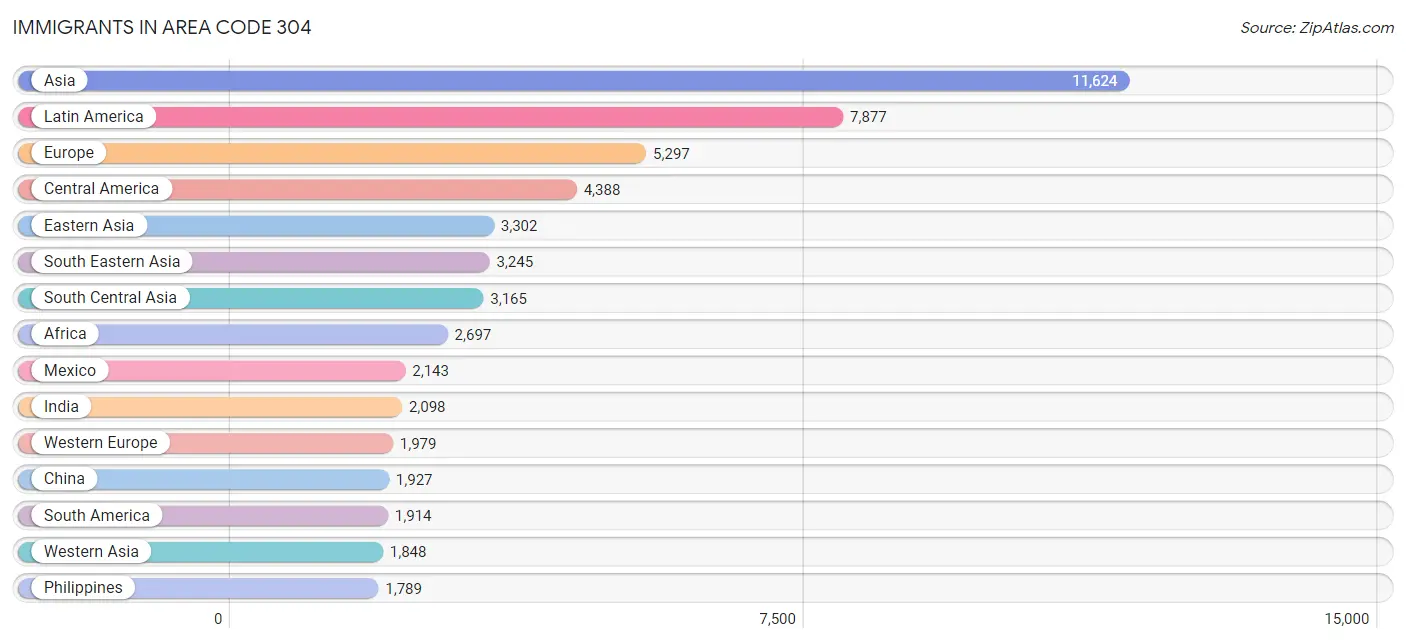
Immigrants in Area Code 304
The most numerous immigrant groups reported in Area Code 304 came from Asia (11,624 | 0.6%), Latin America (7,877 | 0.4%), Europe (5,297 | 0.3%), Central America (4,388 | 0.3%), and Eastern Asia (3,302 | 0.2%), together accounting for 1.8% of all Area Code 304 residents.
| Immigration Origin | # Population | % Population |
| Africa | 2,697 | 0.2% |
| Albania | 21 | 0.0% |
| Argentina | 173 | 0.0% |
| Asia | 11,624 | 0.6% |
| Australia | 148 | 0.0% |
| Austria | 36 | 0.0% |
| Bahamas | 116 | 0.0% |
| Bangladesh | 183 | 0.0% |
| Belarus | 106 | 0.0% |
| Belgium | 38 | 0.0% |
| Bolivia | 40 | 0.0% |
| Bosnia and Herzegovina | 7 | 0.0% |
| Brazil | 291 | 0.0% |
| Bulgaria | 11 | 0.0% |
| Cambodia | 26 | 0.0% |
| Cameroon | 102 | 0.0% |
| Canada | 1,233 | 0.1% |
| Caribbean | 1,575 | 0.1% |
| Central America | 4,388 | 0.3% |
| Chile | 92 | 0.0% |
| China | 1,927 | 0.1% |
| Colombia | 235 | 0.0% |
| Congo | 16 | 0.0% |
| Costa Rica | 224 | 0.0% |
| Croatia | 16 | 0.0% |
| Cuba | 216 | 0.0% |
| Czechoslovakia | 119 | 0.0% |
| Denmark | 33 | 0.0% |
| Dominican Republic | 504 | 0.0% |
| Eastern Africa | 600 | 0.0% |
| Eastern Asia | 3,302 | 0.2% |
| Eastern Europe | 1,016 | 0.1% |
| Ecuador | 178 | 0.0% |
| Egypt | 510 | 0.0% |
| El Salvador | 737 | 0.0% |
| England | 665 | 0.0% |
| Eritrea | 98 | 0.0% |
| Ethiopia | 178 | 0.0% |
| Europe | 5,297 | 0.3% |
| France | 168 | 0.0% |
| Germany | 1,585 | 0.1% |
| Ghana | 168 | 0.0% |
| Greece | 104 | 0.0% |
| Guatemala | 758 | 0.0% |
| Guyana | 349 | 0.0% |
| Haiti | 50 | 0.0% |
| Honduras | 381 | 0.0% |
| Hong Kong | 52 | 0.0% |
| Hungary | 31 | 0.0% |
| India | 2,098 | 0.1% |
| Indonesia | 91 | 0.0% |
| Iran | 196 | 0.0% |
| Iraq | 77 | 0.0% |
| Ireland | 28 | 0.0% |
| Israel | 58 | 0.0% |
| Italy | 604 | 0.0% |
| Jamaica | 479 | 0.0% |
| Japan | 642 | 0.0% |
| Jordan | 57 | 0.0% |
| Kazakhstan | 43 | 0.0% |
| Kenya | 63 | 0.0% |
| Korea | 733 | 0.0% |
| Kuwait | 571 | 0.0% |
| Laos | 30 | 0.0% |
| Latin America | 7,877 | 0.4% |
| Latvia | 15 | 0.0% |
| Lebanon | 163 | 0.0% |
| Liberia | 89 | 0.0% |
| Lithuania | 9 | 0.0% |
| Malaysia | 45 | 0.0% |
| Mexico | 2,143 | 0.1% |
| Middle Africa | 118 | 0.0% |
| Moldova | 40 | 0.0% |
| Morocco | 80 | 0.0% |
| Nepal | 195 | 0.0% |
| Netherlands | 133 | 0.0% |
| Nicaragua | 37 | 0.0% |
| Nigeria | 705 | 0.0% |
| Northern Africa | 734 | 0.0% |
| Northern Europe | 1,348 | 0.1% |
| Oceania | 182 | 0.0% |
| Pakistan | 326 | 0.0% |
| Panama | 108 | 0.0% |
| Peru | 294 | 0.0% |
| Philippines | 1,789 | 0.1% |
| Poland | 82 | 0.0% |
| Portugal | 94 | 0.0% |
| Romania | 107 | 0.0% |
| Russia | 250 | 0.0% |
| Saudi Arabia | 335 | 0.0% |
| Scotland | 80 | 0.0% |
| Serbia | 17 | 0.0% |
| Sierra Leone | 27 | 0.0% |
| Singapore | 28 | 0.0% |
| Somalia | 18 | 0.0% |
| South Africa | 145 | 0.0% |
| South America | 1,914 | 0.1% |
| South Central Asia | 3,165 | 0.2% |
| South Eastern Asia | 3,245 | 0.2% |
| Southern Europe | 928 | 0.1% |
| Spain | 126 | 0.0% |
| Sri Lanka | 124 | 0.0% |
| St. Vincent and the Grenadines | 6 | 0.0% |
| Sudan | 86 | 0.0% |
| Sweden | 40 | 0.0% |
| Switzerland | 19 | 0.0% |
| Syria | 360 | 0.0% |
| Taiwan | 202 | 0.0% |
| Thailand | 207 | 0.0% |
| Trinidad and Tobago | 147 | 0.0% |
| Turkey | 134 | 0.0% |
| Uganda | 17 | 0.0% |
| Ukraine | 42 | 0.0% |
| Uruguay | 61 | 0.0% |
| Venezuela | 199 | 0.0% |
| Vietnam | 877 | 0.1% |
| Western Africa | 1,039 | 0.1% |
| Western Asia | 1,848 | 0.1% |
| Western Europe | 1,979 | 0.1% |
| Zimbabwe | 188 | 0.0% | View All 120 Rows |
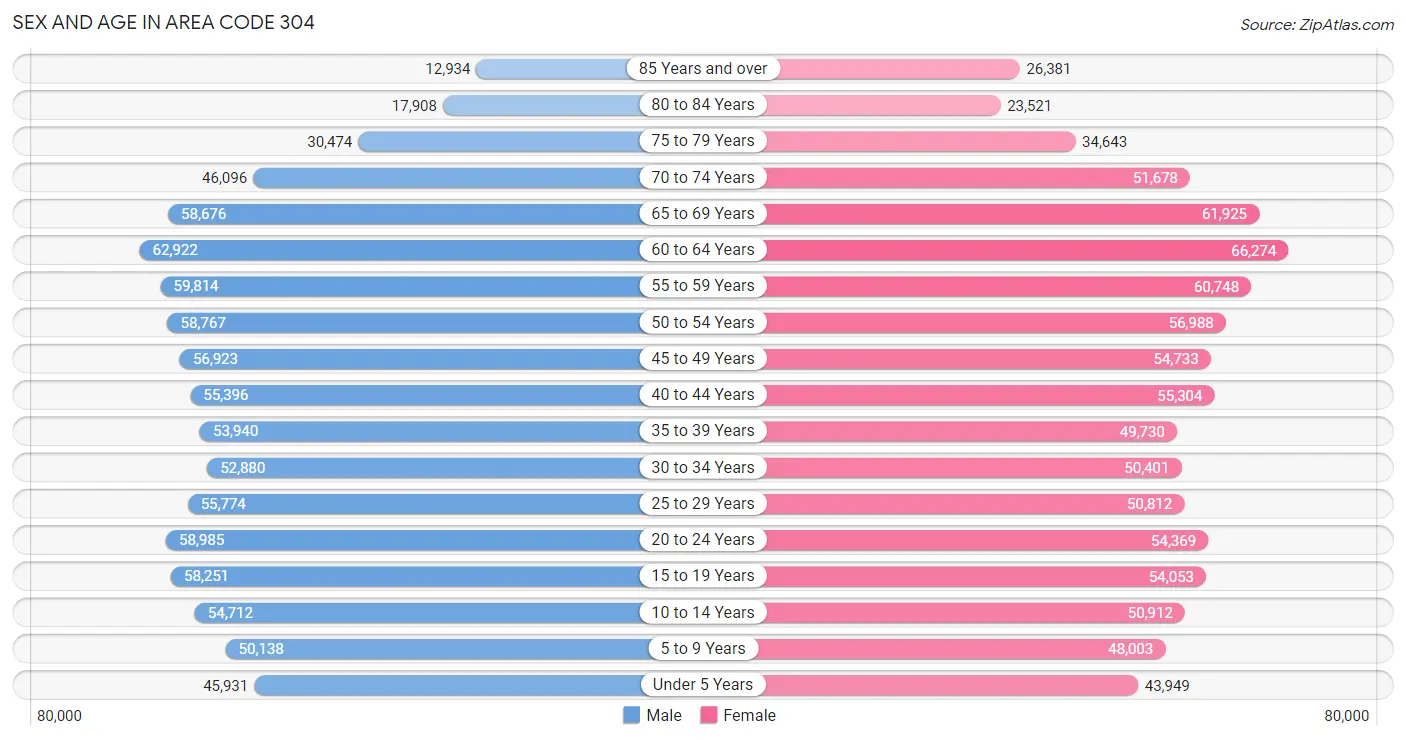
Sex and Age in Area Code 304
Sex and Age in Area Code 304
The most populous age groups in Area Code 304 are 60 to 64 Years (62,922 | 7.1%) for men and 60 to 64 Years (66,274 | 7.4%) for women.
| Age Bracket | Male | Female |
| Under 5 Years | 45,931 (5.2%) | 43,949 (4.9%) |
| 5 to 9 Years | 50,138 (5.6%) | 48,003 (5.4%) |
| 10 to 14 Years | 54,712 (6.1%) | 50,912 (5.7%) |
| 15 to 19 Years | 58,251 (6.5%) | 54,053 (6.0%) |
| 20 to 24 Years | 58,985 (6.6%) | 54,369 (6.1%) |
| 25 to 29 Years | 55,774 (6.3%) | 50,812 (5.7%) |
| 30 to 34 Years | 52,880 (5.9%) | 50,401 (5.6%) |
| 35 to 39 Years | 53,940 (6.1%) | 49,730 (5.6%) |
| 40 to 44 Years | 55,396 (6.2%) | 55,304 (6.2%) |
| 45 to 49 Years | 56,923 (6.4%) | 54,733 (6.1%) |
| 50 to 54 Years | 58,767 (6.6%) | 56,988 (6.4%) |
| 55 to 59 Years | 59,814 (6.7%) | 60,748 (6.8%) |
| 60 to 64 Years | 62,922 (7.1%) | 66,274 (7.4%) |
| 65 to 69 Years | 58,676 (6.6%) | 61,925 (6.9%) |
| 70 to 74 Years | 46,096 (5.2%) | 51,678 (5.8%) |
| 75 to 79 Years | 30,474 (3.4%) | 34,643 (3.9%) |
| 80 to 84 Years | 17,908 (2.0%) | 23,521 (2.6%) |
| 85 Years and over | 12,934 (1.5%) | 26,381 (2.9%) |
| Total | 890,521 (100.0%) | 894,424 (100.0%) |
Families and Households in Area Code 304
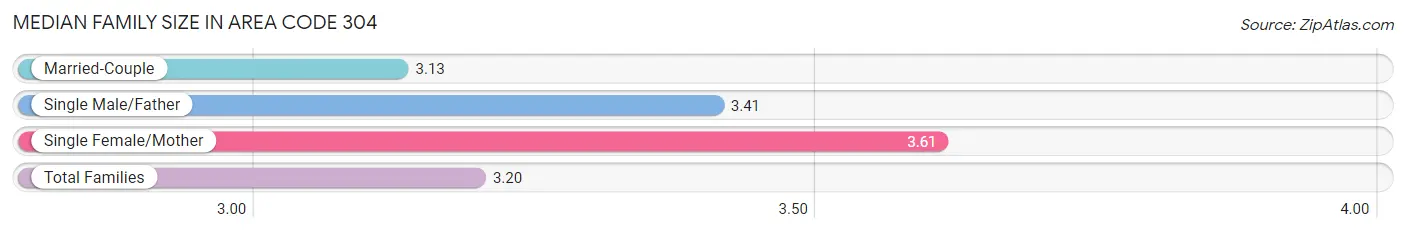
Median Family Size in Area Code 304
The median family size in Area Code 304 is 3.20 persons per family, with single female/mother families (76,366 | 17.1%) accounting for the largest median family size of 3.60896 persons per family. On the other hand, married-couple families (336,756 | 75.3%) represent the smallest median family size with 3.13 persons per family.
| Family Type | # Families | Family Size |
| Married-Couple | 336,756 (75.3%) | 3.13 |
| Single Male/Father | 34,324 (7.7%) | 3.41 |
| Single Female/Mother | 76,366 (17.1%) | 3.61 |
| Total Families | 447,446 (100.0%) | 3.20 |
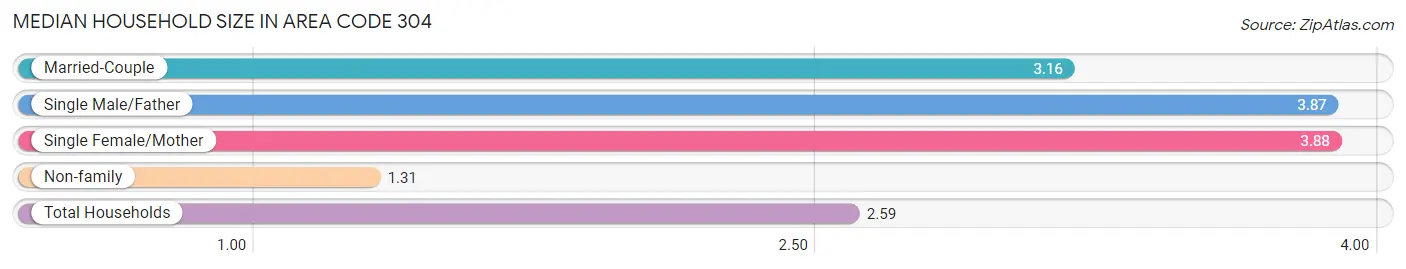
Median Household Size in Area Code 304
The median household size in Area Code 304 is 2.59 persons per household, with single female/mother households (76,366 | 10.7%) accounting for the largest median household size of 3.87909 persons per household. non-family households (265,295 | 37.2%) represent the smallest median household size with 1.31 persons per household.
| Household Type | # Households | Household Size |
| Married-Couple | 336,756 (47.2%) | 3.16 |
| Single Male/Father | 34,324 (4.8%) | 3.87 |
| Single Female/Mother | 76,366 (10.7%) | 3.88 |
| Non-family | 265,295 (37.2%) | 1.31 |
| Total Households | 712,741 (100.0%) | 2.59 |
Household Size by Marriage Status in Area Code 304
Out of a total of 712,741 households in Area Code 304, 447,446 (62.8%) are family households, while 265,295 (37.2%) are nonfamily households. The most numerous type of family households are 2-person households, comprising 224,276, and the most common type of nonfamily households are 1-person households, comprising 222,412.
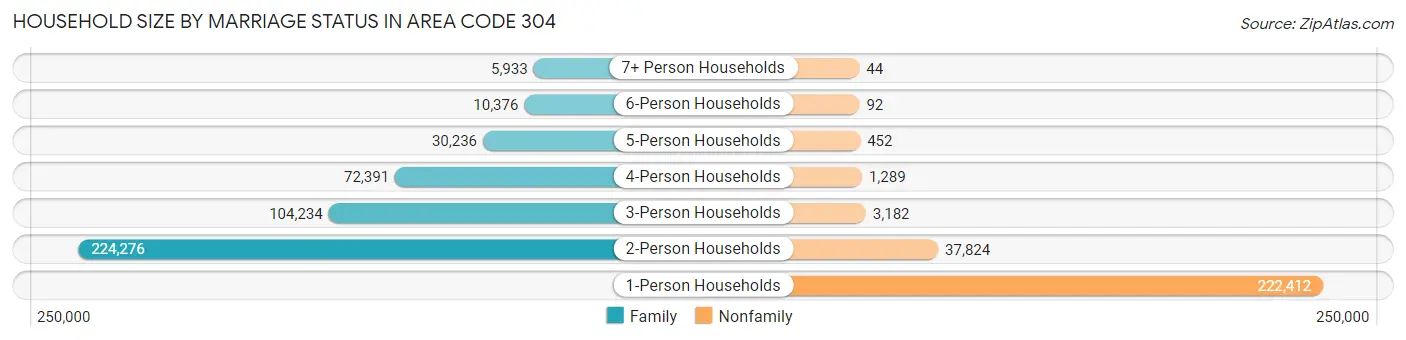
| Household Size | Family Households | Nonfamily Households |
| 1-Person Households | - | 222,412 (31.2%) |
| 2-Person Households | 224,276 (31.5%) | 37,824 (5.3%) |
| 3-Person Households | 104,234 (14.6%) | 3,182 (0.4%) |
| 4-Person Households | 72,391 (10.2%) | 1,289 (0.2%) |
| 5-Person Households | 30,236 (4.2%) | 452 (0.1%) |
| 6-Person Households | 10,376 (1.5%) | 92 (0.0%) |
| 7+ Person Households | 5,933 (0.8%) | 44 (0.0%) |
| Total | 447,446 (62.8%) | 265,295 (37.2%) |
Female Fertility in Area Code 304
Fertility by Age in Area Code 304
Average fertility rate in Area Code 304 is 110.1 births per 1,000 women. Women in the age bracket of 20 to 34 years have the highest fertility rate with 225.1 births per 1,000 women. Women in the age bracket of 20 to 34 years acount for 78.5% of all women with births.
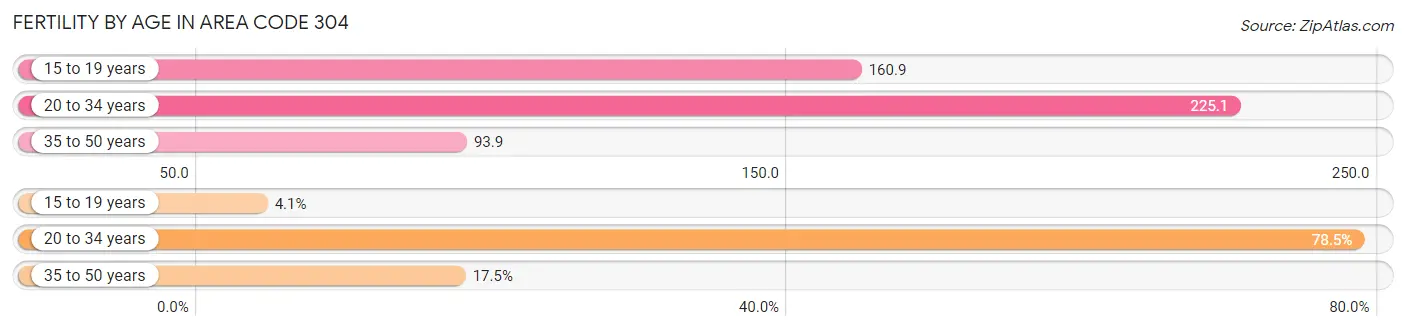
| Age Bracket | Women with Births | Births / 1,000 Women |
| 15 to 19 years | 763 (4.1%) | 160.9 |
| 20 to 34 years | 14,764 (78.5%) | 225.1 |
| 35 to 50 years | 3,291 (17.5%) | 93.9 |
| Total | 18,818 (100.0%) | 110.1 |
Fertility by Age by Marriage Status in Area Code 304
34.1% of women with births (18,818) in Area Code 304 are married. The highest percentage of unmarried women with births falls into 15 to 19 years age bracket with 100.0% of them unmarried at the time of birth, while the lowest percentage of unmarried women with births belong to 20 to 34 years age bracket with 68.5% of them unmarried.
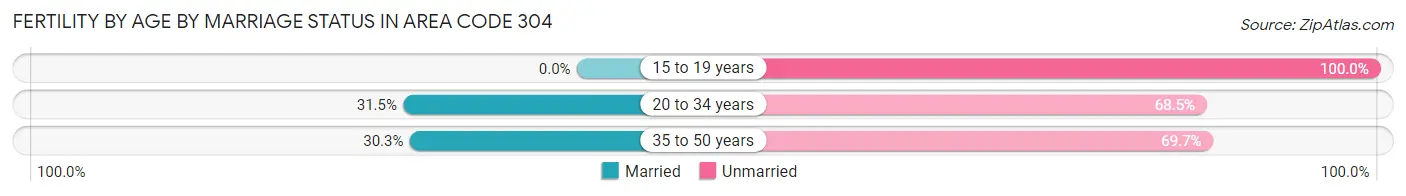
| Age Bracket | Married | Unmarried |
| 15 to 19 years | 0 (0.0%) | 763 (100.0%) |
| 20 to 34 years | 4,646 (31.5%) | 10,118 (68.5%) |
| 35 to 50 years | 997 (30.3%) | 2,294 (69.7%) |
| Total | 6,414 (34.1%) | 12,404 (65.9%) |
Fertility by Education in Area Code 304
Average fertility rate in Area Code 304 is 110.1 births per 1,000 women. Women with the education attainment of graduate degree have the highest fertility rate of 254.8 births per 1,000 women, while women with the education attainment of college or associate's degree have the lowest fertility at 151.5 births per 1,000 women. Women with the education attainment of high school diploma represent 34.9% of all women with births.
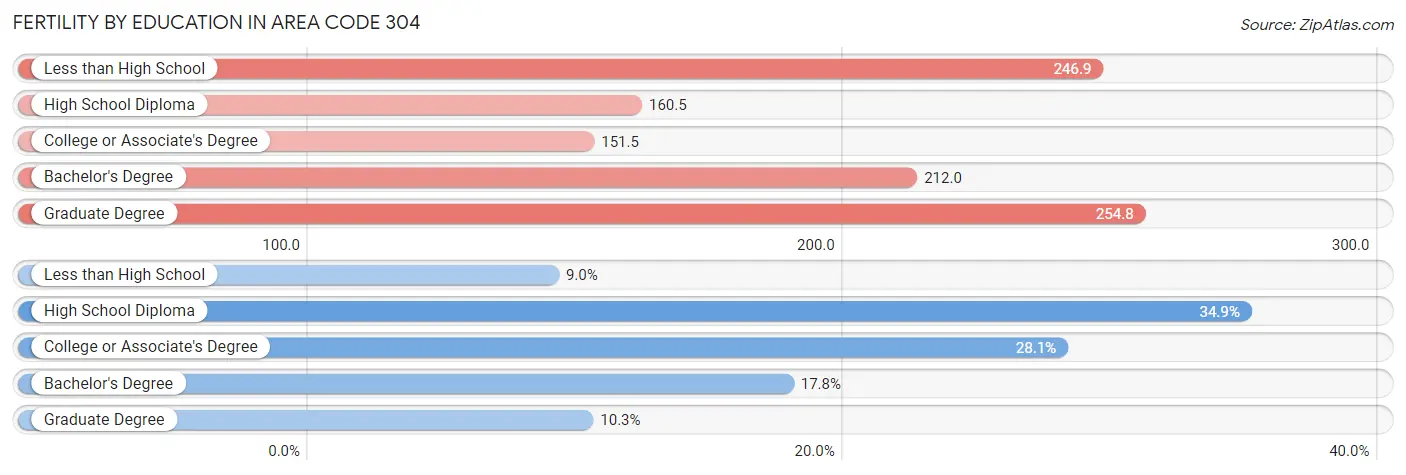
| Educational Attainment | Women with Births | Births / 1,000 Women |
| Less than High School | 1,689 (9.0%) | 246.9 |
| High School Diploma | 6,573 (34.9%) | 160.5 |
| College or Associate's Degree | 5,278 (28.1%) | 151.5 |
| Bachelor's Degree | 3,345 (17.8%) | 212.0 |
| Graduate Degree | 1,933 (10.3%) | 254.8 |
| Total | 18,818 (100.0%) | 110.1 |
Fertility by Education by Marriage Status in Area Code 304
65.9% of women with births in Area Code 304 are unmarried. Women with the educational attainment of graduate degree are most likely to be married with 37.0% of them married at childbirth, while women with the educational attainment of less than high school are least likely to be married with 88.5% of them unmarried at childbirth.
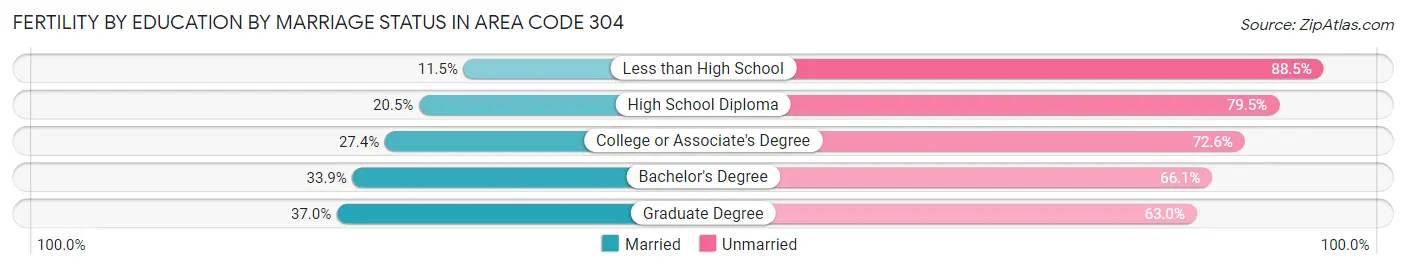
| Educational Attainment | Married | Unmarried |
| Less than High School | 194 (11.5%) | 1,495 (88.5%) |
| High School Diploma | 1,347 (20.5%) | 5,226 (79.5%) |
| College or Associate's Degree | 1,445 (27.4%) | 3,833 (72.6%) |
| Bachelor's Degree | 1,134 (33.9%) | 2,211 (66.1%) |
| Graduate Degree | 716 (37.0%) | 1,217 (63.0%) |
| Total | 6,414 (34.1%) | 12,404 (65.9%) |
Employment Characteristics in Area Code 304
Employment by Class of Employer in Area Code 304
Among the 720,542 employed individuals in Area Code 304, private company employees (468,753 | 65.1%), not-for-profit organizations (60,095 | 8.3%), and state government employees (58,058 | 8.1%) make up the most common classes of employment.
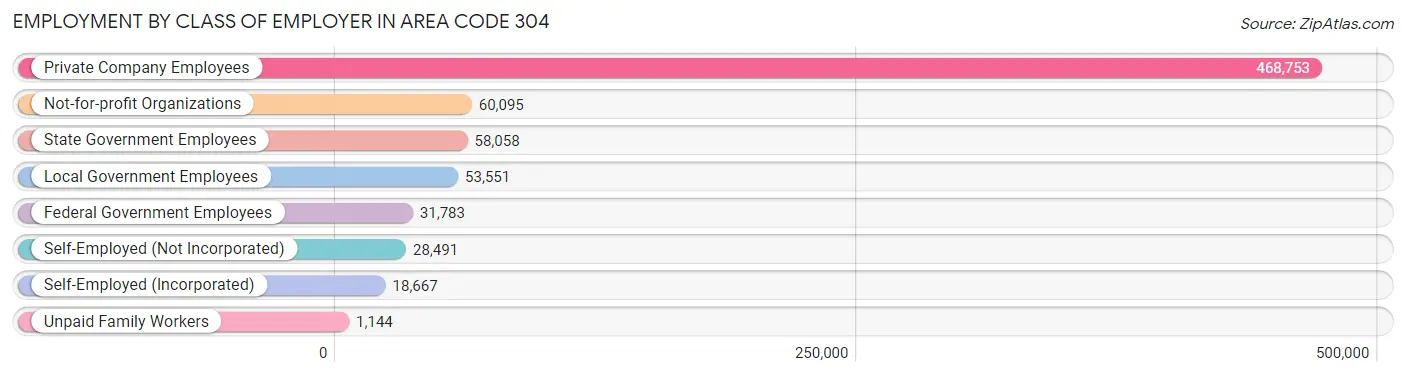
| Employer Class | # Employees | % Employees |
| Private Company Employees | 468,753 | 65.1% |
| Self-Employed (Incorporated) | 18,667 | 2.6% |
| Self-Employed (Not Incorporated) | 28,491 | 4.0% |
| Not-for-profit Organizations | 60,095 | 8.3% |
| Local Government Employees | 53,551 | 7.4% |
| State Government Employees | 58,058 | 8.1% |
| Federal Government Employees | 31,783 | 4.4% |
| Unpaid Family Workers | 1,144 | 0.2% |
| Total | 720,542 | 100.0% |
Employment Status by Age in Area Code 304
According to the labor force statistics for Area Code 304, out of the total population over 16 years of age (1,470,283), 46.8% or 687,945 individuals are in the labor force, with 11.1% or 76,431 of them unemployed. The age group with the highest labor force participation rate is 25 to 29 years, with 80.2% or 85,535 individuals in the labor force. Within the labor force, the 16 to 19 years age range has the highest percentage of unemployed individuals, with 7,244.2% or 3,049,953 of them being unemployed.
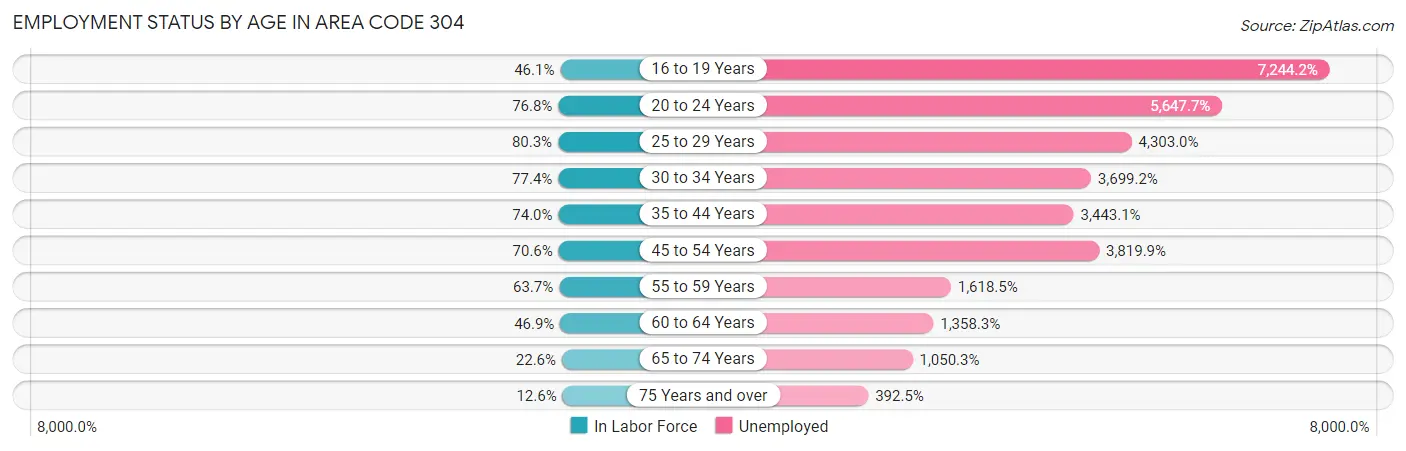
| Age Bracket | In Labor Force | Unemployed |
| 16 to 19 Years | 42,097 (46.1%) | 3,049,953 (7,244.2%) |
| 20 to 24 Years | 87,080 (76.8%) | 4,917,961 (5,647.7%) |
| 25 to 29 Years | 85,538 (80.2%) | 3,680,571 (4,303.0%) |
| 30 to 34 Years | 79,955 (77.4%) | 2,957,510 (3,699.2%) |
| 35 to 44 Years | 158,533 (74.0%) | 5,458,243 (3,443.1%) |
| 45 to 54 Years | 160,576 (70.6%) | 6,133,804 (3,819.9%) |
| 55 to 59 Years | 76,822 (63.7%) | 1,243,364 (1,618.5%) |
| 60 to 64 Years | 60,535 (46.9%) | 822,328 (1,358.3%) |
| 65 to 74 Years | 49,286 (22.6%) | 517,661 (1,050.3%) |
| 75 Years and over | 18,335 (12.6%) | 71,965 (392.5%) |
| Total | 687,990 (46.8%) | 76,455 (11.1%) |
Employment Status by Educational Attainment in Area Code 304
According to labor force statistics for Area Code 304, 62.6% of individuals (564,010) out of the total population between 25 and 64 years of age (901,406) are in the labor force, with 4,312.2% or 24,321,239 of them being unemployed. The group with the highest labor force participation rate are those with the educational attainment of bachelor's degree or higher, with 84.9% or 183,876 individuals in the labor force. Within the labor force, individuals with less than high school education have the highest percentage of unemployment, with 6,222.4% or 2,775,253 of them being unemployed.
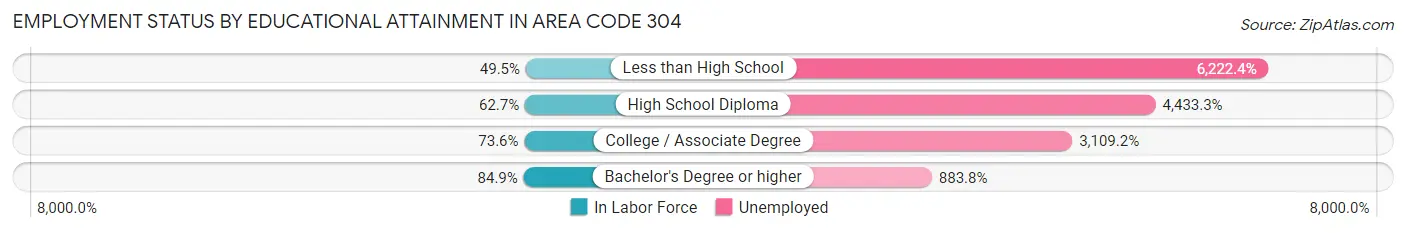
| Educational Attainment | In Labor Force | Unemployed |
| Less than High School | 44,605 (49.5%) | 5,605,387 (6,222.4%) |
| High School Diploma | 215,484 (62.7%) | 15,225,947 (4,433.3%) |
| College / Associate Degree | 184,981 (73.6%) | 7,814,912 (3,109.2%) |
| Bachelor's Degree or higher | 183,877 (84.9%) | 1,913,683 (883.8%) |
| Total | 564,006 (62.6%) | 38,870,430 (4,312.2%) |
Employment Occupations by Sex in Area Code 304
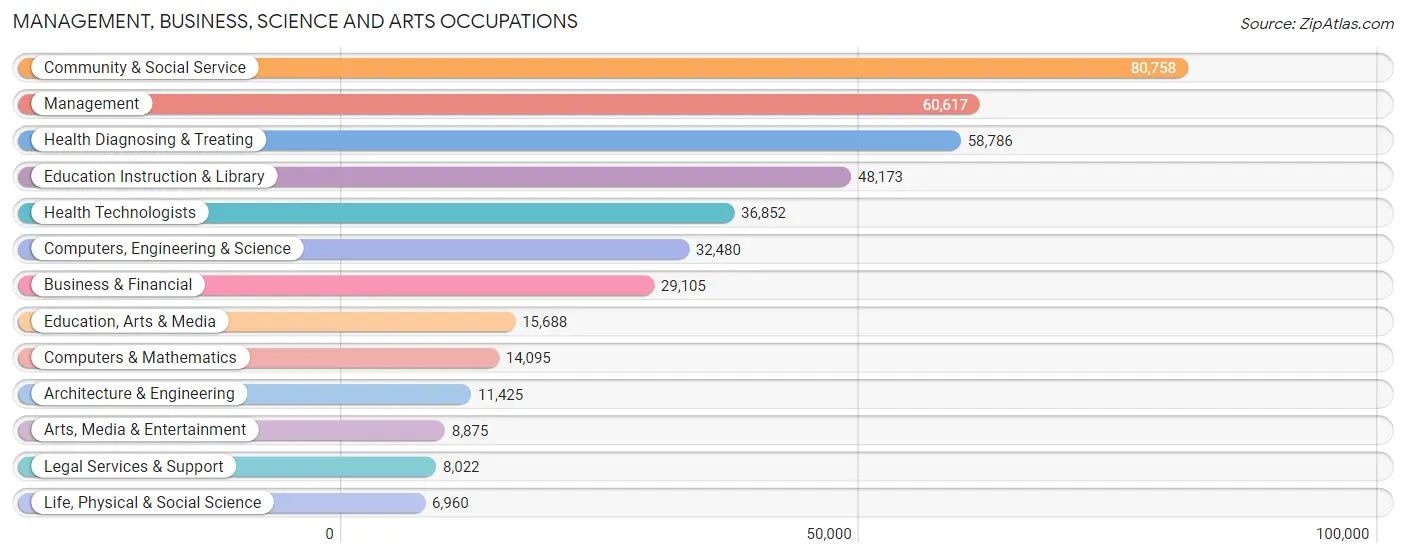
Management, Business, Science and Arts Occupations
The most common Management, Business, Science and Arts occupations in Area Code 304 are Community & Social Service (80,758 | 11.0%), Management (60,617 | 8.3%), Health Diagnosing & Treating (58,786 | 8.0%), Education Instruction & Library (48,173 | 6.6%), and Health Technologists (36,852 | 5.0%).
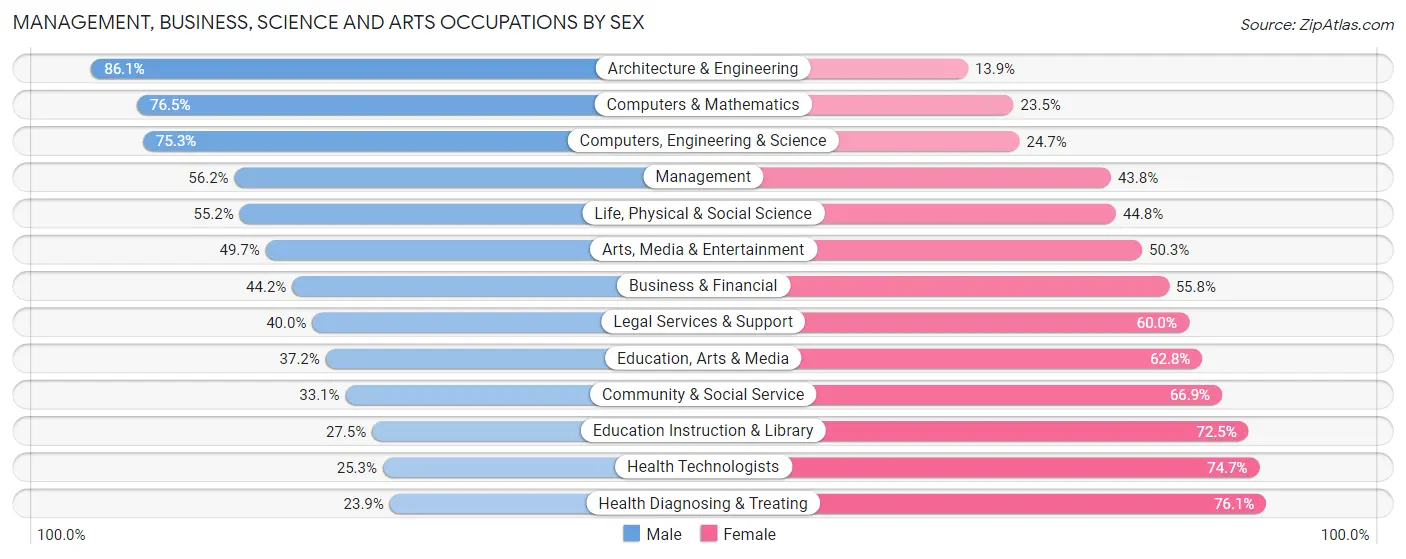
Management, Business, Science and Arts Occupations by Sex
Within the Management, Business, Science and Arts occupations in Area Code 304, the most male-oriented occupations are Architecture & Engineering (86.1%), Computers & Mathematics (76.5%), and Computers, Engineering & Science (75.3%), while the most female-oriented occupations are Health Diagnosing & Treating (76.1%), Health Technologists (74.7%), and Education Instruction & Library (72.5%).
| Occupation | Male | Female |
| Management | 34,082 (56.2%) | 26,535 (43.8%) |
| Business & Financial | 12,862 (44.2%) | 16,243 (55.8%) |
| Computers, Engineering & Science | 24,462 (75.3%) | 8,018 (24.7%) |
| Computers & Mathematics | 10,789 (76.5%) | 3,306 (23.5%) |
| Architecture & Engineering | 9,833 (86.1%) | 1,592 (13.9%) |
| Life, Physical & Social Science | 3,840 (55.2%) | 3,120 (44.8%) |
| Community & Social Service | 26,724 (33.1%) | 54,034 (66.9%) |
| Education, Arts & Media | 5,838 (37.2%) | 9,850 (62.8%) |
| Legal Services & Support | 3,209 (40.0%) | 4,813 (60.0%) |
| Education Instruction & Library | 13,263 (27.5%) | 34,910 (72.5%) |
| Arts, Media & Entertainment | 4,414 (49.7%) | 4,461 (50.3%) |
| Health Diagnosing & Treating | 14,025 (23.9%) | 44,761 (76.1%) |
| Health Technologists | 9,315 (25.3%) | 27,537 (74.7%) |
| Total (Category) | 112,155 (42.8%) | 149,591 (57.2%) |
| Total (Overall) | 387,311 (52.8%) | 346,137 (47.2%) |
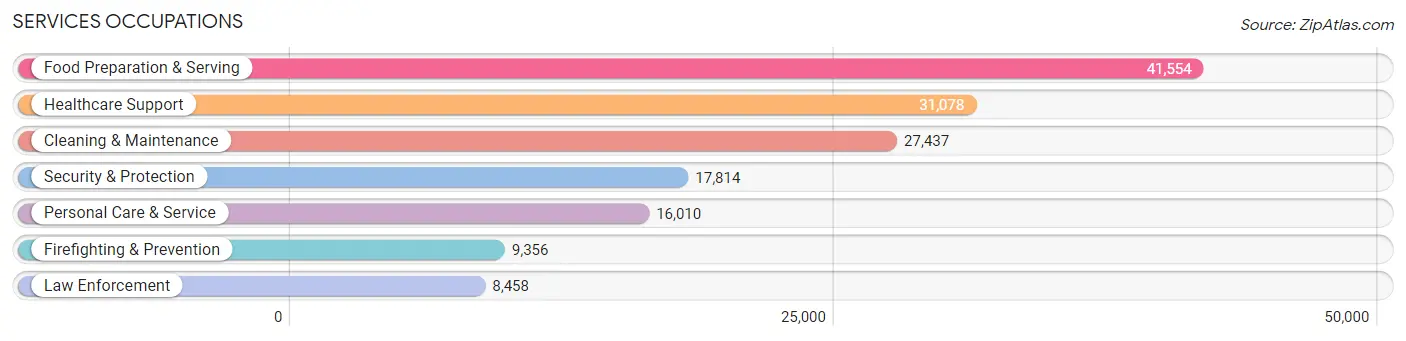
Services Occupations
The most common Services occupations in Area Code 304 are Food Preparation & Serving (41,554 | 5.7%), Healthcare Support (31,078 | 4.2%), Cleaning & Maintenance (27,437 | 3.7%), Security & Protection (17,814 | 2.4%), and Personal Care & Service (16,010 | 2.2%).
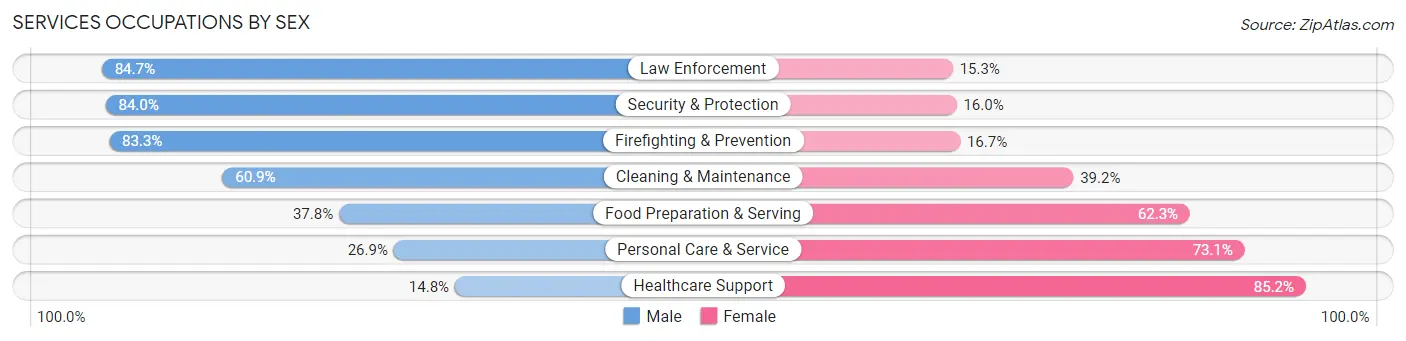
Services Occupations by Sex
Within the Services occupations in Area Code 304, the most male-oriented occupations are Law Enforcement (84.7%), Security & Protection (84.0%), and Firefighting & Prevention (83.3%), while the most female-oriented occupations are Healthcare Support (85.2%), Personal Care & Service (73.1%), and Food Preparation & Serving (62.3%).
| Occupation | Male | Female |
| Healthcare Support | 4,597 (14.8%) | 26,481 (85.2%) |
| Security & Protection | 14,958 (84.0%) | 2,856 (16.0%) |
| Firefighting & Prevention | 7,792 (83.3%) | 1,564 (16.7%) |
| Law Enforcement | 7,166 (84.7%) | 1,292 (15.3%) |
| Food Preparation & Serving | 15,685 (37.8%) | 25,869 (62.3%) |
| Cleaning & Maintenance | 16,696 (60.9%) | 10,741 (39.2%) |
| Personal Care & Service | 4,306 (26.9%) | 11,704 (73.1%) |
| Total (Category) | 56,242 (42.0%) | 77,651 (58.0%) |
| Total (Overall) | 387,311 (52.8%) | 346,137 (47.2%) |
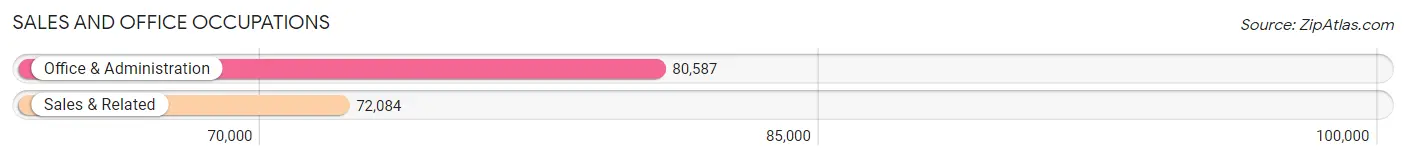
Sales and Office Occupations
The most common Sales and Office occupations in Area Code 304 are Office & Administration (80,587 | 11.0%), and Sales & Related (72,084 | 9.8%).
Sales and Office Occupations by Sex
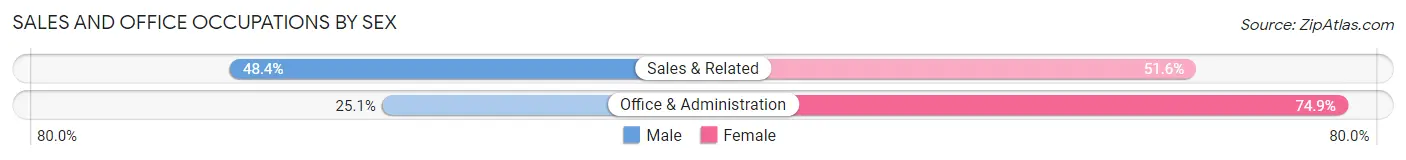
| Occupation | Male | Female |
| Sales & Related | 34,884 (48.4%) | 37,200 (51.6%) |
| Office & Administration | 20,205 (25.1%) | 60,382 (74.9%) |
| Total (Category) | 55,089 (36.1%) | 97,582 (63.9%) |
| Total (Overall) | 387,311 (52.8%) | 346,137 (47.2%) |
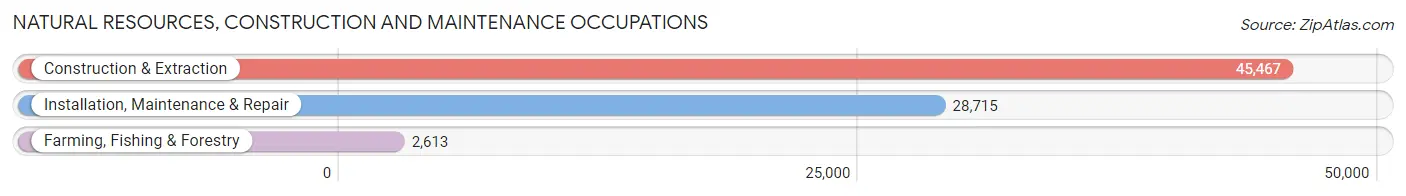
Natural Resources, Construction and Maintenance Occupations
The most common Natural Resources, Construction and Maintenance occupations in Area Code 304 are Construction & Extraction (45,467 | 6.2%), Installation, Maintenance & Repair (28,715 | 3.9%), and Farming, Fishing & Forestry (2,613 | 0.4%).
Natural Resources, Construction and Maintenance Occupations by Sex
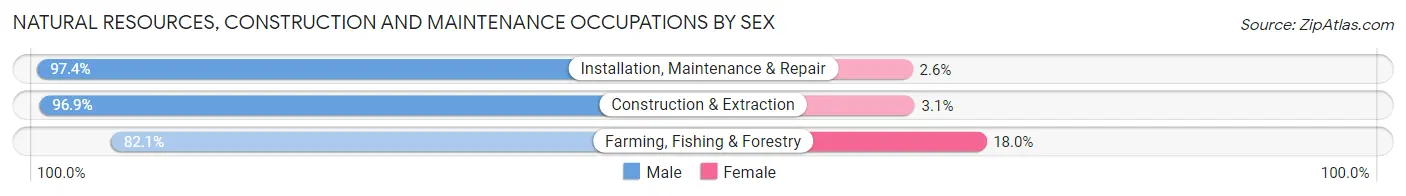
| Occupation | Male | Female |
| Farming, Fishing & Forestry | 2,144 (82.1%) | 469 (17.9%) |
| Construction & Extraction | 44,077 (96.9%) | 1,390 (3.1%) |
| Installation, Maintenance & Repair | 27,961 (97.4%) | 754 (2.6%) |
| Total (Category) | 74,182 (96.6%) | 2,613 (3.4%) |
| Total (Overall) | 387,311 (52.8%) | 346,137 (47.2%) |
Production, Transportation and Moving Occupations
The most common Production, Transportation and Moving occupations in Area Code 304 are Production (41,754 | 5.7%), Transportation (33,562 | 4.6%), and Material Moving (33,027 | 4.5%).
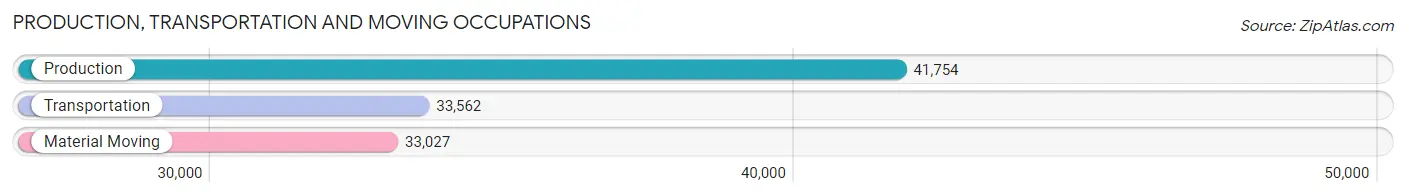
Production, Transportation and Moving Occupations by Sex
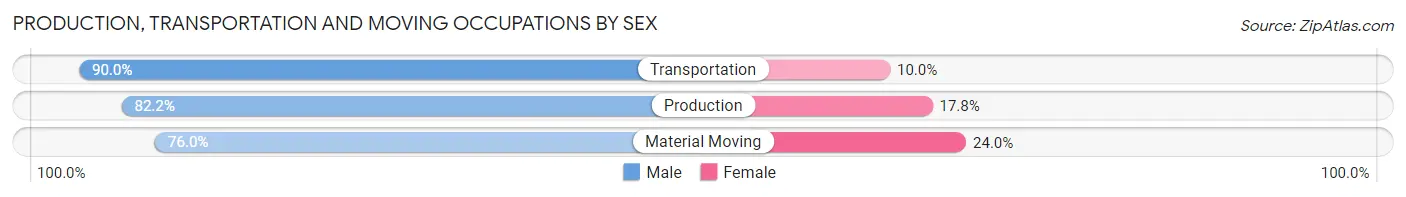
| Occupation | Male | Female |
| Production | 34,325 (82.2%) | 7,429 (17.8%) |
| Transportation | 30,205 (90.0%) | 3,357 (10.0%) |
| Material Moving | 25,113 (76.0%) | 7,914 (24.0%) |
| Total (Category) | 89,643 (82.7%) | 18,700 (17.3%) |
| Total (Overall) | 387,311 (52.8%) | 346,137 (47.2%) |
Employment Industries by Sex in Area Code 304
Employment Industries in Area Code 304
The major employment industries in Area Code 304 include Health Care & Social Assistance (129,936 | 17.7%), Retail Trade (91,540 | 12.5%), Educational Services (75,112 | 10.2%), Manufacturing (59,682 | 8.1%), and Accommodation & Food Services (52,023 | 7.1%).
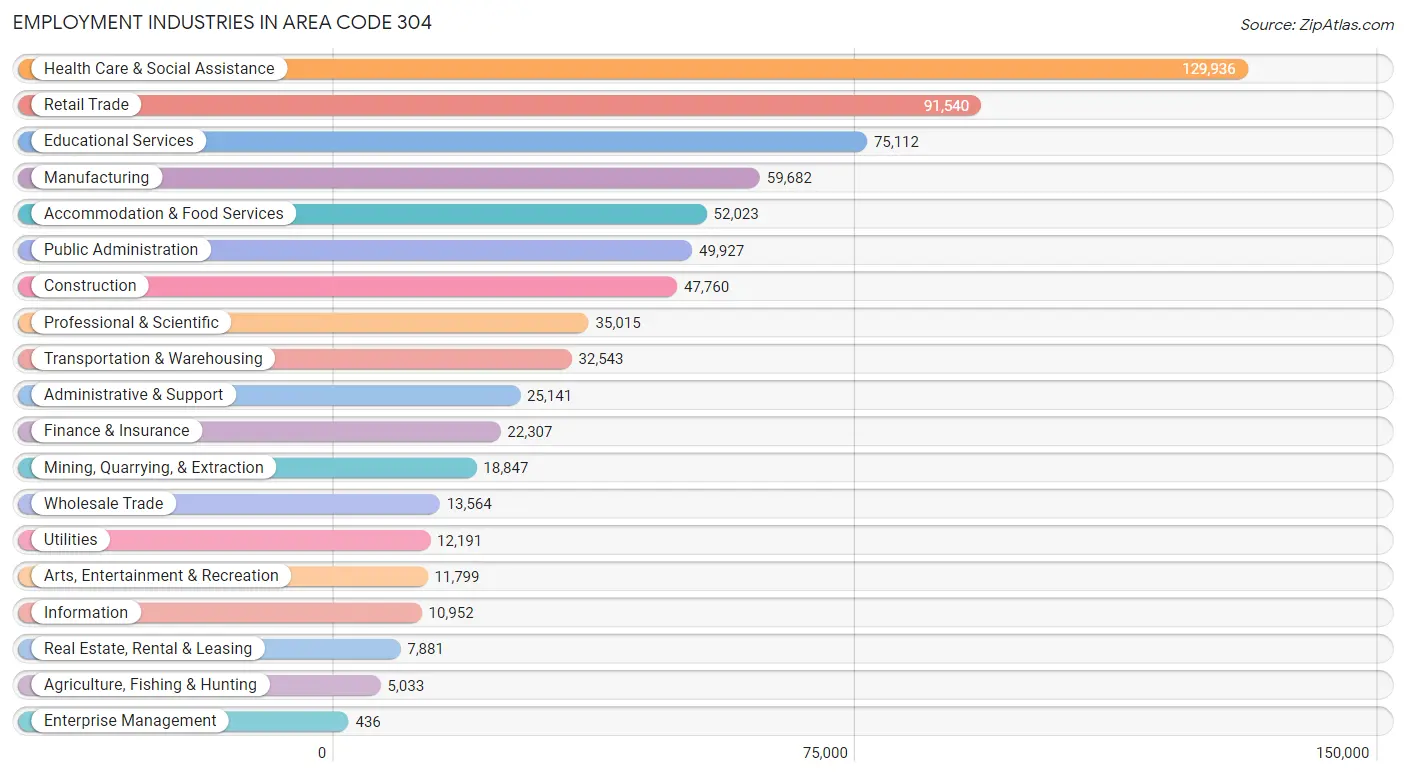
Employment Industries by Sex in Area Code 304
The Area Code 304 industries that see more men than women are Mining, Quarrying, & Extraction (95.5%), Construction (90.7%), and Wholesale Trade (84.0%), whereas the industries that tend to have a higher number of women are Health Care & Social Assistance (78.2%), Enterprise Management (68.6%), and Educational Services (66.4%).
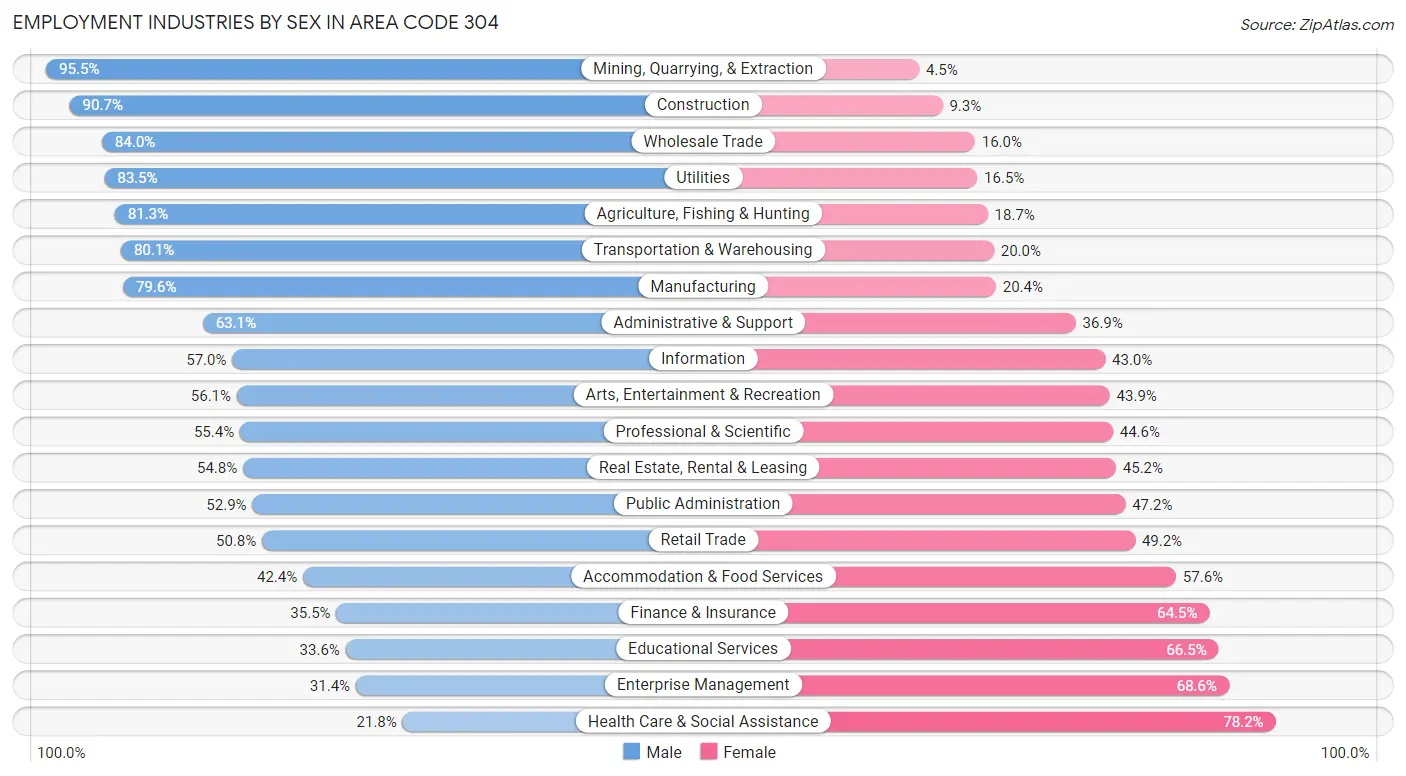
| Industry | Male | Female |
| Agriculture, Fishing & Hunting | 4,093 (81.3%) | 940 (18.7%) |
| Mining, Quarrying, & Extraction | 18,004 (95.5%) | 843 (4.5%) |
| Construction | 43,305 (90.7%) | 4,455 (9.3%) |
| Manufacturing | 47,523 (79.6%) | 12,159 (20.4%) |
| Wholesale Trade | 11,392 (84.0%) | 2,172 (16.0%) |
| Retail Trade | 46,535 (50.8%) | 45,005 (49.2%) |
| Transportation & Warehousing | 26,051 (80.0%) | 6,492 (20.0%) |
| Utilities | 10,178 (83.5%) | 2,013 (16.5%) |
| Information | 6,244 (57.0%) | 4,708 (43.0%) |
| Finance & Insurance | 7,909 (35.5%) | 14,398 (64.5%) |
| Real Estate, Rental & Leasing | 4,318 (54.8%) | 3,563 (45.2%) |
| Professional & Scientific | 19,405 (55.4%) | 15,610 (44.6%) |
| Enterprise Management | 137 (31.4%) | 299 (68.6%) |
| Administrative & Support | 15,870 (63.1%) | 9,271 (36.9%) |
| Educational Services | 25,200 (33.6%) | 49,912 (66.4%) |
| Health Care & Social Assistance | 28,276 (21.8%) | 101,660 (78.2%) |
| Arts, Entertainment & Recreation | 6,616 (56.1%) | 5,183 (43.9%) |
| Accommodation & Food Services | 22,039 (42.4%) | 29,984 (57.6%) |
| Public Administration | 26,384 (52.8%) | 23,543 (47.1%) |
| Total | 387,311 (52.8%) | 346,137 (47.2%) |
Education in Area Code 304
School Enrollment in Area Code 304
The most common levels of schooling among the 369,247 students in Area Code 304 are high school (82,938 | 22.5%), middle school (81,578 | 22.1%), and elementary school (76,651 | 20.8%).
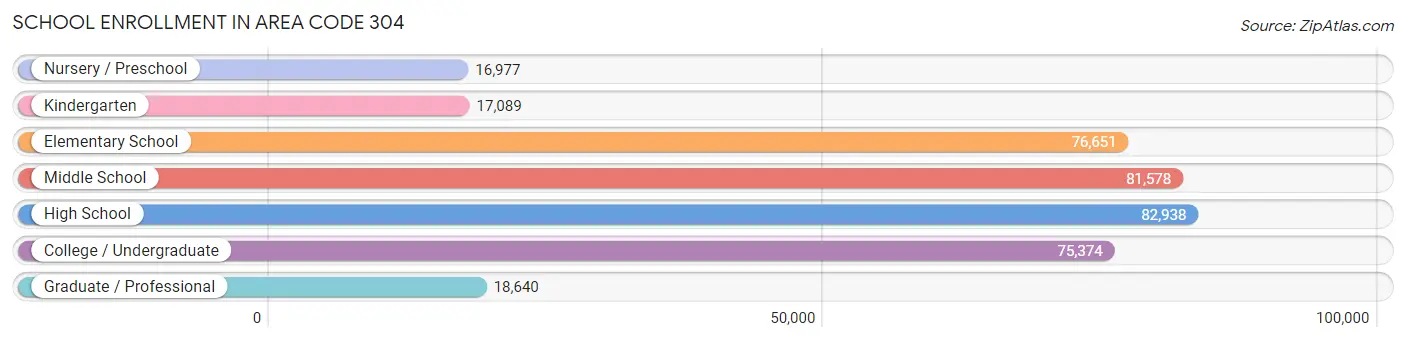
| School Level | # Students | % Students |
| Nursery / Preschool | 16,977 | 4.6% |
| Kindergarten | 17,089 | 4.6% |
| Elementary School | 76,651 | 20.8% |
| Middle School | 81,578 | 22.1% |
| High School | 82,938 | 22.5% |
| College / Undergraduate | 75,374 | 20.4% |
| Graduate / Professional | 18,640 | 5.1% |
| Total | 369,247 | 100.0% |
School Enrollment by Age by Funding Source in Area Code 304
Out of a total of 369,247 students who are enrolled in schools in Area Code 304, 45,528 (12.3%) attend a private institution, while the remaining 323,719 (87.7%) are enrolled in public schools. The age group of 3 to 4 year olds has the highest likelihood of being enrolled in private schools, with 2,788 (27.1% in the age bracket) enrolled. Conversely, the age group of 15 to 17 year olds has the lowest likelihood of being enrolled in a private school, with 55,836 (91.7% in the age bracket) attending a public institution.
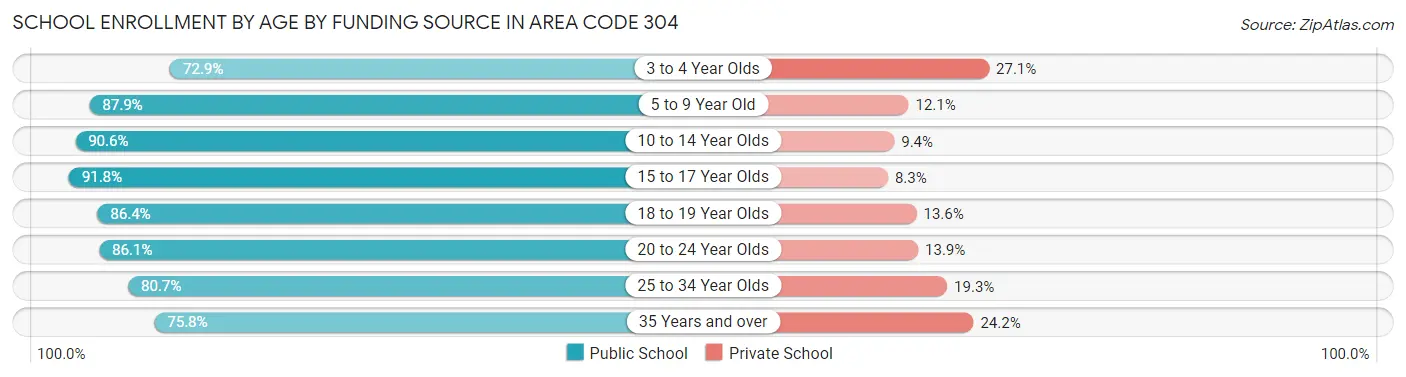
| Age Bracket | Public School | Private School |
| 3 to 4 Year Olds | 7,503 (72.9%) | 2,788 (27.1%) |
| 5 to 9 Year Old | 78,163 (87.9%) | 10,738 (12.1%) |
| 10 to 14 Year Olds | 91,438 (90.6%) | 9,521 (9.4%) |
| 15 to 17 Year Olds | 55,836 (91.7%) | 5,022 (8.3%) |
| 18 to 19 Year Olds | 29,186 (86.4%) | 4,583 (13.6%) |
| 20 to 24 Year Olds | 35,460 (86.1%) | 5,709 (13.9%) |
| 25 to 34 Year Olds | 14,671 (80.7%) | 3,505 (19.3%) |
| 35 Years and over | 11,467 (75.8%) | 3,657 (24.2%) |
| Total | 323,719 (87.7%) | 45,528 (12.3%) |
Educational Attainment by Field of Study in Area Code 304
Education (59,454 | 19.2%), business (53,180 | 17.1%), science & technology (42,027 | 13.5%), arts & humanities (22,770 | 7.3%), and bio, nature & agricultural (21,457 | 6.9%) are the most common fields of study among 310,448 individuals in Area Code 304 who have obtained a bachelor's degree or higher.
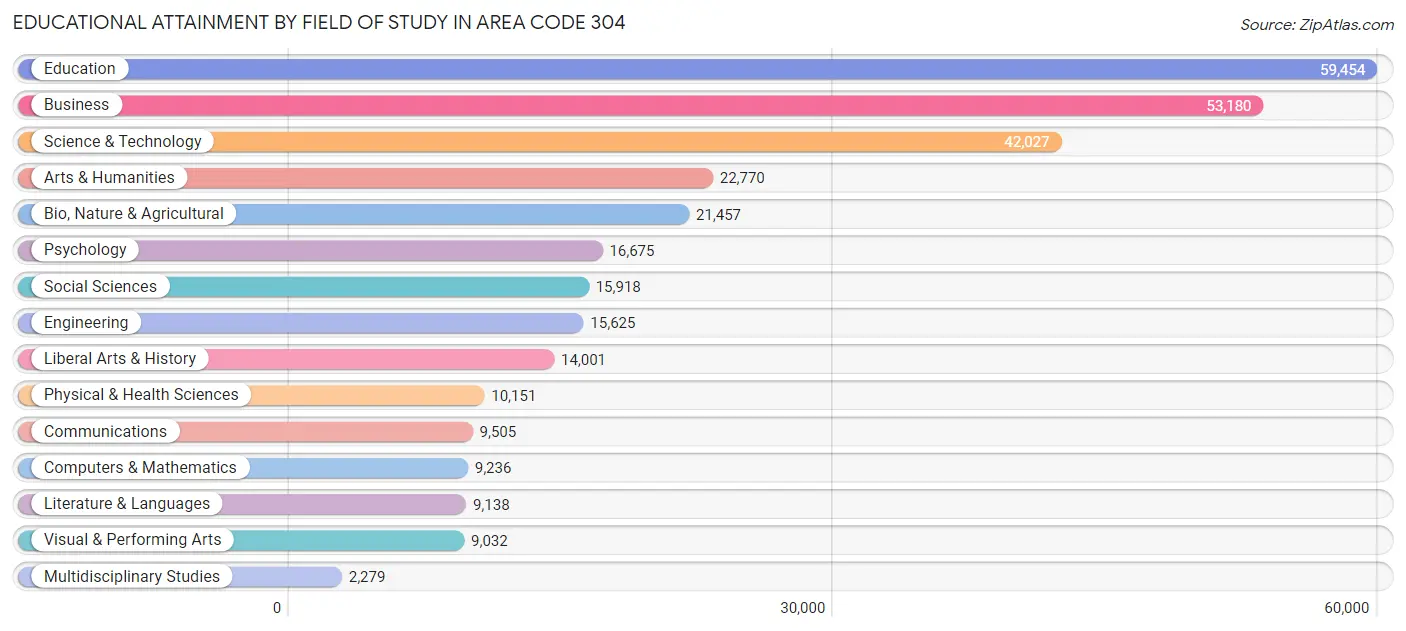
| Field of Study | # Graduates | % Graduates |
| Computers & Mathematics | 9,236 | 3.0% |
| Bio, Nature & Agricultural | 21,457 | 6.9% |
| Physical & Health Sciences | 10,151 | 3.3% |
| Psychology | 16,675 | 5.4% |
| Social Sciences | 15,918 | 5.1% |
| Engineering | 15,625 | 5.0% |
| Multidisciplinary Studies | 2,279 | 0.7% |
| Science & Technology | 42,027 | 13.5% |
| Business | 53,180 | 17.1% |
| Education | 59,454 | 19.2% |
| Literature & Languages | 9,138 | 2.9% |
| Liberal Arts & History | 14,001 | 4.5% |
| Visual & Performing Arts | 9,032 | 2.9% |
| Communications | 9,505 | 3.1% |
| Arts & Humanities | 22,770 | 7.3% |
| Total | 310,448 | 100.0% |
Transportation & Commute in Area Code 304
Vehicle Availability by Sex in Area Code 304
The most prevalent vehicle ownership categories in Area Code 304 are males with 2 vehicles (159,954, accounting for 42.0%) and females with 2 vehicles (137,947, making up 47.7%).
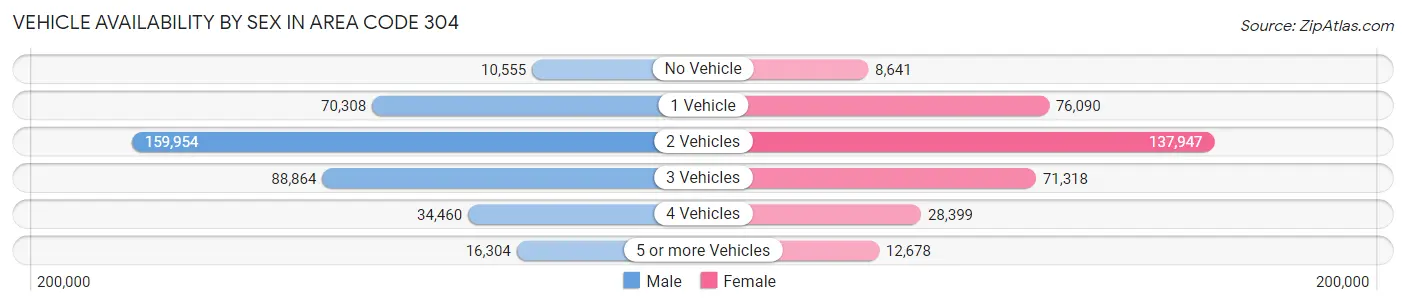
| Vehicles Available | Male | Female |
| No Vehicle | 10,555 (2.8%) | 8,641 (2.6%) |
| 1 Vehicle | 70,308 (18.5%) | 76,090 (22.7%) |
| 2 Vehicles | 159,954 (42.0%) | 137,947 (41.2%) |
| 3 Vehicles | 88,864 (23.4%) | 71,318 (21.3%) |
| 4 Vehicles | 34,460 (9.1%) | 28,399 (8.5%) |
| 5 or more Vehicles | 16,304 (4.3%) | 12,678 (3.8%) |
| Total | 380,445 (100.0%) | 335,073 (100.0%) |
Commute Time in Area Code 304
The most frequently occuring commute durations in Area Code 304 are 15 to 19 minutes (106,272 commuters, 15.8%), 20 to 24 minutes (98,459 commuters, 14.7%), and 10 to 14 minutes (96,124 commuters, 14.3%).
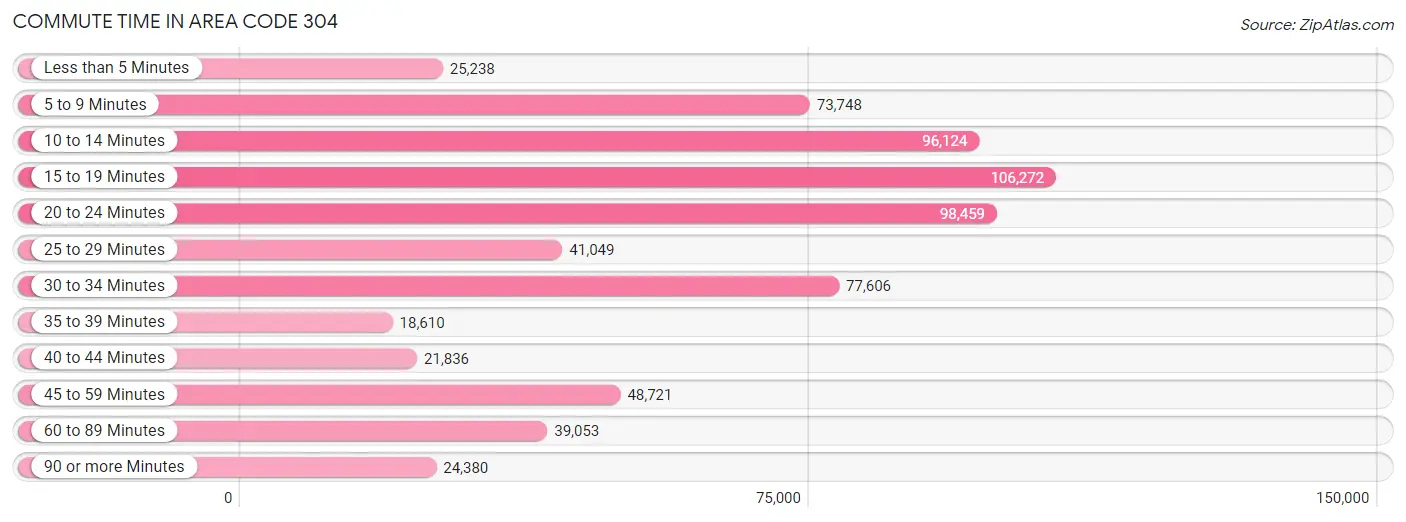
| Commute Time | # Commuters | % Commuters |
| Less than 5 Minutes | 25,238 | 3.8% |
| 5 to 9 Minutes | 73,748 | 11.0% |
| 10 to 14 Minutes | 96,124 | 14.3% |
| 15 to 19 Minutes | 106,272 | 15.8% |
| 20 to 24 Minutes | 98,459 | 14.7% |
| 25 to 29 Minutes | 41,049 | 6.1% |
| 30 to 34 Minutes | 77,606 | 11.6% |
| 35 to 39 Minutes | 18,610 | 2.8% |
| 40 to 44 Minutes | 21,836 | 3.3% |
| 45 to 59 Minutes | 48,721 | 7.3% |
| 60 to 89 Minutes | 39,053 | 5.8% |
| 90 or more Minutes | 24,380 | 3.6% |
Commute Time by Sex in Area Code 304
The most common commute times in Area Code 304 are 15 to 19 minutes (52,285 commuters, 14.5%) for males and 15 to 19 minutes (53,987 commuters, 17.4%) for females.
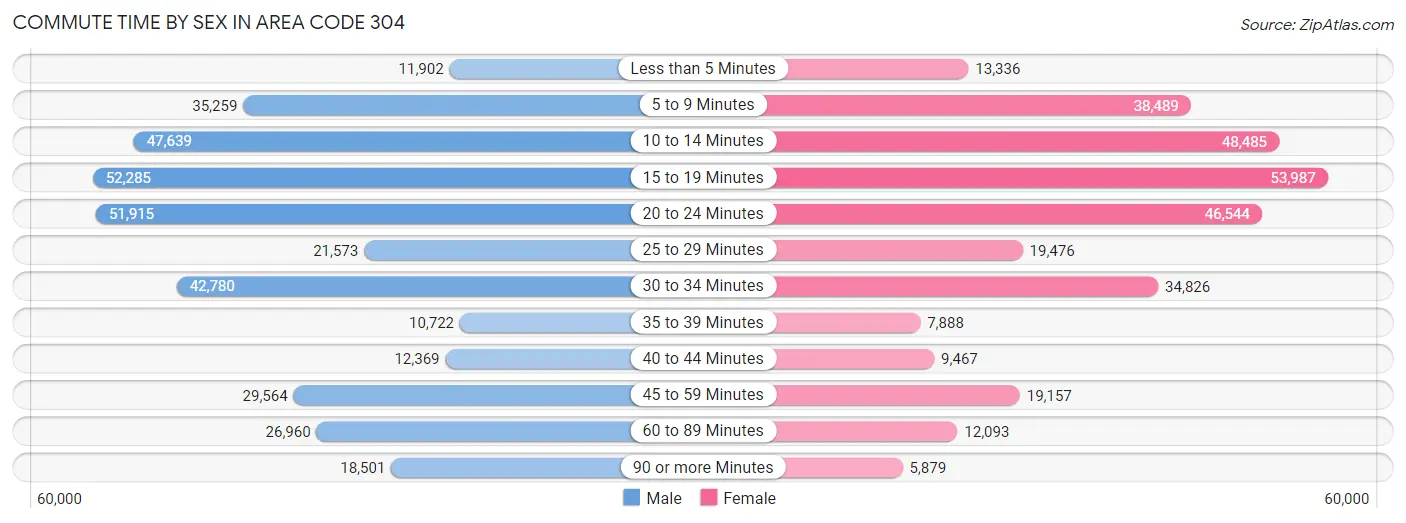
| Commute Time | Male | Female |
| Less than 5 Minutes | 11,902 (3.3%) | 13,336 (4.3%) |
| 5 to 9 Minutes | 35,259 (9.8%) | 38,489 (12.4%) |
| 10 to 14 Minutes | 47,639 (13.2%) | 48,485 (15.7%) |
| 15 to 19 Minutes | 52,285 (14.5%) | 53,987 (17.4%) |
| 20 to 24 Minutes | 51,915 (14.4%) | 46,544 (15.0%) |
| 25 to 29 Minutes | 21,573 (6.0%) | 19,476 (6.3%) |
| 30 to 34 Minutes | 42,780 (11.8%) | 34,826 (11.3%) |
| 35 to 39 Minutes | 10,722 (3.0%) | 7,888 (2.5%) |
| 40 to 44 Minutes | 12,369 (3.4%) | 9,467 (3.1%) |
| 45 to 59 Minutes | 29,564 (8.2%) | 19,157 (6.2%) |
| 60 to 89 Minutes | 26,960 (7.5%) | 12,093 (3.9%) |
| 90 or more Minutes | 18,501 (5.1%) | 5,879 (1.9%) |
Time of Departure to Work by Sex in Area Code 304
The most frequent times of departure to work in Area Code 304 are 7:00 AM to 7:29 AM (45,719, 12.7%) for males and 7:00 AM to 7:29 AM (48,729, 15.7%) for females.
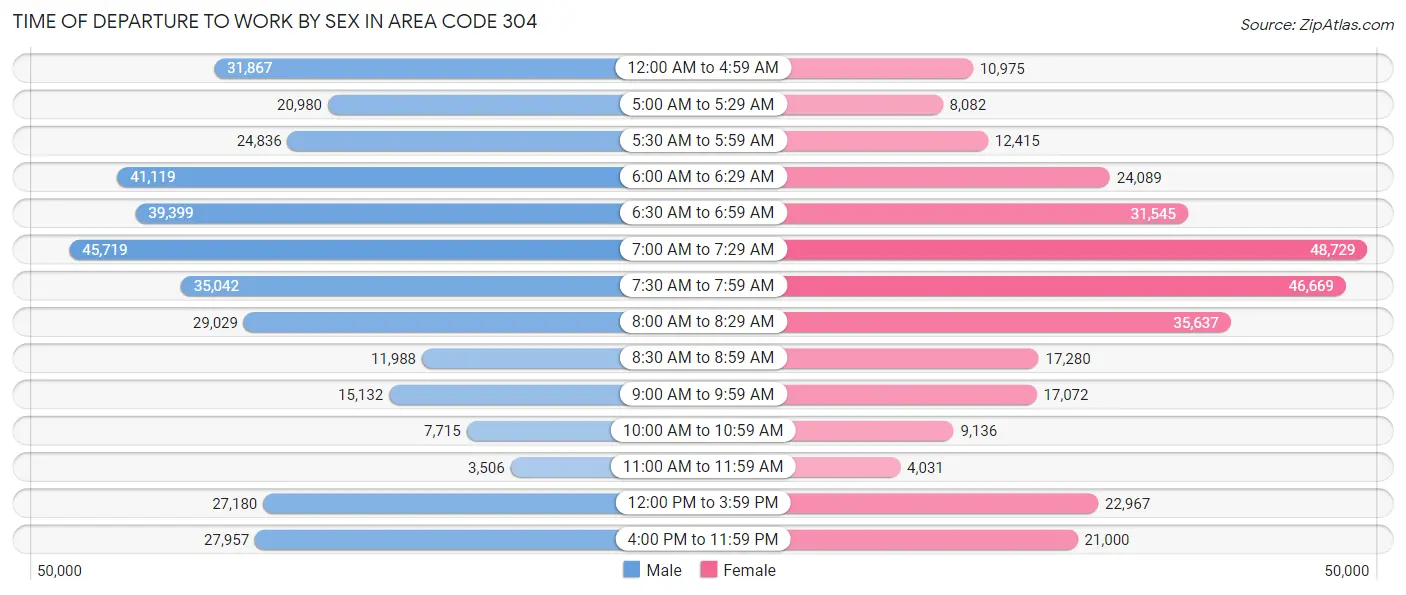
| Time of Departure | Male | Female |
| 12:00 AM to 4:59 AM | 31,867 (8.8%) | 10,975 (3.5%) |
| 5:00 AM to 5:29 AM | 20,980 (5.8%) | 8,082 (2.6%) |
| 5:30 AM to 5:59 AM | 24,836 (6.9%) | 12,415 (4.0%) |
| 6:00 AM to 6:29 AM | 41,119 (11.4%) | 24,089 (7.8%) |
| 6:30 AM to 6:59 AM | 39,399 (10.9%) | 31,545 (10.2%) |
| 7:00 AM to 7:29 AM | 45,719 (12.7%) | 48,729 (15.7%) |
| 7:30 AM to 7:59 AM | 35,042 (9.7%) | 46,669 (15.1%) |
| 8:00 AM to 8:29 AM | 29,029 (8.0%) | 35,637 (11.5%) |
| 8:30 AM to 8:59 AM | 11,988 (3.3%) | 17,280 (5.6%) |
| 9:00 AM to 9:59 AM | 15,132 (4.2%) | 17,072 (5.5%) |
| 10:00 AM to 10:59 AM | 7,715 (2.1%) | 9,136 (2.9%) |
| 11:00 AM to 11:59 AM | 3,506 (1.0%) | 4,031 (1.3%) |
| 12:00 PM to 3:59 PM | 27,180 (7.5%) | 22,967 (7.4%) |
| 4:00 PM to 11:59 PM | 27,957 (7.7%) | 21,000 (6.8%) |
| Total | 361,469 (100.0%) | 309,627 (100.0%) |
Housing Occupancy in Area Code 304
Occupancy by Ownership in Area Code 304
Of the total 712,741 dwellings in Area Code 304, owner-occupied units account for 528,230 (74.1%), while renter-occupied units make up 184,511 (25.9%).
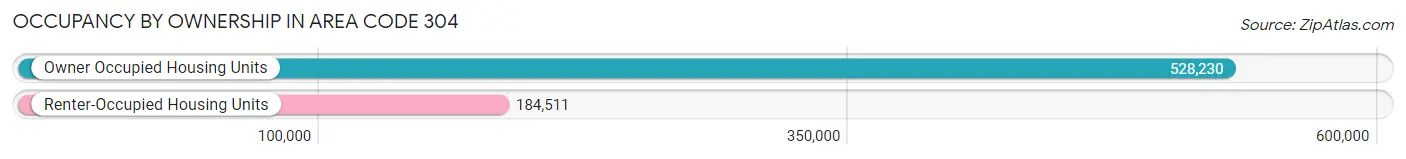
| Occupancy | # Housing Units | % Housing Units |
| Owner Occupied Housing Units | 528,230 | 74.1% |
| Renter-Occupied Housing Units | 184,511 | 25.9% |
| Total Occupied Housing Units | 712,741 | 100.0% |
Occupancy by Household Size in Area Code 304
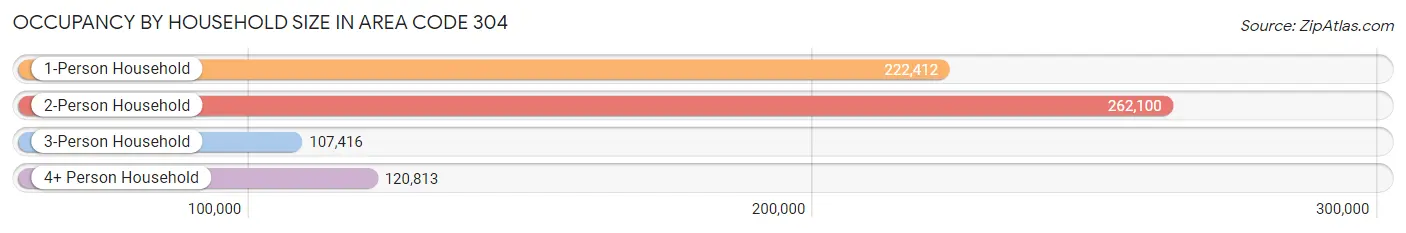
| Household Size | # Housing Units | % Housing Units |
| 1-Person Household | 222,412 | 31.2% |
| 2-Person Household | 262,100 | 36.8% |
| 3-Person Household | 107,416 | 15.1% |
| 4+ Person Household | 120,813 | 17.0% |
| Total Housing Units | 712,741 | 100.0% |
Occupancy by Ownership by Household Size in Area Code 304
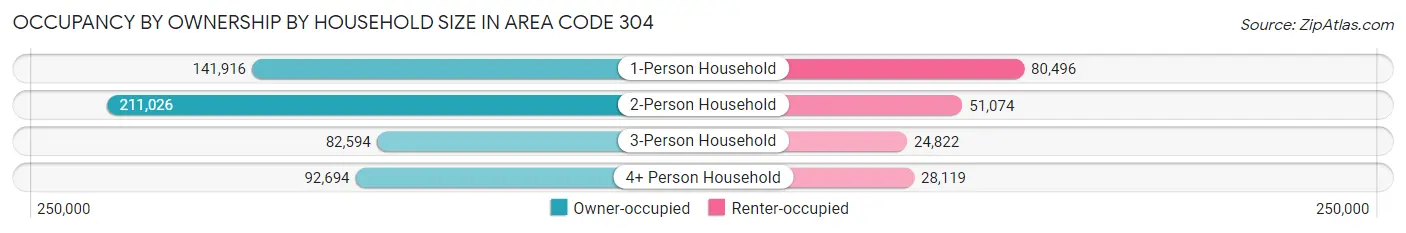
| Household Size | Owner-occupied | Renter-occupied |
| 1-Person Household | 141,916 (63.8%) | 80,496 (36.2%) |
| 2-Person Household | 211,026 (80.5%) | 51,074 (19.5%) |
| 3-Person Household | 82,594 (76.9%) | 24,822 (23.1%) |
| 4+ Person Household | 92,694 (76.7%) | 28,119 (23.3%) |
| Total Housing Units | 528,230 (74.1%) | 184,511 (25.9%) |
Occupancy by Educational Attainment in Area Code 304
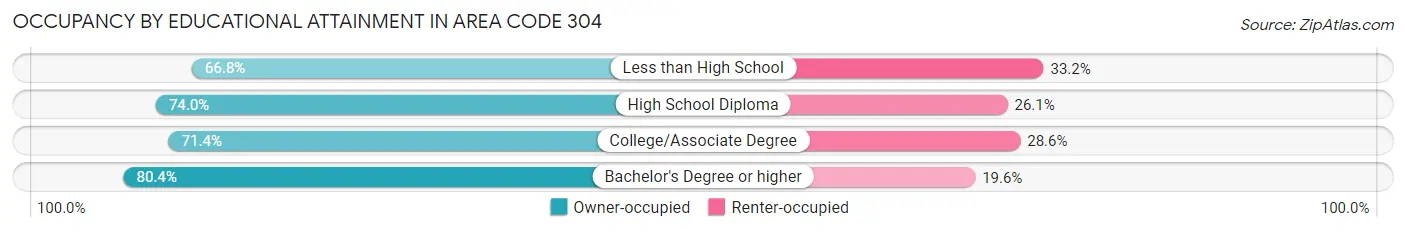
| Household Size | Owner-occupied | Renter-occupied |
| Less than High School | 48,216 (66.8%) | 23,946 (33.2%) |
| High School Diploma | 192,302 (74.0%) | 67,744 (26.1%) |
| College/Associate Degree | 144,780 (71.4%) | 57,921 (28.6%) |
| Bachelor's Degree or higher | 142,932 (80.4%) | 34,900 (19.6%) |
Occupancy by Age of Householder in Area Code 304
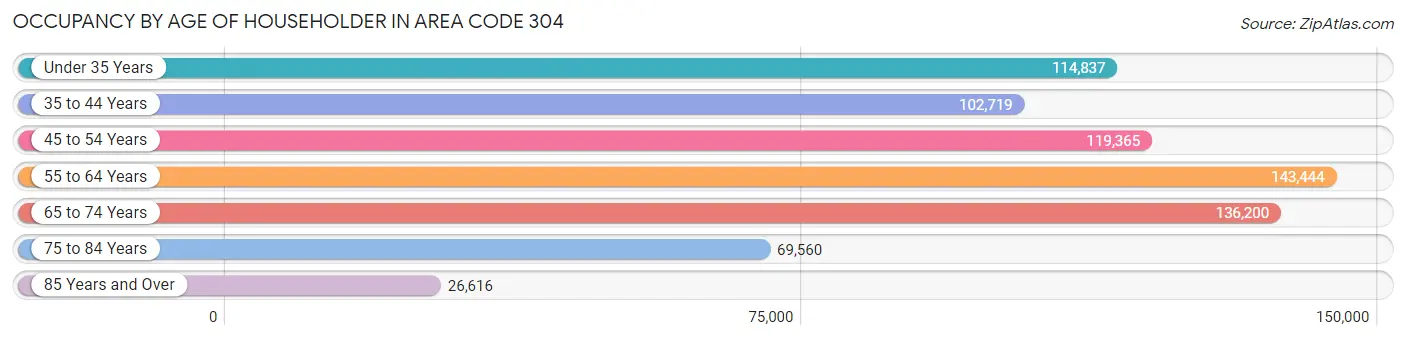
| Age Bracket | # Households | % Households |
| Under 35 Years | 114,837 | 16.1% |
| 35 to 44 Years | 102,719 | 14.4% |
| 45 to 54 Years | 119,365 | 16.8% |
| 55 to 64 Years | 143,444 | 20.1% |
| 65 to 74 Years | 136,200 | 19.1% |
| 75 to 84 Years | 69,560 | 9.8% |
| 85 Years and Over | 26,616 | 3.7% |
| Total | 712,741 | 100.0% |
Housing Finances in Area Code 304
Median Income by Occupancy in Area Code 304
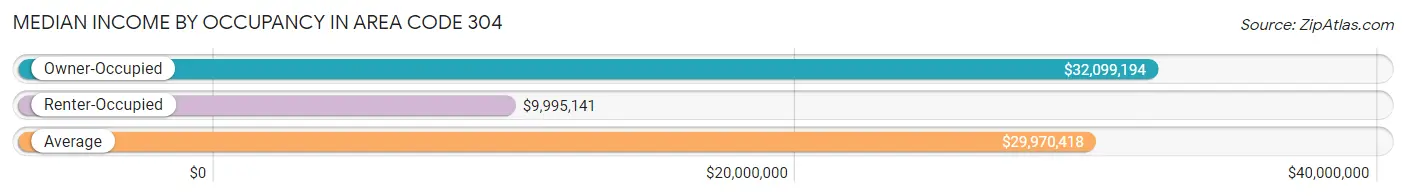
| Occupancy Type | # Households | Median Income |
| Owner-Occupied | 528,230 (74.1%) | $32,099,194 |
| Renter-Occupied | 184,511 (25.9%) | $9,995,141 |
| Average | 712,741 (100.0%) | $29,970,418 |
Occupancy by Householder Income Bracket in Area Code 304
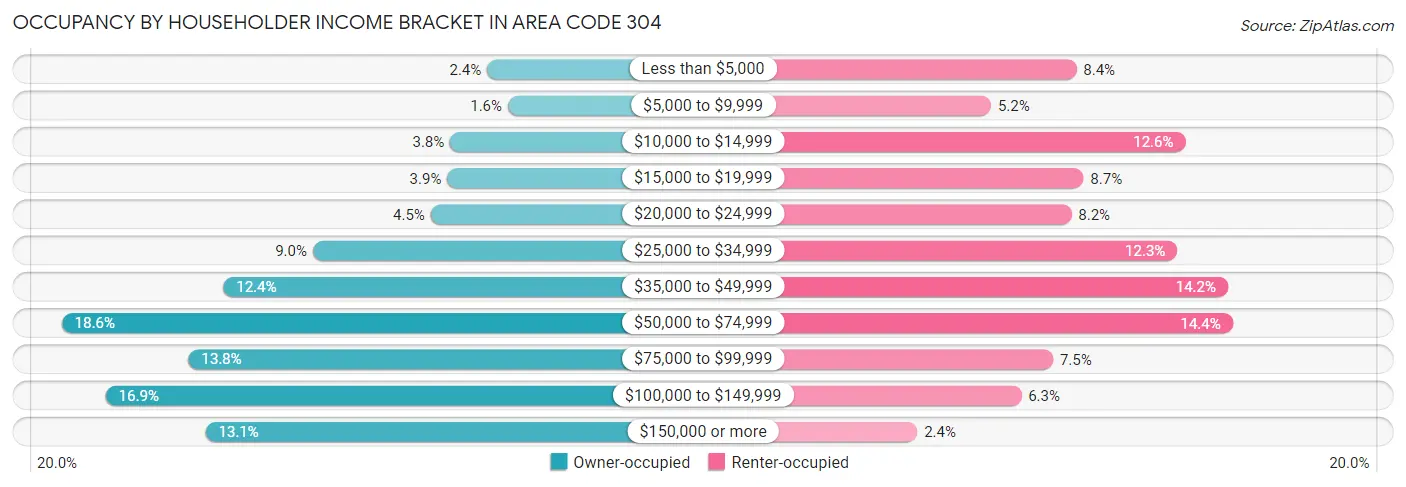
| Income Bracket | Owner-occupied | Renter-occupied |
| Less than $5,000 | 12,548 (2.4%) | 15,517 (8.4%) |
| $5,000 to $9,999 | 8,402 (1.6%) | 9,523 (5.2%) |
| $10,000 to $14,999 | 19,994 (3.8%) | 23,180 (12.6%) |
| $15,000 to $19,999 | 20,594 (3.9%) | 16,024 (8.7%) |
| $20,000 to $24,999 | 23,907 (4.5%) | 15,164 (8.2%) |
| $25,000 to $34,999 | 47,637 (9.0%) | 22,595 (12.2%) |
| $35,000 to $49,999 | 65,677 (12.4%) | 26,158 (14.2%) |
| $50,000 to $74,999 | 98,187 (18.6%) | 26,497 (14.4%) |
| $75,000 to $99,999 | 72,685 (13.8%) | 13,880 (7.5%) |
| $100,000 to $149,999 | 89,334 (16.9%) | 11,646 (6.3%) |
| $150,000 or more | 69,265 (13.1%) | 4,327 (2.4%) |
| Total | 528,230 (100.0%) | 184,511 (100.0%) |
Monthly Housing Cost Tiers in Area Code 304
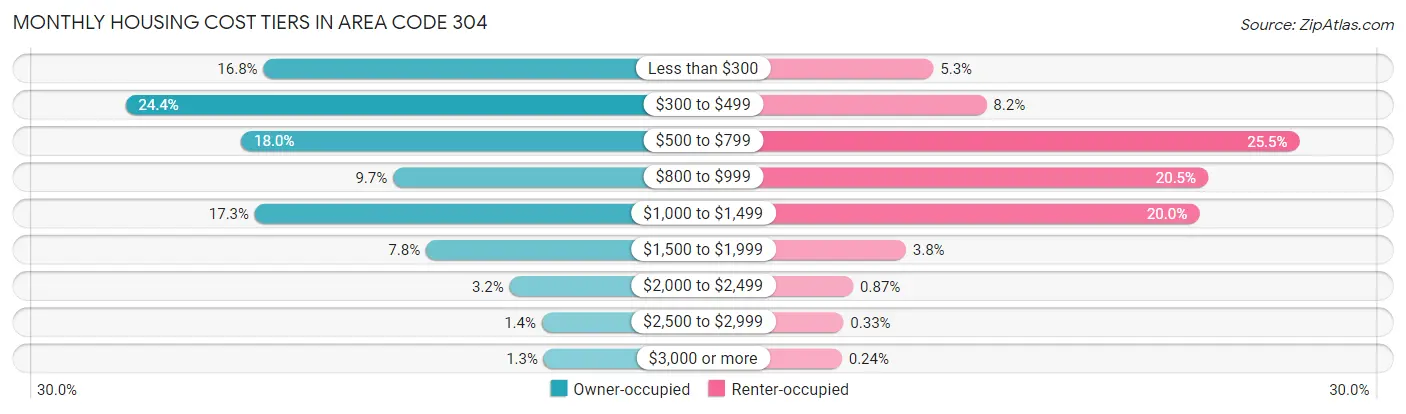
| Monthly Cost | Owner-occupied | Renter-occupied |
| Less than $300 | 88,808 (16.8%) | 9,773 (5.3%) |
| $300 to $499 | 129,038 (24.4%) | 15,190 (8.2%) |
| $500 to $799 | 95,299 (18.0%) | 47,073 (25.5%) |
| $800 to $999 | 50,985 (9.7%) | 37,752 (20.5%) |
| $1,000 to $1,499 | 91,269 (17.3%) | 36,841 (20.0%) |
| $1,500 to $1,999 | 41,374 (7.8%) | 6,978 (3.8%) |
| $2,000 to $2,499 | 16,941 (3.2%) | 1,599 (0.9%) |
| $2,500 to $2,999 | 7,559 (1.4%) | 600 (0.3%) |
| $3,000 or more | 6,957 (1.3%) | 435 (0.2%) |
| Total | 528,230 (100.0%) | 184,511 (100.0%) |
Physical Housing Characteristics in Area Code 304
Housing Structures in Area Code 304
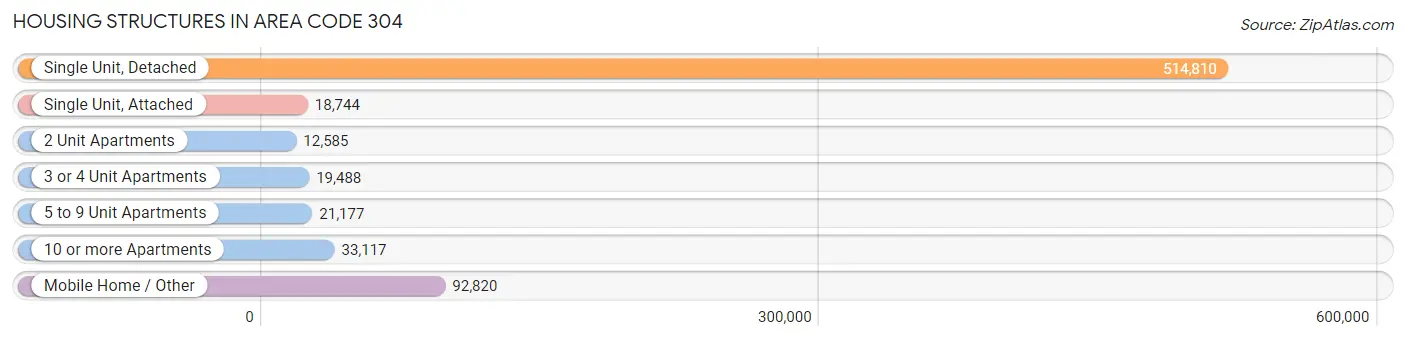
| Structure Type | # Housing Units | % Housing Units |
| Single Unit, Detached | 514,810 | 72.2% |
| Single Unit, Attached | 18,744 | 2.6% |
| 2 Unit Apartments | 12,585 | 1.8% |
| 3 or 4 Unit Apartments | 19,488 | 2.7% |
| 5 to 9 Unit Apartments | 21,177 | 3.0% |
| 10 or more Apartments | 33,117 | 4.6% |
| Mobile Home / Other | 92,820 | 13.0% |
| Total | 712,741 | 100.0% |
Housing Structures by Occupancy in Area Code 304
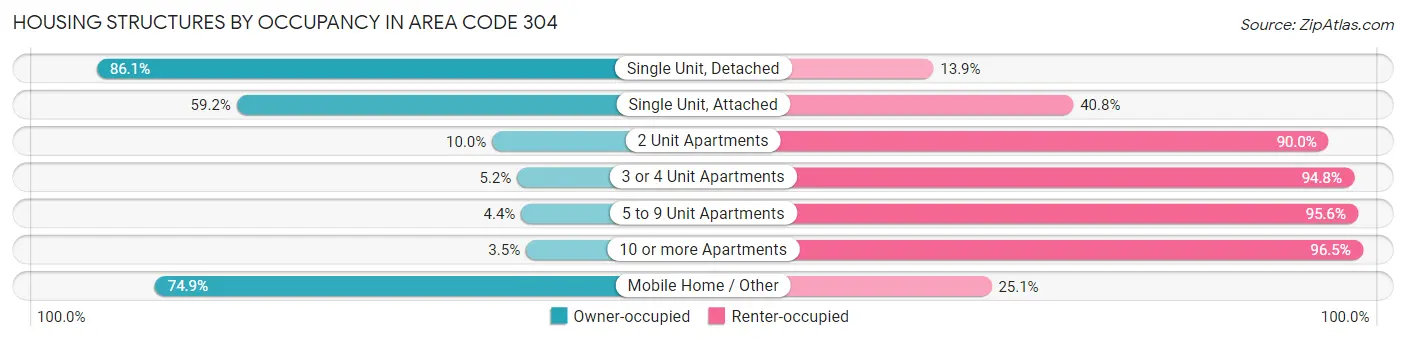
| Structure Type | Owner-occupied | Renter-occupied |
| Single Unit, Detached | 443,262 (86.1%) | 71,548 (13.9%) |
| Single Unit, Attached | 11,090 (59.2%) | 7,654 (40.8%) |
| 2 Unit Apartments | 1,257 (10.0%) | 11,328 (90.0%) |
| 3 or 4 Unit Apartments | 1,008 (5.2%) | 18,480 (94.8%) |
| 5 to 9 Unit Apartments | 929 (4.4%) | 20,248 (95.6%) |
| 10 or more Apartments | 1,145 (3.5%) | 31,972 (96.5%) |
| Mobile Home / Other | 69,539 (74.9%) | 23,281 (25.1%) |
| Total | 528,230 (74.1%) | 184,511 (25.9%) |
Housing Structures by Number of Rooms in Area Code 304
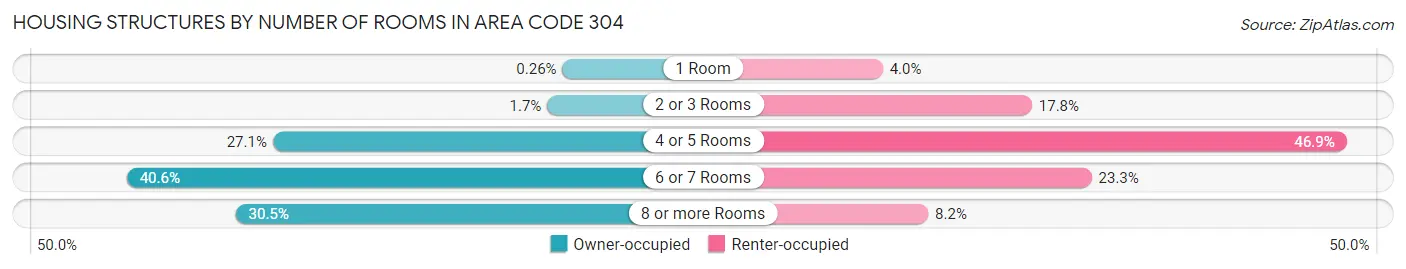
| Number of Rooms | Owner-occupied | Renter-occupied |
| 1 Room | 1,389 (0.3%) | 7,299 (4.0%) |
| 2 or 3 Rooms | 8,805 (1.7%) | 32,753 (17.7%) |
| 4 or 5 Rooms | 142,865 (27.1%) | 86,445 (46.9%) |
| 6 or 7 Rooms | 214,186 (40.6%) | 42,957 (23.3%) |
| 8 or more Rooms | 160,985 (30.5%) | 15,057 (8.2%) |
| Total | 528,230 (100.0%) | 184,511 (100.0%) |
Housing Structure by Heating Type in Area Code 304
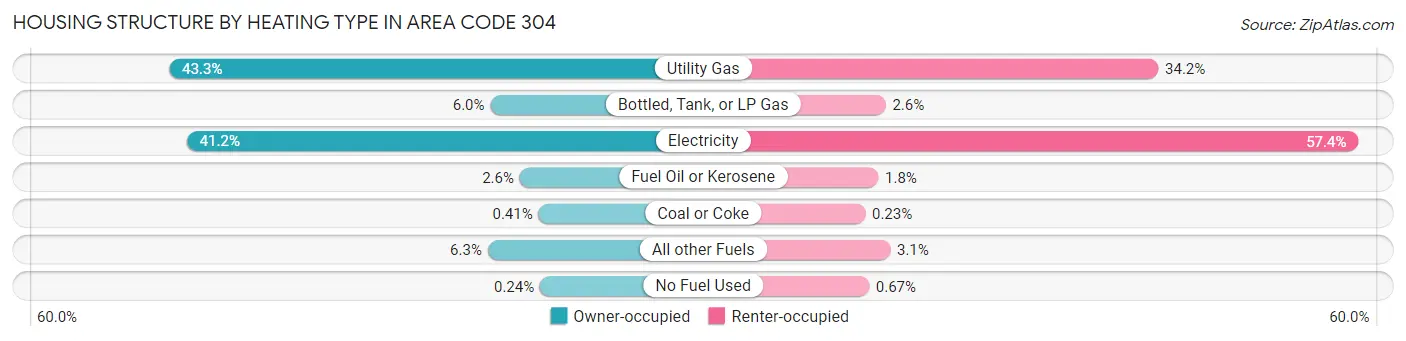
| Heating Type | Owner-occupied | Renter-occupied |
| Utility Gas | 228,435 (43.2%) | 63,114 (34.2%) |
| Bottled, Tank, or LP Gas | 31,716 (6.0%) | 4,806 (2.6%) |
| Electricity | 217,684 (41.2%) | 105,933 (57.4%) |
| Fuel Oil or Kerosene | 13,671 (2.6%) | 3,221 (1.8%) |
| Coal or Coke | 2,183 (0.4%) | 425 (0.2%) |
| All other Fuels | 33,263 (6.3%) | 5,773 (3.1%) |
| No Fuel Used | 1,278 (0.2%) | 1,239 (0.7%) |
| Total | 528,230 (100.0%) | 184,511 (100.0%) |
Household Vehicle Usage in Area Code 304
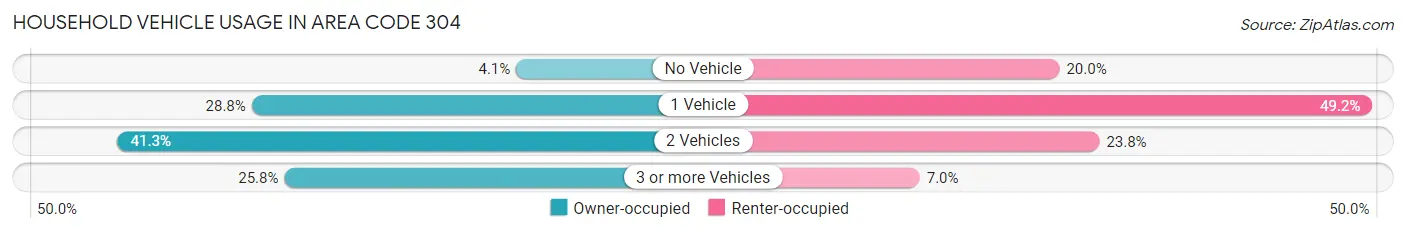
| Vehicles per Household | Owner-occupied | Renter-occupied |
| No Vehicle | 21,742 (4.1%) | 36,955 (20.0%) |
| 1 Vehicle | 152,207 (28.8%) | 90,823 (49.2%) |
| 2 Vehicles | 218,191 (41.3%) | 43,839 (23.8%) |
| 3 or more Vehicles | 136,090 (25.8%) | 12,894 (7.0%) |
| Total | 528,230 (100.0%) | 184,511 (100.0%) |
Real Estate & Mortgages in Area Code 304
Real Estate and Mortgage Overview in Area Code 304
| Characteristic | Without Mortgage | With Mortgage |
| Housing Units | 281,321 | 246,909 |
| Median Property Value | $56,429,096 | $63,756,699 |
| Median Household Income | $24,520,103 | $46,828 |
| Monthly Housing Costs | $205,596 | $6,715 |
| Real Estate Taxes | $298,588 | $7,291 |
Property Value by Mortgage Status in Area Code 304
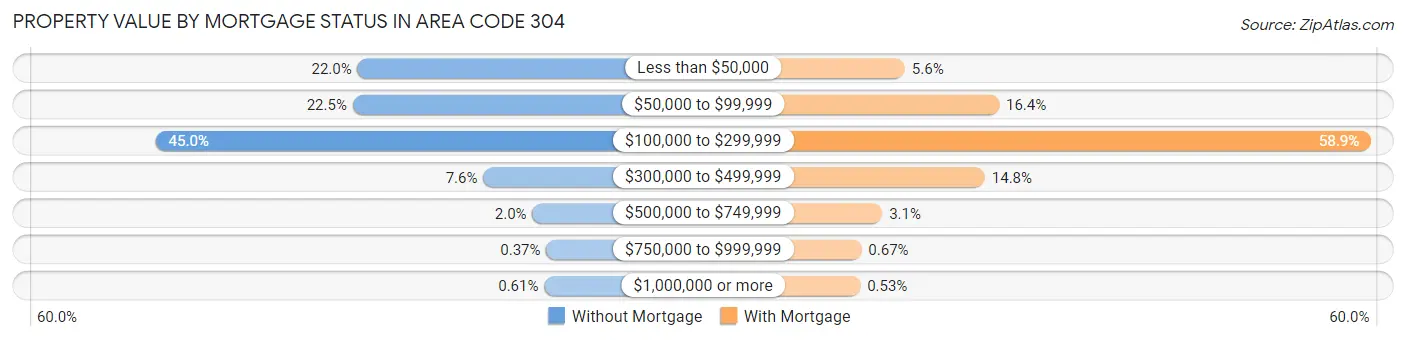
| Property Value | Without Mortgage | With Mortgage |
| Less than $50,000 | 61,753 (22.0%) | 13,937 (5.6%) |
| $50,000 to $99,999 | 63,311 (22.5%) | 40,497 (16.4%) |
| $100,000 to $299,999 | 126,657 (45.0%) | 145,489 (58.9%) |
| $300,000 to $499,999 | 21,314 (7.6%) | 36,481 (14.8%) |
| $500,000 to $749,999 | 5,527 (2.0%) | 7,538 (3.0%) |
| $750,000 to $999,999 | 1,054 (0.4%) | 1,666 (0.7%) |
| $1,000,000 or more | 1,705 (0.6%) | 1,301 (0.5%) |
| Total | 281,321 (100.0%) | 246,909 (100.0%) |
Household Income by Mortgage Status in Area Code 304
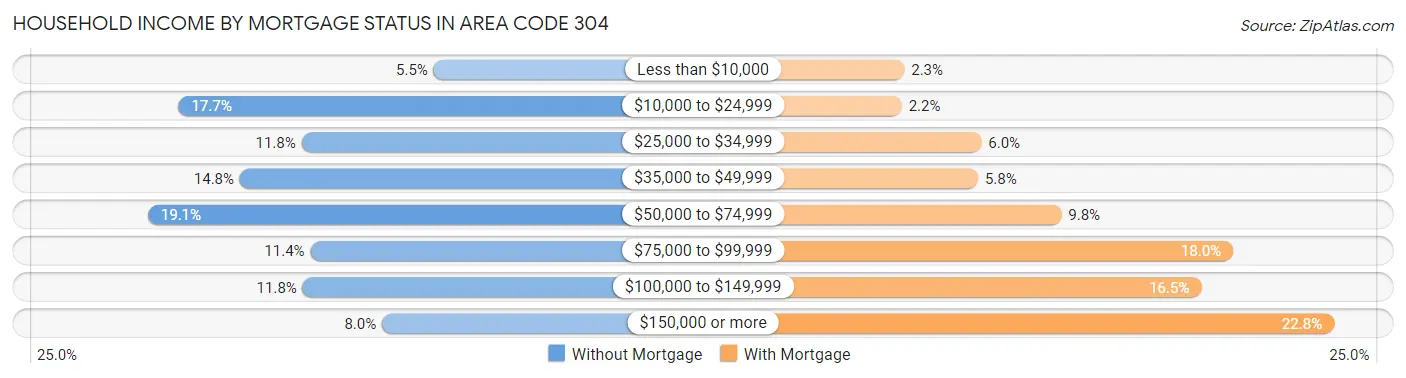
| Household Income | Without Mortgage | With Mortgage |
| Less than $10,000 | 15,517 (5.5%) | 5,734 (2.3%) |
| $10,000 to $24,999 | 49,701 (17.7%) | 5,433 (2.2%) |
| $25,000 to $34,999 | 33,233 (11.8%) | 14,794 (6.0%) |
| $35,000 to $49,999 | 41,488 (14.7%) | 14,404 (5.8%) |
| $50,000 to $74,999 | 53,804 (19.1%) | 24,189 (9.8%) |
| $75,000 to $99,999 | 32,050 (11.4%) | 44,383 (18.0%) |
| $100,000 to $149,999 | 33,091 (11.8%) | 40,635 (16.5%) |
| $150,000 or more | 22,437 (8.0%) | 56,243 (22.8%) |
| Total | 281,321 (100.0%) | 246,909 (100.0%) |
Property Value to Household Income Ratio in Area Code 304
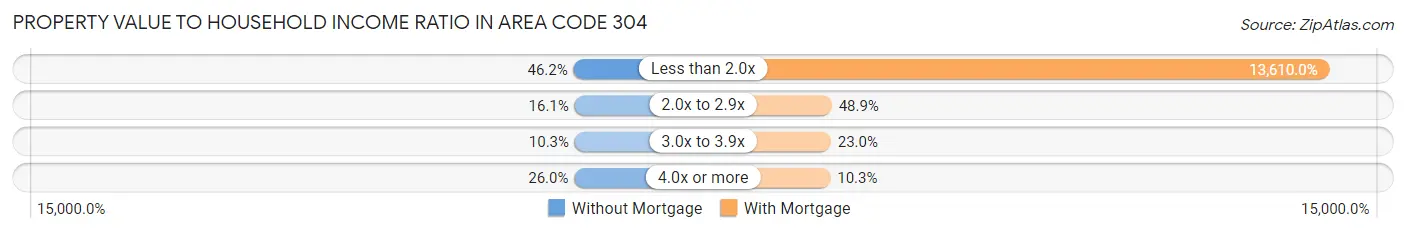
| Value-to-Income Ratio | Without Mortgage | With Mortgage |
| Less than 2.0x | 129,955 (46.2%) | 33,604,402 (13,610.0%) |
| 2.0x to 2.9x | 45,407 (16.1%) | 120,799 (48.9%) |
| 3.0x to 3.9x | 28,911 (10.3%) | 56,718 (23.0%) |
| 4.0x or more | 73,164 (26.0%) | 25,474 (10.3%) |
| Total | 281,321 (100.0%) | 246,909 (100.0%) |
Real Estate Taxes by Mortgage Status in Area Code 304
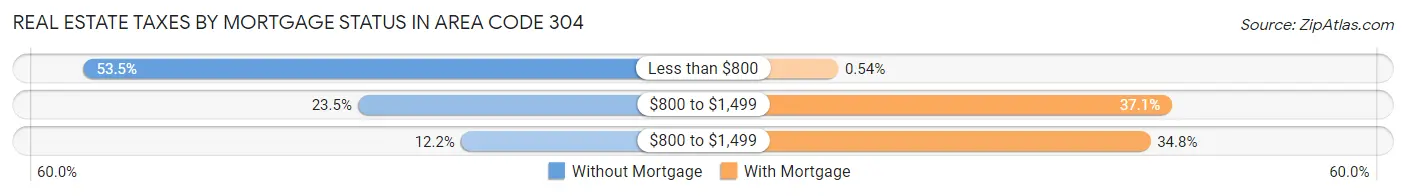
| Property Taxes | Without Mortgage | With Mortgage |
| Less than $800 | 150,602 (53.5%) | 1,329 (0.5%) |
| $800 to $1,499 | 66,079 (23.5%) | 91,702 (37.1%) |
| $800 to $1,499 | 34,362 (12.2%) | 85,815 (34.8%) |
| Total | 281,321 (100.0%) | 246,909 (100.0%) |
Health & Disability in Area Code 304
Health Insurance Coverage by Age in Area Code 304
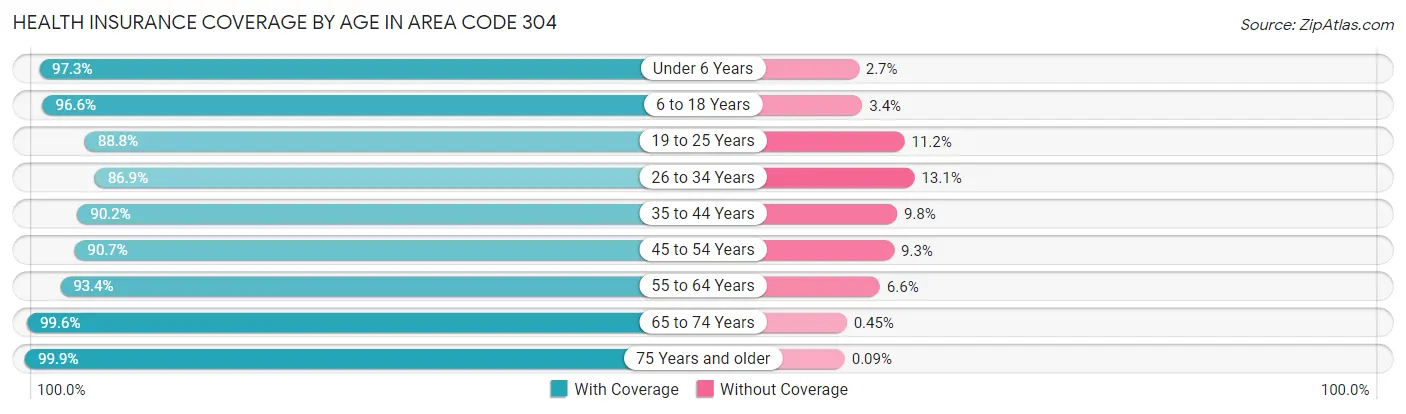
| Age Bracket | With Coverage | Without Coverage |
| Under 6 Years | 105,221 (97.3%) | 2,923 (2.7%) |
| 6 to 18 Years | 265,515 (96.6%) | 9,263 (3.4%) |
| 19 to 25 Years | 137,004 (88.8%) | 17,330 (11.2%) |
| 26 to 34 Years | 157,932 (86.9%) | 23,777 (13.1%) |
| 35 to 44 Years | 186,665 (90.2%) | 20,382 (9.8%) |
| 45 to 54 Years | 202,770 (90.7%) | 20,771 (9.3%) |
| 55 to 64 Years | 230,842 (93.4%) | 16,410 (6.6%) |
| 65 to 74 Years | 214,607 (99.6%) | 975 (0.4%) |
| 75 Years and older | 138,985 (99.9%) | 128 (0.1%) |
| Total | 1,639,541 (93.6%) | 111,959 (6.4%) |
Health Insurance Coverage by Citizenship Status in Area Code 304
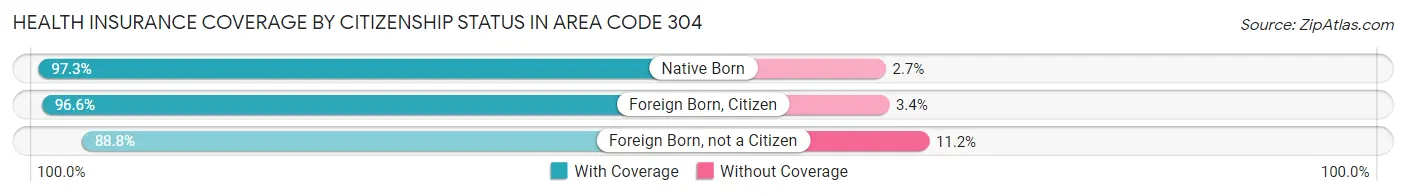
| Citizenship Status | With Coverage | Without Coverage |
| Native Born | 105,221 (97.3%) | 2,923 (2.7%) |
| Foreign Born, Citizen | 265,515 (96.6%) | 9,263 (3.4%) |
| Foreign Born, not a Citizen | 137,004 (88.8%) | 17,330 (11.2%) |
Health Insurance Coverage by Household Income in Area Code 304
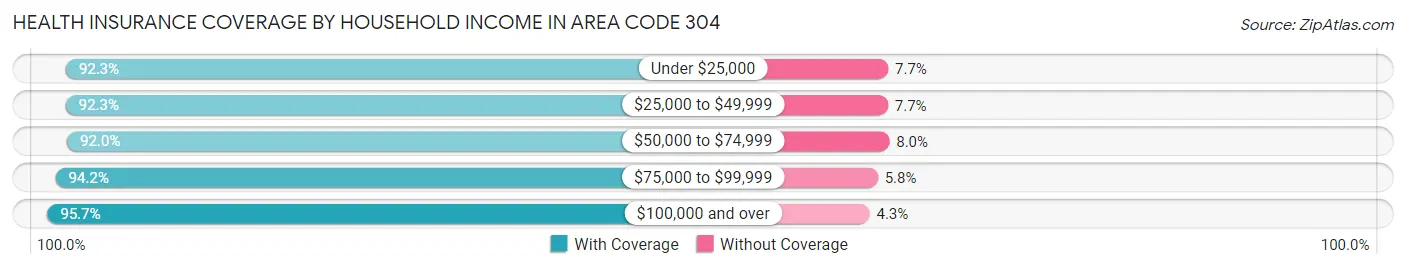
| Household Income | With Coverage | Without Coverage |
| Under $25,000 | 268,993 (92.3%) | 22,581 (7.7%) |
| $25,000 to $49,999 | 316,311 (92.3%) | 26,335 (7.7%) |
| $50,000 to $74,999 | 284,961 (92.0%) | 24,631 (8.0%) |
| $75,000 to $99,999 | 227,422 (94.2%) | 13,969 (5.8%) |
| $100,000 and over | 522,431 (95.7%) | 23,220 (4.3%) |
Public vs Private Health Insurance Coverage by Age in Area Code 304
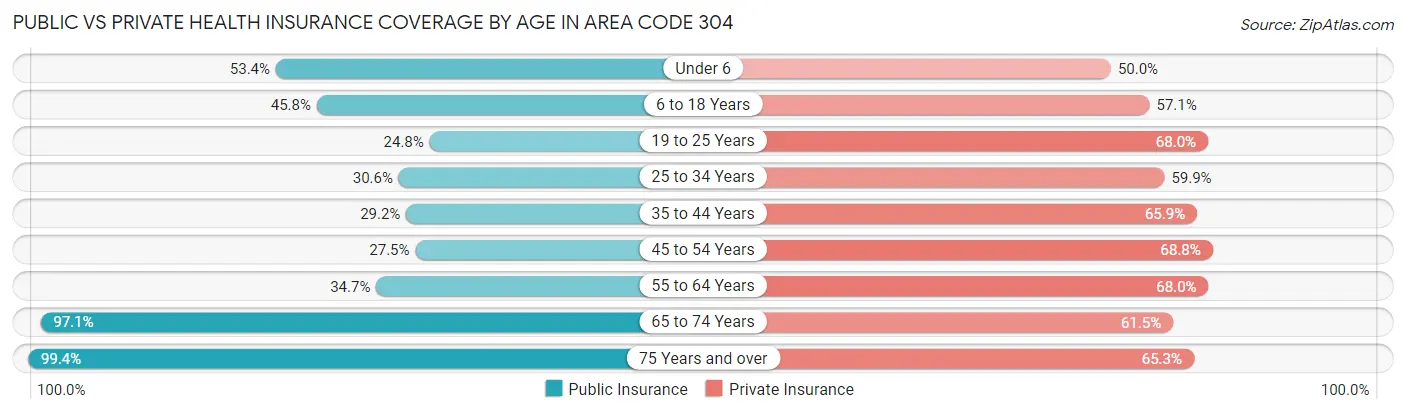
| Age Bracket | Public Insurance | Private Insurance |
| Under 6 | 57,707 (53.4%) | 54,024 (50.0%) |
| 6 to 18 Years | 125,752 (45.8%) | 156,950 (57.1%) |
| 19 to 25 Years | 38,299 (24.8%) | 104,867 (67.9%) |
| 25 to 34 Years | 55,511 (30.5%) | 108,822 (59.9%) |
| 35 to 44 Years | 60,389 (29.2%) | 136,491 (65.9%) |
| 45 to 54 Years | 61,396 (27.5%) | 153,837 (68.8%) |
| 55 to 64 Years | 85,874 (34.7%) | 168,231 (68.0%) |
| 65 to 74 Years | 209,282 (97.1%) | 132,559 (61.5%) |
| 75 Years and over | 138,259 (99.4%) | 90,889 (65.3%) |
| Total | 832,469 (47.5%) | 1,106,670 (63.2%) |
Disability Status by Sex by Age in Area Code 304
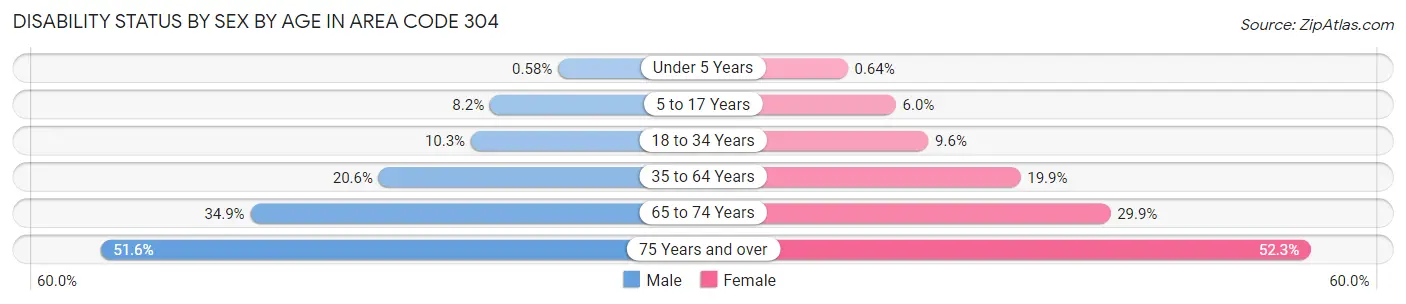
| Age Bracket | Male | Female |
| Under 5 Years | 266 (0.6%) | 281 (0.6%) |
| 5 to 17 Years | 11,257 (8.2%) | 7,779 (6.0%) |
| 18 to 34 Years | 18,995 (10.3%) | 17,022 (9.6%) |
| 35 to 64 Years | 69,160 (20.5%) | 67,856 (19.9%) |
| 65 to 74 Years | 35,998 (34.8%) | 33,564 (29.9%) |
| 75 Years and over | 30,578 (51.6%) | 41,715 (52.3%) |
Disability Class by Sex by Age in Area Code 304
Disability Class: Hearing Difficulty
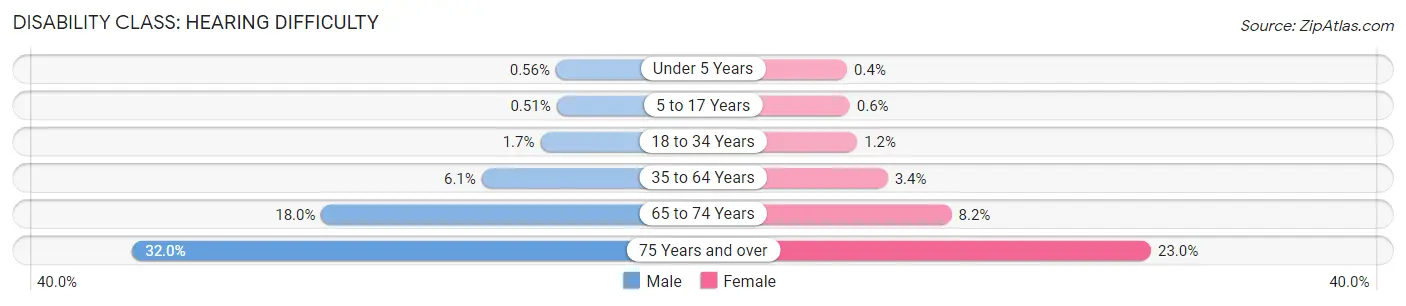
| Age Bracket | Male | Female |
| Under 5 Years | 256 (0.6%) | 176 (0.4%) |
| 5 to 17 Years | 697 (0.5%) | 777 (0.6%) |
| 18 to 34 Years | 3,156 (1.7%) | 2,028 (1.1%) |
| 35 to 64 Years | 20,441 (6.1%) | 11,652 (3.4%) |
| 65 to 74 Years | 18,556 (18.0%) | 9,150 (8.2%) |
| 75 Years and over | 18,975 (32.0%) | 18,325 (23.0%) |
Disability Class: Vision Difficulty
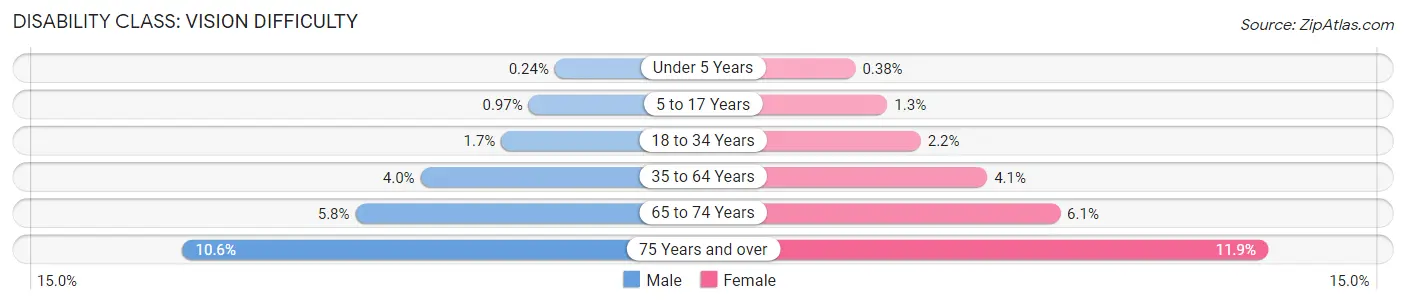
| Age Bracket | Male | Female |
| Under 5 Years | 108 (0.2%) | 167 (0.4%) |
| 5 to 17 Years | 1,338 (1.0%) | 1,651 (1.3%) |
| 18 to 34 Years | 3,201 (1.7%) | 3,887 (2.2%) |
| 35 to 64 Years | 13,408 (4.0%) | 13,808 (4.1%) |
| 65 to 74 Years | 5,985 (5.8%) | 6,822 (6.1%) |
| 75 Years and over | 6,283 (10.6%) | 9,469 (11.9%) |
Disability Class: Cognitive Difficulty
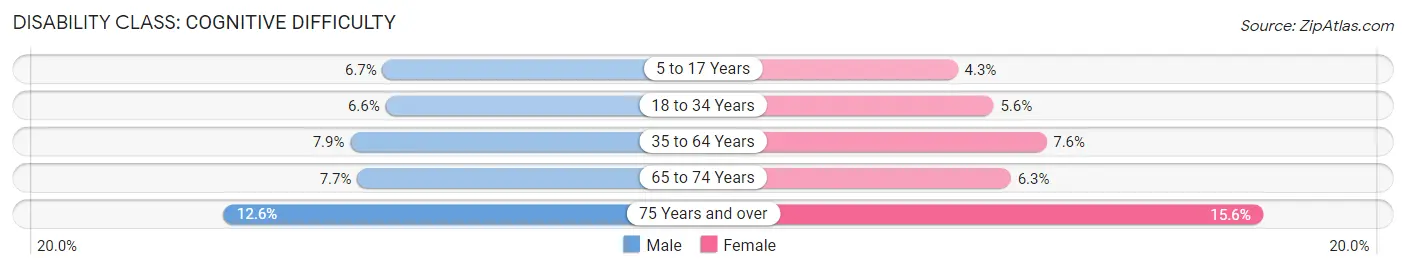
| Age Bracket | Male | Female |
| 5 to 17 Years | 9,238 (6.7%) | 5,581 (4.3%) |
| 18 to 34 Years | 12,185 (6.6%) | 9,971 (5.6%) |
| 35 to 64 Years | 26,622 (7.9%) | 25,911 (7.6%) |
| 65 to 74 Years | 7,897 (7.6%) | 7,037 (6.3%) |
| 75 Years and over | 7,469 (12.6%) | 12,470 (15.6%) |
Disability Class: Ambulatory Difficulty
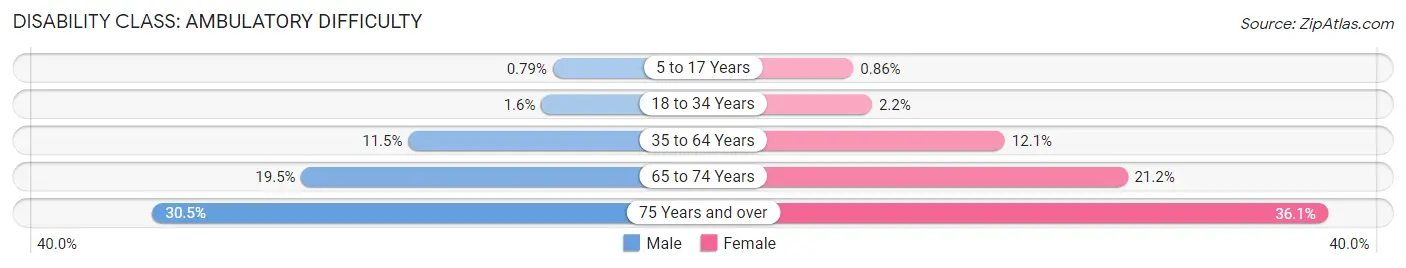
| Age Bracket | Male | Female |
| 5 to 17 Years | 1,089 (0.8%) | 1,122 (0.9%) |
| 18 to 34 Years | 3,022 (1.6%) | 3,965 (2.2%) |
| 35 to 64 Years | 38,739 (11.5%) | 41,310 (12.1%) |
| 65 to 74 Years | 20,094 (19.5%) | 23,821 (21.2%) |
| 75 Years and over | 18,083 (30.5%) | 28,784 (36.1%) |
Disability Class: Self-Care Difficulty
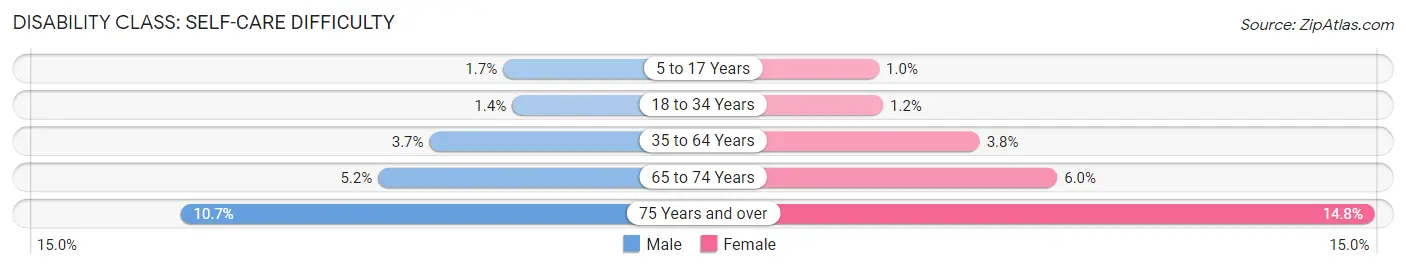
| Age Bracket | Male | Female |
| 5 to 17 Years | 2,319 (1.7%) | 1,346 (1.0%) |
| 18 to 34 Years | 2,631 (1.4%) | 2,037 (1.1%) |
| 35 to 64 Years | 12,556 (3.7%) | 13,114 (3.8%) |
| 65 to 74 Years | 5,326 (5.2%) | 6,734 (6.0%) |
| 75 Years and over | 6,321 (10.7%) | 11,843 (14.8%) |
Technology Access in Area Code 304
Computing Device Access in Area Code 304
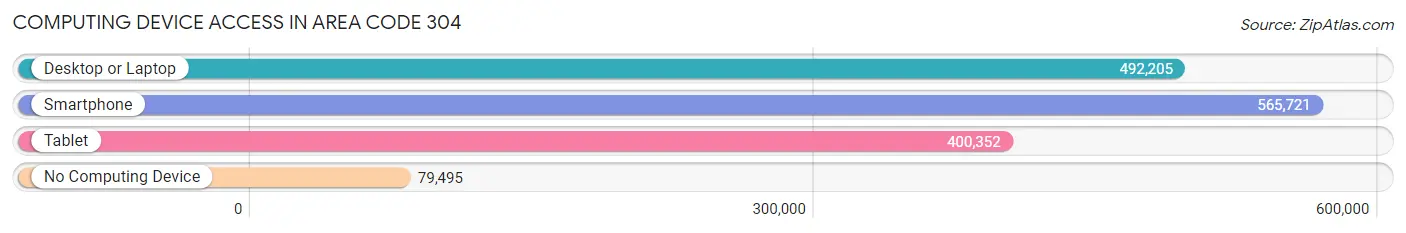
| Device Type | # Households | % Households |
| Desktop or Laptop | 492,205 | 69.1% |
| Smartphone | 565,721 | 79.4% |
| Tablet | 400,352 | 56.2% |
| No Computing Device | 79,495 | 11.2% |
| Total | 712,741 | 100.0% |
Internet Access in Area Code 304
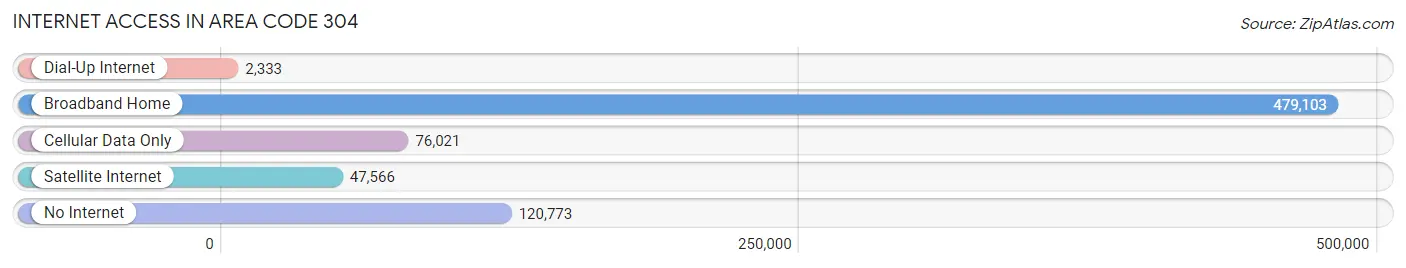
| Internet Type | # Households | % Households |
| Dial-Up Internet | 2,333 | 0.3% |
| Broadband Home | 479,103 | 67.2% |
| Cellular Data Only | 76,021 | 10.7% |
| Satellite Internet | 47,566 | 6.7% |
| No Internet | 120,773 | 16.9% |
| Total | 712,741 | 100.0% |
Area Code 304 Summary
Geography
Area code 304 is located in the state of West Virginia. It covers the entire state, including the cities of Charleston, Huntington, Parkersburg, Morgantown, and Wheeling.
Social
Area code 304 is home to a diverse population of people from all walks of life. The area is known for its friendly and welcoming atmosphere, and its residents are proud of their heritage and culture.
Economics
Area code 304 is home to a variety of industries, including manufacturing, energy, healthcare, and tourism. The area is also home to several universities and colleges, making it a great place for students to pursue their education.
Demographics
Area code 304 is home to a population of over 1.8 million people. The population is largely white, with a small percentage of African Americans, Hispanics, and Asians. The median household income is around $45,000, and the unemployment rate is around 4%.
Common Questions
What is Per Capita Income in Area Code 304?
Per Capita income in Area Code 304 is $26,671.
What is the Median Family Income in Area Code 304?
Median Family Income in Area Code 304 is $67,501.
What is the Median Household income in Area Code 304?
Median Household Income in Area Code 304 is $54,001.
What is Income or Wage Gap in Area Code 304?
Income or Wage Gap in Area Code 304 is 33.7%.
Women in Area Code 304 earn 66.3 cents for every dollar earned by a man.
What is Family Income Deficit in Area Code 304?
Family Income Deficit in Area Code 304 is $10,300.
Families that are below poverty line in Area Code 304 earn $10,300 less on average than the poverty threshold level.
What is Inequality or Gini Index in Area Code 304?
Inequality or Gini Index in Area Code 304 is 268.66.
What is the Total Population of Area Code 304?
Total Population of Area Code 304 is 1,784,945.
What is the Total Male Population of Area Code 304?
Total Male Population of Area Code 304 is 890,521.
What is the Total Female Population of Area Code 304?
Total Female Population of Area Code 304 is 894,424.
What is the Ratio of Males per 100 Females in Area Code 304?
There are 99.56 Males per 100 Females in Area Code 304.
What is the Ratio of Females per 100 Males in Area Code 304?
There are 100.44 Females per 100 Males in Area Code 304.
What is the Median Population Age in Area Code 304?
Median Population Age in Area Code 304 is 45.8 Years.
What is the Average Family Size in Area Code 304
Average Family Size in Area Code 304 is 3.2 People.
What is the Average Household Size in Area Code 304
Average Household Size in Area Code 304 is 2.6 People.
How Large is the Labor Force in Area Code 304?
There are 687,990 People in the Labor Forcein in Area Code 304.
What is the Percentage of People in the Labor Force in Area Code 304?
46.8% of People are in the Labor Force in Area Code 304.
What is the Unemployment Rate in Area Code 304?
Unemployment Rate in Area Code 304 is 11.1%.