St Joe, AR Map & Demographics
St Joe Map
St Joe Overview
$20,727
PER CAPITA INCOME
$66,042
AVG FAMILY INCOME
$62,750
AVG HOUSEHOLD INCOME
0.31
INEQUALITY / GINI INDEX
207
TOTAL POPULATION
140
MALE POPULATION
67
FEMALE POPULATION
208.96
MALES / 100 FEMALES
47.86
FEMALES / 100 MALES
36.6
MEDIAN AGE
3.5
AVG FAMILY SIZE
2.6
AVG HOUSEHOLD SIZE
112
LABOR FORCE [ PEOPLE ]
68.7%
PERCENT IN LABOR FORCE
8.9%
UNEMPLOYMENT RATE
Income in St Joe
Income Overview in St Joe
Per Capita Income in St Joe is $20,727, while median incomes of families and households are $66,042 and $62,750 respectively.
| Characteristic | Number | Measure |
| Per Capita Income | 207 | $20,727 |
| Median Family Income | 50 | $66,042 |
| Mean Family Income | 50 | $63,260 |
| Median Household Income | 80 | $62,750 |
| Mean Household Income | 80 | $54,295 |
| Income Deficit | 50 | $0 |
| Wage / Income Gap (%) | 207 | 0.00% |
| Wage / Income Gap ($) | 207 | 100.00¢ per $1 |
| Gini / Inequality Index | 207 | 0.31 |
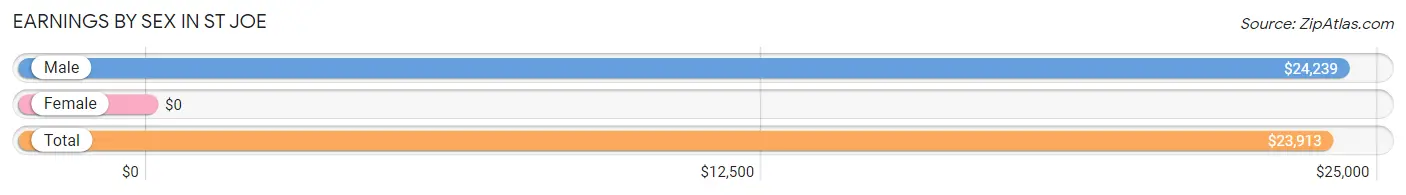
Earnings by Sex in St Joe
| Sex | Number | Average Earnings |
| Male | 70 (62.5%) | $24,239 |
| Female | 42 (37.5%) | $0 |
| Total | 112 (100.0%) | $23,913 |
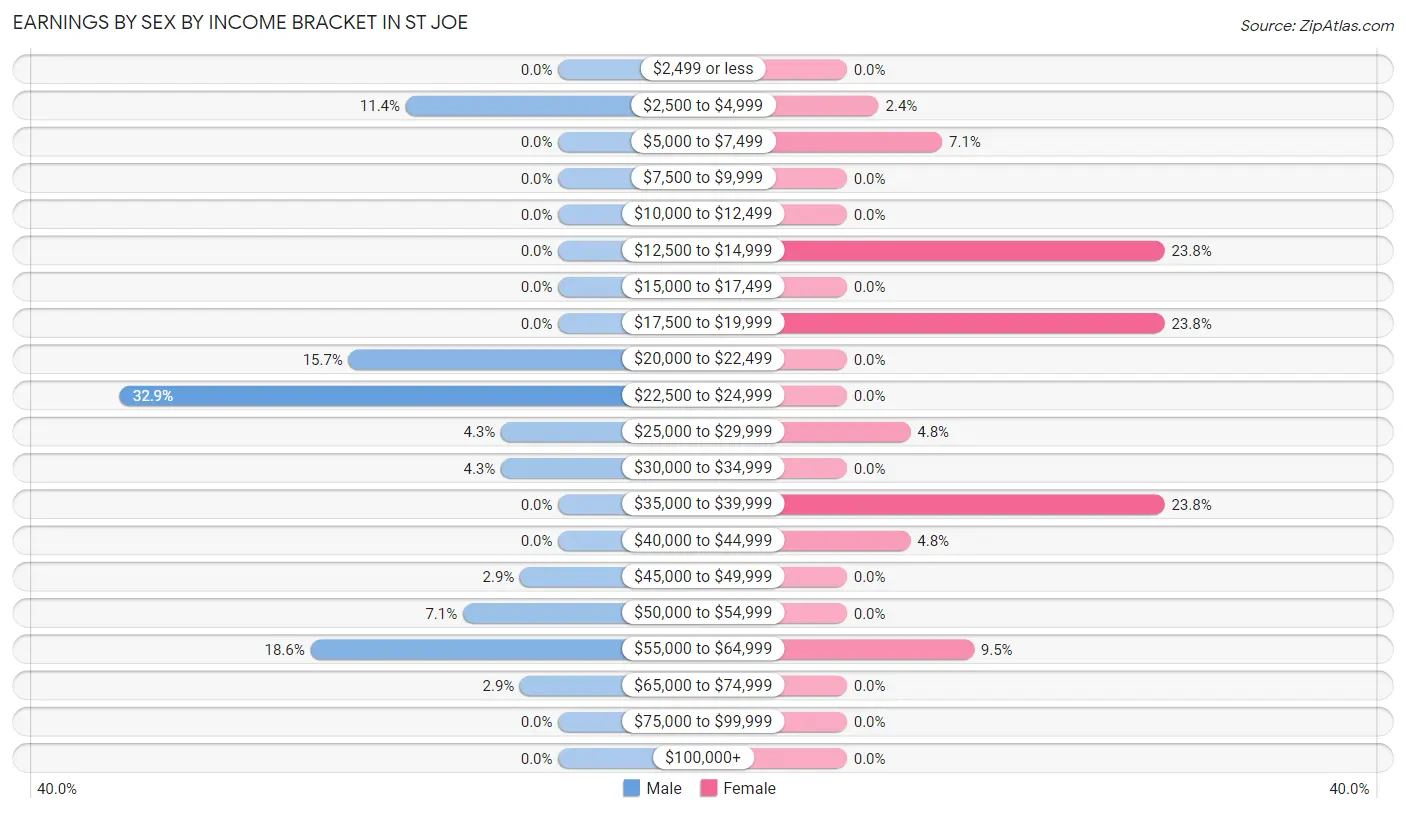
Earnings by Sex by Income Bracket in St Joe
The most common earnings brackets in St Joe are $22,500 to $24,999 for men (23 | 32.9%) and $12,500 to $14,999 for women (10 | 23.8%).
| Income | Male | Female |
| $2,499 or less | 0 (0.0%) | 0 (0.0%) |
| $2,500 to $4,999 | 8 (11.4%) | 1 (2.4%) |
| $5,000 to $7,499 | 0 (0.0%) | 3 (7.1%) |
| $7,500 to $9,999 | 0 (0.0%) | 0 (0.0%) |
| $10,000 to $12,499 | 0 (0.0%) | 0 (0.0%) |
| $12,500 to $14,999 | 0 (0.0%) | 10 (23.8%) |
| $15,000 to $17,499 | 0 (0.0%) | 0 (0.0%) |
| $17,500 to $19,999 | 0 (0.0%) | 10 (23.8%) |
| $20,000 to $22,499 | 11 (15.7%) | 0 (0.0%) |
| $22,500 to $24,999 | 23 (32.9%) | 0 (0.0%) |
| $25,000 to $29,999 | 3 (4.3%) | 2 (4.8%) |
| $30,000 to $34,999 | 3 (4.3%) | 0 (0.0%) |
| $35,000 to $39,999 | 0 (0.0%) | 10 (23.8%) |
| $40,000 to $44,999 | 0 (0.0%) | 2 (4.8%) |
| $45,000 to $49,999 | 2 (2.9%) | 0 (0.0%) |
| $50,000 to $54,999 | 5 (7.1%) | 0 (0.0%) |
| $55,000 to $64,999 | 13 (18.6%) | 4 (9.5%) |
| $65,000 to $74,999 | 2 (2.9%) | 0 (0.0%) |
| $75,000 to $99,999 | 0 (0.0%) | 0 (0.0%) |
| $100,000+ | 0 (0.0%) | 0 (0.0%) |
| Total | 70 (100.0%) | 42 (100.0%) |
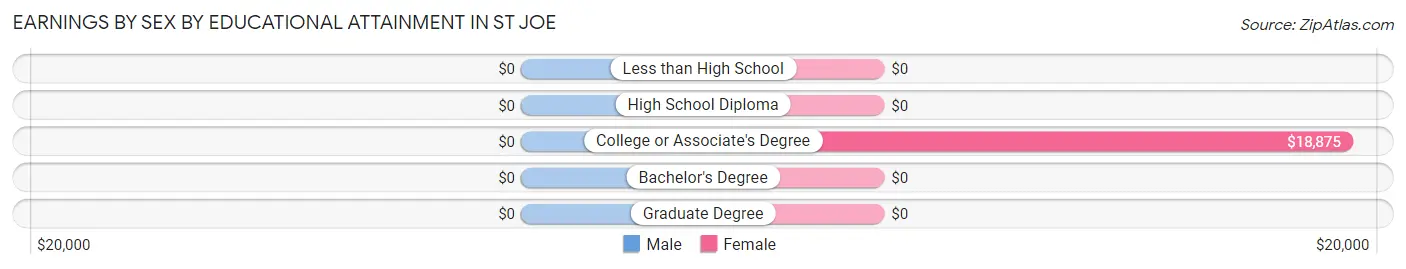
Earnings by Sex by Educational Attainment in St Joe
| Educational Attainment | Male Income | Female Income |
| Less than High School | - | - |
| High School Diploma | - | - |
| College or Associate's Degree | - | - |
| Bachelor's Degree | - | - |
| Graduate Degree | - | - |
| Total | - | - |
Family Income in St Joe
Family Income Brackets in St Joe
According to the St Joe family income data, there are 16 families falling into the $25,000 to $34,999 income range, which is the most common income bracket and makes up 32.0% of all families.
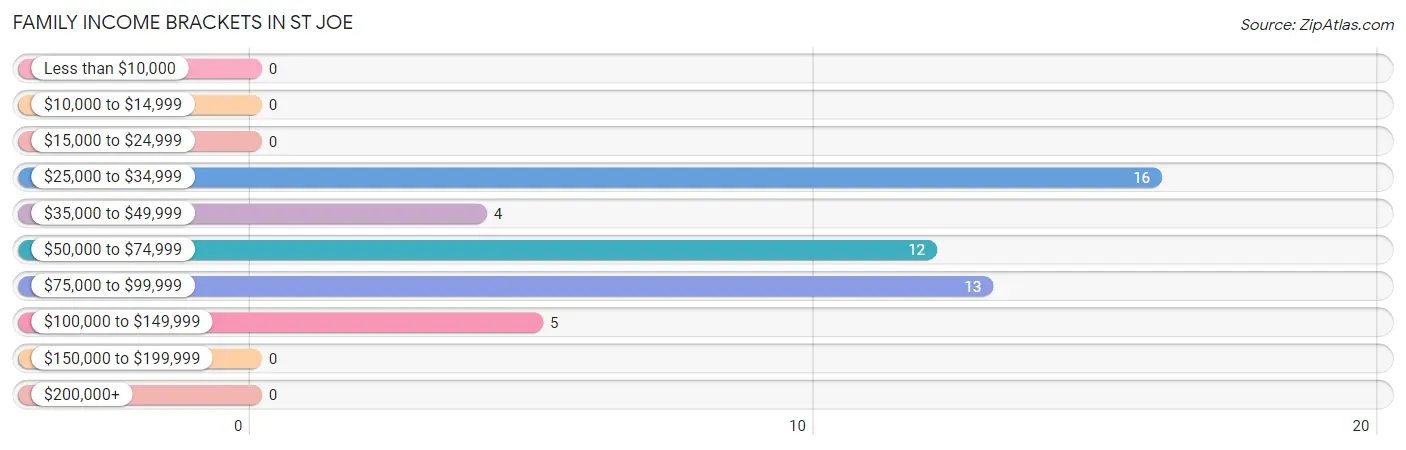
| Income Bracket | # Families | % Families |
| Less than $10,000 | 0 | 0.0% |
| $10,000 to $14,999 | 0 | 0.0% |
| $15,000 to $24,999 | 0 | 0.0% |
| $25,000 to $34,999 | 16 | 32.0% |
| $35,000 to $49,999 | 4 | 8.0% |
| $50,000 to $74,999 | 12 | 24.0% |
| $75,000 to $99,999 | 13 | 26.0% |
| $100,000 to $149,999 | 5 | 10.0% |
| $150,000 to $199,999 | 0 | 0.0% |
| $200,000+ | 0 | 0.0% |
Family Income by Famaliy Size in St Joe
2-person families (23 | 46.0%) account for the highest median family income in St Joe with $65,938 per family, while 2-person families (23 | 46.0%) have the highest median income of $32,969 per family member.
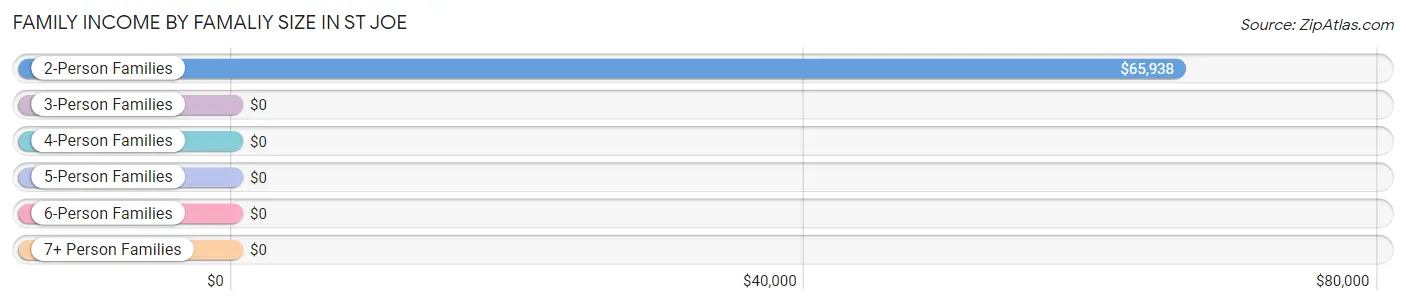
| Income Bracket | # Families | Median Income |
| 2-Person Families | 23 (46.0%) | $65,938 |
| 3-Person Families | 11 (22.0%) | $0 |
| 4-Person Families | 3 (6.0%) | $0 |
| 5-Person Families | 13 (26.0%) | $0 |
| 6-Person Families | 0 (0.0%) | $0 |
| 7+ Person Families | 0 (0.0%) | $0 |
| Total | 50 (100.0%) | $66,042 |
Family Income by Number of Earners in St Joe
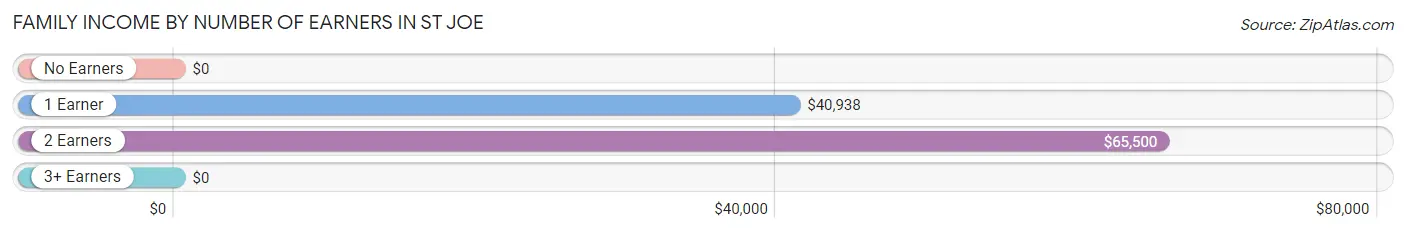
| Number of Earners | # Families | Median Income |
| No Earners | 3 (6.0%) | $0 |
| 1 Earner | 9 (18.0%) | $40,938 |
| 2 Earners | 24 (48.0%) | $65,500 |
| 3+ Earners | 14 (28.0%) | $0 |
| Total | 50 (100.0%) | $66,042 |
Household Income in St Joe
Household Income Brackets in St Joe
With 22 households falling in the category, the $50,000 to $74,999 income range is the most frequent in St Joe, accounting for 27.5% of all households.
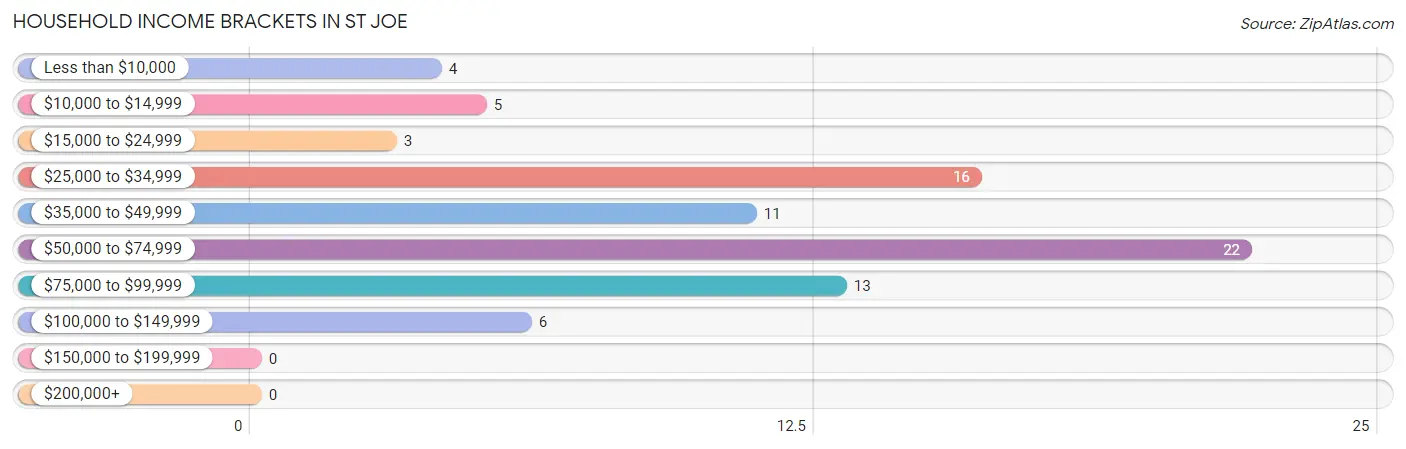
| Income Bracket | # Households | % Households |
| Less than $10,000 | 4 | 5.0% |
| $10,000 to $14,999 | 5 | 6.3% |
| $15,000 to $24,999 | 3 | 3.8% |
| $25,000 to $34,999 | 16 | 20.0% |
| $35,000 to $49,999 | 11 | 13.8% |
| $50,000 to $74,999 | 22 | 27.5% |
| $75,000 to $99,999 | 13 | 16.3% |
| $100,000 to $149,999 | 6 | 7.5% |
| $150,000 to $199,999 | 0 | 0.0% |
| $200,000+ | 0 | 0.0% |
Household Income by Householder Age in St Joe
The median household income in St Joe is $62,750, with the highest median household income of $66,875 found in the 45 to 64 years age bracket for the primary householder. A total of 32 households (40.0%) fall into this category. Meanwhile, the 15 to 24 years age bracket for the primary householder has the lowest median household income of $0, with 2 households (2.5%) in this group.
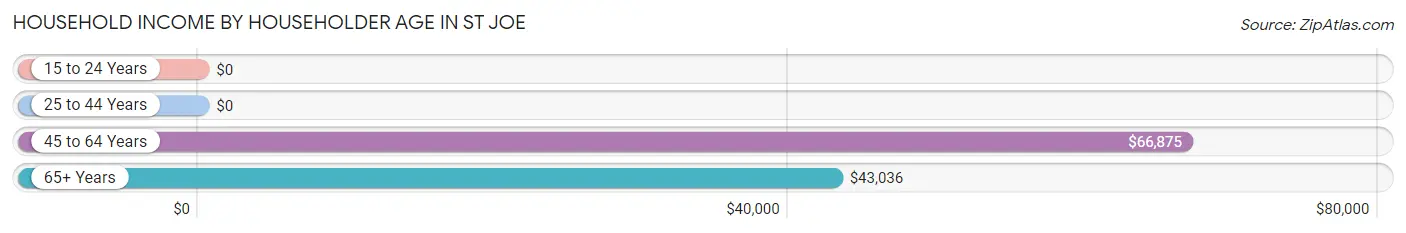
| Income Bracket | # Households | Median Income |
| 15 to 24 Years | 2 (2.5%) | $0 |
| 25 to 44 Years | 33 (41.2%) | $0 |
| 45 to 64 Years | 32 (40.0%) | $66,875 |
| 65+ Years | 13 (16.3%) | $43,036 |
| Total | 80 (100.0%) | $62,750 |
Poverty in St Joe
Income Below Poverty by Sex and Age in St Joe
With 38.6% poverty level for males and 43.3% for females among the residents of St Joe, 6 to 11 year old males and 12 to 14 year old females are the most vulnerable to poverty, with 22 males (100.0%) and 10 females (100.0%) in their respective age groups living below the poverty level.
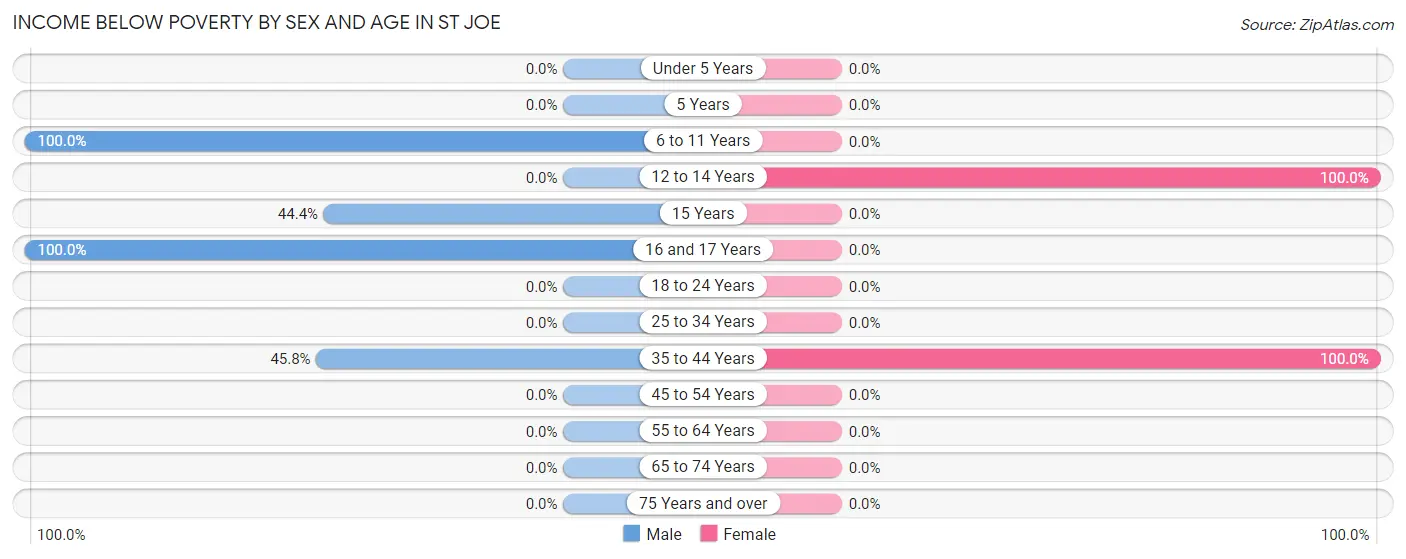
| Age Bracket | Male | Female |
| Under 5 Years | 0 (0.0%) | 0 (0.0%) |
| 5 Years | 0 (0.0%) | 0 (0.0%) |
| 6 to 11 Years | 22 (100.0%) | 0 (0.0%) |
| 12 to 14 Years | 0 (0.0%) | 10 (100.0%) |
| 15 Years | 4 (44.4%) | 0 (0.0%) |
| 16 and 17 Years | 17 (100.0%) | 0 (0.0%) |
| 18 to 24 Years | 0 (0.0%) | 0 (0.0%) |
| 25 to 34 Years | 0 (0.0%) | 0 (0.0%) |
| 35 to 44 Years | 11 (45.8%) | 19 (100.0%) |
| 45 to 54 Years | 0 (0.0%) | 0 (0.0%) |
| 55 to 64 Years | 0 (0.0%) | 0 (0.0%) |
| 65 to 74 Years | 0 (0.0%) | 0 (0.0%) |
| 75 Years and over | 0 (0.0%) | 0 (0.0%) |
| Total | 54 (38.6%) | 29 (43.3%) |
Income Above Poverty by Sex and Age in St Joe
According to the poverty statistics in St Joe, males aged 18 to 24 years and females aged 6 to 11 years are the age groups that are most secure financially, with 100.0% of males and 100.0% of females in these age groups living above the poverty line.
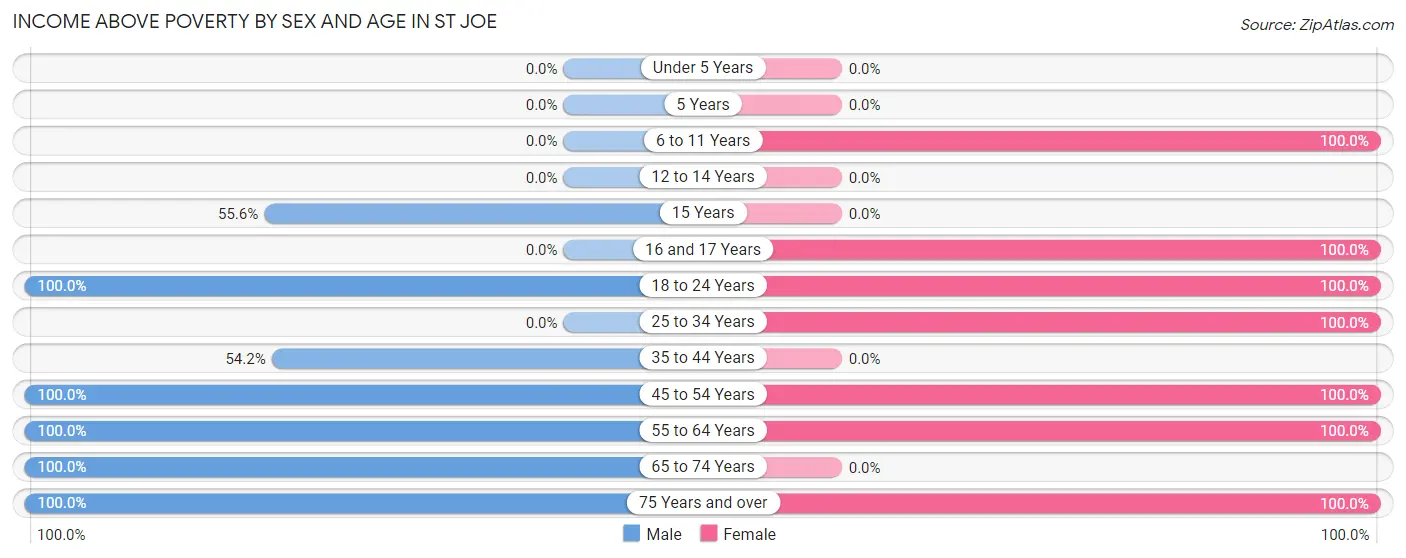
| Age Bracket | Male | Female |
| Under 5 Years | 0 (0.0%) | 0 (0.0%) |
| 5 Years | 0 (0.0%) | 0 (0.0%) |
| 6 to 11 Years | 0 (0.0%) | 3 (100.0%) |
| 12 to 14 Years | 0 (0.0%) | 0 (0.0%) |
| 15 Years | 5 (55.6%) | 0 (0.0%) |
| 16 and 17 Years | 0 (0.0%) | 1 (100.0%) |
| 18 to 24 Years | 26 (100.0%) | 2 (100.0%) |
| 25 to 34 Years | 0 (0.0%) | 2 (100.0%) |
| 35 to 44 Years | 13 (54.2%) | 0 (0.0%) |
| 45 to 54 Years | 13 (100.0%) | 14 (100.0%) |
| 55 to 64 Years | 11 (100.0%) | 15 (100.0%) |
| 65 to 74 Years | 11 (100.0%) | 0 (0.0%) |
| 75 Years and over | 7 (100.0%) | 1 (100.0%) |
| Total | 86 (61.4%) | 38 (56.7%) |
Income Below Poverty Among Married-Couple Families in St Joe
The poverty statistics for married-couple families in St Joe show that 27.7% or 13 of the total 47 families live below the poverty line. Families with 1 or 2 children have the highest poverty rate of 100.0%, comprising of 3 families. On the other hand, families with no children have the lowest poverty rate of 0.0%, which includes 0 families.
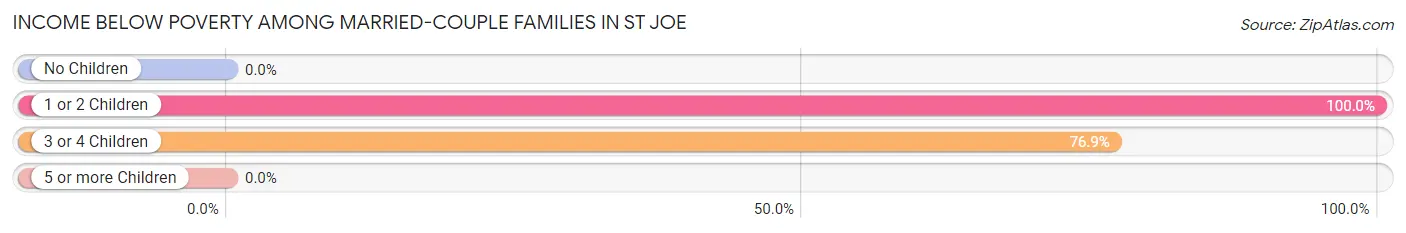
| Children | Above Poverty | Below Poverty |
| No Children | 31 (100.0%) | 0 (0.0%) |
| 1 or 2 Children | 0 (0.0%) | 3 (100.0%) |
| 3 or 4 Children | 3 (23.1%) | 10 (76.9%) |
| 5 or more Children | 0 (0.0%) | 0 (0.0%) |
| Total | 34 (72.3%) | 13 (27.7%) |
Income Below Poverty Among Single-Parent Households in St Joe
| Children | Single Father | Single Mother |
| No Children | 0 (0.0%) | 0 (0.0%) |
| 1 or 2 Children | 0 (0.0%) | 0 (0.0%) |
| 3 or 4 Children | 0 (0.0%) | 0 (0.0%) |
| 5 or more Children | 0 (0.0%) | 0 (0.0%) |
| Total | 0 (0.0%) | 0 (0.0%) |
Income Below Poverty Among Married-Couple vs Single-Parent Households in St Joe
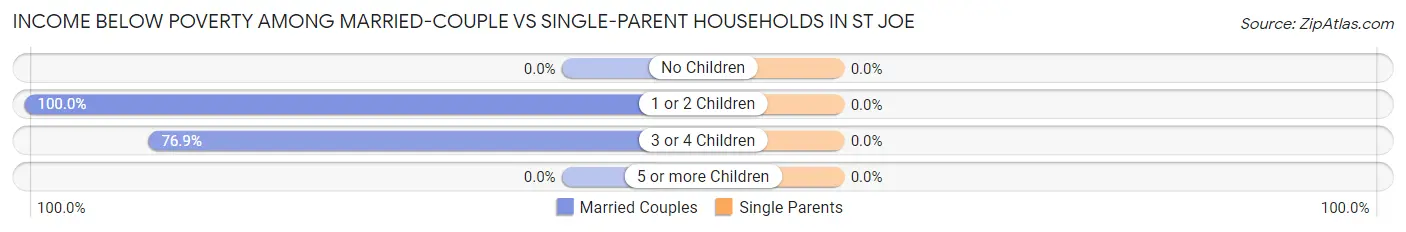
| Children | Married-Couple Families | Single-Parent Households |
| No Children | 0 (0.0%) | 0 (0.0%) |
| 1 or 2 Children | 3 (100.0%) | 0 (0.0%) |
| 3 or 4 Children | 10 (76.9%) | 0 (0.0%) |
| 5 or more Children | 0 (0.0%) | 0 (0.0%) |
| Total | 13 (27.7%) | 0 (0.0%) |
Race in St Joe
The most populous races in St Joe are White / Caucasian (195 | 94.2%), and Native / Alaskan (12 | 5.8%).
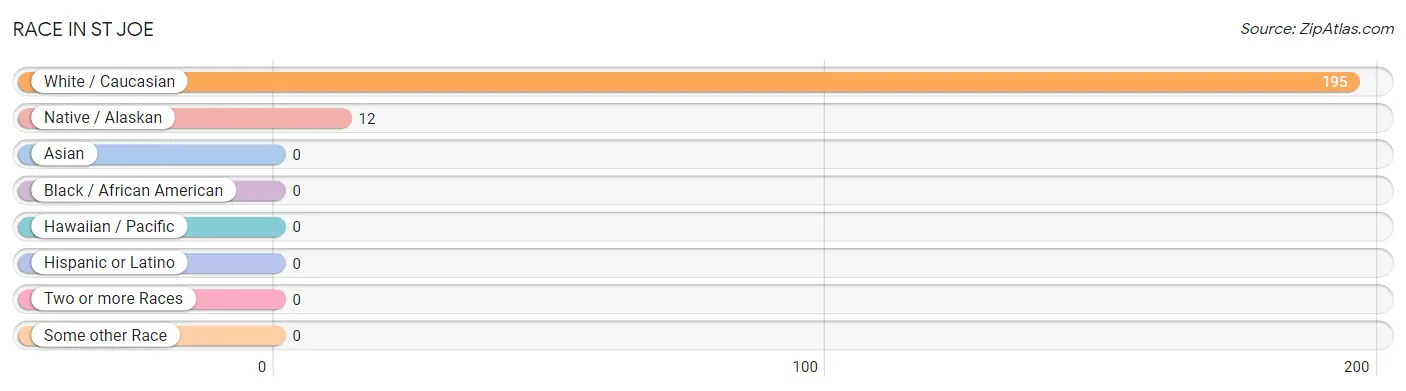
| Race | # Population | % Population |
| Asian | 0 | 0.0% |
| Black / African American | 0 | 0.0% |
| Hawaiian / Pacific | 0 | 0.0% |
| Hispanic or Latino | 0 | 0.0% |
| Native / Alaskan | 12 | 5.8% |
| White / Caucasian | 195 | 94.2% |
| Two or more Races | 0 | 0.0% |
| Some other Race | 0 | 0.0% |
| Total | 207 | 100.0% |
Ancestry in St Joe
The most populous ancestries reported in St Joe are English (63 | 30.4%), German (62 | 29.9%), Choctaw (10 | 4.8%), Scottish (10 | 4.8%), and Swedish (10 | 4.8%), together accounting for 74.9% of all St Joe residents.
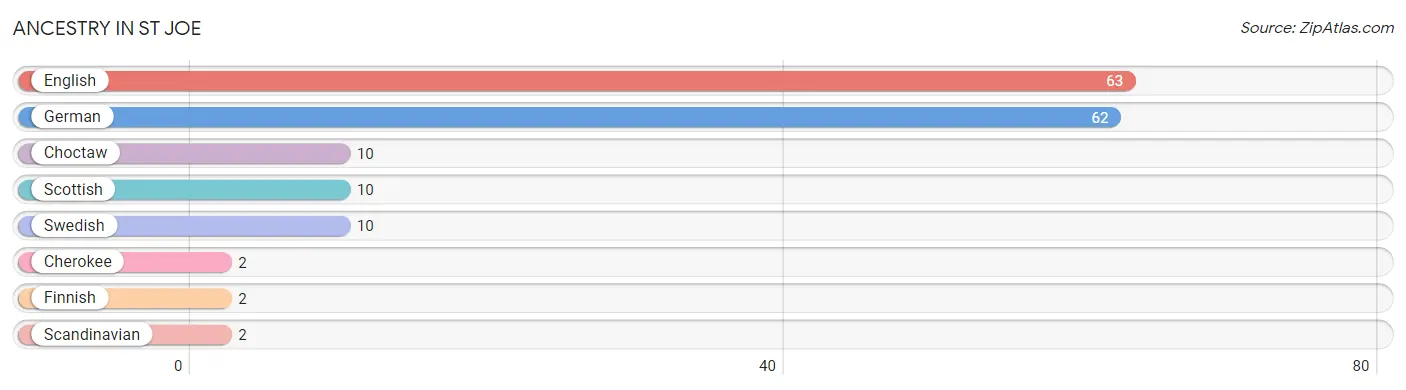
| Ancestry | # Population | % Population |
| Cherokee | 2 | 1.0% |
| Choctaw | 10 | 4.8% |
| English | 63 | 30.4% |
| Finnish | 2 | 1.0% |
| German | 62 | 29.9% |
| Scandinavian | 2 | 1.0% |
| Scottish | 10 | 4.8% |
| Swedish | 10 | 4.8% | View All 8 Rows |
Immigrants in St Joe

| Immigration Origin | # Population | % Population | View All 0 Rows |
Sex and Age in St Joe
Sex and Age in St Joe
The most populous age groups in St Joe are 15 to 19 Years (26 | 18.6%) for men and 35 to 39 Years (19 | 28.4%) for women.
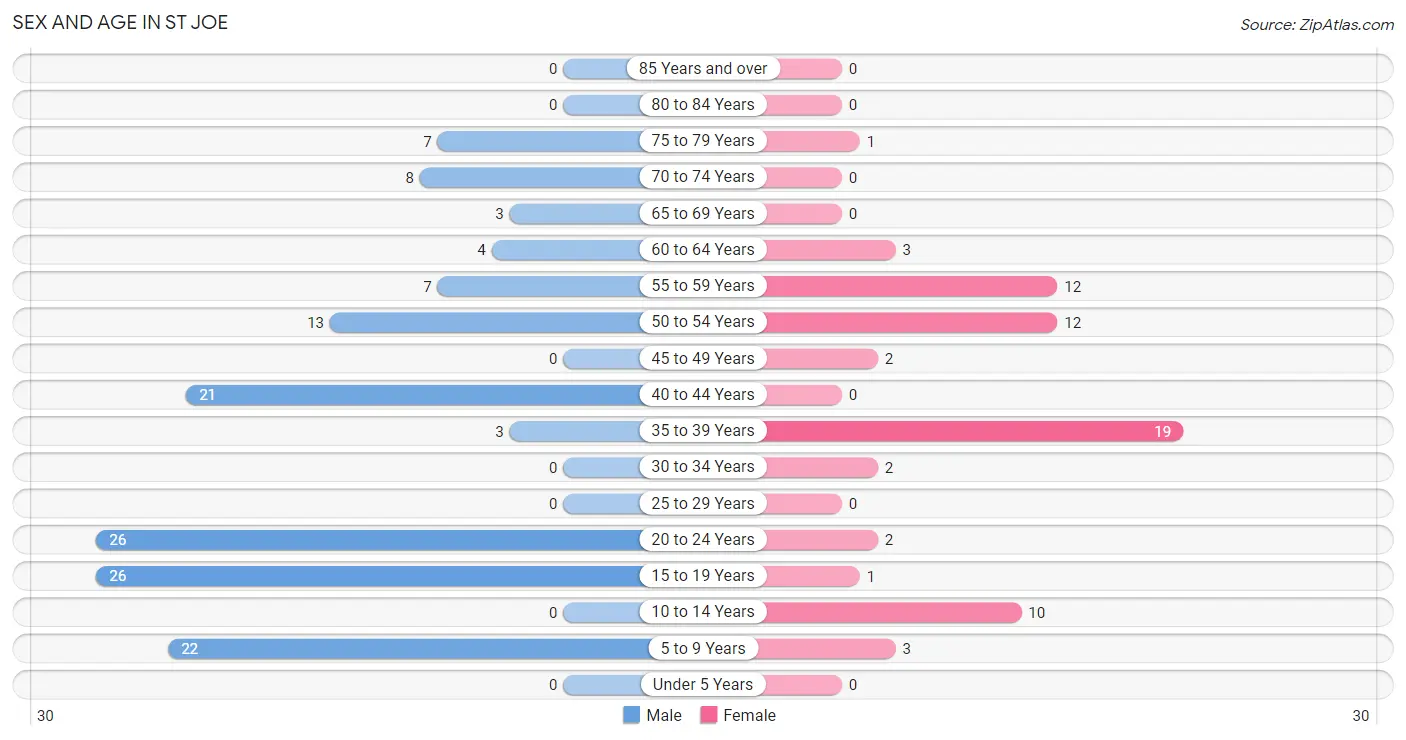
| Age Bracket | Male | Female |
| Under 5 Years | 0 (0.0%) | 0 (0.0%) |
| 5 to 9 Years | 22 (15.7%) | 3 (4.5%) |
| 10 to 14 Years | 0 (0.0%) | 10 (14.9%) |
| 15 to 19 Years | 26 (18.6%) | 1 (1.5%) |
| 20 to 24 Years | 26 (18.6%) | 2 (3.0%) |
| 25 to 29 Years | 0 (0.0%) | 0 (0.0%) |
| 30 to 34 Years | 0 (0.0%) | 2 (3.0%) |
| 35 to 39 Years | 3 (2.1%) | 19 (28.4%) |
| 40 to 44 Years | 21 (15.0%) | 0 (0.0%) |
| 45 to 49 Years | 0 (0.0%) | 2 (3.0%) |
| 50 to 54 Years | 13 (9.3%) | 12 (17.9%) |
| 55 to 59 Years | 7 (5.0%) | 12 (17.9%) |
| 60 to 64 Years | 4 (2.9%) | 3 (4.5%) |
| 65 to 69 Years | 3 (2.1%) | 0 (0.0%) |
| 70 to 74 Years | 8 (5.7%) | 0 (0.0%) |
| 75 to 79 Years | 7 (5.0%) | 1 (1.5%) |
| 80 to 84 Years | 0 (0.0%) | 0 (0.0%) |
| 85 Years and over | 0 (0.0%) | 0 (0.0%) |
| Total | 140 (100.0%) | 67 (100.0%) |
Families and Households in St Joe
Median Family Size in St Joe
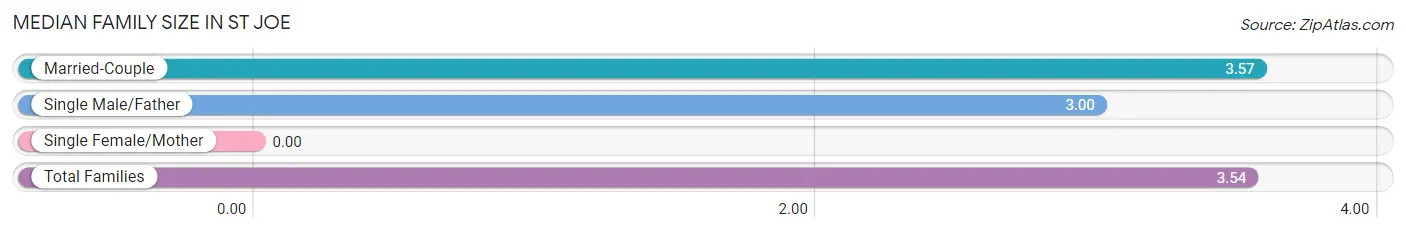
| Family Type | # Families | Family Size |
| Married-Couple | 47 (94.0%) | 3.57 |
| Single Male/Father | 3 (6.0%) | 3.00 |
| Single Female/Mother | 0 (0.0%) | - |
| Total Families | 50 (100.0%) | 3.54 |
Median Household Size in St Joe
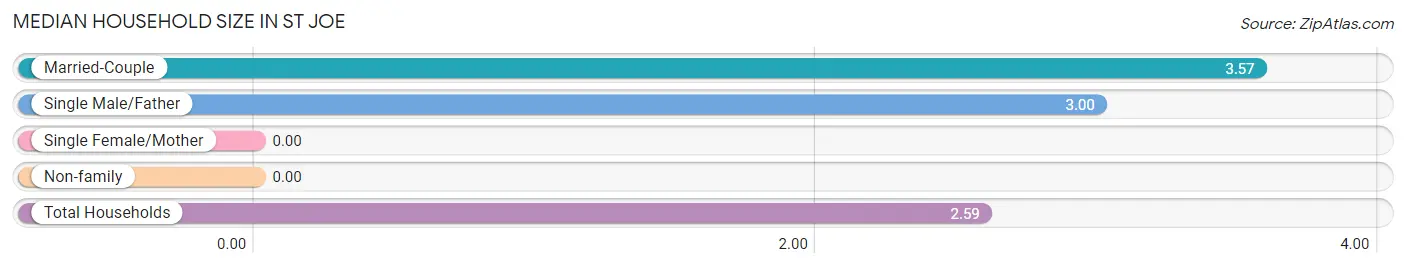
| Household Type | # Households | Household Size |
| Married-Couple | 47 (58.8%) | 3.57 |
| Single Male/Father | 3 (3.7%) | 3.00 |
| Single Female/Mother | 0 (0.0%) | - |
| Non-family | 30 (37.5%) | - |
| Total Households | 80 (100.0%) | 2.59 |
Household Size by Marriage Status in St Joe
Out of a total of 80 households in St Joe, 50 (62.5%) are family households, while 30 (37.5%) are nonfamily households. The most numerous type of family households are 2-person households, comprising 23, and the most common type of nonfamily households are 1-person households, comprising 30.
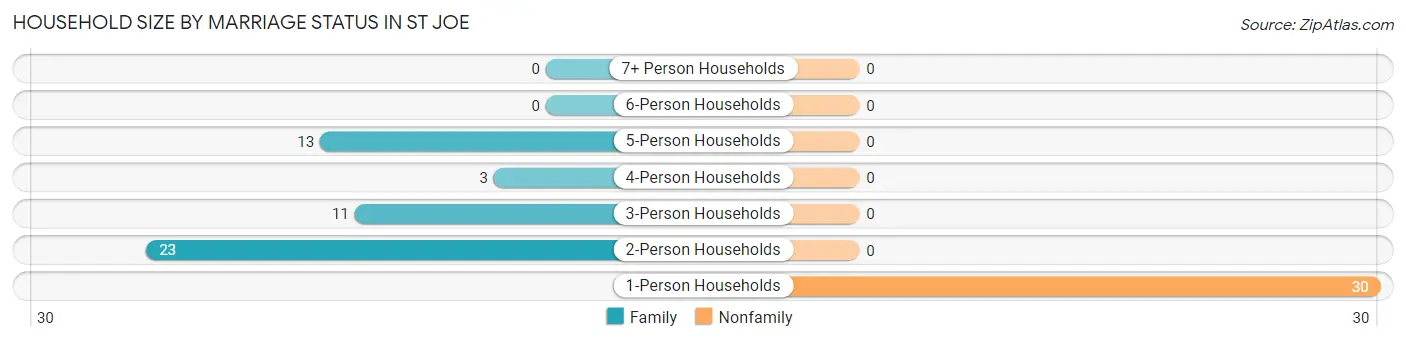
| Household Size | Family Households | Nonfamily Households |
| 1-Person Households | - | 30 (37.5%) |
| 2-Person Households | 23 (28.7%) | 0 (0.0%) |
| 3-Person Households | 11 (13.8%) | 0 (0.0%) |
| 4-Person Households | 3 (3.7%) | 0 (0.0%) |
| 5-Person Households | 13 (16.3%) | 0 (0.0%) |
| 6-Person Households | 0 (0.0%) | 0 (0.0%) |
| 7+ Person Households | 0 (0.0%) | 0 (0.0%) |
| Total | 50 (62.5%) | 30 (37.5%) |
Female Fertility in St Joe
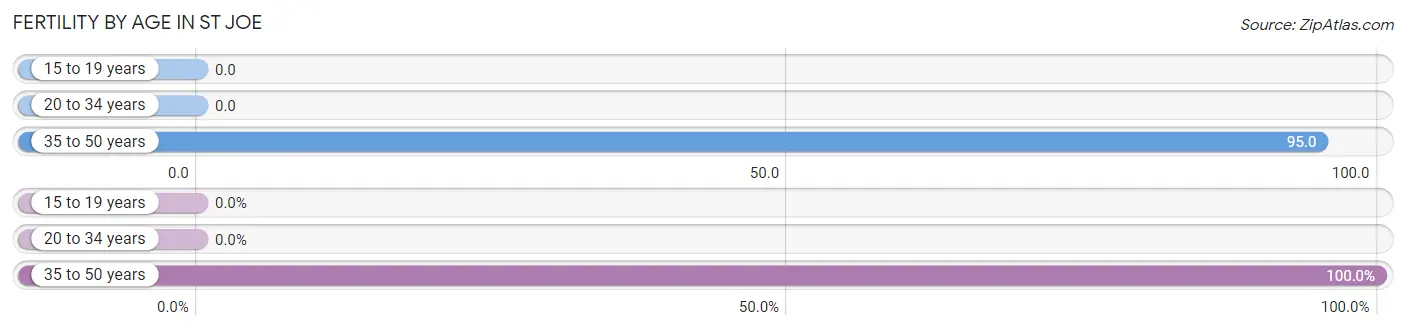
Fertility by Age in St Joe
Average fertility rate in St Joe is 77.0 births per 1,000 women. Women in the age bracket of 35 to 50 years have the highest fertility rate with 95.0 births per 1,000 women. Women in the age bracket of 35 to 50 years acount for 100.0% of all women with births.
| Age Bracket | Women with Births | Births / 1,000 Women |
| 15 to 19 years | 0 (0.0%) | 0.0 |
| 20 to 34 years | 0 (0.0%) | 0.0 |
| 35 to 50 years | 2 (100.0%) | 95.0 |
| Total | 2 (100.0%) | 77.0 |
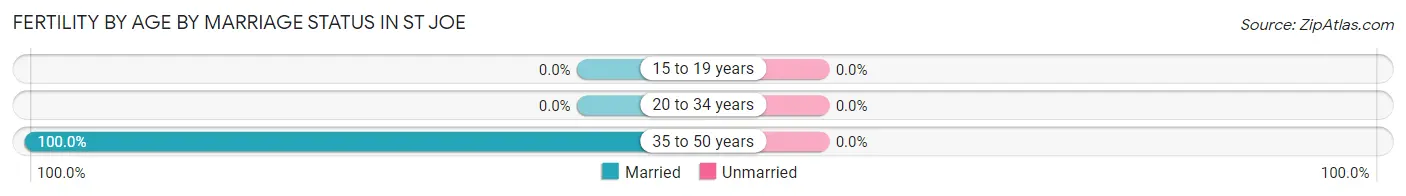
Fertility by Age by Marriage Status in St Joe
| Age Bracket | Married | Unmarried |
| 15 to 19 years | 0 (0.0%) | 0 (0.0%) |
| 20 to 34 years | 0 (0.0%) | 0 (0.0%) |
| 35 to 50 years | 2 (100.0%) | 0 (0.0%) |
| Total | 2 (100.0%) | 0 (0.0%) |
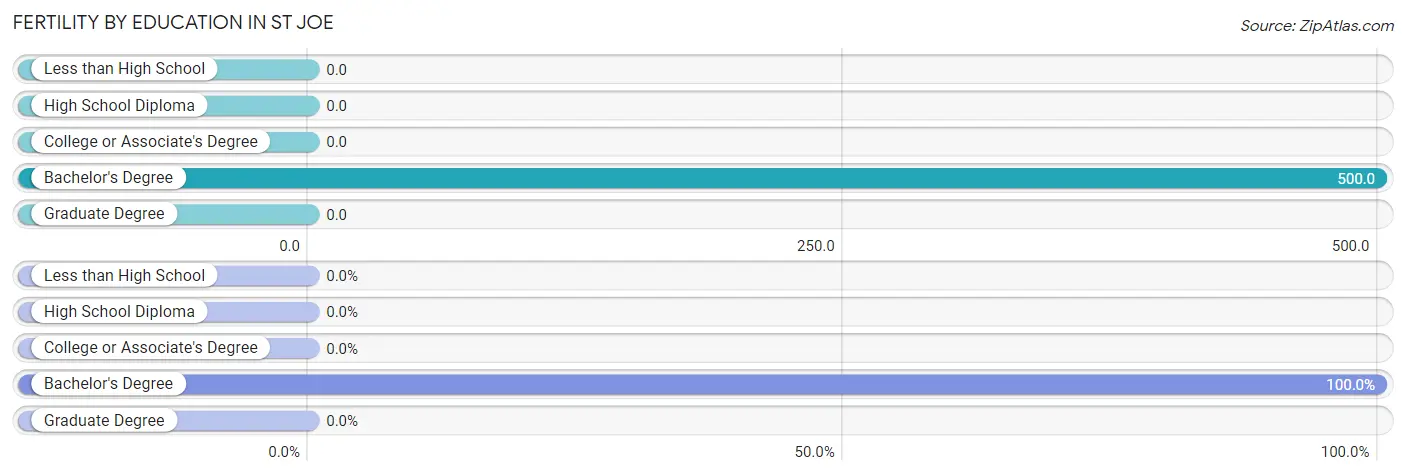
Fertility by Education in St Joe
| Educational Attainment | Women with Births | Births / 1,000 Women |
| Less than High School | 0 (0.0%) | 0.0 |
| High School Diploma | 0 (0.0%) | 0.0 |
| College or Associate's Degree | 0 (0.0%) | 0.0 |
| Bachelor's Degree | 2 (100.0%) | 500.0 |
| Graduate Degree | 0 (0.0%) | 0.0 |
| Total | 2 (100.0%) | 77.0 |
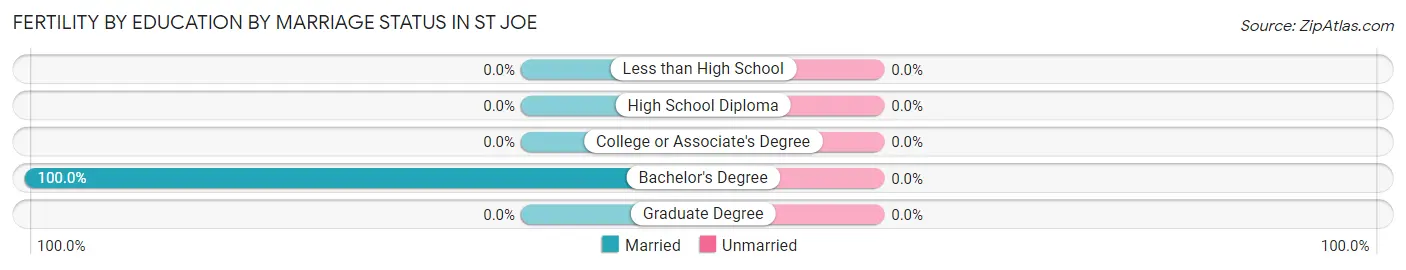
Fertility by Education by Marriage Status in St Joe
| Educational Attainment | Married | Unmarried |
| Less than High School | 0 (0.0%) | 0 (0.0%) |
| High School Diploma | 0 (0.0%) | 0 (0.0%) |
| College or Associate's Degree | 0 (0.0%) | 0 (0.0%) |
| Bachelor's Degree | 2 (100.0%) | 0 (0.0%) |
| Graduate Degree | 0 (0.0%) | 0 (0.0%) |
| Total | 2 (100.0%) | 0 (0.0%) |
Employment Characteristics in St Joe
Employment by Class of Employer in St Joe
Among the 102 employed individuals in St Joe, private company employees (75 | 73.5%), state government employees (12 | 11.8%), and self-employed (not incorporated) (10 | 9.8%) make up the most common classes of employment.
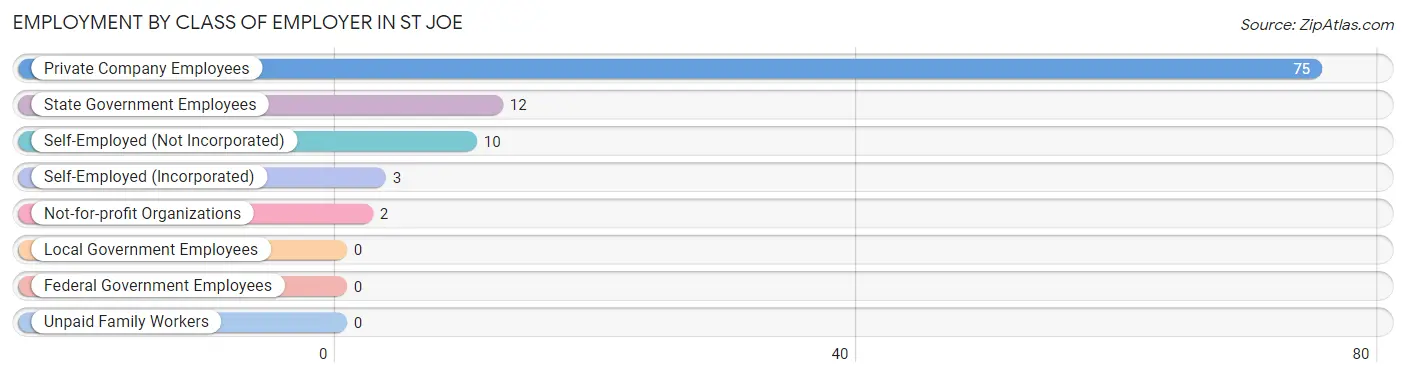
| Employer Class | # Employees | % Employees |
| Private Company Employees | 75 | 73.5% |
| Self-Employed (Incorporated) | 3 | 2.9% |
| Self-Employed (Not Incorporated) | 10 | 9.8% |
| Not-for-profit Organizations | 2 | 2.0% |
| Local Government Employees | 0 | 0.0% |
| State Government Employees | 12 | 11.8% |
| Federal Government Employees | 0 | 0.0% |
| Unpaid Family Workers | 0 | 0.0% |
| Total | 102 | 100.0% |
Employment Status by Age in St Joe
According to the labor force statistics for St Joe, out of the total population over 16 years of age (163), 68.7% or 112 individuals are in the labor force, with 8.9% or 10 of them unemployed. The age group with the highest labor force participation rate is 20 to 24 years, with 100.0% or 28 individuals in the labor force. Within the labor force, the 35 to 44 years age range has the highest percentage of unemployed individuals, with 29.4% or 10 of them being unemployed.
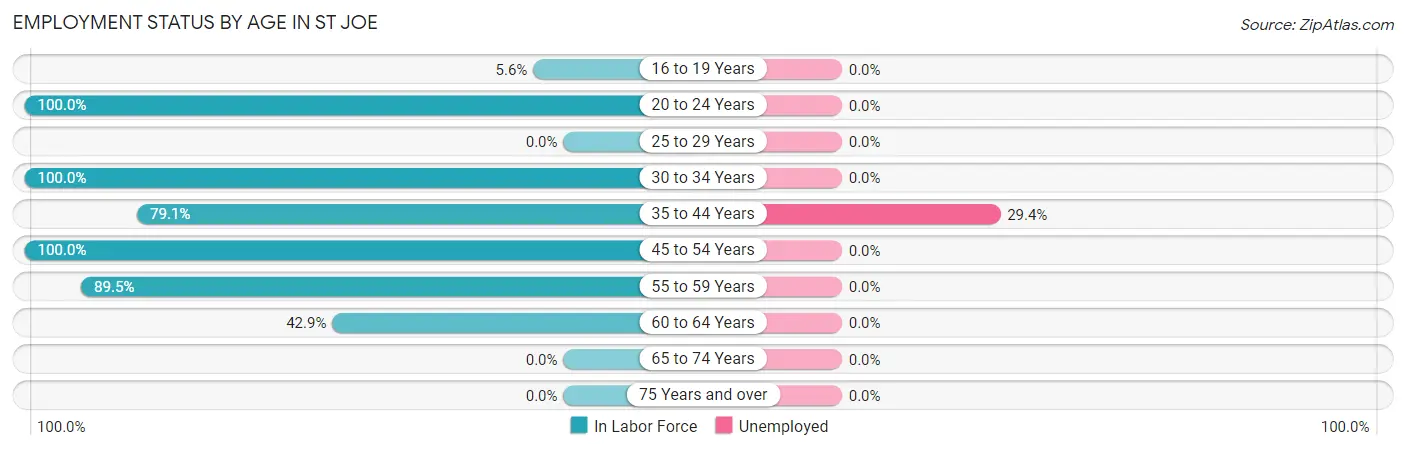
| Age Bracket | In Labor Force | Unemployed |
| 16 to 19 Years | 1 (5.6%) | 0 (0.0%) |
| 20 to 24 Years | 28 (100.0%) | 0 (0.0%) |
| 25 to 29 Years | 0 (0.0%) | 0 (0.0%) |
| 30 to 34 Years | 2 (100.0%) | 0 (0.0%) |
| 35 to 44 Years | 34 (79.1%) | 10 (29.4%) |
| 45 to 54 Years | 27 (100.0%) | 0 (0.0%) |
| 55 to 59 Years | 17 (89.5%) | 0 (0.0%) |
| 60 to 64 Years | 3 (42.9%) | 0 (0.0%) |
| 65 to 74 Years | 0 (0.0%) | 0 (0.0%) |
| 75 Years and over | 0 (0.0%) | 0 (0.0%) |
| Total | 112 (68.7%) | 10 (8.9%) |
Employment Status by Educational Attainment in St Joe
According to labor force statistics for St Joe, 84.7% of individuals (83) out of the total population between 25 and 64 years of age (98) are in the labor force, with 12.0% or 10 of them being unemployed. The group with the highest labor force participation rate are those with the educational attainment of less than high school, with 100.0% or 18 individuals in the labor force. Within the labor force, individuals with college / associate degree education have the highest percentage of unemployment, with 28.6% or 10 of them being unemployed.
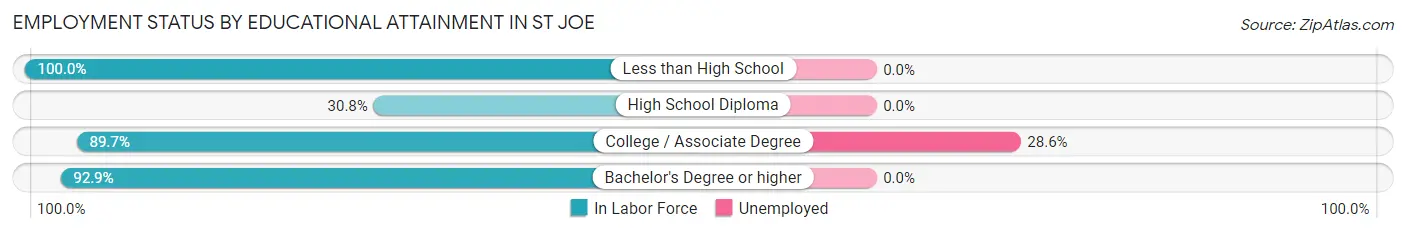
| Educational Attainment | In Labor Force | Unemployed |
| Less than High School | 18 (100.0%) | 0 (0.0%) |
| High School Diploma | 4 (30.8%) | 0 (0.0%) |
| College / Associate Degree | 35 (89.7%) | 11 (28.6%) |
| Bachelor's Degree or higher | 26 (92.9%) | 0 (0.0%) |
| Total | 83 (84.7%) | 12 (12.0%) |
Employment Occupations by Sex in St Joe
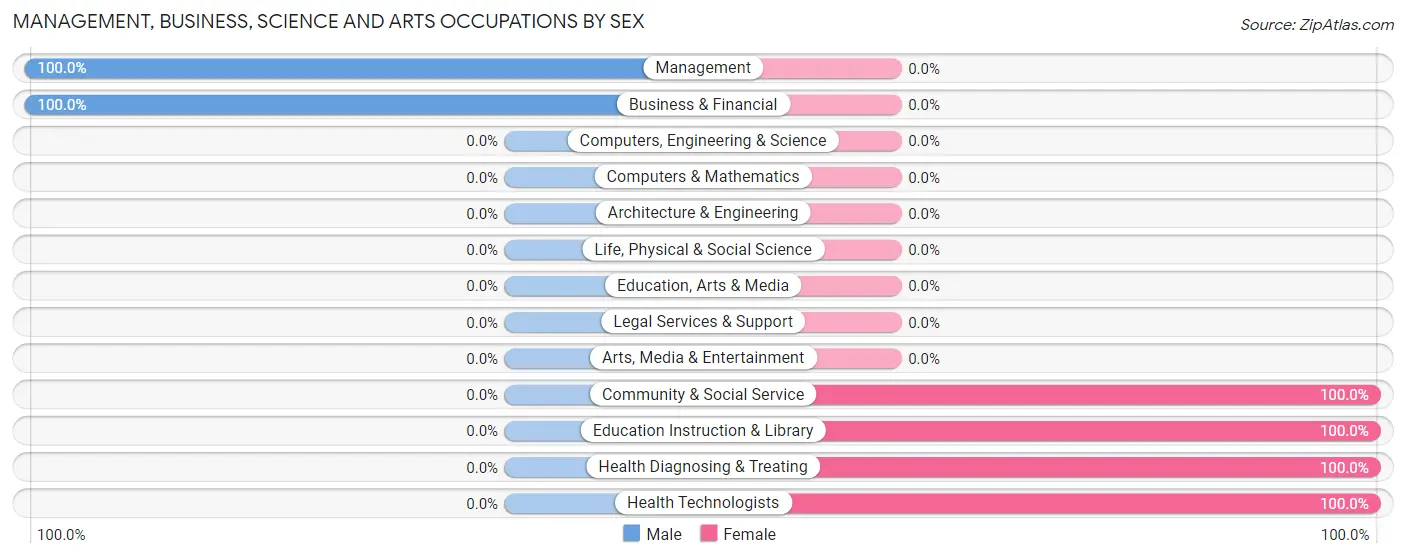
Management, Business, Science and Arts Occupations
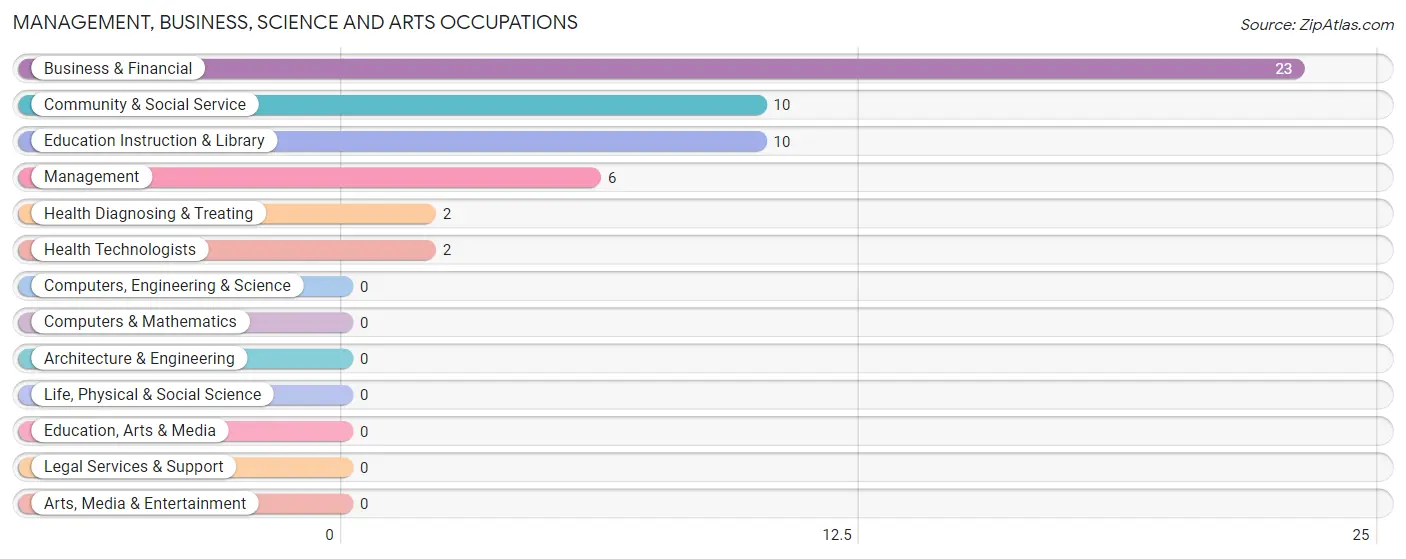
The most common Management, Business, Science and Arts occupations in St Joe are Business & Financial (23 | 22.6%), Community & Social Service (10 | 9.8%), Education Instruction & Library (10 | 9.8%), Management (6 | 5.9%), and Health Diagnosing & Treating (2 | 2.0%).
Management, Business, Science and Arts Occupations by Sex
Within the Management, Business, Science and Arts occupations in St Joe, the most male-oriented occupations are Management (100.0%), and Business & Financial (100.0%), while the most female-oriented occupations are Community & Social Service (100.0%), Education Instruction & Library (100.0%), and Health Diagnosing & Treating (100.0%).
| Occupation | Male | Female |
| Management | 6 (100.0%) | 0 (0.0%) |
| Business & Financial | 23 (100.0%) | 0 (0.0%) |
| Computers, Engineering & Science | 0 (0.0%) | 0 (0.0%) |
| Computers & Mathematics | 0 (0.0%) | 0 (0.0%) |
| Architecture & Engineering | 0 (0.0%) | 0 (0.0%) |
| Life, Physical & Social Science | 0 (0.0%) | 0 (0.0%) |
| Community & Social Service | 0 (0.0%) | 10 (100.0%) |
| Education, Arts & Media | 0 (0.0%) | 0 (0.0%) |
| Legal Services & Support | 0 (0.0%) | 0 (0.0%) |
| Education Instruction & Library | 0 (0.0%) | 10 (100.0%) |
| Arts, Media & Entertainment | 0 (0.0%) | 0 (0.0%) |
| Health Diagnosing & Treating | 0 (0.0%) | 2 (100.0%) |
| Health Technologists | 0 (0.0%) | 2 (100.0%) |
| Total (Category) | 29 (70.7%) | 12 (29.3%) |
| Total (Overall) | 70 (68.6%) | 32 (31.4%) |
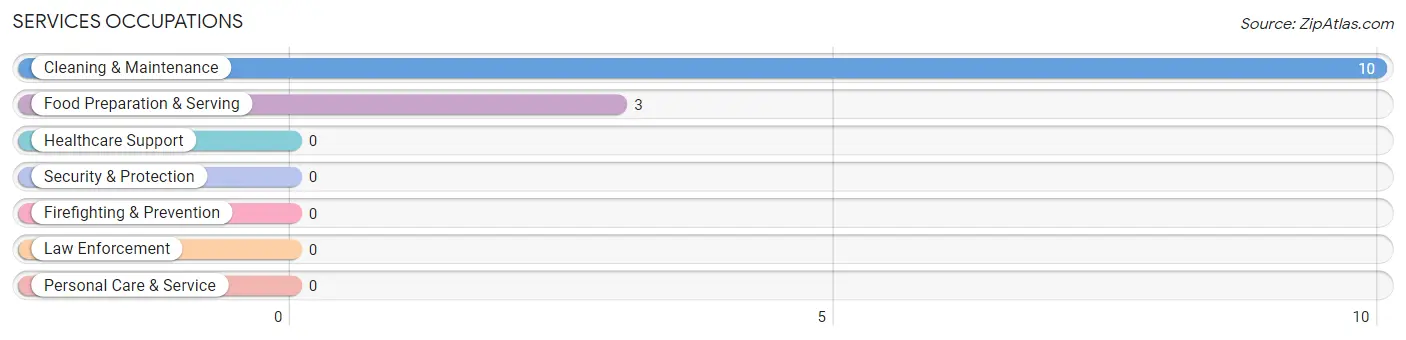
Services Occupations
The most common Services occupations in St Joe are Cleaning & Maintenance (10 | 9.8%), and Food Preparation & Serving (3 | 2.9%).
Services Occupations by Sex
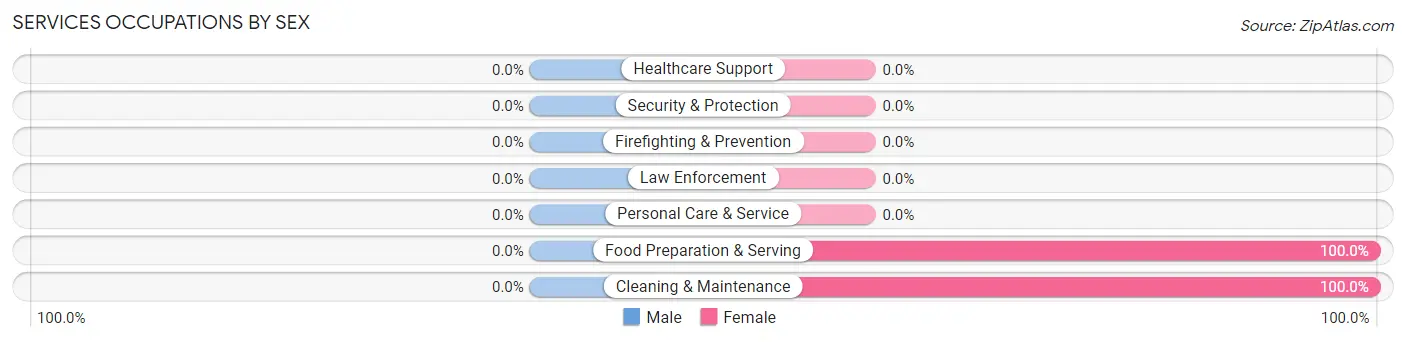
| Occupation | Male | Female |
| Healthcare Support | 0 (0.0%) | 0 (0.0%) |
| Security & Protection | 0 (0.0%) | 0 (0.0%) |
| Firefighting & Prevention | 0 (0.0%) | 0 (0.0%) |
| Law Enforcement | 0 (0.0%) | 0 (0.0%) |
| Food Preparation & Serving | 0 (0.0%) | 3 (100.0%) |
| Cleaning & Maintenance | 0 (0.0%) | 10 (100.0%) |
| Personal Care & Service | 0 (0.0%) | 0 (0.0%) |
| Total (Category) | 0 (0.0%) | 13 (100.0%) |
| Total (Overall) | 70 (68.6%) | 32 (31.4%) |
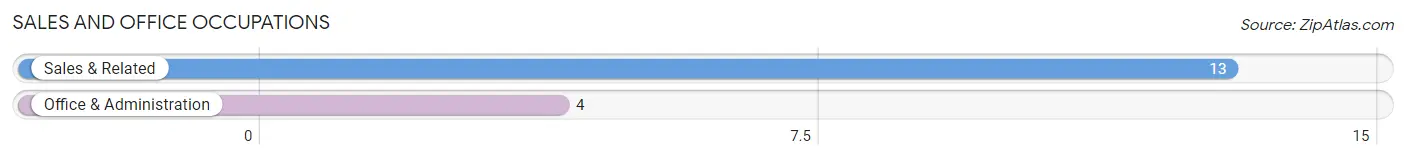
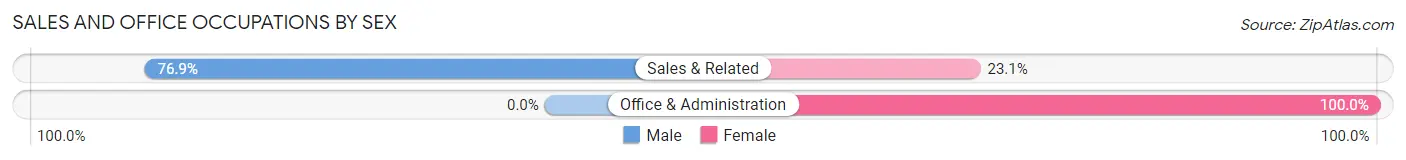
Sales and Office Occupations
The most common Sales and Office occupations in St Joe are Sales & Related (13 | 12.8%), and Office & Administration (4 | 3.9%).
Sales and Office Occupations by Sex
| Occupation | Male | Female |
| Sales & Related | 10 (76.9%) | 3 (23.1%) |
| Office & Administration | 0 (0.0%) | 4 (100.0%) |
| Total (Category) | 10 (58.8%) | 7 (41.2%) |
| Total (Overall) | 70 (68.6%) | 32 (31.4%) |
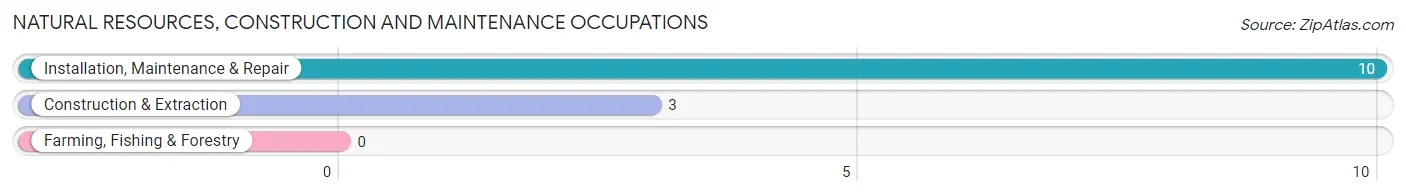
Natural Resources, Construction and Maintenance Occupations
The most common Natural Resources, Construction and Maintenance occupations in St Joe are Installation, Maintenance & Repair (10 | 9.8%), and Construction & Extraction (3 | 2.9%).
Natural Resources, Construction and Maintenance Occupations by Sex
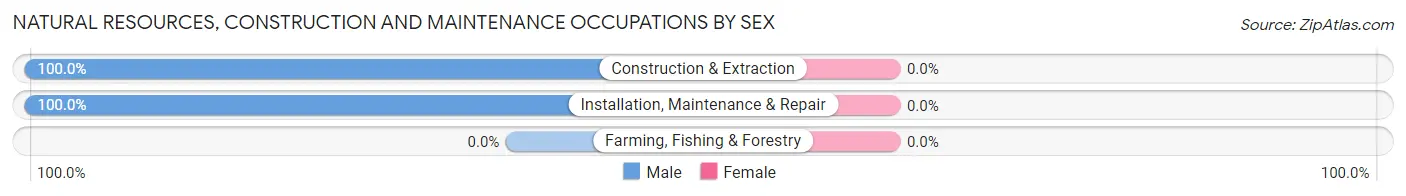
| Occupation | Male | Female |
| Farming, Fishing & Forestry | 0 (0.0%) | 0 (0.0%) |
| Construction & Extraction | 3 (100.0%) | 0 (0.0%) |
| Installation, Maintenance & Repair | 10 (100.0%) | 0 (0.0%) |
| Total (Category) | 13 (100.0%) | 0 (0.0%) |
| Total (Overall) | 70 (68.6%) | 32 (31.4%) |
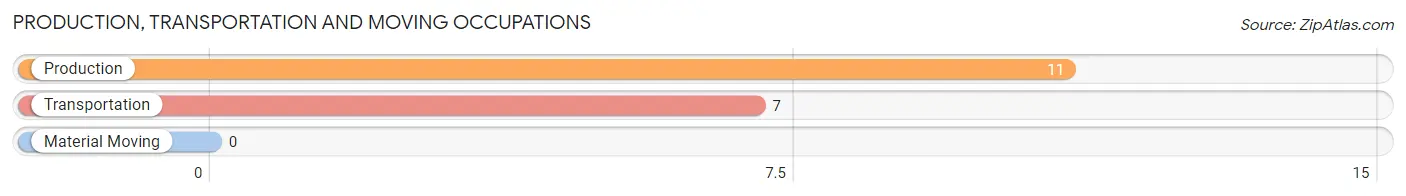
Production, Transportation and Moving Occupations
The most common Production, Transportation and Moving occupations in St Joe are Production (11 | 10.8%), and Transportation (7 | 6.9%).
Production, Transportation and Moving Occupations by Sex
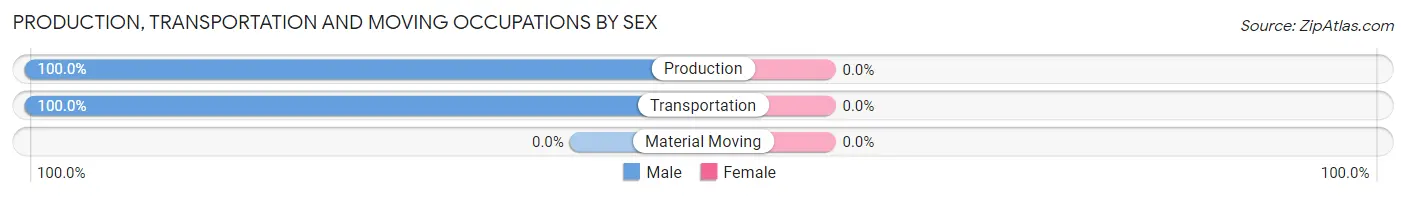
| Occupation | Male | Female |
| Production | 11 (100.0%) | 0 (0.0%) |
| Transportation | 7 (100.0%) | 0 (0.0%) |
| Material Moving | 0 (0.0%) | 0 (0.0%) |
| Total (Category) | 18 (100.0%) | 0 (0.0%) |
| Total (Overall) | 70 (68.6%) | 32 (31.4%) |
Employment Industries by Sex in St Joe
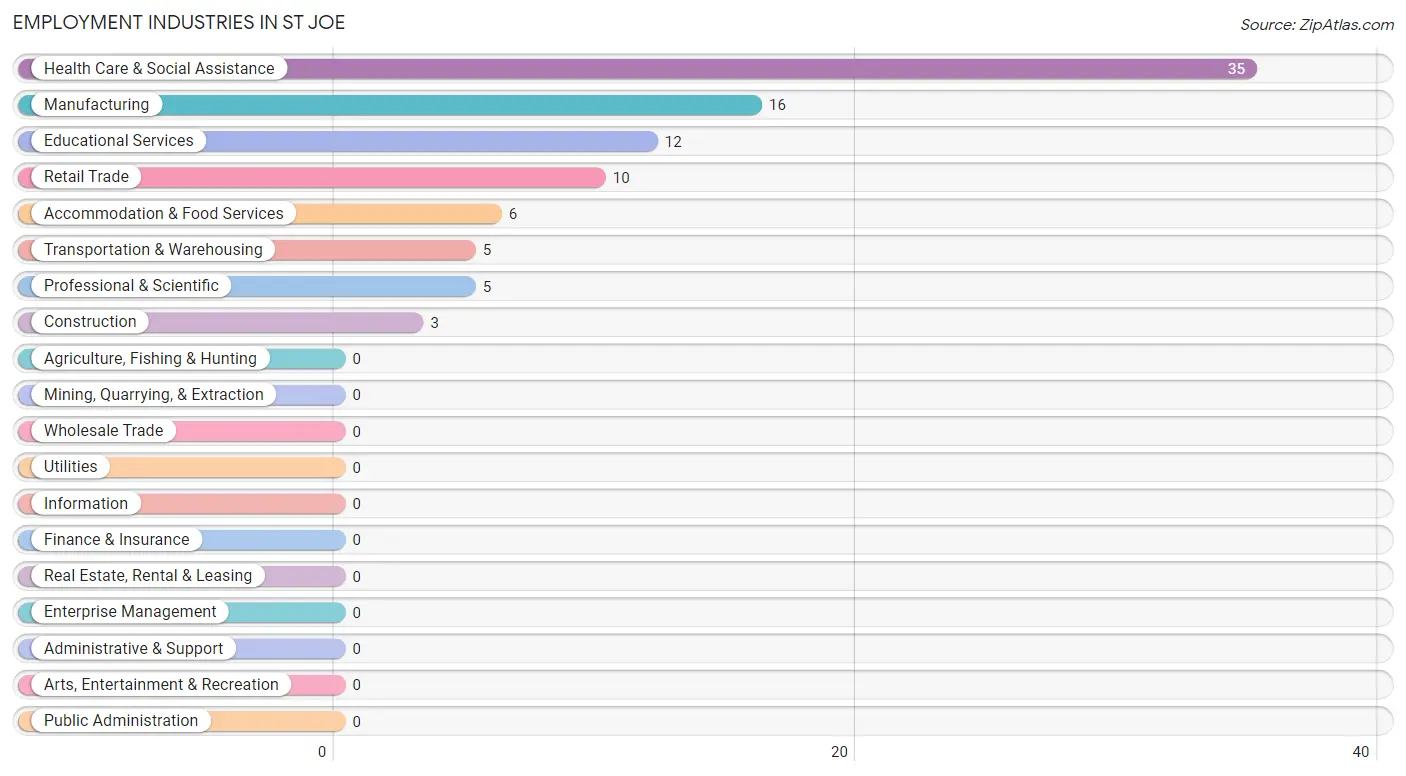
Employment Industries in St Joe
The major employment industries in St Joe include Health Care & Social Assistance (35 | 34.3%), Manufacturing (16 | 15.7%), Educational Services (12 | 11.8%), Retail Trade (10 | 9.8%), and Accommodation & Food Services (6 | 5.9%).
Employment Industries by Sex in St Joe
The St Joe industries that see more men than women are Construction (100.0%), Manufacturing (100.0%), and Retail Trade (100.0%), whereas the industries that tend to have a higher number of women are Professional & Scientific (100.0%), Educational Services (100.0%), and Accommodation & Food Services (50.0%).
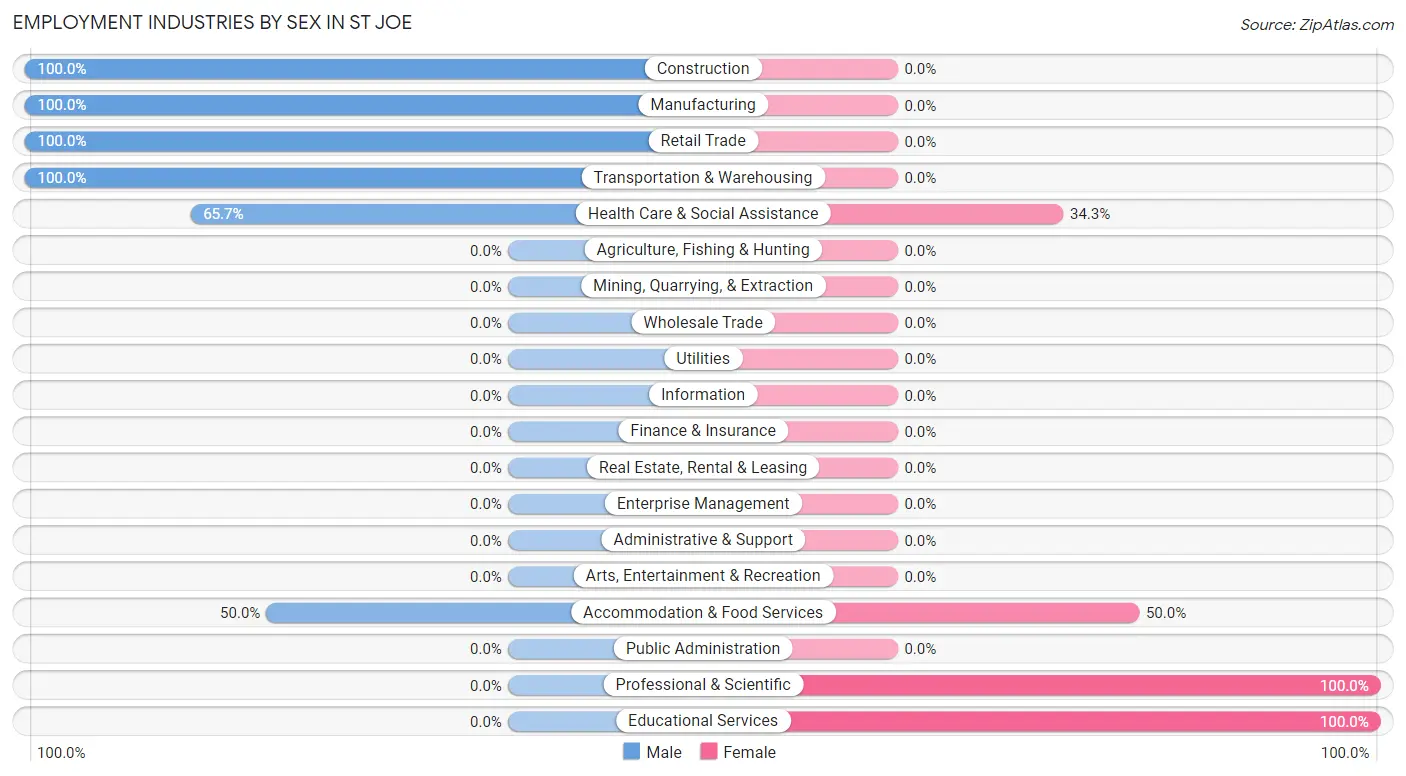
| Industry | Male | Female |
| Agriculture, Fishing & Hunting | 0 (0.0%) | 0 (0.0%) |
| Mining, Quarrying, & Extraction | 0 (0.0%) | 0 (0.0%) |
| Construction | 3 (100.0%) | 0 (0.0%) |
| Manufacturing | 16 (100.0%) | 0 (0.0%) |
| Wholesale Trade | 0 (0.0%) | 0 (0.0%) |
| Retail Trade | 10 (100.0%) | 0 (0.0%) |
| Transportation & Warehousing | 5 (100.0%) | 0 (0.0%) |
| Utilities | 0 (0.0%) | 0 (0.0%) |
| Information | 0 (0.0%) | 0 (0.0%) |
| Finance & Insurance | 0 (0.0%) | 0 (0.0%) |
| Real Estate, Rental & Leasing | 0 (0.0%) | 0 (0.0%) |
| Professional & Scientific | 0 (0.0%) | 5 (100.0%) |
| Enterprise Management | 0 (0.0%) | 0 (0.0%) |
| Administrative & Support | 0 (0.0%) | 0 (0.0%) |
| Educational Services | 0 (0.0%) | 12 (100.0%) |
| Health Care & Social Assistance | 23 (65.7%) | 12 (34.3%) |
| Arts, Entertainment & Recreation | 0 (0.0%) | 0 (0.0%) |
| Accommodation & Food Services | 3 (50.0%) | 3 (50.0%) |
| Public Administration | 0 (0.0%) | 0 (0.0%) |
| Total | 70 (68.6%) | 32 (31.4%) |
Education in St Joe
School Enrollment in St Joe
The most common levels of schooling among the 62 students in St Joe are high school (27 | 43.5%), elementary school (25 | 40.3%), and middle school (10 | 16.1%).
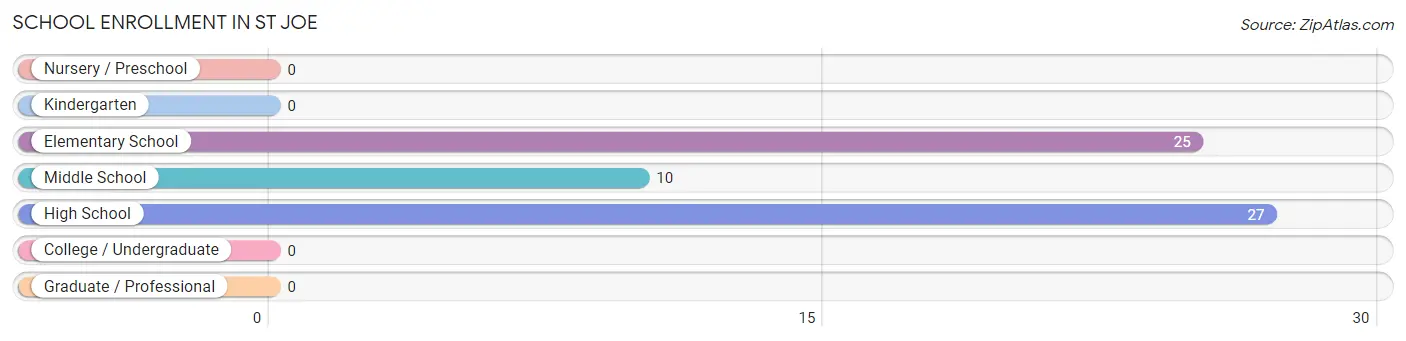
| School Level | # Students | % Students |
| Nursery / Preschool | 0 | 0.0% |
| Kindergarten | 0 | 0.0% |
| Elementary School | 25 | 40.3% |
| Middle School | 10 | 16.1% |
| High School | 27 | 43.5% |
| College / Undergraduate | 0 | 0.0% |
| Graduate / Professional | 0 | 0.0% |
| Total | 62 | 100.0% |
School Enrollment by Age by Funding Source in St Joe
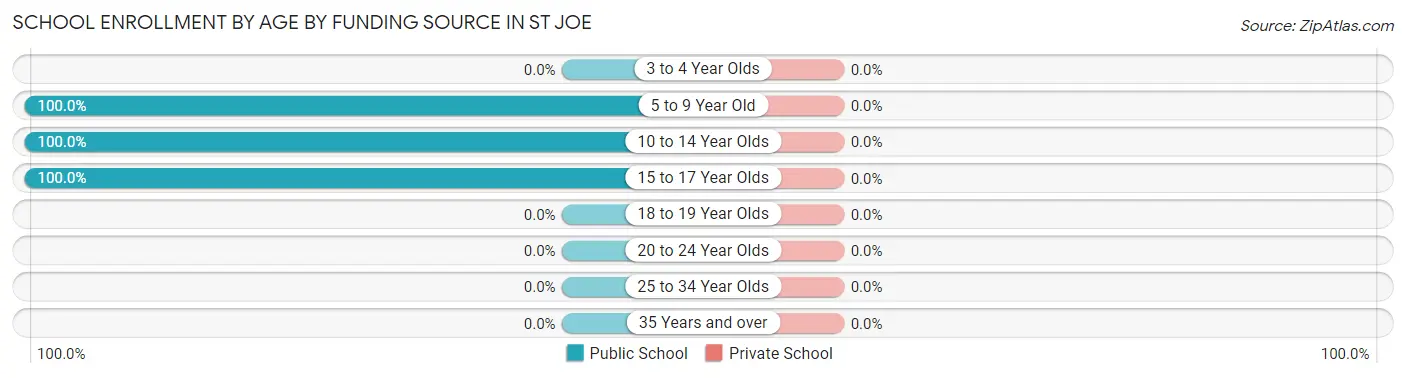
| Age Bracket | Public School | Private School |
| 3 to 4 Year Olds | 0 (0.0%) | 0 (0.0%) |
| 5 to 9 Year Old | 25 (100.0%) | 0 (0.0%) |
| 10 to 14 Year Olds | 10 (100.0%) | 0 (0.0%) |
| 15 to 17 Year Olds | 27 (100.0%) | 0 (0.0%) |
| 18 to 19 Year Olds | 0 (0.0%) | 0 (0.0%) |
| 20 to 24 Year Olds | 0 (0.0%) | 0 (0.0%) |
| 25 to 34 Year Olds | 0 (0.0%) | 0 (0.0%) |
| 35 Years and over | 0 (0.0%) | 0 (0.0%) |
| Total | 62 (100.0%) | 0 (0.0%) |
Educational Attainment by Field of Study in St Joe
Education (17 | 46.0%), social sciences (11 | 29.7%), liberal arts & history (4 | 10.8%), business (3 | 8.1%), and arts & humanities (2 | 5.4%) are the most common fields of study among 37 individuals in St Joe who have obtained a bachelor's degree or higher.
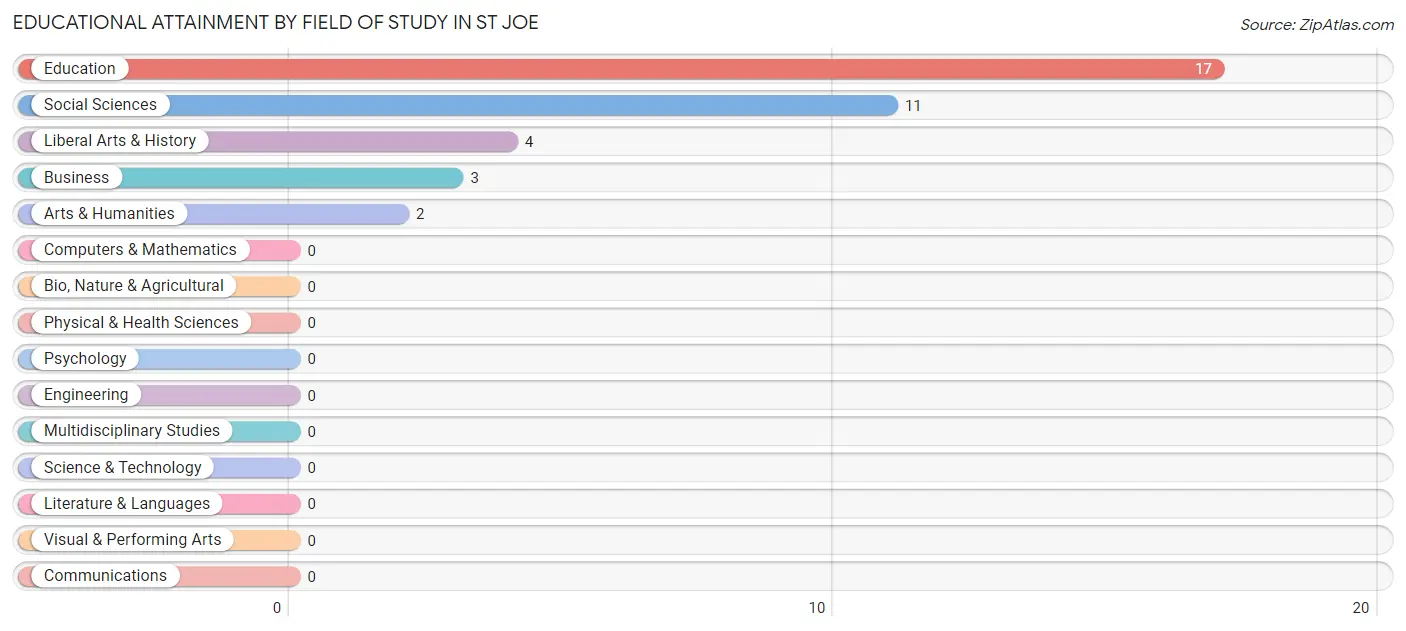
| Field of Study | # Graduates | % Graduates |
| Computers & Mathematics | 0 | 0.0% |
| Bio, Nature & Agricultural | 0 | 0.0% |
| Physical & Health Sciences | 0 | 0.0% |
| Psychology | 0 | 0.0% |
| Social Sciences | 11 | 29.7% |
| Engineering | 0 | 0.0% |
| Multidisciplinary Studies | 0 | 0.0% |
| Science & Technology | 0 | 0.0% |
| Business | 3 | 8.1% |
| Education | 17 | 46.0% |
| Literature & Languages | 0 | 0.0% |
| Liberal Arts & History | 4 | 10.8% |
| Visual & Performing Arts | 0 | 0.0% |
| Communications | 0 | 0.0% |
| Arts & Humanities | 2 | 5.4% |
| Total | 37 | 100.0% |
Transportation & Commute in St Joe
Vehicle Availability by Sex in St Joe
The most prevalent vehicle ownership categories in St Joe are males with 4 vehicles (46, accounting for 65.7%) and females with 4 vehicles (10, making up 143.8%).
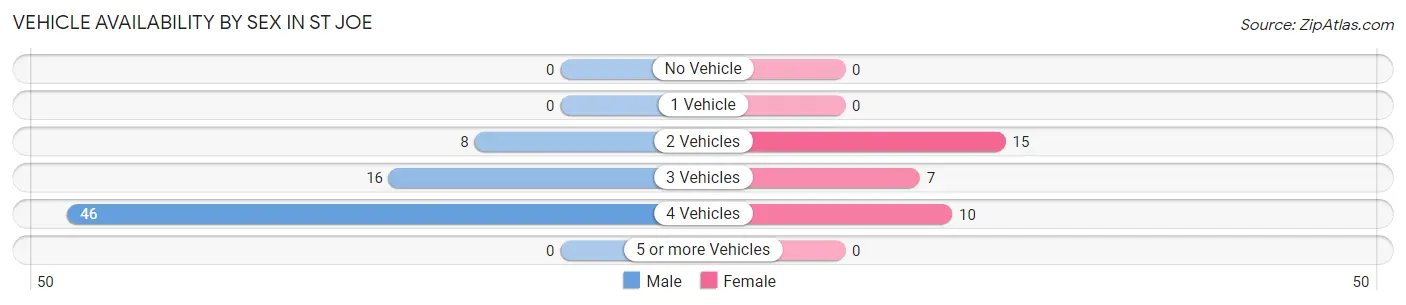
| Vehicles Available | Male | Female |
| No Vehicle | 0 (0.0%) | 0 (0.0%) |
| 1 Vehicle | 0 (0.0%) | 0 (0.0%) |
| 2 Vehicles | 8 (11.4%) | 15 (46.9%) |
| 3 Vehicles | 16 (22.9%) | 7 (21.9%) |
| 4 Vehicles | 46 (65.7%) | 10 (31.2%) |
| 5 or more Vehicles | 0 (0.0%) | 0 (0.0%) |
| Total | 70 (100.0%) | 32 (100.0%) |
Commute Time in St Joe
The most frequently occuring commute durations in St Joe are 40 to 44 minutes (33 commuters, 33.0%), 60 to 89 minutes (12 commuters, 12.0%), and 25 to 29 minutes (11 commuters, 11.0%).
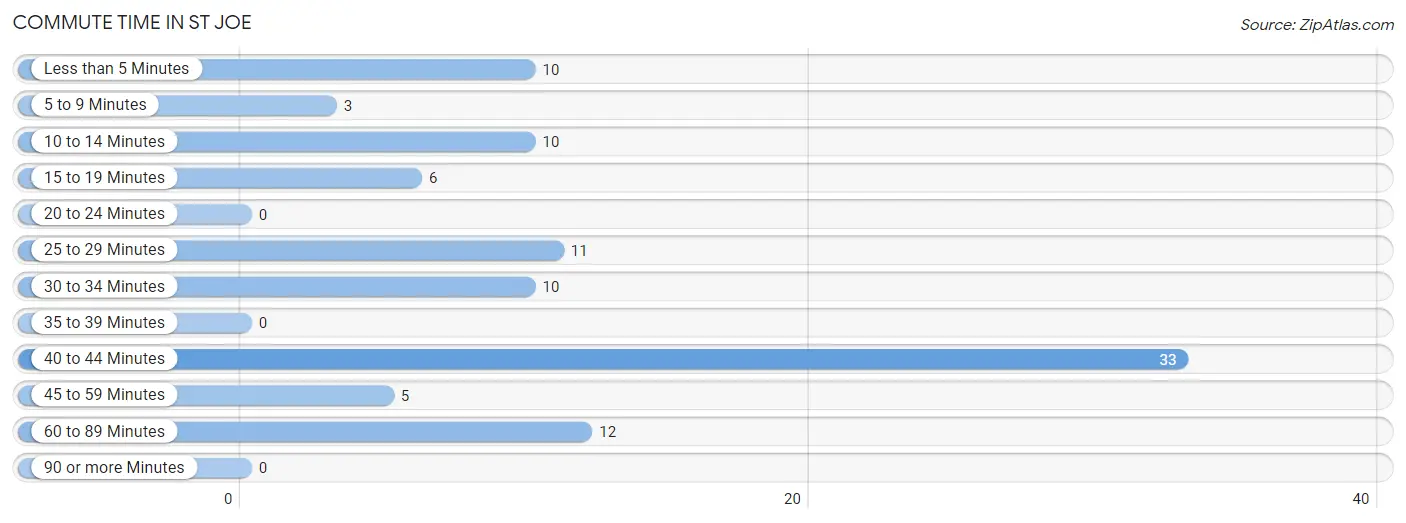
| Commute Time | # Commuters | % Commuters |
| Less than 5 Minutes | 10 | 10.0% |
| 5 to 9 Minutes | 3 | 3.0% |
| 10 to 14 Minutes | 10 | 10.0% |
| 15 to 19 Minutes | 6 | 6.0% |
| 20 to 24 Minutes | 0 | 0.0% |
| 25 to 29 Minutes | 11 | 11.0% |
| 30 to 34 Minutes | 10 | 10.0% |
| 35 to 39 Minutes | 0 | 0.0% |
| 40 to 44 Minutes | 33 | 33.0% |
| 45 to 59 Minutes | 5 | 5.0% |
| 60 to 89 Minutes | 12 | 12.0% |
| 90 or more Minutes | 0 | 0.0% |
Commute Time by Sex in St Joe
The most common commute times in St Joe are 40 to 44 minutes (23 commuters, 32.9%) for males and 10 to 14 minutes (10 commuters, 33.3%) for females.
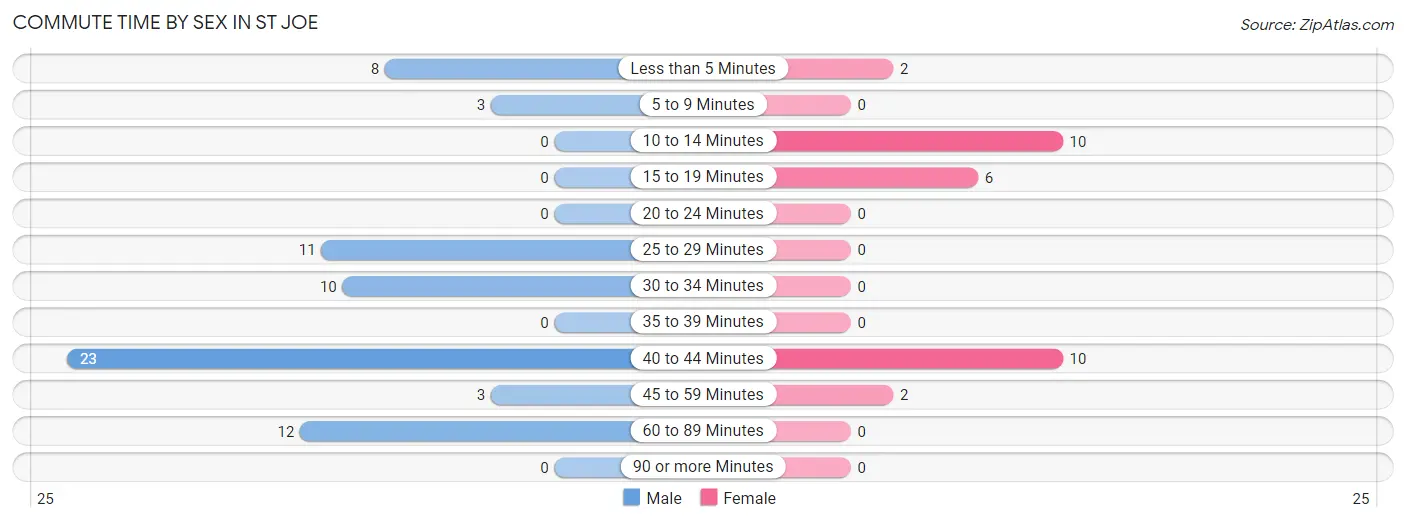
| Commute Time | Male | Female |
| Less than 5 Minutes | 8 (11.4%) | 2 (6.7%) |
| 5 to 9 Minutes | 3 (4.3%) | 0 (0.0%) |
| 10 to 14 Minutes | 0 (0.0%) | 10 (33.3%) |
| 15 to 19 Minutes | 0 (0.0%) | 6 (20.0%) |
| 20 to 24 Minutes | 0 (0.0%) | 0 (0.0%) |
| 25 to 29 Minutes | 11 (15.7%) | 0 (0.0%) |
| 30 to 34 Minutes | 10 (14.3%) | 0 (0.0%) |
| 35 to 39 Minutes | 0 (0.0%) | 0 (0.0%) |
| 40 to 44 Minutes | 23 (32.9%) | 10 (33.3%) |
| 45 to 59 Minutes | 3 (4.3%) | 2 (6.7%) |
| 60 to 89 Minutes | 12 (17.1%) | 0 (0.0%) |
| 90 or more Minutes | 0 (0.0%) | 0 (0.0%) |
Time of Departure to Work by Sex in St Joe
The most frequent times of departure to work in St Joe are 6:00 AM to 6:29 AM (26, 37.1%) for males and 7:30 AM to 7:59 AM (12, 40.0%) for females.
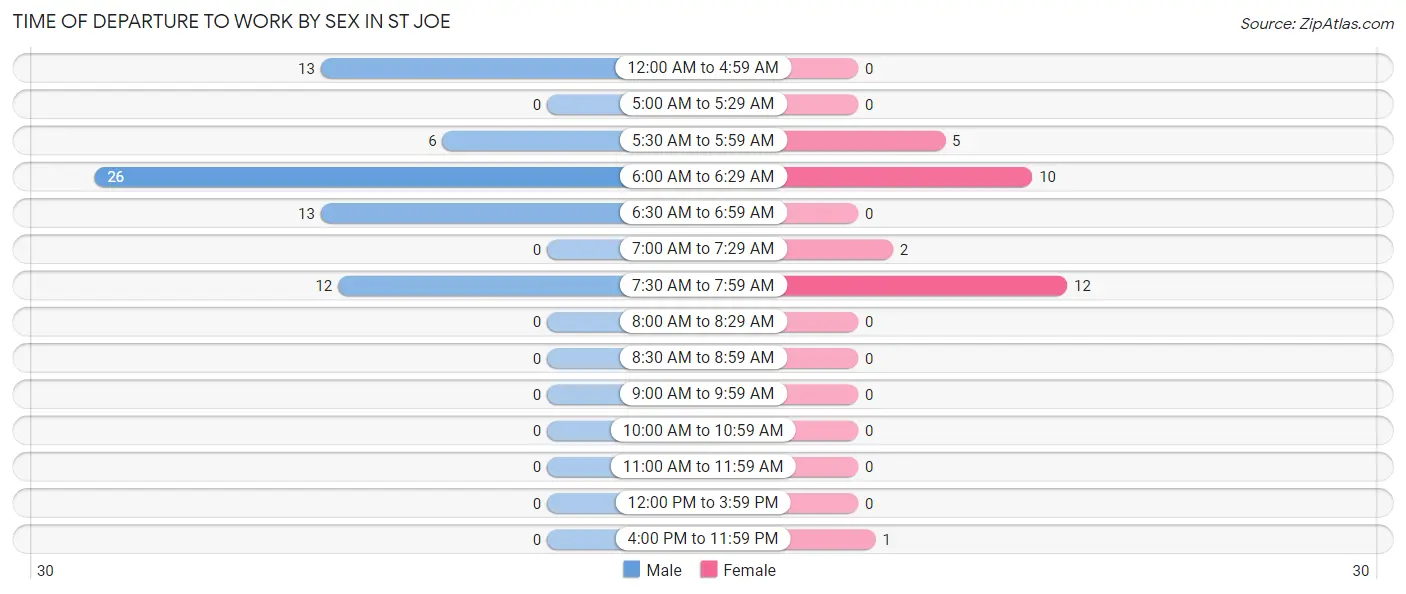
| Time of Departure | Male | Female |
| 12:00 AM to 4:59 AM | 13 (18.6%) | 0 (0.0%) |
| 5:00 AM to 5:29 AM | 0 (0.0%) | 0 (0.0%) |
| 5:30 AM to 5:59 AM | 6 (8.6%) | 5 (16.7%) |
| 6:00 AM to 6:29 AM | 26 (37.1%) | 10 (33.3%) |
| 6:30 AM to 6:59 AM | 13 (18.6%) | 0 (0.0%) |
| 7:00 AM to 7:29 AM | 0 (0.0%) | 2 (6.7%) |
| 7:30 AM to 7:59 AM | 12 (17.1%) | 12 (40.0%) |
| 8:00 AM to 8:29 AM | 0 (0.0%) | 0 (0.0%) |
| 8:30 AM to 8:59 AM | 0 (0.0%) | 0 (0.0%) |
| 9:00 AM to 9:59 AM | 0 (0.0%) | 0 (0.0%) |
| 10:00 AM to 10:59 AM | 0 (0.0%) | 0 (0.0%) |
| 11:00 AM to 11:59 AM | 0 (0.0%) | 0 (0.0%) |
| 12:00 PM to 3:59 PM | 0 (0.0%) | 0 (0.0%) |
| 4:00 PM to 11:59 PM | 0 (0.0%) | 1 (3.3%) |
| Total | 70 (100.0%) | 30 (100.0%) |
Housing Occupancy in St Joe
Occupancy by Ownership in St Joe
Of the total 80 dwellings in St Joe, owner-occupied units account for 63 (78.7%), while renter-occupied units make up 17 (21.2%).
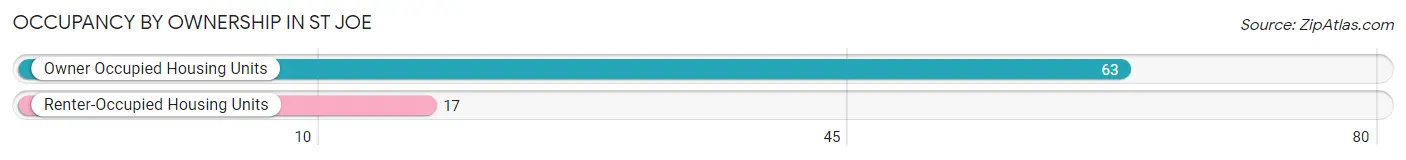
| Occupancy | # Housing Units | % Housing Units |
| Owner Occupied Housing Units | 63 | 78.7% |
| Renter-Occupied Housing Units | 17 | 21.2% |
| Total Occupied Housing Units | 80 | 100.0% |
Occupancy by Household Size in St Joe
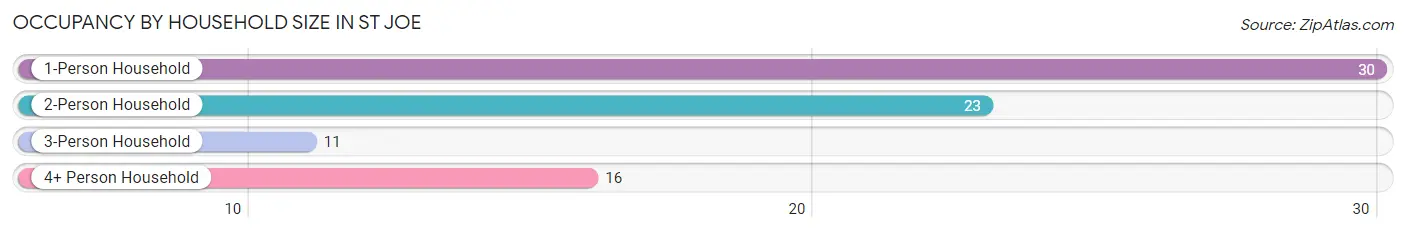
| Household Size | # Housing Units | % Housing Units |
| 1-Person Household | 30 | 37.5% |
| 2-Person Household | 23 | 28.7% |
| 3-Person Household | 11 | 13.8% |
| 4+ Person Household | 16 | 20.0% |
| Total Housing Units | 80 | 100.0% |
Occupancy by Ownership by Household Size in St Joe
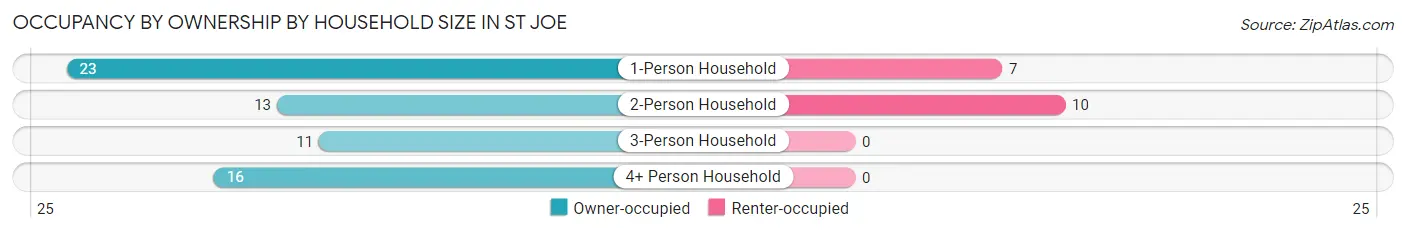
| Household Size | Owner-occupied | Renter-occupied |
| 1-Person Household | 23 (76.7%) | 7 (23.3%) |
| 2-Person Household | 13 (56.5%) | 10 (43.5%) |
| 3-Person Household | 11 (100.0%) | 0 (0.0%) |
| 4+ Person Household | 16 (100.0%) | 0 (0.0%) |
| Total Housing Units | 63 (78.7%) | 17 (21.2%) |
Occupancy by Educational Attainment in St Joe
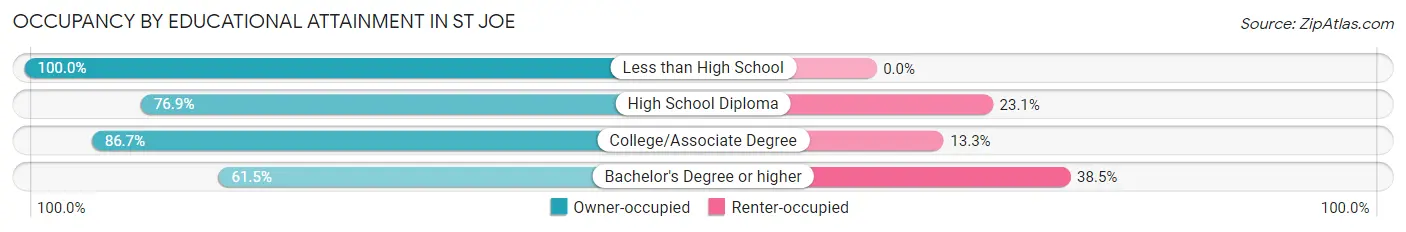
| Household Size | Owner-occupied | Renter-occupied |
| Less than High School | 11 (100.0%) | 0 (0.0%) |
| High School Diploma | 10 (76.9%) | 3 (23.1%) |
| College/Associate Degree | 26 (86.7%) | 4 (13.3%) |
| Bachelor's Degree or higher | 16 (61.5%) | 10 (38.5%) |
Occupancy by Age of Householder in St Joe
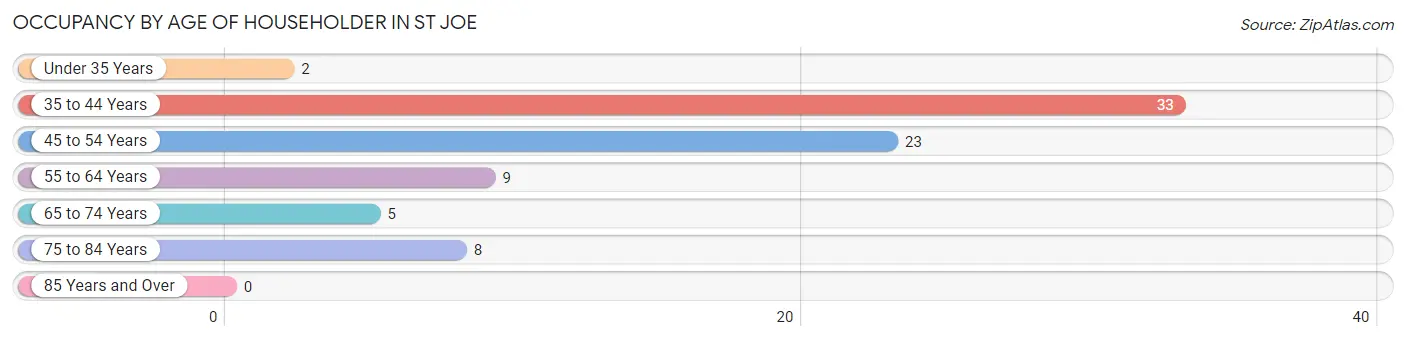
| Age Bracket | # Households | % Households |
| Under 35 Years | 2 | 2.5% |
| 35 to 44 Years | 33 | 41.2% |
| 45 to 54 Years | 23 | 28.7% |
| 55 to 64 Years | 9 | 11.3% |
| 65 to 74 Years | 5 | 6.2% |
| 75 to 84 Years | 8 | 10.0% |
| 85 Years and Over | 0 | 0.0% |
| Total | 80 | 100.0% |
Housing Finances in St Joe
Median Income by Occupancy in St Joe
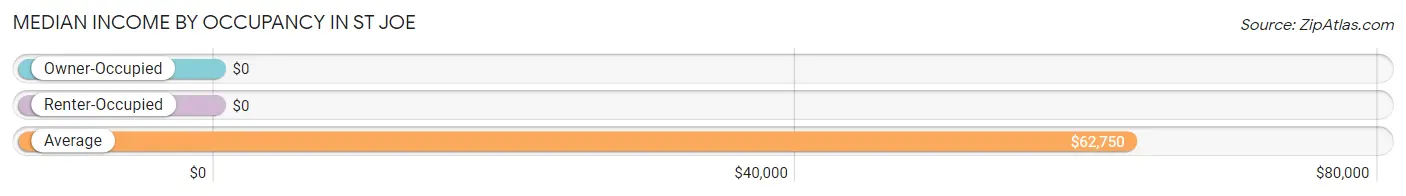
| Occupancy Type | # Households | Median Income |
| Owner-Occupied | 63 (78.7%) | $0 |
| Renter-Occupied | 17 (21.2%) | $0 |
| Average | 80 (100.0%) | $62,750 |
Occupancy by Householder Income Bracket in St Joe
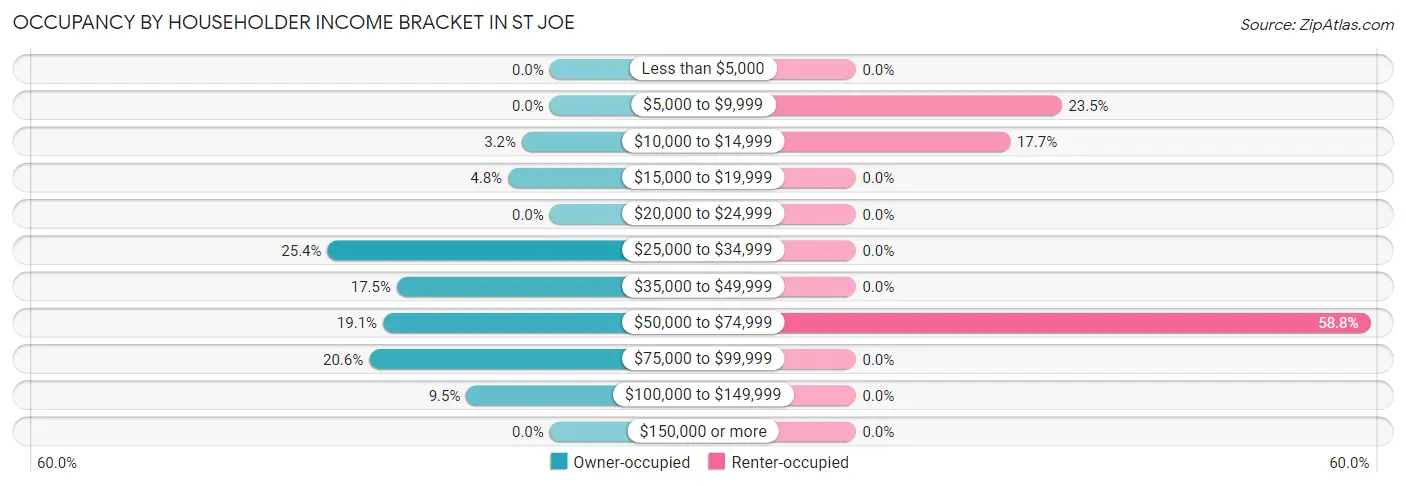
| Income Bracket | Owner-occupied | Renter-occupied |
| Less than $5,000 | 0 (0.0%) | 0 (0.0%) |
| $5,000 to $9,999 | 0 (0.0%) | 4 (23.5%) |
| $10,000 to $14,999 | 2 (3.2%) | 3 (17.6%) |
| $15,000 to $19,999 | 3 (4.8%) | 0 (0.0%) |
| $20,000 to $24,999 | 0 (0.0%) | 0 (0.0%) |
| $25,000 to $34,999 | 16 (25.4%) | 0 (0.0%) |
| $35,000 to $49,999 | 11 (17.5%) | 0 (0.0%) |
| $50,000 to $74,999 | 12 (19.1%) | 10 (58.8%) |
| $75,000 to $99,999 | 13 (20.6%) | 0 (0.0%) |
| $100,000 to $149,999 | 6 (9.5%) | 0 (0.0%) |
| $150,000 or more | 0 (0.0%) | 0 (0.0%) |
| Total | 63 (100.0%) | 17 (100.0%) |
Monthly Housing Cost Tiers in St Joe
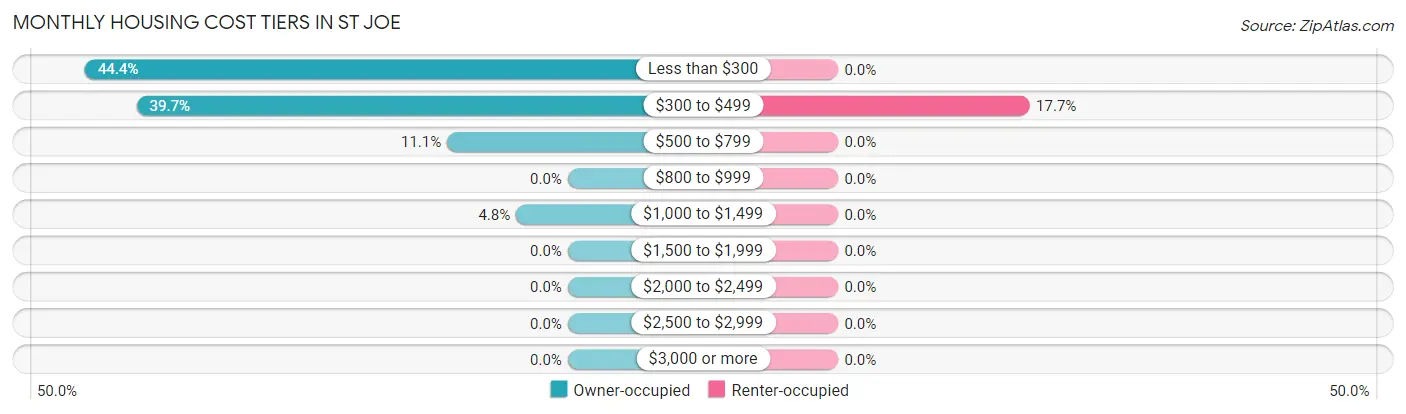
| Monthly Cost | Owner-occupied | Renter-occupied |
| Less than $300 | 28 (44.4%) | 0 (0.0%) |
| $300 to $499 | 25 (39.7%) | 3 (17.6%) |
| $500 to $799 | 7 (11.1%) | 0 (0.0%) |
| $800 to $999 | 0 (0.0%) | 0 (0.0%) |
| $1,000 to $1,499 | 3 (4.8%) | 0 (0.0%) |
| $1,500 to $1,999 | 0 (0.0%) | 0 (0.0%) |
| $2,000 to $2,499 | 0 (0.0%) | 0 (0.0%) |
| $2,500 to $2,999 | 0 (0.0%) | 0 (0.0%) |
| $3,000 or more | 0 (0.0%) | 0 (0.0%) |
| Total | 63 (100.0%) | 17 (100.0%) |
Physical Housing Characteristics in St Joe
Housing Structures in St Joe
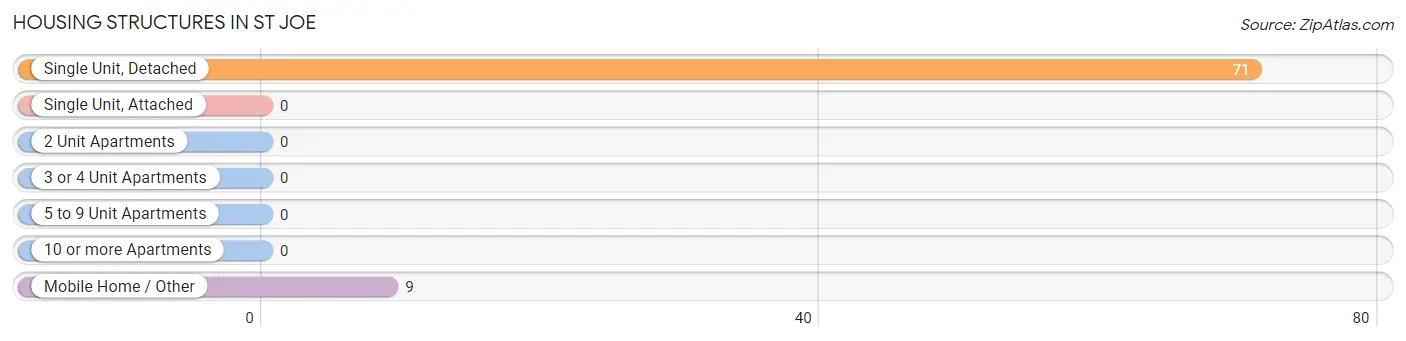
| Structure Type | # Housing Units | % Housing Units |
| Single Unit, Detached | 71 | 88.7% |
| Single Unit, Attached | 0 | 0.0% |
| 2 Unit Apartments | 0 | 0.0% |
| 3 or 4 Unit Apartments | 0 | 0.0% |
| 5 to 9 Unit Apartments | 0 | 0.0% |
| 10 or more Apartments | 0 | 0.0% |
| Mobile Home / Other | 9 | 11.3% |
| Total | 80 | 100.0% |
Housing Structures by Occupancy in St Joe
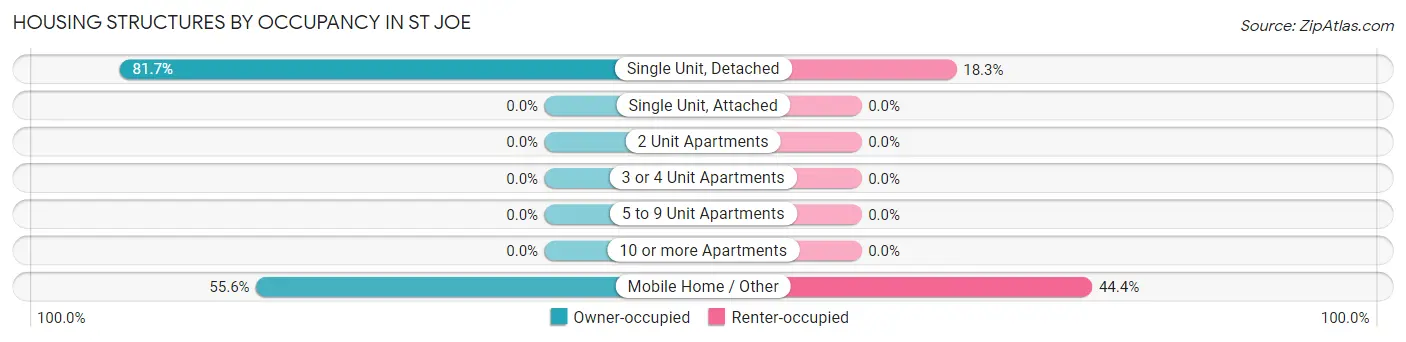
| Structure Type | Owner-occupied | Renter-occupied |
| Single Unit, Detached | 58 (81.7%) | 13 (18.3%) |
| Single Unit, Attached | 0 (0.0%) | 0 (0.0%) |
| 2 Unit Apartments | 0 (0.0%) | 0 (0.0%) |
| 3 or 4 Unit Apartments | 0 (0.0%) | 0 (0.0%) |
| 5 to 9 Unit Apartments | 0 (0.0%) | 0 (0.0%) |
| 10 or more Apartments | 0 (0.0%) | 0 (0.0%) |
| Mobile Home / Other | 5 (55.6%) | 4 (44.4%) |
| Total | 63 (78.7%) | 17 (21.2%) |
Housing Structures by Number of Rooms in St Joe
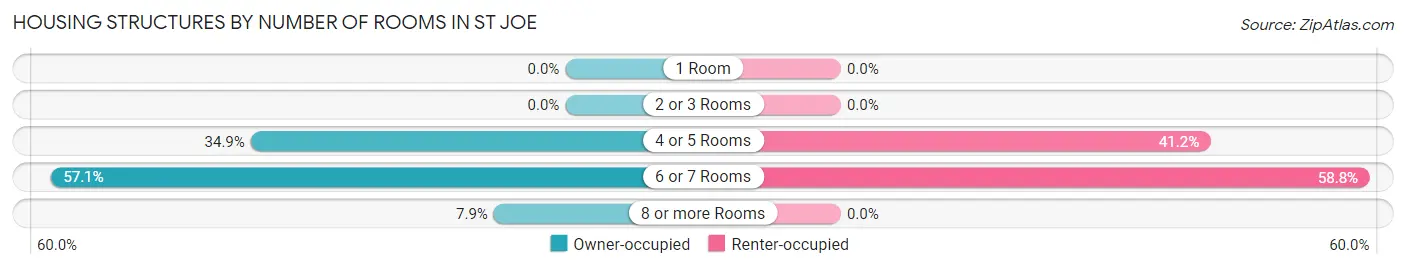
| Number of Rooms | Owner-occupied | Renter-occupied |
| 1 Room | 0 (0.0%) | 0 (0.0%) |
| 2 or 3 Rooms | 0 (0.0%) | 0 (0.0%) |
| 4 or 5 Rooms | 22 (34.9%) | 7 (41.2%) |
| 6 or 7 Rooms | 36 (57.1%) | 10 (58.8%) |
| 8 or more Rooms | 5 (7.9%) | 0 (0.0%) |
| Total | 63 (100.0%) | 17 (100.0%) |
Housing Structure by Heating Type in St Joe
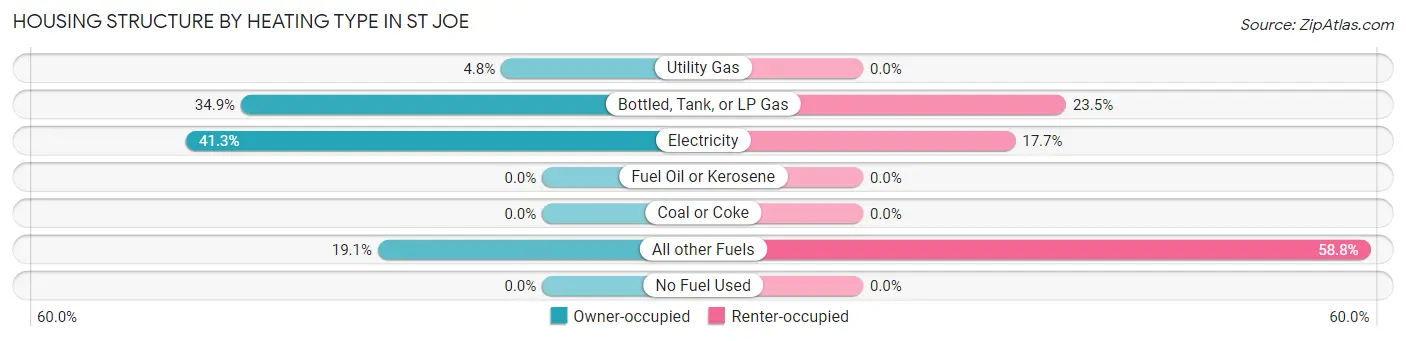
| Heating Type | Owner-occupied | Renter-occupied |
| Utility Gas | 3 (4.8%) | 0 (0.0%) |
| Bottled, Tank, or LP Gas | 22 (34.9%) | 4 (23.5%) |
| Electricity | 26 (41.3%) | 3 (17.6%) |
| Fuel Oil or Kerosene | 0 (0.0%) | 0 (0.0%) |
| Coal or Coke | 0 (0.0%) | 0 (0.0%) |
| All other Fuels | 12 (19.1%) | 10 (58.8%) |
| No Fuel Used | 0 (0.0%) | 0 (0.0%) |
| Total | 63 (100.0%) | 17 (100.0%) |
Household Vehicle Usage in St Joe
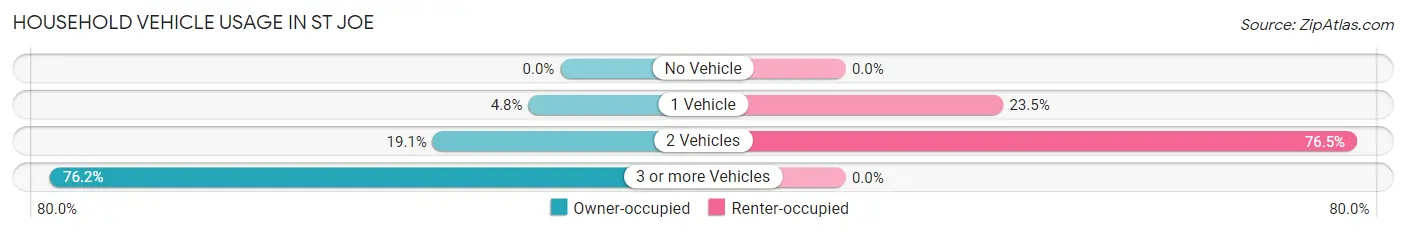
| Vehicles per Household | Owner-occupied | Renter-occupied |
| No Vehicle | 0 (0.0%) | 0 (0.0%) |
| 1 Vehicle | 3 (4.8%) | 4 (23.5%) |
| 2 Vehicles | 12 (19.1%) | 13 (76.5%) |
| 3 or more Vehicles | 48 (76.2%) | 0 (0.0%) |
| Total | 63 (100.0%) | 17 (100.0%) |
Real Estate & Mortgages in St Joe
Real Estate and Mortgage Overview in St Joe
| Characteristic | Without Mortgage | With Mortgage |
| Housing Units | 56 | 7 |
| Median Property Value | $69,000 | $0 |
| Median Household Income | $53,750 | $0 |
| Monthly Housing Costs | $300 | $0 |
| Real Estate Taxes | - | - |
Property Value by Mortgage Status in St Joe
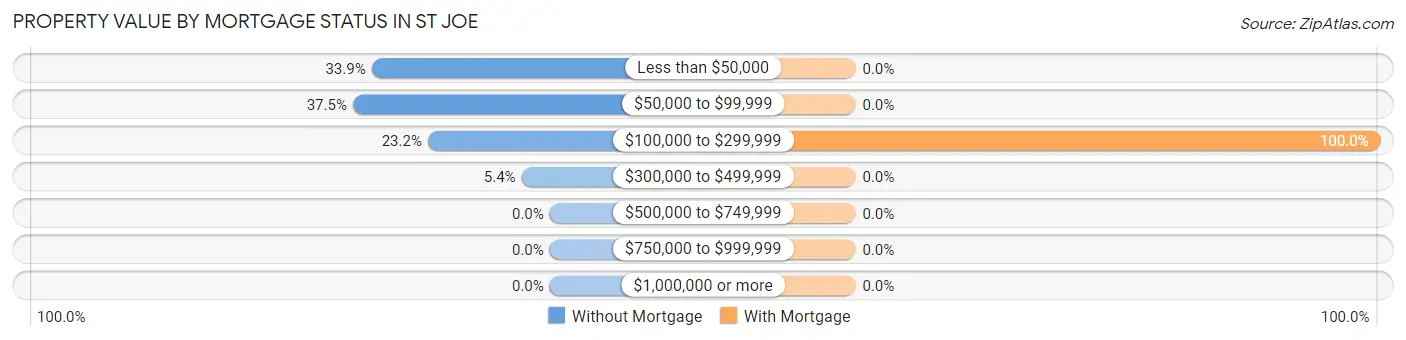
| Property Value | Without Mortgage | With Mortgage |
| Less than $50,000 | 19 (33.9%) | 0 (0.0%) |
| $50,000 to $99,999 | 21 (37.5%) | 0 (0.0%) |
| $100,000 to $299,999 | 13 (23.2%) | 7 (100.0%) |
| $300,000 to $499,999 | 3 (5.4%) | 0 (0.0%) |
| $500,000 to $749,999 | 0 (0.0%) | 0 (0.0%) |
| $750,000 to $999,999 | 0 (0.0%) | 0 (0.0%) |
| $1,000,000 or more | 0 (0.0%) | 0 (0.0%) |
| Total | 56 (100.0%) | 7 (100.0%) |
Household Income by Mortgage Status in St Joe
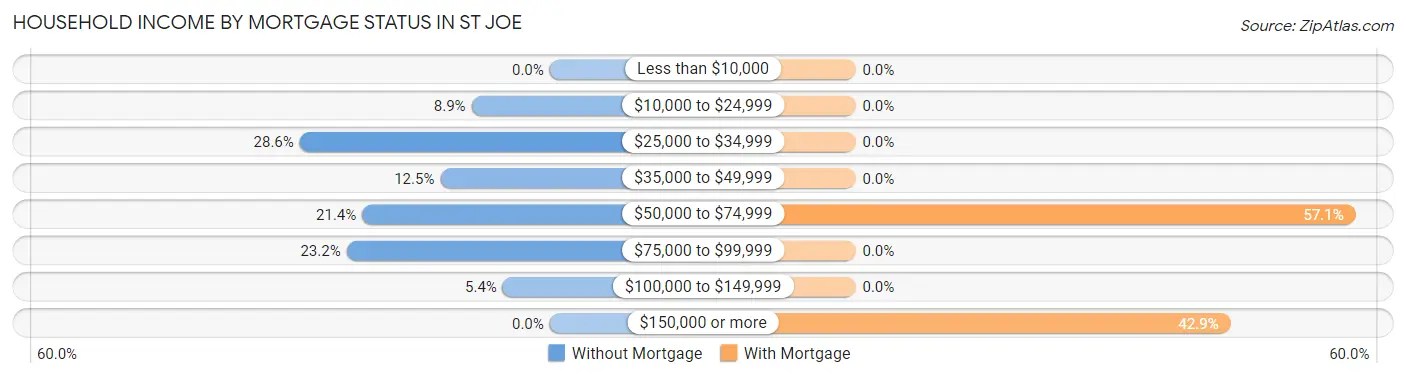
| Household Income | Without Mortgage | With Mortgage |
| Less than $10,000 | 0 (0.0%) | 0 (0.0%) |
| $10,000 to $24,999 | 5 (8.9%) | 0 (0.0%) |
| $25,000 to $34,999 | 16 (28.6%) | 0 (0.0%) |
| $35,000 to $49,999 | 7 (12.5%) | 0 (0.0%) |
| $50,000 to $74,999 | 12 (21.4%) | 4 (57.1%) |
| $75,000 to $99,999 | 13 (23.2%) | 0 (0.0%) |
| $100,000 to $149,999 | 3 (5.4%) | 0 (0.0%) |
| $150,000 or more | 0 (0.0%) | 3 (42.9%) |
| Total | 56 (100.0%) | 7 (100.0%) |
Property Value to Household Income Ratio in St Joe
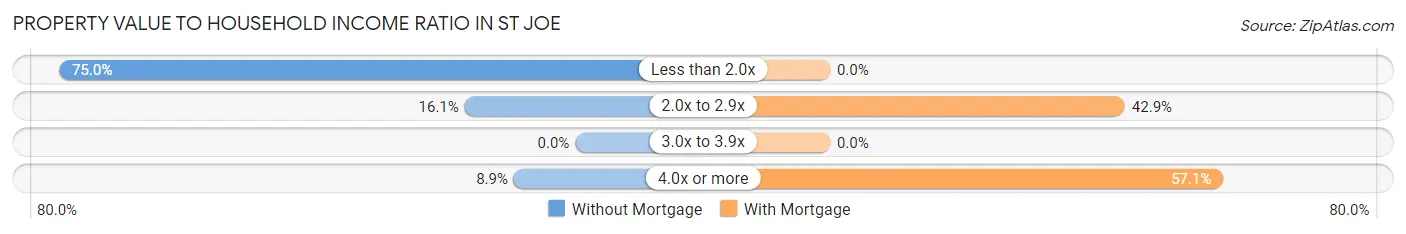
| Value-to-Income Ratio | Without Mortgage | With Mortgage |
| Less than 2.0x | 42 (75.0%) | 0 (0.0%) |
| 2.0x to 2.9x | 9 (16.1%) | 3 (42.9%) |
| 3.0x to 3.9x | 0 (0.0%) | 0 (0.0%) |
| 4.0x or more | 5 (8.9%) | 4 (57.1%) |
| Total | 56 (100.0%) | 7 (100.0%) |
Real Estate Taxes by Mortgage Status in St Joe
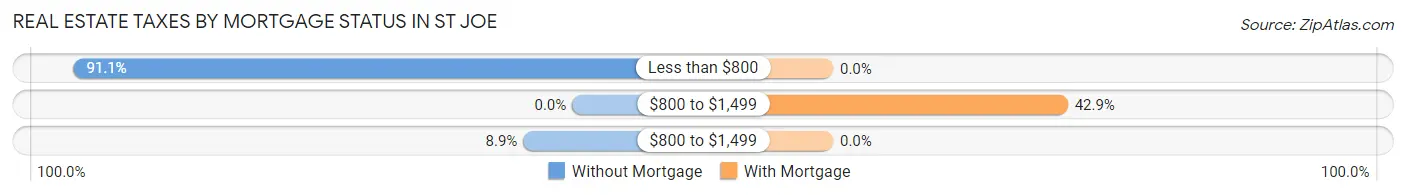
| Property Taxes | Without Mortgage | With Mortgage |
| Less than $800 | 51 (91.1%) | 0 (0.0%) |
| $800 to $1,499 | 0 (0.0%) | 3 (42.9%) |
| $800 to $1,499 | 5 (8.9%) | 0 (0.0%) |
| Total | 56 (100.0%) | 7 (100.0%) |
Health & Disability in St Joe
Health Insurance Coverage by Age in St Joe
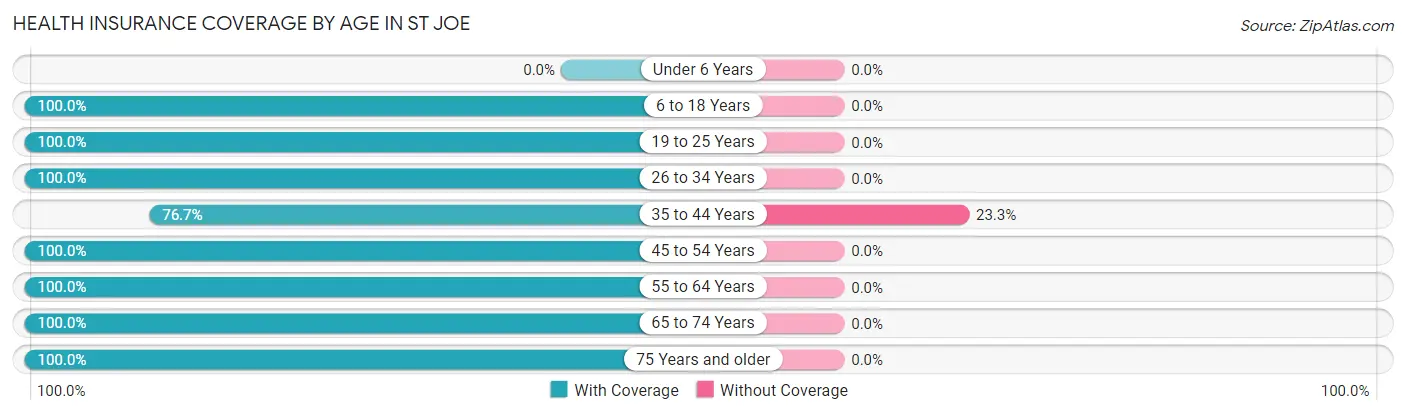
| Age Bracket | With Coverage | Without Coverage |
| Under 6 Years | 0 (0.0%) | 0 (0.0%) |
| 6 to 18 Years | 62 (100.0%) | 0 (0.0%) |
| 19 to 25 Years | 28 (100.0%) | 0 (0.0%) |
| 26 to 34 Years | 2 (100.0%) | 0 (0.0%) |
| 35 to 44 Years | 33 (76.7%) | 10 (23.3%) |
| 45 to 54 Years | 27 (100.0%) | 0 (0.0%) |
| 55 to 64 Years | 26 (100.0%) | 0 (0.0%) |
| 65 to 74 Years | 11 (100.0%) | 0 (0.0%) |
| 75 Years and older | 8 (100.0%) | 0 (0.0%) |
| Total | 197 (95.2%) | 10 (4.8%) |
Health Insurance Coverage by Citizenship Status in St Joe
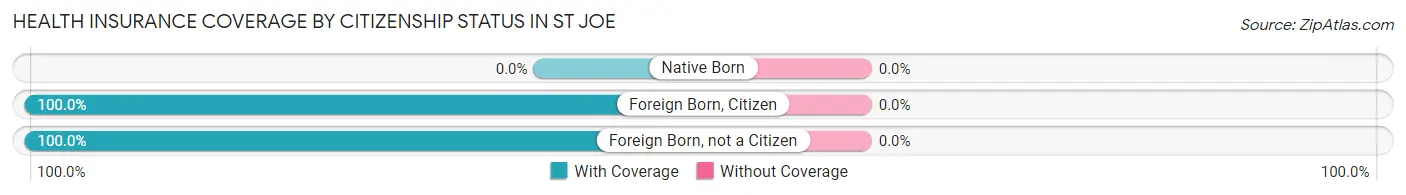
| Citizenship Status | With Coverage | Without Coverage |
| Native Born | 0 (0.0%) | 0 (0.0%) |
| Foreign Born, Citizen | 62 (100.0%) | 0 (0.0%) |
| Foreign Born, not a Citizen | 28 (100.0%) | 0 (0.0%) |
Health Insurance Coverage by Household Income in St Joe
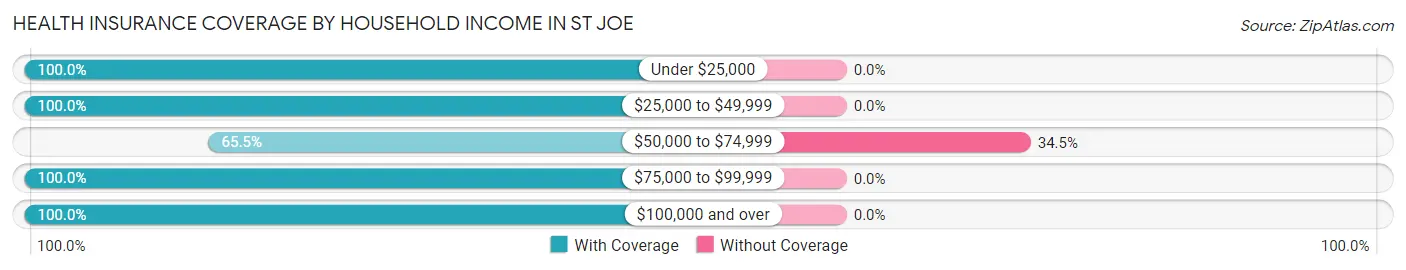
| Household Income | With Coverage | Without Coverage |
| Under $25,000 | 12 (100.0%) | 0 (0.0%) |
| $25,000 to $49,999 | 98 (100.0%) | 0 (0.0%) |
| $50,000 to $74,999 | 19 (65.5%) | 10 (34.5%) |
| $75,000 to $99,999 | 49 (100.0%) | 0 (0.0%) |
| $100,000 and over | 19 (100.0%) | 0 (0.0%) |
Public vs Private Health Insurance Coverage by Age in St Joe
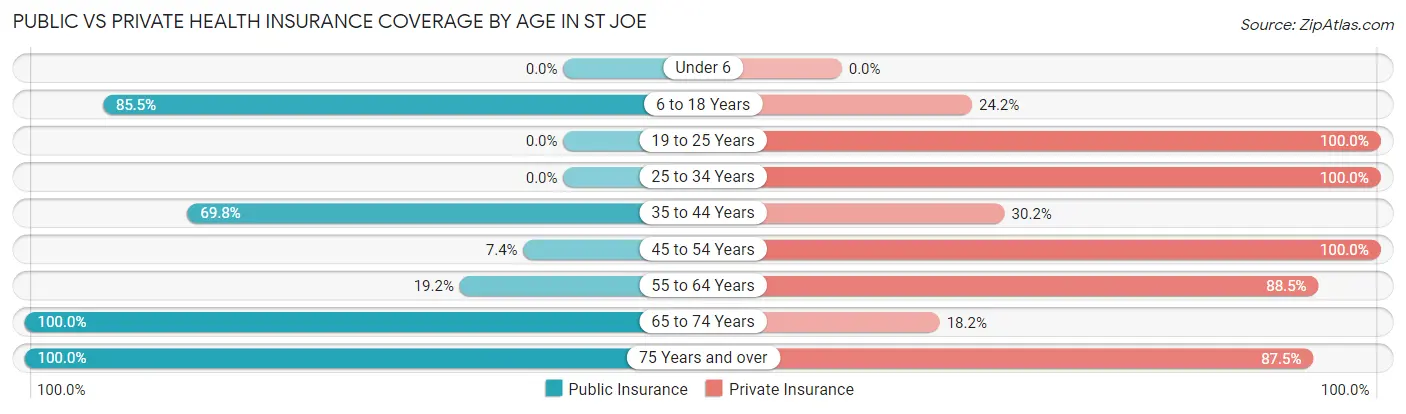
| Age Bracket | Public Insurance | Private Insurance |
| Under 6 | 0 (0.0%) | 0 (0.0%) |
| 6 to 18 Years | 53 (85.5%) | 15 (24.2%) |
| 19 to 25 Years | 0 (0.0%) | 28 (100.0%) |
| 25 to 34 Years | 0 (0.0%) | 2 (100.0%) |
| 35 to 44 Years | 30 (69.8%) | 13 (30.2%) |
| 45 to 54 Years | 2 (7.4%) | 27 (100.0%) |
| 55 to 64 Years | 5 (19.2%) | 23 (88.5%) |
| 65 to 74 Years | 11 (100.0%) | 2 (18.2%) |
| 75 Years and over | 8 (100.0%) | 7 (87.5%) |
| Total | 109 (52.7%) | 117 (56.5%) |
Disability Status by Sex by Age in St Joe
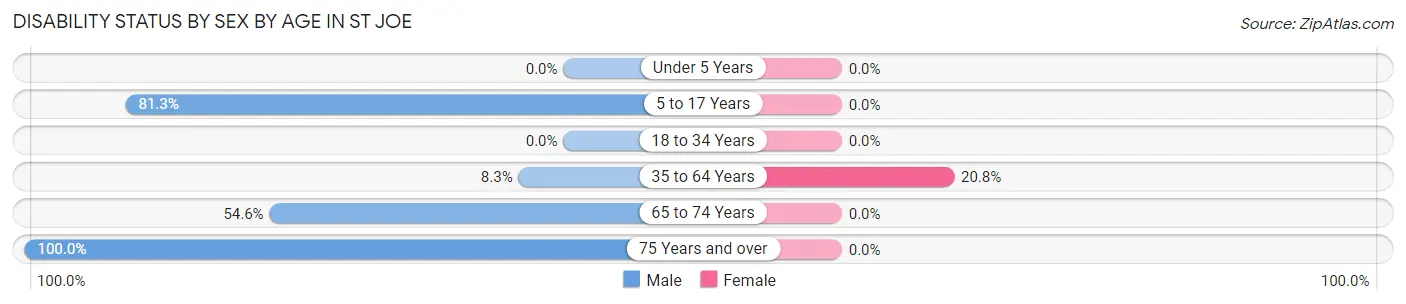
| Age Bracket | Male | Female |
| Under 5 Years | 0 (0.0%) | 0 (0.0%) |
| 5 to 17 Years | 39 (81.2%) | 0 (0.0%) |
| 18 to 34 Years | 0 (0.0%) | 0 (0.0%) |
| 35 to 64 Years | 4 (8.3%) | 10 (20.8%) |
| 65 to 74 Years | 6 (54.5%) | 0 (0.0%) |
| 75 Years and over | 7 (100.0%) | 0 (0.0%) |
Disability Class by Sex by Age in St Joe
Disability Class: Hearing Difficulty
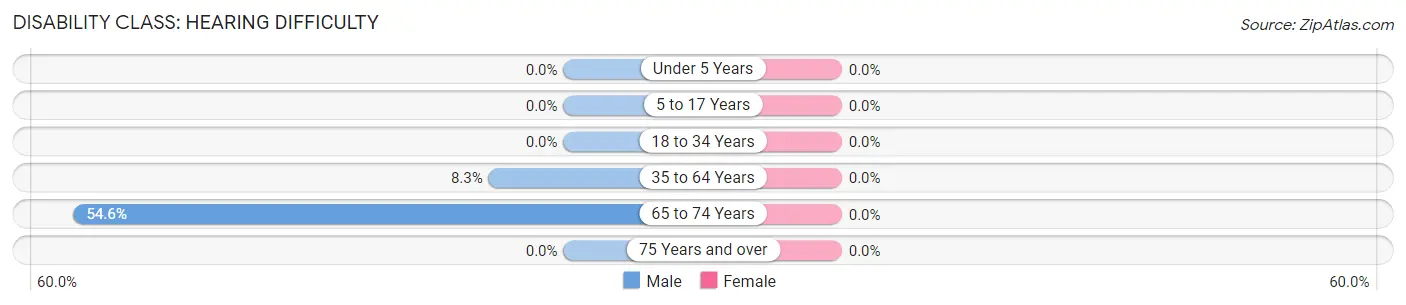
| Age Bracket | Male | Female |
| Under 5 Years | 0 (0.0%) | 0 (0.0%) |
| 5 to 17 Years | 0 (0.0%) | 0 (0.0%) |
| 18 to 34 Years | 0 (0.0%) | 0 (0.0%) |
| 35 to 64 Years | 4 (8.3%) | 0 (0.0%) |
| 65 to 74 Years | 6 (54.5%) | 0 (0.0%) |
| 75 Years and over | 0 (0.0%) | 0 (0.0%) |
Disability Class: Vision Difficulty
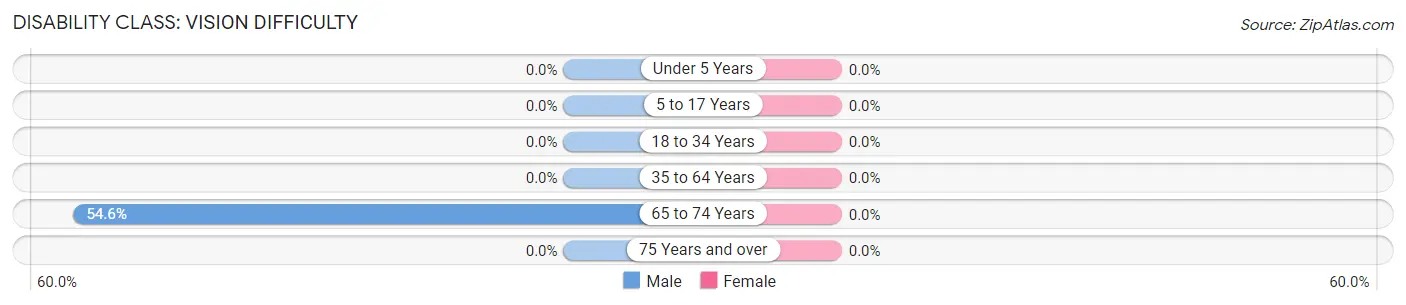
| Age Bracket | Male | Female |
| Under 5 Years | 0 (0.0%) | 0 (0.0%) |
| 5 to 17 Years | 0 (0.0%) | 0 (0.0%) |
| 18 to 34 Years | 0 (0.0%) | 0 (0.0%) |
| 35 to 64 Years | 0 (0.0%) | 0 (0.0%) |
| 65 to 74 Years | 6 (54.5%) | 0 (0.0%) |
| 75 Years and over | 0 (0.0%) | 0 (0.0%) |
Disability Class: Cognitive Difficulty
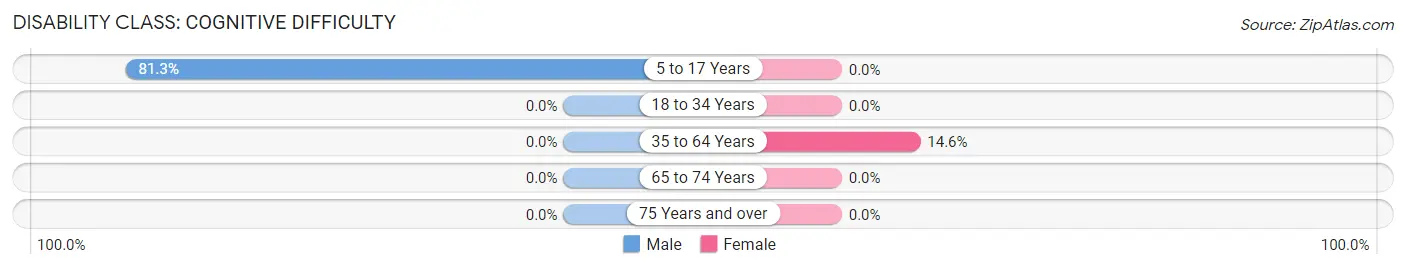
| Age Bracket | Male | Female |
| 5 to 17 Years | 39 (81.2%) | 0 (0.0%) |
| 18 to 34 Years | 0 (0.0%) | 0 (0.0%) |
| 35 to 64 Years | 0 (0.0%) | 7 (14.6%) |
| 65 to 74 Years | 0 (0.0%) | 0 (0.0%) |
| 75 Years and over | 0 (0.0%) | 0 (0.0%) |
Disability Class: Ambulatory Difficulty
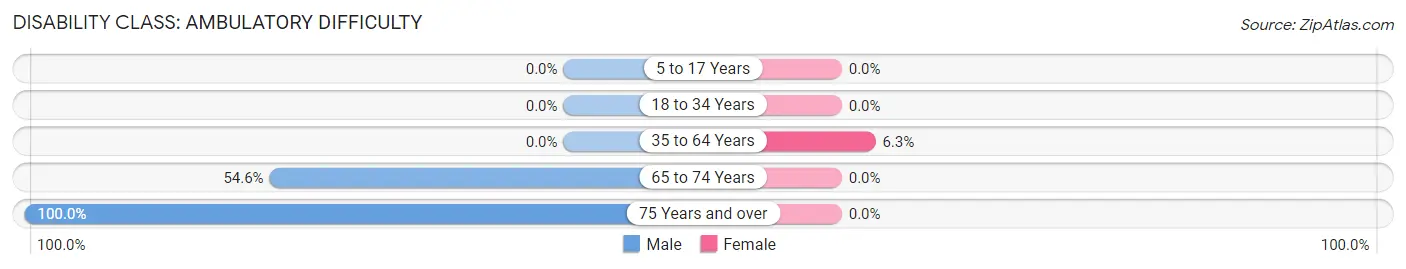
| Age Bracket | Male | Female |
| 5 to 17 Years | 0 (0.0%) | 0 (0.0%) |
| 18 to 34 Years | 0 (0.0%) | 0 (0.0%) |
| 35 to 64 Years | 0 (0.0%) | 3 (6.2%) |
| 65 to 74 Years | 6 (54.5%) | 0 (0.0%) |
| 75 Years and over | 7 (100.0%) | 0 (0.0%) |
Disability Class: Self-Care Difficulty
| Age Bracket | Male | Female |
| 5 to 17 Years | 0 (0.0%) | 0 (0.0%) |
| 18 to 34 Years | 0 (0.0%) | 0 (0.0%) |
| 35 to 64 Years | 0 (0.0%) | 0 (0.0%) |
| 65 to 74 Years | 0 (0.0%) | 0 (0.0%) |
| 75 Years and over | 0 (0.0%) | 0 (0.0%) |
Technology Access in St Joe
Computing Device Access in St Joe
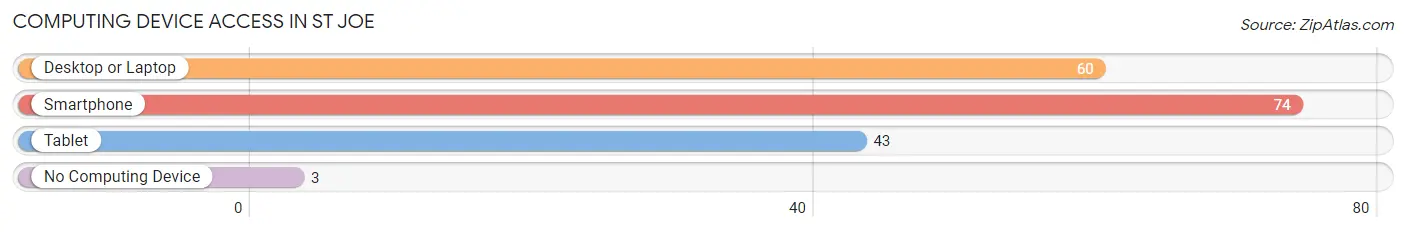
| Device Type | # Households | % Households |
| Desktop or Laptop | 60 | 75.0% |
| Smartphone | 74 | 92.5% |
| Tablet | 43 | 53.7% |
| No Computing Device | 3 | 3.7% |
| Total | 80 | 100.0% |
Internet Access in St Joe
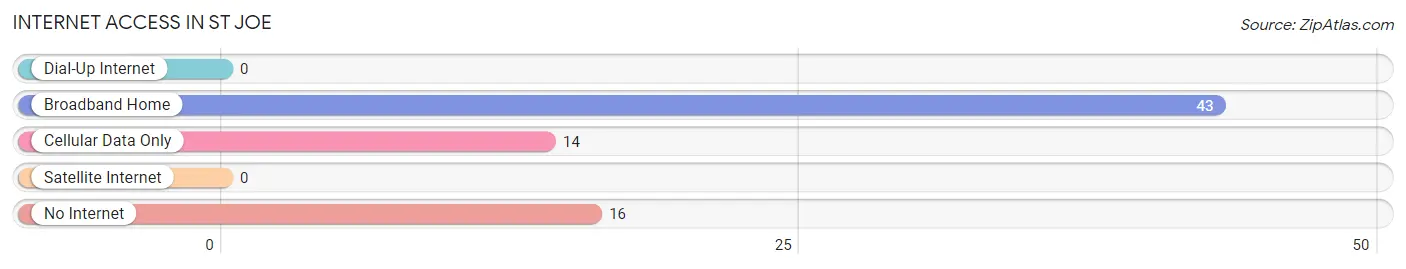
| Internet Type | # Households | % Households |
| Dial-Up Internet | 0 | 0.0% |
| Broadband Home | 43 | 53.7% |
| Cellular Data Only | 14 | 17.5% |
| Satellite Internet | 0 | 0.0% |
| No Internet | 16 | 20.0% |
| Total | 80 | 100.0% |
St Joe Summary
St. Joe is a small town located in the northwest corner of Arkansas, in the Ozark Mountains. It is situated in the foothills of the Ozarks, and is surrounded by the White River and its tributaries. The town is located in Madison County, and is part of the Fayetteville-Springdale-Rogers Metropolitan Statistical Area.
History
St. Joe was founded in 1883 by a group of settlers from the nearby town of Huntsville. The town was named after St. Joseph, the patron saint of the Catholic Church. The settlers were mostly of Irish and German descent, and the town was originally a farming community. The town was incorporated in 1887, and the first post office was established in 1888.
In the early 1900s, St. Joe began to grow and develop. The town was home to several businesses, including a sawmill, a gristmill, a blacksmith shop, and a general store. The town also had a school, a church, and a hotel.
In the 1920s, St. Joe began to experience a period of growth and prosperity. The town was home to several businesses, including a bank, a movie theater, a drug store, and a grocery store. The town also had a library, a hospital, and a fire department.
In the 1950s, St. Joe experienced a period of decline. The town's population decreased, and many of the businesses closed. The town was also affected by the construction of the Bull Shoals Dam, which flooded much of the surrounding area.
Geography
St. Joe is located in the northwest corner of Arkansas, in the Ozark Mountains. The town is situated in the foothills of the Ozarks, and is surrounded by the White River and its tributaries. The town is located in Madison County, and is part of the Fayetteville-Springdale-Rogers Metropolitan Statistical Area.
The town has a total area of 1.2 square miles, all of which is land. The town is located at an elevation of 1,072 feet above sea level.
Economy
St. Joe is a small, rural town with a population of just over 500 people. The town's economy is largely based on agriculture and tourism. The town is home to several small businesses, including a grocery store, a hardware store, and a restaurant.
The town is also home to several tourist attractions, including the Ozark National Forest, the Buffalo National River, and the White River. The town is also home to several historic sites, including the St. Joe Historic District and the St. Joe Cemetery.
Demographics
As of the 2010 census, St. Joe had a population of 517 people. The racial makeup of the town was 97.3% White, 0.4% African American, 0.2% Native American, 0.2% Asian, 0.2% from other races, and 1.6% from two or more races. Hispanic or Latino of any race were 1.2% of the population.
The median household income in St. Joe was $30,000, and the median family income was $35,000. The per capita income in the town was $14,000. About 17.3% of the population was below the poverty line.
Common Questions
What is Per Capita Income in St Joe?
Per Capita income in St Joe is $20,727.
What is the Median Family Income in St Joe?
Median Family Income in St Joe is $66,042.
What is the Median Household income in St Joe?
Median Household Income in St Joe is $62,750.
What is Inequality or Gini Index in St Joe?
Inequality or Gini Index in St Joe is 0.31.
What is the Total Population of St Joe?
Total Population of St Joe is 207.
What is the Total Male Population of St Joe?
Total Male Population of St Joe is 140.
What is the Total Female Population of St Joe?
Total Female Population of St Joe is 67.
What is the Ratio of Males per 100 Females in St Joe?
There are 208.96 Males per 100 Females in St Joe.
What is the Ratio of Females per 100 Males in St Joe?
There are 47.86 Females per 100 Males in St Joe.
What is the Median Population Age in St Joe?
Median Population Age in St Joe is 36.6 Years.
What is the Average Family Size in St Joe
Average Family Size in St Joe is 3.5 People.
What is the Average Household Size in St Joe
Average Household Size in St Joe is 2.6 People.
How Large is the Labor Force in St Joe?
There are 112 People in the Labor Forcein in St Joe.
What is the Percentage of People in the Labor Force in St Joe?
68.7% of People are in the Labor Force in St Joe.
What is the Unemployment Rate in St Joe?
Unemployment Rate in St Joe is 8.9%.