Zinc, AR Map & Demographics
Zinc Map
Zinc Overview
$20,490
PER CAPITA INCOME
0.53
INEQUALITY / GINI INDEX
68
TOTAL POPULATION
36
MALE POPULATION
32
FEMALE POPULATION
112.50
MALES / 100 FEMALES
88.89
FEMALES / 100 MALES
41.8
MEDIAN AGE
3.2
AVG FAMILY SIZE
2.3
AVG HOUSEHOLD SIZE
21
LABOR FORCE [ PEOPLE ]
37.5%
PERCENT IN LABOR FORCE
9.5%
UNEMPLOYMENT RATE
Income in Zinc
Income Overview in Zinc
| Characteristic | Number | Measure |
| Per Capita Income | 68 | $20,490 |
| Median Family Income | 15 | $0 |
| Mean Family Income | 15 | $62,607 |
| Median Household Income | 30 | $0 |
| Mean Household Income | 30 | $45,987 |
| Income Deficit | 15 | $0 |
| Wage / Income Gap (%) | 68 | 0.00% |
| Wage / Income Gap ($) | 68 | 100.00¢ per $1 |
| Gini / Inequality Index | 68 | 0.53 |
Earnings by Sex in Zinc
| Sex | Number | Average Earnings |
| Male | 10 (37.0%) | $0 |
| Female | 17 (63.0%) | $0 |
| Total | 27 (100.0%) | $0 |
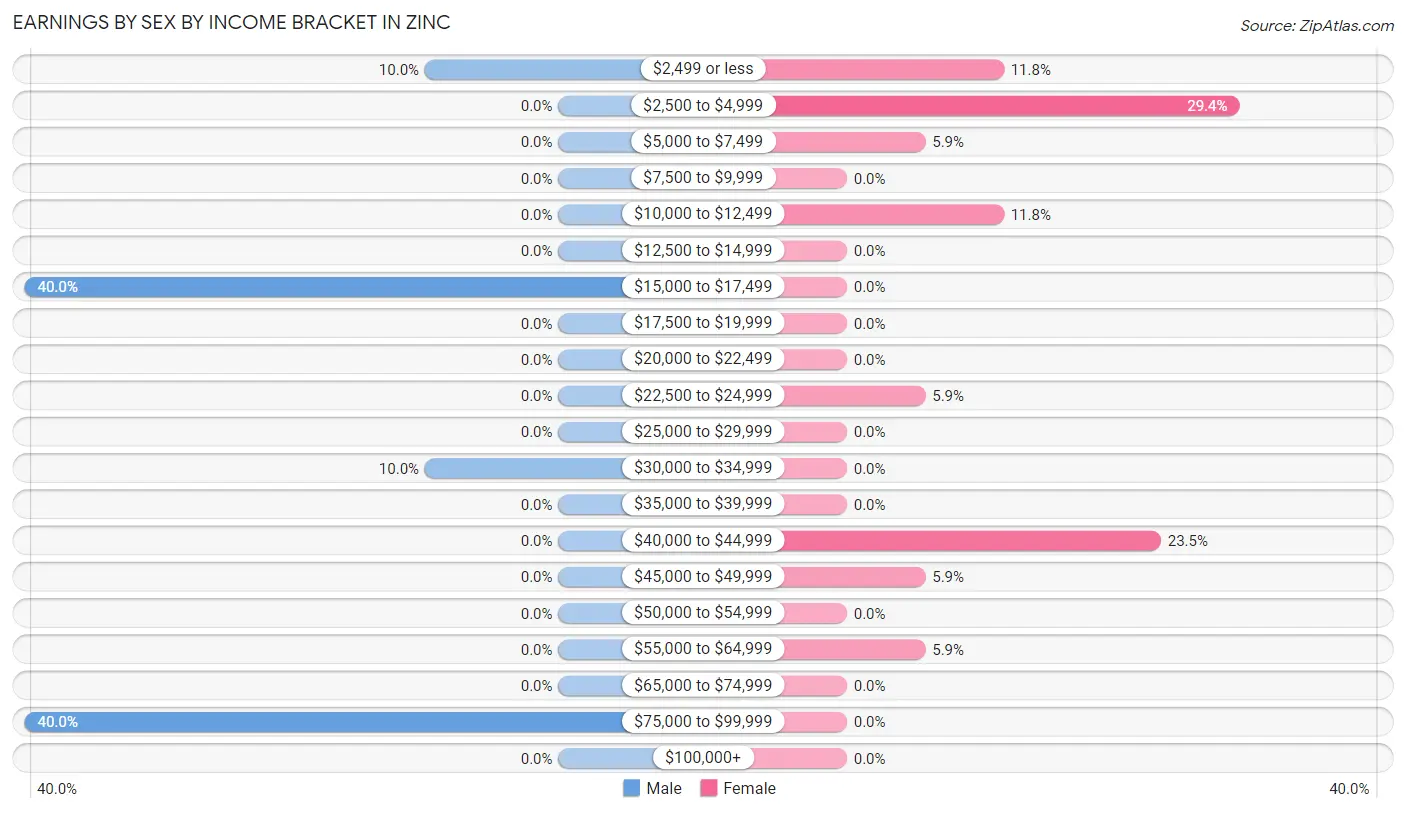
Earnings by Sex by Income Bracket in Zinc
The most common earnings brackets in Zinc are $15,000 to $17,499 for men (4 | 40.0%) and $2,500 to $4,999 for women (5 | 29.4%).
| Income | Male | Female |
| $2,499 or less | 1 (10.0%) | 2 (11.8%) |
| $2,500 to $4,999 | 0 (0.0%) | 5 (29.4%) |
| $5,000 to $7,499 | 0 (0.0%) | 1 (5.9%) |
| $7,500 to $9,999 | 0 (0.0%) | 0 (0.0%) |
| $10,000 to $12,499 | 0 (0.0%) | 2 (11.8%) |
| $12,500 to $14,999 | 0 (0.0%) | 0 (0.0%) |
| $15,000 to $17,499 | 4 (40.0%) | 0 (0.0%) |
| $17,500 to $19,999 | 0 (0.0%) | 0 (0.0%) |
| $20,000 to $22,499 | 0 (0.0%) | 0 (0.0%) |
| $22,500 to $24,999 | 0 (0.0%) | 1 (5.9%) |
| $25,000 to $29,999 | 0 (0.0%) | 0 (0.0%) |
| $30,000 to $34,999 | 1 (10.0%) | 0 (0.0%) |
| $35,000 to $39,999 | 0 (0.0%) | 0 (0.0%) |
| $40,000 to $44,999 | 0 (0.0%) | 4 (23.5%) |
| $45,000 to $49,999 | 0 (0.0%) | 1 (5.9%) |
| $50,000 to $54,999 | 0 (0.0%) | 0 (0.0%) |
| $55,000 to $64,999 | 0 (0.0%) | 1 (5.9%) |
| $65,000 to $74,999 | 0 (0.0%) | 0 (0.0%) |
| $75,000 to $99,999 | 4 (40.0%) | 0 (0.0%) |
| $100,000+ | 0 (0.0%) | 0 (0.0%) |
| Total | 10 (100.0%) | 17 (100.0%) |
Earnings by Sex by Educational Attainment in Zinc
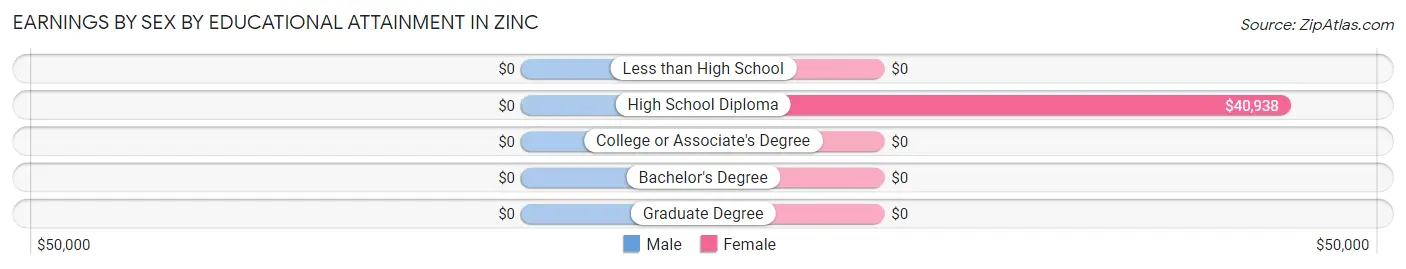
| Educational Attainment | Male Income | Female Income |
| Less than High School | - | - |
| High School Diploma | - | - |
| College or Associate's Degree | - | - |
| Bachelor's Degree | - | - |
| Graduate Degree | - | - |
| Total | - | - |
Family Income in Zinc
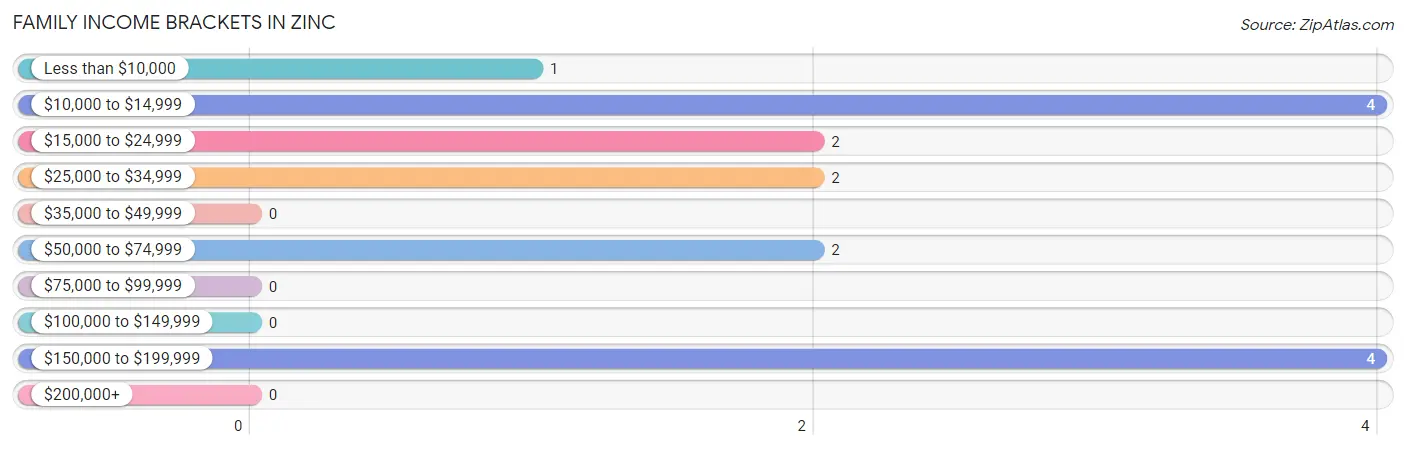
Family Income Brackets in Zinc
According to the Zinc family income data, there are 4 families falling into the $10,000 to $14,999 income range, which is the most common income bracket and makes up 26.7% of all families.
| Income Bracket | # Families | % Families |
| Less than $10,000 | 1 | 6.7% |
| $10,000 to $14,999 | 4 | 26.7% |
| $15,000 to $24,999 | 2 | 13.3% |
| $25,000 to $34,999 | 2 | 13.3% |
| $35,000 to $49,999 | 0 | 0.0% |
| $50,000 to $74,999 | 2 | 13.3% |
| $75,000 to $99,999 | 0 | 0.0% |
| $100,000 to $149,999 | 0 | 0.0% |
| $150,000 to $199,999 | 4 | 26.7% |
| $200,000+ | 0 | 0.0% |
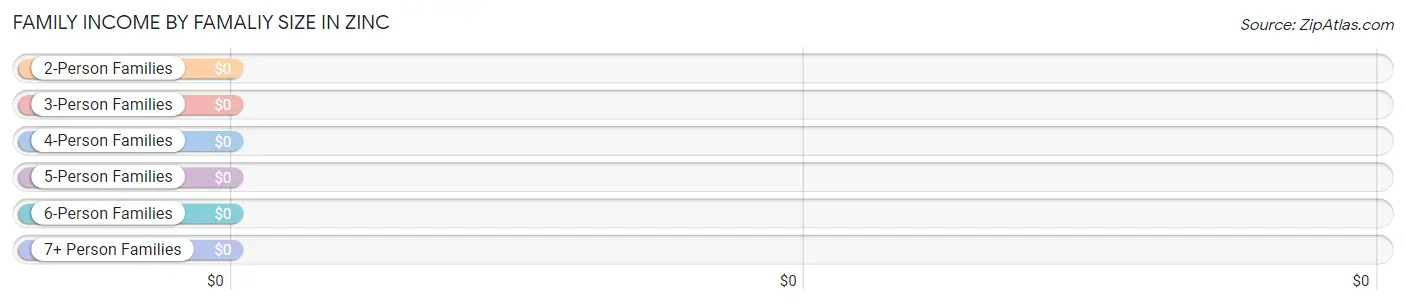
Family Income by Famaliy Size in Zinc
| Income Bracket | # Families | Median Income |
| 2-Person Families | 10 (66.7%) | $0 |
| 3-Person Families | 2 (13.3%) | $0 |
| 4-Person Families | 1 (6.7%) | $0 |
| 5-Person Families | 2 (13.3%) | $0 |
| 6-Person Families | 0 (0.0%) | $0 |
| 7+ Person Families | 0 (0.0%) | $0 |
| Total | 15 (100.0%) | $0 |
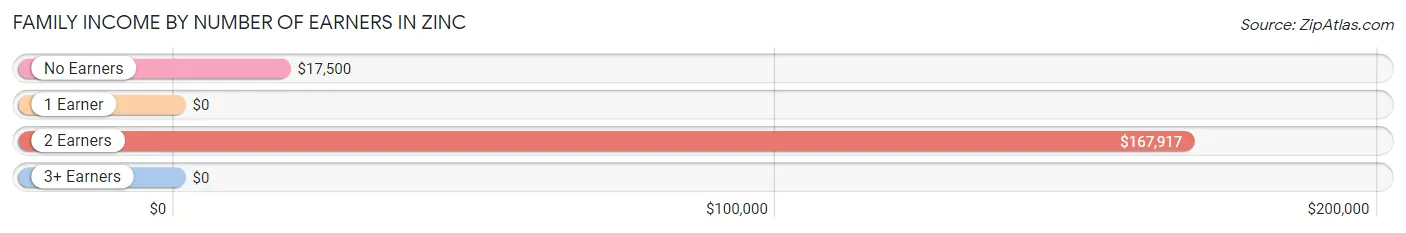
Family Income by Number of Earners in Zinc
| Number of Earners | # Families | Median Income |
| No Earners | 6 (40.0%) | $17,500 |
| 1 Earner | 4 (26.7%) | $0 |
| 2 Earners | 5 (33.3%) | $167,917 |
| 3+ Earners | 0 (0.0%) | $0 |
| Total | 15 (100.0%) | $0 |
Household Income in Zinc
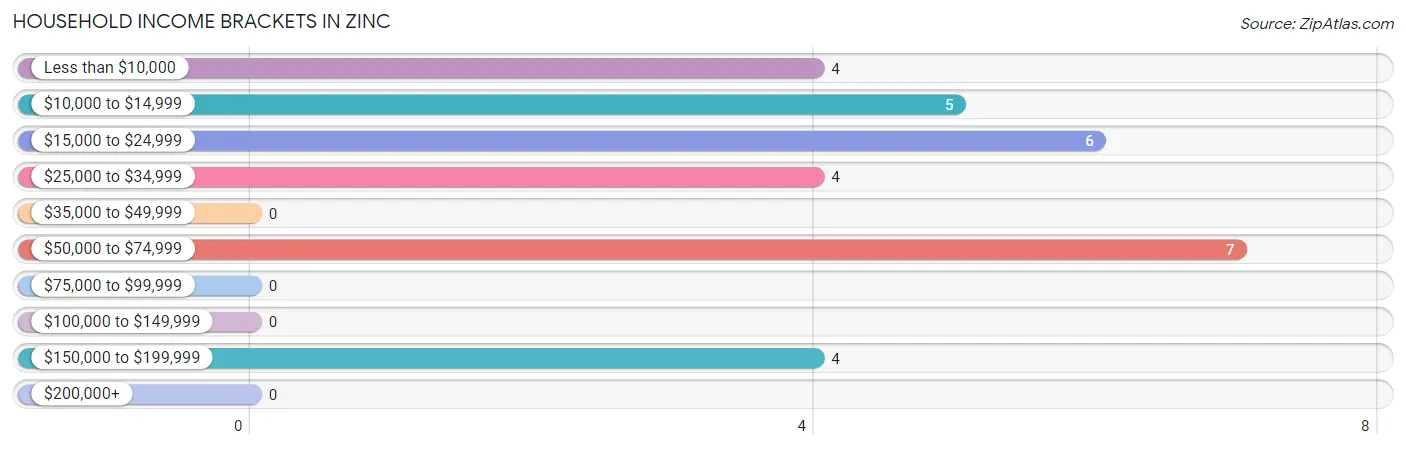
Household Income Brackets in Zinc
With 7 households falling in the category, the $50,000 to $74,999 income range is the most frequent in Zinc, accounting for 23.3% of all households.
| Income Bracket | # Households | % Households |
| Less than $10,000 | 4 | 13.3% |
| $10,000 to $14,999 | 5 | 16.7% |
| $15,000 to $24,999 | 6 | 20.0% |
| $25,000 to $34,999 | 4 | 13.3% |
| $35,000 to $49,999 | 0 | 0.0% |
| $50,000 to $74,999 | 7 | 23.3% |
| $75,000 to $99,999 | 0 | 0.0% |
| $100,000 to $149,999 | 0 | 0.0% |
| $150,000 to $199,999 | 4 | 13.3% |
| $200,000+ | 0 | 0.0% |
Household Income by Householder Age in Zinc
The median household income in Zinc is $0, with the highest median household income of $17,188 found in the 25 to 44 years age bracket for the primary householder. A total of 11 households (36.7%) fall into this category.
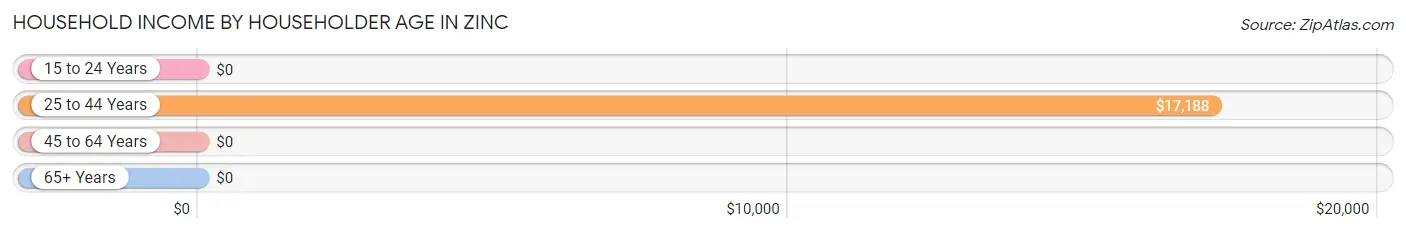
| Income Bracket | # Households | Median Income |
| 15 to 24 Years | 0 (0.0%) | $0 |
| 25 to 44 Years | 11 (36.7%) | $17,188 |
| 45 to 64 Years | 14 (46.7%) | $0 |
| 65+ Years | 5 (16.7%) | $0 |
| Total | 30 (100.0%) | $0 |
Poverty in Zinc
Income Below Poverty by Sex and Age in Zinc
With 22.2% poverty level for males and 53.1% for females among the residents of Zinc, under 5 year old males and under 5 year old females are the most vulnerable to poverty, with 2 males (100.0%) and 5 females (100.0%) in their respective age groups living below the poverty level.
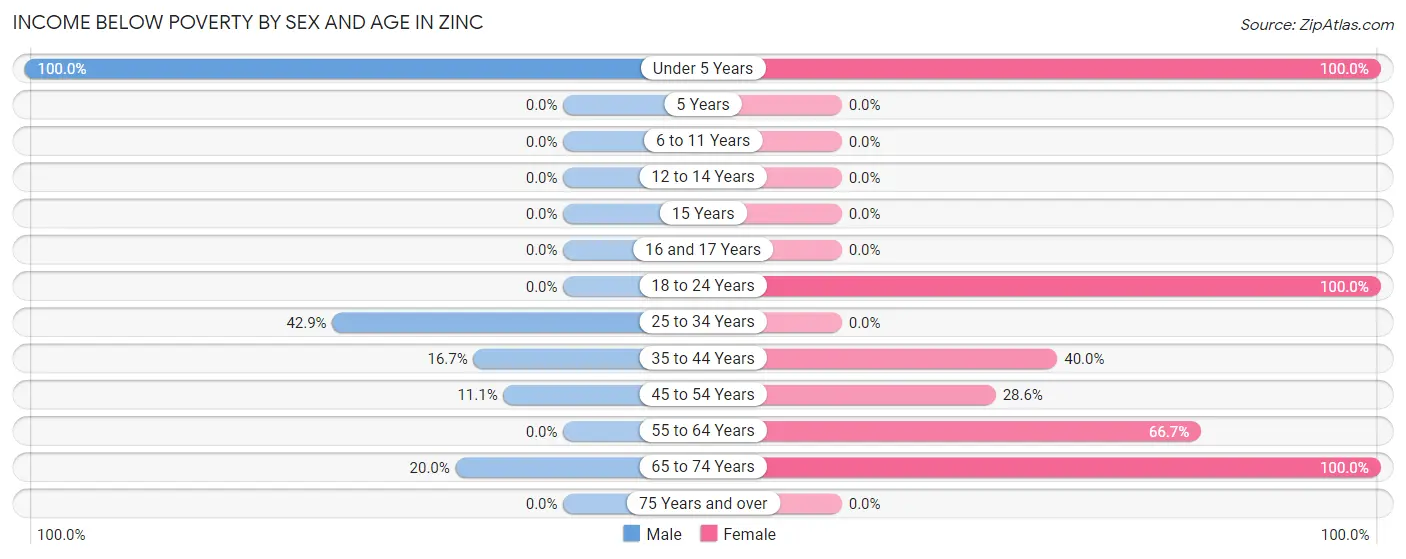
| Age Bracket | Male | Female |
| Under 5 Years | 2 (100.0%) | 5 (100.0%) |
| 5 Years | 0 (0.0%) | 0 (0.0%) |
| 6 to 11 Years | 0 (0.0%) | 0 (0.0%) |
| 12 to 14 Years | 0 (0.0%) | 0 (0.0%) |
| 15 Years | 0 (0.0%) | 0 (0.0%) |
| 16 and 17 Years | 0 (0.0%) | 0 (0.0%) |
| 18 to 24 Years | 0 (0.0%) | 3 (100.0%) |
| 25 to 34 Years | 3 (42.9%) | 0 (0.0%) |
| 35 to 44 Years | 1 (16.7%) | 2 (40.0%) |
| 45 to 54 Years | 1 (11.1%) | 2 (28.6%) |
| 55 to 64 Years | 0 (0.0%) | 4 (66.7%) |
| 65 to 74 Years | 1 (20.0%) | 1 (100.0%) |
| 75 Years and over | 0 (0.0%) | 0 (0.0%) |
| Total | 8 (22.2%) | 17 (53.1%) |
Income Above Poverty by Sex and Age in Zinc
According to the poverty statistics in Zinc, males aged 6 to 11 years and females aged 6 to 11 years are the age groups that are most secure financially, with 100.0% of males and 100.0% of females in these age groups living above the poverty line.
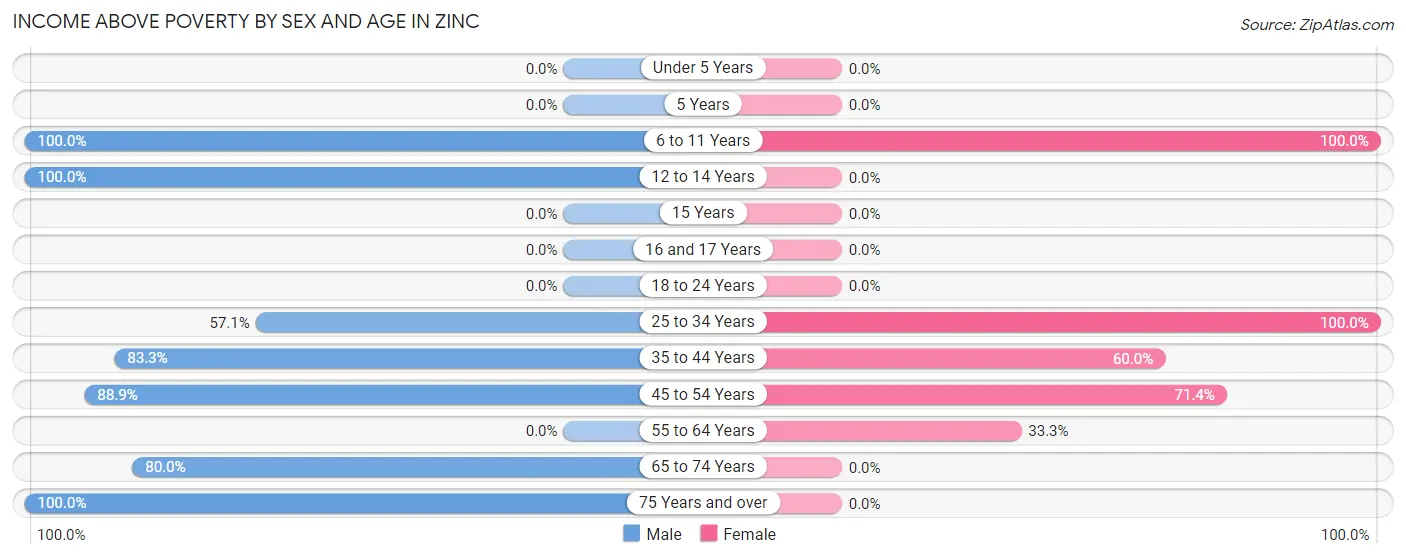
| Age Bracket | Male | Female |
| Under 5 Years | 0 (0.0%) | 0 (0.0%) |
| 5 Years | 0 (0.0%) | 0 (0.0%) |
| 6 to 11 Years | 1 (100.0%) | 1 (100.0%) |
| 12 to 14 Years | 3 (100.0%) | 0 (0.0%) |
| 15 Years | 0 (0.0%) | 0 (0.0%) |
| 16 and 17 Years | 0 (0.0%) | 0 (0.0%) |
| 18 to 24 Years | 0 (0.0%) | 0 (0.0%) |
| 25 to 34 Years | 4 (57.1%) | 4 (100.0%) |
| 35 to 44 Years | 5 (83.3%) | 3 (60.0%) |
| 45 to 54 Years | 8 (88.9%) | 5 (71.4%) |
| 55 to 64 Years | 0 (0.0%) | 2 (33.3%) |
| 65 to 74 Years | 4 (80.0%) | 0 (0.0%) |
| 75 Years and over | 3 (100.0%) | 0 (0.0%) |
| Total | 28 (77.8%) | 15 (46.9%) |
Income Below Poverty Among Married-Couple Families in Zinc
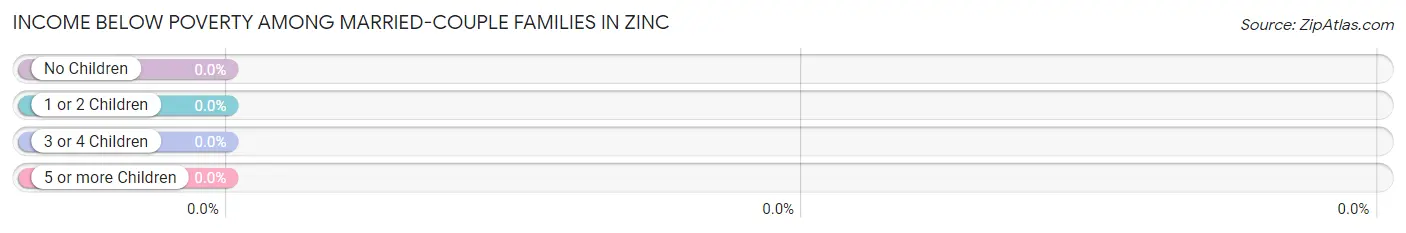
| Children | Above Poverty | Below Poverty |
| No Children | 4 (100.0%) | 0 (0.0%) |
| 1 or 2 Children | 2 (100.0%) | 0 (0.0%) |
| 3 or 4 Children | 0 (0.0%) | 0 (0.0%) |
| 5 or more Children | 0 (0.0%) | 0 (0.0%) |
| Total | 6 (100.0%) | 0 (0.0%) |
Income Below Poverty Among Single-Parent Households in Zinc
According to the poverty data in Zinc, 25.0% or 1 single-father households and 80.0% or 4 single-mother households are living below the poverty line. Among single-father households, those with no children have the highest poverty rate, with 1 households (25.0%) experiencing poverty. Likewise, among single-mother households, those with no children have the highest poverty rate, with 2 households (100.0%) falling below the poverty line.
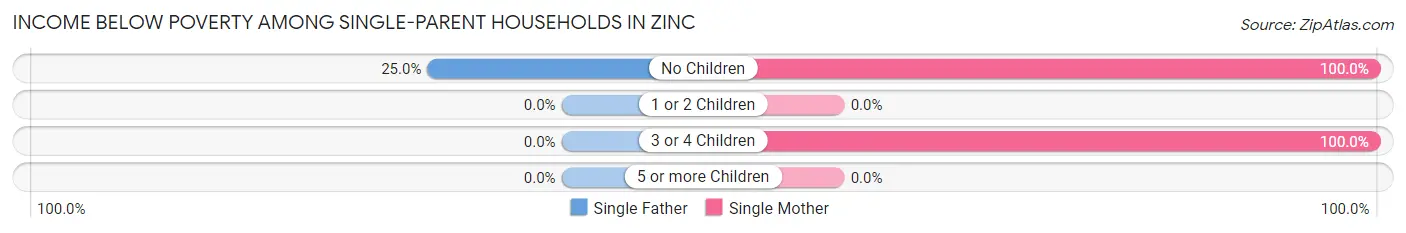
| Children | Single Father | Single Mother |
| No Children | 1 (25.0%) | 2 (100.0%) |
| 1 or 2 Children | 0 (0.0%) | 0 (0.0%) |
| 3 or 4 Children | 0 (0.0%) | 2 (100.0%) |
| 5 or more Children | 0 (0.0%) | 0 (0.0%) |
| Total | 1 (25.0%) | 4 (80.0%) |
Income Below Poverty Among Married-Couple vs Single-Parent Households in Zinc
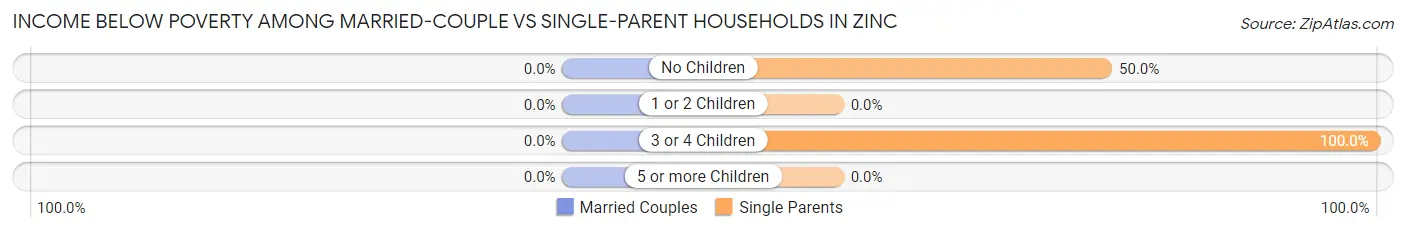
| Children | Married-Couple Families | Single-Parent Households |
| No Children | 0 (0.0%) | 3 (50.0%) |
| 1 or 2 Children | 0 (0.0%) | 0 (0.0%) |
| 3 or 4 Children | 0 (0.0%) | 2 (100.0%) |
| 5 or more Children | 0 (0.0%) | 0 (0.0%) |
| Total | 0 (0.0%) | 5 (55.6%) |
Race in Zinc
The most populous races in Zinc are White / Caucasian (63 | 92.6%), Hispanic or Latino (4 | 5.9%), and Some other Race (4 | 5.9%).
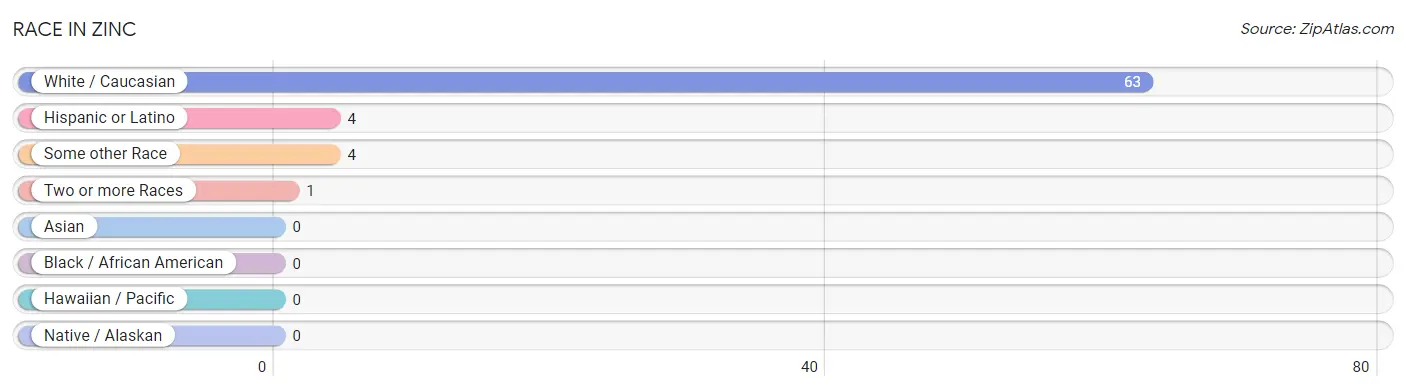
| Race | # Population | % Population |
| Asian | 0 | 0.0% |
| Black / African American | 0 | 0.0% |
| Hawaiian / Pacific | 0 | 0.0% |
| Hispanic or Latino | 4 | 5.9% |
| Native / Alaskan | 0 | 0.0% |
| White / Caucasian | 63 | 92.6% |
| Two or more Races | 1 | 1.5% |
| Some other Race | 4 | 5.9% |
| Total | 68 | 100.0% |
Ancestry in Zinc
The most populous ancestries reported in Zinc are American (8 | 11.8%), German (7 | 10.3%), Central American (4 | 5.9%), Guatemalan (4 | 5.9%), and Dutch (2 | 2.9%), together accounting for 36.7% of all Zinc residents.
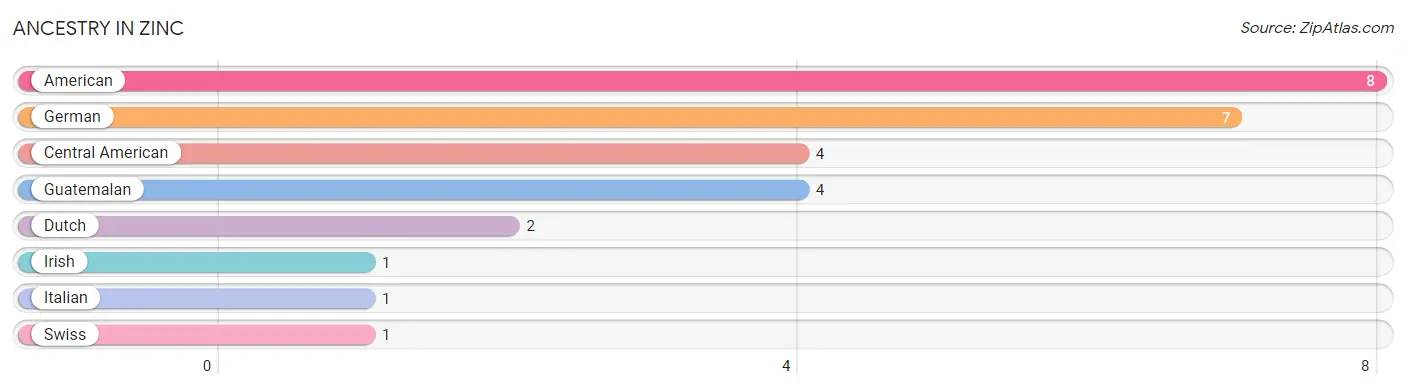
| Ancestry | # Population | % Population |
| American | 8 | 11.8% |
| Central American | 4 | 5.9% |
| Dutch | 2 | 2.9% |
| German | 7 | 10.3% |
| Guatemalan | 4 | 5.9% |
| Irish | 1 | 1.5% |
| Italian | 1 | 1.5% |
| Swiss | 1 | 1.5% | View All 8 Rows |
Immigrants in Zinc

| Immigration Origin | # Population | % Population | View All 0 Rows |
Sex and Age in Zinc
Sex and Age in Zinc
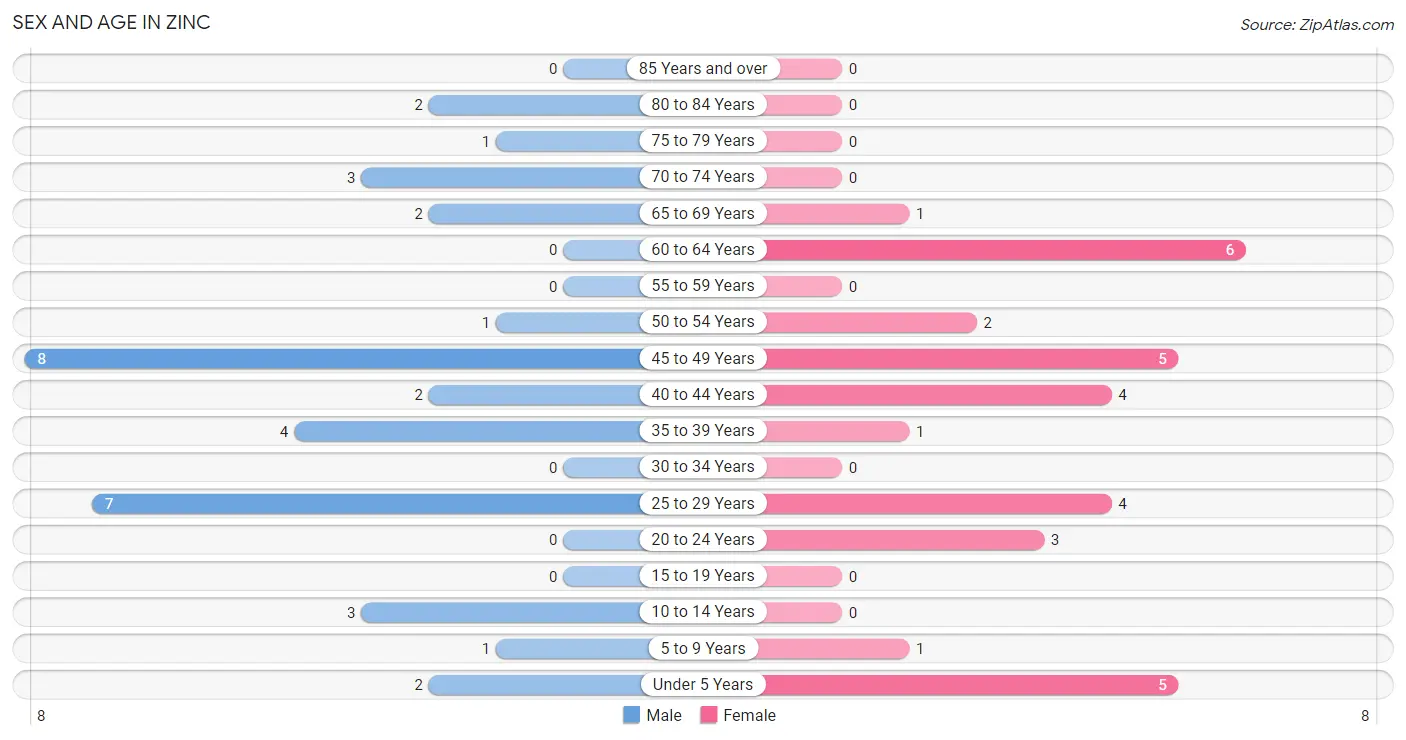
The most populous age groups in Zinc are 45 to 49 Years (8 | 22.2%) for men and 60 to 64 Years (6 | 18.8%) for women.
| Age Bracket | Male | Female |
| Under 5 Years | 2 (5.6%) | 5 (15.6%) |
| 5 to 9 Years | 1 (2.8%) | 1 (3.1%) |
| 10 to 14 Years | 3 (8.3%) | 0 (0.0%) |
| 15 to 19 Years | 0 (0.0%) | 0 (0.0%) |
| 20 to 24 Years | 0 (0.0%) | 3 (9.4%) |
| 25 to 29 Years | 7 (19.4%) | 4 (12.5%) |
| 30 to 34 Years | 0 (0.0%) | 0 (0.0%) |
| 35 to 39 Years | 4 (11.1%) | 1 (3.1%) |
| 40 to 44 Years | 2 (5.6%) | 4 (12.5%) |
| 45 to 49 Years | 8 (22.2%) | 5 (15.6%) |
| 50 to 54 Years | 1 (2.8%) | 2 (6.2%) |
| 55 to 59 Years | 0 (0.0%) | 0 (0.0%) |
| 60 to 64 Years | 0 (0.0%) | 6 (18.8%) |
| 65 to 69 Years | 2 (5.6%) | 1 (3.1%) |
| 70 to 74 Years | 3 (8.3%) | 0 (0.0%) |
| 75 to 79 Years | 1 (2.8%) | 0 (0.0%) |
| 80 to 84 Years | 2 (5.6%) | 0 (0.0%) |
| 85 Years and over | 0 (0.0%) | 0 (0.0%) |
| Total | 36 (100.0%) | 32 (100.0%) |
Families and Households in Zinc
Median Family Size in Zinc
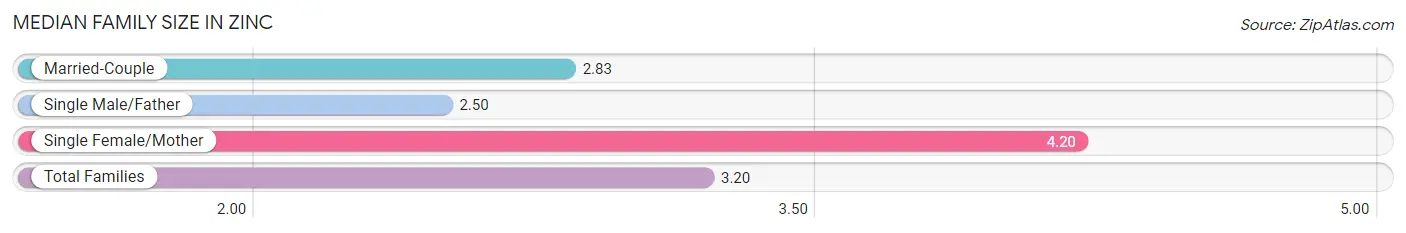
The median family size in Zinc is 3.20 persons per family, with single female/mother families (5 | 33.3%) accounting for the largest median family size of 4.2 persons per family. On the other hand, single male/father families (4 | 26.7%) represent the smallest median family size with 2.50 persons per family.
| Family Type | # Families | Family Size |
| Married-Couple | 6 (40.0%) | 2.83 |
| Single Male/Father | 4 (26.7%) | 2.50 |
| Single Female/Mother | 5 (33.3%) | 4.20 |
| Total Families | 15 (100.0%) | 3.20 |
Median Household Size in Zinc
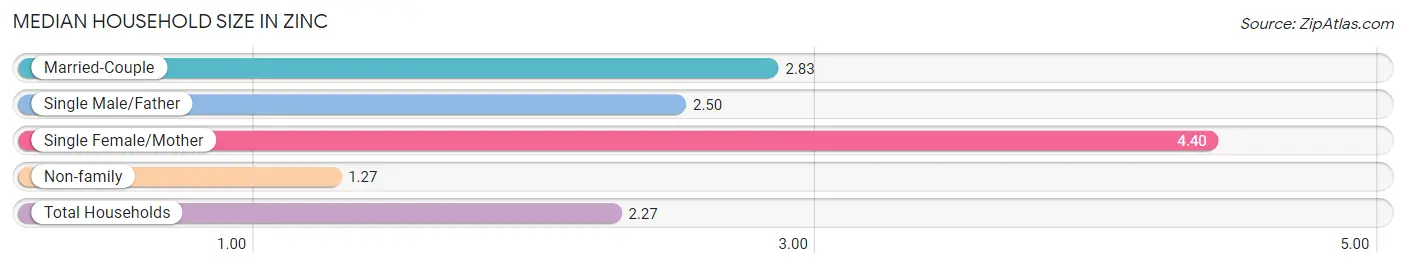
The median household size in Zinc is 2.27 persons per household, with single female/mother households (5 | 16.7%) accounting for the largest median household size of 4.4 persons per household. non-family households (15 | 50.0%) represent the smallest median household size with 1.27 persons per household.
| Household Type | # Households | Household Size |
| Married-Couple | 6 (20.0%) | 2.83 |
| Single Male/Father | 4 (13.3%) | 2.50 |
| Single Female/Mother | 5 (16.7%) | 4.40 |
| Non-family | 15 (50.0%) | 1.27 |
| Total Households | 30 (100.0%) | 2.27 |
Household Size by Marriage Status in Zinc
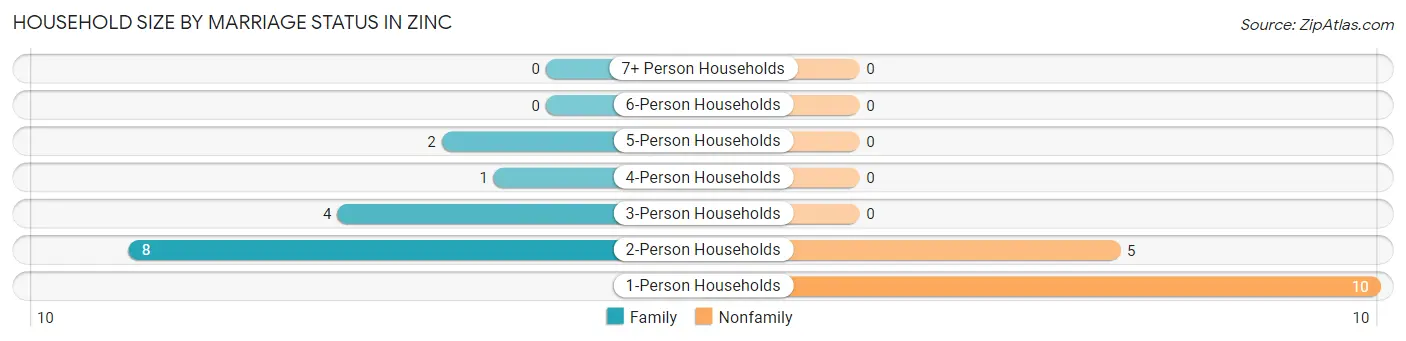
Out of a total of 30 households in Zinc, 15 (50.0%) are family households, while 15 (50.0%) are nonfamily households. The most numerous type of family households are 2-person households, comprising 8, and the most common type of nonfamily households are 1-person households, comprising 10.
| Household Size | Family Households | Nonfamily Households |
| 1-Person Households | - | 10 (33.3%) |
| 2-Person Households | 8 (26.7%) | 5 (16.7%) |
| 3-Person Households | 4 (13.3%) | 0 (0.0%) |
| 4-Person Households | 1 (3.3%) | 0 (0.0%) |
| 5-Person Households | 2 (6.7%) | 0 (0.0%) |
| 6-Person Households | 0 (0.0%) | 0 (0.0%) |
| 7+ Person Households | 0 (0.0%) | 0 (0.0%) |
| Total | 15 (50.0%) | 15 (50.0%) |
Female Fertility in Zinc
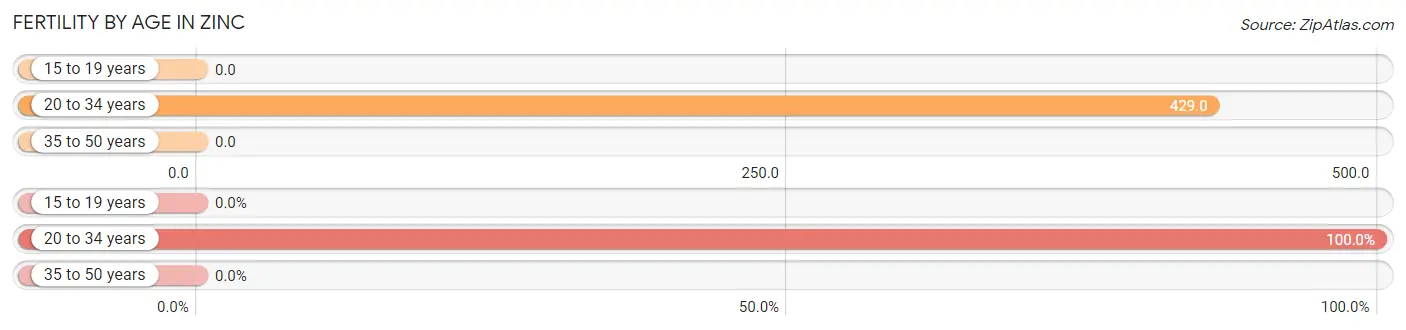
Fertility by Age in Zinc
Average fertility rate in Zinc is 158.0 births per 1,000 women. Women in the age bracket of 20 to 34 years have the highest fertility rate with 429.0 births per 1,000 women. Women in the age bracket of 20 to 34 years acount for 100.0% of all women with births.
| Age Bracket | Women with Births | Births / 1,000 Women |
| 15 to 19 years | 0 (0.0%) | 0.0 |
| 20 to 34 years | 3 (100.0%) | 429.0 |
| 35 to 50 years | 0 (0.0%) | 0.0 |
| Total | 3 (100.0%) | 158.0 |
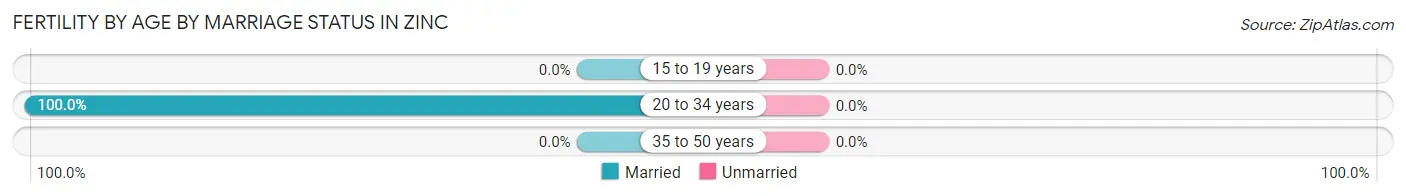
Fertility by Age by Marriage Status in Zinc
| Age Bracket | Married | Unmarried |
| 15 to 19 years | 0 (0.0%) | 0 (0.0%) |
| 20 to 34 years | 3 (100.0%) | 0 (0.0%) |
| 35 to 50 years | 0 (0.0%) | 0 (0.0%) |
| Total | 3 (100.0%) | 0 (0.0%) |
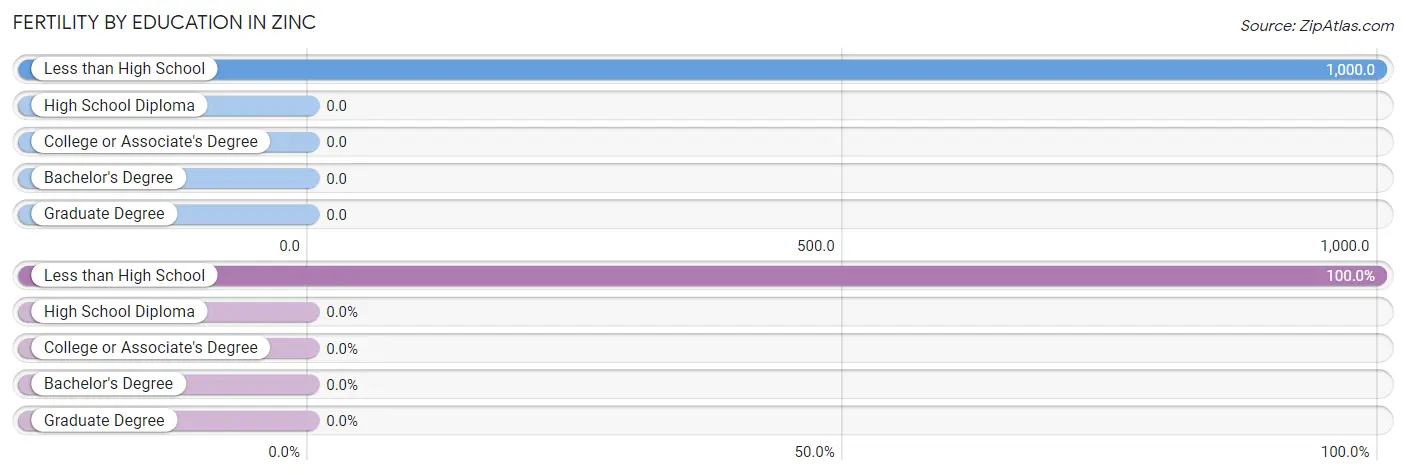
Fertility by Education in Zinc
| Educational Attainment | Women with Births | Births / 1,000 Women |
| Less than High School | 3 (100.0%) | 1,000.0 |
| High School Diploma | 0 (0.0%) | 0.0 |
| College or Associate's Degree | 0 (0.0%) | 0.0 |
| Bachelor's Degree | 0 (0.0%) | 0.0 |
| Graduate Degree | 0 (0.0%) | 0.0 |
| Total | 3 (100.0%) | 158.0 |
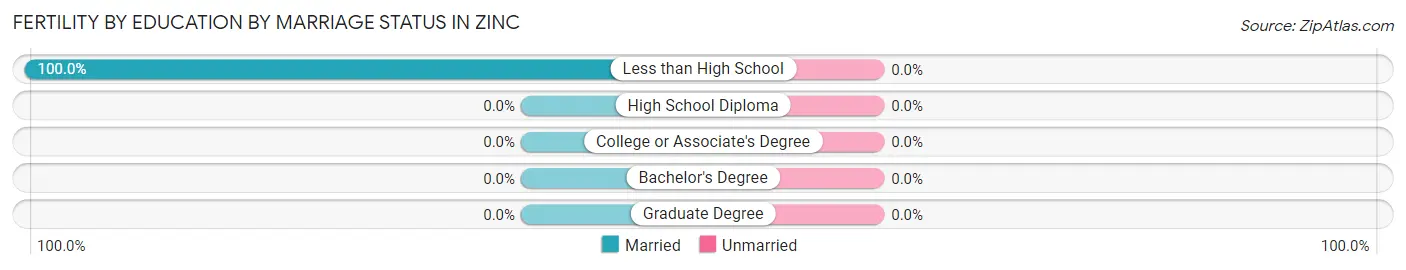
Fertility by Education by Marriage Status in Zinc
| Educational Attainment | Married | Unmarried |
| Less than High School | 3 (100.0%) | 0 (0.0%) |
| High School Diploma | 0 (0.0%) | 0 (0.0%) |
| College or Associate's Degree | 0 (0.0%) | 0 (0.0%) |
| Bachelor's Degree | 0 (0.0%) | 0 (0.0%) |
| Graduate Degree | 0 (0.0%) | 0 (0.0%) |
| Total | 3 (100.0%) | 0 (0.0%) |
Employment Characteristics in Zinc
Employment by Class of Employer in Zinc
Among the 19 employed individuals in Zinc, private company employees (15 | 78.9%), federal government employees (3 | 15.8%), and self-employed (incorporated) (1 | 5.3%) make up the most common classes of employment.
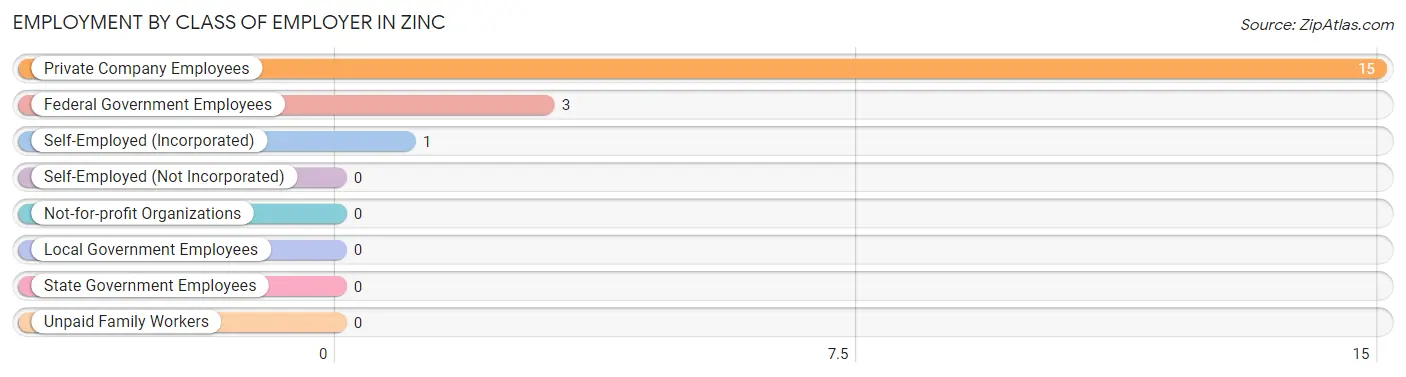
| Employer Class | # Employees | % Employees |
| Private Company Employees | 15 | 78.9% |
| Self-Employed (Incorporated) | 1 | 5.3% |
| Self-Employed (Not Incorporated) | 0 | 0.0% |
| Not-for-profit Organizations | 0 | 0.0% |
| Local Government Employees | 0 | 0.0% |
| State Government Employees | 0 | 0.0% |
| Federal Government Employees | 3 | 15.8% |
| Unpaid Family Workers | 0 | 0.0% |
| Total | 19 | 100.0% |
Employment Status by Age in Zinc
According to the labor force statistics for Zinc, out of the total population over 16 years of age (56), 37.5% or 21 individuals are in the labor force, with 9.5% or 2 of them unemployed. The age group with the highest labor force participation rate is 25 to 29 years, with 72.7% or 8 individuals in the labor force. Within the labor force, the 60 to 64 years age range has the highest percentage of unemployed individuals, with 66.7% or 2 of them being unemployed.
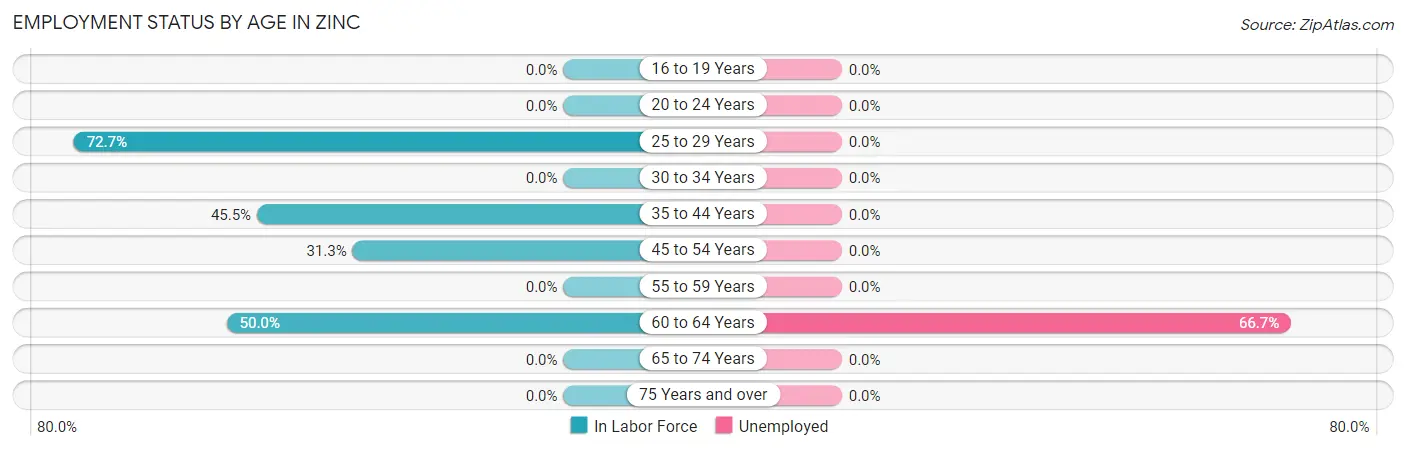
| Age Bracket | In Labor Force | Unemployed |
| 16 to 19 Years | 0 (0.0%) | 0 (0.0%) |
| 20 to 24 Years | 0 (0.0%) | 0 (0.0%) |
| 25 to 29 Years | 8 (72.7%) | 0 (0.0%) |
| 30 to 34 Years | 0 (0.0%) | 0 (0.0%) |
| 35 to 44 Years | 5 (45.5%) | 0 (0.0%) |
| 45 to 54 Years | 5 (31.3%) | 0 (0.0%) |
| 55 to 59 Years | 0 (0.0%) | 0 (0.0%) |
| 60 to 64 Years | 3 (50.0%) | 2 (66.7%) |
| 65 to 74 Years | 0 (0.0%) | 0 (0.0%) |
| 75 Years and over | 0 (0.0%) | 0 (0.0%) |
| Total | 21 (37.5%) | 2 (9.5%) |
Employment Status by Educational Attainment in Zinc
According to labor force statistics for Zinc, 47.7% of individuals (21) out of the total population between 25 and 64 years of age (44) are in the labor force, with 9.5% or 2 of them being unemployed. The group with the highest labor force participation rate are those with the educational attainment of bachelor's degree or higher, with 100.0% or 2 individuals in the labor force. Within the labor force, individuals with college / associate degree education have the highest percentage of unemployment, with 28.6% or 2 of them being unemployed.
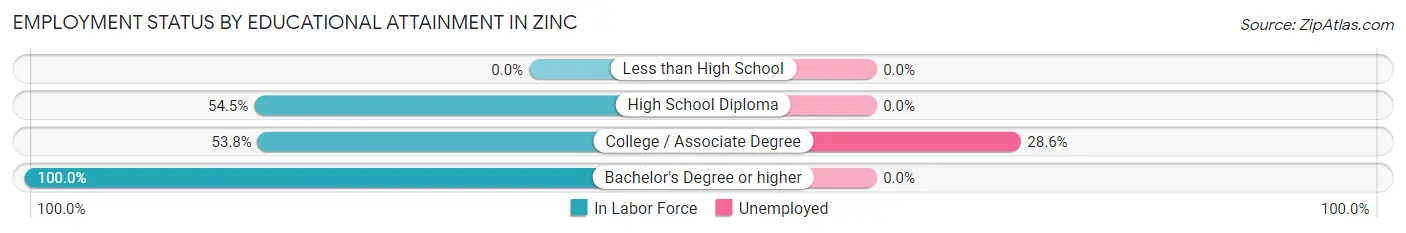
| Educational Attainment | In Labor Force | Unemployed |
| Less than High School | 0 (0.0%) | 0 (0.0%) |
| High School Diploma | 12 (54.5%) | 0 (0.0%) |
| College / Associate Degree | 7 (53.8%) | 4 (28.6%) |
| Bachelor's Degree or higher | 2 (100.0%) | 0 (0.0%) |
| Total | 21 (47.7%) | 4 (9.5%) |
Employment Occupations by Sex in Zinc
Management, Business, Science and Arts Occupations
The most common Management, Business, Science and Arts occupations in Zinc are Management (2 | 10.5%), and Business & Financial (1 | 5.3%).
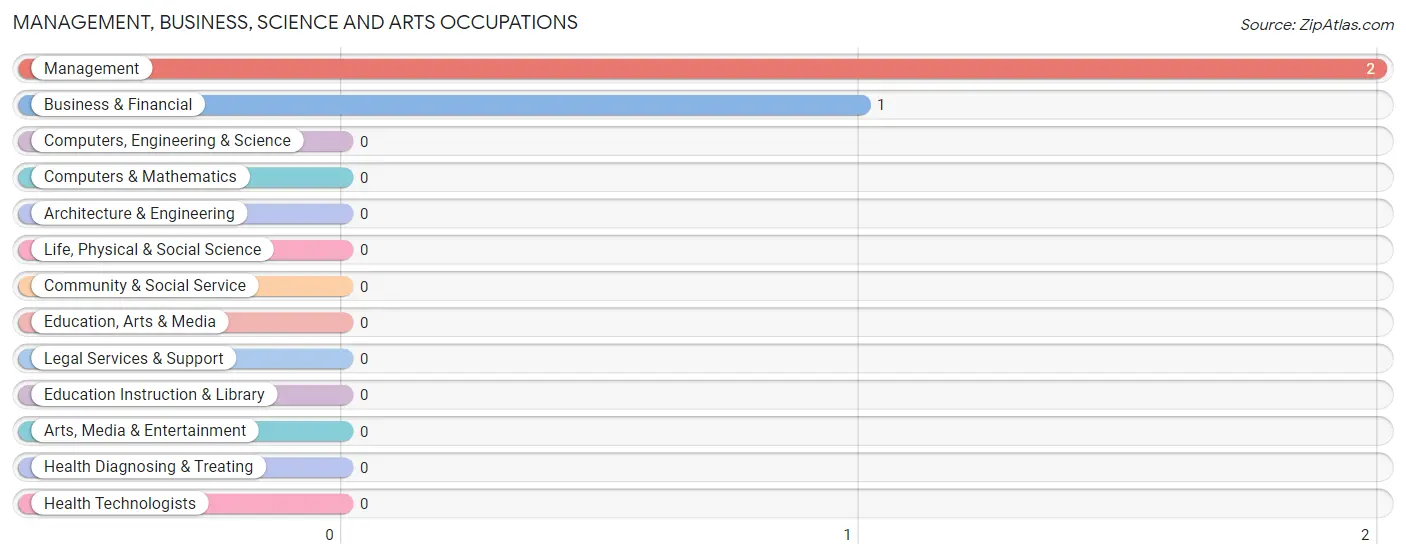
Management, Business, Science and Arts Occupations by Sex
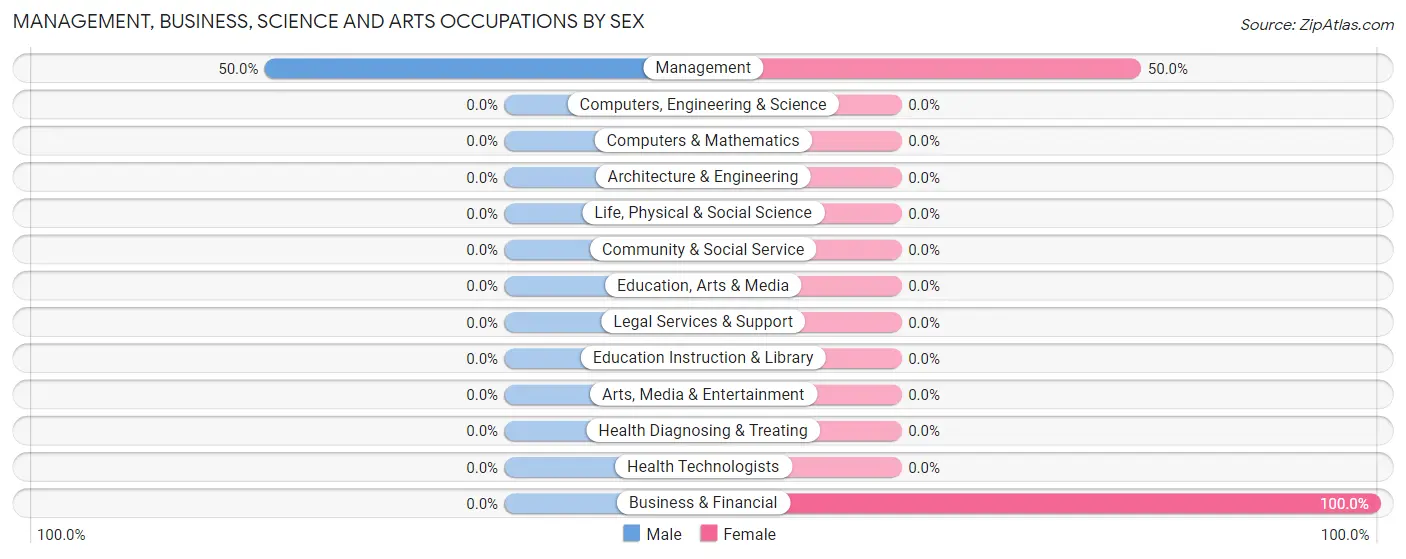
| Occupation | Male | Female |
| Management | 1 (50.0%) | 1 (50.0%) |
| Business & Financial | 0 (0.0%) | 1 (100.0%) |
| Computers, Engineering & Science | 0 (0.0%) | 0 (0.0%) |
| Computers & Mathematics | 0 (0.0%) | 0 (0.0%) |
| Architecture & Engineering | 0 (0.0%) | 0 (0.0%) |
| Life, Physical & Social Science | 0 (0.0%) | 0 (0.0%) |
| Community & Social Service | 0 (0.0%) | 0 (0.0%) |
| Education, Arts & Media | 0 (0.0%) | 0 (0.0%) |
| Legal Services & Support | 0 (0.0%) | 0 (0.0%) |
| Education Instruction & Library | 0 (0.0%) | 0 (0.0%) |
| Arts, Media & Entertainment | 0 (0.0%) | 0 (0.0%) |
| Health Diagnosing & Treating | 0 (0.0%) | 0 (0.0%) |
| Health Technologists | 0 (0.0%) | 0 (0.0%) |
| Total (Category) | 1 (33.3%) | 2 (66.7%) |
| Total (Overall) | 10 (52.6%) | 9 (47.4%) |
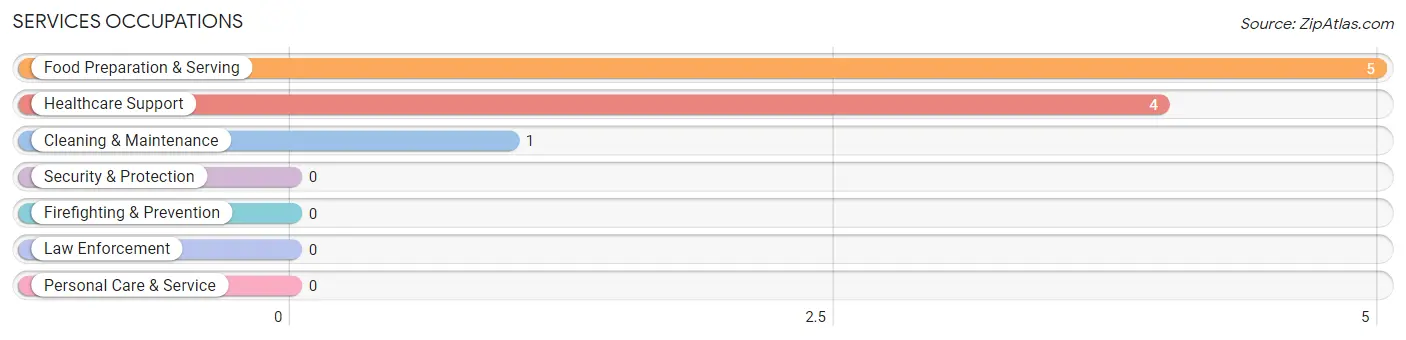
Services Occupations
The most common Services occupations in Zinc are Food Preparation & Serving (5 | 26.3%), Healthcare Support (4 | 21.0%), and Cleaning & Maintenance (1 | 5.3%).
Services Occupations by Sex
Within the Services occupations in Zinc, the most male-oriented occupations are Cleaning & Maintenance (100.0%), and Food Preparation & Serving (80.0%), while the most female-oriented occupations are Healthcare Support (100.0%), and Food Preparation & Serving (20.0%).
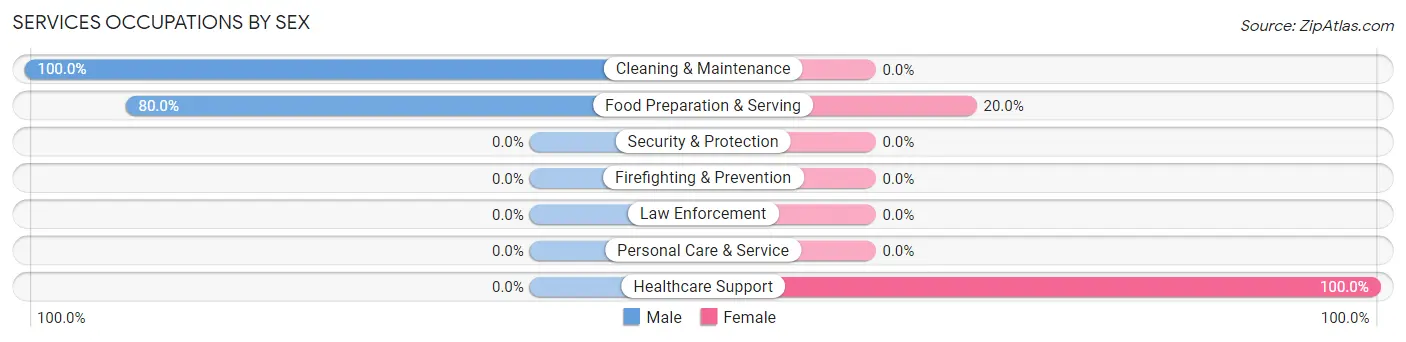
| Occupation | Male | Female |
| Healthcare Support | 0 (0.0%) | 4 (100.0%) |
| Security & Protection | 0 (0.0%) | 0 (0.0%) |
| Firefighting & Prevention | 0 (0.0%) | 0 (0.0%) |
| Law Enforcement | 0 (0.0%) | 0 (0.0%) |
| Food Preparation & Serving | 4 (80.0%) | 1 (20.0%) |
| Cleaning & Maintenance | 1 (100.0%) | 0 (0.0%) |
| Personal Care & Service | 0 (0.0%) | 0 (0.0%) |
| Total (Category) | 5 (50.0%) | 5 (50.0%) |
| Total (Overall) | 10 (52.6%) | 9 (47.4%) |
Sales and Office Occupations
The most common Sales and Office occupations in Zinc are , and Office & Administration (5 | 26.3%).
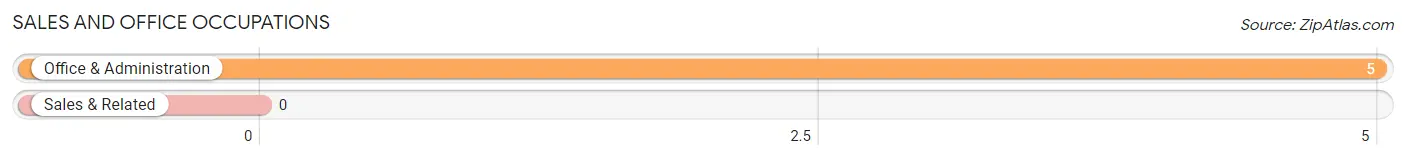
Sales and Office Occupations by Sex
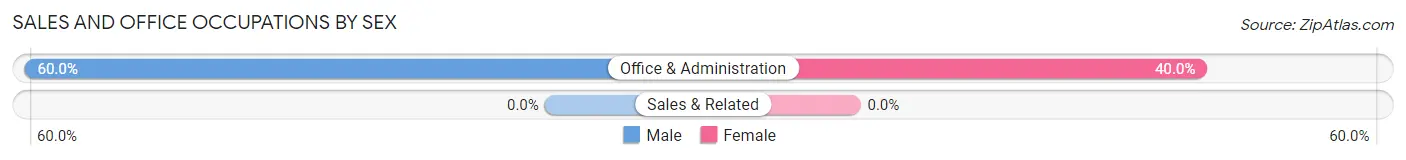
| Occupation | Male | Female |
| Sales & Related | 0 (0.0%) | 0 (0.0%) |
| Office & Administration | 3 (60.0%) | 2 (40.0%) |
| Total (Category) | 3 (60.0%) | 2 (40.0%) |
| Total (Overall) | 10 (52.6%) | 9 (47.4%) |
Natural Resources, Construction and Maintenance Occupations
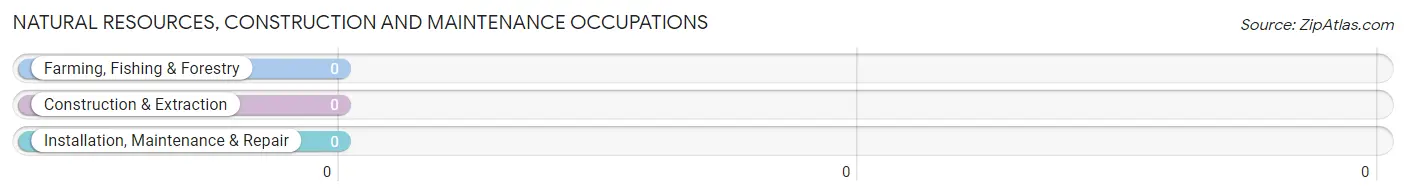
Natural Resources, Construction and Maintenance Occupations by Sex
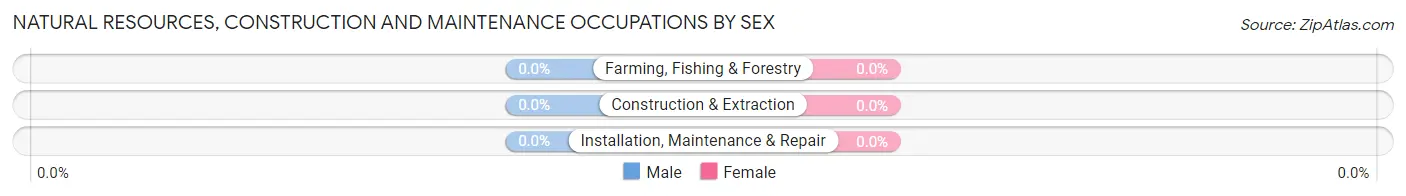
| Occupation | Male | Female |
| Farming, Fishing & Forestry | 0 (0.0%) | 0 (0.0%) |
| Construction & Extraction | 0 (0.0%) | 0 (0.0%) |
| Installation, Maintenance & Repair | 0 (0.0%) | 0 (0.0%) |
| Total (Category) | 0 (0.0%) | 0 (0.0%) |
| Total (Overall) | 10 (52.6%) | 9 (47.4%) |
Production, Transportation and Moving Occupations
The most common Production, Transportation and Moving occupations in Zinc are , and Material Moving (1 | 5.3%).
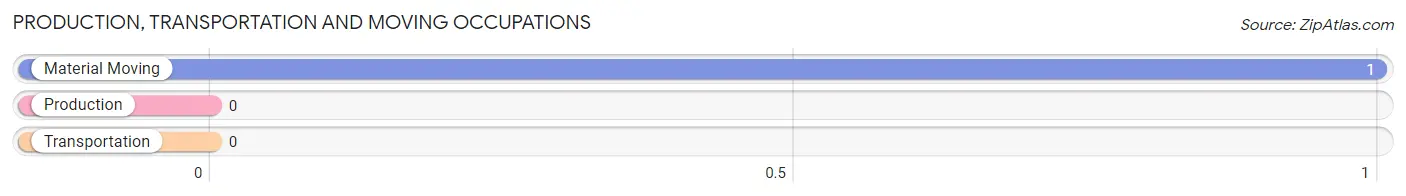
Production, Transportation and Moving Occupations by Sex
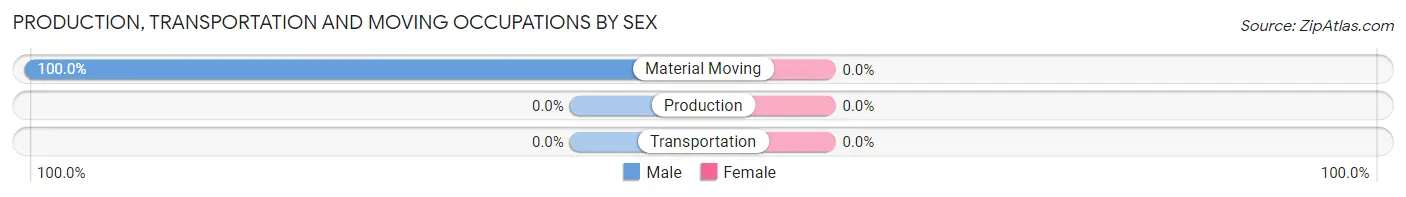
| Occupation | Male | Female |
| Production | 0 (0.0%) | 0 (0.0%) |
| Transportation | 0 (0.0%) | 0 (0.0%) |
| Material Moving | 1 (100.0%) | 0 (0.0%) |
| Total (Category) | 1 (100.0%) | 0 (0.0%) |
| Total (Overall) | 10 (52.6%) | 9 (47.4%) |
Employment Industries by Sex in Zinc
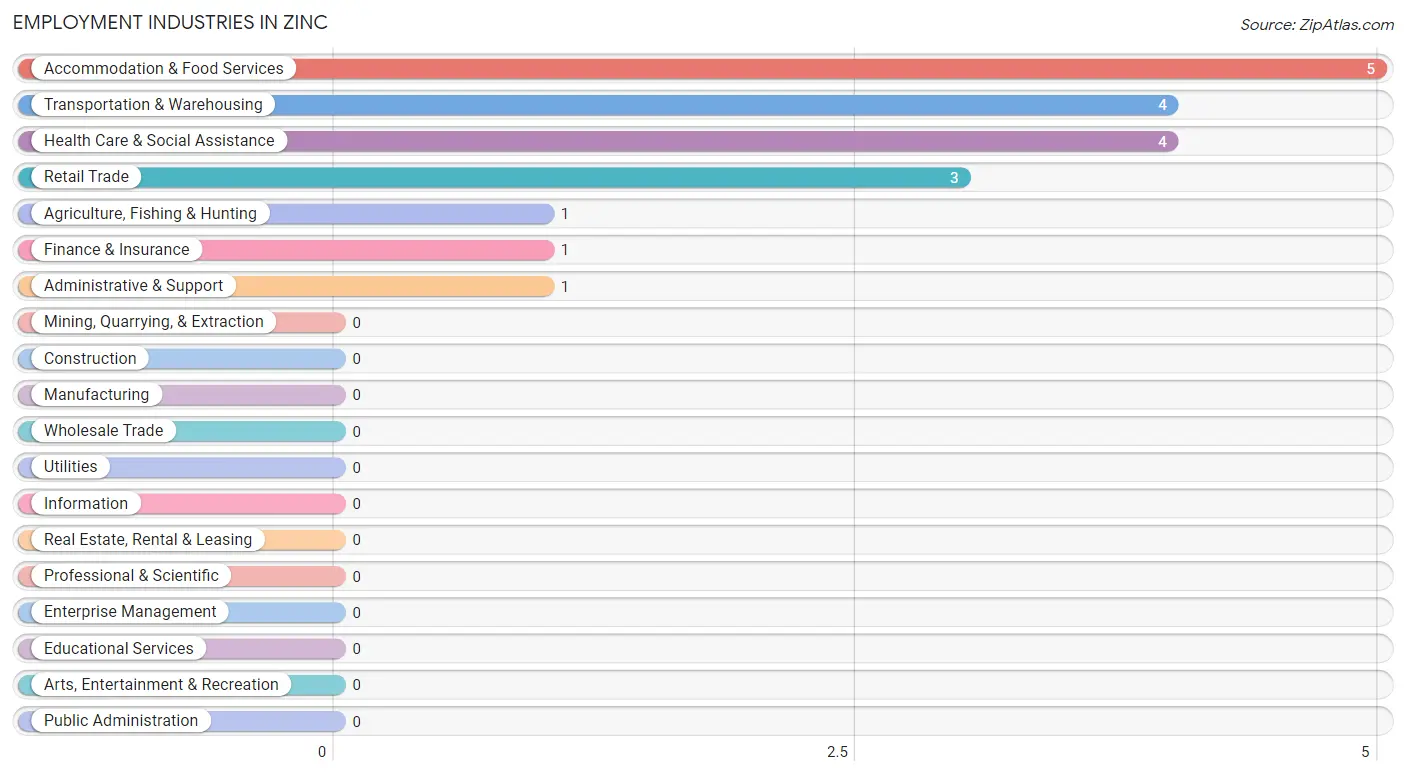
Employment Industries in Zinc
The major employment industries in Zinc include Accommodation & Food Services (5 | 26.3%), Transportation & Warehousing (4 | 21.0%), Health Care & Social Assistance (4 | 21.0%), Retail Trade (3 | 15.8%), and Agriculture, Fishing & Hunting (1 | 5.3%).
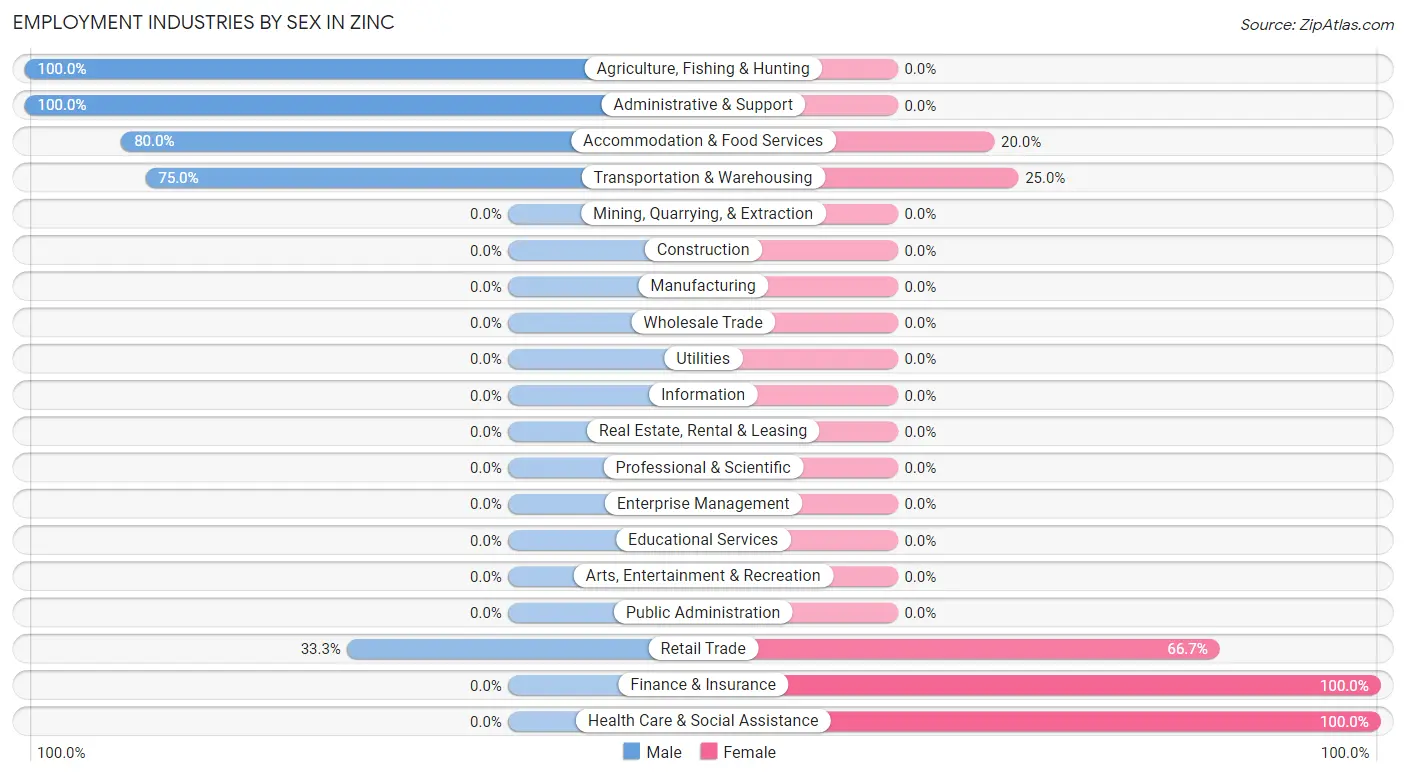
Employment Industries by Sex in Zinc
The Zinc industries that see more men than women are Agriculture, Fishing & Hunting (100.0%), Administrative & Support (100.0%), and Accommodation & Food Services (80.0%), whereas the industries that tend to have a higher number of women are Finance & Insurance (100.0%), Health Care & Social Assistance (100.0%), and Retail Trade (66.7%).
| Industry | Male | Female |
| Agriculture, Fishing & Hunting | 1 (100.0%) | 0 (0.0%) |
| Mining, Quarrying, & Extraction | 0 (0.0%) | 0 (0.0%) |
| Construction | 0 (0.0%) | 0 (0.0%) |
| Manufacturing | 0 (0.0%) | 0 (0.0%) |
| Wholesale Trade | 0 (0.0%) | 0 (0.0%) |
| Retail Trade | 1 (33.3%) | 2 (66.7%) |
| Transportation & Warehousing | 3 (75.0%) | 1 (25.0%) |
| Utilities | 0 (0.0%) | 0 (0.0%) |
| Information | 0 (0.0%) | 0 (0.0%) |
| Finance & Insurance | 0 (0.0%) | 1 (100.0%) |
| Real Estate, Rental & Leasing | 0 (0.0%) | 0 (0.0%) |
| Professional & Scientific | 0 (0.0%) | 0 (0.0%) |
| Enterprise Management | 0 (0.0%) | 0 (0.0%) |
| Administrative & Support | 1 (100.0%) | 0 (0.0%) |
| Educational Services | 0 (0.0%) | 0 (0.0%) |
| Health Care & Social Assistance | 0 (0.0%) | 4 (100.0%) |
| Arts, Entertainment & Recreation | 0 (0.0%) | 0 (0.0%) |
| Accommodation & Food Services | 4 (80.0%) | 1 (20.0%) |
| Public Administration | 0 (0.0%) | 0 (0.0%) |
| Total | 10 (52.6%) | 9 (47.4%) |
Education in Zinc
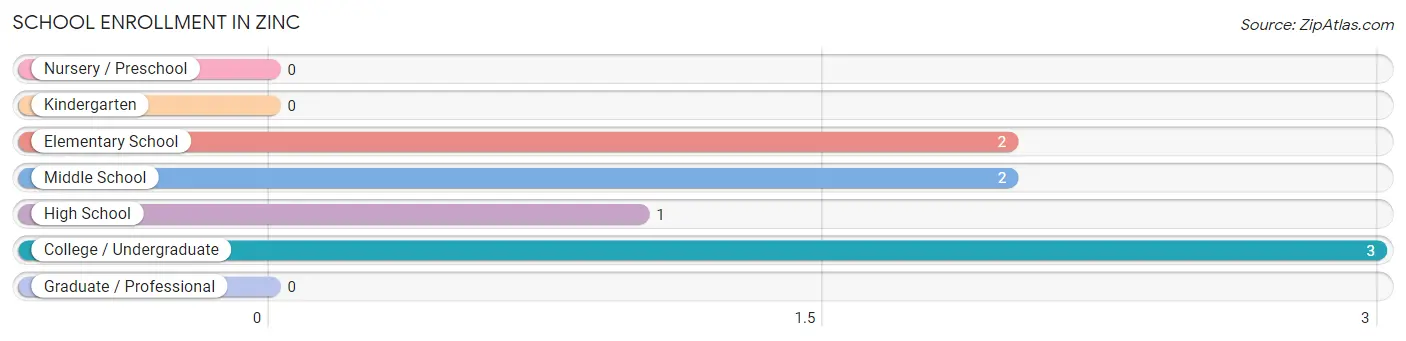
School Enrollment in Zinc
The most common levels of schooling among the 8 students in Zinc are college / undergraduate (3 | 37.5%), elementary school (2 | 25.0%), and middle school (2 | 25.0%).
| School Level | # Students | % Students |
| Nursery / Preschool | 0 | 0.0% |
| Kindergarten | 0 | 0.0% |
| Elementary School | 2 | 25.0% |
| Middle School | 2 | 25.0% |
| High School | 1 | 12.5% |
| College / Undergraduate | 3 | 37.5% |
| Graduate / Professional | 0 | 0.0% |
| Total | 8 | 100.0% |
School Enrollment by Age by Funding Source in Zinc
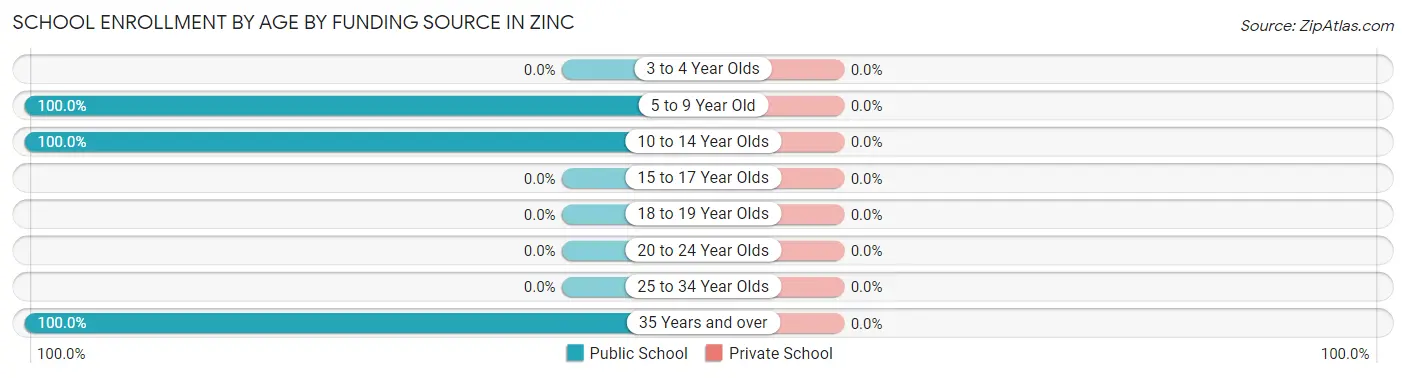
| Age Bracket | Public School | Private School |
| 3 to 4 Year Olds | 0 (0.0%) | 0 (0.0%) |
| 5 to 9 Year Old | 2 (100.0%) | 0 (0.0%) |
| 10 to 14 Year Olds | 3 (100.0%) | 0 (0.0%) |
| 15 to 17 Year Olds | 0 (0.0%) | 0 (0.0%) |
| 18 to 19 Year Olds | 0 (0.0%) | 0 (0.0%) |
| 20 to 24 Year Olds | 0 (0.0%) | 0 (0.0%) |
| 25 to 34 Year Olds | 0 (0.0%) | 0 (0.0%) |
| 35 Years and over | 3 (100.0%) | 0 (0.0%) |
| Total | 8 (100.0%) | 0 (0.0%) |
Educational Attainment by Field of Study in Zinc
, and psychology (2 | 100.0%) are the most common fields of study among 2 individuals in Zinc who have obtained a bachelor's degree or higher.
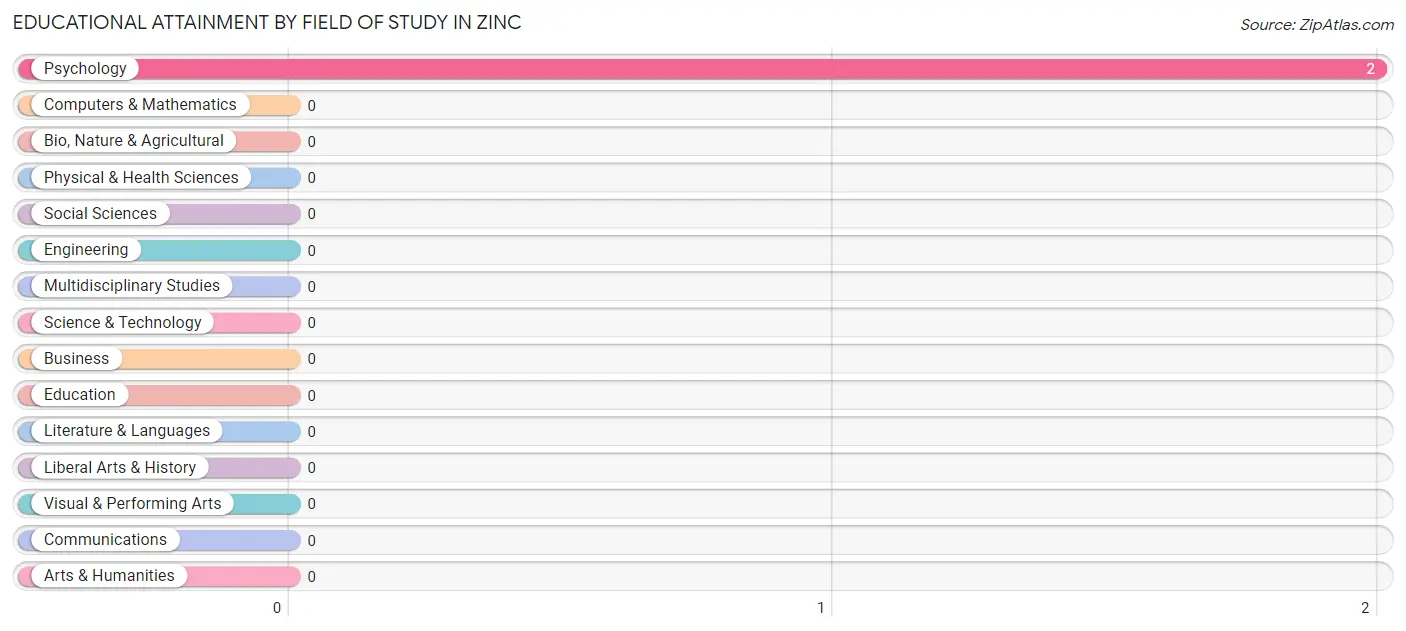
| Field of Study | # Graduates | % Graduates |
| Computers & Mathematics | 0 | 0.0% |
| Bio, Nature & Agricultural | 0 | 0.0% |
| Physical & Health Sciences | 0 | 0.0% |
| Psychology | 2 | 100.0% |
| Social Sciences | 0 | 0.0% |
| Engineering | 0 | 0.0% |
| Multidisciplinary Studies | 0 | 0.0% |
| Science & Technology | 0 | 0.0% |
| Business | 0 | 0.0% |
| Education | 0 | 0.0% |
| Literature & Languages | 0 | 0.0% |
| Liberal Arts & History | 0 | 0.0% |
| Visual & Performing Arts | 0 | 0.0% |
| Communications | 0 | 0.0% |
| Arts & Humanities | 0 | 0.0% |
| Total | 2 | 100.0% |
Transportation & Commute in Zinc
Vehicle Availability by Sex in Zinc
The most prevalent vehicle ownership categories in Zinc are males with 2 vehicles (5, accounting for 50.0%) and females with 2 vehicles (7, making up 55.6%).
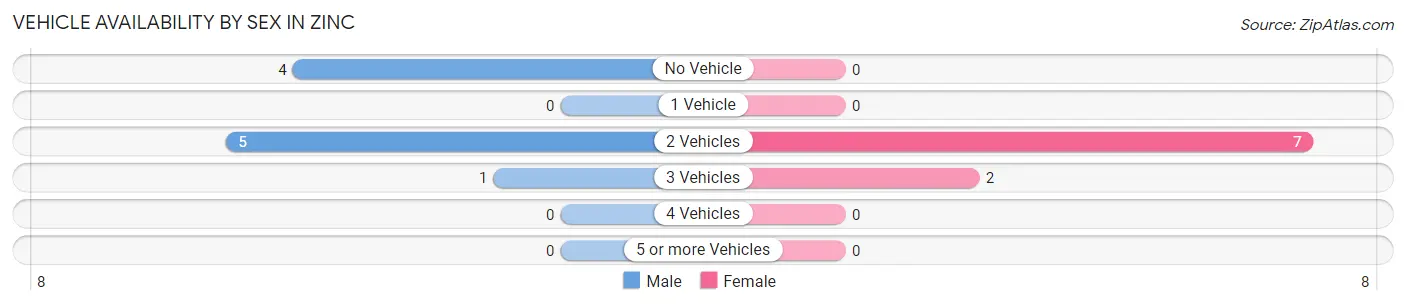
| Vehicles Available | Male | Female |
| No Vehicle | 4 (40.0%) | 0 (0.0%) |
| 1 Vehicle | 0 (0.0%) | 0 (0.0%) |
| 2 Vehicles | 5 (50.0%) | 7 (77.8%) |
| 3 Vehicles | 1 (10.0%) | 2 (22.2%) |
| 4 Vehicles | 0 (0.0%) | 0 (0.0%) |
| 5 or more Vehicles | 0 (0.0%) | 0 (0.0%) |
| Total | 10 (100.0%) | 9 (100.0%) |
Commute Time in Zinc
The most frequently occuring commute durations in Zinc are 20 to 24 minutes (6 commuters, 33.3%), 45 to 59 minutes (4 commuters, 22.2%), and 5 to 9 minutes (3 commuters, 16.7%).
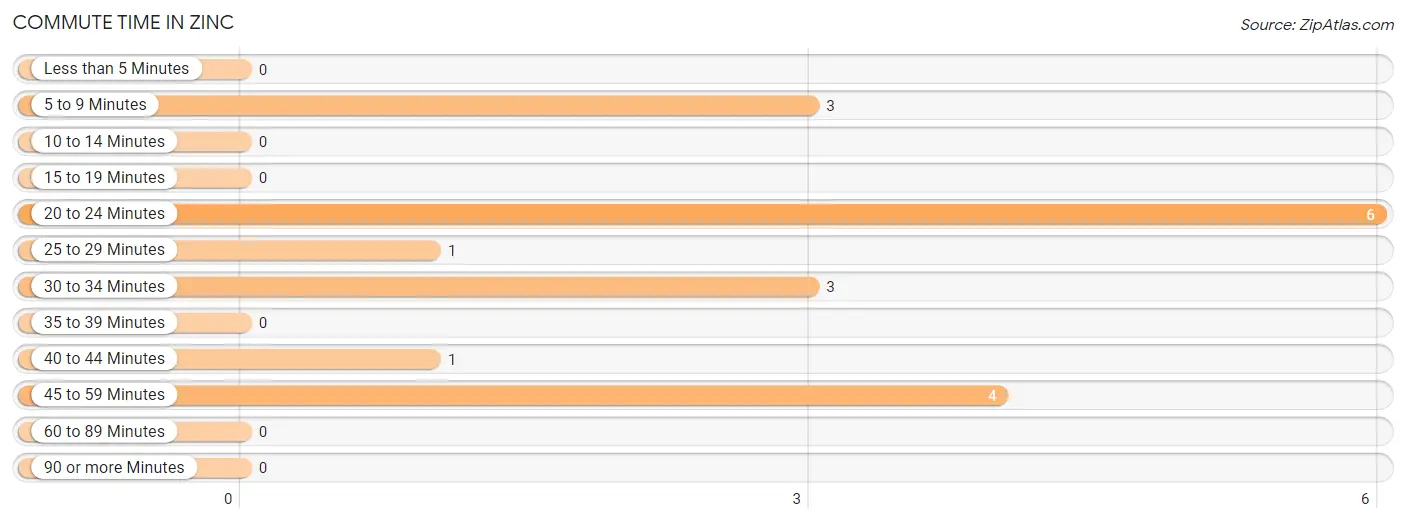
| Commute Time | # Commuters | % Commuters |
| Less than 5 Minutes | 0 | 0.0% |
| 5 to 9 Minutes | 3 | 16.7% |
| 10 to 14 Minutes | 0 | 0.0% |
| 15 to 19 Minutes | 0 | 0.0% |
| 20 to 24 Minutes | 6 | 33.3% |
| 25 to 29 Minutes | 1 | 5.6% |
| 30 to 34 Minutes | 3 | 16.7% |
| 35 to 39 Minutes | 0 | 0.0% |
| 40 to 44 Minutes | 1 | 5.6% |
| 45 to 59 Minutes | 4 | 22.2% |
| 60 to 89 Minutes | 0 | 0.0% |
| 90 or more Minutes | 0 | 0.0% |
Commute Time by Sex in Zinc
The most common commute times in Zinc are 45 to 59 minutes (4 commuters, 44.4%) for males and 20 to 24 minutes (5 commuters, 55.6%) for females.
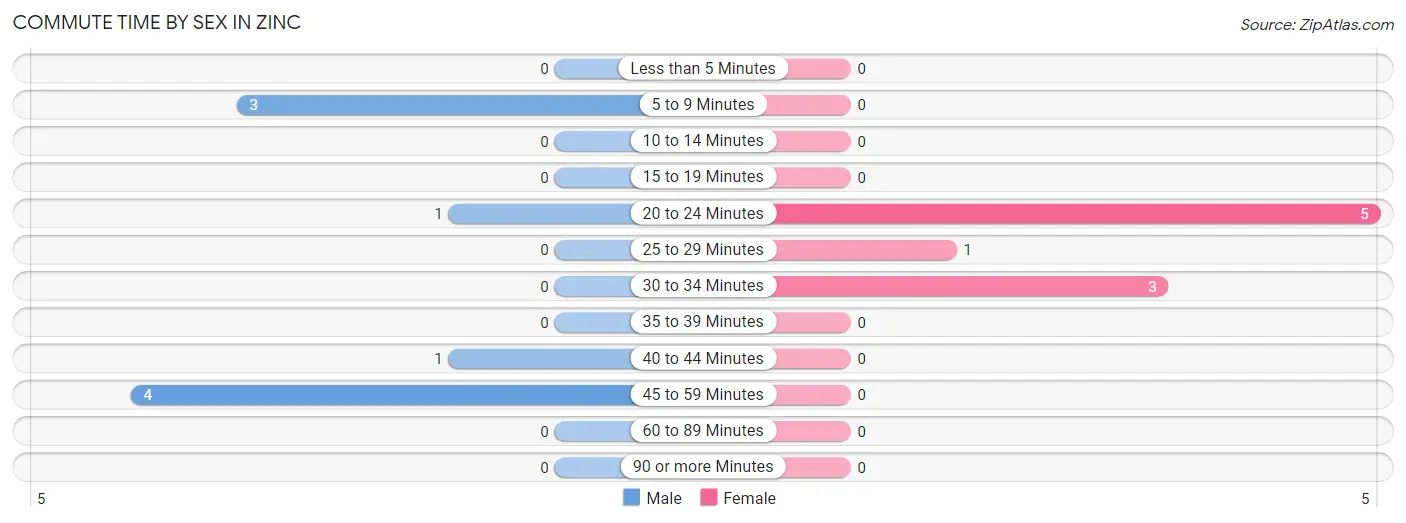
| Commute Time | Male | Female |
| Less than 5 Minutes | 0 (0.0%) | 0 (0.0%) |
| 5 to 9 Minutes | 3 (33.3%) | 0 (0.0%) |
| 10 to 14 Minutes | 0 (0.0%) | 0 (0.0%) |
| 15 to 19 Minutes | 0 (0.0%) | 0 (0.0%) |
| 20 to 24 Minutes | 1 (11.1%) | 5 (55.6%) |
| 25 to 29 Minutes | 0 (0.0%) | 1 (11.1%) |
| 30 to 34 Minutes | 0 (0.0%) | 3 (33.3%) |
| 35 to 39 Minutes | 0 (0.0%) | 0 (0.0%) |
| 40 to 44 Minutes | 1 (11.1%) | 0 (0.0%) |
| 45 to 59 Minutes | 4 (44.4%) | 0 (0.0%) |
| 60 to 89 Minutes | 0 (0.0%) | 0 (0.0%) |
| 90 or more Minutes | 0 (0.0%) | 0 (0.0%) |
Time of Departure to Work by Sex in Zinc
The most frequent times of departure to work in Zinc are 11:00 AM to 11:59 AM (4, 44.4%) for males and 10:00 AM to 10:59 AM (4, 44.4%) for females.
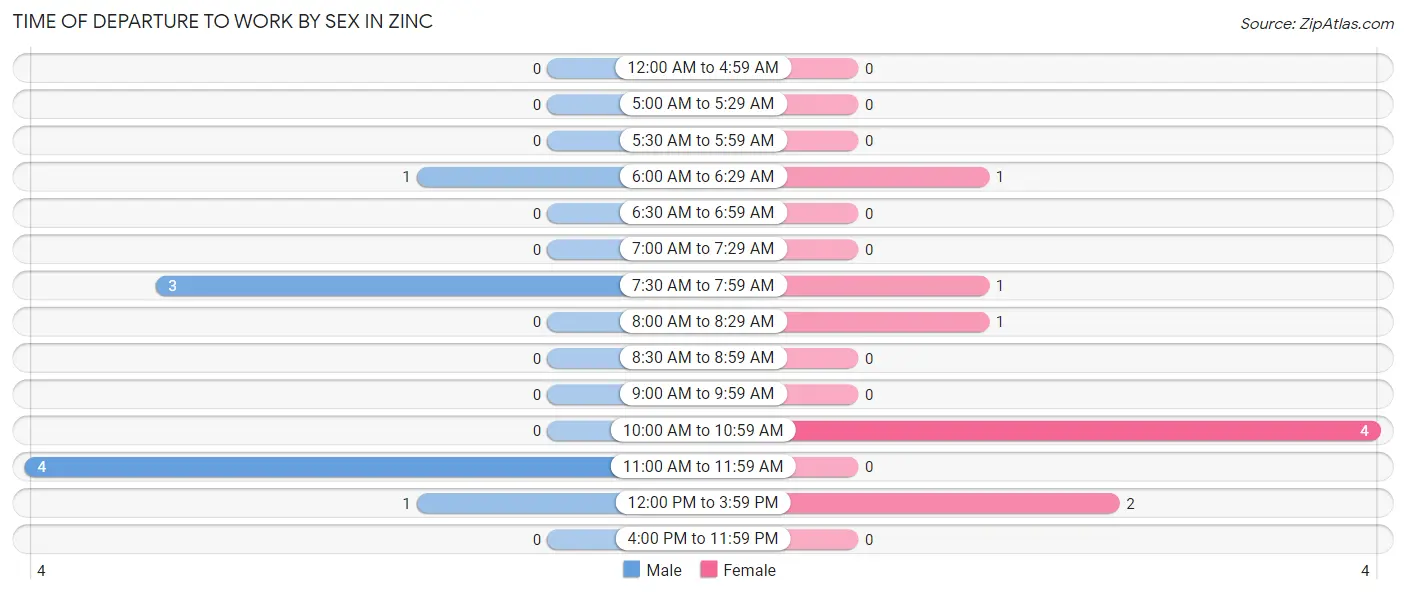
| Time of Departure | Male | Female |
| 12:00 AM to 4:59 AM | 0 (0.0%) | 0 (0.0%) |
| 5:00 AM to 5:29 AM | 0 (0.0%) | 0 (0.0%) |
| 5:30 AM to 5:59 AM | 0 (0.0%) | 0 (0.0%) |
| 6:00 AM to 6:29 AM | 1 (11.1%) | 1 (11.1%) |
| 6:30 AM to 6:59 AM | 0 (0.0%) | 0 (0.0%) |
| 7:00 AM to 7:29 AM | 0 (0.0%) | 0 (0.0%) |
| 7:30 AM to 7:59 AM | 3 (33.3%) | 1 (11.1%) |
| 8:00 AM to 8:29 AM | 0 (0.0%) | 1 (11.1%) |
| 8:30 AM to 8:59 AM | 0 (0.0%) | 0 (0.0%) |
| 9:00 AM to 9:59 AM | 0 (0.0%) | 0 (0.0%) |
| 10:00 AM to 10:59 AM | 0 (0.0%) | 4 (44.4%) |
| 11:00 AM to 11:59 AM | 4 (44.4%) | 0 (0.0%) |
| 12:00 PM to 3:59 PM | 1 (11.1%) | 2 (22.2%) |
| 4:00 PM to 11:59 PM | 0 (0.0%) | 0 (0.0%) |
| Total | 9 (100.0%) | 9 (100.0%) |
Housing Occupancy in Zinc
Occupancy by Ownership in Zinc
Of the total 30 dwellings in Zinc, owner-occupied units account for 21 (70.0%), while renter-occupied units make up 9 (30.0%).
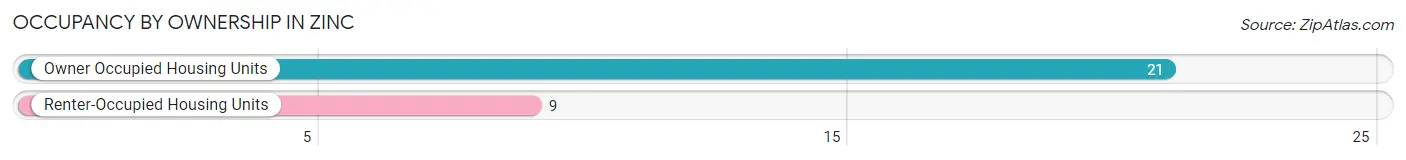
| Occupancy | # Housing Units | % Housing Units |
| Owner Occupied Housing Units | 21 | 70.0% |
| Renter-Occupied Housing Units | 9 | 30.0% |
| Total Occupied Housing Units | 30 | 100.0% |
Occupancy by Household Size in Zinc
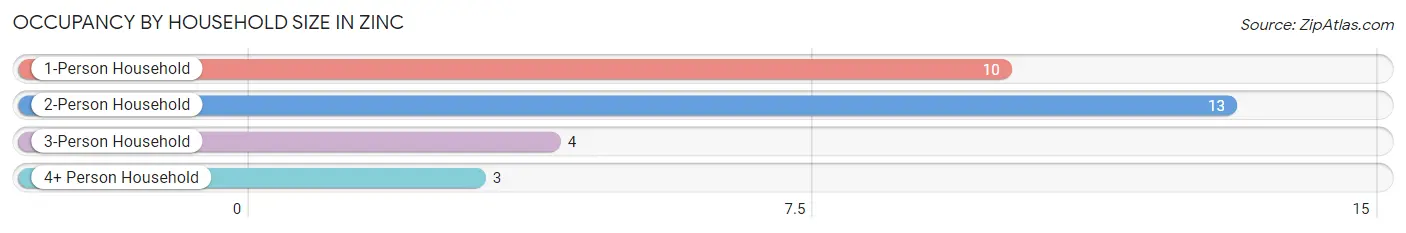
| Household Size | # Housing Units | % Housing Units |
| 1-Person Household | 10 | 33.3% |
| 2-Person Household | 13 | 43.3% |
| 3-Person Household | 4 | 13.3% |
| 4+ Person Household | 3 | 10.0% |
| Total Housing Units | 30 | 100.0% |
Occupancy by Ownership by Household Size in Zinc
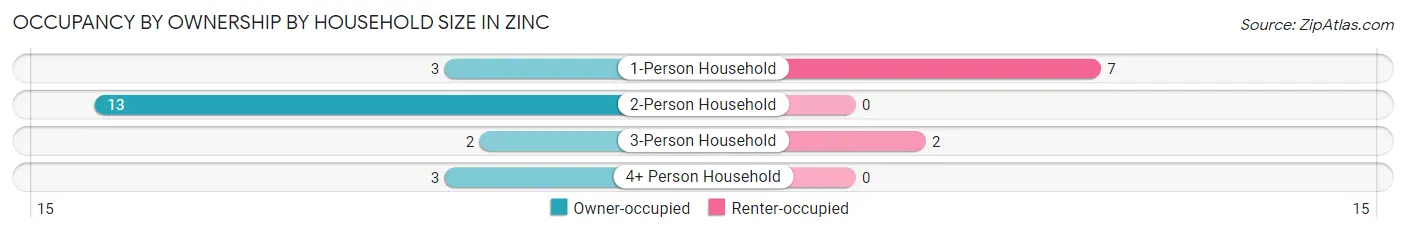
| Household Size | Owner-occupied | Renter-occupied |
| 1-Person Household | 3 (30.0%) | 7 (70.0%) |
| 2-Person Household | 13 (100.0%) | 0 (0.0%) |
| 3-Person Household | 2 (50.0%) | 2 (50.0%) |
| 4+ Person Household | 3 (100.0%) | 0 (0.0%) |
| Total Housing Units | 21 (70.0%) | 9 (30.0%) |
Occupancy by Educational Attainment in Zinc
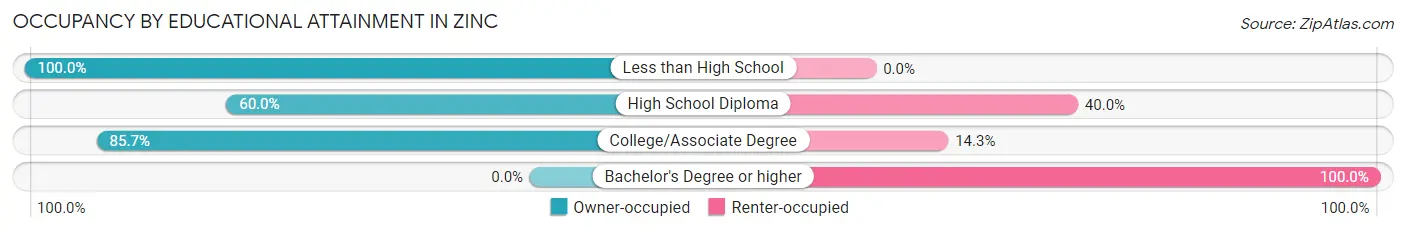
| Household Size | Owner-occupied | Renter-occupied |
| Less than High School | 6 (100.0%) | 0 (0.0%) |
| High School Diploma | 9 (60.0%) | 6 (40.0%) |
| College/Associate Degree | 6 (85.7%) | 1 (14.3%) |
| Bachelor's Degree or higher | 0 (0.0%) | 2 (100.0%) |
Occupancy by Age of Householder in Zinc
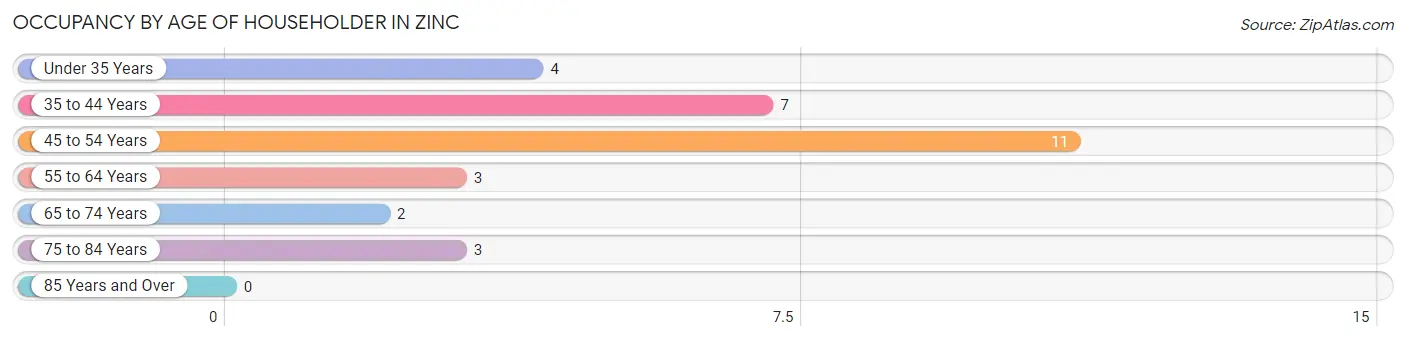
| Age Bracket | # Households | % Households |
| Under 35 Years | 4 | 13.3% |
| 35 to 44 Years | 7 | 23.3% |
| 45 to 54 Years | 11 | 36.7% |
| 55 to 64 Years | 3 | 10.0% |
| 65 to 74 Years | 2 | 6.7% |
| 75 to 84 Years | 3 | 10.0% |
| 85 Years and Over | 0 | 0.0% |
| Total | 30 | 100.0% |
Housing Finances in Zinc
Median Income by Occupancy in Zinc
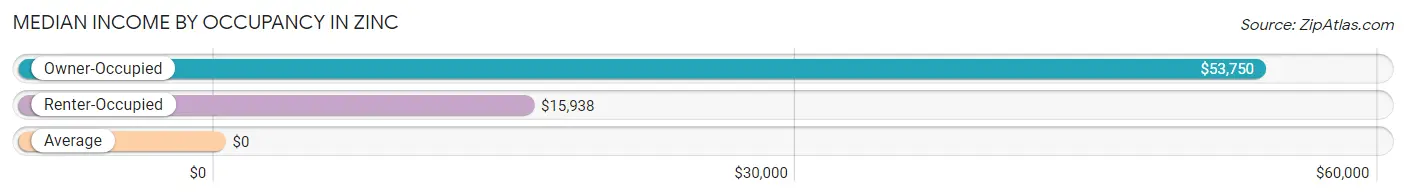
| Occupancy Type | # Households | Median Income |
| Owner-Occupied | 21 (70.0%) | $53,750 |
| Renter-Occupied | 9 (30.0%) | $15,938 |
| Average | 30 (100.0%) | $0 |
Occupancy by Householder Income Bracket in Zinc
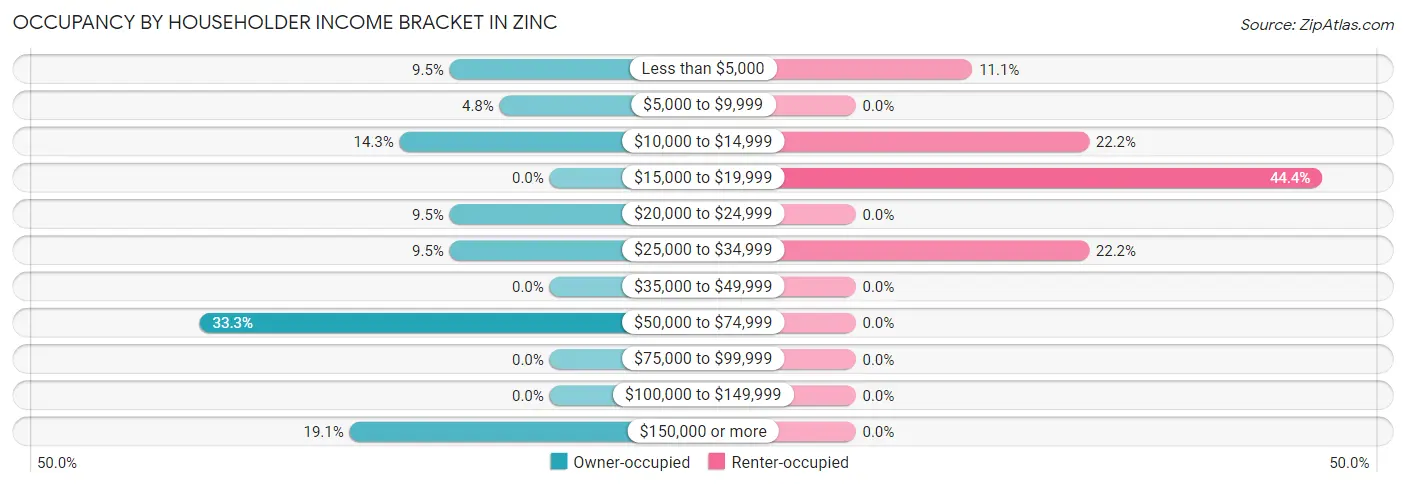
| Income Bracket | Owner-occupied | Renter-occupied |
| Less than $5,000 | 2 (9.5%) | 1 (11.1%) |
| $5,000 to $9,999 | 1 (4.8%) | 0 (0.0%) |
| $10,000 to $14,999 | 3 (14.3%) | 2 (22.2%) |
| $15,000 to $19,999 | 0 (0.0%) | 4 (44.4%) |
| $20,000 to $24,999 | 2 (9.5%) | 0 (0.0%) |
| $25,000 to $34,999 | 2 (9.5%) | 2 (22.2%) |
| $35,000 to $49,999 | 0 (0.0%) | 0 (0.0%) |
| $50,000 to $74,999 | 7 (33.3%) | 0 (0.0%) |
| $75,000 to $99,999 | 0 (0.0%) | 0 (0.0%) |
| $100,000 to $149,999 | 0 (0.0%) | 0 (0.0%) |
| $150,000 or more | 4 (19.1%) | 0 (0.0%) |
| Total | 21 (100.0%) | 9 (100.0%) |
Monthly Housing Cost Tiers in Zinc
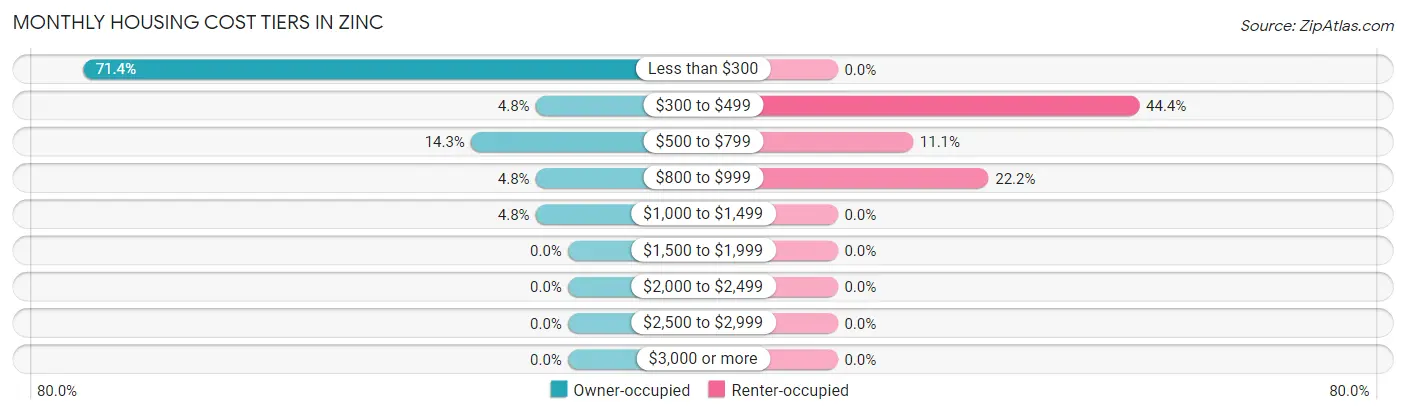
| Monthly Cost | Owner-occupied | Renter-occupied |
| Less than $300 | 15 (71.4%) | 0 (0.0%) |
| $300 to $499 | 1 (4.8%) | 4 (44.4%) |
| $500 to $799 | 3 (14.3%) | 1 (11.1%) |
| $800 to $999 | 1 (4.8%) | 2 (22.2%) |
| $1,000 to $1,499 | 1 (4.8%) | 0 (0.0%) |
| $1,500 to $1,999 | 0 (0.0%) | 0 (0.0%) |
| $2,000 to $2,499 | 0 (0.0%) | 0 (0.0%) |
| $2,500 to $2,999 | 0 (0.0%) | 0 (0.0%) |
| $3,000 or more | 0 (0.0%) | 0 (0.0%) |
| Total | 21 (100.0%) | 9 (100.0%) |
Physical Housing Characteristics in Zinc
Housing Structures in Zinc
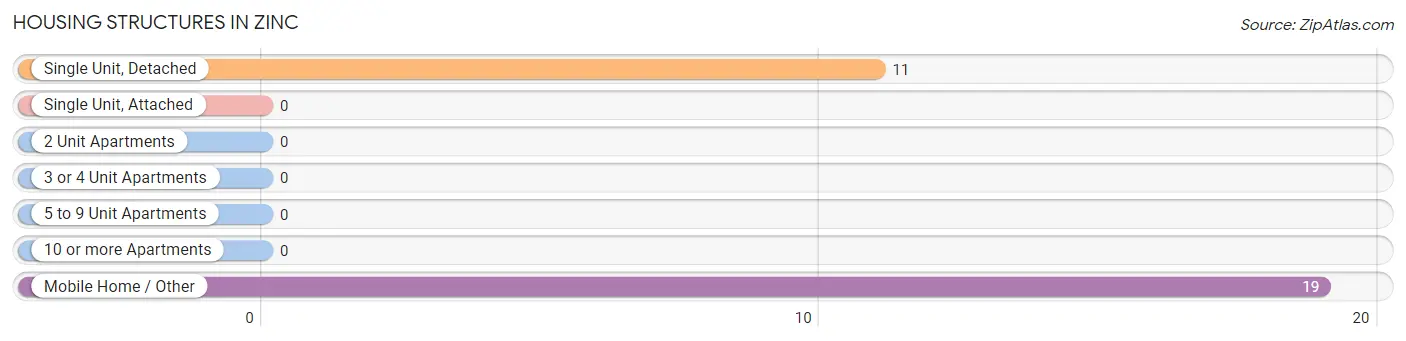
| Structure Type | # Housing Units | % Housing Units |
| Single Unit, Detached | 11 | 36.7% |
| Single Unit, Attached | 0 | 0.0% |
| 2 Unit Apartments | 0 | 0.0% |
| 3 or 4 Unit Apartments | 0 | 0.0% |
| 5 to 9 Unit Apartments | 0 | 0.0% |
| 10 or more Apartments | 0 | 0.0% |
| Mobile Home / Other | 19 | 63.3% |
| Total | 30 | 100.0% |
Housing Structures by Occupancy in Zinc
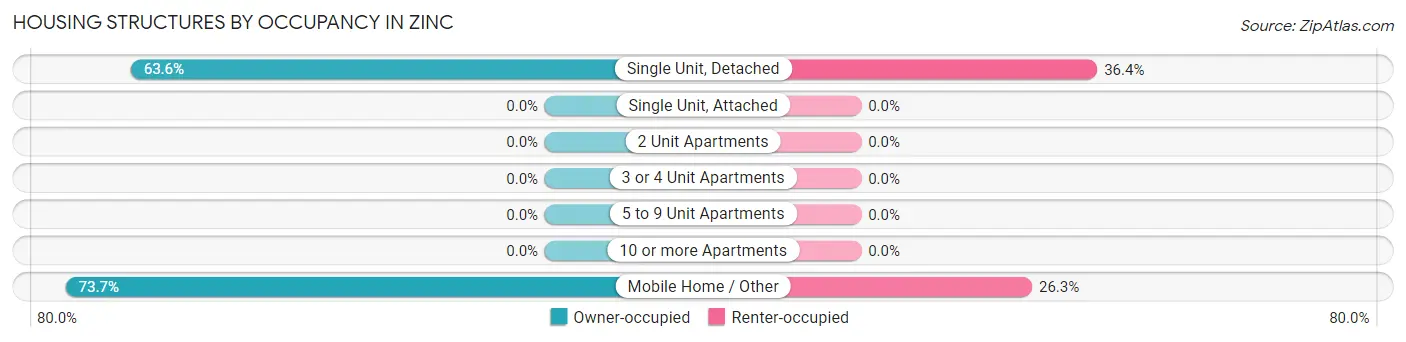
| Structure Type | Owner-occupied | Renter-occupied |
| Single Unit, Detached | 7 (63.6%) | 4 (36.4%) |
| Single Unit, Attached | 0 (0.0%) | 0 (0.0%) |
| 2 Unit Apartments | 0 (0.0%) | 0 (0.0%) |
| 3 or 4 Unit Apartments | 0 (0.0%) | 0 (0.0%) |
| 5 to 9 Unit Apartments | 0 (0.0%) | 0 (0.0%) |
| 10 or more Apartments | 0 (0.0%) | 0 (0.0%) |
| Mobile Home / Other | 14 (73.7%) | 5 (26.3%) |
| Total | 21 (70.0%) | 9 (30.0%) |
Housing Structures by Number of Rooms in Zinc
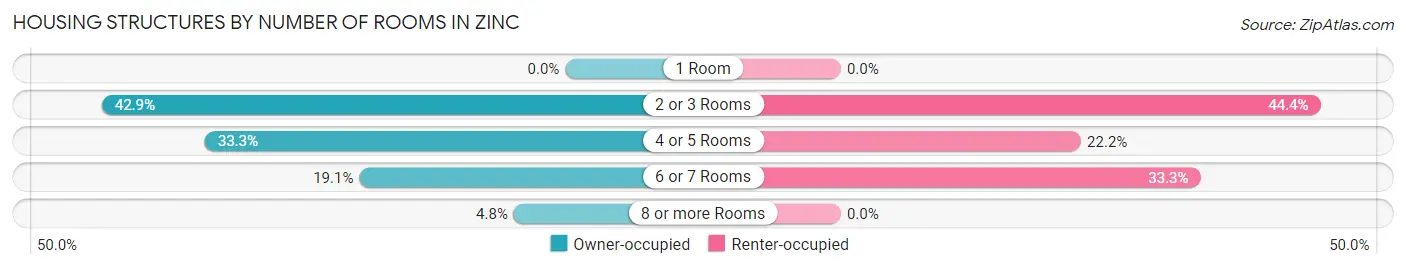
| Number of Rooms | Owner-occupied | Renter-occupied |
| 1 Room | 0 (0.0%) | 0 (0.0%) |
| 2 or 3 Rooms | 9 (42.9%) | 4 (44.4%) |
| 4 or 5 Rooms | 7 (33.3%) | 2 (22.2%) |
| 6 or 7 Rooms | 4 (19.1%) | 3 (33.3%) |
| 8 or more Rooms | 1 (4.8%) | 0 (0.0%) |
| Total | 21 (100.0%) | 9 (100.0%) |
Housing Structure by Heating Type in Zinc
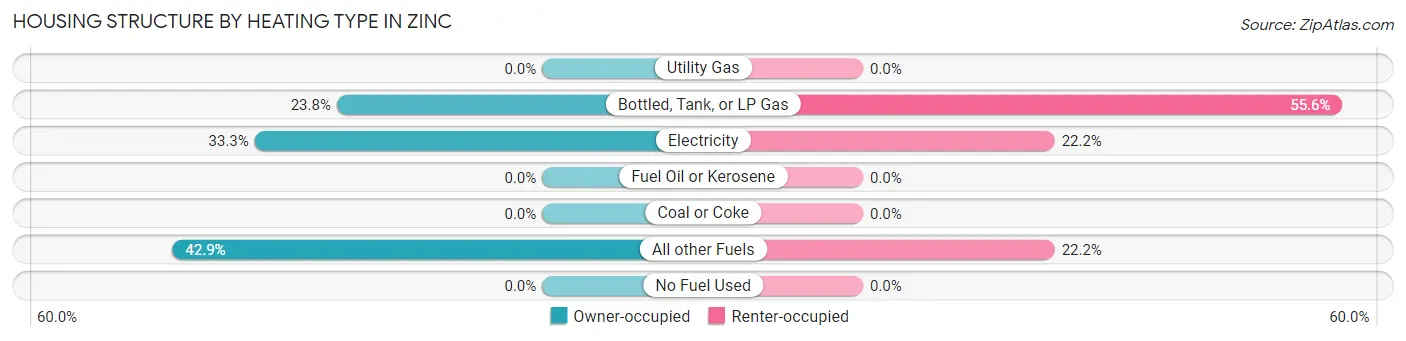
| Heating Type | Owner-occupied | Renter-occupied |
| Utility Gas | 0 (0.0%) | 0 (0.0%) |
| Bottled, Tank, or LP Gas | 5 (23.8%) | 5 (55.6%) |
| Electricity | 7 (33.3%) | 2 (22.2%) |
| Fuel Oil or Kerosene | 0 (0.0%) | 0 (0.0%) |
| Coal or Coke | 0 (0.0%) | 0 (0.0%) |
| All other Fuels | 9 (42.9%) | 2 (22.2%) |
| No Fuel Used | 0 (0.0%) | 0 (0.0%) |
| Total | 21 (100.0%) | 9 (100.0%) |
Household Vehicle Usage in Zinc
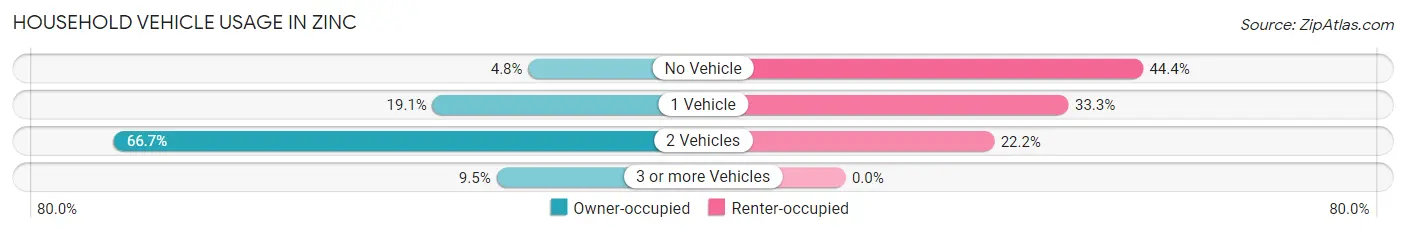
| Vehicles per Household | Owner-occupied | Renter-occupied |
| No Vehicle | 1 (4.8%) | 4 (44.4%) |
| 1 Vehicle | 4 (19.1%) | 3 (33.3%) |
| 2 Vehicles | 14 (66.7%) | 2 (22.2%) |
| 3 or more Vehicles | 2 (9.5%) | 0 (0.0%) |
| Total | 21 (100.0%) | 9 (100.0%) |
Real Estate & Mortgages in Zinc
Real Estate and Mortgage Overview in Zinc
| Characteristic | Without Mortgage | With Mortgage |
| Housing Units | 16 | 5 |
| Median Property Value | $9,999 | $145,800 |
| Median Household Income | - | - |
| Monthly Housing Costs | $210 | $0 |
| Real Estate Taxes | $199 | $3 |
Property Value by Mortgage Status in Zinc
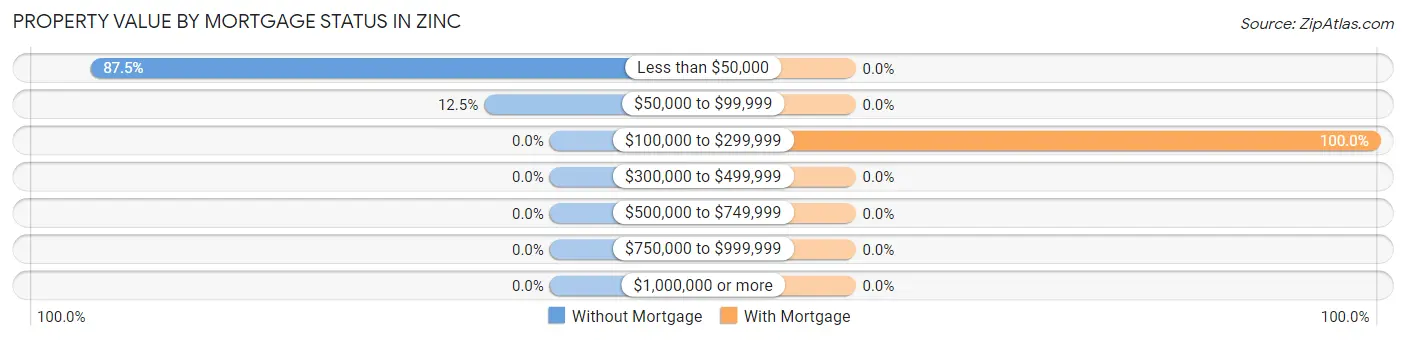
| Property Value | Without Mortgage | With Mortgage |
| Less than $50,000 | 14 (87.5%) | 0 (0.0%) |
| $50,000 to $99,999 | 2 (12.5%) | 0 (0.0%) |
| $100,000 to $299,999 | 0 (0.0%) | 5 (100.0%) |
| $300,000 to $499,999 | 0 (0.0%) | 0 (0.0%) |
| $500,000 to $749,999 | 0 (0.0%) | 0 (0.0%) |
| $750,000 to $999,999 | 0 (0.0%) | 0 (0.0%) |
| $1,000,000 or more | 0 (0.0%) | 0 (0.0%) |
| Total | 16 (100.0%) | 5 (100.0%) |
Household Income by Mortgage Status in Zinc
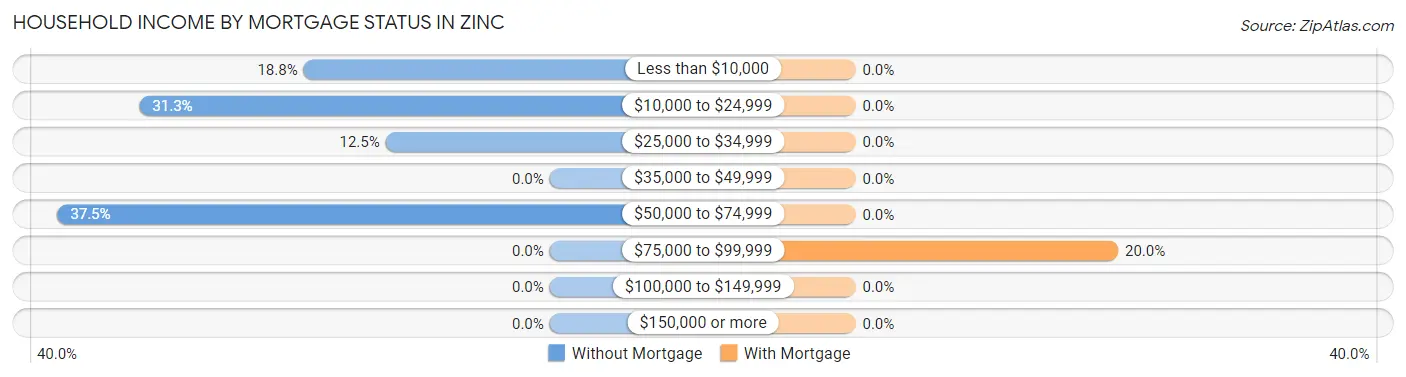
| Household Income | Without Mortgage | With Mortgage |
| Less than $10,000 | 3 (18.8%) | 0 (0.0%) |
| $10,000 to $24,999 | 5 (31.2%) | 0 (0.0%) |
| $25,000 to $34,999 | 2 (12.5%) | 0 (0.0%) |
| $35,000 to $49,999 | 0 (0.0%) | 0 (0.0%) |
| $50,000 to $74,999 | 6 (37.5%) | 0 (0.0%) |
| $75,000 to $99,999 | 0 (0.0%) | 1 (20.0%) |
| $100,000 to $149,999 | 0 (0.0%) | 0 (0.0%) |
| $150,000 or more | 0 (0.0%) | 0 (0.0%) |
| Total | 16 (100.0%) | 5 (100.0%) |
Property Value to Household Income Ratio in Zinc
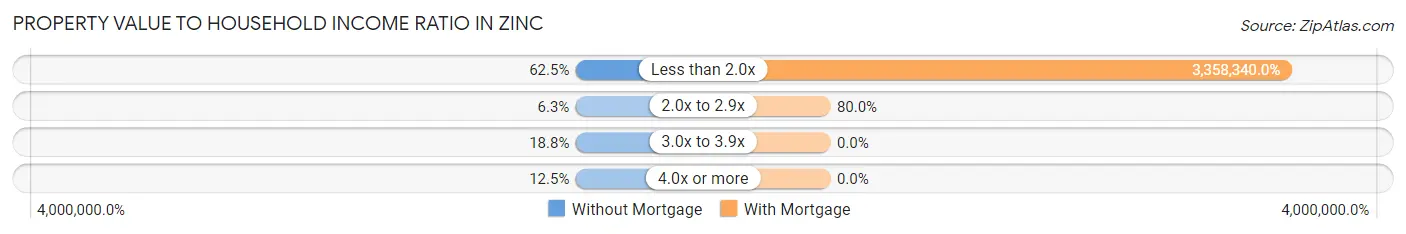
| Value-to-Income Ratio | Without Mortgage | With Mortgage |
| Less than 2.0x | 10 (62.5%) | 167,917 (3,358,340.0%) |
| 2.0x to 2.9x | 1 (6.2%) | 4 (80.0%) |
| 3.0x to 3.9x | 3 (18.8%) | 0 (0.0%) |
| 4.0x or more | 2 (12.5%) | 0 (0.0%) |
| Total | 16 (100.0%) | 5 (100.0%) |
Real Estate Taxes by Mortgage Status in Zinc
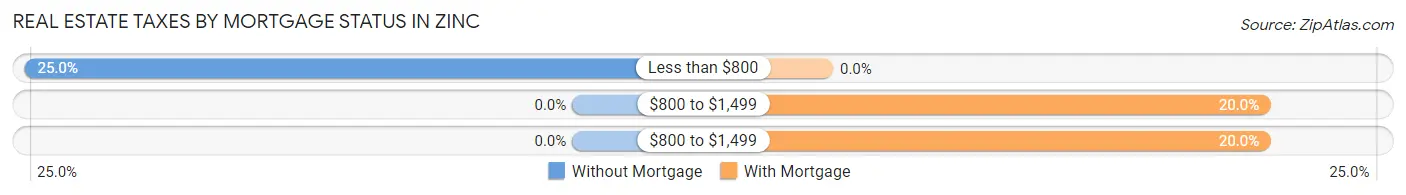
| Property Taxes | Without Mortgage | With Mortgage |
| Less than $800 | 4 (25.0%) | 0 (0.0%) |
| $800 to $1,499 | 0 (0.0%) | 1 (20.0%) |
| $800 to $1,499 | 0 (0.0%) | 1 (20.0%) |
| Total | 16 (100.0%) | 5 (100.0%) |
Health & Disability in Zinc
Health Insurance Coverage by Age in Zinc
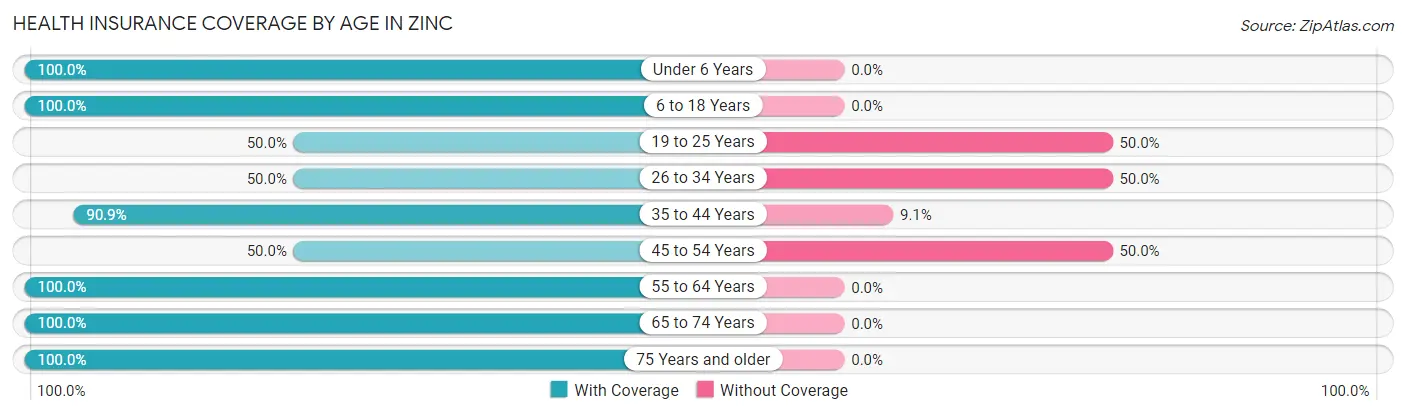
| Age Bracket | With Coverage | Without Coverage |
| Under 6 Years | 7 (100.0%) | 0 (0.0%) |
| 6 to 18 Years | 5 (100.0%) | 0 (0.0%) |
| 19 to 25 Years | 3 (50.0%) | 3 (50.0%) |
| 26 to 34 Years | 4 (50.0%) | 4 (50.0%) |
| 35 to 44 Years | 10 (90.9%) | 1 (9.1%) |
| 45 to 54 Years | 8 (50.0%) | 8 (50.0%) |
| 55 to 64 Years | 6 (100.0%) | 0 (0.0%) |
| 65 to 74 Years | 6 (100.0%) | 0 (0.0%) |
| 75 Years and older | 3 (100.0%) | 0 (0.0%) |
| Total | 52 (76.5%) | 16 (23.5%) |
Health Insurance Coverage by Citizenship Status in Zinc
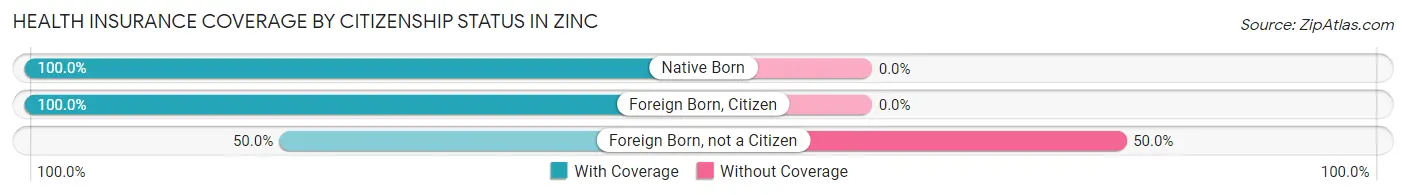
| Citizenship Status | With Coverage | Without Coverage |
| Native Born | 7 (100.0%) | 0 (0.0%) |
| Foreign Born, Citizen | 5 (100.0%) | 0 (0.0%) |
| Foreign Born, not a Citizen | 3 (50.0%) | 3 (50.0%) |
Health Insurance Coverage by Household Income in Zinc
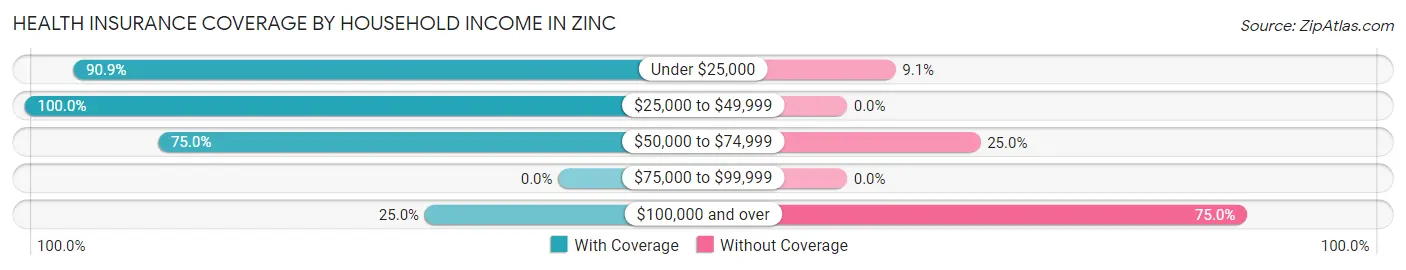
| Household Income | With Coverage | Without Coverage |
| Under $25,000 | 30 (90.9%) | 3 (9.1%) |
| $25,000 to $49,999 | 7 (100.0%) | 0 (0.0%) |
| $50,000 to $74,999 | 12 (75.0%) | 4 (25.0%) |
| $75,000 to $99,999 | 0 (0.0%) | 0 (0.0%) |
| $100,000 and over | 3 (25.0%) | 9 (75.0%) |
Public vs Private Health Insurance Coverage by Age in Zinc
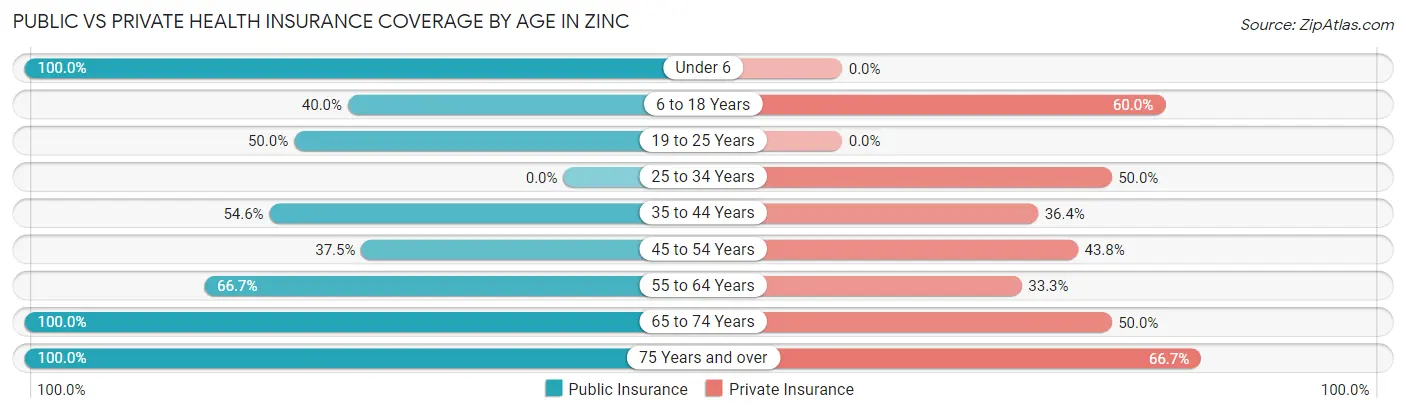
| Age Bracket | Public Insurance | Private Insurance |
| Under 6 | 7 (100.0%) | 0 (0.0%) |
| 6 to 18 Years | 2 (40.0%) | 3 (60.0%) |
| 19 to 25 Years | 3 (50.0%) | 0 (0.0%) |
| 25 to 34 Years | 0 (0.0%) | 4 (50.0%) |
| 35 to 44 Years | 6 (54.5%) | 4 (36.4%) |
| 45 to 54 Years | 6 (37.5%) | 7 (43.8%) |
| 55 to 64 Years | 4 (66.7%) | 2 (33.3%) |
| 65 to 74 Years | 6 (100.0%) | 3 (50.0%) |
| 75 Years and over | 3 (100.0%) | 2 (66.7%) |
| Total | 37 (54.4%) | 25 (36.8%) |
Disability Status by Sex by Age in Zinc
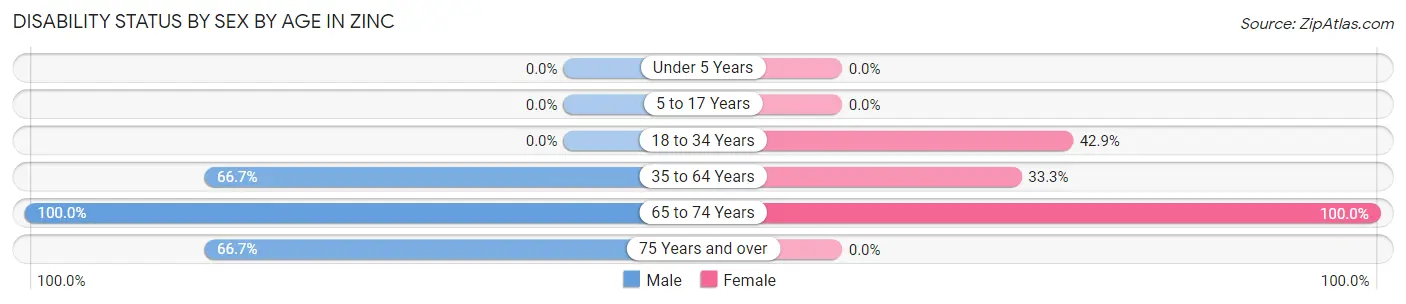
| Age Bracket | Male | Female |
| Under 5 Years | 0 (0.0%) | 0 (0.0%) |
| 5 to 17 Years | 0 (0.0%) | 0 (0.0%) |
| 18 to 34 Years | 0 (0.0%) | 3 (42.9%) |
| 35 to 64 Years | 10 (66.7%) | 6 (33.3%) |
| 65 to 74 Years | 5 (100.0%) | 1 (100.0%) |
| 75 Years and over | 2 (66.7%) | 0 (0.0%) |
Disability Class by Sex by Age in Zinc
Disability Class: Hearing Difficulty
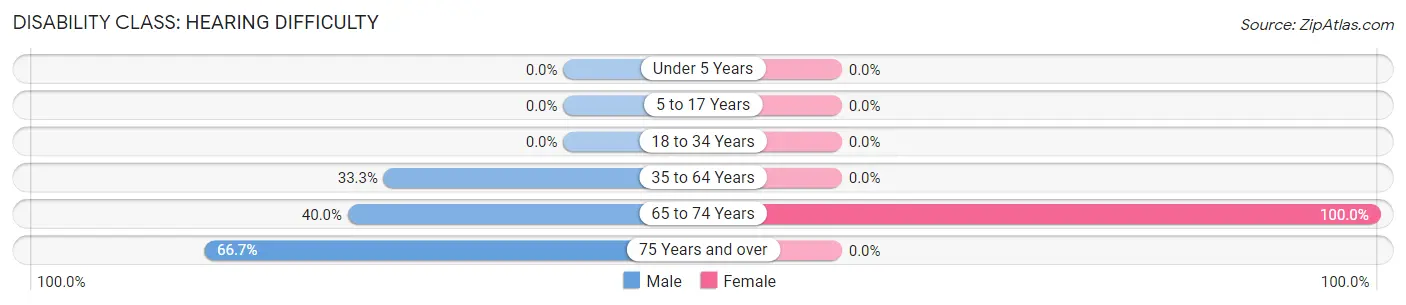
| Age Bracket | Male | Female |
| Under 5 Years | 0 (0.0%) | 0 (0.0%) |
| 5 to 17 Years | 0 (0.0%) | 0 (0.0%) |
| 18 to 34 Years | 0 (0.0%) | 0 (0.0%) |
| 35 to 64 Years | 5 (33.3%) | 0 (0.0%) |
| 65 to 74 Years | 2 (40.0%) | 1 (100.0%) |
| 75 Years and over | 2 (66.7%) | 0 (0.0%) |
Disability Class: Vision Difficulty
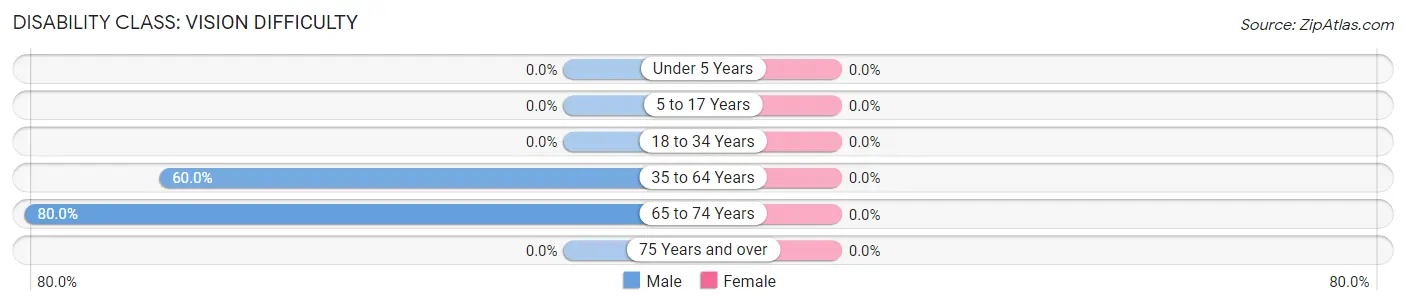
| Age Bracket | Male | Female |
| Under 5 Years | 0 (0.0%) | 0 (0.0%) |
| 5 to 17 Years | 0 (0.0%) | 0 (0.0%) |
| 18 to 34 Years | 0 (0.0%) | 0 (0.0%) |
| 35 to 64 Years | 9 (60.0%) | 0 (0.0%) |
| 65 to 74 Years | 4 (80.0%) | 0 (0.0%) |
| 75 Years and over | 0 (0.0%) | 0 (0.0%) |
Disability Class: Cognitive Difficulty
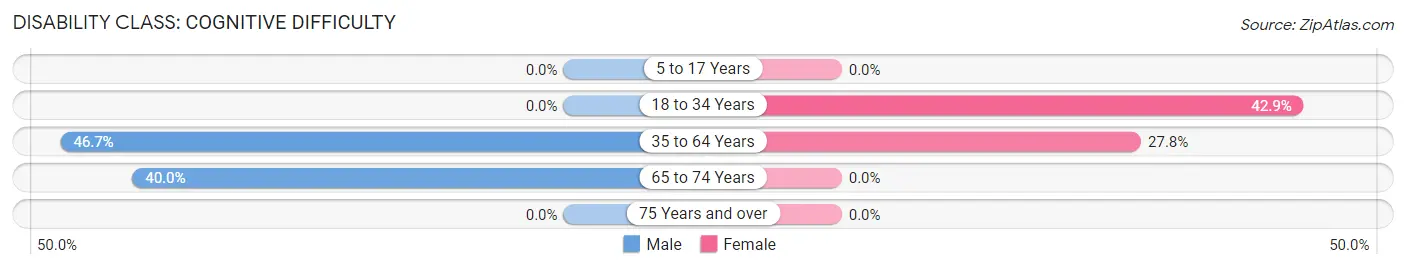
| Age Bracket | Male | Female |
| 5 to 17 Years | 0 (0.0%) | 0 (0.0%) |
| 18 to 34 Years | 0 (0.0%) | 3 (42.9%) |
| 35 to 64 Years | 7 (46.7%) | 5 (27.8%) |
| 65 to 74 Years | 2 (40.0%) | 0 (0.0%) |
| 75 Years and over | 0 (0.0%) | 0 (0.0%) |
Disability Class: Ambulatory Difficulty
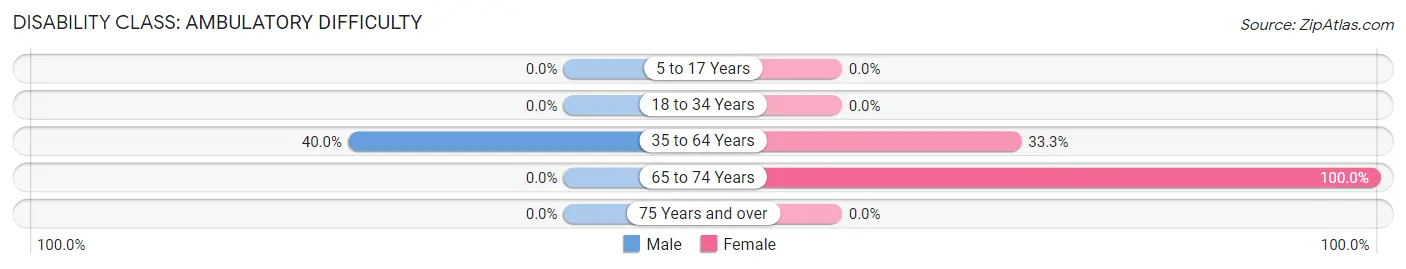
| Age Bracket | Male | Female |
| 5 to 17 Years | 0 (0.0%) | 0 (0.0%) |
| 18 to 34 Years | 0 (0.0%) | 0 (0.0%) |
| 35 to 64 Years | 6 (40.0%) | 6 (33.3%) |
| 65 to 74 Years | 0 (0.0%) | 1 (100.0%) |
| 75 Years and over | 0 (0.0%) | 0 (0.0%) |
Disability Class: Self-Care Difficulty
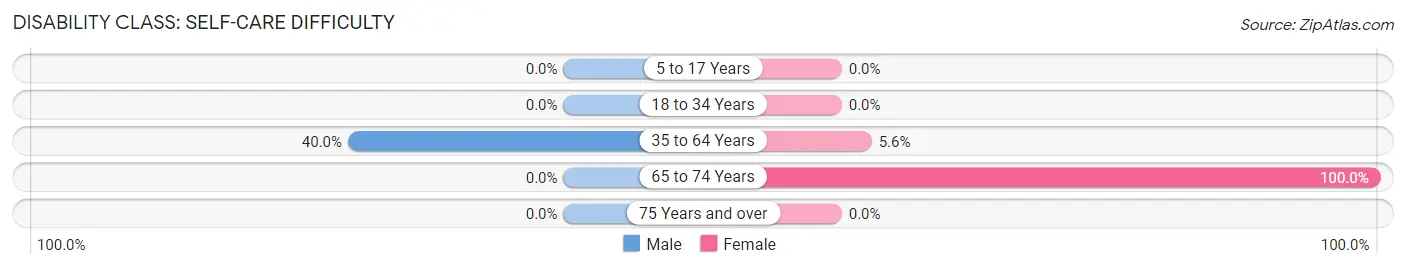
| Age Bracket | Male | Female |
| 5 to 17 Years | 0 (0.0%) | 0 (0.0%) |
| 18 to 34 Years | 0 (0.0%) | 0 (0.0%) |
| 35 to 64 Years | 6 (40.0%) | 1 (5.6%) |
| 65 to 74 Years | 0 (0.0%) | 1 (100.0%) |
| 75 Years and over | 0 (0.0%) | 0 (0.0%) |
Technology Access in Zinc
Computing Device Access in Zinc
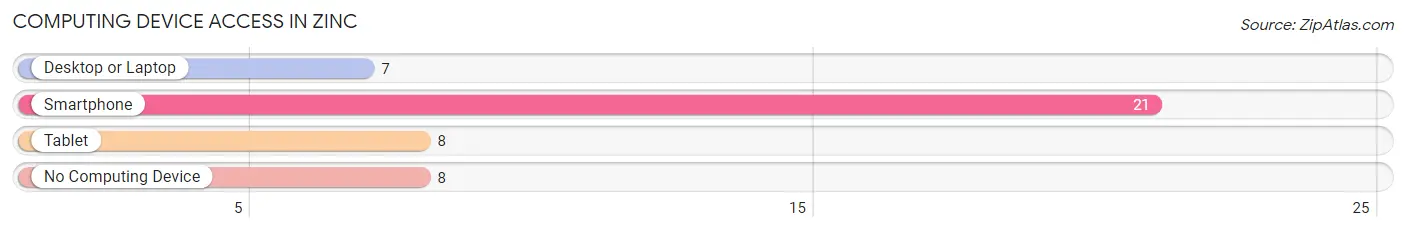
| Device Type | # Households | % Households |
| Desktop or Laptop | 7 | 23.3% |
| Smartphone | 21 | 70.0% |
| Tablet | 8 | 26.7% |
| No Computing Device | 8 | 26.7% |
| Total | 30 | 100.0% |
Internet Access in Zinc
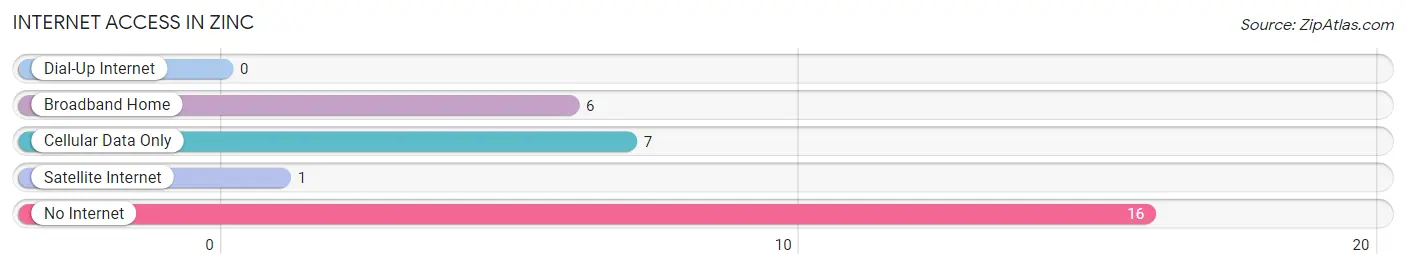
| Internet Type | # Households | % Households |
| Dial-Up Internet | 0 | 0.0% |
| Broadband Home | 6 | 20.0% |
| Cellular Data Only | 7 | 23.3% |
| Satellite Internet | 1 | 3.3% |
| No Internet | 16 | 53.3% |
| Total | 30 | 100.0% |
Zinc Summary
Zinc is a mineral that is essential for human health and is found in many foods. It is an important component of enzymes and proteins, and is necessary for the proper functioning of the immune system, cell growth, and wound healing. Zinc is also important for the development of the reproductive system, and is essential for the production of testosterone.
AR History
The history of zinc in Arkansas dates back to the early 1800s when it was first discovered in the Ouachita Mountains. The first zinc mine in the state was opened in 1845, and by the late 1800s, Arkansas was the leading producer of zinc in the United States. The state’s zinc production peaked in the early 1900s, and by the mid-1900s, Arkansas was the second-largest producer of zinc in the country.
Today, Arkansas is still a major producer of zinc, with several active mines in the state. The largest zinc mine in the state is the Ozark-St. Francis National Forest Mine, which produces about 10 percent of the state’s total zinc production.
Geography
Arkansas is located in the south-central United States, and is bordered by six states: Missouri, Tennessee, Mississippi, Louisiana, Texas, and Oklahoma. The state is divided into 75 counties, and its capital is Little Rock. Arkansas is home to the Ozark Mountains, which are located in the northwest corner of the state. The state also has several rivers, including the Arkansas River, which flows through the state from west to east.
Economy
The economy of Arkansas is largely based on agriculture, with the state’s main crops being cotton, soybeans, rice, and wheat. The state is also a major producer of timber, and is home to several large timber companies. Arkansas is also a major producer of zinc, and the state’s zinc mines are some of the largest in the country.
In addition to agriculture and mining, Arkansas is also home to several large manufacturing companies, including Tyson Foods, J.B. Hunt, and Walmart. The state is also home to several large universities, including the University of Arkansas, Arkansas State University, and the University of Central Arkansas.
Demographics
As of 2020, the population of Arkansas was estimated to be 3.017 million. The state is predominantly white, with about 80 percent of the population identifying as white. The state is also home to a large African American population, with about 15 percent of the population identifying as African American. The state also has a large Hispanic population, with about 8 percent of the population identifying as Hispanic or Latino. The state also has a small Native American population, with about 1 percent of the population identifying as Native American.
Common Questions
What is Per Capita Income in Zinc?
Per Capita income in Zinc is $20,490.
What is Inequality or Gini Index in Zinc?
Inequality or Gini Index in Zinc is 0.53.
What is the Total Population of Zinc?
Total Population of Zinc is 68.
What is the Total Male Population of Zinc?
Total Male Population of Zinc is 36.
What is the Total Female Population of Zinc?
Total Female Population of Zinc is 32.
What is the Ratio of Males per 100 Females in Zinc?
There are 112.50 Males per 100 Females in Zinc.
What is the Ratio of Females per 100 Males in Zinc?
There are 88.89 Females per 100 Males in Zinc.
What is the Median Population Age in Zinc?
Median Population Age in Zinc is 41.8 Years.
What is the Average Family Size in Zinc
Average Family Size in Zinc is 3.2 People.
What is the Average Household Size in Zinc
Average Household Size in Zinc is 2.3 People.
How Large is the Labor Force in Zinc?
There are 21 People in the Labor Forcein in Zinc.
What is the Percentage of People in the Labor Force in Zinc?
37.5% of People are in the Labor Force in Zinc.
What is the Unemployment Rate in Zinc?
Unemployment Rate in Zinc is 9.5%.