Hindsville, AR Map & Demographics
Hindsville Map
Hindsville Overview
$26,630
PER CAPITA INCOME
$88,405
AVG FAMILY INCOME
$87,672
AVG HOUSEHOLD INCOME
0.23
INEQUALITY / GINI INDEX
120
TOTAL POPULATION
75
MALE POPULATION
45
FEMALE POPULATION
166.67
MALES / 100 FEMALES
60.00
FEMALES / 100 MALES
75.4
MEDIAN AGE
2.6
AVG FAMILY SIZE
2.1
AVG HOUSEHOLD SIZE
59
LABOR FORCE [ PEOPLE ]
51.8%
PERCENT IN LABOR FORCE
Hindsville Zip Codes
Hindsville Area Codes
Income in Hindsville
Income Overview in Hindsville
Per Capita Income in Hindsville is $26,630, while median incomes of families and households are $88,405 and $87,672 respectively.
| Characteristic | Number | Measure |
| Per Capita Income | 120 | $26,630 |
| Median Family Income | 39 | $88,405 |
| Mean Family Income | 39 | $78,164 |
| Median Household Income | 56 | $87,672 |
| Mean Household Income | 56 | $66,220 |
| Income Deficit | 39 | $0 |
| Wage / Income Gap (%) | 120 | 0.00% |
| Wage / Income Gap ($) | 120 | 100.00¢ per $1 |
| Gini / Inequality Index | 120 | 0.23 |
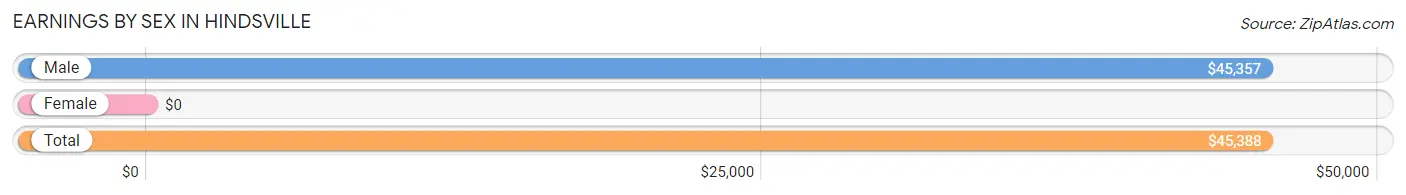
Earnings by Sex in Hindsville
| Sex | Number | Average Earnings |
| Male | 52 (88.1%) | $45,357 |
| Female | 7 (11.9%) | $0 |
| Total | 59 (100.0%) | $45,388 |
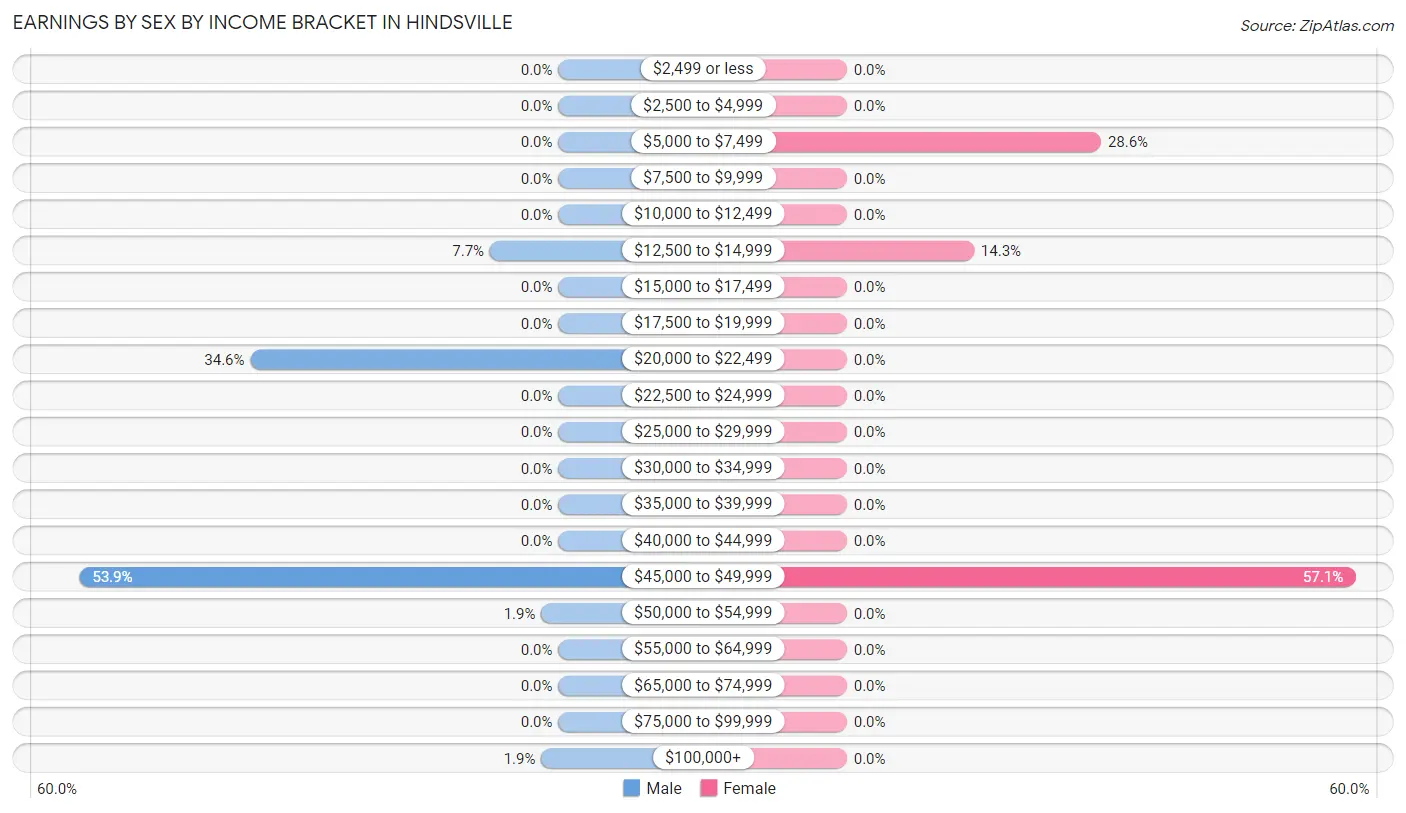
Earnings by Sex by Income Bracket in Hindsville
The most common earnings brackets in Hindsville are $45,000 to $49,999 for men (28 | 53.8%) and $45,000 to $49,999 for women (4 | 57.1%).
| Income | Male | Female |
| $2,499 or less | 0 (0.0%) | 0 (0.0%) |
| $2,500 to $4,999 | 0 (0.0%) | 0 (0.0%) |
| $5,000 to $7,499 | 0 (0.0%) | 2 (28.6%) |
| $7,500 to $9,999 | 0 (0.0%) | 0 (0.0%) |
| $10,000 to $12,499 | 0 (0.0%) | 0 (0.0%) |
| $12,500 to $14,999 | 4 (7.7%) | 1 (14.3%) |
| $15,000 to $17,499 | 0 (0.0%) | 0 (0.0%) |
| $17,500 to $19,999 | 0 (0.0%) | 0 (0.0%) |
| $20,000 to $22,499 | 18 (34.6%) | 0 (0.0%) |
| $22,500 to $24,999 | 0 (0.0%) | 0 (0.0%) |
| $25,000 to $29,999 | 0 (0.0%) | 0 (0.0%) |
| $30,000 to $34,999 | 0 (0.0%) | 0 (0.0%) |
| $35,000 to $39,999 | 0 (0.0%) | 0 (0.0%) |
| $40,000 to $44,999 | 0 (0.0%) | 0 (0.0%) |
| $45,000 to $49,999 | 28 (53.8%) | 4 (57.1%) |
| $50,000 to $54,999 | 1 (1.9%) | 0 (0.0%) |
| $55,000 to $64,999 | 0 (0.0%) | 0 (0.0%) |
| $65,000 to $74,999 | 0 (0.0%) | 0 (0.0%) |
| $75,000 to $99,999 | 0 (0.0%) | 0 (0.0%) |
| $100,000+ | 1 (1.9%) | 0 (0.0%) |
| Total | 52 (100.0%) | 7 (100.0%) |
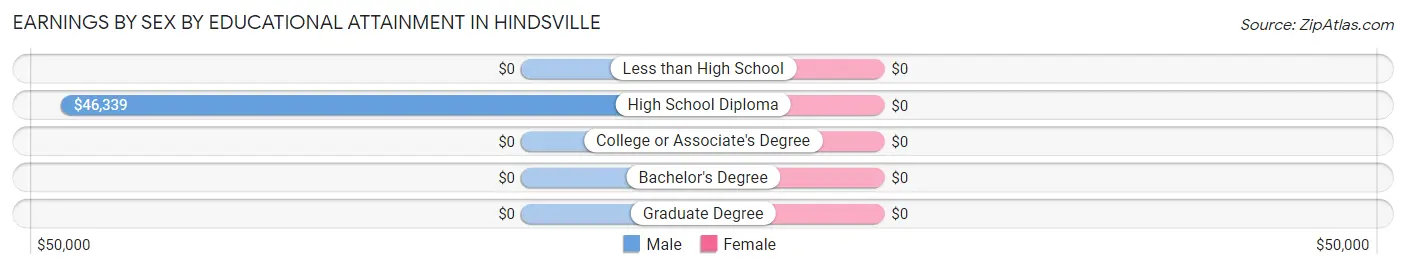
Earnings by Sex by Educational Attainment in Hindsville
| Educational Attainment | Male Income | Female Income |
| Less than High School | - | - |
| High School Diploma | $46,339 | $0 |
| College or Associate's Degree | - | - |
| Bachelor's Degree | - | - |
| Graduate Degree | - | - |
| Total | $45,357 | $0 |
Family Income in Hindsville
Family Income Brackets in Hindsville
According to the Hindsville family income data, there are 29 families falling into the $75,000 to $99,999 income range, which is the most common income bracket and makes up 74.4% of all families.
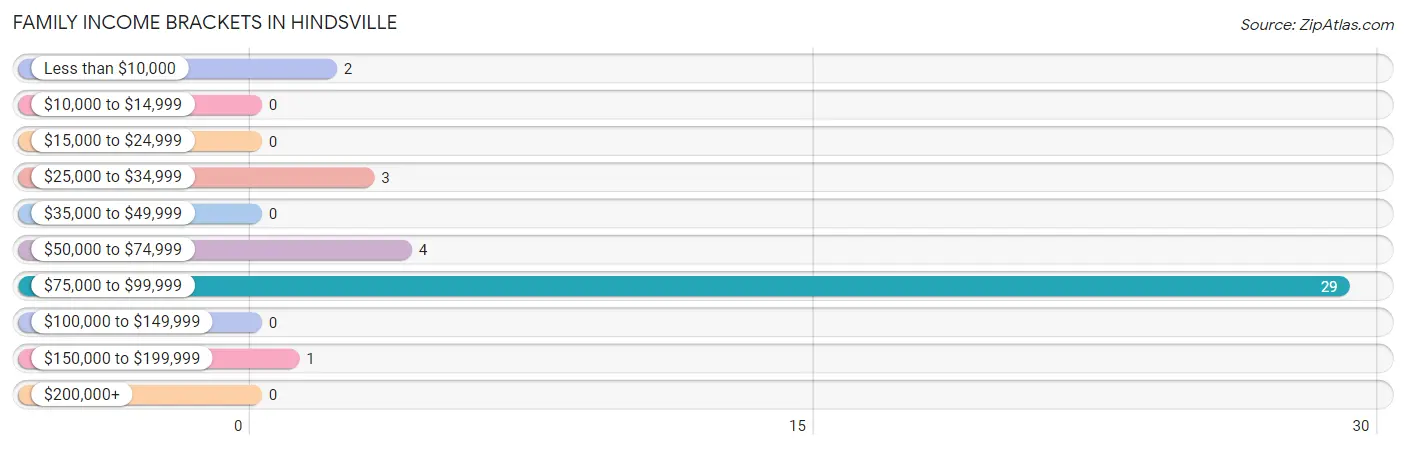
| Income Bracket | # Families | % Families |
| Less than $10,000 | 2 | 5.1% |
| $10,000 to $14,999 | 0 | 0.0% |
| $15,000 to $24,999 | 0 | 0.0% |
| $25,000 to $34,999 | 3 | 7.7% |
| $35,000 to $49,999 | 0 | 0.0% |
| $50,000 to $74,999 | 4 | 10.3% |
| $75,000 to $99,999 | 29 | 74.4% |
| $100,000 to $149,999 | 0 | 0.0% |
| $150,000 to $199,999 | 1 | 2.6% |
| $200,000+ | 0 | 0.0% |
Family Income by Famaliy Size in Hindsville
3-person families (35 | 89.7%) account for the highest median family income in Hindsville with $88,491 per family, while 3-person families (35 | 89.7%) have the highest median income of $29,497 per family member.
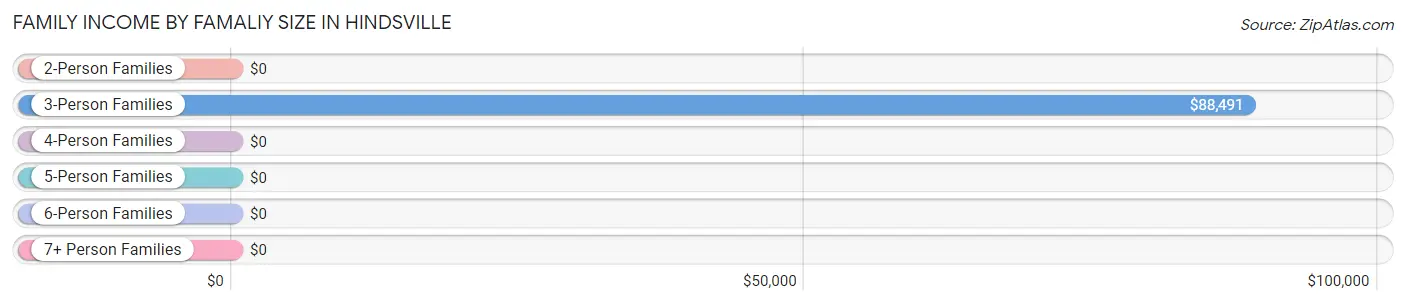
| Income Bracket | # Families | Median Income |
| 2-Person Families | 4 (10.3%) | $0 |
| 3-Person Families | 35 (89.7%) | $88,491 |
| 4-Person Families | 0 (0.0%) | $0 |
| 5-Person Families | 0 (0.0%) | $0 |
| 6-Person Families | 0 (0.0%) | $0 |
| 7+ Person Families | 0 (0.0%) | $0 |
| Total | 39 (100.0%) | $88,405 |
Family Income by Number of Earners in Hindsville
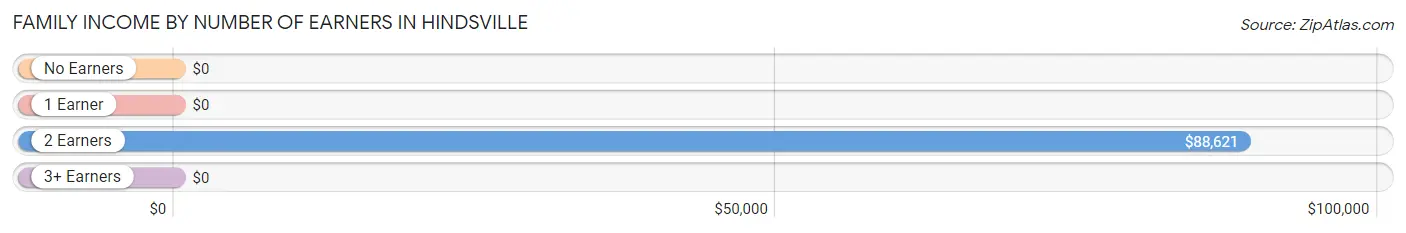
| Number of Earners | # Families | Median Income |
| No Earners | 3 (7.7%) | $0 |
| 1 Earner | 2 (5.1%) | $0 |
| 2 Earners | 34 (87.2%) | $88,621 |
| 3+ Earners | 0 (0.0%) | $0 |
| Total | 39 (100.0%) | $88,405 |
Household Income in Hindsville
Household Income Brackets in Hindsville
With 29 households falling in the category, the $75,000 to $99,999 income range is the most frequent in Hindsville, accounting for 51.8% of all households.
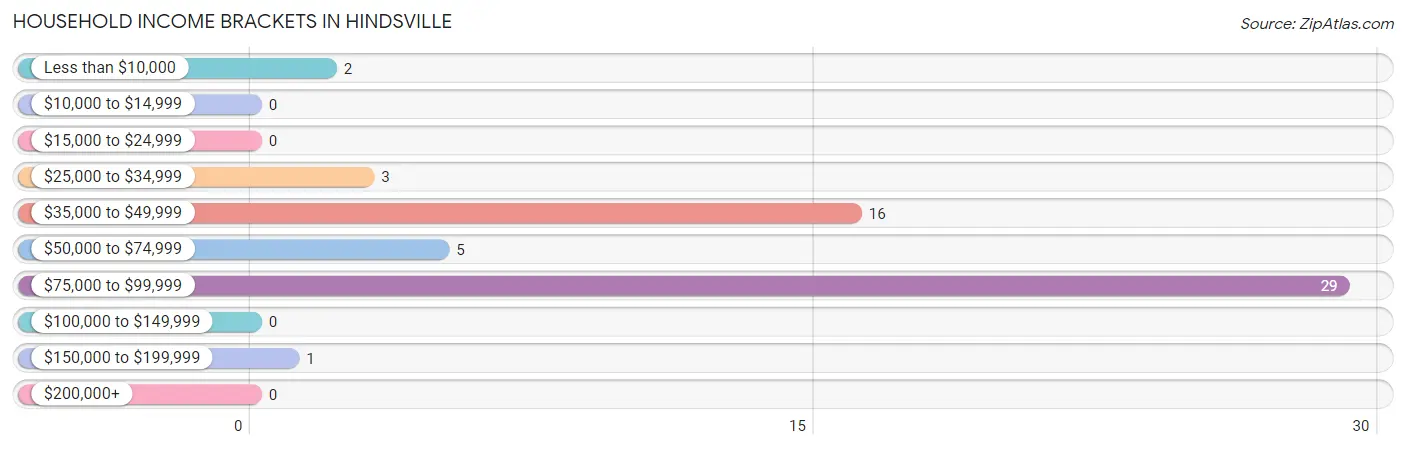
| Income Bracket | # Households | % Households |
| Less than $10,000 | 2 | 3.6% |
| $10,000 to $14,999 | 0 | 0.0% |
| $15,000 to $24,999 | 0 | 0.0% |
| $25,000 to $34,999 | 3 | 5.4% |
| $35,000 to $49,999 | 16 | 28.6% |
| $50,000 to $74,999 | 5 | 8.9% |
| $75,000 to $99,999 | 29 | 51.8% |
| $100,000 to $149,999 | 0 | 0.0% |
| $150,000 to $199,999 | 1 | 1.8% |
| $200,000+ | 0 | 0.0% |
Household Income by Householder Age in Hindsville
The median household income in Hindsville is $87,672, with the highest median household income of $87,931 found in the 65+ years age bracket for the primary householder. A total of 48 households (85.7%) fall into this category.
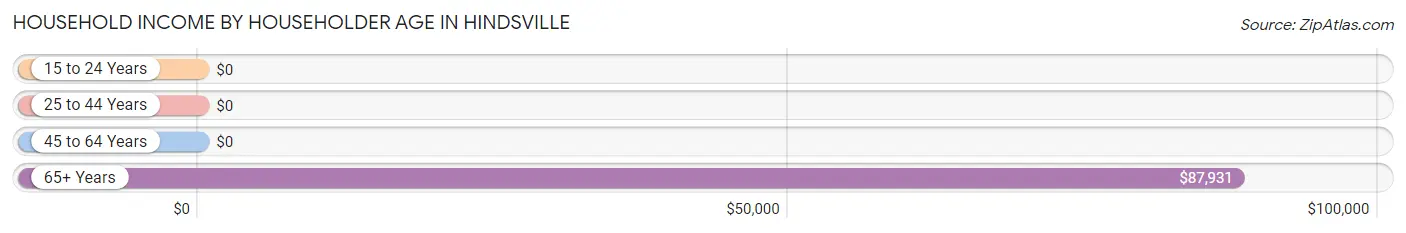
| Income Bracket | # Households | Median Income |
| 15 to 24 Years | 0 (0.0%) | $0 |
| 25 to 44 Years | 6 (10.7%) | $0 |
| 45 to 64 Years | 2 (3.6%) | $0 |
| 65+ Years | 48 (85.7%) | $87,931 |
| Total | 56 (100.0%) | $87,672 |
Poverty in Hindsville
Income Below Poverty by Sex and Age in Hindsville
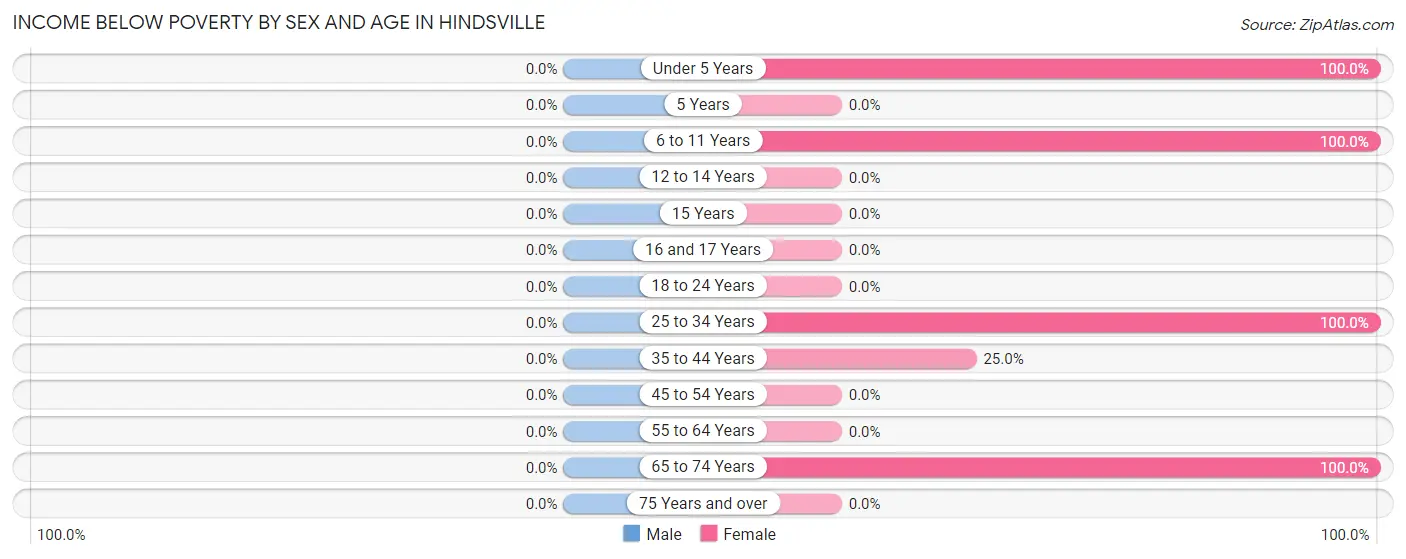
| Age Bracket | Male | Female |
| Under 5 Years | 0 (0.0%) | 3 (100.0%) |
| 5 Years | 0 (0.0%) | 0 (0.0%) |
| 6 to 11 Years | 0 (0.0%) | 3 (100.0%) |
| 12 to 14 Years | 0 (0.0%) | 0 (0.0%) |
| 15 Years | 0 (0.0%) | 0 (0.0%) |
| 16 and 17 Years | 0 (0.0%) | 0 (0.0%) |
| 18 to 24 Years | 0 (0.0%) | 0 (0.0%) |
| 25 to 34 Years | 0 (0.0%) | 2 (100.0%) |
| 35 to 44 Years | 0 (0.0%) | 1 (25.0%) |
| 45 to 54 Years | 0 (0.0%) | 0 (0.0%) |
| 55 to 64 Years | 0 (0.0%) | 0 (0.0%) |
| 65 to 74 Years | 0 (0.0%) | 1 (100.0%) |
| 75 Years and over | 0 (0.0%) | 0 (0.0%) |
| Total | 0 (0.0%) | 10 (22.2%) |
Income Above Poverty by Sex and Age in Hindsville
According to the poverty statistics in Hindsville, males aged 16 and 17 years and females aged 45 to 54 years are the age groups that are most secure financially, with 100.0% of males and 100.0% of females in these age groups living above the poverty line.
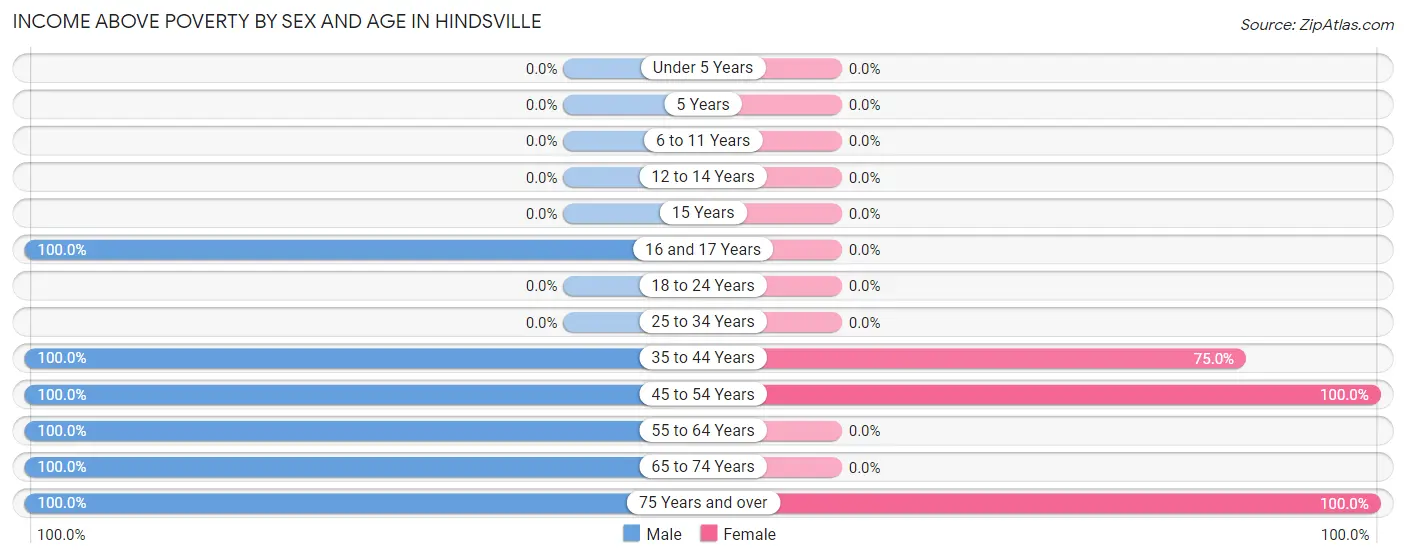
| Age Bracket | Male | Female |
| Under 5 Years | 0 (0.0%) | 0 (0.0%) |
| 5 Years | 0 (0.0%) | 0 (0.0%) |
| 6 to 11 Years | 0 (0.0%) | 0 (0.0%) |
| 12 to 14 Years | 0 (0.0%) | 0 (0.0%) |
| 15 Years | 0 (0.0%) | 0 (0.0%) |
| 16 and 17 Years | 4 (100.0%) | 0 (0.0%) |
| 18 to 24 Years | 0 (0.0%) | 0 (0.0%) |
| 25 to 34 Years | 0 (0.0%) | 0 (0.0%) |
| 35 to 44 Years | 4 (100.0%) | 3 (75.0%) |
| 45 to 54 Years | 1 (100.0%) | 1 (100.0%) |
| 55 to 64 Years | 29 (100.0%) | 0 (0.0%) |
| 65 to 74 Years | 1 (100.0%) | 0 (0.0%) |
| 75 Years and over | 36 (100.0%) | 31 (100.0%) |
| Total | 75 (100.0%) | 35 (77.8%) |
Income Below Poverty Among Married-Couple Families in Hindsville
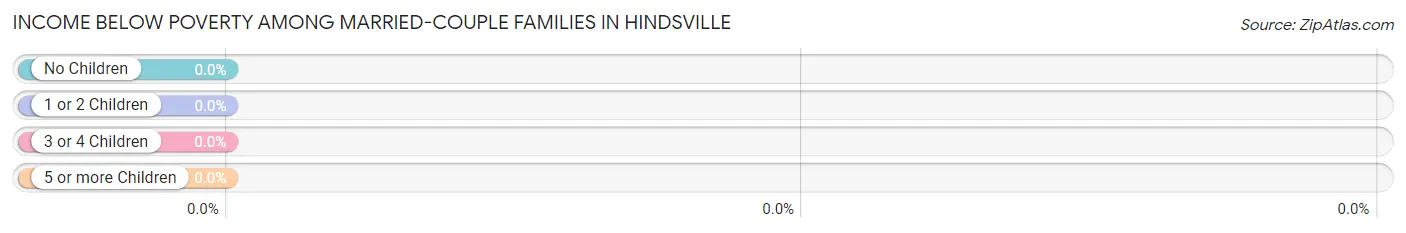
| Children | Above Poverty | Below Poverty |
| No Children | 33 (100.0%) | 0 (0.0%) |
| 1 or 2 Children | 4 (100.0%) | 0 (0.0%) |
| 3 or 4 Children | 0 (0.0%) | 0 (0.0%) |
| 5 or more Children | 0 (0.0%) | 0 (0.0%) |
| Total | 37 (100.0%) | 0 (0.0%) |
Income Below Poverty Among Single-Parent Households in Hindsville
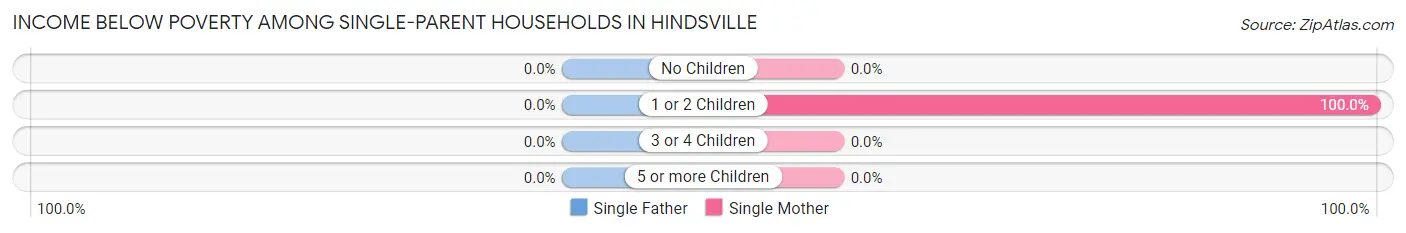
| Children | Single Father | Single Mother |
| No Children | 0 (0.0%) | 0 (0.0%) |
| 1 or 2 Children | 0 (0.0%) | 2 (100.0%) |
| 3 or 4 Children | 0 (0.0%) | 0 (0.0%) |
| 5 or more Children | 0 (0.0%) | 0 (0.0%) |
| Total | 0 (0.0%) | 2 (100.0%) |
Income Below Poverty Among Married-Couple vs Single-Parent Households in Hindsville
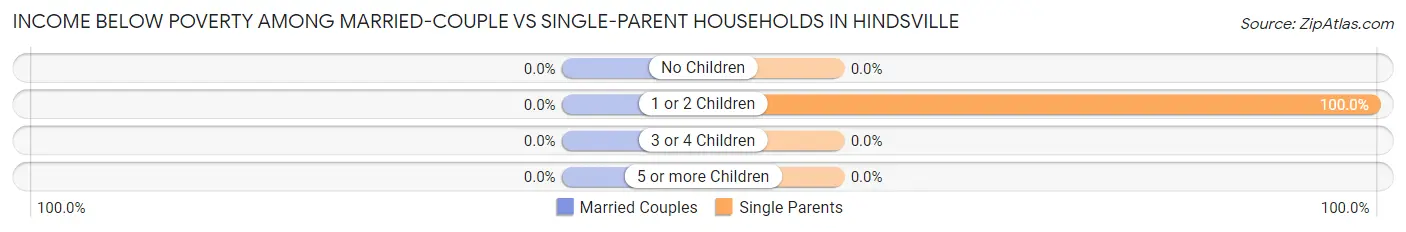
| Children | Married-Couple Families | Single-Parent Households |
| No Children | 0 (0.0%) | 0 (0.0%) |
| 1 or 2 Children | 0 (0.0%) | 2 (100.0%) |
| 3 or 4 Children | 0 (0.0%) | 0 (0.0%) |
| 5 or more Children | 0 (0.0%) | 0 (0.0%) |
| Total | 0 (0.0%) | 2 (100.0%) |
Race in Hindsville
The most populous races in Hindsville are White / Caucasian (117 | 97.5%), Two or more Races (2 | 1.7%), and Native / Alaskan (1 | 0.8%).
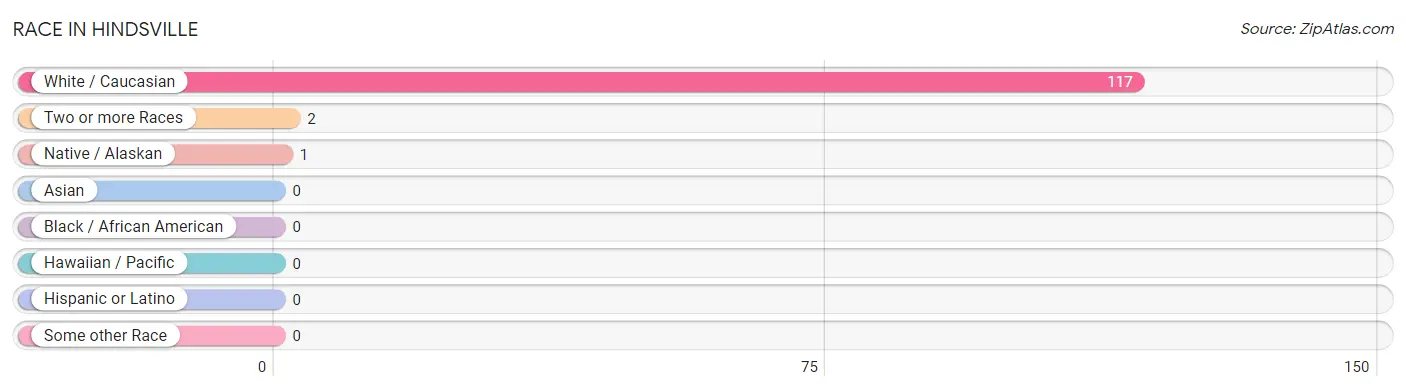
| Race | # Population | % Population |
| Asian | 0 | 0.0% |
| Black / African American | 0 | 0.0% |
| Hawaiian / Pacific | 0 | 0.0% |
| Hispanic or Latino | 0 | 0.0% |
| Native / Alaskan | 1 | 0.8% |
| White / Caucasian | 117 | 97.5% |
| Two or more Races | 2 | 1.7% |
| Some other Race | 0 | 0.0% |
| Total | 120 | 100.0% |
Ancestry in Hindsville
The most populous ancestries reported in Hindsville are English (83 | 69.2%), Irish (24 | 20.0%), American (3 | 2.5%), Cherokee (3 | 2.5%), and Danish (1 | 0.8%), together accounting for 95.0% of all Hindsville residents.
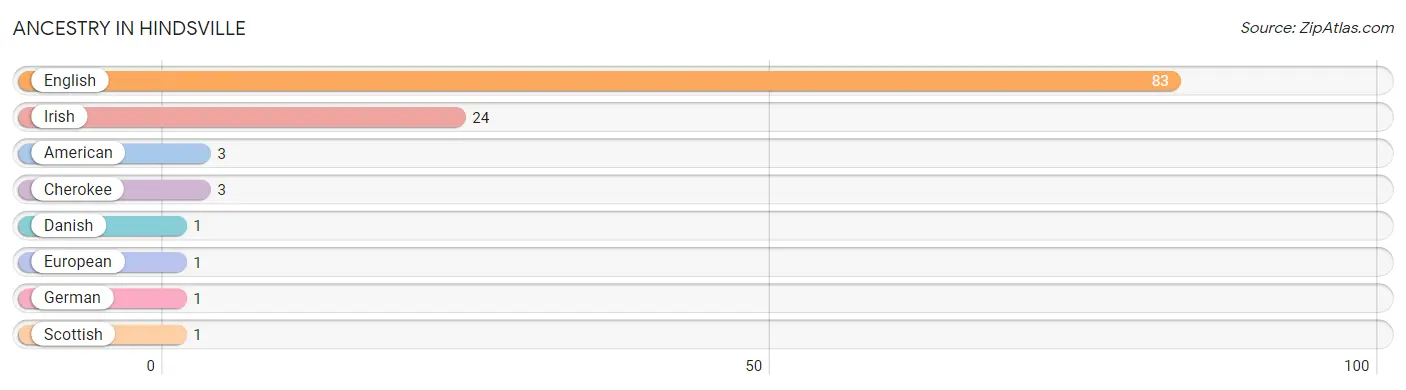
| Ancestry | # Population | % Population |
| American | 3 | 2.5% |
| Cherokee | 3 | 2.5% |
| Danish | 1 | 0.8% |
| English | 83 | 69.2% |
| European | 1 | 0.8% |
| German | 1 | 0.8% |
| Irish | 24 | 20.0% |
| Scottish | 1 | 0.8% | View All 8 Rows |
Immigrants in Hindsville

| Immigration Origin | # Population | % Population | View All 0 Rows |
Sex and Age in Hindsville
Sex and Age in Hindsville
The most populous age groups in Hindsville are 75 to 79 Years (36 | 48.0%) for men and 75 to 79 Years (31 | 68.9%) for women.
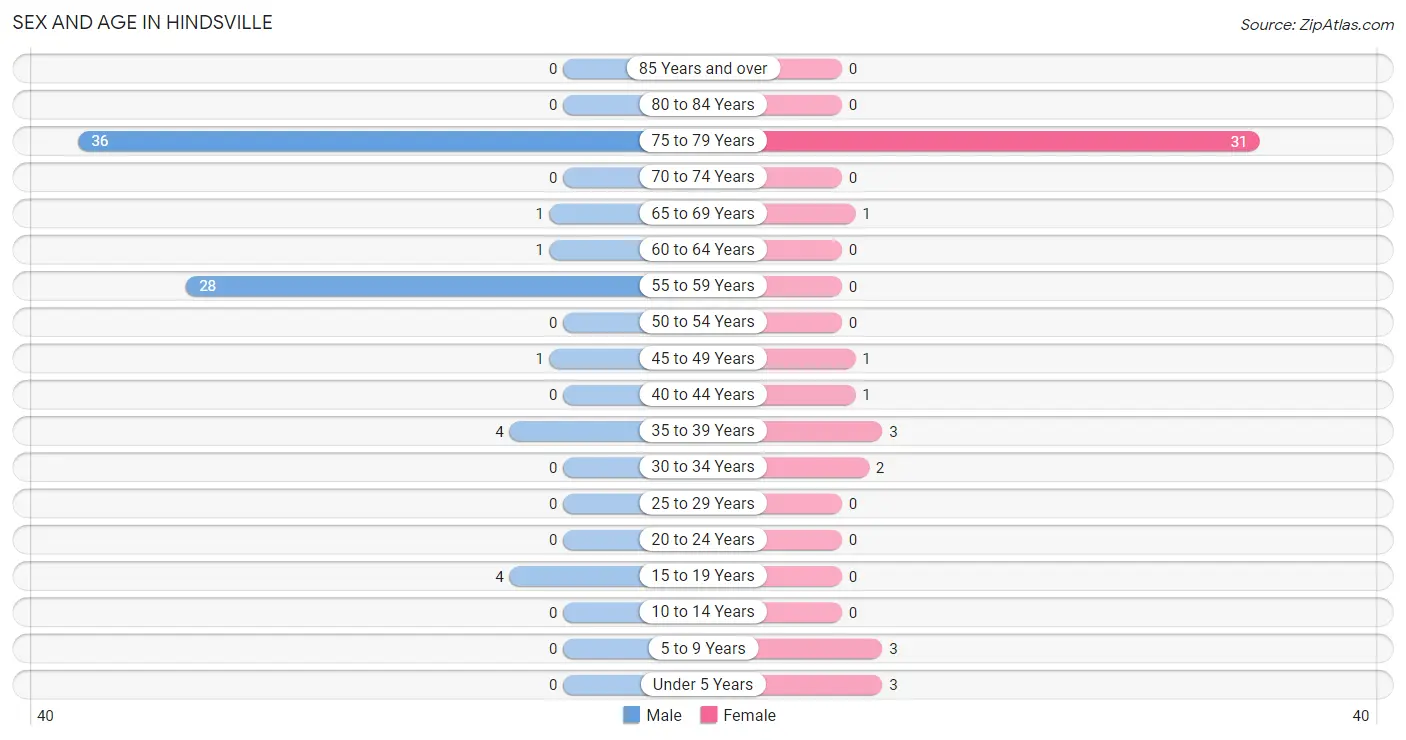
| Age Bracket | Male | Female |
| Under 5 Years | 0 (0.0%) | 3 (6.7%) |
| 5 to 9 Years | 0 (0.0%) | 3 (6.7%) |
| 10 to 14 Years | 0 (0.0%) | 0 (0.0%) |
| 15 to 19 Years | 4 (5.3%) | 0 (0.0%) |
| 20 to 24 Years | 0 (0.0%) | 0 (0.0%) |
| 25 to 29 Years | 0 (0.0%) | 0 (0.0%) |
| 30 to 34 Years | 0 (0.0%) | 2 (4.4%) |
| 35 to 39 Years | 4 (5.3%) | 3 (6.7%) |
| 40 to 44 Years | 0 (0.0%) | 1 (2.2%) |
| 45 to 49 Years | 1 (1.3%) | 1 (2.2%) |
| 50 to 54 Years | 0 (0.0%) | 0 (0.0%) |
| 55 to 59 Years | 28 (37.3%) | 0 (0.0%) |
| 60 to 64 Years | 1 (1.3%) | 0 (0.0%) |
| 65 to 69 Years | 1 (1.3%) | 1 (2.2%) |
| 70 to 74 Years | 0 (0.0%) | 0 (0.0%) |
| 75 to 79 Years | 36 (48.0%) | 31 (68.9%) |
| 80 to 84 Years | 0 (0.0%) | 0 (0.0%) |
| 85 Years and over | 0 (0.0%) | 0 (0.0%) |
| Total | 75 (100.0%) | 45 (100.0%) |
Families and Households in Hindsville
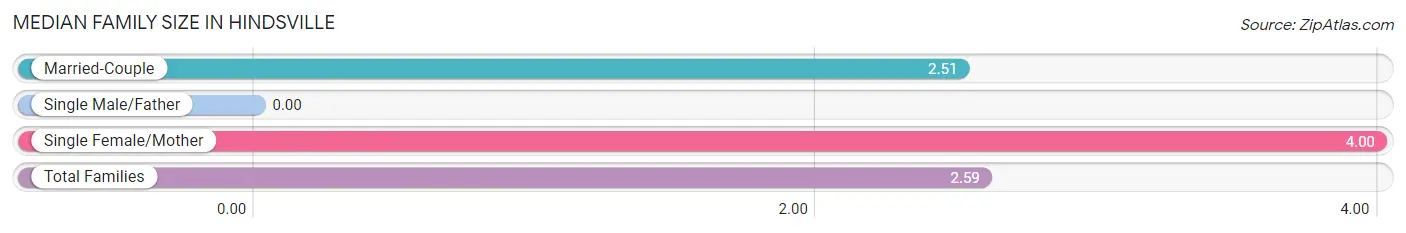
Median Family Size in Hindsville
| Family Type | # Families | Family Size |
| Married-Couple | 37 (94.9%) | 2.51 |
| Single Male/Father | 0 (0.0%) | - |
| Single Female/Mother | 2 (5.1%) | 4.00 |
| Total Families | 39 (100.0%) | 2.59 |
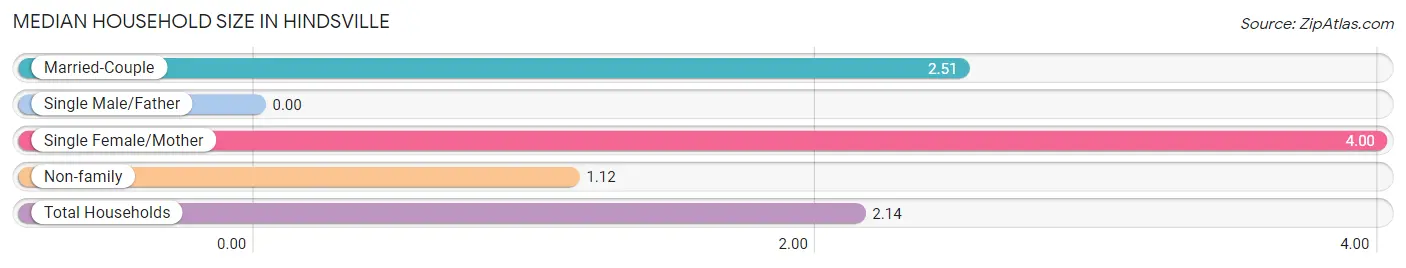
Median Household Size in Hindsville
| Household Type | # Households | Household Size |
| Married-Couple | 37 (66.1%) | 2.51 |
| Single Male/Father | 0 (0.0%) | - |
| Single Female/Mother | 2 (3.6%) | 4.00 |
| Non-family | 17 (30.4%) | 1.12 |
| Total Households | 56 (100.0%) | 2.14 |
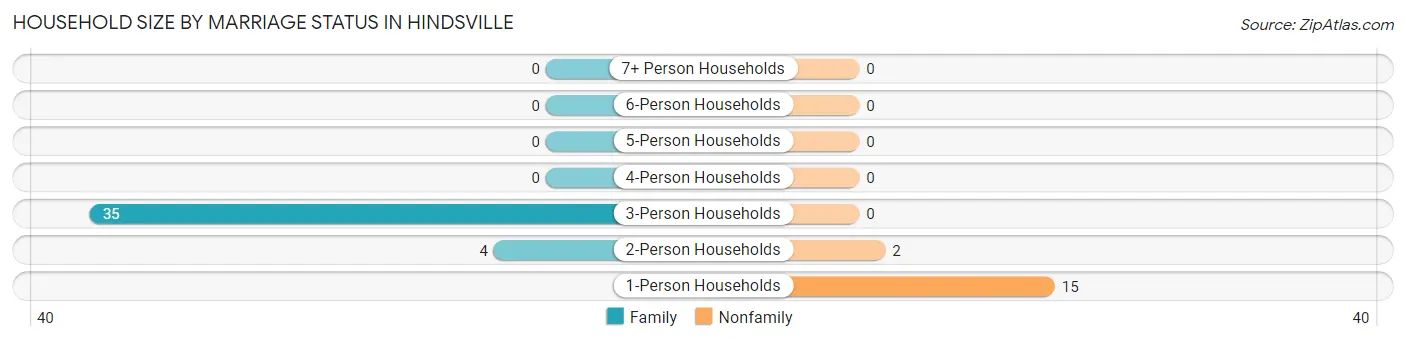
Household Size by Marriage Status in Hindsville
Out of a total of 56 households in Hindsville, 39 (69.6%) are family households, while 17 (30.4%) are nonfamily households. The most numerous type of family households are 3-person households, comprising 35, and the most common type of nonfamily households are 1-person households, comprising 15.
| Household Size | Family Households | Nonfamily Households |
| 1-Person Households | - | 15 (26.8%) |
| 2-Person Households | 4 (7.1%) | 2 (3.6%) |
| 3-Person Households | 35 (62.5%) | 0 (0.0%) |
| 4-Person Households | 0 (0.0%) | 0 (0.0%) |
| 5-Person Households | 0 (0.0%) | 0 (0.0%) |
| 6-Person Households | 0 (0.0%) | 0 (0.0%) |
| 7+ Person Households | 0 (0.0%) | 0 (0.0%) |
| Total | 39 (69.6%) | 17 (30.4%) |
Female Fertility in Hindsville
Fertility by Age in Hindsville
| Age Bracket | Women with Births | Births / 1,000 Women |
| 15 to 19 years | 0 (0.0%) | 0.0 |
| 20 to 34 years | 0 (0.0%) | 0.0 |
| 35 to 50 years | 0 (0.0%) | 0.0 |
| Total | 0 (0.0%) | 0.0 |
Fertility by Age by Marriage Status in Hindsville
| Age Bracket | Married | Unmarried |
| 15 to 19 years | 0 (0.0%) | 0 (0.0%) |
| 20 to 34 years | 0 (0.0%) | 0 (0.0%) |
| 35 to 50 years | 0 (0.0%) | 0 (0.0%) |
| Total | 0 (0.0%) | 0 (0.0%) |
Fertility by Education in Hindsville
| Educational Attainment | Women with Births | Births / 1,000 Women |
| Less than High School | 0 (0.0%) | 0.0 |
| High School Diploma | 0 (0.0%) | 0.0 |
| College or Associate's Degree | 0 (0.0%) | 0.0 |
| Bachelor's Degree | 0 (0.0%) | 0.0 |
| Graduate Degree | 0 (0.0%) | 0.0 |
| Total | 0 (0.0%) | 0.0 |
Fertility by Education by Marriage Status in Hindsville
| Educational Attainment | Married | Unmarried |
| Less than High School | 0 (0.0%) | 0 (0.0%) |
| High School Diploma | 0 (0.0%) | 0 (0.0%) |
| College or Associate's Degree | 0 (0.0%) | 0 (0.0%) |
| Bachelor's Degree | 0 (0.0%) | 0 (0.0%) |
| Graduate Degree | 0 (0.0%) | 0 (0.0%) |
| Total | 0 (0.0%) | 0 (0.0%) |
Employment Characteristics in Hindsville
Employment by Class of Employer in Hindsville
Among the 55 employed individuals in Hindsville, private company employees (54 | 98.2%), and not-for-profit organizations (1 | 1.8%) make up the most common classes of employment.
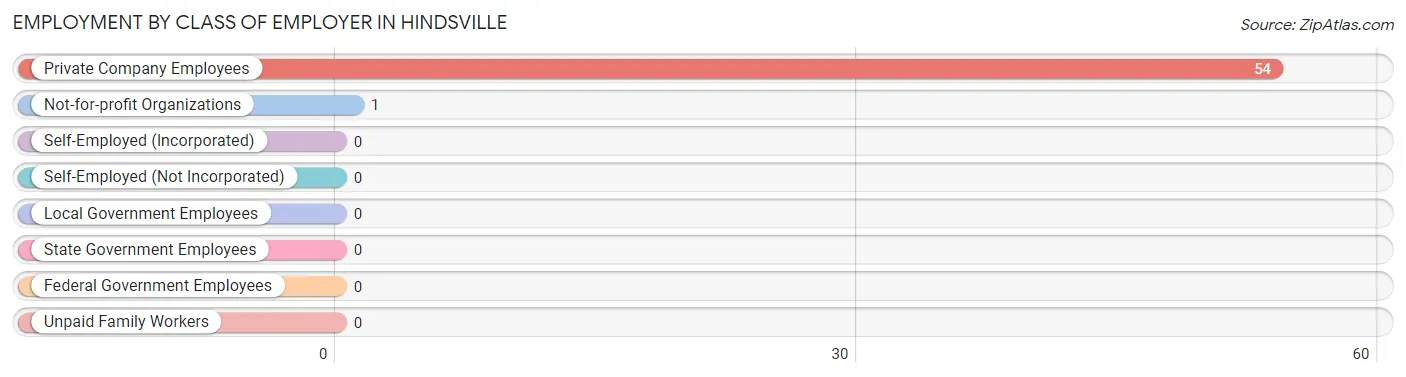
| Employer Class | # Employees | % Employees |
| Private Company Employees | 54 | 98.2% |
| Self-Employed (Incorporated) | 0 | 0.0% |
| Self-Employed (Not Incorporated) | 0 | 0.0% |
| Not-for-profit Organizations | 1 | 1.8% |
| Local Government Employees | 0 | 0.0% |
| State Government Employees | 0 | 0.0% |
| Federal Government Employees | 0 | 0.0% |
| Unpaid Family Workers | 0 | 0.0% |
| Total | 55 | 100.0% |
Employment Status by Age in Hindsville
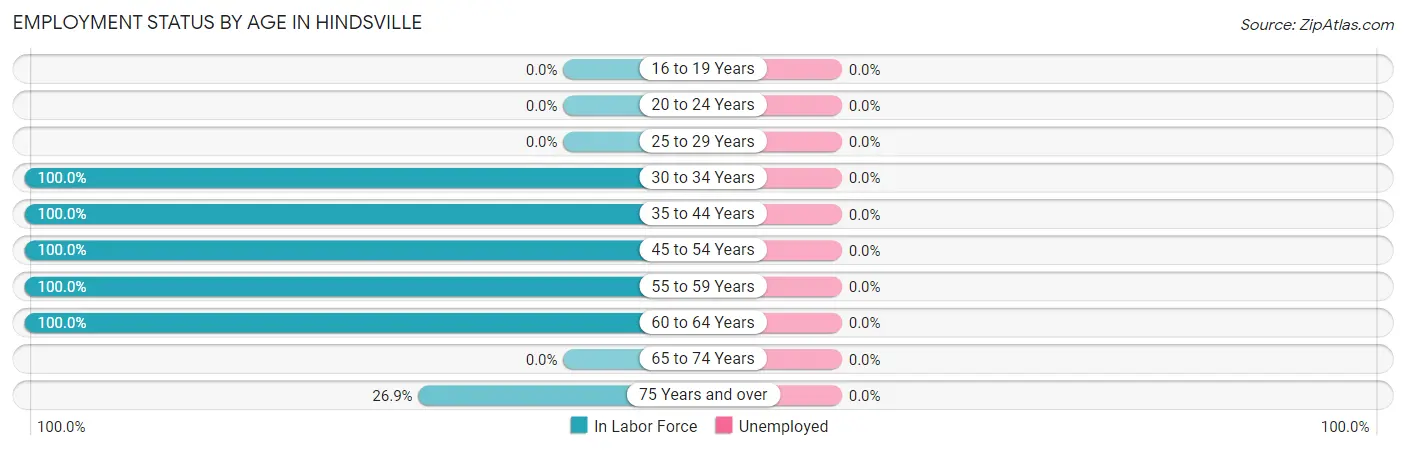
| Age Bracket | In Labor Force | Unemployed |
| 16 to 19 Years | 0 (0.0%) | 0 (0.0%) |
| 20 to 24 Years | 0 (0.0%) | 0 (0.0%) |
| 25 to 29 Years | 0 (0.0%) | 0 (0.0%) |
| 30 to 34 Years | 2 (100.0%) | 0 (0.0%) |
| 35 to 44 Years | 8 (100.0%) | 0 (0.0%) |
| 45 to 54 Years | 2 (100.0%) | 0 (0.0%) |
| 55 to 59 Years | 28 (100.0%) | 0 (0.0%) |
| 60 to 64 Years | 1 (100.0%) | 0 (0.0%) |
| 65 to 74 Years | 0 (0.0%) | 0 (0.0%) |
| 75 Years and over | 18 (26.9%) | 0 (0.0%) |
| Total | 59 (51.8%) | 0 (0.0%) |
Employment Status by Educational Attainment in Hindsville
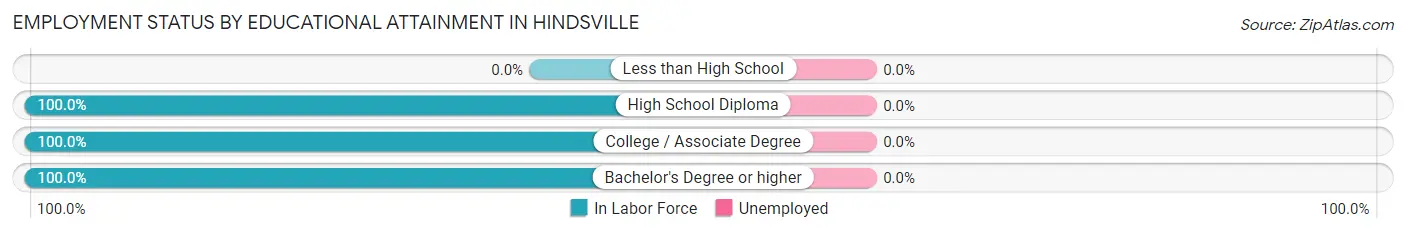
| Educational Attainment | In Labor Force | Unemployed |
| Less than High School | 0 (0.0%) | 0 (0.0%) |
| High School Diploma | 33 (100.0%) | 0 (0.0%) |
| College / Associate Degree | 3 (100.0%) | 0 (0.0%) |
| Bachelor's Degree or higher | 5 (100.0%) | 0 (0.0%) |
| Total | 41 (100.0%) | 0 (0.0%) |
Employment Occupations by Sex in Hindsville
Management, Business, Science and Arts Occupations
The most common Management, Business, Science and Arts occupations in Hindsville are , and Management (2 | 3.4%).
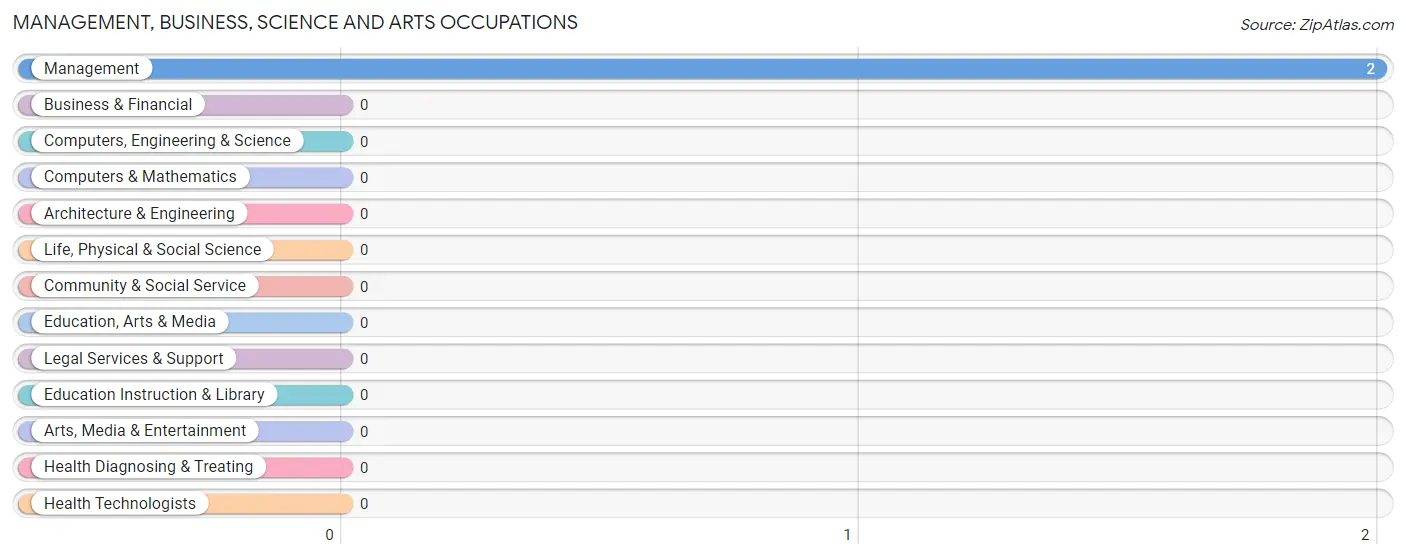
Management, Business, Science and Arts Occupations by Sex
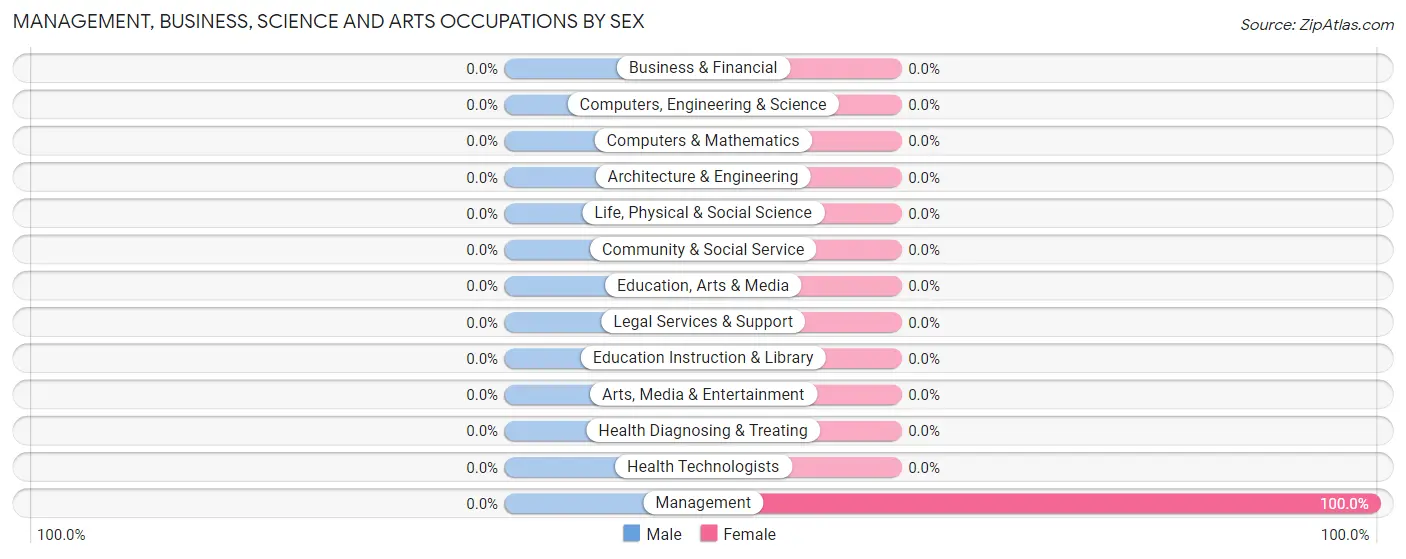
| Occupation | Male | Female |
| Management | 0 (0.0%) | 2 (100.0%) |
| Business & Financial | 0 (0.0%) | 0 (0.0%) |
| Computers, Engineering & Science | 0 (0.0%) | 0 (0.0%) |
| Computers & Mathematics | 0 (0.0%) | 0 (0.0%) |
| Architecture & Engineering | 0 (0.0%) | 0 (0.0%) |
| Life, Physical & Social Science | 0 (0.0%) | 0 (0.0%) |
| Community & Social Service | 0 (0.0%) | 0 (0.0%) |
| Education, Arts & Media | 0 (0.0%) | 0 (0.0%) |
| Legal Services & Support | 0 (0.0%) | 0 (0.0%) |
| Education Instruction & Library | 0 (0.0%) | 0 (0.0%) |
| Arts, Media & Entertainment | 0 (0.0%) | 0 (0.0%) |
| Health Diagnosing & Treating | 0 (0.0%) | 0 (0.0%) |
| Health Technologists | 0 (0.0%) | 0 (0.0%) |
| Total (Category) | 0 (0.0%) | 2 (100.0%) |
| Total (Overall) | 52 (88.1%) | 7 (11.9%) |
Services Occupations
Services Occupations by Sex
| Occupation | Male | Female |
| Healthcare Support | 0 (0.0%) | 0 (0.0%) |
| Security & Protection | 0 (0.0%) | 0 (0.0%) |
| Firefighting & Prevention | 0 (0.0%) | 0 (0.0%) |
| Law Enforcement | 0 (0.0%) | 0 (0.0%) |
| Food Preparation & Serving | 0 (0.0%) | 0 (0.0%) |
| Cleaning & Maintenance | 0 (0.0%) | 0 (0.0%) |
| Personal Care & Service | 0 (0.0%) | 0 (0.0%) |
| Total (Category) | 0 (0.0%) | 0 (0.0%) |
| Total (Overall) | 52 (88.1%) | 7 (11.9%) |
Sales and Office Occupations
The most common Sales and Office occupations in Hindsville are Sales & Related (28 | 47.5%), and Office & Administration (5 | 8.5%).
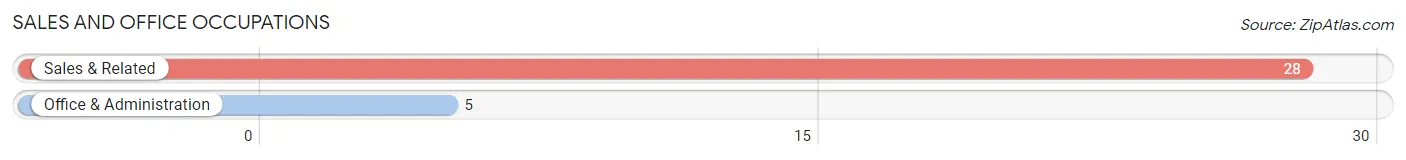
Sales and Office Occupations by Sex

| Occupation | Male | Female |
| Sales & Related | 28 (100.0%) | 0 (0.0%) |
| Office & Administration | 0 (0.0%) | 5 (100.0%) |
| Total (Category) | 28 (84.9%) | 5 (15.1%) |
| Total (Overall) | 52 (88.1%) | 7 (11.9%) |
Natural Resources, Construction and Maintenance Occupations
The most common Natural Resources, Construction and Maintenance occupations in Hindsville are , and Farming, Fishing & Forestry (18 | 30.5%).
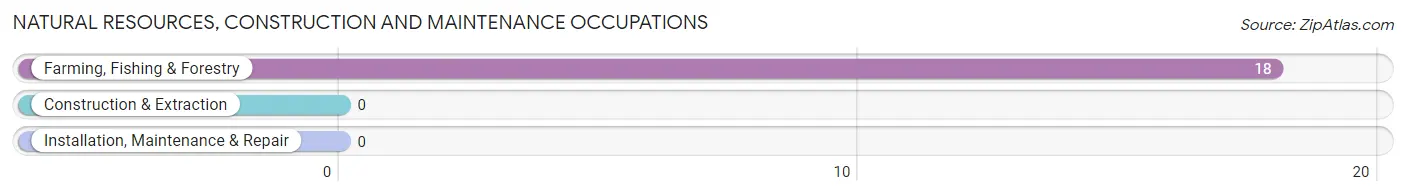
Natural Resources, Construction and Maintenance Occupations by Sex

| Occupation | Male | Female |
| Farming, Fishing & Forestry | 18 (100.0%) | 0 (0.0%) |
| Construction & Extraction | 0 (0.0%) | 0 (0.0%) |
| Installation, Maintenance & Repair | 0 (0.0%) | 0 (0.0%) |
| Total (Category) | 18 (100.0%) | 0 (0.0%) |
| Total (Overall) | 52 (88.1%) | 7 (11.9%) |
Production, Transportation and Moving Occupations
The most common Production, Transportation and Moving occupations in Hindsville are Transportation (5 | 8.5%), and Production (1 | 1.7%).
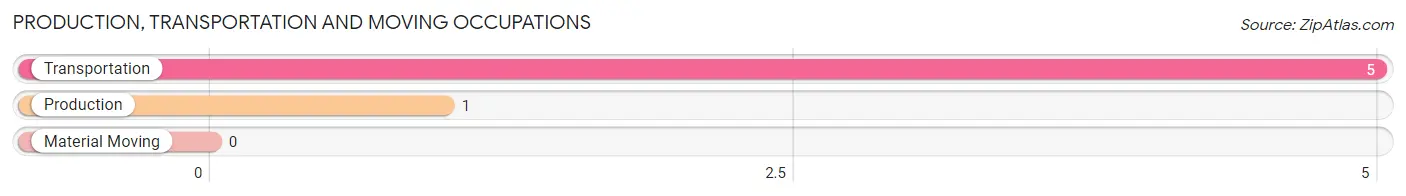
Production, Transportation and Moving Occupations by Sex
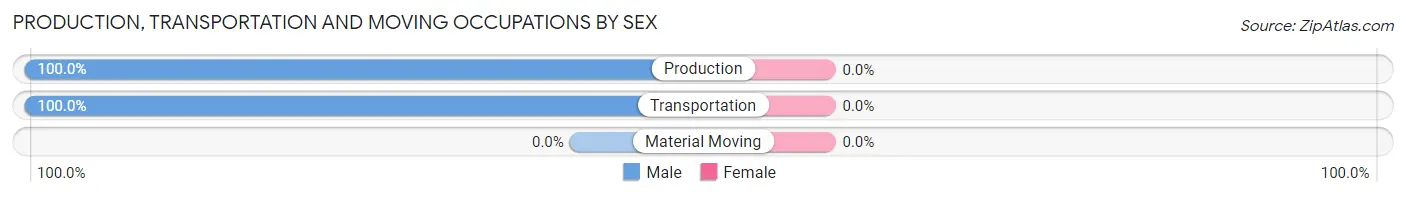
| Occupation | Male | Female |
| Production | 1 (100.0%) | 0 (0.0%) |
| Transportation | 5 (100.0%) | 0 (0.0%) |
| Material Moving | 0 (0.0%) | 0 (0.0%) |
| Total (Category) | 6 (100.0%) | 0 (0.0%) |
| Total (Overall) | 52 (88.1%) | 7 (11.9%) |
Employment Industries by Sex in Hindsville
Employment Industries in Hindsville
The major employment industries in Hindsville include Retail Trade (28 | 47.5%), Agriculture, Fishing & Hunting (18 | 30.5%), Utilities (4 | 6.8%), Construction (3 | 5.1%), and Transportation & Warehousing (2 | 3.4%).
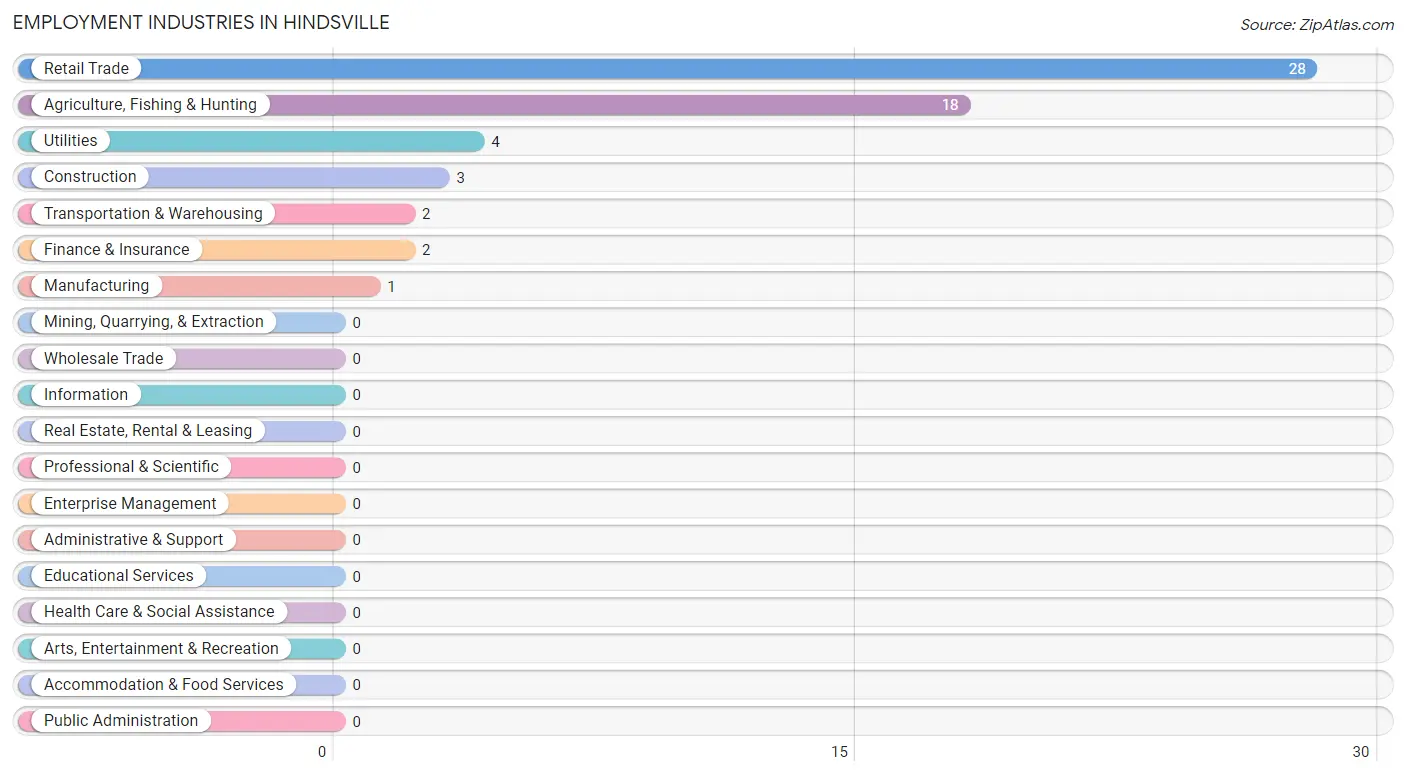
Employment Industries by Sex in Hindsville
The Hindsville industries that see more men than women are Agriculture, Fishing & Hunting (100.0%), Manufacturing (100.0%), and Retail Trade (100.0%), whereas the industries that tend to have a higher number of women are Construction (100.0%), Finance & Insurance (100.0%), and Transportation & Warehousing (50.0%).
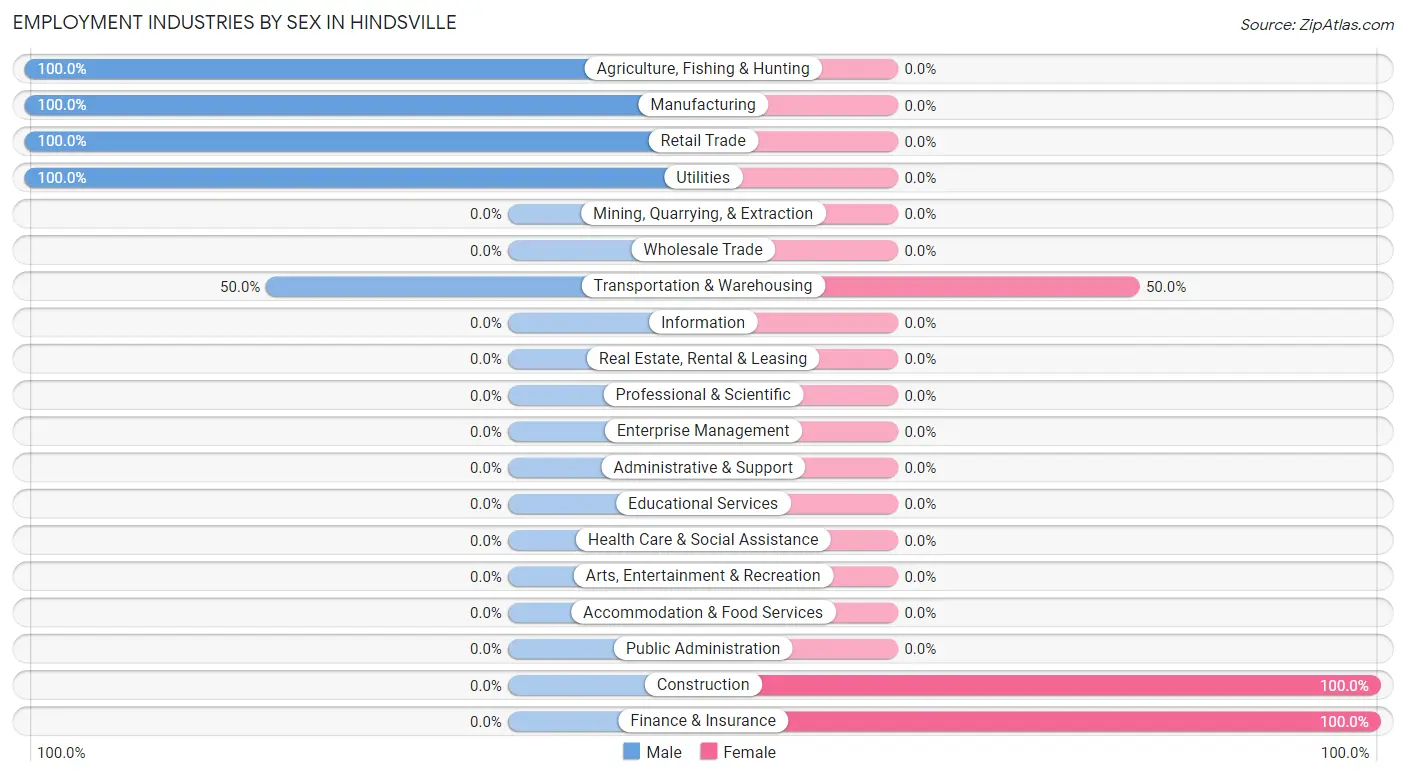
| Industry | Male | Female |
| Agriculture, Fishing & Hunting | 18 (100.0%) | 0 (0.0%) |
| Mining, Quarrying, & Extraction | 0 (0.0%) | 0 (0.0%) |
| Construction | 0 (0.0%) | 3 (100.0%) |
| Manufacturing | 1 (100.0%) | 0 (0.0%) |
| Wholesale Trade | 0 (0.0%) | 0 (0.0%) |
| Retail Trade | 28 (100.0%) | 0 (0.0%) |
| Transportation & Warehousing | 1 (50.0%) | 1 (50.0%) |
| Utilities | 4 (100.0%) | 0 (0.0%) |
| Information | 0 (0.0%) | 0 (0.0%) |
| Finance & Insurance | 0 (0.0%) | 2 (100.0%) |
| Real Estate, Rental & Leasing | 0 (0.0%) | 0 (0.0%) |
| Professional & Scientific | 0 (0.0%) | 0 (0.0%) |
| Enterprise Management | 0 (0.0%) | 0 (0.0%) |
| Administrative & Support | 0 (0.0%) | 0 (0.0%) |
| Educational Services | 0 (0.0%) | 0 (0.0%) |
| Health Care & Social Assistance | 0 (0.0%) | 0 (0.0%) |
| Arts, Entertainment & Recreation | 0 (0.0%) | 0 (0.0%) |
| Accommodation & Food Services | 0 (0.0%) | 0 (0.0%) |
| Public Administration | 0 (0.0%) | 0 (0.0%) |
| Total | 52 (88.1%) | 7 (11.9%) |
Education in Hindsville
School Enrollment in Hindsville
The most common levels of schooling among the 10 students in Hindsville are high school (4 | 40.0%), nursery / preschool (3 | 30.0%), and elementary school (3 | 30.0%).
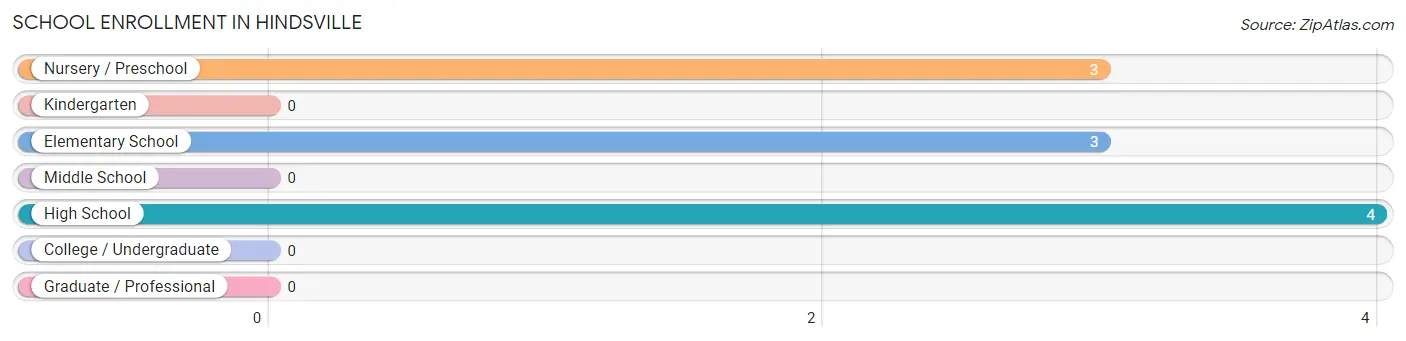
| School Level | # Students | % Students |
| Nursery / Preschool | 3 | 30.0% |
| Kindergarten | 0 | 0.0% |
| Elementary School | 3 | 30.0% |
| Middle School | 0 | 0.0% |
| High School | 4 | 40.0% |
| College / Undergraduate | 0 | 0.0% |
| Graduate / Professional | 0 | 0.0% |
| Total | 10 | 100.0% |
School Enrollment by Age by Funding Source in Hindsville
Out of a total of 10 students who are enrolled in schools in Hindsville, 3 (30.0%) attend a private institution, while the remaining 7 (70.0%) are enrolled in public schools. The age group of 5 to 9 year old has the highest likelihood of being enrolled in private schools, with 3 (100.0% in the age bracket) enrolled. Conversely, the age group of 3 to 4 year olds has the lowest likelihood of being enrolled in a private school, with 3 (100.0% in the age bracket) attending a public institution.
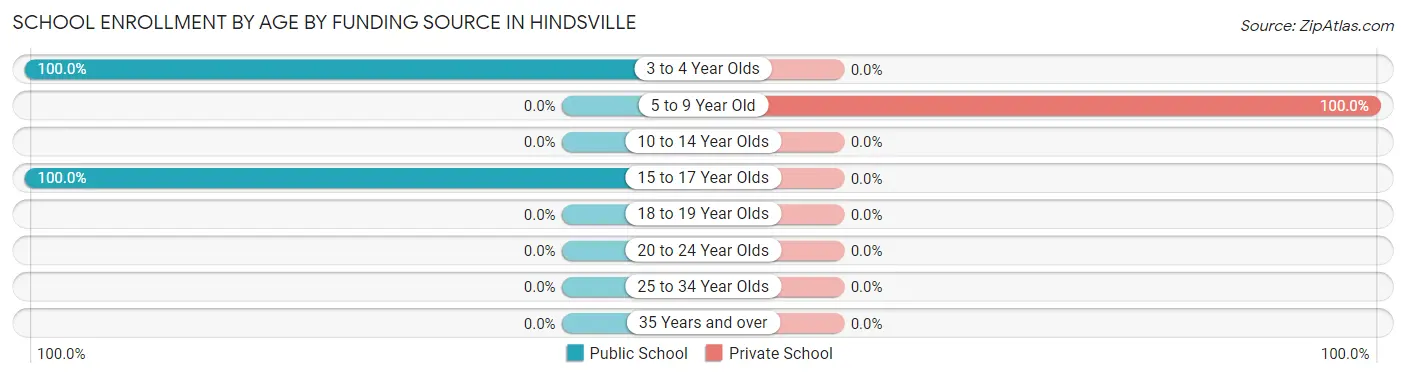
| Age Bracket | Public School | Private School |
| 3 to 4 Year Olds | 3 (100.0%) | 0 (0.0%) |
| 5 to 9 Year Old | 0 (0.0%) | 3 (100.0%) |
| 10 to 14 Year Olds | 0 (0.0%) | 0 (0.0%) |
| 15 to 17 Year Olds | 4 (100.0%) | 0 (0.0%) |
| 18 to 19 Year Olds | 0 (0.0%) | 0 (0.0%) |
| 20 to 24 Year Olds | 0 (0.0%) | 0 (0.0%) |
| 25 to 34 Year Olds | 0 (0.0%) | 0 (0.0%) |
| 35 Years and over | 0 (0.0%) | 0 (0.0%) |
| Total | 7 (70.0%) | 3 (30.0%) |
Educational Attainment by Field of Study in Hindsville
Education (5 | 55.6%), and arts & humanities (4 | 44.4%) are the most common fields of study among 9 individuals in Hindsville who have obtained a bachelor's degree or higher.
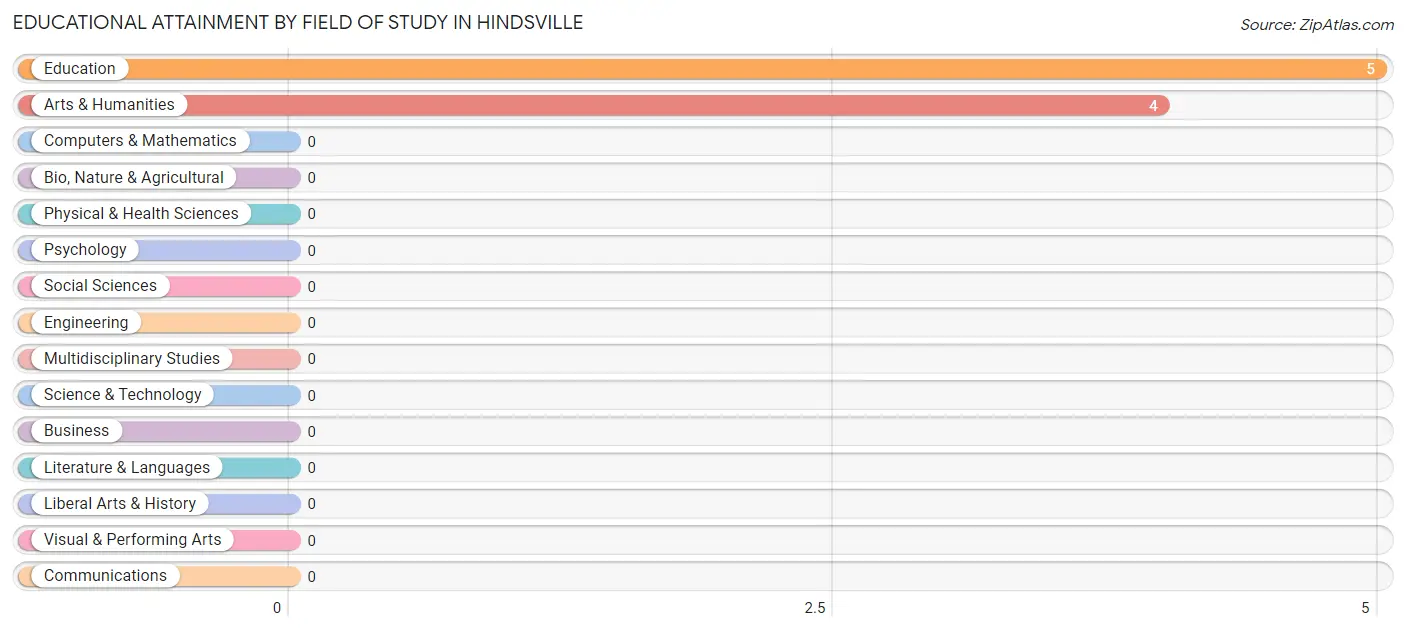
| Field of Study | # Graduates | % Graduates |
| Computers & Mathematics | 0 | 0.0% |
| Bio, Nature & Agricultural | 0 | 0.0% |
| Physical & Health Sciences | 0 | 0.0% |
| Psychology | 0 | 0.0% |
| Social Sciences | 0 | 0.0% |
| Engineering | 0 | 0.0% |
| Multidisciplinary Studies | 0 | 0.0% |
| Science & Technology | 0 | 0.0% |
| Business | 0 | 0.0% |
| Education | 5 | 55.6% |
| Literature & Languages | 0 | 0.0% |
| Liberal Arts & History | 0 | 0.0% |
| Visual & Performing Arts | 0 | 0.0% |
| Communications | 0 | 0.0% |
| Arts & Humanities | 4 | 44.4% |
| Total | 9 | 100.0% |
Transportation & Commute in Hindsville
Vehicle Availability by Sex in Hindsville
The most prevalent vehicle ownership categories in Hindsville are males with 3 vehicles (46, accounting for 95.8%) and females with 3 vehicles (0, making up 657.1%).
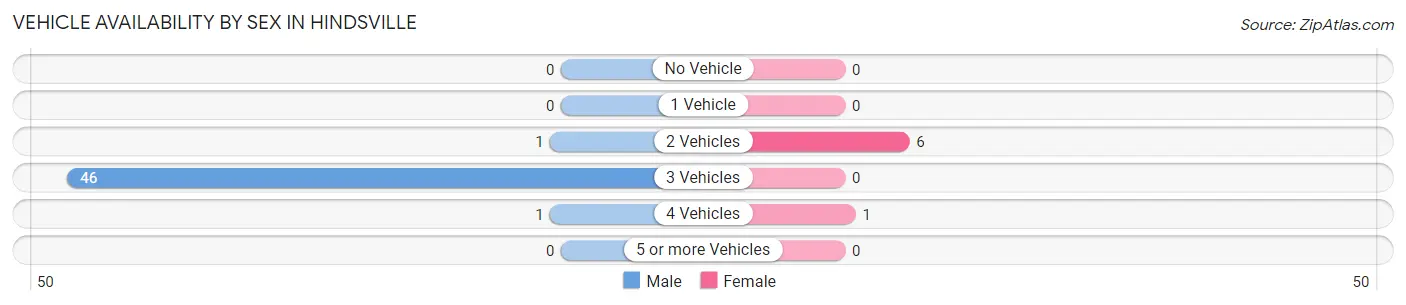
| Vehicles Available | Male | Female |
| No Vehicle | 0 (0.0%) | 0 (0.0%) |
| 1 Vehicle | 0 (0.0%) | 0 (0.0%) |
| 2 Vehicles | 1 (2.1%) | 6 (85.7%) |
| 3 Vehicles | 46 (95.8%) | 0 (0.0%) |
| 4 Vehicles | 1 (2.1%) | 1 (14.3%) |
| 5 or more Vehicles | 0 (0.0%) | 0 (0.0%) |
| Total | 48 (100.0%) | 7 (100.0%) |
Commute Time in Hindsville
The most frequently occuring commute durations in Hindsville are 5 to 9 minutes (28 commuters, 50.9%), less than 5 minutes (18 commuters, 32.7%), and 45 to 59 minutes (6 commuters, 10.9%).
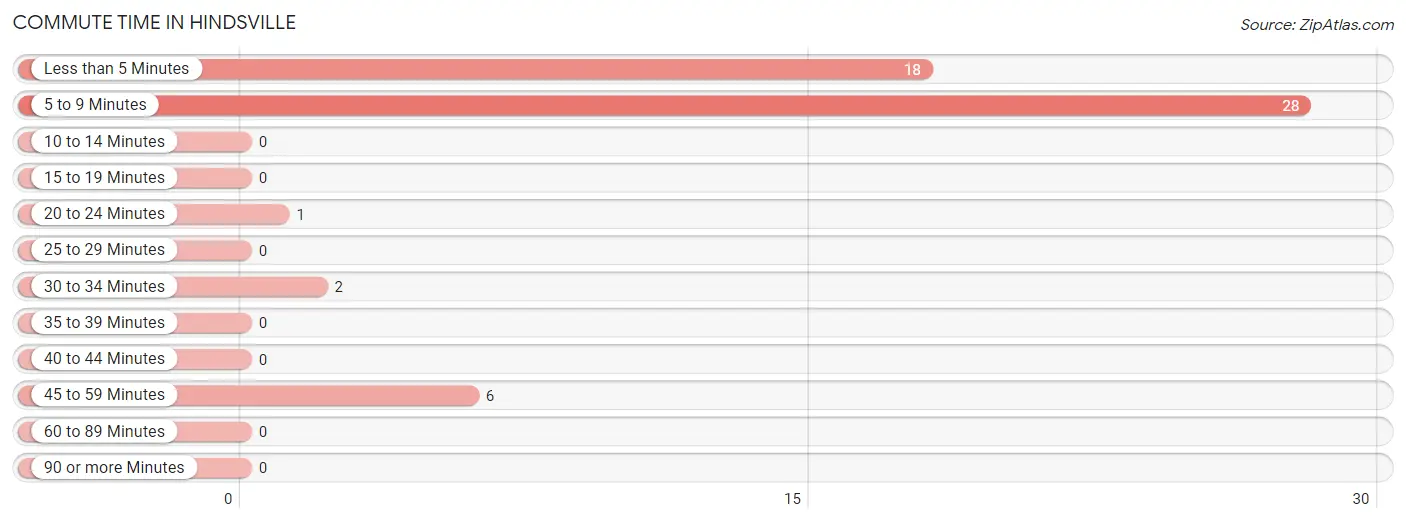
| Commute Time | # Commuters | % Commuters |
| Less than 5 Minutes | 18 | 32.7% |
| 5 to 9 Minutes | 28 | 50.9% |
| 10 to 14 Minutes | 0 | 0.0% |
| 15 to 19 Minutes | 0 | 0.0% |
| 20 to 24 Minutes | 1 | 1.8% |
| 25 to 29 Minutes | 0 | 0.0% |
| 30 to 34 Minutes | 2 | 3.6% |
| 35 to 39 Minutes | 0 | 0.0% |
| 40 to 44 Minutes | 0 | 0.0% |
| 45 to 59 Minutes | 6 | 10.9% |
| 60 to 89 Minutes | 0 | 0.0% |
| 90 or more Minutes | 0 | 0.0% |
Commute Time by Sex in Hindsville
The most common commute times in Hindsville are 5 to 9 minutes (28 commuters, 58.3%) for males and 45 to 59 minutes (6 commuters, 85.7%) for females.
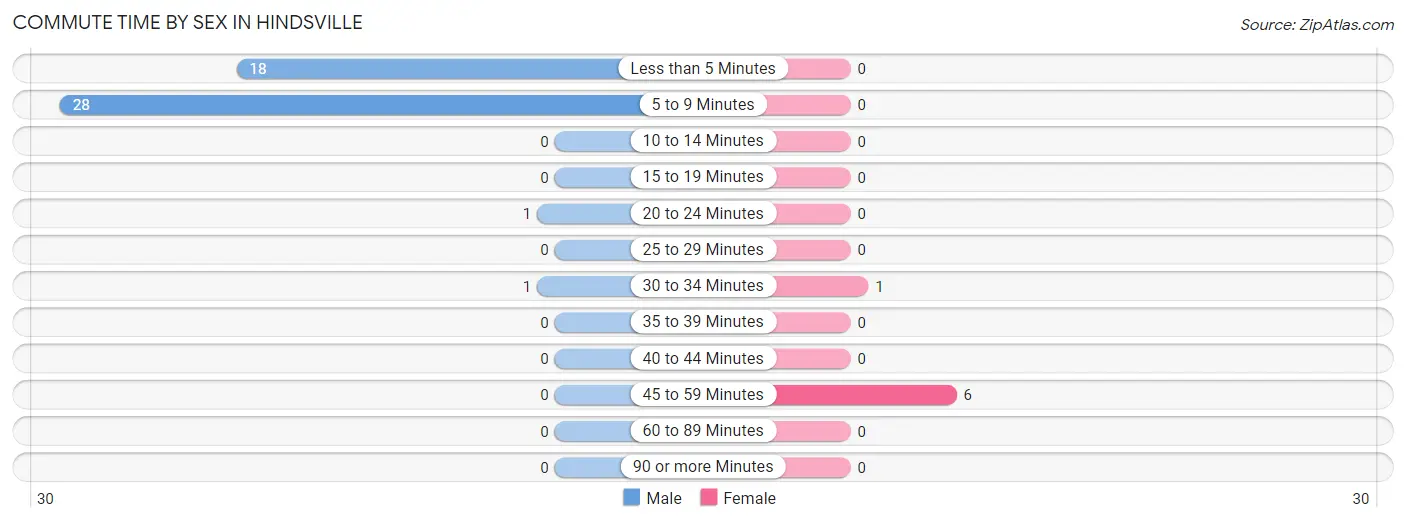
| Commute Time | Male | Female |
| Less than 5 Minutes | 18 (37.5%) | 0 (0.0%) |
| 5 to 9 Minutes | 28 (58.3%) | 0 (0.0%) |
| 10 to 14 Minutes | 0 (0.0%) | 0 (0.0%) |
| 15 to 19 Minutes | 0 (0.0%) | 0 (0.0%) |
| 20 to 24 Minutes | 1 (2.1%) | 0 (0.0%) |
| 25 to 29 Minutes | 0 (0.0%) | 0 (0.0%) |
| 30 to 34 Minutes | 1 (2.1%) | 1 (14.3%) |
| 35 to 39 Minutes | 0 (0.0%) | 0 (0.0%) |
| 40 to 44 Minutes | 0 (0.0%) | 0 (0.0%) |
| 45 to 59 Minutes | 0 (0.0%) | 6 (85.7%) |
| 60 to 89 Minutes | 0 (0.0%) | 0 (0.0%) |
| 90 or more Minutes | 0 (0.0%) | 0 (0.0%) |
Time of Departure to Work by Sex in Hindsville
The most frequent times of departure to work in Hindsville are 12:00 PM to 3:59 PM (28, 58.3%) for males and 6:30 AM to 6:59 AM (3, 42.9%) for females.
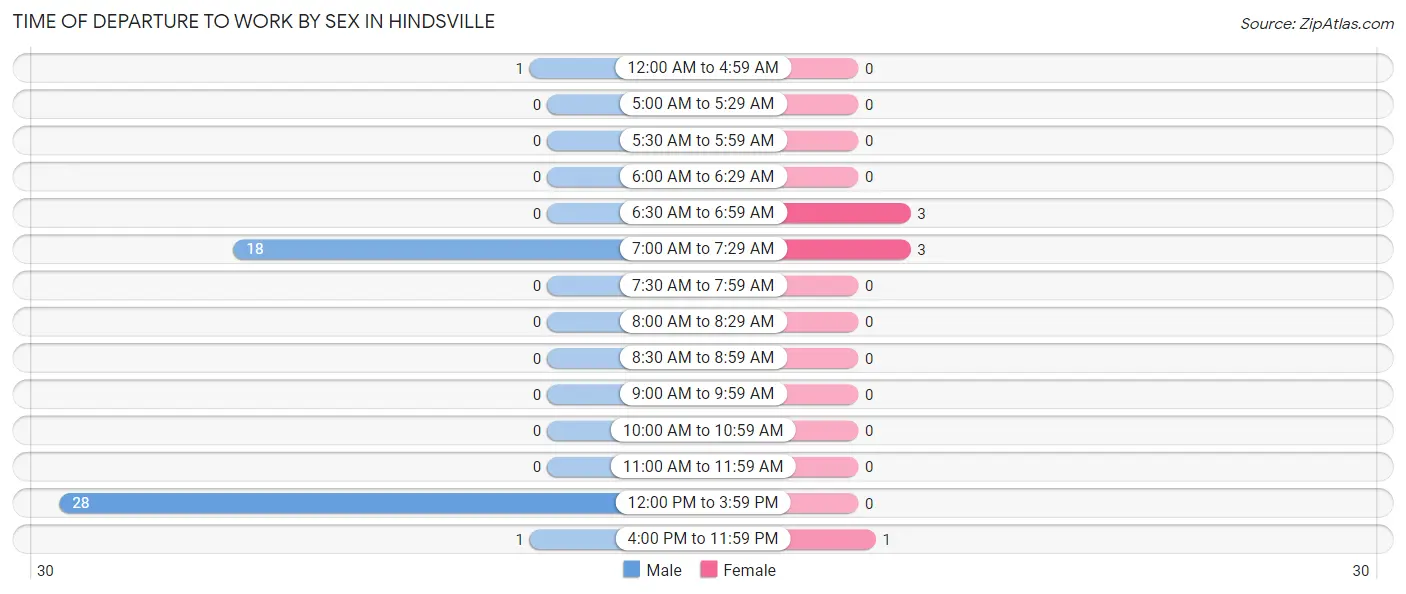
| Time of Departure | Male | Female |
| 12:00 AM to 4:59 AM | 1 (2.1%) | 0 (0.0%) |
| 5:00 AM to 5:29 AM | 0 (0.0%) | 0 (0.0%) |
| 5:30 AM to 5:59 AM | 0 (0.0%) | 0 (0.0%) |
| 6:00 AM to 6:29 AM | 0 (0.0%) | 0 (0.0%) |
| 6:30 AM to 6:59 AM | 0 (0.0%) | 3 (42.9%) |
| 7:00 AM to 7:29 AM | 18 (37.5%) | 3 (42.9%) |
| 7:30 AM to 7:59 AM | 0 (0.0%) | 0 (0.0%) |
| 8:00 AM to 8:29 AM | 0 (0.0%) | 0 (0.0%) |
| 8:30 AM to 8:59 AM | 0 (0.0%) | 0 (0.0%) |
| 9:00 AM to 9:59 AM | 0 (0.0%) | 0 (0.0%) |
| 10:00 AM to 10:59 AM | 0 (0.0%) | 0 (0.0%) |
| 11:00 AM to 11:59 AM | 0 (0.0%) | 0 (0.0%) |
| 12:00 PM to 3:59 PM | 28 (58.3%) | 0 (0.0%) |
| 4:00 PM to 11:59 PM | 1 (2.1%) | 1 (14.3%) |
| Total | 48 (100.0%) | 7 (100.0%) |
Housing Occupancy in Hindsville
Occupancy by Ownership in Hindsville
Of the total 56 dwellings in Hindsville, owner-occupied units account for 50 (89.3%), while renter-occupied units make up 6 (10.7%).
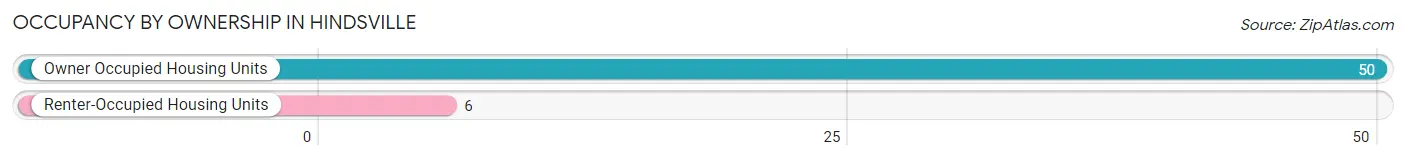
| Occupancy | # Housing Units | % Housing Units |
| Owner Occupied Housing Units | 50 | 89.3% |
| Renter-Occupied Housing Units | 6 | 10.7% |
| Total Occupied Housing Units | 56 | 100.0% |
Occupancy by Household Size in Hindsville
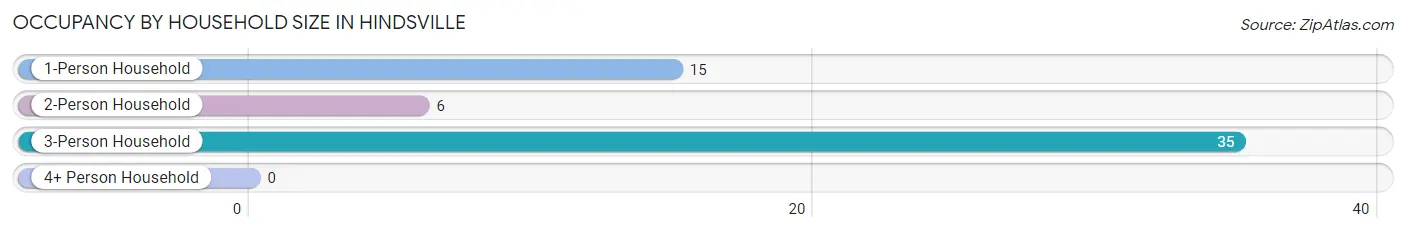
| Household Size | # Housing Units | % Housing Units |
| 1-Person Household | 15 | 26.8% |
| 2-Person Household | 6 | 10.7% |
| 3-Person Household | 35 | 62.5% |
| 4+ Person Household | 0 | 0.0% |
| Total Housing Units | 56 | 100.0% |
Occupancy by Ownership by Household Size in Hindsville
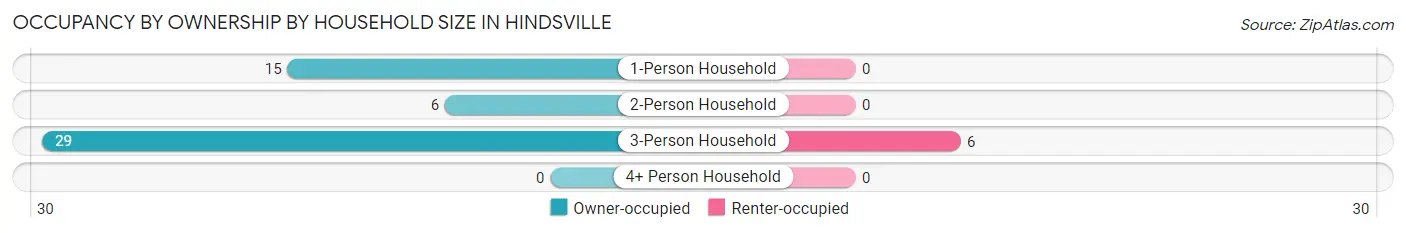
| Household Size | Owner-occupied | Renter-occupied |
| 1-Person Household | 15 (100.0%) | 0 (0.0%) |
| 2-Person Household | 6 (100.0%) | 0 (0.0%) |
| 3-Person Household | 29 (82.9%) | 6 (17.1%) |
| 4+ Person Household | 0 (0.0%) | 0 (0.0%) |
| Total Housing Units | 50 (89.3%) | 6 (10.7%) |
Occupancy by Educational Attainment in Hindsville
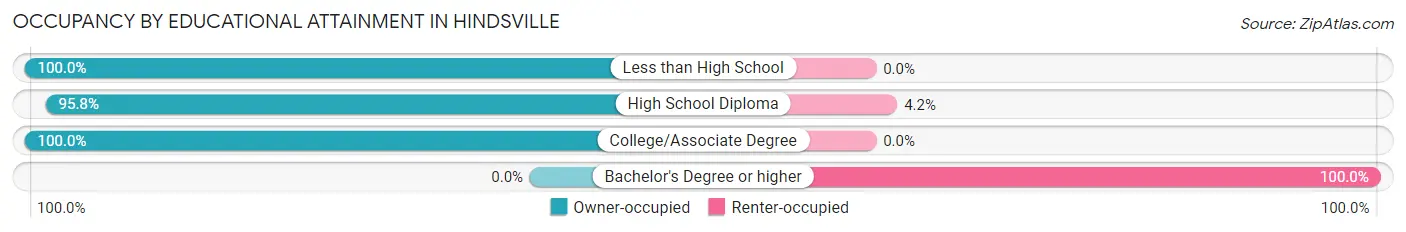
| Household Size | Owner-occupied | Renter-occupied |
| Less than High School | 3 (100.0%) | 0 (0.0%) |
| High School Diploma | 46 (95.8%) | 2 (4.2%) |
| College/Associate Degree | 1 (100.0%) | 0 (0.0%) |
| Bachelor's Degree or higher | 0 (0.0%) | 4 (100.0%) |
Occupancy by Age of Householder in Hindsville
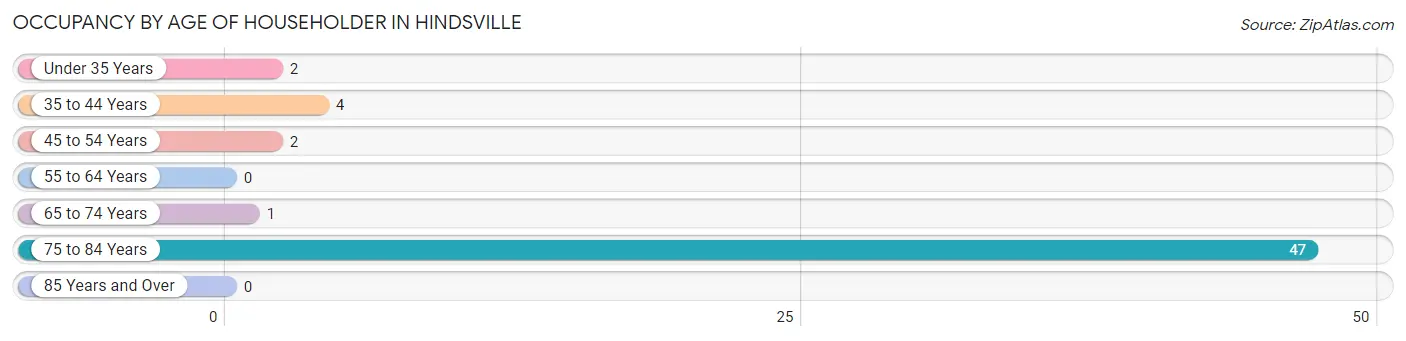
| Age Bracket | # Households | % Households |
| Under 35 Years | 2 | 3.6% |
| 35 to 44 Years | 4 | 7.1% |
| 45 to 54 Years | 2 | 3.6% |
| 55 to 64 Years | 0 | 0.0% |
| 65 to 74 Years | 1 | 1.8% |
| 75 to 84 Years | 47 | 83.9% |
| 85 Years and Over | 0 | 0.0% |
| Total | 56 | 100.0% |
Housing Finances in Hindsville
Median Income by Occupancy in Hindsville
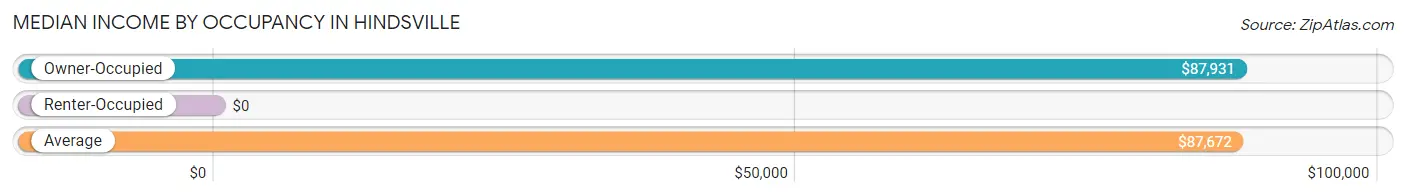
| Occupancy Type | # Households | Median Income |
| Owner-Occupied | 50 (89.3%) | $87,931 |
| Renter-Occupied | 6 (10.7%) | $0 |
| Average | 56 (100.0%) | $87,672 |
Occupancy by Householder Income Bracket in Hindsville
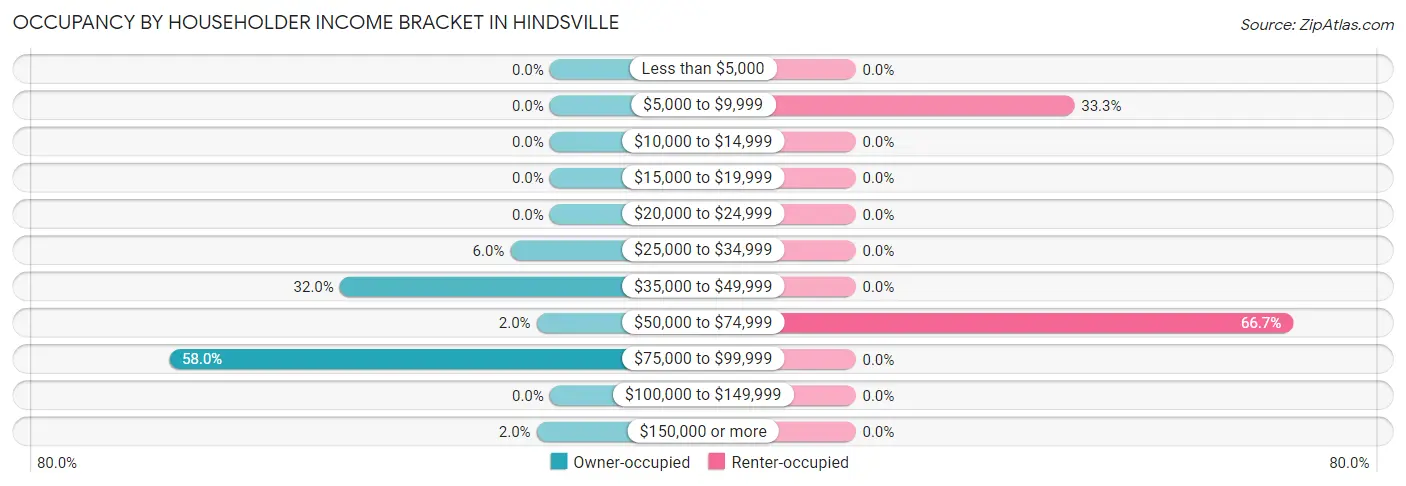
| Income Bracket | Owner-occupied | Renter-occupied |
| Less than $5,000 | 0 (0.0%) | 0 (0.0%) |
| $5,000 to $9,999 | 0 (0.0%) | 2 (33.3%) |
| $10,000 to $14,999 | 0 (0.0%) | 0 (0.0%) |
| $15,000 to $19,999 | 0 (0.0%) | 0 (0.0%) |
| $20,000 to $24,999 | 0 (0.0%) | 0 (0.0%) |
| $25,000 to $34,999 | 3 (6.0%) | 0 (0.0%) |
| $35,000 to $49,999 | 16 (32.0%) | 0 (0.0%) |
| $50,000 to $74,999 | 1 (2.0%) | 4 (66.7%) |
| $75,000 to $99,999 | 29 (58.0%) | 0 (0.0%) |
| $100,000 to $149,999 | 0 (0.0%) | 0 (0.0%) |
| $150,000 or more | 1 (2.0%) | 0 (0.0%) |
| Total | 50 (100.0%) | 6 (100.0%) |
Monthly Housing Cost Tiers in Hindsville
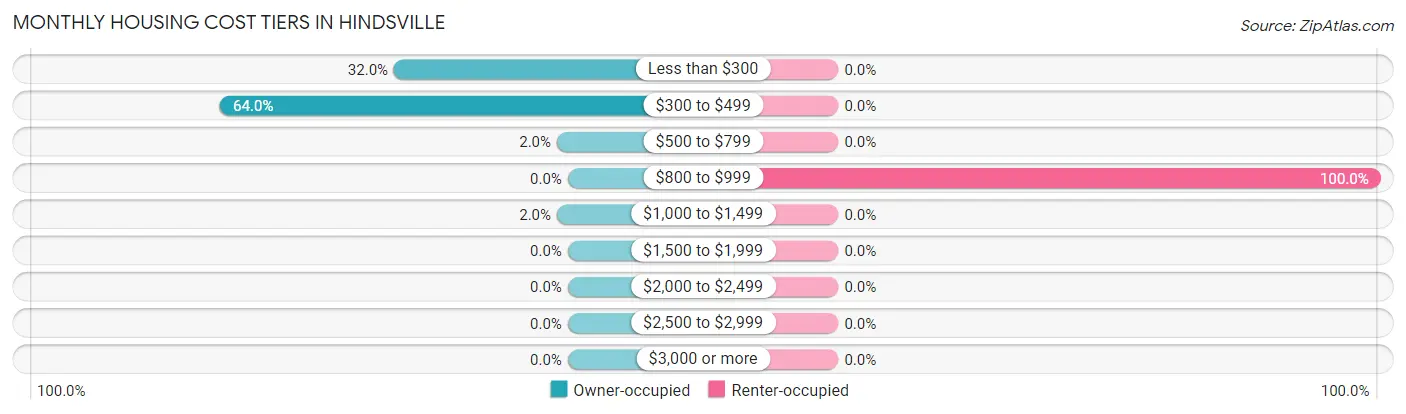
| Monthly Cost | Owner-occupied | Renter-occupied |
| Less than $300 | 16 (32.0%) | 0 (0.0%) |
| $300 to $499 | 32 (64.0%) | 0 (0.0%) |
| $500 to $799 | 1 (2.0%) | 0 (0.0%) |
| $800 to $999 | 0 (0.0%) | 6 (100.0%) |
| $1,000 to $1,499 | 1 (2.0%) | 0 (0.0%) |
| $1,500 to $1,999 | 0 (0.0%) | 0 (0.0%) |
| $2,000 to $2,499 | 0 (0.0%) | 0 (0.0%) |
| $2,500 to $2,999 | 0 (0.0%) | 0 (0.0%) |
| $3,000 or more | 0 (0.0%) | 0 (0.0%) |
| Total | 50 (100.0%) | 6 (100.0%) |
Physical Housing Characteristics in Hindsville
Housing Structures in Hindsville
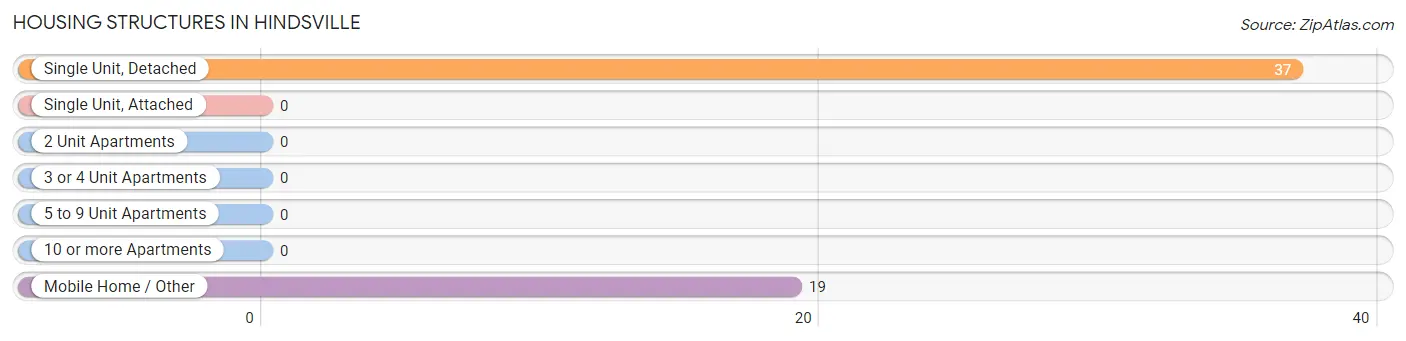
| Structure Type | # Housing Units | % Housing Units |
| Single Unit, Detached | 37 | 66.1% |
| Single Unit, Attached | 0 | 0.0% |
| 2 Unit Apartments | 0 | 0.0% |
| 3 or 4 Unit Apartments | 0 | 0.0% |
| 5 to 9 Unit Apartments | 0 | 0.0% |
| 10 or more Apartments | 0 | 0.0% |
| Mobile Home / Other | 19 | 33.9% |
| Total | 56 | 100.0% |
Housing Structures by Occupancy in Hindsville
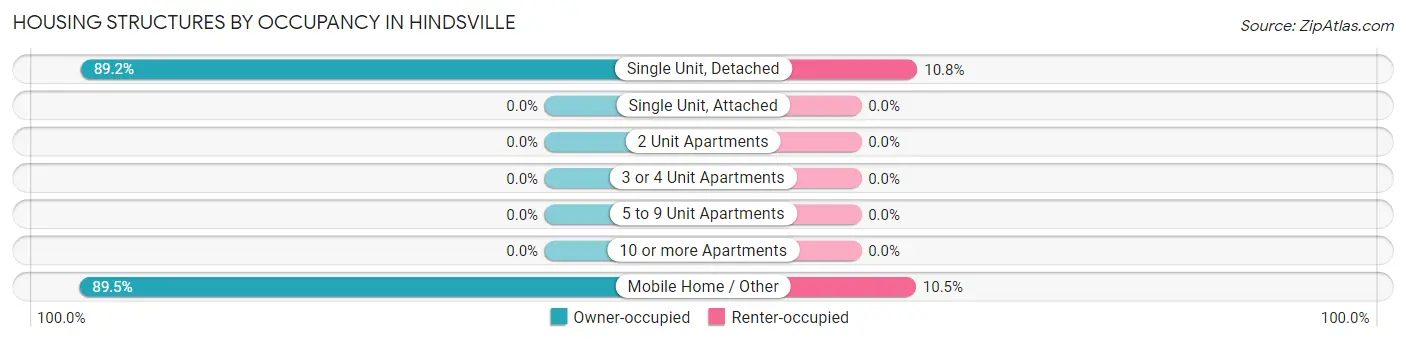
| Structure Type | Owner-occupied | Renter-occupied |
| Single Unit, Detached | 33 (89.2%) | 4 (10.8%) |
| Single Unit, Attached | 0 (0.0%) | 0 (0.0%) |
| 2 Unit Apartments | 0 (0.0%) | 0 (0.0%) |
| 3 or 4 Unit Apartments | 0 (0.0%) | 0 (0.0%) |
| 5 to 9 Unit Apartments | 0 (0.0%) | 0 (0.0%) |
| 10 or more Apartments | 0 (0.0%) | 0 (0.0%) |
| Mobile Home / Other | 17 (89.5%) | 2 (10.5%) |
| Total | 50 (89.3%) | 6 (10.7%) |
Housing Structures by Number of Rooms in Hindsville
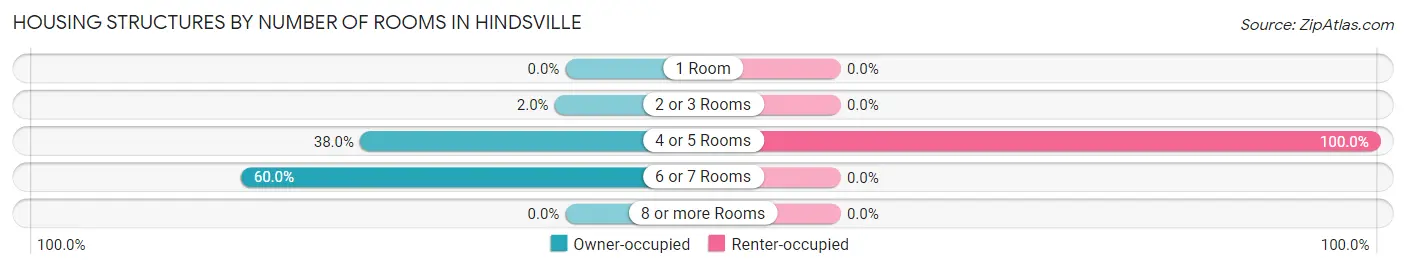
| Number of Rooms | Owner-occupied | Renter-occupied |
| 1 Room | 0 (0.0%) | 0 (0.0%) |
| 2 or 3 Rooms | 1 (2.0%) | 0 (0.0%) |
| 4 or 5 Rooms | 19 (38.0%) | 6 (100.0%) |
| 6 or 7 Rooms | 30 (60.0%) | 0 (0.0%) |
| 8 or more Rooms | 0 (0.0%) | 0 (0.0%) |
| Total | 50 (100.0%) | 6 (100.0%) |
Housing Structure by Heating Type in Hindsville
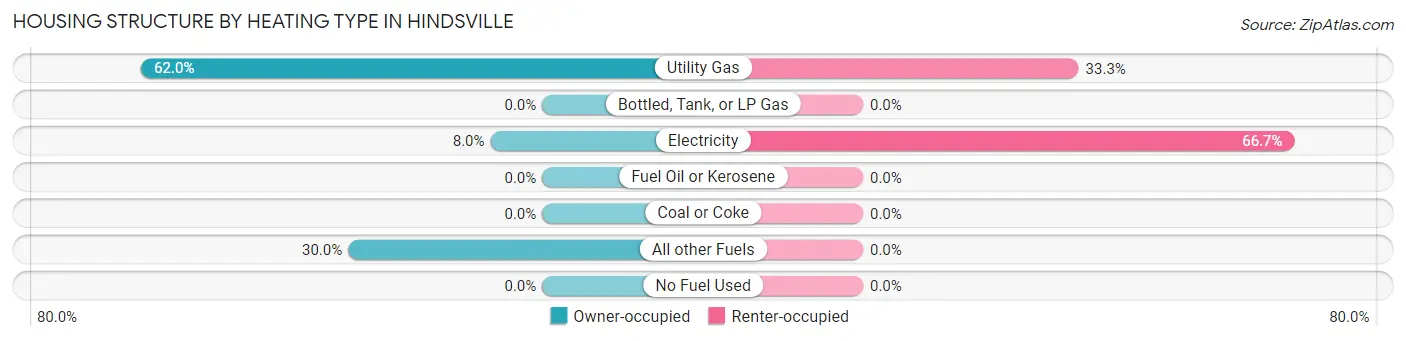
| Heating Type | Owner-occupied | Renter-occupied |
| Utility Gas | 31 (62.0%) | 2 (33.3%) |
| Bottled, Tank, or LP Gas | 0 (0.0%) | 0 (0.0%) |
| Electricity | 4 (8.0%) | 4 (66.7%) |
| Fuel Oil or Kerosene | 0 (0.0%) | 0 (0.0%) |
| Coal or Coke | 0 (0.0%) | 0 (0.0%) |
| All other Fuels | 15 (30.0%) | 0 (0.0%) |
| No Fuel Used | 0 (0.0%) | 0 (0.0%) |
| Total | 50 (100.0%) | 6 (100.0%) |
Household Vehicle Usage in Hindsville
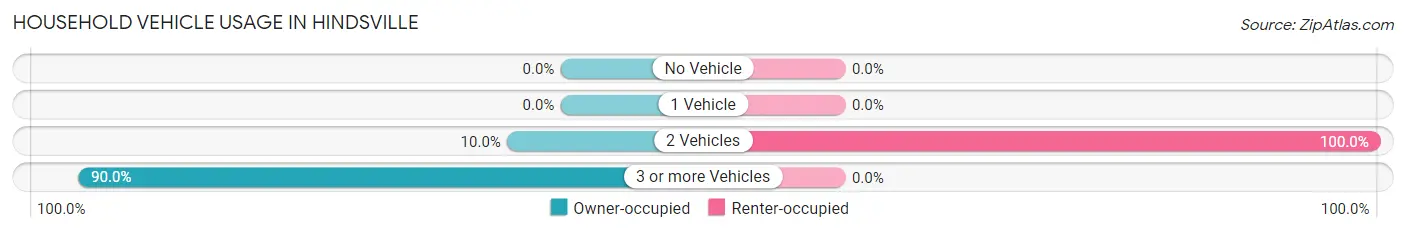
| Vehicles per Household | Owner-occupied | Renter-occupied |
| No Vehicle | 0 (0.0%) | 0 (0.0%) |
| 1 Vehicle | 0 (0.0%) | 0 (0.0%) |
| 2 Vehicles | 5 (10.0%) | 6 (100.0%) |
| 3 or more Vehicles | 45 (90.0%) | 0 (0.0%) |
| Total | 50 (100.0%) | 6 (100.0%) |
Real Estate & Mortgages in Hindsville
Real Estate and Mortgage Overview in Hindsville
| Characteristic | Without Mortgage | With Mortgage |
| Housing Units | 49 | 1 |
| Median Property Value | $82,600 | $0 |
| Median Household Income | $87,888 | $1 |
| Monthly Housing Costs | $314 | $0 |
| Real Estate Taxes | $199 | $1 |
Property Value by Mortgage Status in Hindsville
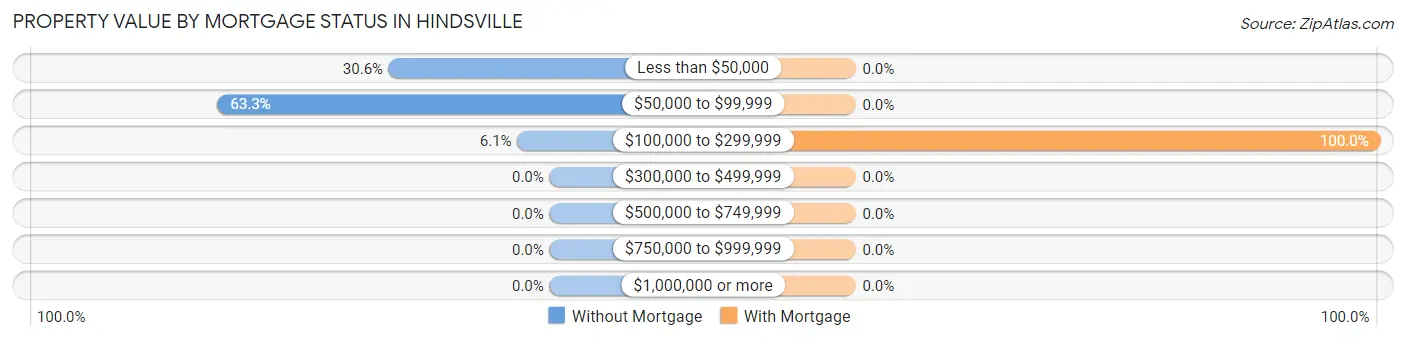
| Property Value | Without Mortgage | With Mortgage |
| Less than $50,000 | 15 (30.6%) | 0 (0.0%) |
| $50,000 to $99,999 | 31 (63.3%) | 0 (0.0%) |
| $100,000 to $299,999 | 3 (6.1%) | 1 (100.0%) |
| $300,000 to $499,999 | 0 (0.0%) | 0 (0.0%) |
| $500,000 to $749,999 | 0 (0.0%) | 0 (0.0%) |
| $750,000 to $999,999 | 0 (0.0%) | 0 (0.0%) |
| $1,000,000 or more | 0 (0.0%) | 0 (0.0%) |
| Total | 49 (100.0%) | 1 (100.0%) |
Household Income by Mortgage Status in Hindsville
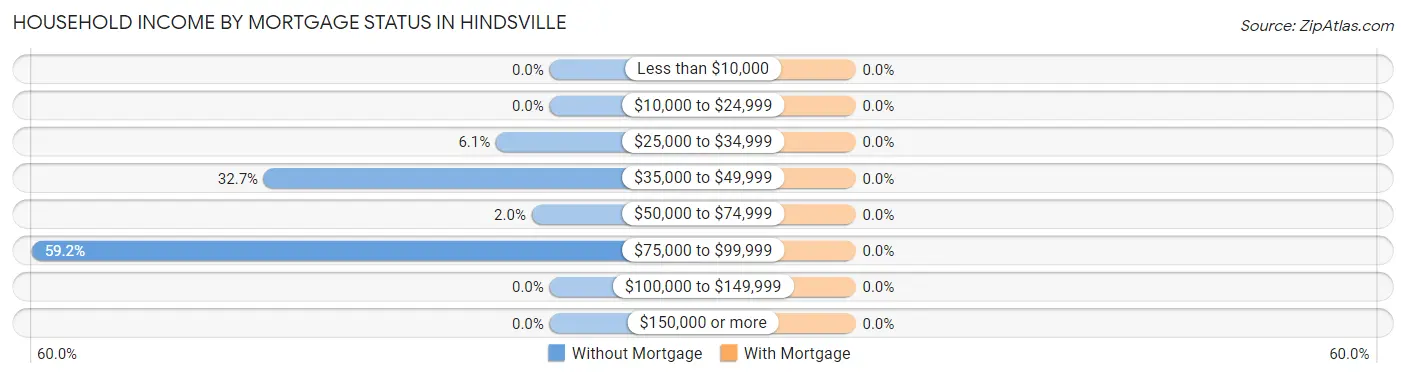
| Household Income | Without Mortgage | With Mortgage |
| Less than $10,000 | 0 (0.0%) | 0 (0.0%) |
| $10,000 to $24,999 | 0 (0.0%) | 0 (0.0%) |
| $25,000 to $34,999 | 3 (6.1%) | 0 (0.0%) |
| $35,000 to $49,999 | 16 (32.7%) | 0 (0.0%) |
| $50,000 to $74,999 | 1 (2.0%) | 0 (0.0%) |
| $75,000 to $99,999 | 29 (59.2%) | 0 (0.0%) |
| $100,000 to $149,999 | 0 (0.0%) | 0 (0.0%) |
| $150,000 or more | 0 (0.0%) | 0 (0.0%) |
| Total | 49 (100.0%) | 1 (100.0%) |
Property Value to Household Income Ratio in Hindsville
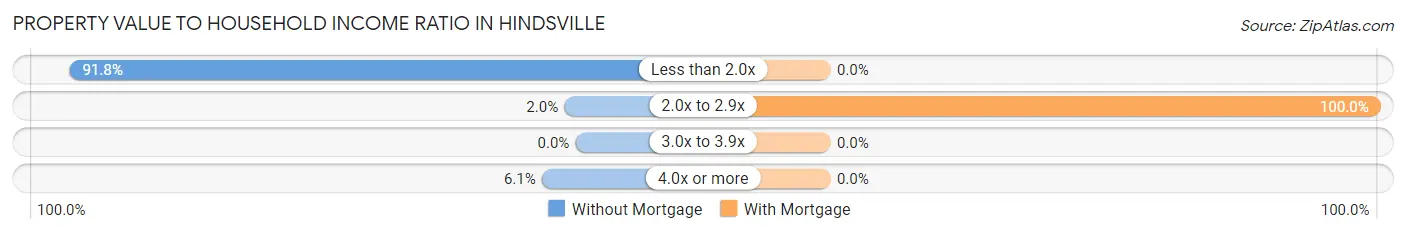
| Value-to-Income Ratio | Without Mortgage | With Mortgage |
| Less than 2.0x | 45 (91.8%) | 0 (0.0%) |
| 2.0x to 2.9x | 1 (2.0%) | 1 (100.0%) |
| 3.0x to 3.9x | 0 (0.0%) | 0 (0.0%) |
| 4.0x or more | 3 (6.1%) | 0 (0.0%) |
| Total | 49 (100.0%) | 1 (100.0%) |
Real Estate Taxes by Mortgage Status in Hindsville
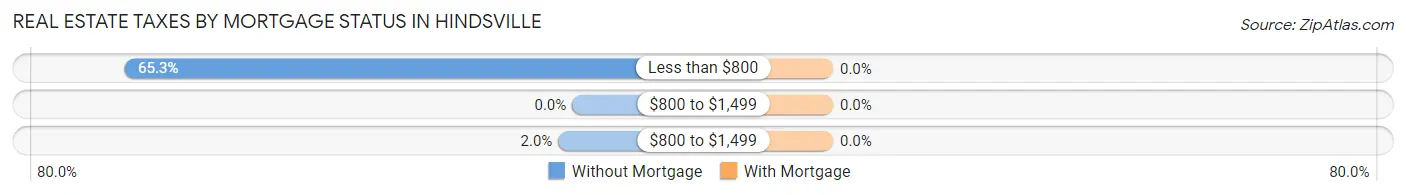
| Property Taxes | Without Mortgage | With Mortgage |
| Less than $800 | 32 (65.3%) | 0 (0.0%) |
| $800 to $1,499 | 0 (0.0%) | 0 (0.0%) |
| $800 to $1,499 | 1 (2.0%) | 0 (0.0%) |
| Total | 49 (100.0%) | 1 (100.0%) |
Health & Disability in Hindsville
Health Insurance Coverage by Age in Hindsville
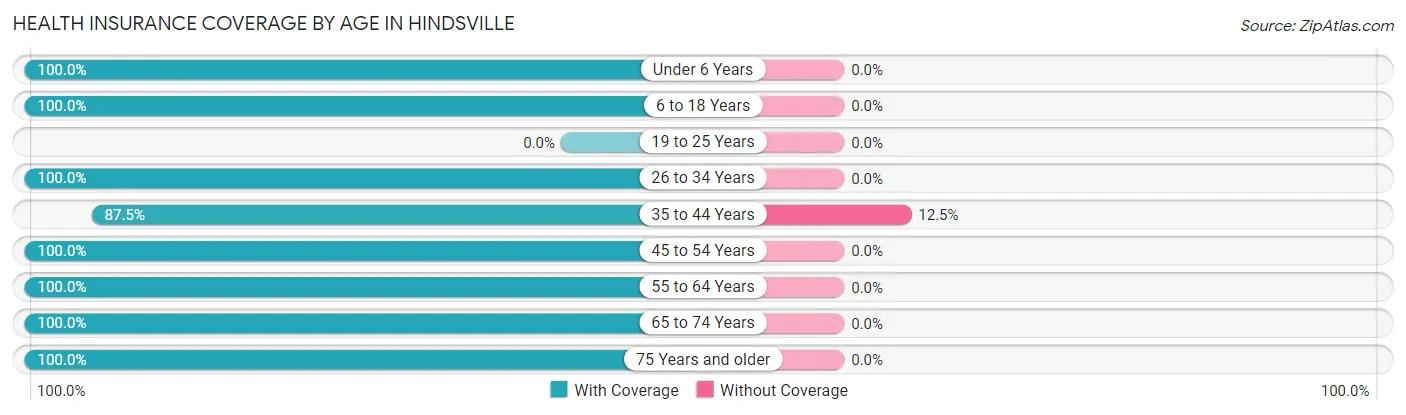
| Age Bracket | With Coverage | Without Coverage |
| Under 6 Years | 3 (100.0%) | 0 (0.0%) |
| 6 to 18 Years | 7 (100.0%) | 0 (0.0%) |
| 19 to 25 Years | 0 (0.0%) | 0 (0.0%) |
| 26 to 34 Years | 2 (100.0%) | 0 (0.0%) |
| 35 to 44 Years | 7 (87.5%) | 1 (12.5%) |
| 45 to 54 Years | 2 (100.0%) | 0 (0.0%) |
| 55 to 64 Years | 29 (100.0%) | 0 (0.0%) |
| 65 to 74 Years | 2 (100.0%) | 0 (0.0%) |
| 75 Years and older | 67 (100.0%) | 0 (0.0%) |
| Total | 119 (99.2%) | 1 (0.8%) |
Health Insurance Coverage by Citizenship Status in Hindsville
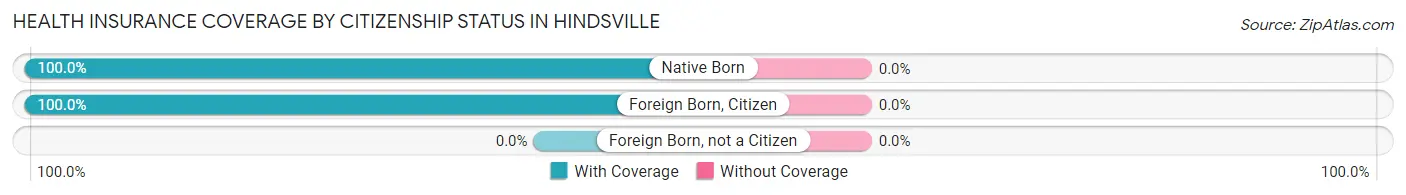
| Citizenship Status | With Coverage | Without Coverage |
| Native Born | 3 (100.0%) | 0 (0.0%) |
| Foreign Born, Citizen | 7 (100.0%) | 0 (0.0%) |
| Foreign Born, not a Citizen | 0 (0.0%) | 0 (0.0%) |
Health Insurance Coverage by Household Income in Hindsville
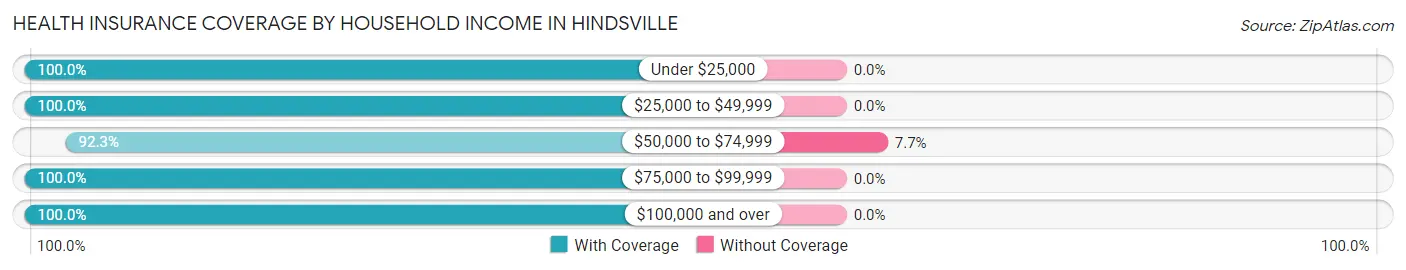
| Household Income | With Coverage | Without Coverage |
| Under $25,000 | 8 (100.0%) | 0 (0.0%) |
| $25,000 to $49,999 | 22 (100.0%) | 0 (0.0%) |
| $50,000 to $74,999 | 12 (92.3%) | 1 (7.7%) |
| $75,000 to $99,999 | 75 (100.0%) | 0 (0.0%) |
| $100,000 and over | 2 (100.0%) | 0 (0.0%) |
Public vs Private Health Insurance Coverage by Age in Hindsville
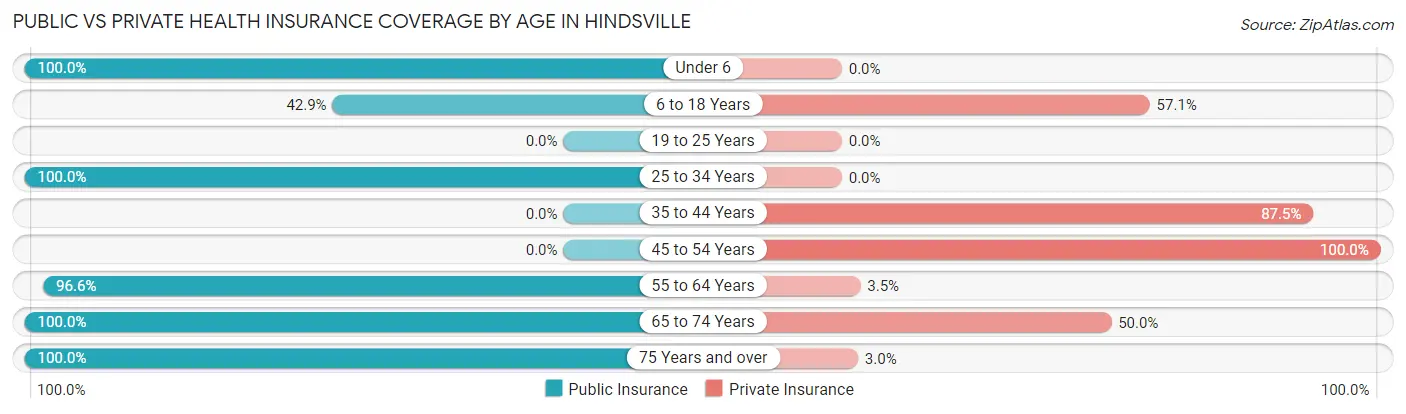
| Age Bracket | Public Insurance | Private Insurance |
| Under 6 | 3 (100.0%) | 0 (0.0%) |
| 6 to 18 Years | 3 (42.9%) | 4 (57.1%) |
| 19 to 25 Years | 0 (0.0%) | 0 (0.0%) |
| 25 to 34 Years | 2 (100.0%) | 0 (0.0%) |
| 35 to 44 Years | 0 (0.0%) | 7 (87.5%) |
| 45 to 54 Years | 0 (0.0%) | 2 (100.0%) |
| 55 to 64 Years | 28 (96.6%) | 1 (3.5%) |
| 65 to 74 Years | 2 (100.0%) | 1 (50.0%) |
| 75 Years and over | 67 (100.0%) | 2 (3.0%) |
| Total | 105 (87.5%) | 17 (14.2%) |
Disability Status by Sex by Age in Hindsville
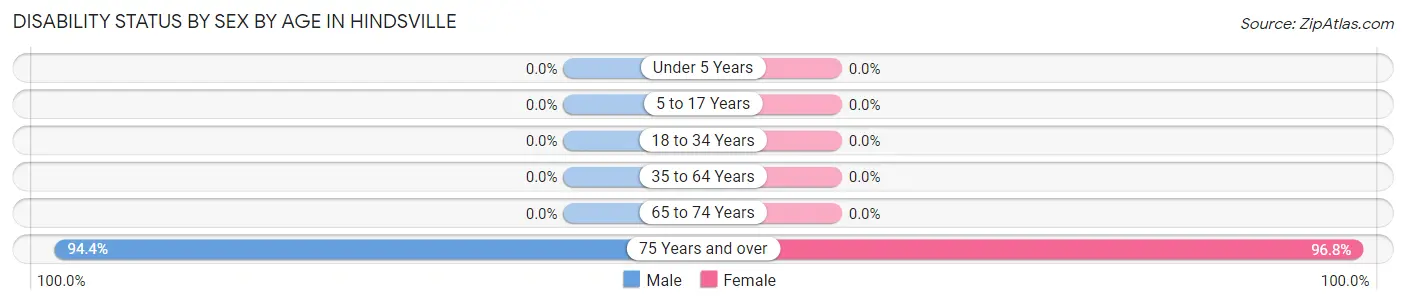
| Age Bracket | Male | Female |
| Under 5 Years | 0 (0.0%) | 0 (0.0%) |
| 5 to 17 Years | 0 (0.0%) | 0 (0.0%) |
| 18 to 34 Years | 0 (0.0%) | 0 (0.0%) |
| 35 to 64 Years | 0 (0.0%) | 0 (0.0%) |
| 65 to 74 Years | 0 (0.0%) | 0 (0.0%) |
| 75 Years and over | 34 (94.4%) | 30 (96.8%) |
Disability Class by Sex by Age in Hindsville
Disability Class: Hearing Difficulty
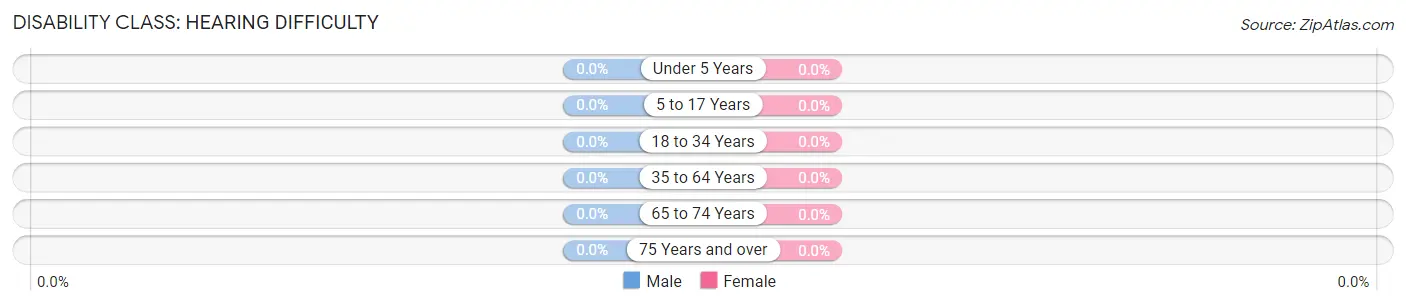
| Age Bracket | Male | Female |
| Under 5 Years | 0 (0.0%) | 0 (0.0%) |
| 5 to 17 Years | 0 (0.0%) | 0 (0.0%) |
| 18 to 34 Years | 0 (0.0%) | 0 (0.0%) |
| 35 to 64 Years | 0 (0.0%) | 0 (0.0%) |
| 65 to 74 Years | 0 (0.0%) | 0 (0.0%) |
| 75 Years and over | 0 (0.0%) | 0 (0.0%) |
Disability Class: Vision Difficulty
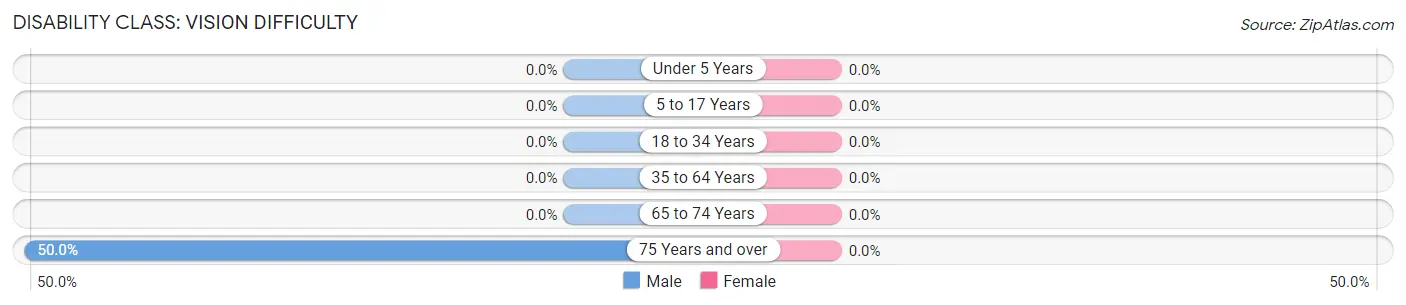
| Age Bracket | Male | Female |
| Under 5 Years | 0 (0.0%) | 0 (0.0%) |
| 5 to 17 Years | 0 (0.0%) | 0 (0.0%) |
| 18 to 34 Years | 0 (0.0%) | 0 (0.0%) |
| 35 to 64 Years | 0 (0.0%) | 0 (0.0%) |
| 65 to 74 Years | 0 (0.0%) | 0 (0.0%) |
| 75 Years and over | 18 (50.0%) | 0 (0.0%) |
Disability Class: Cognitive Difficulty
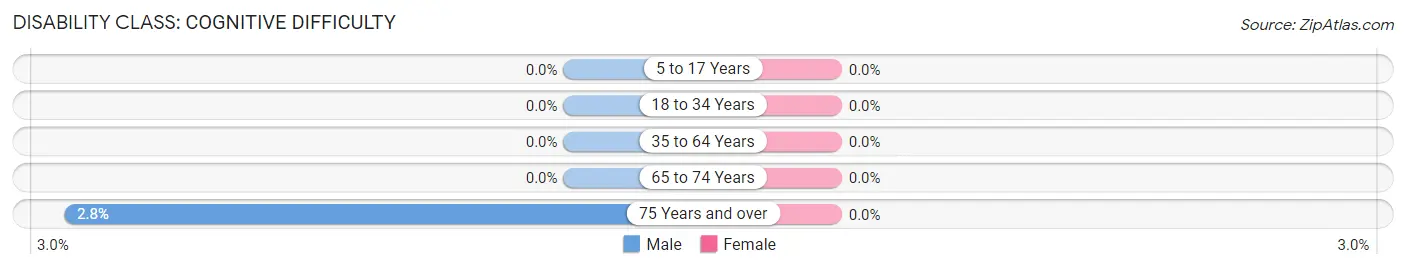
| Age Bracket | Male | Female |
| 5 to 17 Years | 0 (0.0%) | 0 (0.0%) |
| 18 to 34 Years | 0 (0.0%) | 0 (0.0%) |
| 35 to 64 Years | 0 (0.0%) | 0 (0.0%) |
| 65 to 74 Years | 0 (0.0%) | 0 (0.0%) |
| 75 Years and over | 1 (2.8%) | 0 (0.0%) |
Disability Class: Ambulatory Difficulty
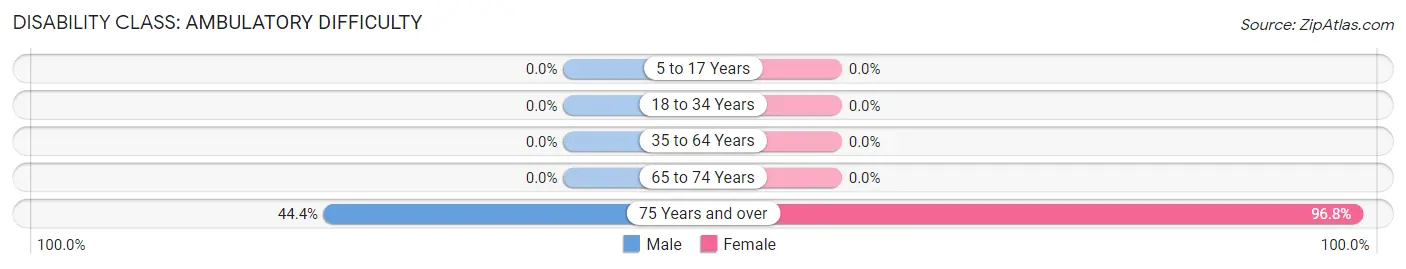
| Age Bracket | Male | Female |
| 5 to 17 Years | 0 (0.0%) | 0 (0.0%) |
| 18 to 34 Years | 0 (0.0%) | 0 (0.0%) |
| 35 to 64 Years | 0 (0.0%) | 0 (0.0%) |
| 65 to 74 Years | 0 (0.0%) | 0 (0.0%) |
| 75 Years and over | 16 (44.4%) | 30 (96.8%) |
Disability Class: Self-Care Difficulty
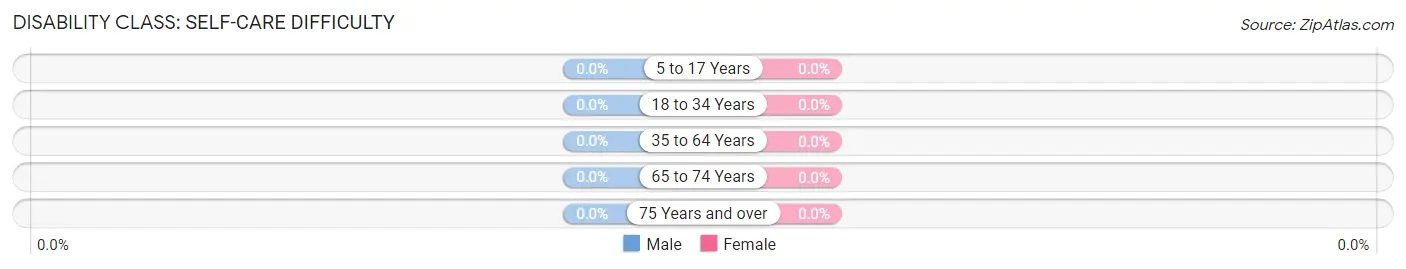
| Age Bracket | Male | Female |
| 5 to 17 Years | 0 (0.0%) | 0 (0.0%) |
| 18 to 34 Years | 0 (0.0%) | 0 (0.0%) |
| 35 to 64 Years | 0 (0.0%) | 0 (0.0%) |
| 65 to 74 Years | 0 (0.0%) | 0 (0.0%) |
| 75 Years and over | 0 (0.0%) | 0 (0.0%) |
Technology Access in Hindsville
Computing Device Access in Hindsville
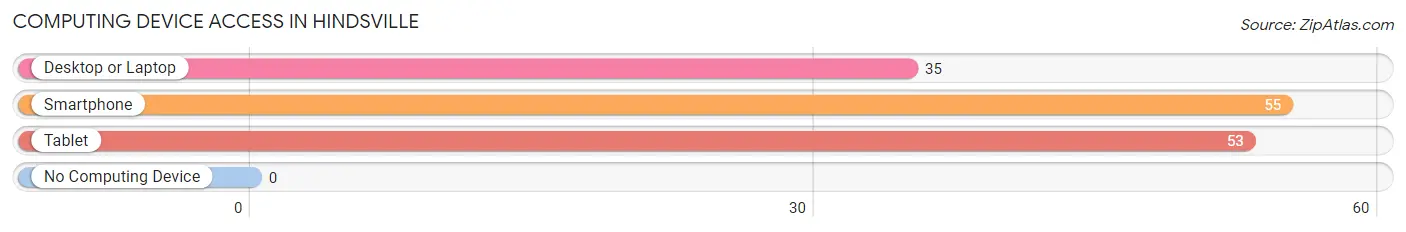
| Device Type | # Households | % Households |
| Desktop or Laptop | 35 | 62.5% |
| Smartphone | 55 | 98.2% |
| Tablet | 53 | 94.6% |
| No Computing Device | 0 | 0.0% |
| Total | 56 | 100.0% |
Internet Access in Hindsville
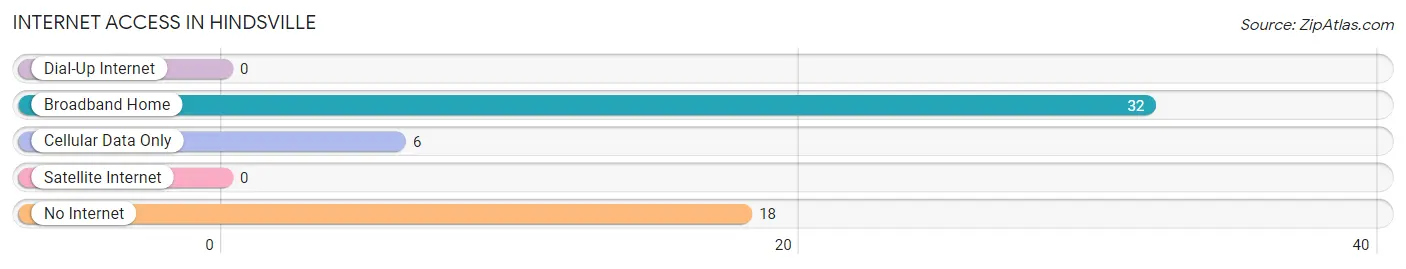
| Internet Type | # Households | % Households |
| Dial-Up Internet | 0 | 0.0% |
| Broadband Home | 32 | 57.1% |
| Cellular Data Only | 6 | 10.7% |
| Satellite Internet | 0 | 0.0% |
| No Internet | 18 | 32.1% |
| Total | 56 | 100.0% |
Hindsville Summary
Hindsville is a small town located in Madison County, Arkansas, United States. The town is situated in the Ozark Mountains, and is part of the Northwest Arkansas region. The population of Hindsville was 545 at the 2010 census.
History
Hindsville was founded in 1883 by William Hinds, a local farmer. The town was originally known as Hindsville Station, and was a stop on the St. Louis and San Francisco Railway. The town was officially incorporated in 1887.
In the early 1900s, Hindsville was a thriving agricultural community, with cotton, corn, and other crops being grown in the area. The town also had a sawmill, a gristmill, and a cotton gin.
In the 1950s, Hindsville began to decline as the railroad stopped running through the town. The population of the town decreased, and many businesses closed.
Geography
Hindsville is located in the Ozark Mountains of Northwest Arkansas. The town is situated at the intersection of Arkansas Highway 45 and Arkansas Highway 74.
The town is located in the Ozark National Forest, and is surrounded by rolling hills and forests. The nearest major city is Fayetteville, which is about 25 miles away.
Economy
Hindsville’s economy is largely based on agriculture. The town is home to several farms, which produce a variety of crops, including cotton, corn, soybeans, and wheat.
The town also has a few small businesses, including a grocery store, a hardware store, and a few restaurants.
Demographics
As of the 2010 census, the population of Hindsville was 545. The racial makeup of the town was 97.3% White, 0.2% African American, 0.4% Native American, 0.2% Asian, 0.2% from other races, and 1.7% from two or more races.
The median household income in Hindsville was $31,250, and the median family income was $37,500. The per capita income was $15,945. About 16.2% of the population was below the poverty line.
Conclusion
Hindsville is a small town located in the Ozark Mountains of Northwest Arkansas. The town was founded in 1883, and was once a thriving agricultural community. Today, the town’s economy is largely based on agriculture, and the population is 545. The town is home to several farms, and has a few small businesses. The median household income in Hindsville is $31,250, and the per capita income is $15,945.
Common Questions
What is Per Capita Income in Hindsville?
Per Capita income in Hindsville is $26,630.
What is the Median Family Income in Hindsville?
Median Family Income in Hindsville is $88,405.
What is the Median Household income in Hindsville?
Median Household Income in Hindsville is $87,672.
What is Inequality or Gini Index in Hindsville?
Inequality or Gini Index in Hindsville is 0.23.
What is the Total Population of Hindsville?
Total Population of Hindsville is 120.
What is the Total Male Population of Hindsville?
Total Male Population of Hindsville is 75.
What is the Total Female Population of Hindsville?
Total Female Population of Hindsville is 45.
What is the Ratio of Males per 100 Females in Hindsville?
There are 166.67 Males per 100 Females in Hindsville.
What is the Ratio of Females per 100 Males in Hindsville?
There are 60.00 Females per 100 Males in Hindsville.
What is the Median Population Age in Hindsville?
Median Population Age in Hindsville is 75.4 Years.
What is the Average Family Size in Hindsville
Average Family Size in Hindsville is 2.6 People.
What is the Average Household Size in Hindsville
Average Household Size in Hindsville is 2.1 People.
How Large is the Labor Force in Hindsville?
There are 59 People in the Labor Forcein in Hindsville.
What is the Percentage of People in the Labor Force in Hindsville?
51.8% of People are in the Labor Force in Hindsville.