Fargo, AR Map & Demographics
Fargo Map
Fargo Overview
$18,597
PER CAPITA INCOME
0.62
INEQUALITY / GINI INDEX
61
TOTAL POPULATION
24
MALE POPULATION
37
FEMALE POPULATION
64.86
MALES / 100 FEMALES
154.17
FEMALES / 100 MALES
54.5
MEDIAN AGE
3.8
AVG FAMILY SIZE
2.3
AVG HOUSEHOLD SIZE
23
LABOR FORCE [ PEOPLE ]
45.1%
PERCENT IN LABOR FORCE
Income in Fargo
Income Overview in Fargo
| Characteristic | Number | Measure |
| Per Capita Income | 61 | $18,597 |
| Median Family Income | 9 | $0 |
| Mean Family Income | 9 | $80,089 |
| Median Household Income | 27 | $0 |
| Mean Household Income | 27 | $35,837 |
| Income Deficit | 9 | $0 |
| Wage / Income Gap (%) | 61 | 0.00% |
| Wage / Income Gap ($) | 61 | 100.00¢ per $1 |
| Gini / Inequality Index | 61 | 0.62 |
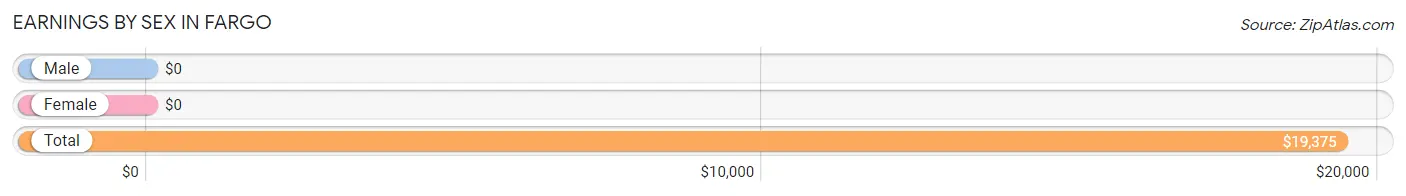
Earnings by Sex in Fargo
| Sex | Number | Average Earnings |
| Male | 13 (56.5%) | $0 |
| Female | 10 (43.5%) | $0 |
| Total | 23 (100.0%) | $19,375 |
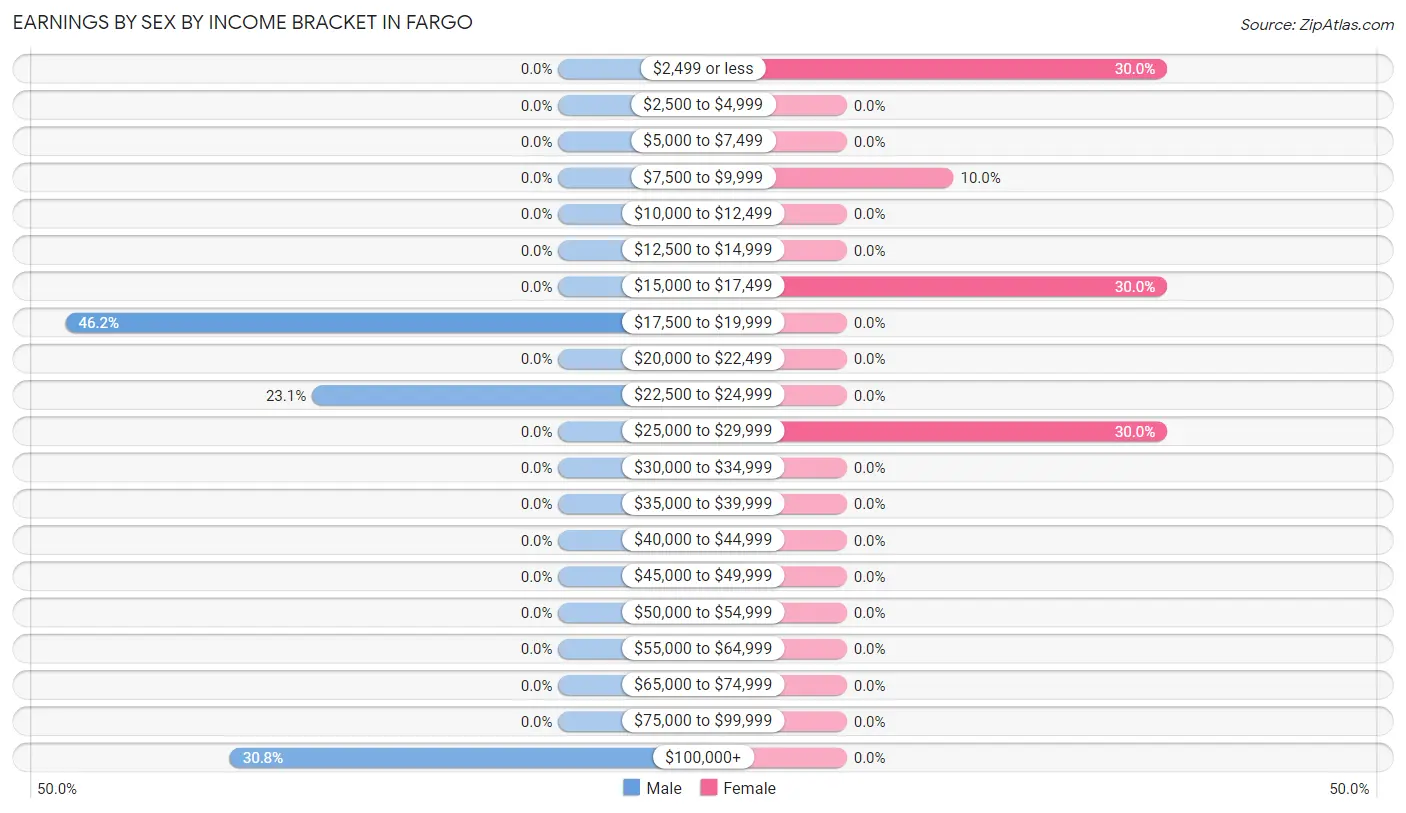
Earnings by Sex by Income Bracket in Fargo
The most common earnings brackets in Fargo are $17,500 to $19,999 for men (6 | 46.2%) and $2,499 or less for women (3 | 30.0%).
| Income | Male | Female |
| $2,499 or less | 0 (0.0%) | 3 (30.0%) |
| $2,500 to $4,999 | 0 (0.0%) | 0 (0.0%) |
| $5,000 to $7,499 | 0 (0.0%) | 0 (0.0%) |
| $7,500 to $9,999 | 0 (0.0%) | 1 (10.0%) |
| $10,000 to $12,499 | 0 (0.0%) | 0 (0.0%) |
| $12,500 to $14,999 | 0 (0.0%) | 0 (0.0%) |
| $15,000 to $17,499 | 0 (0.0%) | 3 (30.0%) |
| $17,500 to $19,999 | 6 (46.2%) | 0 (0.0%) |
| $20,000 to $22,499 | 0 (0.0%) | 0 (0.0%) |
| $22,500 to $24,999 | 3 (23.1%) | 0 (0.0%) |
| $25,000 to $29,999 | 0 (0.0%) | 3 (30.0%) |
| $30,000 to $34,999 | 0 (0.0%) | 0 (0.0%) |
| $35,000 to $39,999 | 0 (0.0%) | 0 (0.0%) |
| $40,000 to $44,999 | 0 (0.0%) | 0 (0.0%) |
| $45,000 to $49,999 | 0 (0.0%) | 0 (0.0%) |
| $50,000 to $54,999 | 0 (0.0%) | 0 (0.0%) |
| $55,000 to $64,999 | 0 (0.0%) | 0 (0.0%) |
| $65,000 to $74,999 | 0 (0.0%) | 0 (0.0%) |
| $75,000 to $99,999 | 0 (0.0%) | 0 (0.0%) |
| $100,000+ | 4 (30.8%) | 0 (0.0%) |
| Total | 13 (100.0%) | 10 (100.0%) |
Earnings by Sex by Educational Attainment in Fargo
| Educational Attainment | Male Income | Female Income |
| Less than High School | - | - |
| High School Diploma | - | - |
| College or Associate's Degree | - | - |
| Bachelor's Degree | - | - |
| Graduate Degree | - | - |
| Total | - | - |
Family Income in Fargo
Family Income Brackets in Fargo
According to the Fargo family income data, there are 3 families falling into the $15,000 to $24,999 income range, which is the most common income bracket and makes up 33.3% of all families.
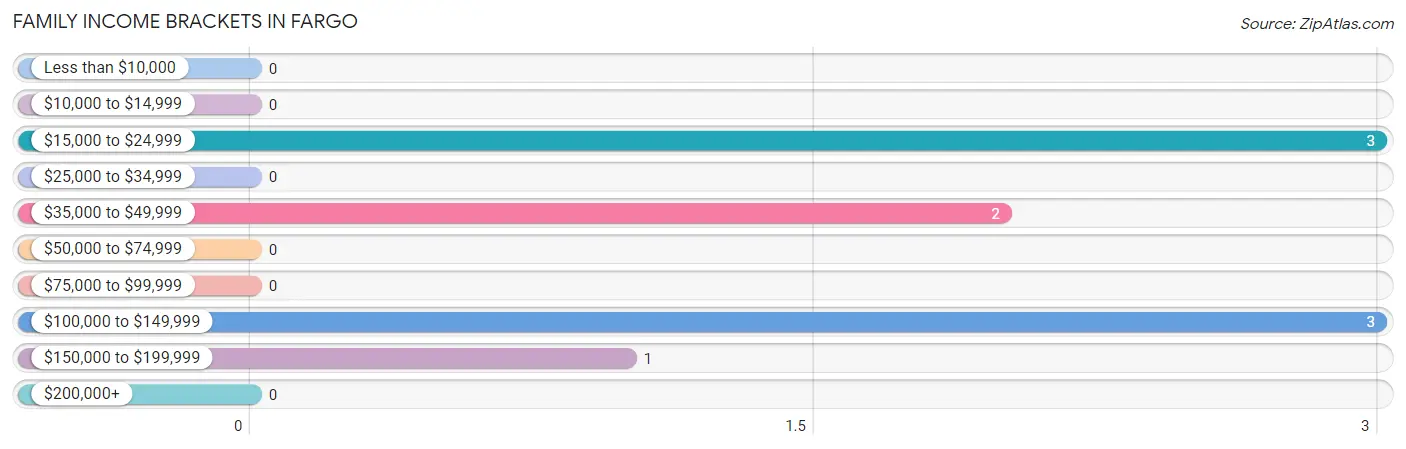
| Income Bracket | # Families | % Families |
| Less than $10,000 | 0 | 0.0% |
| $10,000 to $14,999 | 0 | 0.0% |
| $15,000 to $24,999 | 3 | 33.3% |
| $25,000 to $34,999 | 0 | 0.0% |
| $35,000 to $49,999 | 2 | 22.2% |
| $50,000 to $74,999 | 0 | 0.0% |
| $75,000 to $99,999 | 0 | 0.0% |
| $100,000 to $149,999 | 3 | 33.3% |
| $150,000 to $199,999 | 1 | 11.1% |
| $200,000+ | 0 | 0.0% |
Family Income by Famaliy Size in Fargo
2-person families (6 | 66.7%) account for the highest median family income in Fargo with $128,333 per family, while 2-person families (6 | 66.7%) have the highest median income of $64,166 per family member.
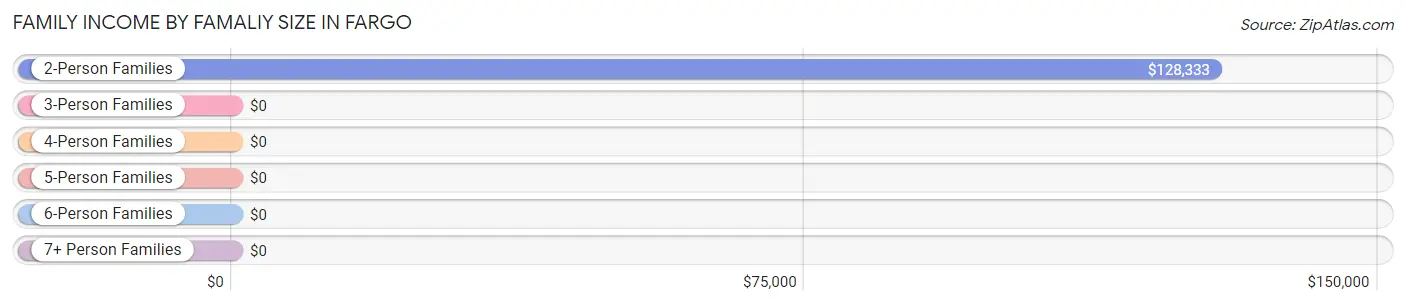
| Income Bracket | # Families | Median Income |
| 2-Person Families | 6 (66.7%) | $128,333 |
| 3-Person Families | 0 (0.0%) | $0 |
| 4-Person Families | 3 (33.3%) | $0 |
| 5-Person Families | 0 (0.0%) | $0 |
| 6-Person Families | 0 (0.0%) | $0 |
| 7+ Person Families | 0 (0.0%) | $0 |
| Total | 9 (100.0%) | $0 |
Family Income by Number of Earners in Fargo
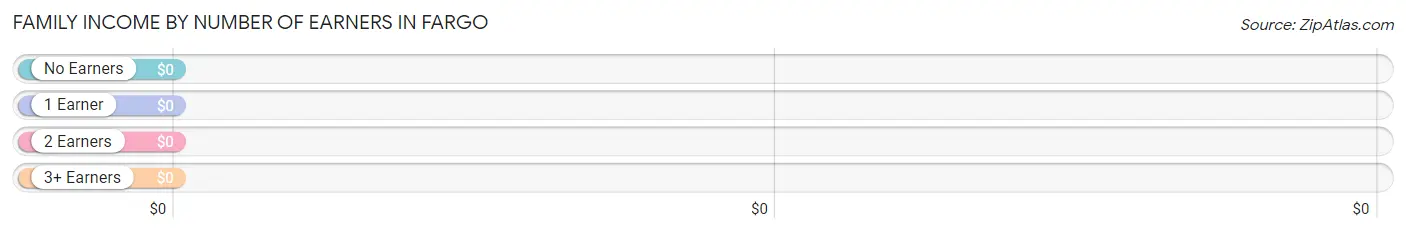
| Number of Earners | # Families | Median Income |
| No Earners | 2 (22.2%) | $0 |
| 1 Earner | 0 (0.0%) | $0 |
| 2 Earners | 7 (77.8%) | $0 |
| 3+ Earners | 0 (0.0%) | $0 |
| Total | 9 (100.0%) | $0 |
Household Income in Fargo
Household Income Brackets in Fargo
With 10 households falling in the category, the less than $10,000 income range is the most frequent in Fargo, accounting for 37.0% of all households.
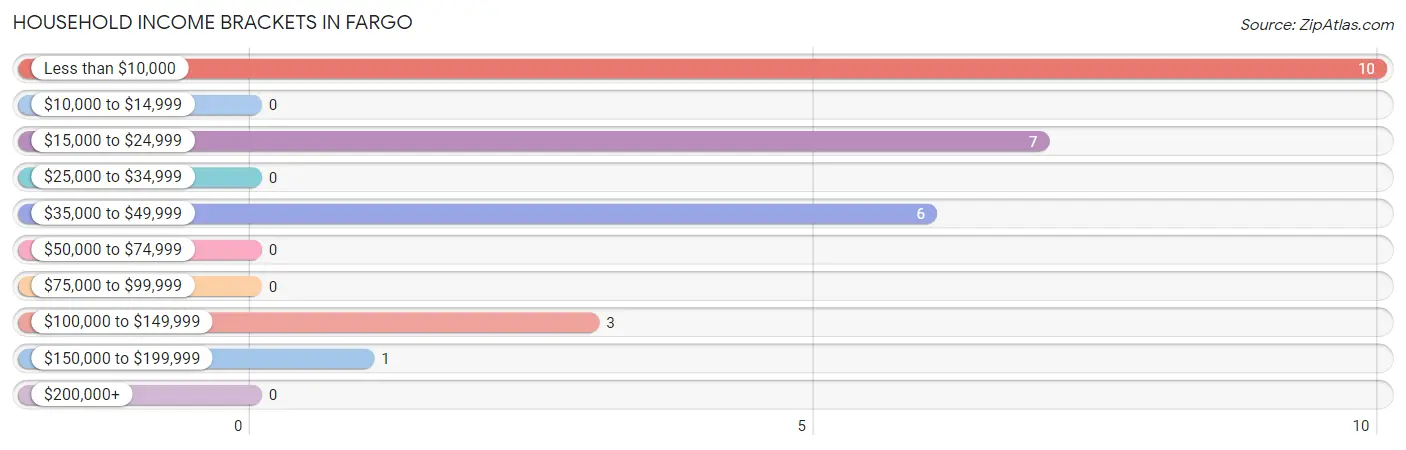
| Income Bracket | # Households | % Households |
| Less than $10,000 | 10 | 37.0% |
| $10,000 to $14,999 | 0 | 0.0% |
| $15,000 to $24,999 | 7 | 25.9% |
| $25,000 to $34,999 | 0 | 0.0% |
| $35,000 to $49,999 | 6 | 22.2% |
| $50,000 to $74,999 | 0 | 0.0% |
| $75,000 to $99,999 | 0 | 0.0% |
| $100,000 to $149,999 | 3 | 11.1% |
| $150,000 to $199,999 | 1 | 3.7% |
| $200,000+ | 0 | 0.0% |
Household Income by Householder Age in Fargo
The median household income in Fargo is $0, with the highest median household income of $2,499 found in the 65+ years age bracket for the primary householder. A total of 16 households (59.3%) fall into this category.
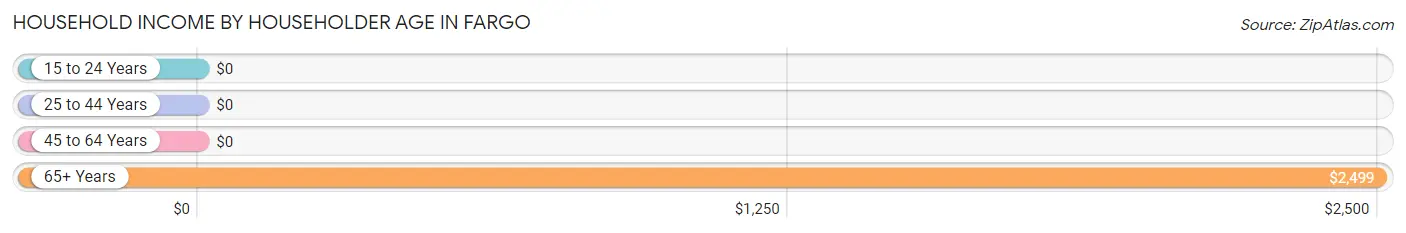
| Income Bracket | # Households | Median Income |
| 15 to 24 Years | 0 (0.0%) | $0 |
| 25 to 44 Years | 1 (3.7%) | $0 |
| 45 to 64 Years | 10 (37.0%) | $0 |
| 65+ Years | 16 (59.3%) | $2,499 |
| Total | 27 (100.0%) | $0 |
Poverty in Fargo
Income Below Poverty by Sex and Age in Fargo
With 50.0% poverty level for males and 62.2% for females among the residents of Fargo, 65 to 74 year old males and 6 to 11 year old females are the most vulnerable to poverty, with 9 males (81.8%) and 10 females (100.0%) in their respective age groups living below the poverty level.
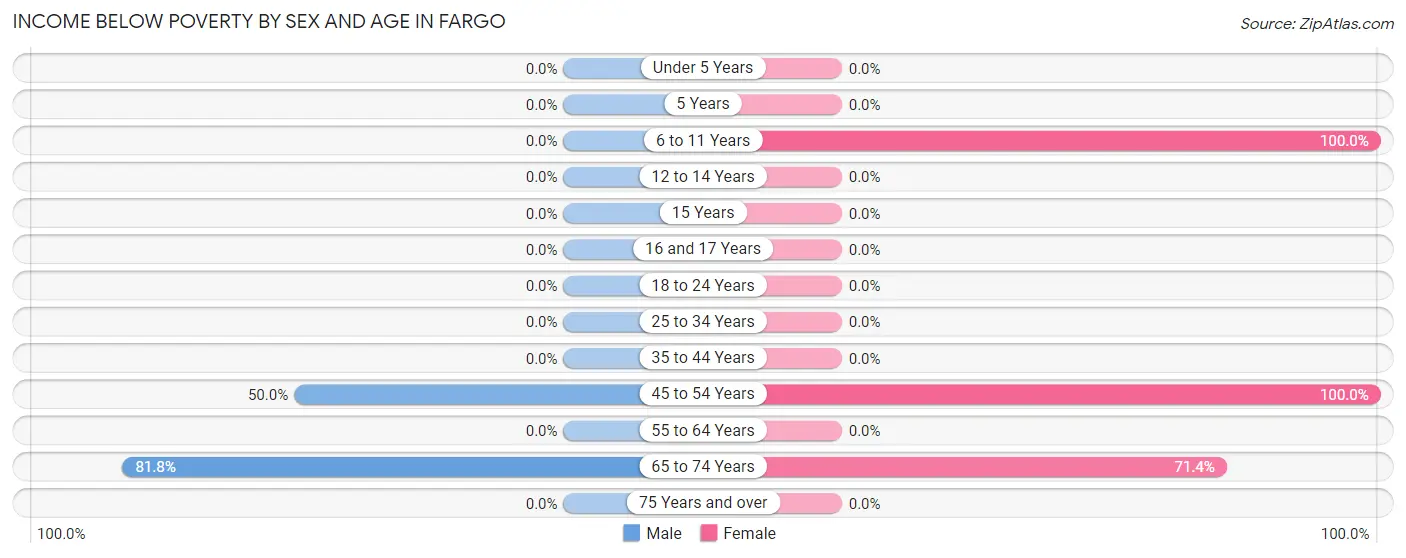
| Age Bracket | Male | Female |
| Under 5 Years | 0 (0.0%) | 0 (0.0%) |
| 5 Years | 0 (0.0%) | 0 (0.0%) |
| 6 to 11 Years | 0 (0.0%) | 10 (100.0%) |
| 12 to 14 Years | 0 (0.0%) | 0 (0.0%) |
| 15 Years | 0 (0.0%) | 0 (0.0%) |
| 16 and 17 Years | 0 (0.0%) | 0 (0.0%) |
| 18 to 24 Years | 0 (0.0%) | 0 (0.0%) |
| 25 to 34 Years | 0 (0.0%) | 0 (0.0%) |
| 35 to 44 Years | 0 (0.0%) | 0 (0.0%) |
| 45 to 54 Years | 3 (50.0%) | 3 (100.0%) |
| 55 to 64 Years | 0 (0.0%) | 0 (0.0%) |
| 65 to 74 Years | 9 (81.8%) | 10 (71.4%) |
| 75 Years and over | 0 (0.0%) | 0 (0.0%) |
| Total | 12 (50.0%) | 23 (62.2%) |
Income Above Poverty by Sex and Age in Fargo
According to the poverty statistics in Fargo, males aged 18 to 24 years and females aged 18 to 24 years are the age groups that are most secure financially, with 100.0% of males and 100.0% of females in these age groups living above the poverty line.
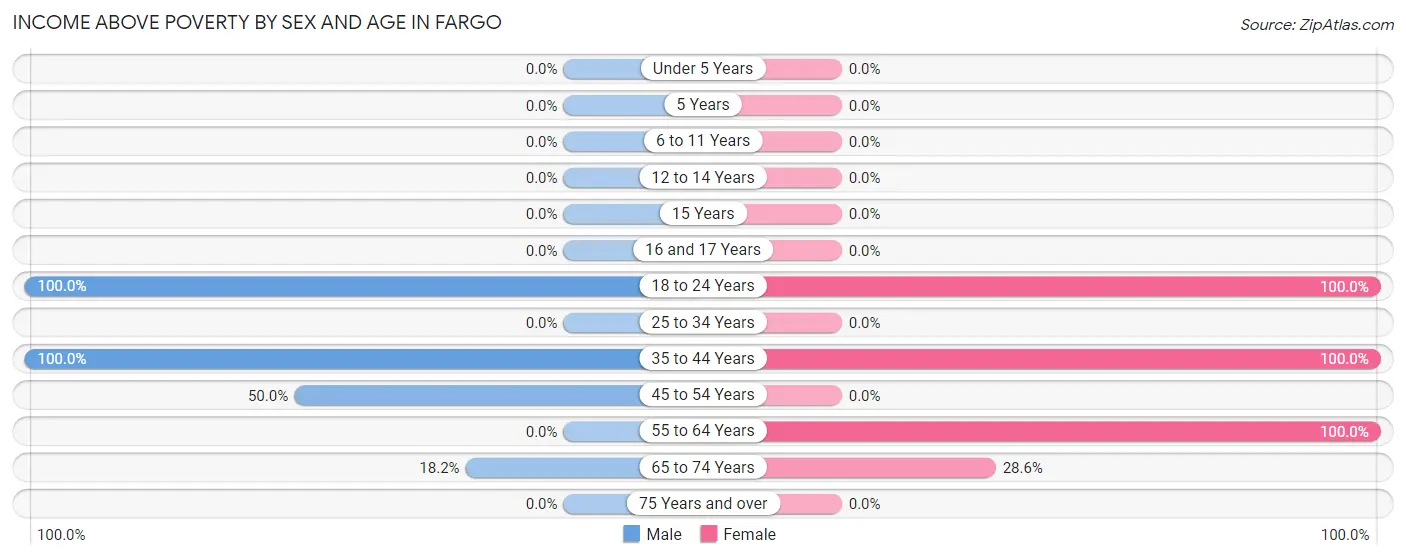
| Age Bracket | Male | Female |
| Under 5 Years | 0 (0.0%) | 0 (0.0%) |
| 5 Years | 0 (0.0%) | 0 (0.0%) |
| 6 to 11 Years | 0 (0.0%) | 0 (0.0%) |
| 12 to 14 Years | 0 (0.0%) | 0 (0.0%) |
| 15 Years | 0 (0.0%) | 0 (0.0%) |
| 16 and 17 Years | 0 (0.0%) | 0 (0.0%) |
| 18 to 24 Years | 6 (100.0%) | 3 (100.0%) |
| 25 to 34 Years | 0 (0.0%) | 0 (0.0%) |
| 35 to 44 Years | 1 (100.0%) | 3 (100.0%) |
| 45 to 54 Years | 3 (50.0%) | 0 (0.0%) |
| 55 to 64 Years | 0 (0.0%) | 4 (100.0%) |
| 65 to 74 Years | 2 (18.2%) | 4 (28.6%) |
| 75 Years and over | 0 (0.0%) | 0 (0.0%) |
| Total | 12 (50.0%) | 14 (37.8%) |
Income Below Poverty Among Married-Couple Families in Fargo
The poverty statistics for married-couple families in Fargo show that 100.0% or 3 of the total 3 families live below the poverty line. Families with 1 or 2 children have the highest poverty rate of 100.0%, comprising of 3 families. On the other hand, families with 1 or 2 children have the lowest poverty rate of 100.0%, which includes 3 families.
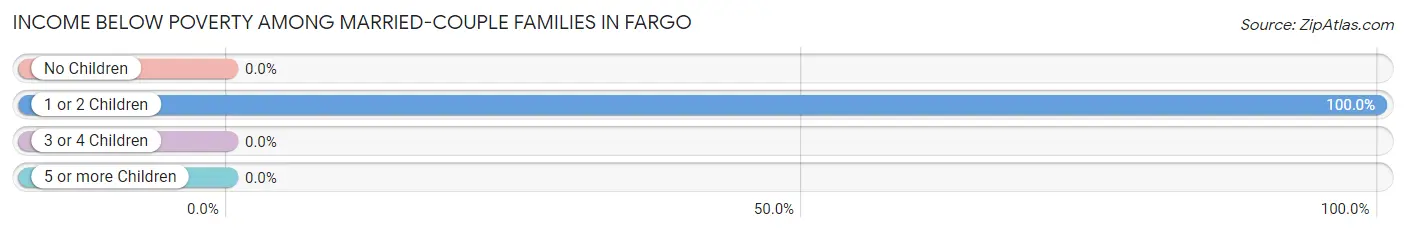
| Children | Above Poverty | Below Poverty |
| No Children | 0 (0.0%) | 0 (0.0%) |
| 1 or 2 Children | 0 (0.0%) | 3 (100.0%) |
| 3 or 4 Children | 0 (0.0%) | 0 (0.0%) |
| 5 or more Children | 0 (0.0%) | 0 (0.0%) |
| Total | 0 (0.0%) | 3 (100.0%) |
Income Below Poverty Among Single-Parent Households in Fargo
| Children | Single Father | Single Mother |
| No Children | 0 (0.0%) | 0 (0.0%) |
| 1 or 2 Children | 0 (0.0%) | 0 (0.0%) |
| 3 or 4 Children | 0 (0.0%) | 0 (0.0%) |
| 5 or more Children | 0 (0.0%) | 0 (0.0%) |
| Total | 0 (0.0%) | 0 (0.0%) |
Income Below Poverty Among Married-Couple vs Single-Parent Households in Fargo
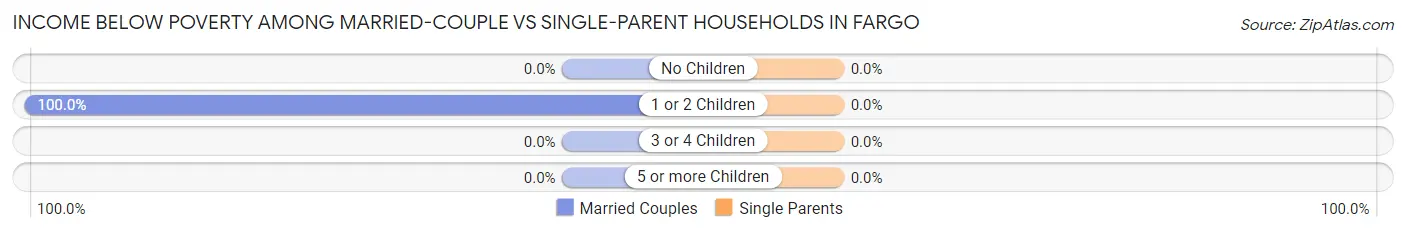
| Children | Married-Couple Families | Single-Parent Households |
| No Children | 0 (0.0%) | 0 (0.0%) |
| 1 or 2 Children | 3 (100.0%) | 0 (0.0%) |
| 3 or 4 Children | 0 (0.0%) | 0 (0.0%) |
| 5 or more Children | 0 (0.0%) | 0 (0.0%) |
| Total | 3 (100.0%) | 0 (0.0%) |
Race in Fargo
The most populous races in Fargo are Black / African American (52 | 85.3%), and White / Caucasian (9 | 14.7%).
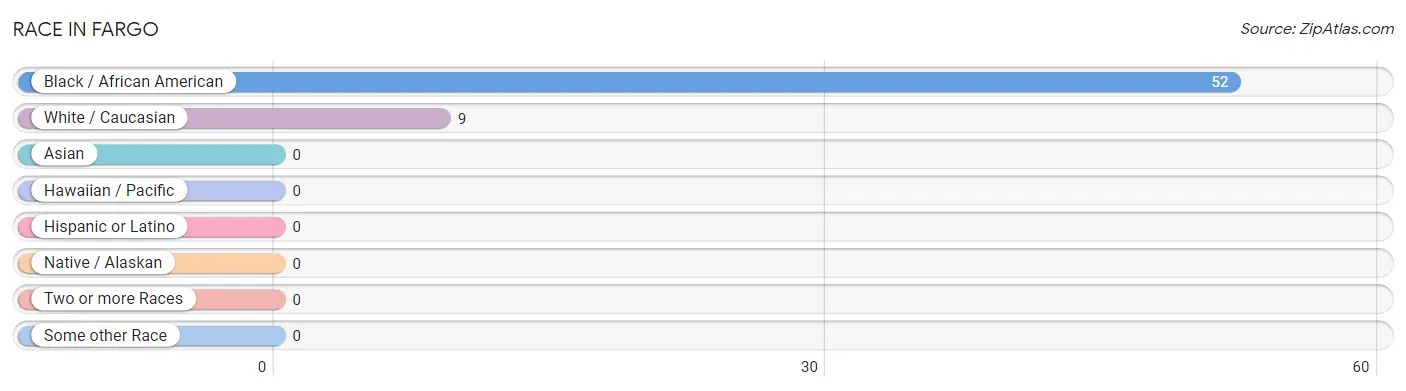
| Race | # Population | % Population |
| Asian | 0 | 0.0% |
| Black / African American | 52 | 85.3% |
| Hawaiian / Pacific | 0 | 0.0% |
| Hispanic or Latino | 0 | 0.0% |
| Native / Alaskan | 0 | 0.0% |
| White / Caucasian | 9 | 14.7% |
| Two or more Races | 0 | 0.0% |
| Some other Race | 0 | 0.0% |
| Total | 61 | 100.0% |
Ancestry in Fargo
The most populous ancestries reported in Fargo are American (10 | 16.4%), and Irish (9 | 14.7%), together accounting for 31.1% of all Fargo residents.
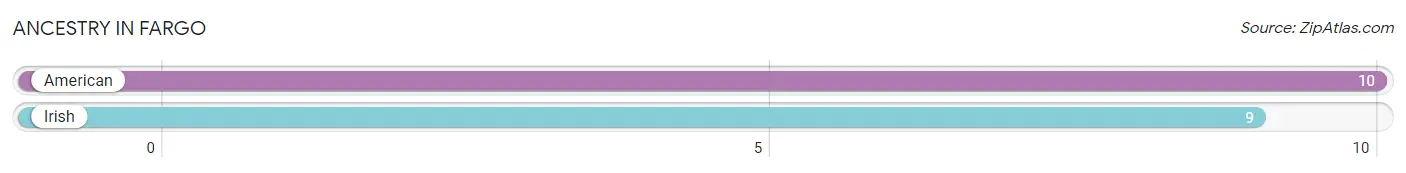
| Ancestry | # Population | % Population |
| American | 10 | 16.4% |
| Irish | 9 | 14.7% | View All 2 Rows |
Immigrants in Fargo

| Immigration Origin | # Population | % Population | View All 0 Rows |
Sex and Age in Fargo
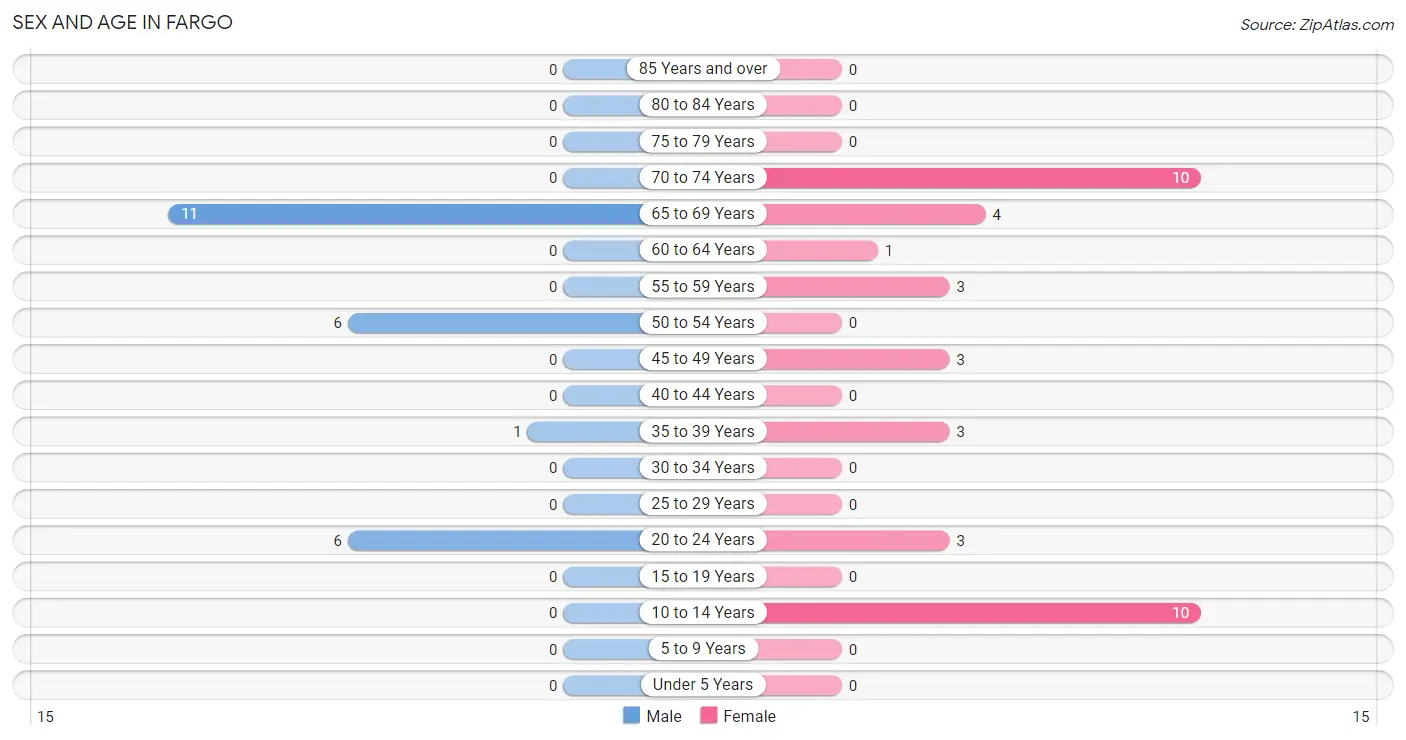
Sex and Age in Fargo
The most populous age groups in Fargo are 65 to 69 Years (11 | 45.8%) for men and 10 to 14 Years (10 | 27.0%) for women.
| Age Bracket | Male | Female |
| Under 5 Years | 0 (0.0%) | 0 (0.0%) |
| 5 to 9 Years | 0 (0.0%) | 0 (0.0%) |
| 10 to 14 Years | 0 (0.0%) | 10 (27.0%) |
| 15 to 19 Years | 0 (0.0%) | 0 (0.0%) |
| 20 to 24 Years | 6 (25.0%) | 3 (8.1%) |
| 25 to 29 Years | 0 (0.0%) | 0 (0.0%) |
| 30 to 34 Years | 0 (0.0%) | 0 (0.0%) |
| 35 to 39 Years | 1 (4.2%) | 3 (8.1%) |
| 40 to 44 Years | 0 (0.0%) | 0 (0.0%) |
| 45 to 49 Years | 0 (0.0%) | 3 (8.1%) |
| 50 to 54 Years | 6 (25.0%) | 0 (0.0%) |
| 55 to 59 Years | 0 (0.0%) | 3 (8.1%) |
| 60 to 64 Years | 0 (0.0%) | 1 (2.7%) |
| 65 to 69 Years | 11 (45.8%) | 4 (10.8%) |
| 70 to 74 Years | 0 (0.0%) | 10 (27.0%) |
| 75 to 79 Years | 0 (0.0%) | 0 (0.0%) |
| 80 to 84 Years | 0 (0.0%) | 0 (0.0%) |
| 85 Years and over | 0 (0.0%) | 0 (0.0%) |
| Total | 24 (100.0%) | 37 (100.0%) |
Families and Households in Fargo
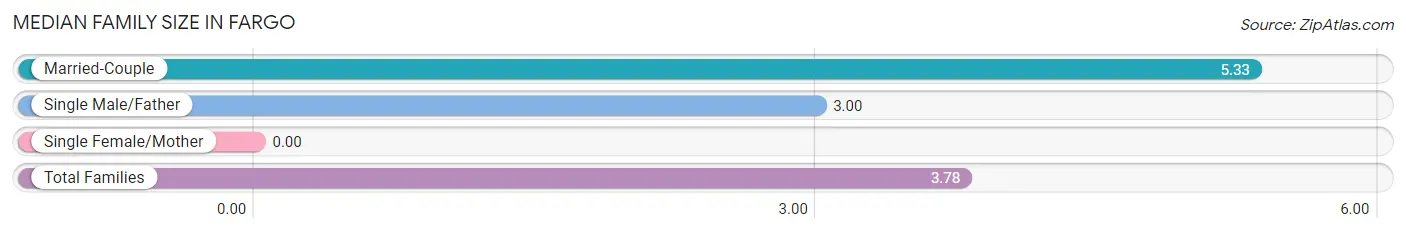
Median Family Size in Fargo
| Family Type | # Families | Family Size |
| Married-Couple | 3 (33.3%) | 5.33 |
| Single Male/Father | 6 (66.7%) | 3.00 |
| Single Female/Mother | 0 (0.0%) | - |
| Total Families | 9 (100.0%) | 3.78 |
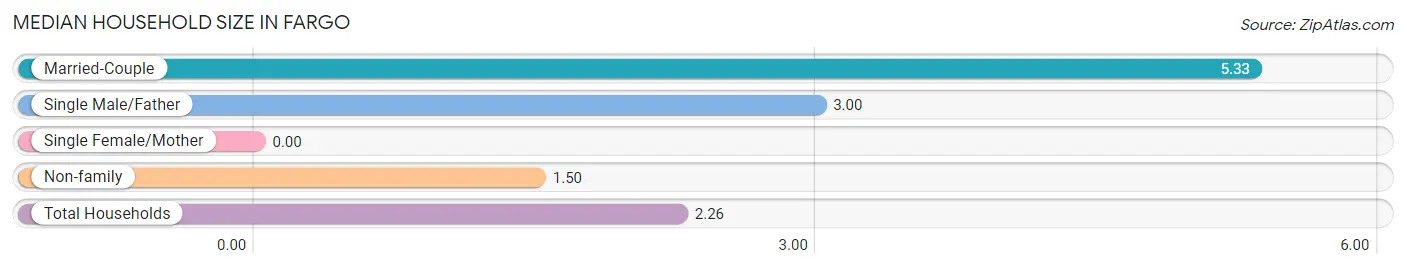
Median Household Size in Fargo
| Household Type | # Households | Household Size |
| Married-Couple | 3 (11.1%) | 5.33 |
| Single Male/Father | 6 (22.2%) | 3.00 |
| Single Female/Mother | 0 (0.0%) | - |
| Non-family | 18 (66.7%) | 1.50 |
| Total Households | 27 (100.0%) | 2.26 |
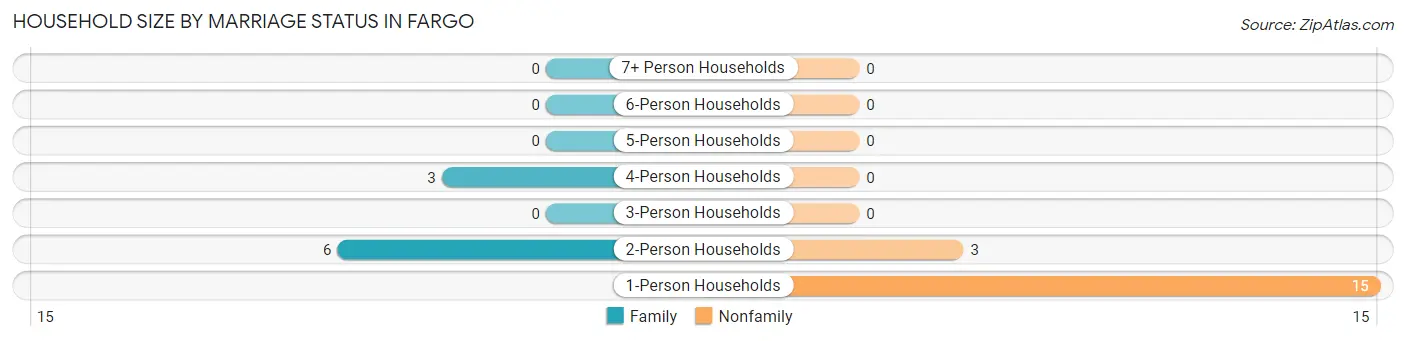
Household Size by Marriage Status in Fargo
Out of a total of 27 households in Fargo, 9 (33.3%) are family households, while 18 (66.7%) are nonfamily households. The most numerous type of family households are 2-person households, comprising 6, and the most common type of nonfamily households are 1-person households, comprising 15.
| Household Size | Family Households | Nonfamily Households |
| 1-Person Households | - | 15 (55.6%) |
| 2-Person Households | 6 (22.2%) | 3 (11.1%) |
| 3-Person Households | 0 (0.0%) | 0 (0.0%) |
| 4-Person Households | 3 (11.1%) | 0 (0.0%) |
| 5-Person Households | 0 (0.0%) | 0 (0.0%) |
| 6-Person Households | 0 (0.0%) | 0 (0.0%) |
| 7+ Person Households | 0 (0.0%) | 0 (0.0%) |
| Total | 9 (33.3%) | 18 (66.7%) |
Female Fertility in Fargo
Fertility by Age in Fargo
| Age Bracket | Women with Births | Births / 1,000 Women |
| 15 to 19 years | 0 (0.0%) | 0.0 |
| 20 to 34 years | 0 (0.0%) | 0.0 |
| 35 to 50 years | 0 (0.0%) | 0.0 |
| Total | 0 (0.0%) | 0.0 |
Fertility by Age by Marriage Status in Fargo
| Age Bracket | Married | Unmarried |
| 15 to 19 years | 0 (0.0%) | 0 (0.0%) |
| 20 to 34 years | 0 (0.0%) | 0 (0.0%) |
| 35 to 50 years | 0 (0.0%) | 0 (0.0%) |
| Total | 0 (0.0%) | 0 (0.0%) |
Fertility by Education in Fargo
| Educational Attainment | Women with Births | Births / 1,000 Women |
| Less than High School | 0 (0.0%) | 0.0 |
| High School Diploma | 0 (0.0%) | 0.0 |
| College or Associate's Degree | 0 (0.0%) | 0.0 |
| Bachelor's Degree | 0 (0.0%) | 0.0 |
| Graduate Degree | 0 (0.0%) | 0.0 |
| Total | 0 (0.0%) | 0.0 |
Fertility by Education by Marriage Status in Fargo
| Educational Attainment | Married | Unmarried |
| Less than High School | 0 (0.0%) | 0 (0.0%) |
| High School Diploma | 0 (0.0%) | 0 (0.0%) |
| College or Associate's Degree | 0 (0.0%) | 0 (0.0%) |
| Bachelor's Degree | 0 (0.0%) | 0 (0.0%) |
| Graduate Degree | 0 (0.0%) | 0 (0.0%) |
| Total | 0 (0.0%) | 0 (0.0%) |
Employment Characteristics in Fargo
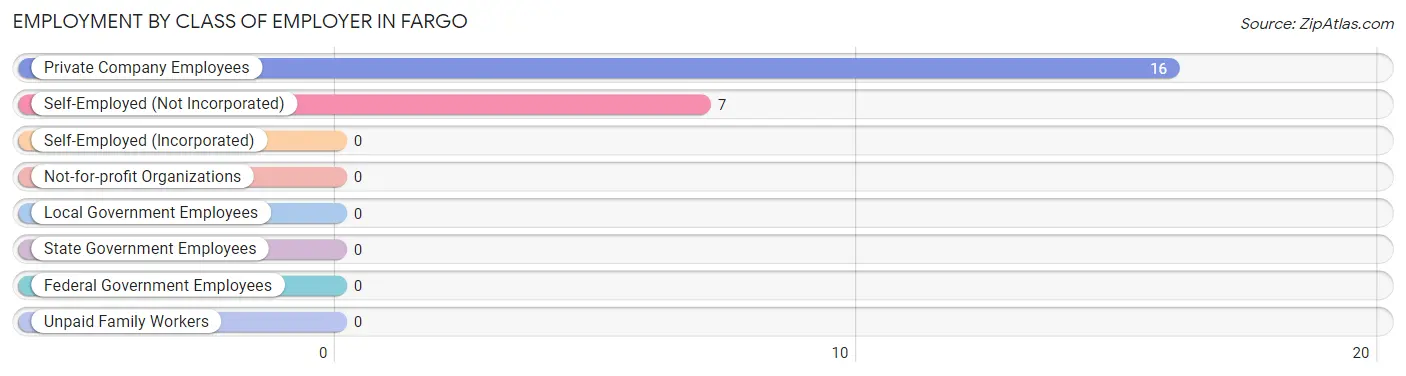
Employment by Class of Employer in Fargo
Among the 23 employed individuals in Fargo, private company employees (16 | 69.6%), and self-employed (not incorporated) (7 | 30.4%) make up the most common classes of employment.
| Employer Class | # Employees | % Employees |
| Private Company Employees | 16 | 69.6% |
| Self-Employed (Incorporated) | 0 | 0.0% |
| Self-Employed (Not Incorporated) | 7 | 30.4% |
| Not-for-profit Organizations | 0 | 0.0% |
| Local Government Employees | 0 | 0.0% |
| State Government Employees | 0 | 0.0% |
| Federal Government Employees | 0 | 0.0% |
| Unpaid Family Workers | 0 | 0.0% |
| Total | 23 | 100.0% |
Employment Status by Age in Fargo
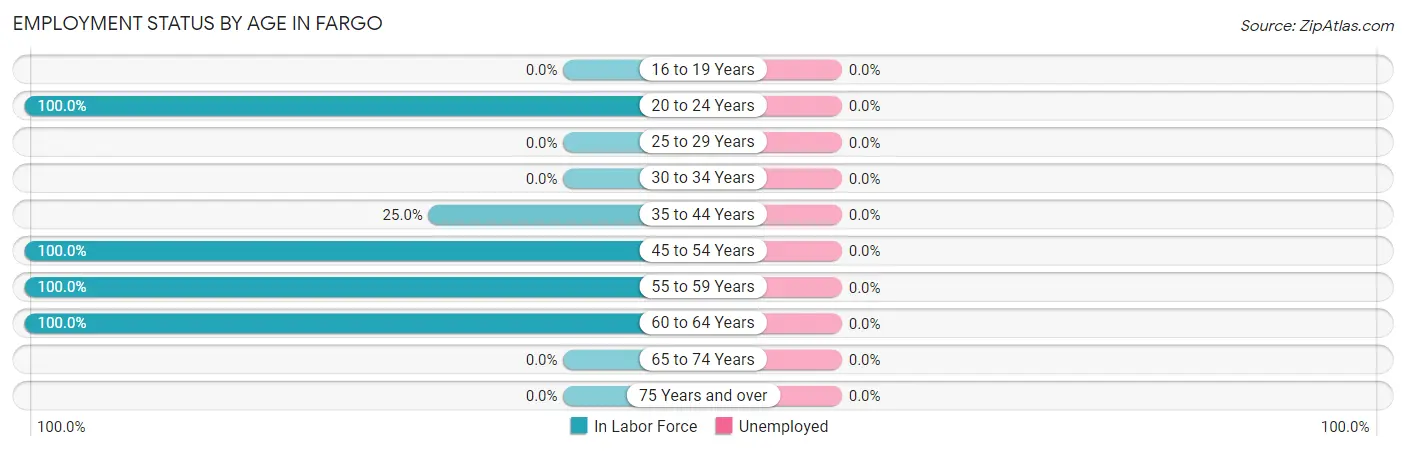
| Age Bracket | In Labor Force | Unemployed |
| 16 to 19 Years | 0 (0.0%) | 0 (0.0%) |
| 20 to 24 Years | 9 (100.0%) | 0 (0.0%) |
| 25 to 29 Years | 0 (0.0%) | 0 (0.0%) |
| 30 to 34 Years | 0 (0.0%) | 0 (0.0%) |
| 35 to 44 Years | 1 (25.0%) | 0 (0.0%) |
| 45 to 54 Years | 9 (100.0%) | 0 (0.0%) |
| 55 to 59 Years | 3 (100.0%) | 0 (0.0%) |
| 60 to 64 Years | 1 (100.0%) | 0 (0.0%) |
| 65 to 74 Years | 0 (0.0%) | 0 (0.0%) |
| 75 Years and over | 0 (0.0%) | 0 (0.0%) |
| Total | 23 (45.1%) | 0 (0.0%) |
Employment Status by Educational Attainment in Fargo
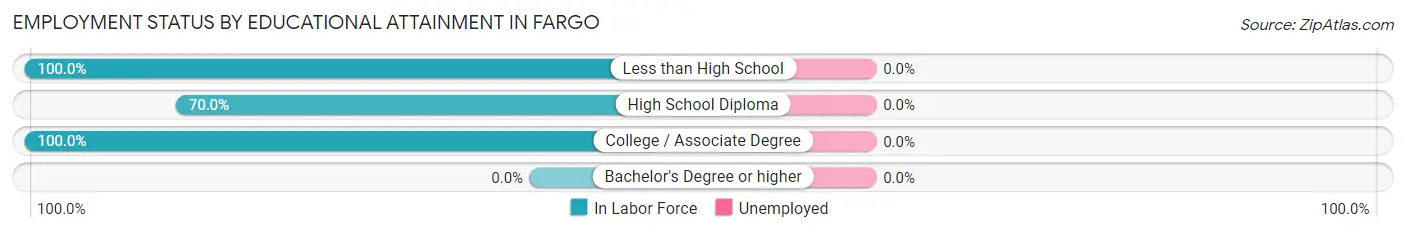
| Educational Attainment | In Labor Force | Unemployed |
| Less than High School | 3 (100.0%) | 0 (0.0%) |
| High School Diploma | 7 (70.0%) | 0 (0.0%) |
| College / Associate Degree | 4 (100.0%) | 0 (0.0%) |
| Bachelor's Degree or higher | 0 (0.0%) | 0 (0.0%) |
| Total | 14 (82.4%) | 0 (0.0%) |
Employment Occupations by Sex in Fargo
Management, Business, Science and Arts Occupations
The most common Management, Business, Science and Arts occupations in Fargo are , and Management (3 | 13.0%).
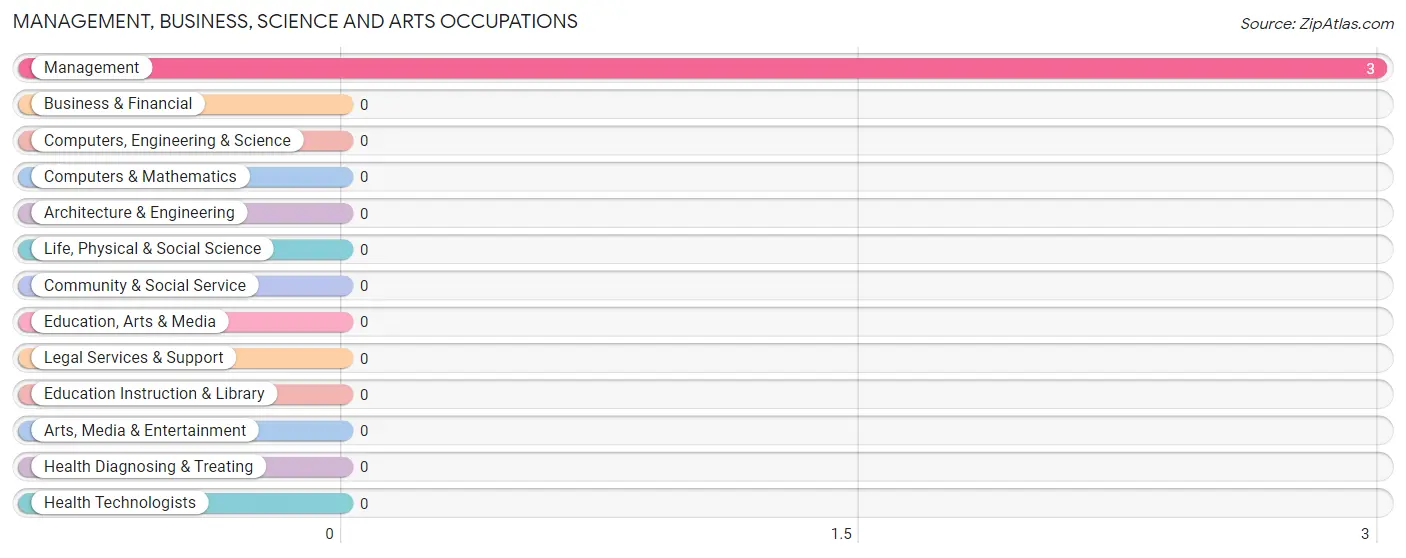
Management, Business, Science and Arts Occupations by Sex
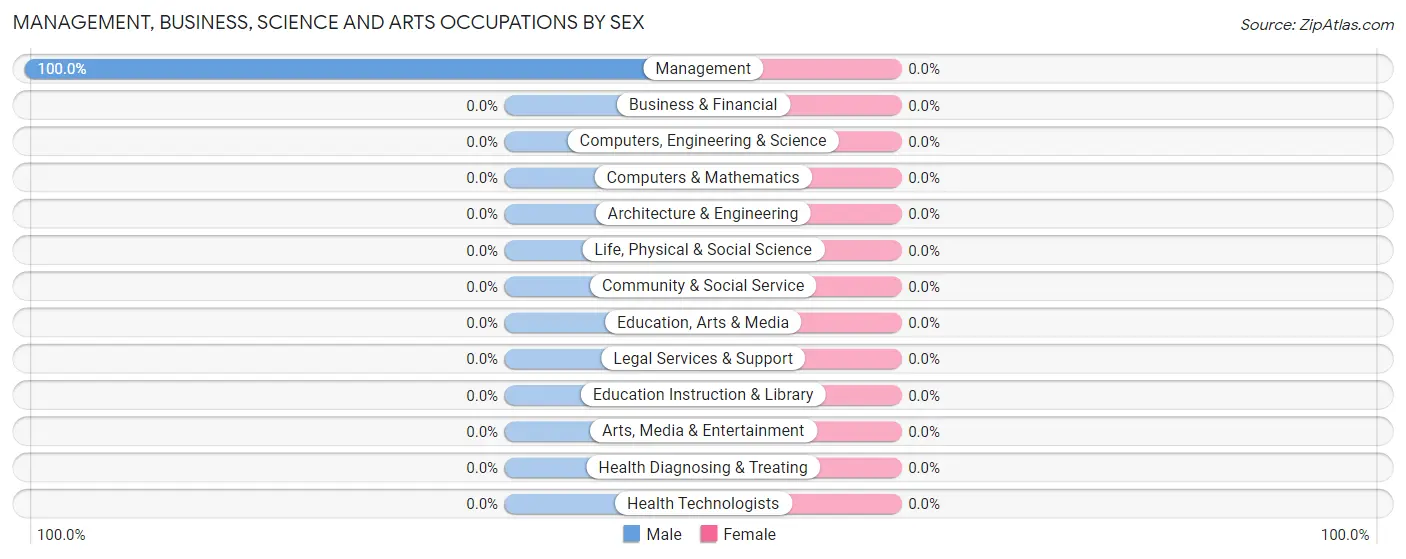
| Occupation | Male | Female |
| Management | 3 (100.0%) | 0 (0.0%) |
| Business & Financial | 0 (0.0%) | 0 (0.0%) |
| Computers, Engineering & Science | 0 (0.0%) | 0 (0.0%) |
| Computers & Mathematics | 0 (0.0%) | 0 (0.0%) |
| Architecture & Engineering | 0 (0.0%) | 0 (0.0%) |
| Life, Physical & Social Science | 0 (0.0%) | 0 (0.0%) |
| Community & Social Service | 0 (0.0%) | 0 (0.0%) |
| Education, Arts & Media | 0 (0.0%) | 0 (0.0%) |
| Legal Services & Support | 0 (0.0%) | 0 (0.0%) |
| Education Instruction & Library | 0 (0.0%) | 0 (0.0%) |
| Arts, Media & Entertainment | 0 (0.0%) | 0 (0.0%) |
| Health Diagnosing & Treating | 0 (0.0%) | 0 (0.0%) |
| Health Technologists | 0 (0.0%) | 0 (0.0%) |
| Total (Category) | 3 (100.0%) | 0 (0.0%) |
| Total (Overall) | 13 (56.5%) | 10 (43.5%) |
Services Occupations
The most common Services occupations in Fargo are , and Cleaning & Maintenance (4 | 17.4%).
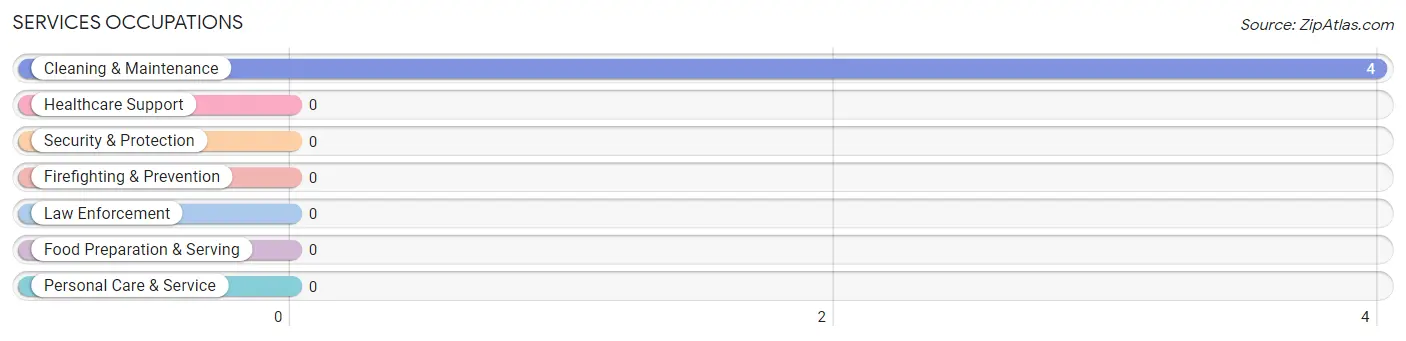
Services Occupations by Sex
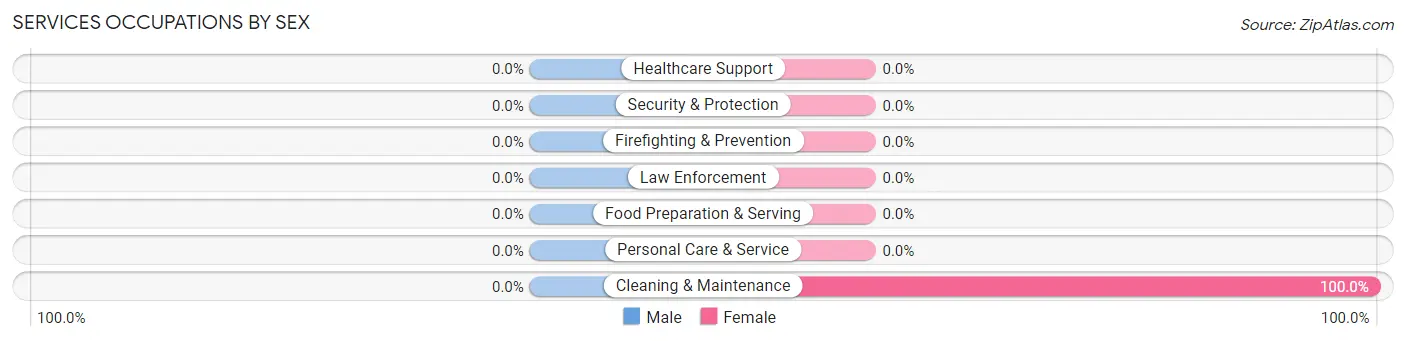
| Occupation | Male | Female |
| Healthcare Support | 0 (0.0%) | 0 (0.0%) |
| Security & Protection | 0 (0.0%) | 0 (0.0%) |
| Firefighting & Prevention | 0 (0.0%) | 0 (0.0%) |
| Law Enforcement | 0 (0.0%) | 0 (0.0%) |
| Food Preparation & Serving | 0 (0.0%) | 0 (0.0%) |
| Cleaning & Maintenance | 0 (0.0%) | 4 (100.0%) |
| Personal Care & Service | 0 (0.0%) | 0 (0.0%) |
| Total (Category) | 0 (0.0%) | 4 (100.0%) |
| Total (Overall) | 13 (56.5%) | 10 (43.5%) |
Sales and Office Occupations
The most common Sales and Office occupations in Fargo are , and Sales & Related (6 | 26.1%).
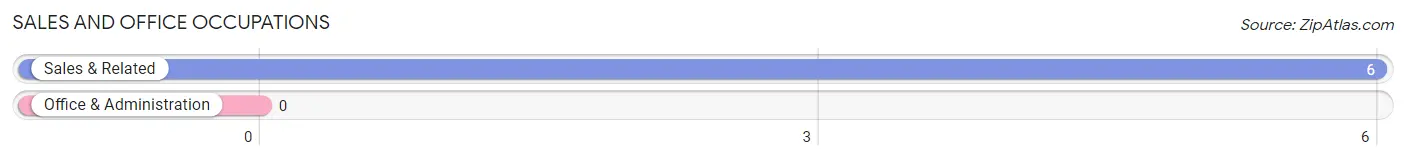
Sales and Office Occupations by Sex

| Occupation | Male | Female |
| Sales & Related | 0 (0.0%) | 6 (100.0%) |
| Office & Administration | 0 (0.0%) | 0 (0.0%) |
| Total (Category) | 0 (0.0%) | 6 (100.0%) |
| Total (Overall) | 13 (56.5%) | 10 (43.5%) |
Natural Resources, Construction and Maintenance Occupations
The most common Natural Resources, Construction and Maintenance occupations in Fargo are , and Construction & Extraction (6 | 26.1%).
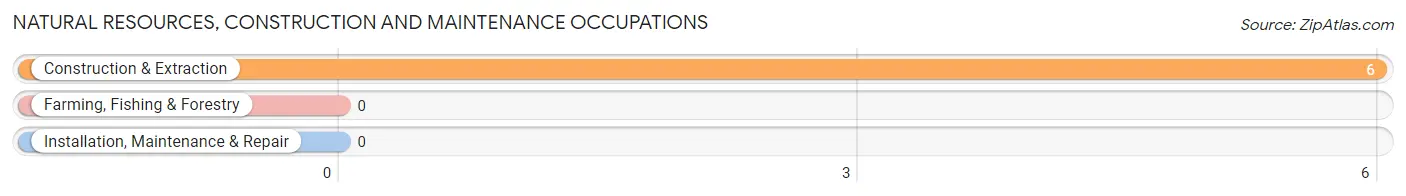
Natural Resources, Construction and Maintenance Occupations by Sex

| Occupation | Male | Female |
| Farming, Fishing & Forestry | 0 (0.0%) | 0 (0.0%) |
| Construction & Extraction | 6 (100.0%) | 0 (0.0%) |
| Installation, Maintenance & Repair | 0 (0.0%) | 0 (0.0%) |
| Total (Category) | 6 (100.0%) | 0 (0.0%) |
| Total (Overall) | 13 (56.5%) | 10 (43.5%) |
Production, Transportation and Moving Occupations
The most common Production, Transportation and Moving occupations in Fargo are , and Transportation (4 | 17.4%).
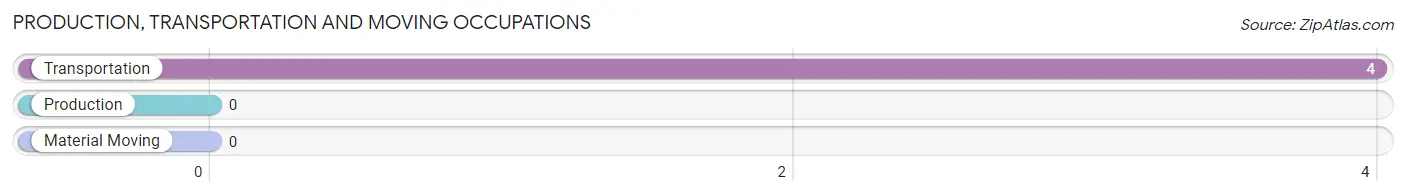
Production, Transportation and Moving Occupations by Sex
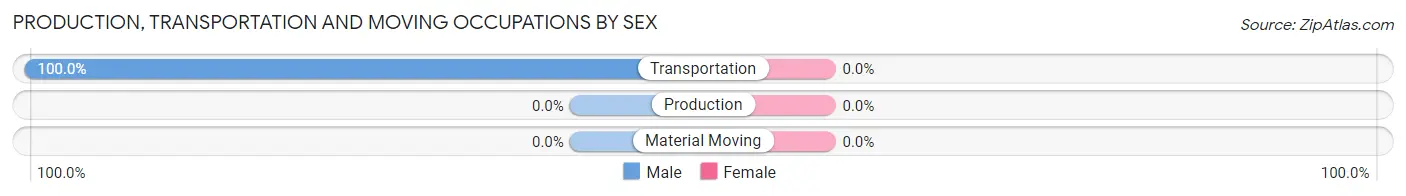
| Occupation | Male | Female |
| Production | 0 (0.0%) | 0 (0.0%) |
| Transportation | 4 (100.0%) | 0 (0.0%) |
| Material Moving | 0 (0.0%) | 0 (0.0%) |
| Total (Category) | 4 (100.0%) | 0 (0.0%) |
| Total (Overall) | 13 (56.5%) | 10 (43.5%) |
Employment Industries by Sex in Fargo
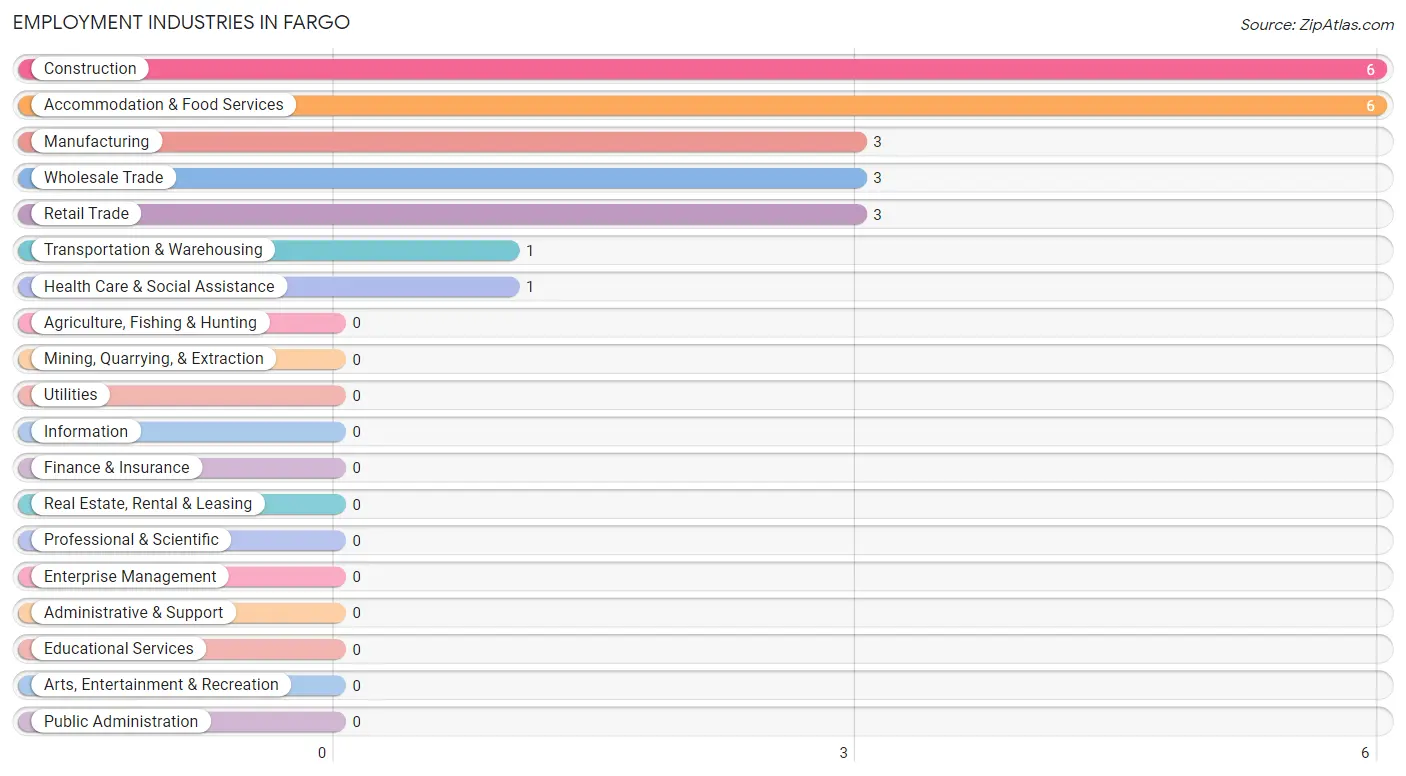
Employment Industries in Fargo
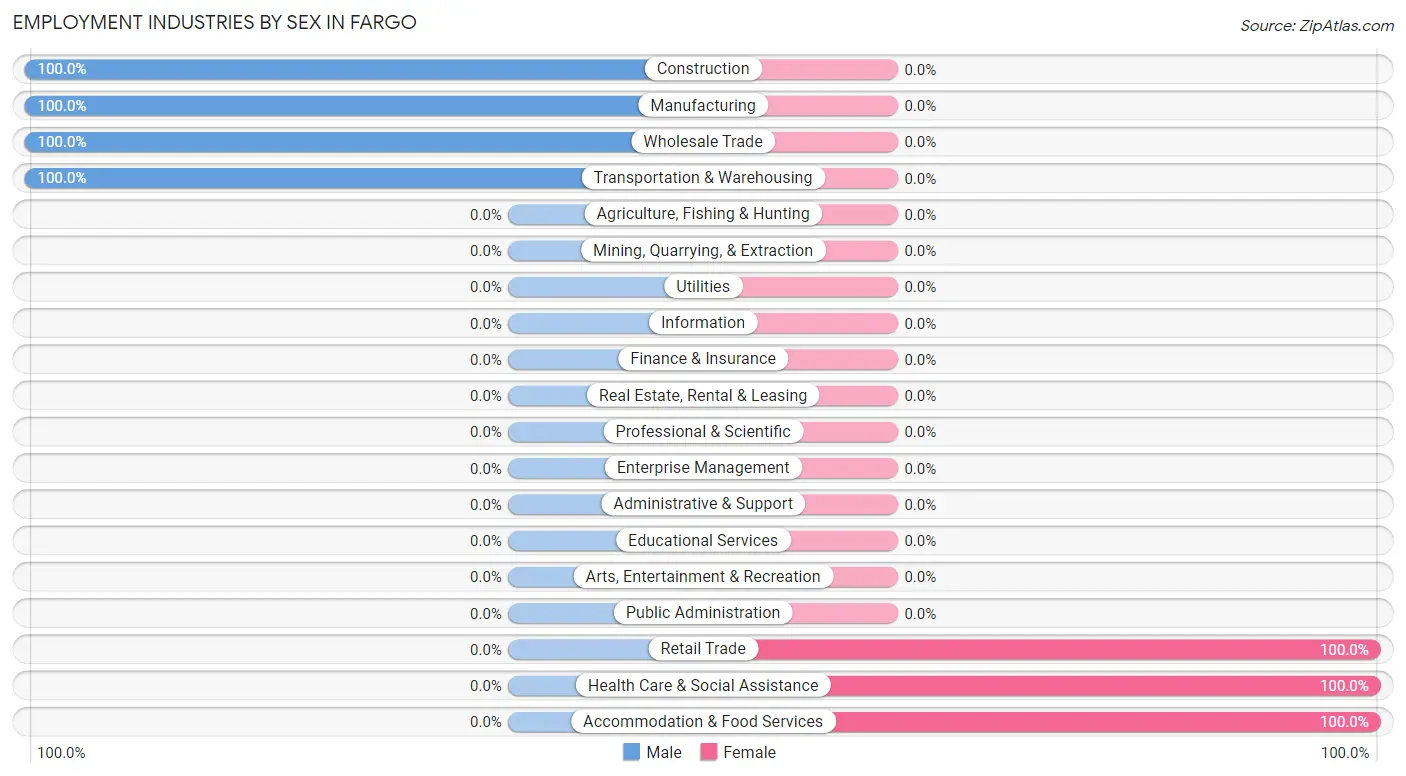
The major employment industries in Fargo include Construction (6 | 26.1%), Accommodation & Food Services (6 | 26.1%), Manufacturing (3 | 13.0%), Wholesale Trade (3 | 13.0%), and Retail Trade (3 | 13.0%).
Employment Industries by Sex in Fargo
The Fargo industries that see more men than women are Construction (100.0%), Manufacturing (100.0%), and Wholesale Trade (100.0%), whereas the industries that tend to have a higher number of women are Retail Trade (100.0%), Health Care & Social Assistance (100.0%), and Accommodation & Food Services (100.0%).
| Industry | Male | Female |
| Agriculture, Fishing & Hunting | 0 (0.0%) | 0 (0.0%) |
| Mining, Quarrying, & Extraction | 0 (0.0%) | 0 (0.0%) |
| Construction | 6 (100.0%) | 0 (0.0%) |
| Manufacturing | 3 (100.0%) | 0 (0.0%) |
| Wholesale Trade | 3 (100.0%) | 0 (0.0%) |
| Retail Trade | 0 (0.0%) | 3 (100.0%) |
| Transportation & Warehousing | 1 (100.0%) | 0 (0.0%) |
| Utilities | 0 (0.0%) | 0 (0.0%) |
| Information | 0 (0.0%) | 0 (0.0%) |
| Finance & Insurance | 0 (0.0%) | 0 (0.0%) |
| Real Estate, Rental & Leasing | 0 (0.0%) | 0 (0.0%) |
| Professional & Scientific | 0 (0.0%) | 0 (0.0%) |
| Enterprise Management | 0 (0.0%) | 0 (0.0%) |
| Administrative & Support | 0 (0.0%) | 0 (0.0%) |
| Educational Services | 0 (0.0%) | 0 (0.0%) |
| Health Care & Social Assistance | 0 (0.0%) | 1 (100.0%) |
| Arts, Entertainment & Recreation | 0 (0.0%) | 0 (0.0%) |
| Accommodation & Food Services | 0 (0.0%) | 6 (100.0%) |
| Public Administration | 0 (0.0%) | 0 (0.0%) |
| Total | 13 (56.5%) | 10 (43.5%) |
Education in Fargo
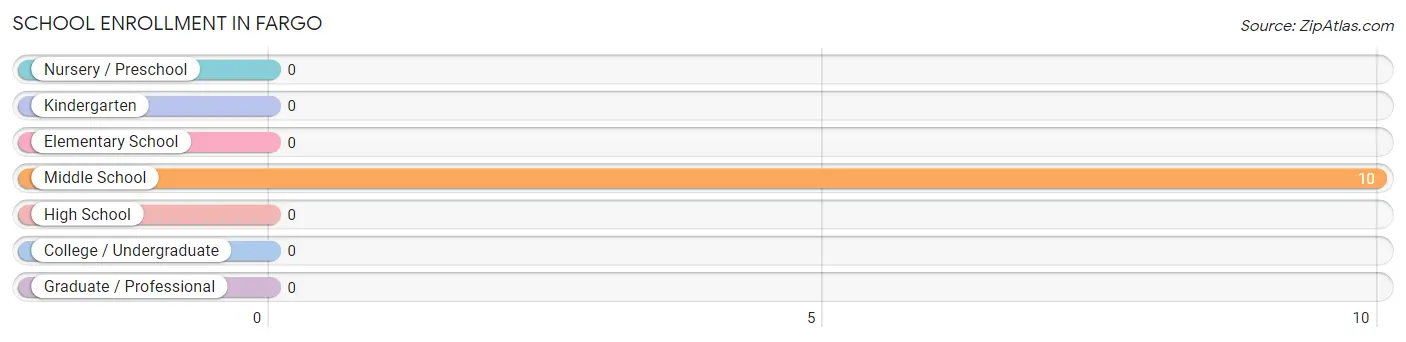
School Enrollment in Fargo
| School Level | # Students | % Students |
| Nursery / Preschool | 0 | 0.0% |
| Kindergarten | 0 | 0.0% |
| Elementary School | 0 | 0.0% |
| Middle School | 10 | 100.0% |
| High School | 0 | 0.0% |
| College / Undergraduate | 0 | 0.0% |
| Graduate / Professional | 0 | 0.0% |
| Total | 10 | 100.0% |
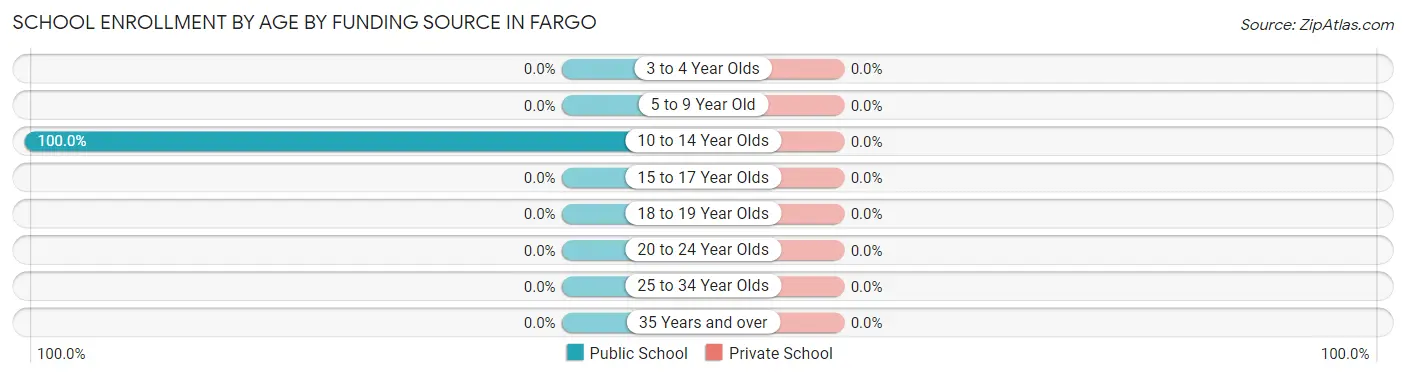
School Enrollment by Age by Funding Source in Fargo
| Age Bracket | Public School | Private School |
| 3 to 4 Year Olds | 0 (0.0%) | 0 (0.0%) |
| 5 to 9 Year Old | 0 (0.0%) | 0 (0.0%) |
| 10 to 14 Year Olds | 10 (100.0%) | 0 (0.0%) |
| 15 to 17 Year Olds | 0 (0.0%) | 0 (0.0%) |
| 18 to 19 Year Olds | 0 (0.0%) | 0 (0.0%) |
| 20 to 24 Year Olds | 0 (0.0%) | 0 (0.0%) |
| 25 to 34 Year Olds | 0 (0.0%) | 0 (0.0%) |
| 35 Years and over | 0 (0.0%) | 0 (0.0%) |
| Total | 10 (100.0%) | 0 (0.0%) |
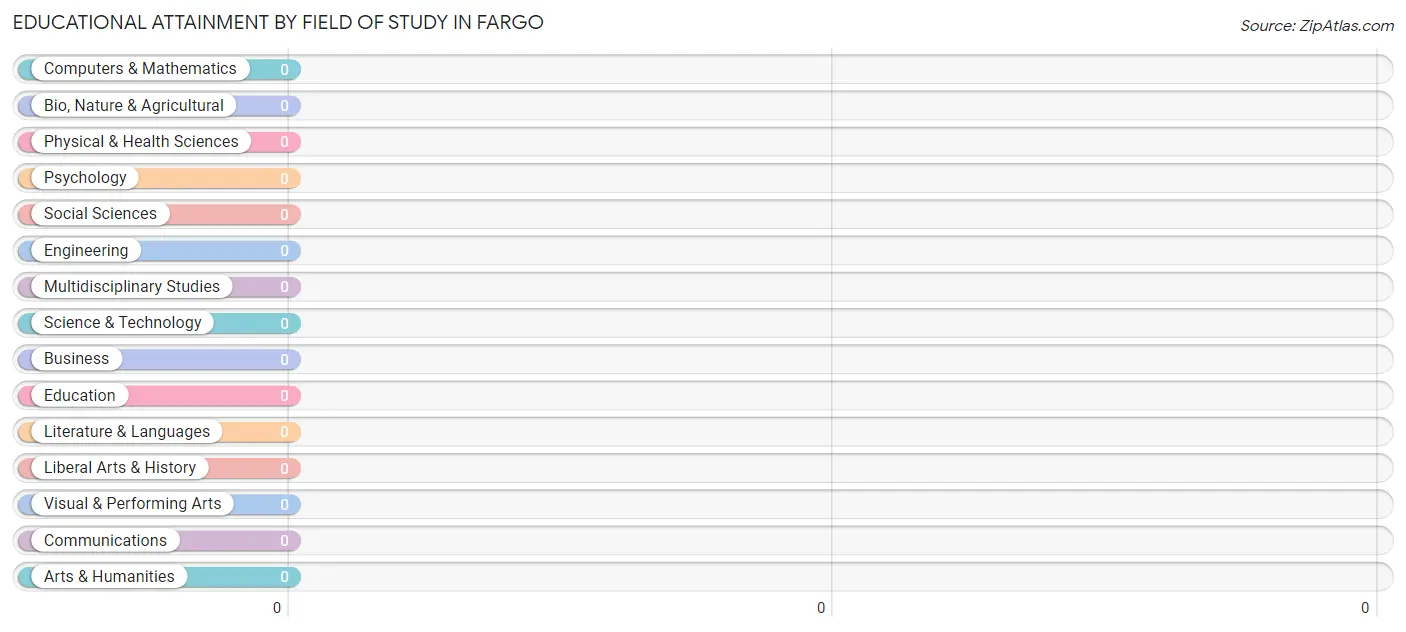
Educational Attainment by Field of Study in Fargo
| Field of Study | # Graduates | % Graduates |
| Computers & Mathematics | 0 | 0.0% |
| Bio, Nature & Agricultural | 0 | 0.0% |
| Physical & Health Sciences | 0 | 0.0% |
| Psychology | 0 | 0.0% |
| Social Sciences | 0 | 0.0% |
| Engineering | 0 | 0.0% |
| Multidisciplinary Studies | 0 | 0.0% |
| Science & Technology | 0 | 0.0% |
| Business | 0 | 0.0% |
| Education | 0 | 0.0% |
| Literature & Languages | 0 | 0.0% |
| Liberal Arts & History | 0 | 0.0% |
| Visual & Performing Arts | 0 | 0.0% |
| Communications | 0 | 0.0% |
| Arts & Humanities | 0 | 0.0% |
| Total | 0 | 0.0% |
Transportation & Commute in Fargo
Vehicle Availability by Sex in Fargo
The most prevalent vehicle ownership categories in Fargo are males with 2 vehicles (13, accounting for 100.0%) and females with 2 vehicles (9, making up 130.0%).
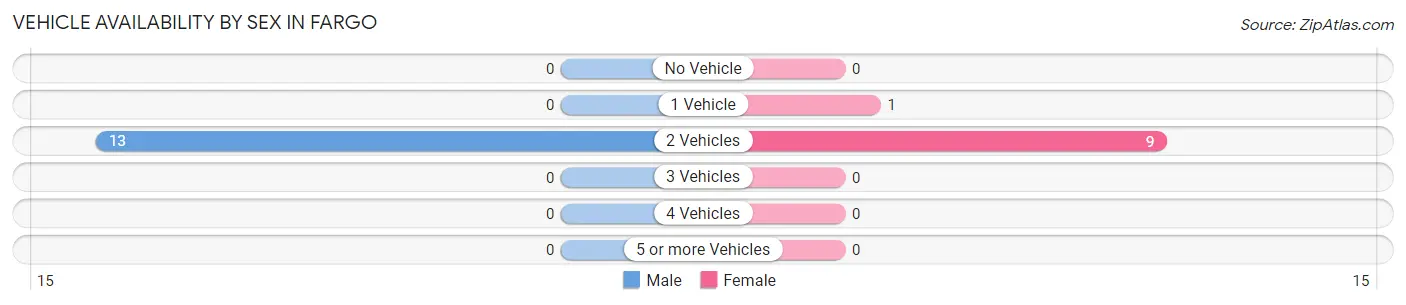
| Vehicles Available | Male | Female |
| No Vehicle | 0 (0.0%) | 0 (0.0%) |
| 1 Vehicle | 0 (0.0%) | 1 (10.0%) |
| 2 Vehicles | 13 (100.0%) | 9 (90.0%) |
| 3 Vehicles | 0 (0.0%) | 0 (0.0%) |
| 4 Vehicles | 0 (0.0%) | 0 (0.0%) |
| 5 or more Vehicles | 0 (0.0%) | 0 (0.0%) |
| Total | 13 (100.0%) | 10 (100.0%) |
Commute Time in Fargo
The most frequently occuring commute durations in Fargo are 15 to 19 minutes (12 commuters, 52.2%), 5 to 9 minutes (7 commuters, 30.4%), and 30 to 34 minutes (3 commuters, 13.0%).
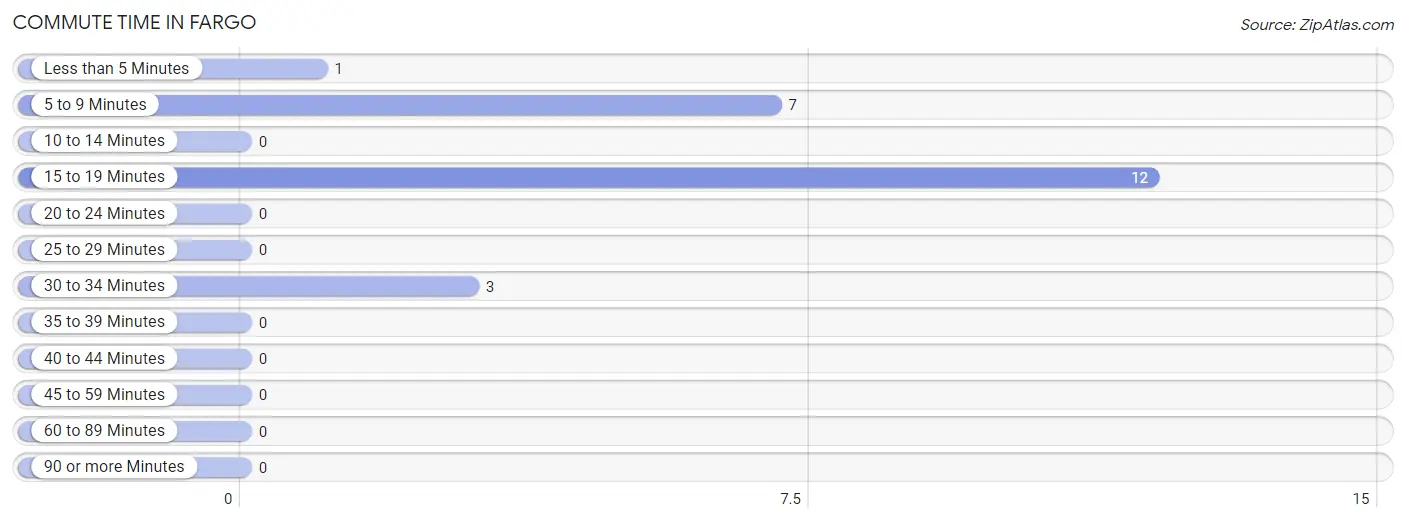
| Commute Time | # Commuters | % Commuters |
| Less than 5 Minutes | 1 | 4.3% |
| 5 to 9 Minutes | 7 | 30.4% |
| 10 to 14 Minutes | 0 | 0.0% |
| 15 to 19 Minutes | 12 | 52.2% |
| 20 to 24 Minutes | 0 | 0.0% |
| 25 to 29 Minutes | 0 | 0.0% |
| 30 to 34 Minutes | 3 | 13.0% |
| 35 to 39 Minutes | 0 | 0.0% |
| 40 to 44 Minutes | 0 | 0.0% |
| 45 to 59 Minutes | 0 | 0.0% |
| 60 to 89 Minutes | 0 | 0.0% |
| 90 or more Minutes | 0 | 0.0% |
Commute Time by Sex in Fargo
The most common commute times in Fargo are 15 to 19 minutes (6 commuters, 46.2%) for males and 15 to 19 minutes (6 commuters, 60.0%) for females.
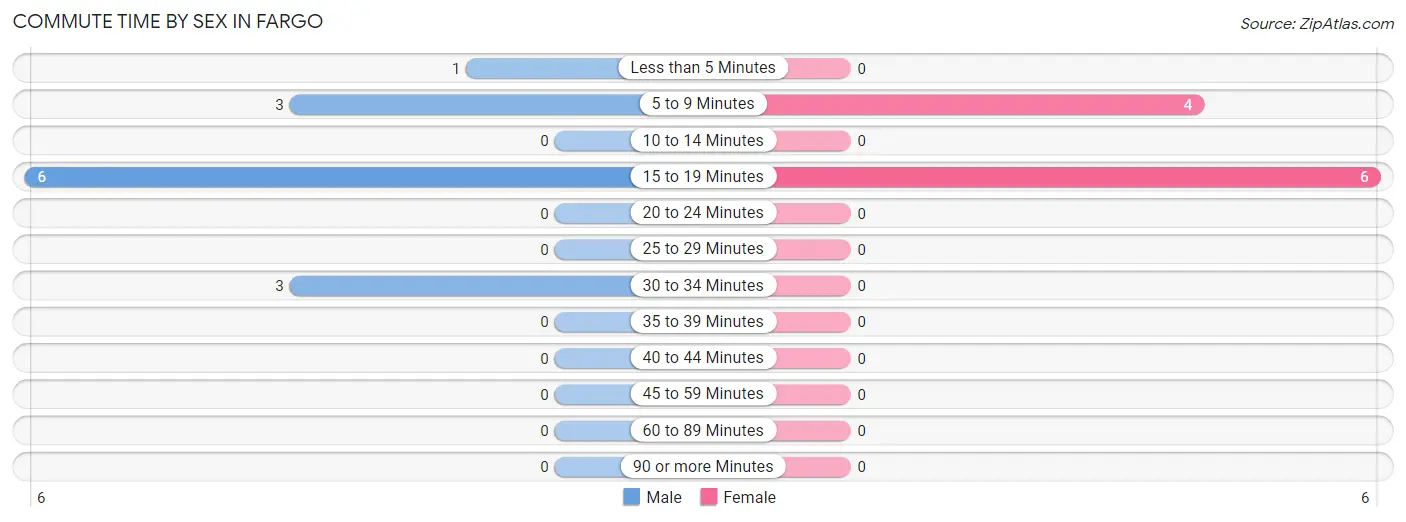
| Commute Time | Male | Female |
| Less than 5 Minutes | 1 (7.7%) | 0 (0.0%) |
| 5 to 9 Minutes | 3 (23.1%) | 4 (40.0%) |
| 10 to 14 Minutes | 0 (0.0%) | 0 (0.0%) |
| 15 to 19 Minutes | 6 (46.2%) | 6 (60.0%) |
| 20 to 24 Minutes | 0 (0.0%) | 0 (0.0%) |
| 25 to 29 Minutes | 0 (0.0%) | 0 (0.0%) |
| 30 to 34 Minutes | 3 (23.1%) | 0 (0.0%) |
| 35 to 39 Minutes | 0 (0.0%) | 0 (0.0%) |
| 40 to 44 Minutes | 0 (0.0%) | 0 (0.0%) |
| 45 to 59 Minutes | 0 (0.0%) | 0 (0.0%) |
| 60 to 89 Minutes | 0 (0.0%) | 0 (0.0%) |
| 90 or more Minutes | 0 (0.0%) | 0 (0.0%) |
Time of Departure to Work by Sex in Fargo
The most frequent times of departure to work in Fargo are 6:00 AM to 6:29 AM (6, 46.2%) for males and 12:00 AM to 4:59 AM (3, 30.0%) for females.
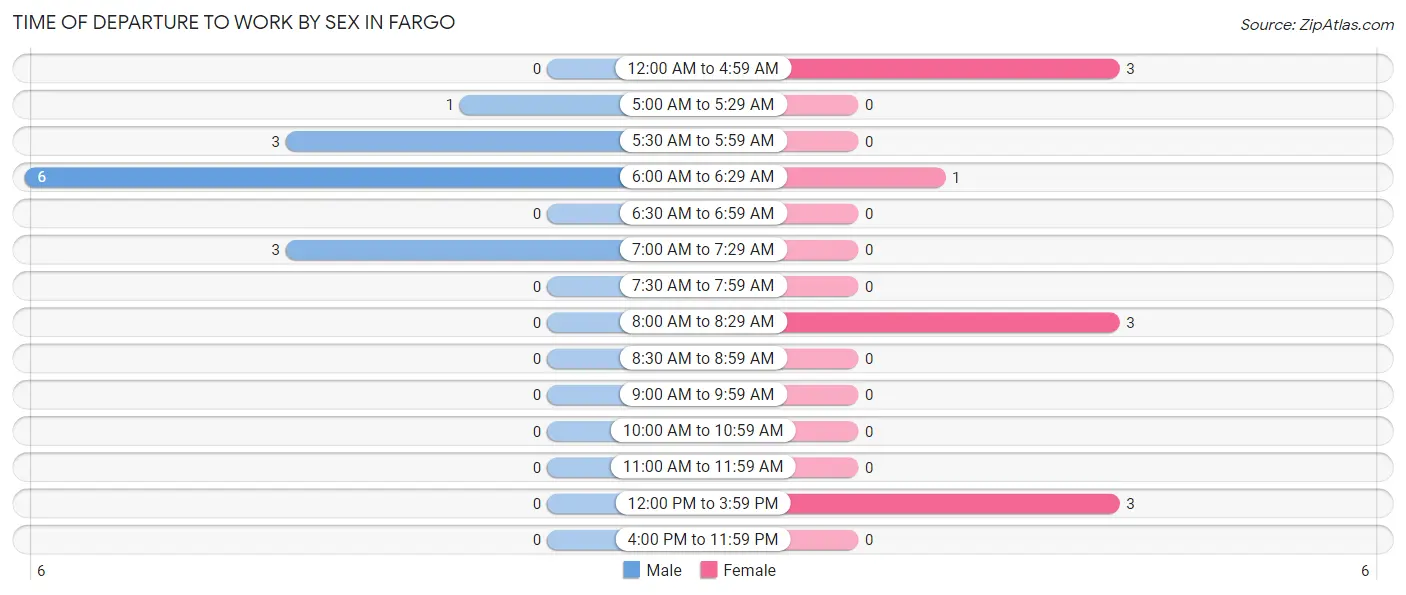
| Time of Departure | Male | Female |
| 12:00 AM to 4:59 AM | 0 (0.0%) | 3 (30.0%) |
| 5:00 AM to 5:29 AM | 1 (7.7%) | 0 (0.0%) |
| 5:30 AM to 5:59 AM | 3 (23.1%) | 0 (0.0%) |
| 6:00 AM to 6:29 AM | 6 (46.2%) | 1 (10.0%) |
| 6:30 AM to 6:59 AM | 0 (0.0%) | 0 (0.0%) |
| 7:00 AM to 7:29 AM | 3 (23.1%) | 0 (0.0%) |
| 7:30 AM to 7:59 AM | 0 (0.0%) | 0 (0.0%) |
| 8:00 AM to 8:29 AM | 0 (0.0%) | 3 (30.0%) |
| 8:30 AM to 8:59 AM | 0 (0.0%) | 0 (0.0%) |
| 9:00 AM to 9:59 AM | 0 (0.0%) | 0 (0.0%) |
| 10:00 AM to 10:59 AM | 0 (0.0%) | 0 (0.0%) |
| 11:00 AM to 11:59 AM | 0 (0.0%) | 0 (0.0%) |
| 12:00 PM to 3:59 PM | 0 (0.0%) | 3 (30.0%) |
| 4:00 PM to 11:59 PM | 0 (0.0%) | 0 (0.0%) |
| Total | 13 (100.0%) | 10 (100.0%) |
Housing Occupancy in Fargo
Occupancy by Ownership in Fargo
Of the total 27 dwellings in Fargo, owner-occupied units account for 22 (81.5%), while renter-occupied units make up 5 (18.5%).
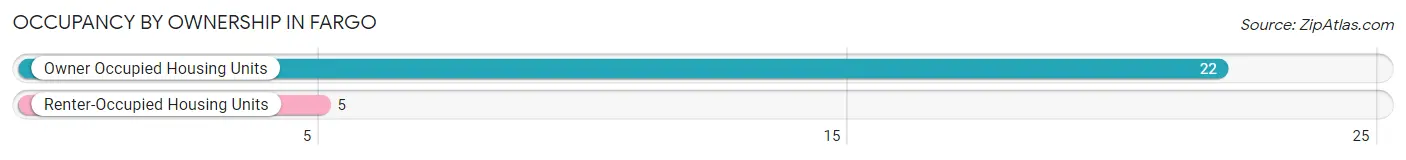
| Occupancy | # Housing Units | % Housing Units |
| Owner Occupied Housing Units | 22 | 81.5% |
| Renter-Occupied Housing Units | 5 | 18.5% |
| Total Occupied Housing Units | 27 | 100.0% |
Occupancy by Household Size in Fargo
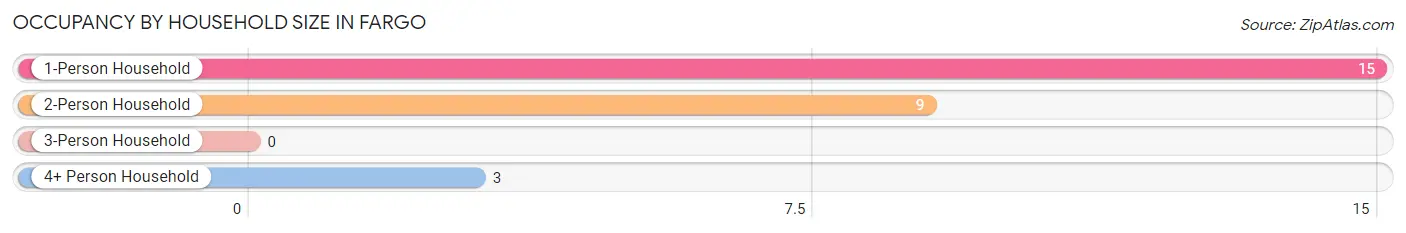
| Household Size | # Housing Units | % Housing Units |
| 1-Person Household | 15 | 55.6% |
| 2-Person Household | 9 | 33.3% |
| 3-Person Household | 0 | 0.0% |
| 4+ Person Household | 3 | 11.1% |
| Total Housing Units | 27 | 100.0% |
Occupancy by Ownership by Household Size in Fargo
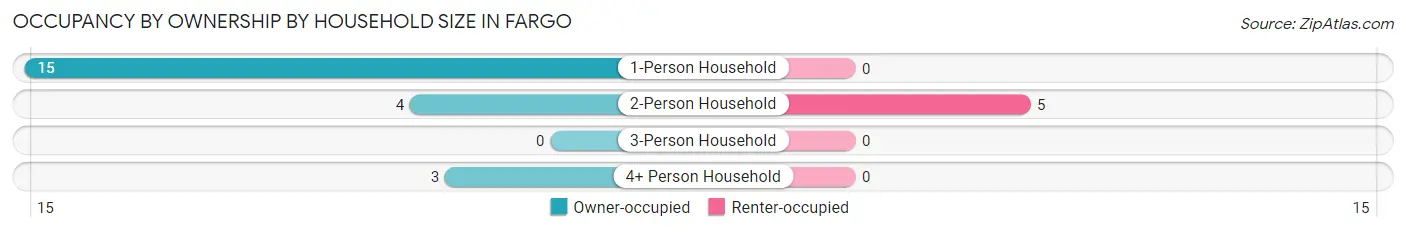
| Household Size | Owner-occupied | Renter-occupied |
| 1-Person Household | 15 (100.0%) | 0 (0.0%) |
| 2-Person Household | 4 (44.4%) | 5 (55.6%) |
| 3-Person Household | 0 (0.0%) | 0 (0.0%) |
| 4+ Person Household | 3 (100.0%) | 0 (0.0%) |
| Total Housing Units | 22 (81.5%) | 5 (18.5%) |
Occupancy by Educational Attainment in Fargo
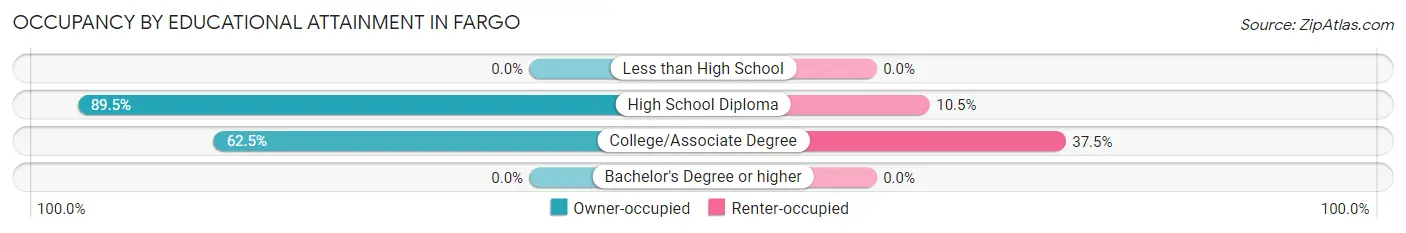
| Household Size | Owner-occupied | Renter-occupied |
| Less than High School | 0 (0.0%) | 0 (0.0%) |
| High School Diploma | 17 (89.5%) | 2 (10.5%) |
| College/Associate Degree | 5 (62.5%) | 3 (37.5%) |
| Bachelor's Degree or higher | 0 (0.0%) | 0 (0.0%) |
Occupancy by Age of Householder in Fargo
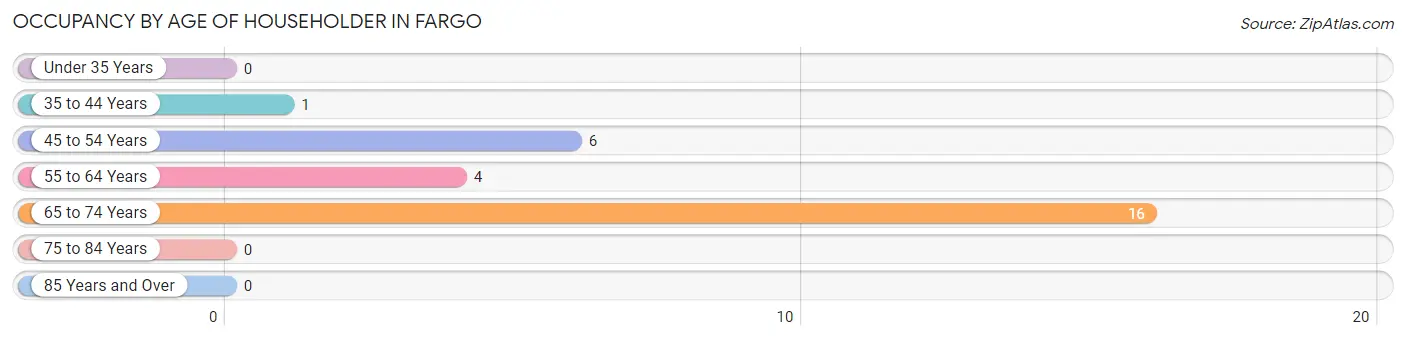
| Age Bracket | # Households | % Households |
| Under 35 Years | 0 | 0.0% |
| 35 to 44 Years | 1 | 3.7% |
| 45 to 54 Years | 6 | 22.2% |
| 55 to 64 Years | 4 | 14.8% |
| 65 to 74 Years | 16 | 59.3% |
| 75 to 84 Years | 0 | 0.0% |
| 85 Years and Over | 0 | 0.0% |
| Total | 27 | 100.0% |
Housing Finances in Fargo
Median Income by Occupancy in Fargo
| Occupancy Type | # Households | Median Income |
| Owner-Occupied | 22 (81.5%) | $0 |
| Renter-Occupied | 5 (18.5%) | $0 |
| Average | 27 (100.0%) | $0 |
Occupancy by Householder Income Bracket in Fargo
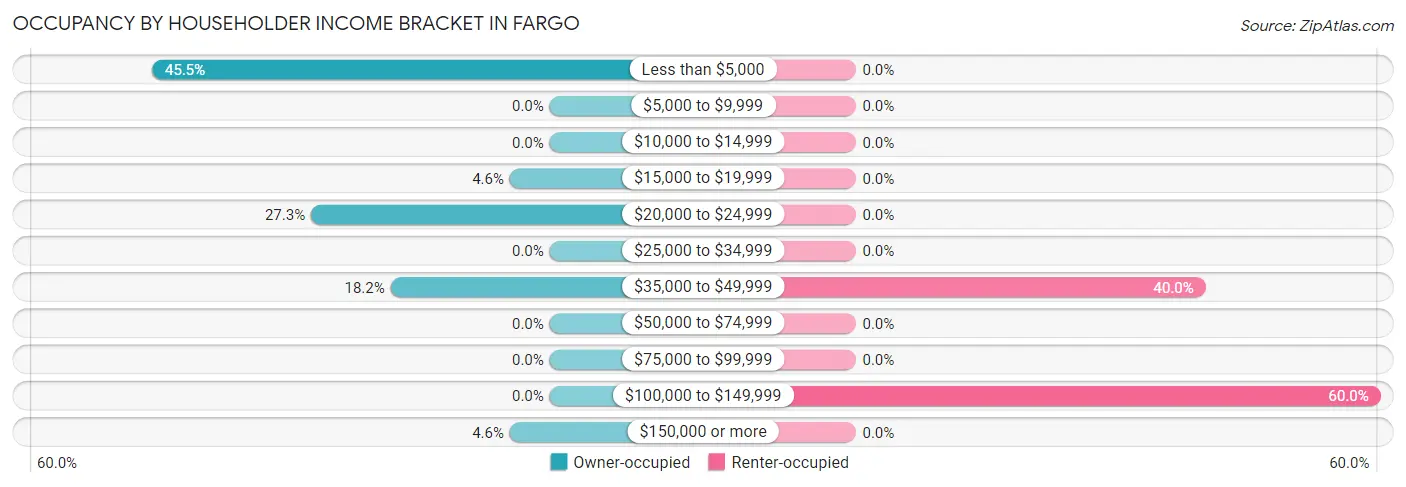
| Income Bracket | Owner-occupied | Renter-occupied |
| Less than $5,000 | 10 (45.5%) | 0 (0.0%) |
| $5,000 to $9,999 | 0 (0.0%) | 0 (0.0%) |
| $10,000 to $14,999 | 0 (0.0%) | 0 (0.0%) |
| $15,000 to $19,999 | 1 (4.5%) | 0 (0.0%) |
| $20,000 to $24,999 | 6 (27.3%) | 0 (0.0%) |
| $25,000 to $34,999 | 0 (0.0%) | 0 (0.0%) |
| $35,000 to $49,999 | 4 (18.2%) | 2 (40.0%) |
| $50,000 to $74,999 | 0 (0.0%) | 0 (0.0%) |
| $75,000 to $99,999 | 0 (0.0%) | 0 (0.0%) |
| $100,000 to $149,999 | 0 (0.0%) | 3 (60.0%) |
| $150,000 or more | 1 (4.5%) | 0 (0.0%) |
| Total | 22 (100.0%) | 5 (100.0%) |
Monthly Housing Cost Tiers in Fargo
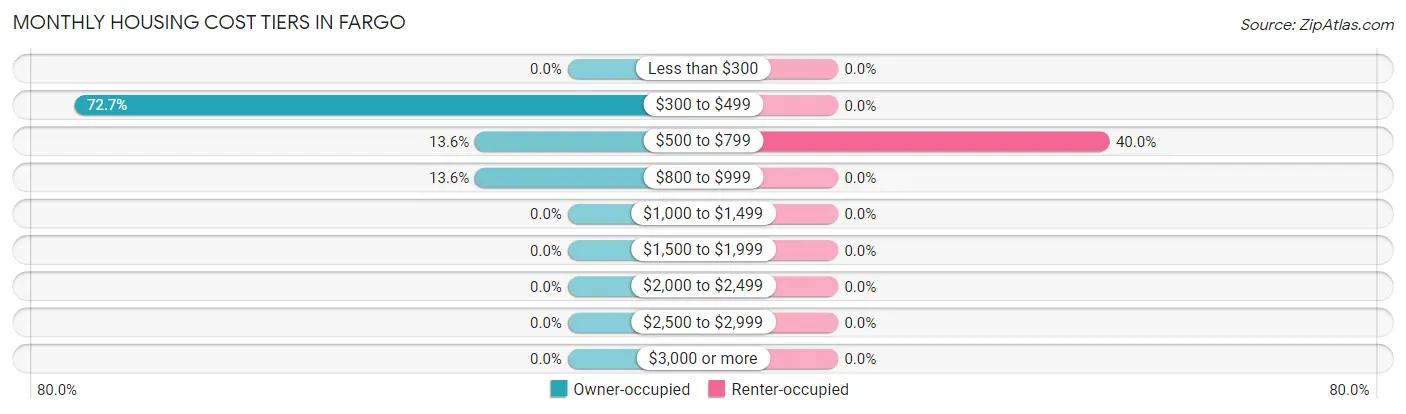
| Monthly Cost | Owner-occupied | Renter-occupied |
| Less than $300 | 0 (0.0%) | 0 (0.0%) |
| $300 to $499 | 16 (72.7%) | 0 (0.0%) |
| $500 to $799 | 3 (13.6%) | 2 (40.0%) |
| $800 to $999 | 3 (13.6%) | 0 (0.0%) |
| $1,000 to $1,499 | 0 (0.0%) | 0 (0.0%) |
| $1,500 to $1,999 | 0 (0.0%) | 0 (0.0%) |
| $2,000 to $2,499 | 0 (0.0%) | 0 (0.0%) |
| $2,500 to $2,999 | 0 (0.0%) | 0 (0.0%) |
| $3,000 or more | 0 (0.0%) | 0 (0.0%) |
| Total | 22 (100.0%) | 5 (100.0%) |
Physical Housing Characteristics in Fargo
Housing Structures in Fargo
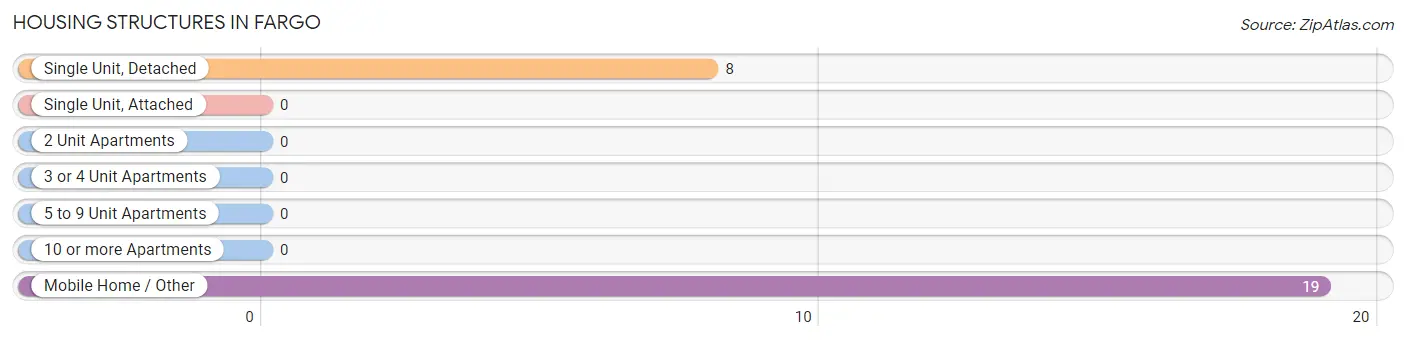
| Structure Type | # Housing Units | % Housing Units |
| Single Unit, Detached | 8 | 29.6% |
| Single Unit, Attached | 0 | 0.0% |
| 2 Unit Apartments | 0 | 0.0% |
| 3 or 4 Unit Apartments | 0 | 0.0% |
| 5 to 9 Unit Apartments | 0 | 0.0% |
| 10 or more Apartments | 0 | 0.0% |
| Mobile Home / Other | 19 | 70.4% |
| Total | 27 | 100.0% |
Housing Structures by Occupancy in Fargo
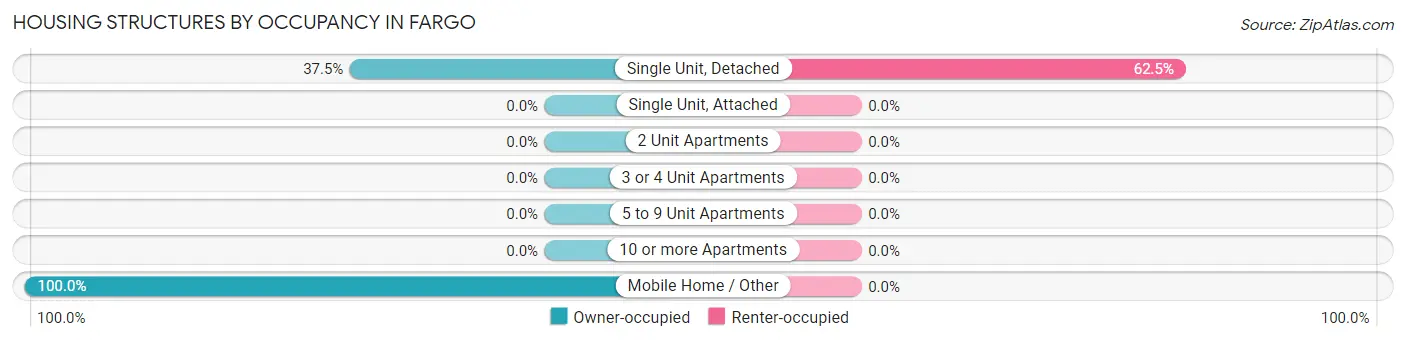
| Structure Type | Owner-occupied | Renter-occupied |
| Single Unit, Detached | 3 (37.5%) | 5 (62.5%) |
| Single Unit, Attached | 0 (0.0%) | 0 (0.0%) |
| 2 Unit Apartments | 0 (0.0%) | 0 (0.0%) |
| 3 or 4 Unit Apartments | 0 (0.0%) | 0 (0.0%) |
| 5 to 9 Unit Apartments | 0 (0.0%) | 0 (0.0%) |
| 10 or more Apartments | 0 (0.0%) | 0 (0.0%) |
| Mobile Home / Other | 19 (100.0%) | 0 (0.0%) |
| Total | 22 (81.5%) | 5 (18.5%) |
Housing Structures by Number of Rooms in Fargo
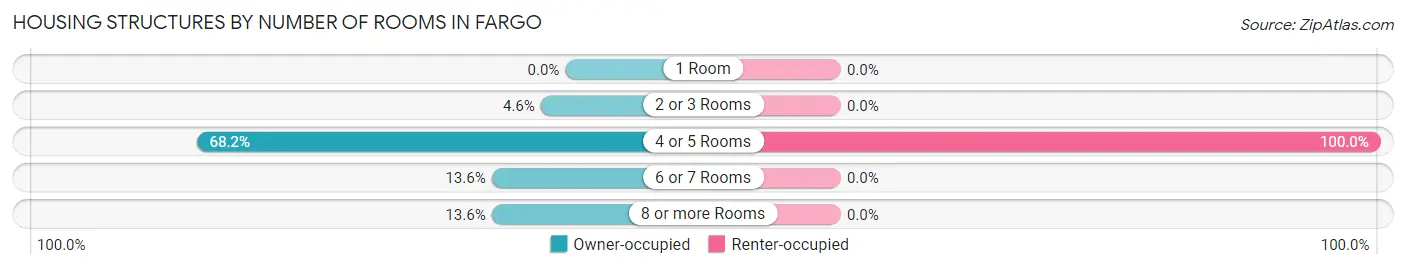
| Number of Rooms | Owner-occupied | Renter-occupied |
| 1 Room | 0 (0.0%) | 0 (0.0%) |
| 2 or 3 Rooms | 1 (4.5%) | 0 (0.0%) |
| 4 or 5 Rooms | 15 (68.2%) | 5 (100.0%) |
| 6 or 7 Rooms | 3 (13.6%) | 0 (0.0%) |
| 8 or more Rooms | 3 (13.6%) | 0 (0.0%) |
| Total | 22 (100.0%) | 5 (100.0%) |
Housing Structure by Heating Type in Fargo
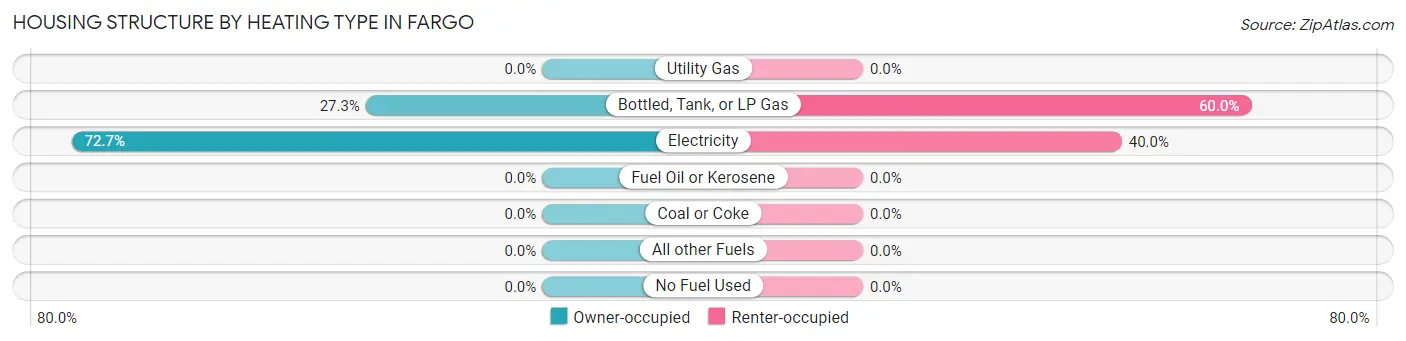
| Heating Type | Owner-occupied | Renter-occupied |
| Utility Gas | 0 (0.0%) | 0 (0.0%) |
| Bottled, Tank, or LP Gas | 6 (27.3%) | 3 (60.0%) |
| Electricity | 16 (72.7%) | 2 (40.0%) |
| Fuel Oil or Kerosene | 0 (0.0%) | 0 (0.0%) |
| Coal or Coke | 0 (0.0%) | 0 (0.0%) |
| All other Fuels | 0 (0.0%) | 0 (0.0%) |
| No Fuel Used | 0 (0.0%) | 0 (0.0%) |
| Total | 22 (100.0%) | 5 (100.0%) |
Household Vehicle Usage in Fargo
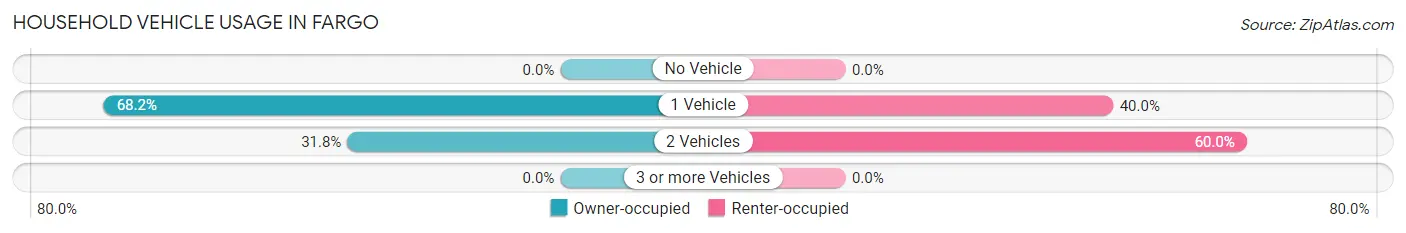
| Vehicles per Household | Owner-occupied | Renter-occupied |
| No Vehicle | 0 (0.0%) | 0 (0.0%) |
| 1 Vehicle | 15 (68.2%) | 2 (40.0%) |
| 2 Vehicles | 7 (31.8%) | 3 (60.0%) |
| 3 or more Vehicles | 0 (0.0%) | 0 (0.0%) |
| Total | 22 (100.0%) | 5 (100.0%) |
Real Estate & Mortgages in Fargo
Real Estate and Mortgage Overview in Fargo
| Characteristic | Without Mortgage | With Mortgage |
| Housing Units | 9 | 13 |
| Median Property Value | - | - |
| Median Household Income | $37,813 | $0 |
| Monthly Housing Costs | $470 | $0 |
| Real Estate Taxes | $325 | $0 |
Property Value by Mortgage Status in Fargo
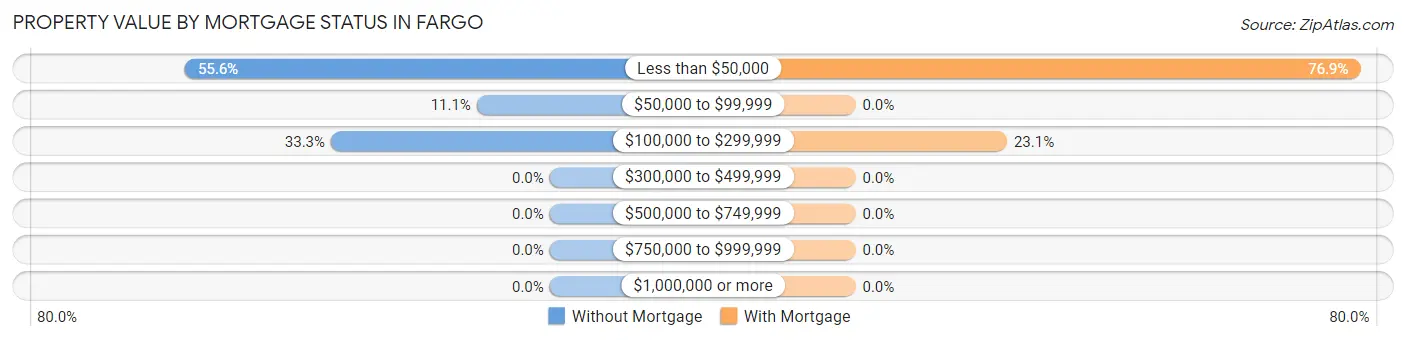
| Property Value | Without Mortgage | With Mortgage |
| Less than $50,000 | 5 (55.6%) | 10 (76.9%) |
| $50,000 to $99,999 | 1 (11.1%) | 0 (0.0%) |
| $100,000 to $299,999 | 3 (33.3%) | 3 (23.1%) |
| $300,000 to $499,999 | 0 (0.0%) | 0 (0.0%) |
| $500,000 to $749,999 | 0 (0.0%) | 0 (0.0%) |
| $750,000 to $999,999 | 0 (0.0%) | 0 (0.0%) |
| $1,000,000 or more | 0 (0.0%) | 0 (0.0%) |
| Total | 9 (100.0%) | 13 (100.0%) |
Household Income by Mortgage Status in Fargo
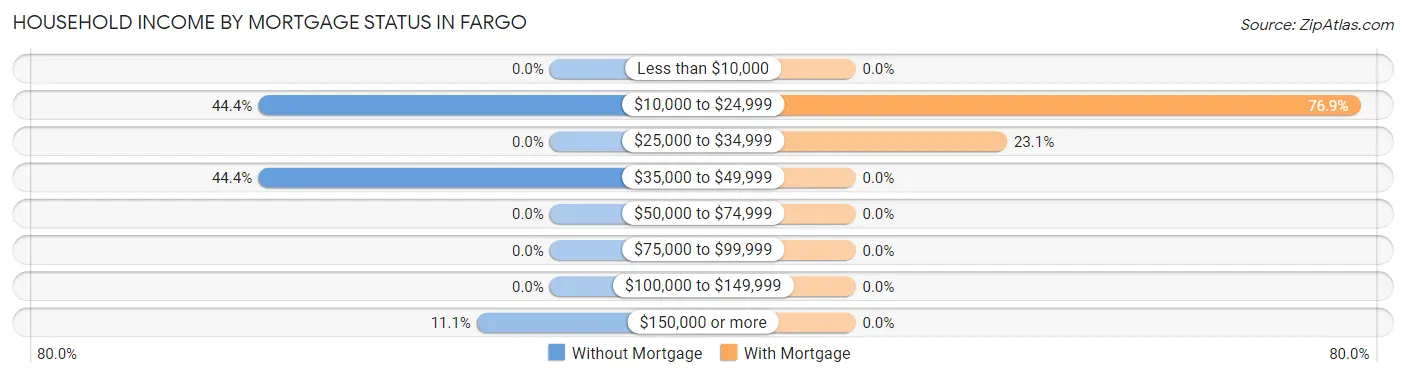
| Household Income | Without Mortgage | With Mortgage |
| Less than $10,000 | 0 (0.0%) | 0 (0.0%) |
| $10,000 to $24,999 | 4 (44.4%) | 10 (76.9%) |
| $25,000 to $34,999 | 0 (0.0%) | 3 (23.1%) |
| $35,000 to $49,999 | 4 (44.4%) | 0 (0.0%) |
| $50,000 to $74,999 | 0 (0.0%) | 0 (0.0%) |
| $75,000 to $99,999 | 0 (0.0%) | 0 (0.0%) |
| $100,000 to $149,999 | 0 (0.0%) | 0 (0.0%) |
| $150,000 or more | 1 (11.1%) | 0 (0.0%) |
| Total | 9 (100.0%) | 13 (100.0%) |
Property Value to Household Income Ratio in Fargo
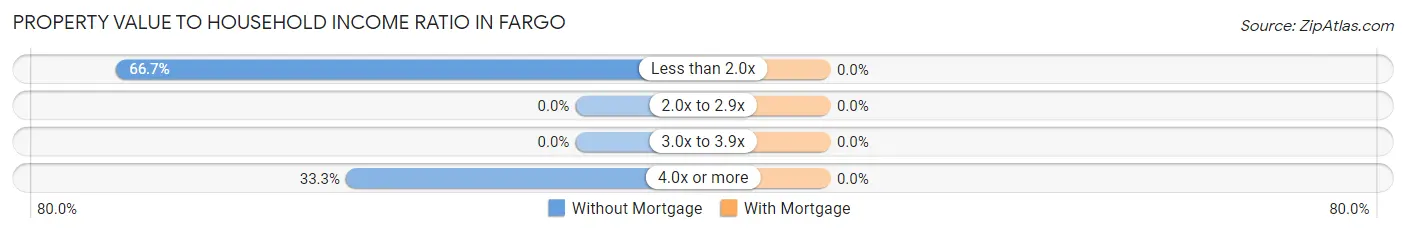
| Value-to-Income Ratio | Without Mortgage | With Mortgage |
| Less than 2.0x | 6 (66.7%) | 0 (0.0%) |
| 2.0x to 2.9x | 0 (0.0%) | 0 (0.0%) |
| 3.0x to 3.9x | 0 (0.0%) | 0 (0.0%) |
| 4.0x or more | 3 (33.3%) | 0 (0.0%) |
| Total | 9 (100.0%) | 13 (100.0%) |
Real Estate Taxes by Mortgage Status in Fargo
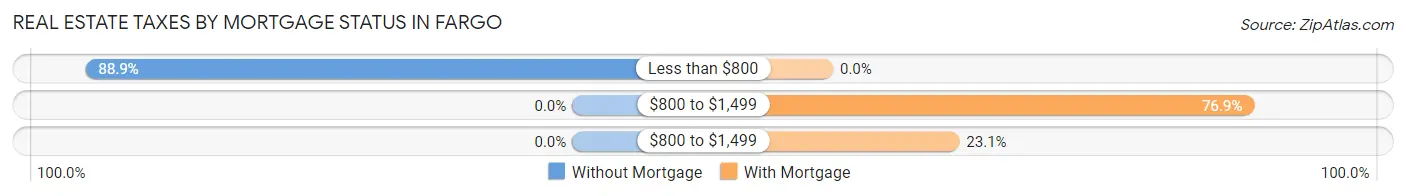
| Property Taxes | Without Mortgage | With Mortgage |
| Less than $800 | 8 (88.9%) | 0 (0.0%) |
| $800 to $1,499 | 0 (0.0%) | 10 (76.9%) |
| $800 to $1,499 | 0 (0.0%) | 3 (23.1%) |
| Total | 9 (100.0%) | 13 (100.0%) |
Health & Disability in Fargo
Health Insurance Coverage by Age in Fargo
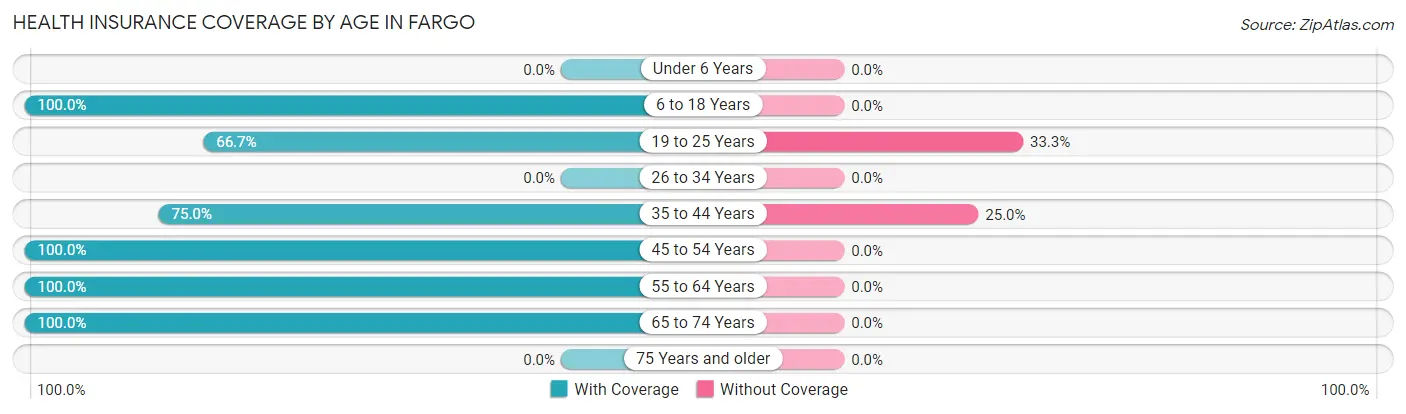
| Age Bracket | With Coverage | Without Coverage |
| Under 6 Years | 0 (0.0%) | 0 (0.0%) |
| 6 to 18 Years | 10 (100.0%) | 0 (0.0%) |
| 19 to 25 Years | 6 (66.7%) | 3 (33.3%) |
| 26 to 34 Years | 0 (0.0%) | 0 (0.0%) |
| 35 to 44 Years | 3 (75.0%) | 1 (25.0%) |
| 45 to 54 Years | 9 (100.0%) | 0 (0.0%) |
| 55 to 64 Years | 4 (100.0%) | 0 (0.0%) |
| 65 to 74 Years | 25 (100.0%) | 0 (0.0%) |
| 75 Years and older | 0 (0.0%) | 0 (0.0%) |
| Total | 57 (93.4%) | 4 (6.6%) |
Health Insurance Coverage by Citizenship Status in Fargo

| Citizenship Status | With Coverage | Without Coverage |
| Native Born | 0 (0.0%) | 0 (0.0%) |
| Foreign Born, Citizen | 10 (100.0%) | 0 (0.0%) |
| Foreign Born, not a Citizen | 6 (66.7%) | 3 (33.3%) |
Health Insurance Coverage by Household Income in Fargo
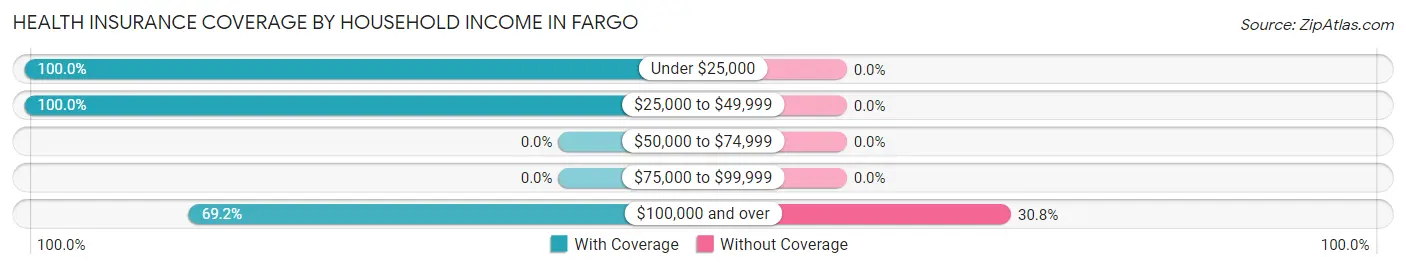
| Household Income | With Coverage | Without Coverage |
| Under $25,000 | 30 (100.0%) | 0 (0.0%) |
| $25,000 to $49,999 | 18 (100.0%) | 0 (0.0%) |
| $50,000 to $74,999 | 0 (0.0%) | 0 (0.0%) |
| $75,000 to $99,999 | 0 (0.0%) | 0 (0.0%) |
| $100,000 and over | 9 (69.2%) | 4 (30.8%) |
Public vs Private Health Insurance Coverage by Age in Fargo
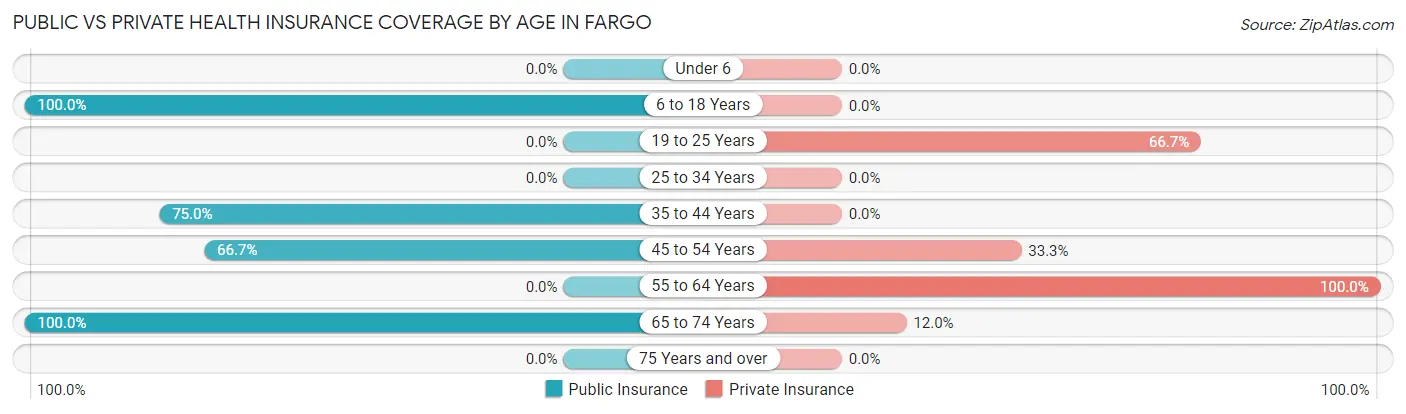
| Age Bracket | Public Insurance | Private Insurance |
| Under 6 | 0 (0.0%) | 0 (0.0%) |
| 6 to 18 Years | 10 (100.0%) | 0 (0.0%) |
| 19 to 25 Years | 0 (0.0%) | 6 (66.7%) |
| 25 to 34 Years | 0 (0.0%) | 0 (0.0%) |
| 35 to 44 Years | 3 (75.0%) | 0 (0.0%) |
| 45 to 54 Years | 6 (66.7%) | 3 (33.3%) |
| 55 to 64 Years | 0 (0.0%) | 4 (100.0%) |
| 65 to 74 Years | 25 (100.0%) | 3 (12.0%) |
| 75 Years and over | 0 (0.0%) | 0 (0.0%) |
| Total | 44 (72.1%) | 16 (26.2%) |
Disability Status by Sex by Age in Fargo
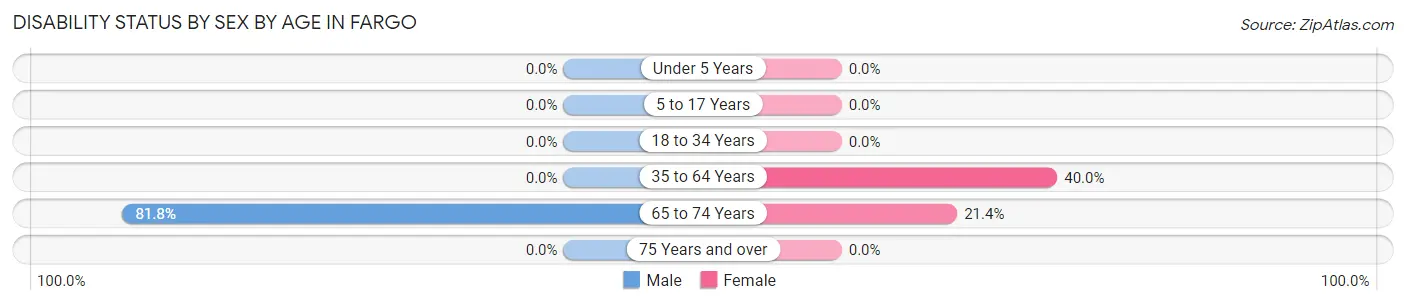
| Age Bracket | Male | Female |
| Under 5 Years | 0 (0.0%) | 0 (0.0%) |
| 5 to 17 Years | 0 (0.0%) | 0 (0.0%) |
| 18 to 34 Years | 0 (0.0%) | 0 (0.0%) |
| 35 to 64 Years | 0 (0.0%) | 4 (40.0%) |
| 65 to 74 Years | 9 (81.8%) | 3 (21.4%) |
| 75 Years and over | 0 (0.0%) | 0 (0.0%) |
Disability Class by Sex by Age in Fargo
Disability Class: Hearing Difficulty
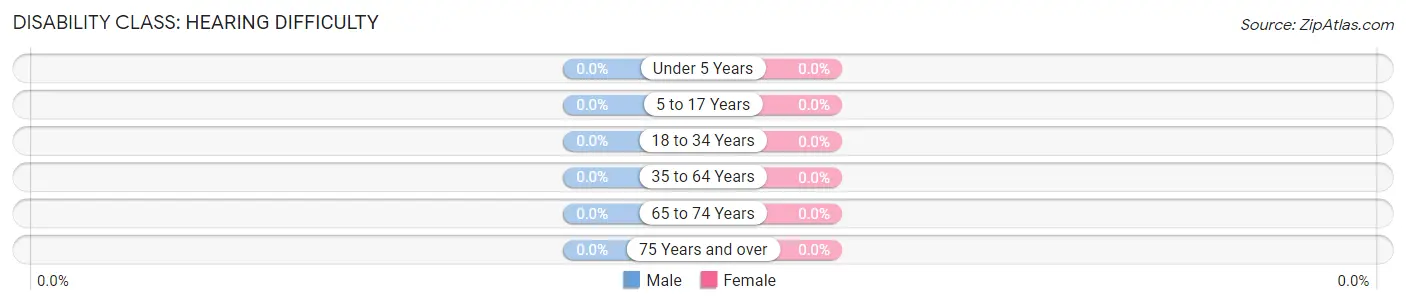
| Age Bracket | Male | Female |
| Under 5 Years | 0 (0.0%) | 0 (0.0%) |
| 5 to 17 Years | 0 (0.0%) | 0 (0.0%) |
| 18 to 34 Years | 0 (0.0%) | 0 (0.0%) |
| 35 to 64 Years | 0 (0.0%) | 0 (0.0%) |
| 65 to 74 Years | 0 (0.0%) | 0 (0.0%) |
| 75 Years and over | 0 (0.0%) | 0 (0.0%) |
Disability Class: Vision Difficulty
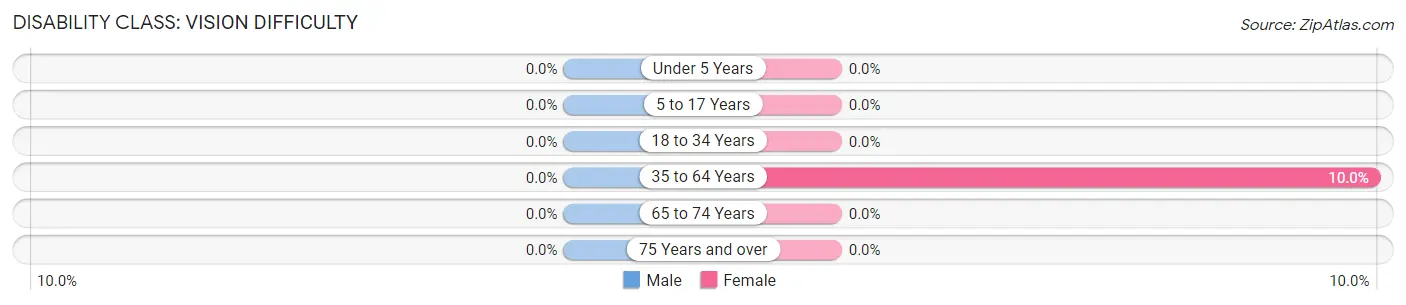
| Age Bracket | Male | Female |
| Under 5 Years | 0 (0.0%) | 0 (0.0%) |
| 5 to 17 Years | 0 (0.0%) | 0 (0.0%) |
| 18 to 34 Years | 0 (0.0%) | 0 (0.0%) |
| 35 to 64 Years | 0 (0.0%) | 1 (10.0%) |
| 65 to 74 Years | 0 (0.0%) | 0 (0.0%) |
| 75 Years and over | 0 (0.0%) | 0 (0.0%) |
Disability Class: Cognitive Difficulty

| Age Bracket | Male | Female |
| 5 to 17 Years | 0 (0.0%) | 0 (0.0%) |
| 18 to 34 Years | 0 (0.0%) | 0 (0.0%) |
| 35 to 64 Years | 0 (0.0%) | 3 (30.0%) |
| 65 to 74 Years | 9 (81.8%) | 0 (0.0%) |
| 75 Years and over | 0 (0.0%) | 0 (0.0%) |
Disability Class: Ambulatory Difficulty
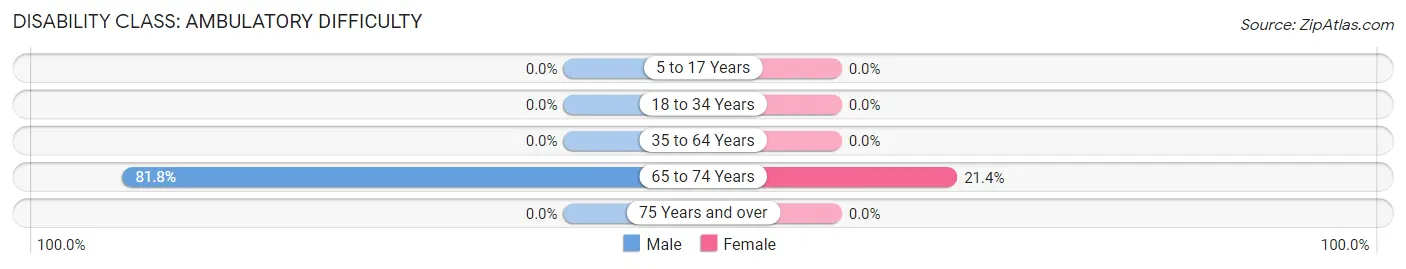
| Age Bracket | Male | Female |
| 5 to 17 Years | 0 (0.0%) | 0 (0.0%) |
| 18 to 34 Years | 0 (0.0%) | 0 (0.0%) |
| 35 to 64 Years | 0 (0.0%) | 0 (0.0%) |
| 65 to 74 Years | 9 (81.8%) | 3 (21.4%) |
| 75 Years and over | 0 (0.0%) | 0 (0.0%) |
Disability Class: Self-Care Difficulty
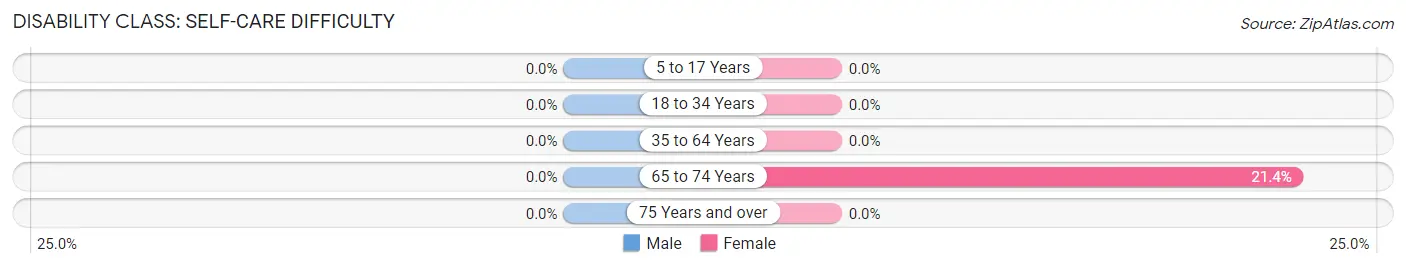
| Age Bracket | Male | Female |
| 5 to 17 Years | 0 (0.0%) | 0 (0.0%) |
| 18 to 34 Years | 0 (0.0%) | 0 (0.0%) |
| 35 to 64 Years | 0 (0.0%) | 0 (0.0%) |
| 65 to 74 Years | 0 (0.0%) | 3 (21.4%) |
| 75 Years and over | 0 (0.0%) | 0 (0.0%) |
Technology Access in Fargo
Computing Device Access in Fargo
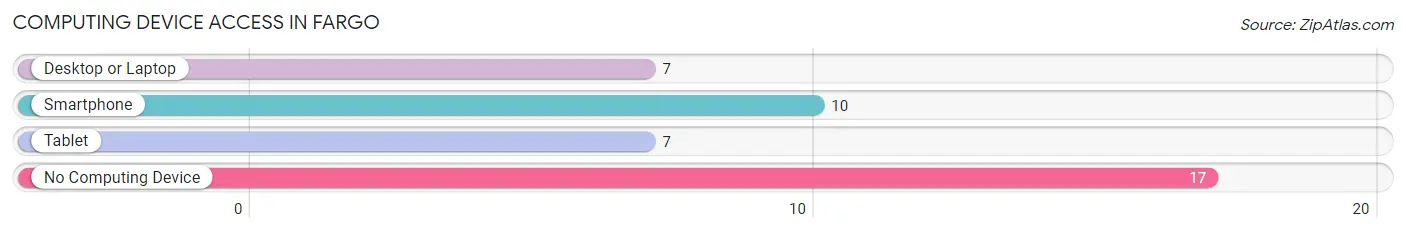
| Device Type | # Households | % Households |
| Desktop or Laptop | 7 | 25.9% |
| Smartphone | 10 | 37.0% |
| Tablet | 7 | 25.9% |
| No Computing Device | 17 | 63.0% |
| Total | 27 | 100.0% |
Internet Access in Fargo
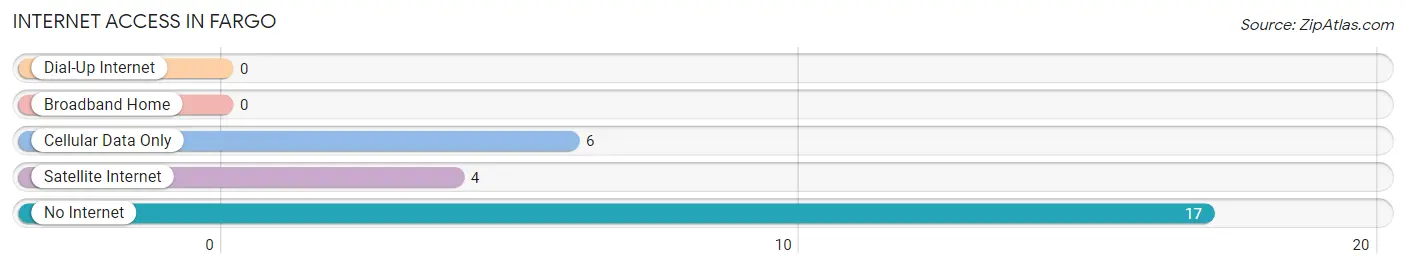
| Internet Type | # Households | % Households |
| Dial-Up Internet | 0 | 0.0% |
| Broadband Home | 0 | 0.0% |
| Cellular Data Only | 6 | 22.2% |
| Satellite Internet | 4 | 14.8% |
| No Internet | 17 | 63.0% |
| Total | 27 | 100.0% |
Fargo Summary
Fargo is a small town located in the northwest corner of Arkansas, in the Ozark Mountains. It is situated in the foothills of the Ozarks, and is surrounded by the White River and its tributaries. The town is located in Madison County, and is part of the Fayetteville–Springdale–Rogers Metropolitan Statistical Area.
History
Fargo was founded in 1883 by a group of settlers from the nearby town of Huntsville. The town was named after the nearby Fargo Creek, which was named after a local settler, William Fargo. The town was originally a farming community, and the main crops grown were cotton, corn, and wheat.
In the early 1900s, the town began to grow and develop. The first school was built in 1906, and the first post office was established in 1907. The town also had a general store, a blacksmith shop, and a grist mill.
In the 1920s, the town began to experience a period of growth and prosperity. The population increased from around 200 in 1920 to over 500 in 1930. During this time, the town was home to several businesses, including a bank, a hotel, a movie theater, and a variety of stores.
In the 1950s, the town began to decline. The population decreased from over 500 in 1950 to around 300 in 1960. The decline was due to the decline of the local farming industry, as well as the lack of economic opportunities in the area.
Geography
Fargo is located in the northwest corner of Arkansas, in the Ozark Mountains. The town is situated in the foothills of the Ozarks, and is surrounded by the White River and its tributaries. The town is located in Madison County, and is part of the Fayetteville–Springdale–Rogers Metropolitan Statistical Area.
The town has a total area of 0.7 square miles, all of which is land. The town is located at an elevation of 1,072 feet above sea level.
Economy
Fargo’s economy is largely based on agriculture. The town is home to several farms, which produce a variety of crops, including cotton, corn, and wheat. The town also has a few small businesses, including a general store, a blacksmith shop, and a grist mill.
Demographics
As of the 2010 census, Fargo had a population of 441. The racial makeup of the town was 97.3% White, 0.2% African American, 0.2% Native American, 0.2% Asian, 0.2% from other races, and 1.9% from two or more races. Hispanic or Latino of any race were 1.1% of the population.
The median income for a household in the town was $30,000, and the median income for a family was $35,000. The per capita income for the town was $14,000. About 15.2% of the population was below the poverty line.
Common Questions
What is Per Capita Income in Fargo?
Per Capita income in Fargo is $18,597.
What is Inequality or Gini Index in Fargo?
Inequality or Gini Index in Fargo is 0.62.
What is the Total Population of Fargo?
Total Population of Fargo is 61.
What is the Total Male Population of Fargo?
Total Male Population of Fargo is 24.
What is the Total Female Population of Fargo?
Total Female Population of Fargo is 37.
What is the Ratio of Males per 100 Females in Fargo?
There are 64.86 Males per 100 Females in Fargo.
What is the Ratio of Females per 100 Males in Fargo?
There are 154.17 Females per 100 Males in Fargo.
What is the Median Population Age in Fargo?
Median Population Age in Fargo is 54.5 Years.
What is the Average Family Size in Fargo
Average Family Size in Fargo is 3.8 People.
What is the Average Household Size in Fargo
Average Household Size in Fargo is 2.3 People.
How Large is the Labor Force in Fargo?
There are 23 People in the Labor Forcein in Fargo.
What is the Percentage of People in the Labor Force in Fargo?
45.1% of People are in the Labor Force in Fargo.