Mitchellville, AR Map & Demographics
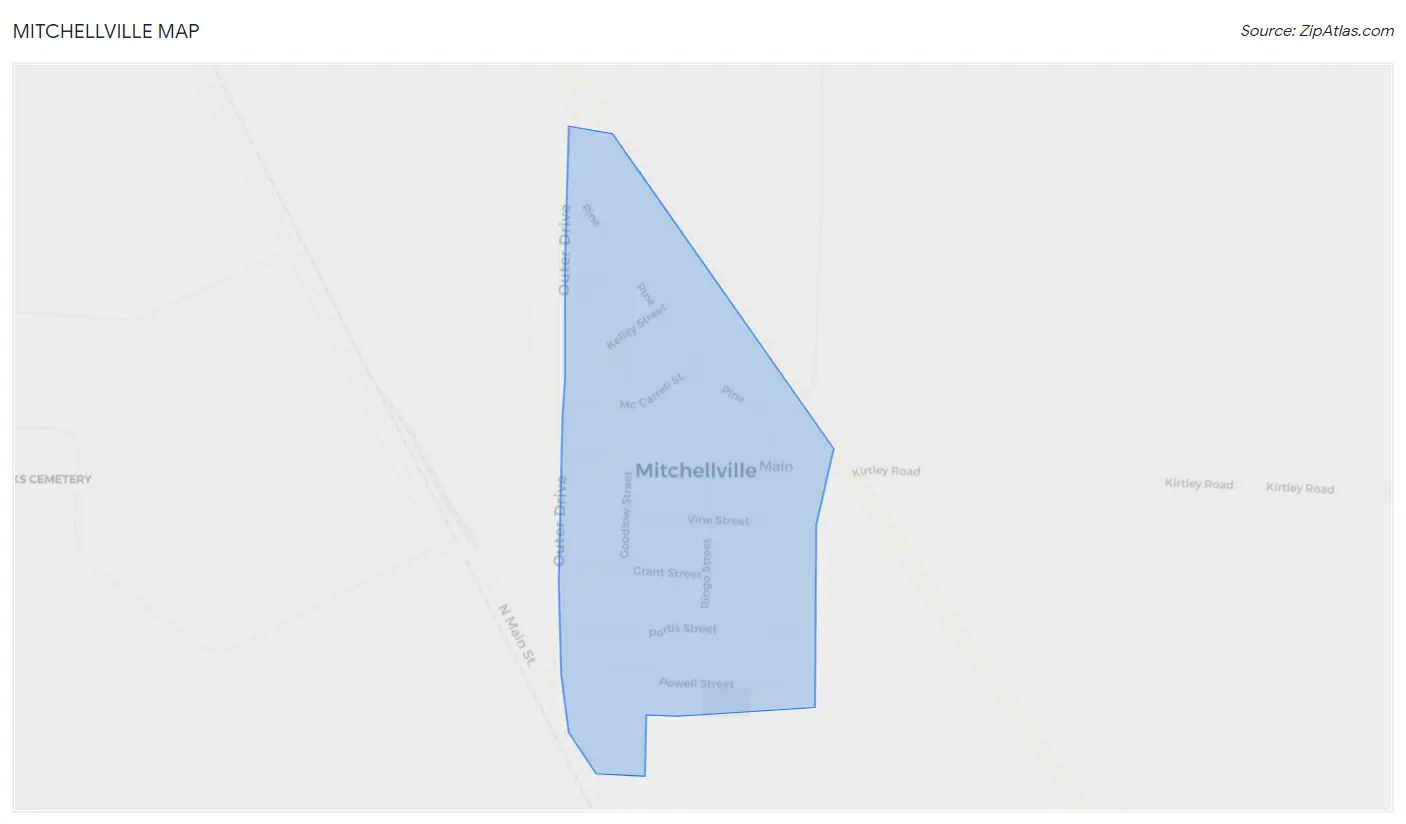
Mitchellville Map
Mitchellville Overview
$15,926
PER CAPITA INCOME
$29,271
AVG FAMILY INCOME
$28,029
AVG HOUSEHOLD INCOME
36.1%
WAGE / INCOME GAP [ % ]
63.9¢/ $1
WAGE / INCOME GAP [ $ ]
$13,836
FAMILY INCOME DEFICIT
0.35
INEQUALITY / GINI INDEX
209
TOTAL POPULATION
91
MALE POPULATION
118
FEMALE POPULATION
77.12
MALES / 100 FEMALES
129.67
FEMALES / 100 MALES
61.1
MEDIAN AGE
2.4
AVG FAMILY SIZE
1.9
AVG HOUSEHOLD SIZE
69
LABOR FORCE [ PEOPLE ]
37.5%
PERCENT IN LABOR FORCE
8.7%
UNEMPLOYMENT RATE
Income in Mitchellville
Income Overview in Mitchellville
Per Capita Income in Mitchellville is $15,926, while median incomes of families and households are $29,271 and $28,029 respectively.
| Characteristic | Number | Measure |
| Per Capita Income | 209 | $15,926 |
| Median Family Income | 68 | $29,271 |
| Mean Family Income | 68 | $34,625 |
| Median Household Income | 113 | $28,029 |
| Mean Household Income | 113 | $30,693 |
| Income Deficit | 68 | $13,836 |
| Wage / Income Gap (%) | 209 | 36.10% |
| Wage / Income Gap ($) | 209 | 63.90¢ per $1 |
| Gini / Inequality Index | 209 | 0.35 |
Earnings by Sex in Mitchellville
Average Earnings in Mitchellville are $17,063, $25,625 for men and $16,375 for women, a difference of 36.1%.
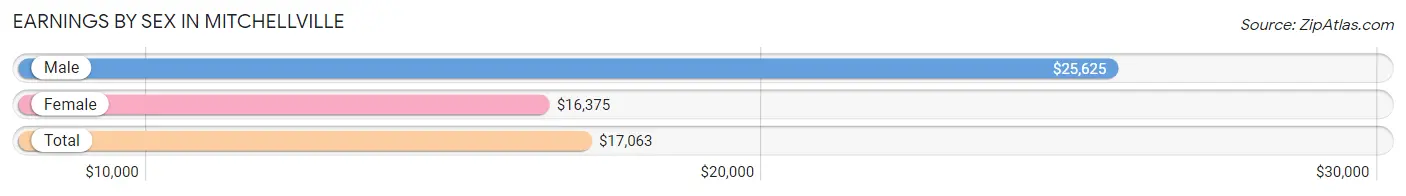
| Sex | Number | Average Earnings |
| Male | 23 (32.4%) | $25,625 |
| Female | 48 (67.6%) | $16,375 |
| Total | 71 (100.0%) | $17,063 |
Earnings by Sex by Income Bracket in Mitchellville
The most common earnings brackets in Mitchellville are $25,000 to $29,999 for men (6 | 26.1%) and $15,000 to $17,499 for women (20 | 41.7%).
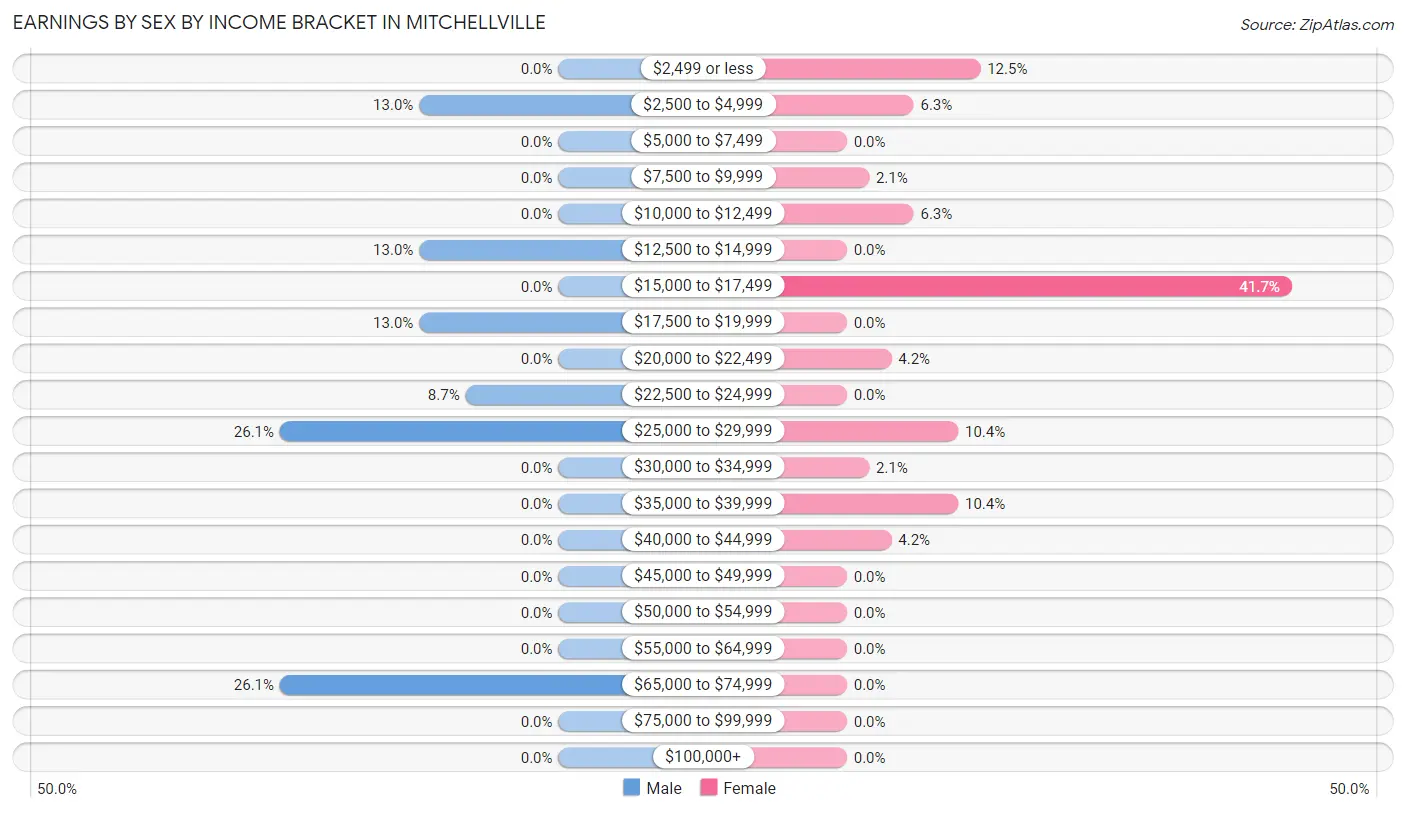
| Income | Male | Female |
| $2,499 or less | 0 (0.0%) | 6 (12.5%) |
| $2,500 to $4,999 | 3 (13.0%) | 3 (6.2%) |
| $5,000 to $7,499 | 0 (0.0%) | 0 (0.0%) |
| $7,500 to $9,999 | 0 (0.0%) | 1 (2.1%) |
| $10,000 to $12,499 | 0 (0.0%) | 3 (6.2%) |
| $12,500 to $14,999 | 3 (13.0%) | 0 (0.0%) |
| $15,000 to $17,499 | 0 (0.0%) | 20 (41.7%) |
| $17,500 to $19,999 | 3 (13.0%) | 0 (0.0%) |
| $20,000 to $22,499 | 0 (0.0%) | 2 (4.2%) |
| $22,500 to $24,999 | 2 (8.7%) | 0 (0.0%) |
| $25,000 to $29,999 | 6 (26.1%) | 5 (10.4%) |
| $30,000 to $34,999 | 0 (0.0%) | 1 (2.1%) |
| $35,000 to $39,999 | 0 (0.0%) | 5 (10.4%) |
| $40,000 to $44,999 | 0 (0.0%) | 2 (4.2%) |
| $45,000 to $49,999 | 0 (0.0%) | 0 (0.0%) |
| $50,000 to $54,999 | 0 (0.0%) | 0 (0.0%) |
| $55,000 to $64,999 | 0 (0.0%) | 0 (0.0%) |
| $65,000 to $74,999 | 6 (26.1%) | 0 (0.0%) |
| $75,000 to $99,999 | 0 (0.0%) | 0 (0.0%) |
| $100,000+ | 0 (0.0%) | 0 (0.0%) |
| Total | 23 (100.0%) | 48 (100.0%) |
Earnings by Sex by Educational Attainment in Mitchellville
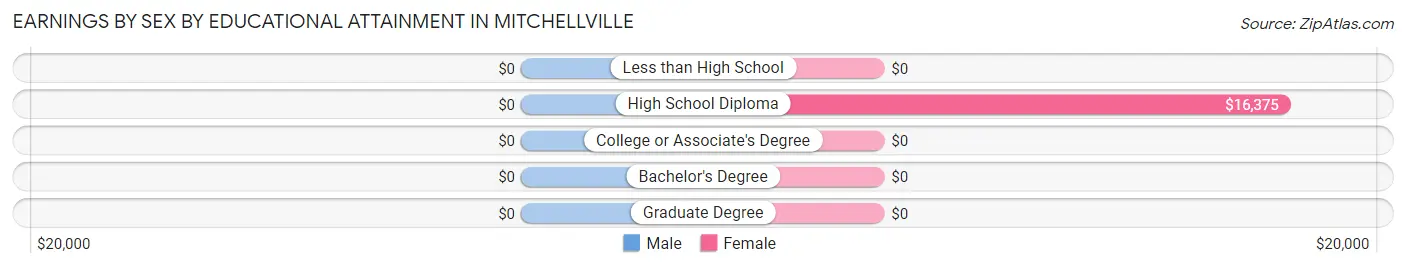
| Educational Attainment | Male Income | Female Income |
| Less than High School | - | - |
| High School Diploma | - | - |
| College or Associate's Degree | - | - |
| Bachelor's Degree | - | - |
| Graduate Degree | - | - |
| Total | $25,625 | $16,250 |
Family Income in Mitchellville
Family Income Brackets in Mitchellville
According to the Mitchellville family income data, there are 27 families falling into the $25,000 to $34,999 income range, which is the most common income bracket and makes up 39.7% of all families.
| Income Bracket | # Families | % Families |
| Less than $10,000 | 5 | 7.4% |
| $10,000 to $14,999 | 6 | 8.8% |
| $15,000 to $24,999 | 3 | 4.4% |
| $25,000 to $34,999 | 27 | 39.7% |
| $35,000 to $49,999 | 12 | 17.6% |
| $50,000 to $74,999 | 13 | 19.1% |
| $75,000 to $99,999 | 2 | 2.9% |
| $100,000 to $149,999 | 0 | 0.0% |
| $150,000 to $199,999 | 0 | 0.0% |
| $200,000+ | 0 | 0.0% |
Family Income by Famaliy Size in Mitchellville
3-person families (17 | 25.0%) account for the highest median family income in Mitchellville with $50,417 per family, while 3-person families (17 | 25.0%) have the highest median income of $16,806 per family member.
| Income Bracket | # Families | Median Income |
| 2-Person Families | 45 (66.2%) | $28,906 |
| 3-Person Families | 17 (25.0%) | $50,417 |
| 4-Person Families | 3 (4.4%) | $0 |
| 5-Person Families | 0 (0.0%) | $0 |
| 6-Person Families | 0 (0.0%) | $0 |
| 7+ Person Families | 3 (4.4%) | $0 |
| Total | 68 (100.0%) | $29,271 |
Family Income by Number of Earners in Mitchellville
| Number of Earners | # Families | Median Income |
| No Earners | 17 (25.0%) | $0 |
| 1 Earner | 40 (58.8%) | $29,063 |
| 2 Earners | 8 (11.8%) | $52,500 |
| 3+ Earners | 3 (4.4%) | $0 |
| Total | 68 (100.0%) | $29,271 |
Household Income in Mitchellville
Household Income Brackets in Mitchellville
With 30 households falling in the category, the $25,000 to $34,999 income range is the most frequent in Mitchellville, accounting for 26.6% of all households.
| Income Bracket | # Households | % Households |
| Less than $10,000 | 10 | 8.8% |
| $10,000 to $14,999 | 13 | 11.5% |
| $15,000 to $24,999 | 25 | 22.1% |
| $25,000 to $34,999 | 30 | 26.5% |
| $35,000 to $49,999 | 12 | 10.6% |
| $50,000 to $74,999 | 21 | 18.6% |
| $75,000 to $99,999 | 2 | 1.8% |
| $100,000 to $149,999 | 0 | 0.0% |
| $150,000 to $199,999 | 0 | 0.0% |
| $200,000+ | 0 | 0.0% |
Household Income by Householder Age in Mitchellville
The median household income in Mitchellville is $28,029, with the highest median household income of $28,462 found in the 65+ years age bracket for the primary householder. A total of 60 households (53.1%) fall into this category.
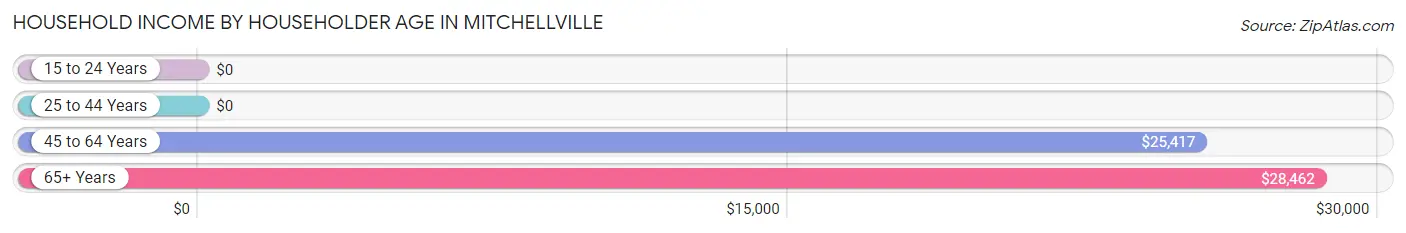
| Income Bracket | # Households | Median Income |
| 15 to 24 Years | 0 (0.0%) | $0 |
| 25 to 44 Years | 10 (8.8%) | $0 |
| 45 to 64 Years | 43 (38.1%) | $25,417 |
| 65+ Years | 60 (53.1%) | $28,462 |
| Total | 113 (100.0%) | $28,029 |
Poverty in Mitchellville
Income Below Poverty by Sex and Age in Mitchellville
With 24.2% poverty level for males and 33.1% for females among the residents of Mitchellville, 5 year old males and 35 to 44 year old females are the most vulnerable to poverty, with 2 males (100.0%) and 18 females (100.0%) in their respective age groups living below the poverty level.
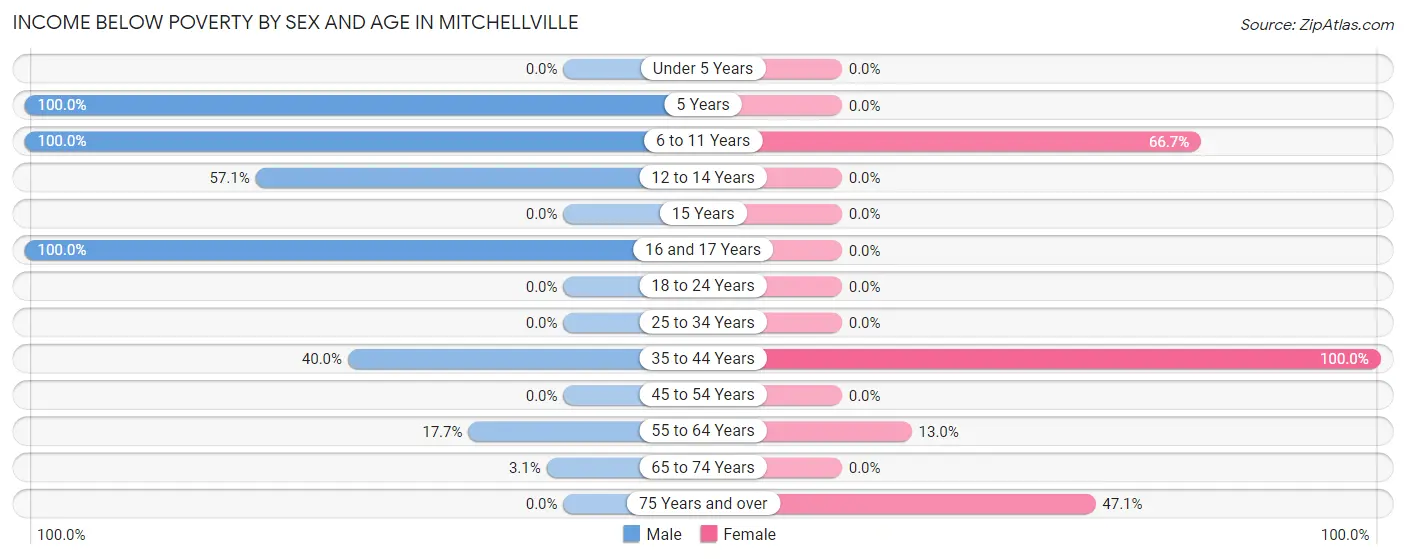
| Age Bracket | Male | Female |
| Under 5 Years | 0 (0.0%) | 0 (0.0%) |
| 5 Years | 2 (100.0%) | 0 (0.0%) |
| 6 to 11 Years | 7 (100.0%) | 6 (66.7%) |
| 12 to 14 Years | 4 (57.1%) | 0 (0.0%) |
| 15 Years | 0 (0.0%) | 0 (0.0%) |
| 16 and 17 Years | 3 (100.0%) | 0 (0.0%) |
| 18 to 24 Years | 0 (0.0%) | 0 (0.0%) |
| 25 to 34 Years | 0 (0.0%) | 0 (0.0%) |
| 35 to 44 Years | 2 (40.0%) | 18 (100.0%) |
| 45 to 54 Years | 0 (0.0%) | 0 (0.0%) |
| 55 to 64 Years | 3 (17.6%) | 7 (13.0%) |
| 65 to 74 Years | 1 (3.1%) | 0 (0.0%) |
| 75 Years and over | 0 (0.0%) | 8 (47.1%) |
| Total | 22 (24.2%) | 39 (33.1%) |
Income Above Poverty by Sex and Age in Mitchellville
According to the poverty statistics in Mitchellville, males aged 25 to 34 years and females aged 18 to 24 years are the age groups that are most secure financially, with 100.0% of males and 100.0% of females in these age groups living above the poverty line.
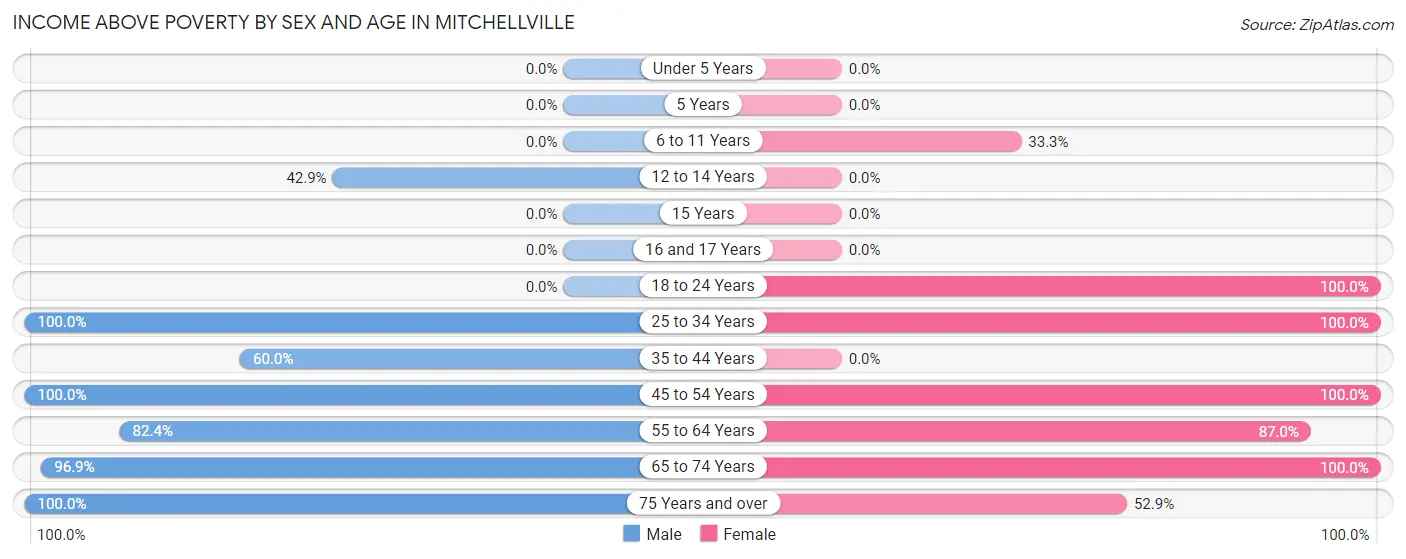
| Age Bracket | Male | Female |
| Under 5 Years | 0 (0.0%) | 0 (0.0%) |
| 5 Years | 0 (0.0%) | 0 (0.0%) |
| 6 to 11 Years | 0 (0.0%) | 3 (33.3%) |
| 12 to 14 Years | 3 (42.9%) | 0 (0.0%) |
| 15 Years | 0 (0.0%) | 0 (0.0%) |
| 16 and 17 Years | 0 (0.0%) | 0 (0.0%) |
| 18 to 24 Years | 0 (0.0%) | 4 (100.0%) |
| 25 to 34 Years | 3 (100.0%) | 3 (100.0%) |
| 35 to 44 Years | 3 (60.0%) | 0 (0.0%) |
| 45 to 54 Years | 8 (100.0%) | 3 (100.0%) |
| 55 to 64 Years | 14 (82.4%) | 47 (87.0%) |
| 65 to 74 Years | 31 (96.9%) | 10 (100.0%) |
| 75 Years and over | 7 (100.0%) | 9 (52.9%) |
| Total | 69 (75.8%) | 79 (66.9%) |
Income Below Poverty Among Married-Couple Families in Mitchellville
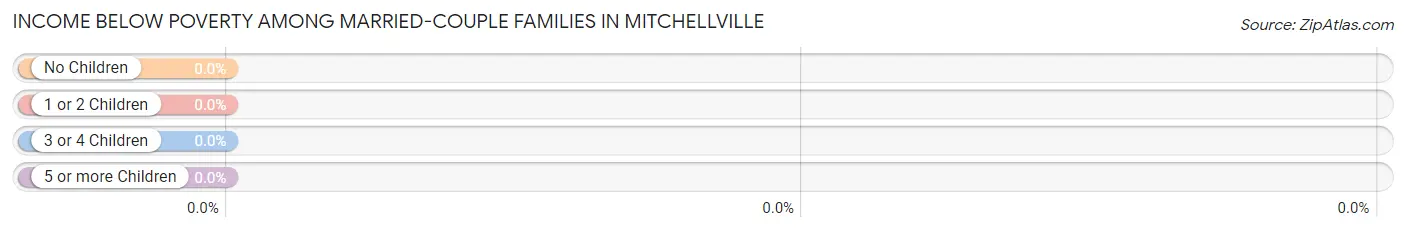
| Children | Above Poverty | Below Poverty |
| No Children | 38 (100.0%) | 0 (0.0%) |
| 1 or 2 Children | 0 (0.0%) | 0 (0.0%) |
| 3 or 4 Children | 0 (0.0%) | 0 (0.0%) |
| 5 or more Children | 0 (0.0%) | 0 (0.0%) |
| Total | 38 (100.0%) | 0 (0.0%) |
Income Below Poverty Among Single-Parent Households in Mitchellville
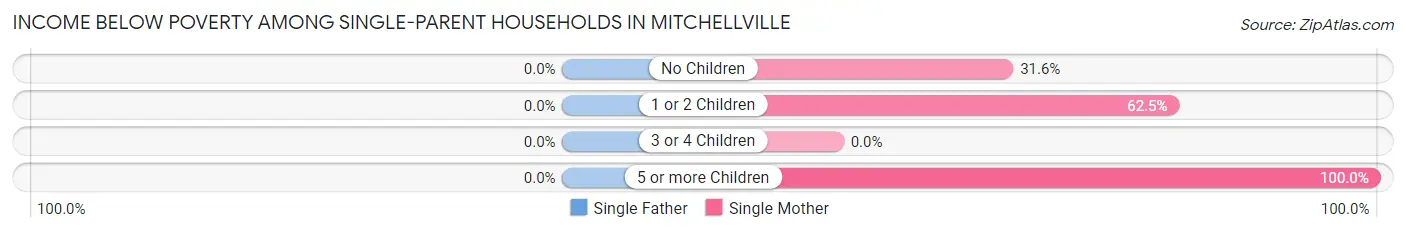
| Children | Single Father | Single Mother |
| No Children | 0 (0.0%) | 6 (31.6%) |
| 1 or 2 Children | 0 (0.0%) | 5 (62.5%) |
| 3 or 4 Children | 0 (0.0%) | 0 (0.0%) |
| 5 or more Children | 0 (0.0%) | 3 (100.0%) |
| Total | 0 (0.0%) | 14 (46.7%) |
Income Below Poverty Among Married-Couple vs Single-Parent Households in Mitchellville
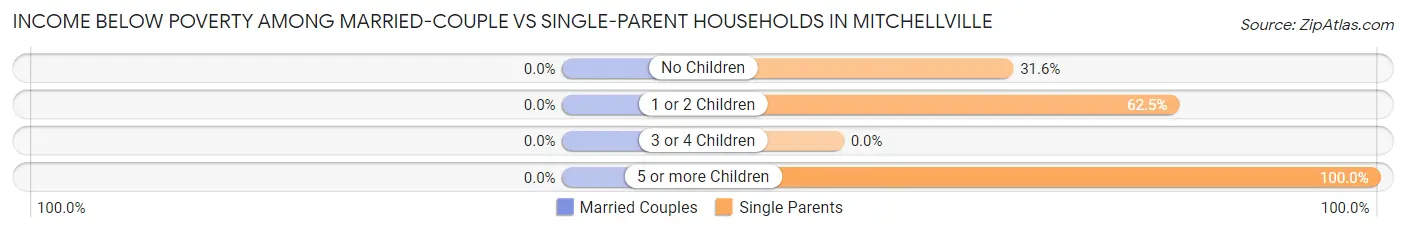
| Children | Married-Couple Families | Single-Parent Households |
| No Children | 0 (0.0%) | 6 (31.6%) |
| 1 or 2 Children | 0 (0.0%) | 5 (62.5%) |
| 3 or 4 Children | 0 (0.0%) | 0 (0.0%) |
| 5 or more Children | 0 (0.0%) | 3 (100.0%) |
| Total | 0 (0.0%) | 14 (46.7%) |
Race in Mitchellville
The most populous races in Mitchellville are Black / African American (200 | 95.7%), Two or more Races (8 | 3.8%), and White / Caucasian (1 | 0.5%).
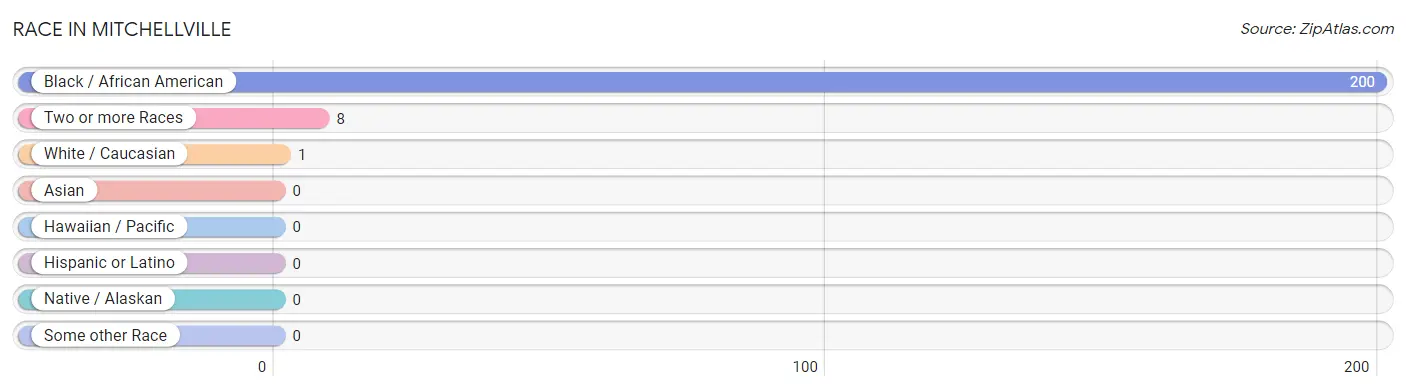
| Race | # Population | % Population |
| Asian | 0 | 0.0% |
| Black / African American | 200 | 95.7% |
| Hawaiian / Pacific | 0 | 0.0% |
| Hispanic or Latino | 0 | 0.0% |
| Native / Alaskan | 0 | 0.0% |
| White / Caucasian | 1 | 0.5% |
| Two or more Races | 8 | 3.8% |
| Some other Race | 0 | 0.0% |
| Total | 209 | 100.0% |
Ancestry in Mitchellville
The most populous ancestries reported in Mitchellville are American (9 | 4.3%), Cherokee (6 | 2.9%), African (2 | 1.0%), Blackfeet (2 | 1.0%), and Subsaharan African (2 | 1.0%), together accounting for 10.1% of all Mitchellville residents.
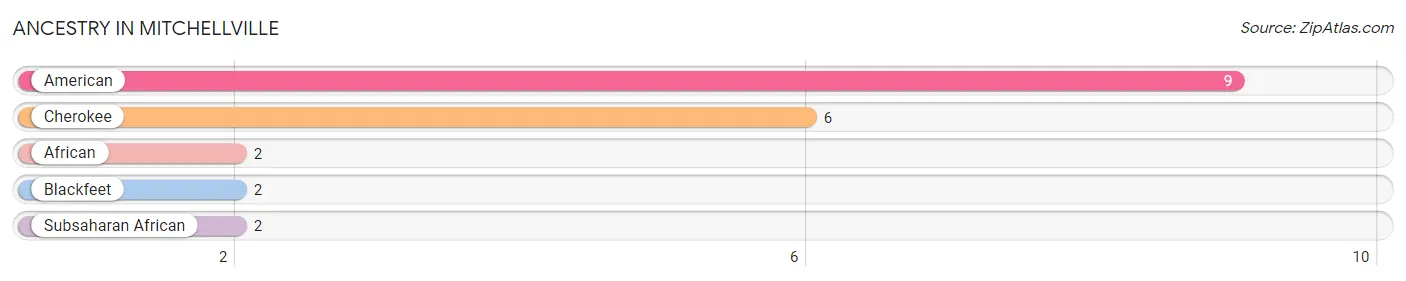
| Ancestry | # Population | % Population |
| African | 2 | 1.0% |
| American | 9 | 4.3% |
| Blackfeet | 2 | 1.0% |
| Cherokee | 6 | 2.9% |
| Subsaharan African | 2 | 1.0% | View All 5 Rows |
Immigrants in Mitchellville

| Immigration Origin | # Population | % Population | View All 0 Rows |
Sex and Age in Mitchellville
Sex and Age in Mitchellville
The most populous age groups in Mitchellville are 70 to 74 Years (24 | 26.4%) for men and 60 to 64 Years (44 | 37.3%) for women.
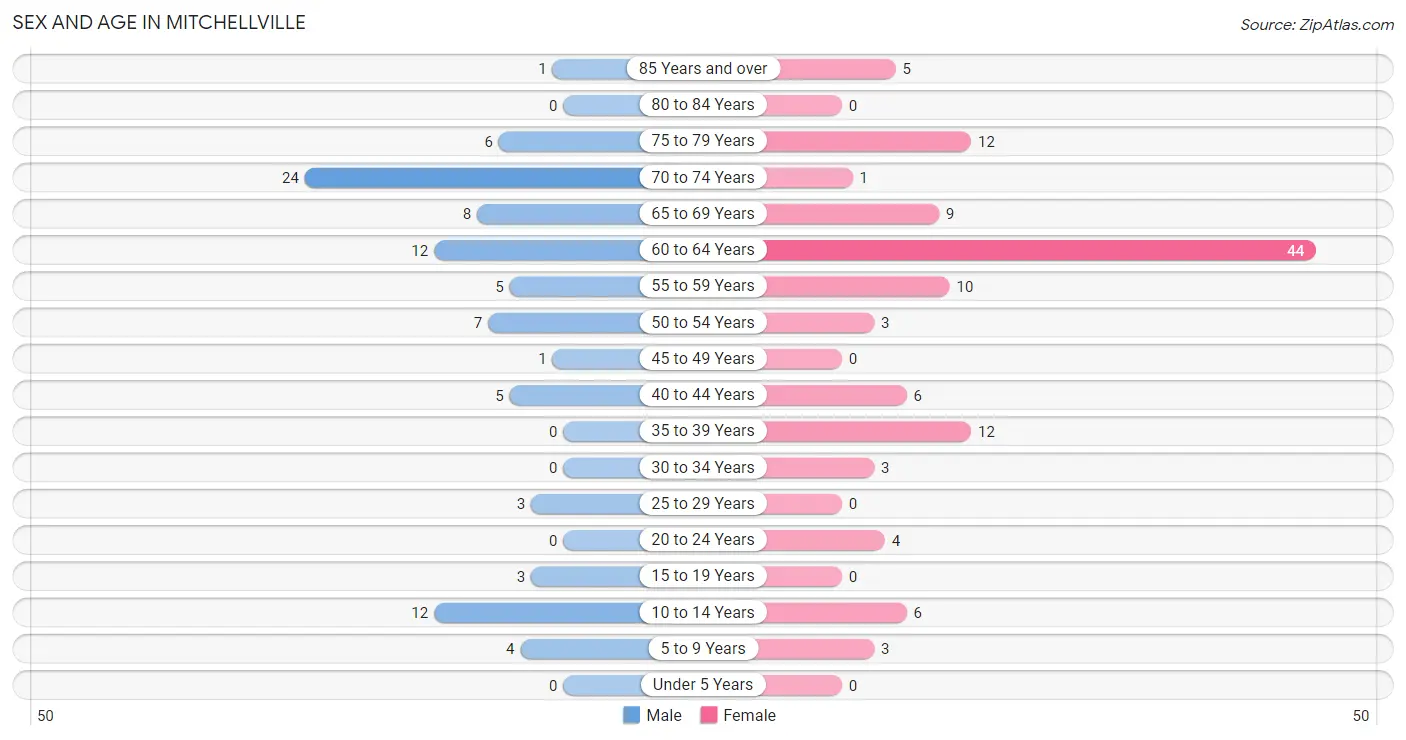
| Age Bracket | Male | Female |
| Under 5 Years | 0 (0.0%) | 0 (0.0%) |
| 5 to 9 Years | 4 (4.4%) | 3 (2.5%) |
| 10 to 14 Years | 12 (13.2%) | 6 (5.1%) |
| 15 to 19 Years | 3 (3.3%) | 0 (0.0%) |
| 20 to 24 Years | 0 (0.0%) | 4 (3.4%) |
| 25 to 29 Years | 3 (3.3%) | 0 (0.0%) |
| 30 to 34 Years | 0 (0.0%) | 3 (2.5%) |
| 35 to 39 Years | 0 (0.0%) | 12 (10.2%) |
| 40 to 44 Years | 5 (5.5%) | 6 (5.1%) |
| 45 to 49 Years | 1 (1.1%) | 0 (0.0%) |
| 50 to 54 Years | 7 (7.7%) | 3 (2.5%) |
| 55 to 59 Years | 5 (5.5%) | 10 (8.5%) |
| 60 to 64 Years | 12 (13.2%) | 44 (37.3%) |
| 65 to 69 Years | 8 (8.8%) | 9 (7.6%) |
| 70 to 74 Years | 24 (26.4%) | 1 (0.9%) |
| 75 to 79 Years | 6 (6.6%) | 12 (10.2%) |
| 80 to 84 Years | 0 (0.0%) | 0 (0.0%) |
| 85 Years and over | 1 (1.1%) | 5 (4.2%) |
| Total | 91 (100.0%) | 118 (100.0%) |
Families and Households in Mitchellville
Median Family Size in Mitchellville
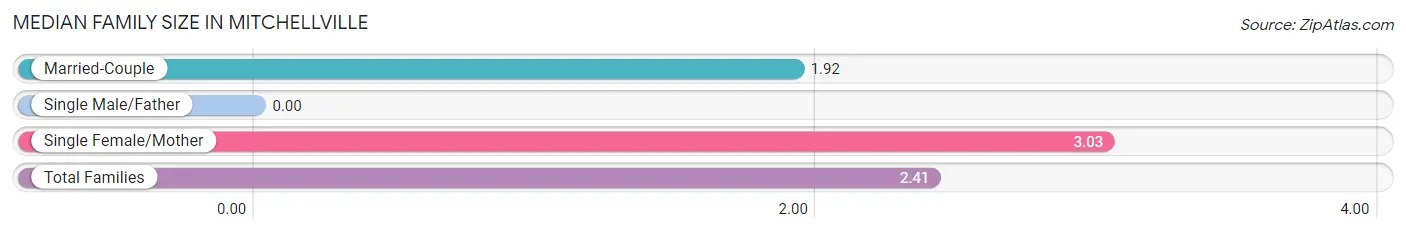
| Family Type | # Families | Family Size |
| Married-Couple | 38 (55.9%) | 1.92 |
| Single Male/Father | 0 (0.0%) | - |
| Single Female/Mother | 30 (44.1%) | 3.03 |
| Total Families | 68 (100.0%) | 2.41 |
Median Household Size in Mitchellville
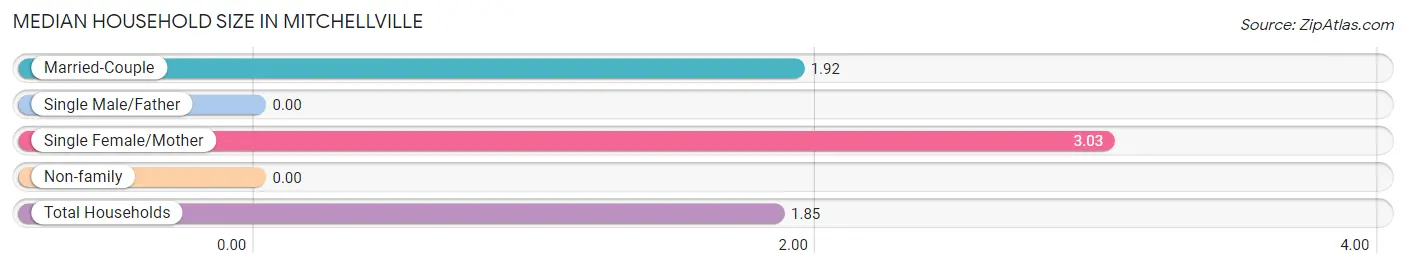
| Household Type | # Households | Household Size |
| Married-Couple | 38 (33.6%) | 1.92 |
| Single Male/Father | 0 (0.0%) | - |
| Single Female/Mother | 30 (26.6%) | 3.03 |
| Non-family | 45 (39.8%) | - |
| Total Households | 113 (100.0%) | 1.85 |
Household Size by Marriage Status in Mitchellville
Out of a total of 113 households in Mitchellville, 68 (60.2%) are family households, while 45 (39.8%) are nonfamily households. The most numerous type of family households are 2-person households, comprising 45, and the most common type of nonfamily households are 1-person households, comprising 45.
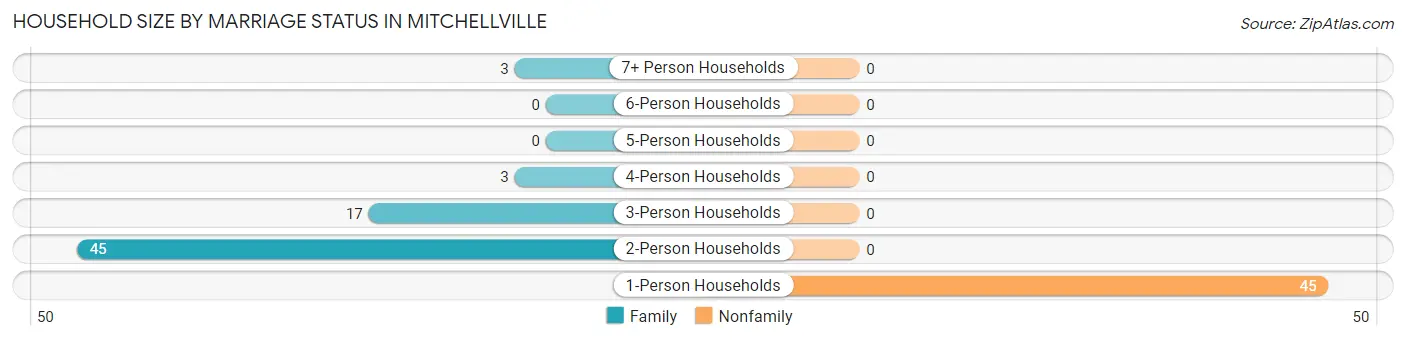
| Household Size | Family Households | Nonfamily Households |
| 1-Person Households | - | 45 (39.8%) |
| 2-Person Households | 45 (39.8%) | 0 (0.0%) |
| 3-Person Households | 17 (15.0%) | 0 (0.0%) |
| 4-Person Households | 3 (2.6%) | 0 (0.0%) |
| 5-Person Households | 0 (0.0%) | 0 (0.0%) |
| 6-Person Households | 0 (0.0%) | 0 (0.0%) |
| 7+ Person Households | 3 (2.6%) | 0 (0.0%) |
| Total | 68 (60.2%) | 45 (39.8%) |
Female Fertility in Mitchellville
Fertility by Age in Mitchellville
Average fertility rate in Mitchellville is 77.0 births per 1,000 women. Women in the age bracket of 20 to 34 years have the highest fertility rate with 286.0 births per 1,000 women. Women in the age bracket of 20 to 34 years acount for 100.0% of all women with births.
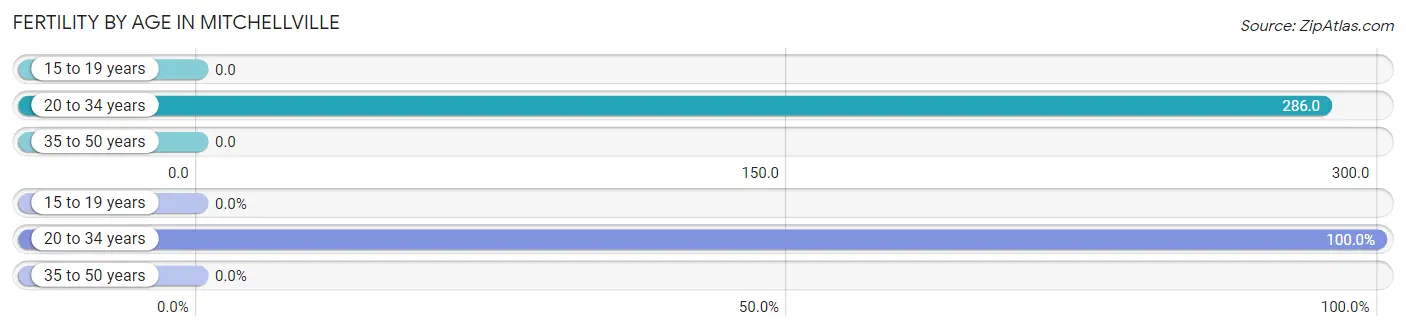
| Age Bracket | Women with Births | Births / 1,000 Women |
| 15 to 19 years | 0 (0.0%) | 0.0 |
| 20 to 34 years | 2 (100.0%) | 286.0 |
| 35 to 50 years | 0 (0.0%) | 0.0 |
| Total | 2 (100.0%) | 77.0 |
Fertility by Age by Marriage Status in Mitchellville
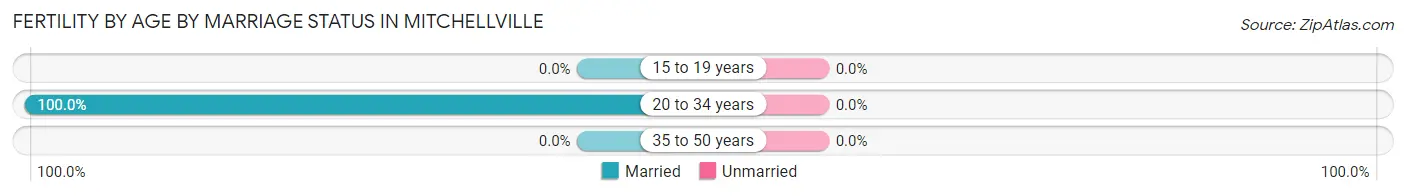
| Age Bracket | Married | Unmarried |
| 15 to 19 years | 0 (0.0%) | 0 (0.0%) |
| 20 to 34 years | 2 (100.0%) | 0 (0.0%) |
| 35 to 50 years | 0 (0.0%) | 0 (0.0%) |
| Total | 2 (100.0%) | 0 (0.0%) |
Fertility by Education in Mitchellville
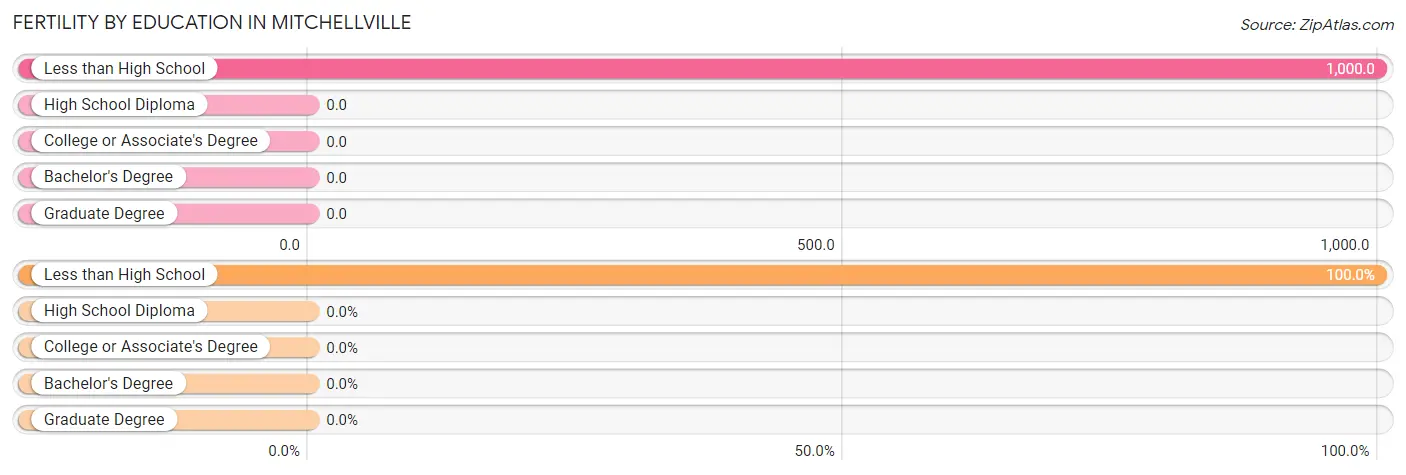
| Educational Attainment | Women with Births | Births / 1,000 Women |
| Less than High School | 2 (100.0%) | 1,000.0 |
| High School Diploma | 0 (0.0%) | 0.0 |
| College or Associate's Degree | 0 (0.0%) | 0.0 |
| Bachelor's Degree | 0 (0.0%) | 0.0 |
| Graduate Degree | 0 (0.0%) | 0.0 |
| Total | 2 (100.0%) | 77.0 |
Fertility by Education by Marriage Status in Mitchellville
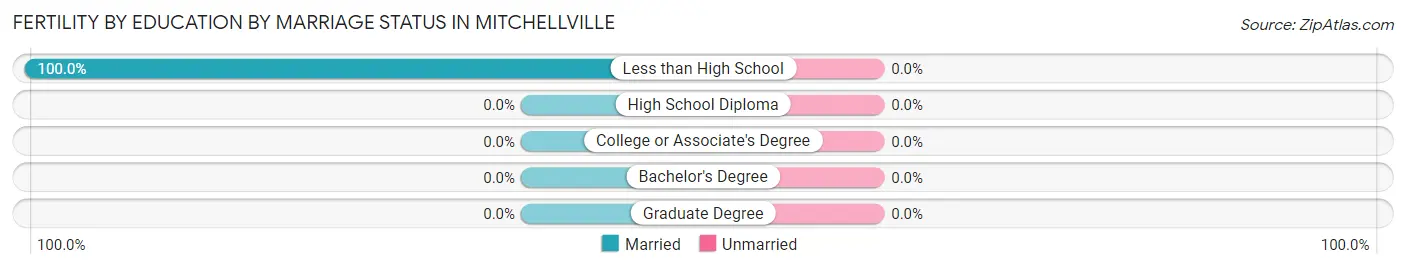
| Educational Attainment | Married | Unmarried |
| Less than High School | 2 (100.0%) | 0 (0.0%) |
| High School Diploma | 0 (0.0%) | 0 (0.0%) |
| College or Associate's Degree | 0 (0.0%) | 0 (0.0%) |
| Bachelor's Degree | 0 (0.0%) | 0 (0.0%) |
| Graduate Degree | 0 (0.0%) | 0 (0.0%) |
| Total | 2 (100.0%) | 0 (0.0%) |
Employment Characteristics in Mitchellville
Employment by Class of Employer in Mitchellville
Among the 63 employed individuals in Mitchellville, private company employees (40 | 63.5%), local government employees (13 | 20.6%), and not-for-profit organizations (5 | 7.9%) make up the most common classes of employment.
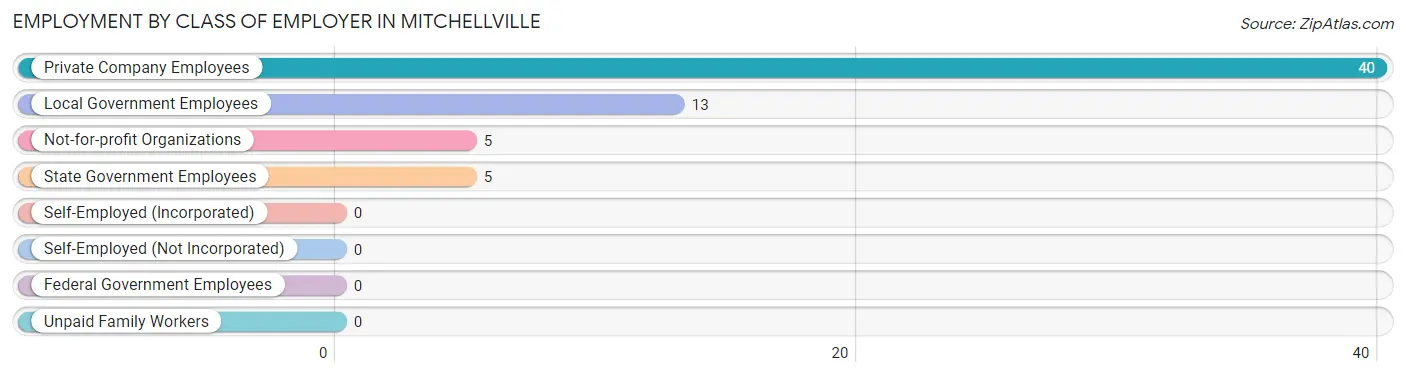
| Employer Class | # Employees | % Employees |
| Private Company Employees | 40 | 63.5% |
| Self-Employed (Incorporated) | 0 | 0.0% |
| Self-Employed (Not Incorporated) | 0 | 0.0% |
| Not-for-profit Organizations | 5 | 7.9% |
| Local Government Employees | 13 | 20.6% |
| State Government Employees | 5 | 7.9% |
| Federal Government Employees | 0 | 0.0% |
| Unpaid Family Workers | 0 | 0.0% |
| Total | 63 | 100.0% |
Employment Status by Age in Mitchellville
According to the labor force statistics for Mitchellville, out of the total population over 16 years of age (184), 37.5% or 69 individuals are in the labor force, with 8.7% or 6 of them unemployed. The age group with the highest labor force participation rate is 30 to 34 years, with 100.0% or 3 individuals in the labor force. Within the labor force, the 35 to 44 years age range has the highest percentage of unemployed individuals, with 71.4% or 5 of them being unemployed.
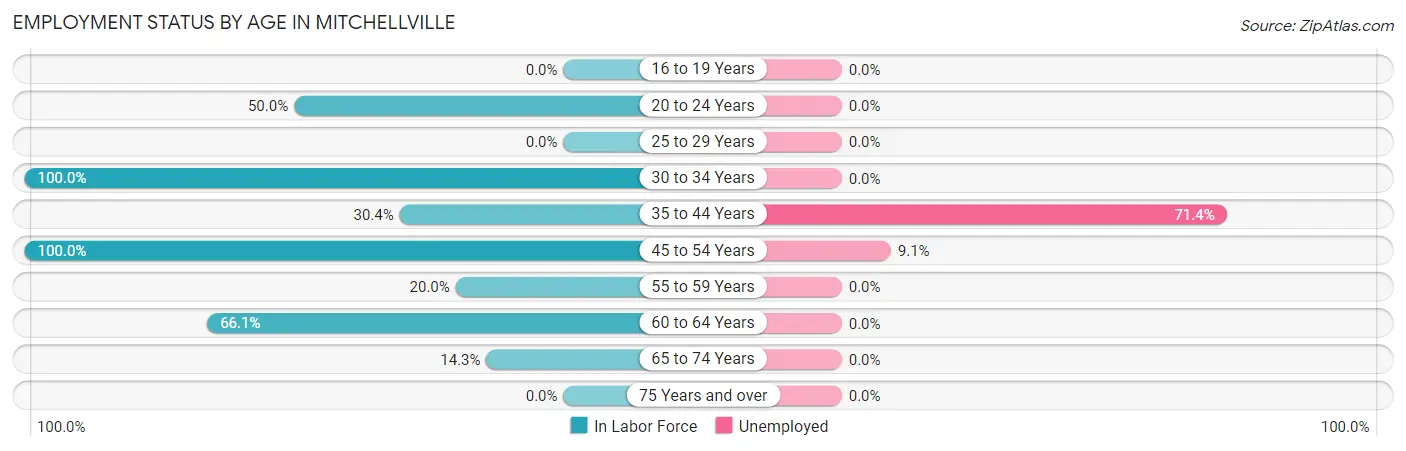
| Age Bracket | In Labor Force | Unemployed |
| 16 to 19 Years | 0 (0.0%) | 0 (0.0%) |
| 20 to 24 Years | 2 (50.0%) | 0 (0.0%) |
| 25 to 29 Years | 0 (0.0%) | 0 (0.0%) |
| 30 to 34 Years | 3 (100.0%) | 0 (0.0%) |
| 35 to 44 Years | 7 (30.4%) | 5 (71.4%) |
| 45 to 54 Years | 11 (100.0%) | 1 (9.1%) |
| 55 to 59 Years | 3 (20.0%) | 0 (0.0%) |
| 60 to 64 Years | 37 (66.1%) | 0 (0.0%) |
| 65 to 74 Years | 6 (14.3%) | 0 (0.0%) |
| 75 Years and over | 0 (0.0%) | 0 (0.0%) |
| Total | 69 (37.5%) | 6 (8.7%) |
Employment Status by Educational Attainment in Mitchellville
According to labor force statistics for Mitchellville, 55.0% of individuals (61) out of the total population between 25 and 64 years of age (111) are in the labor force, with 9.8% or 6 of them being unemployed. The group with the highest labor force participation rate are those with the educational attainment of college / associate degree, with 100.0% or 11 individuals in the labor force. Within the labor force, individuals with college / associate degree education have the highest percentage of unemployment, with 45.5% or 5 of them being unemployed.
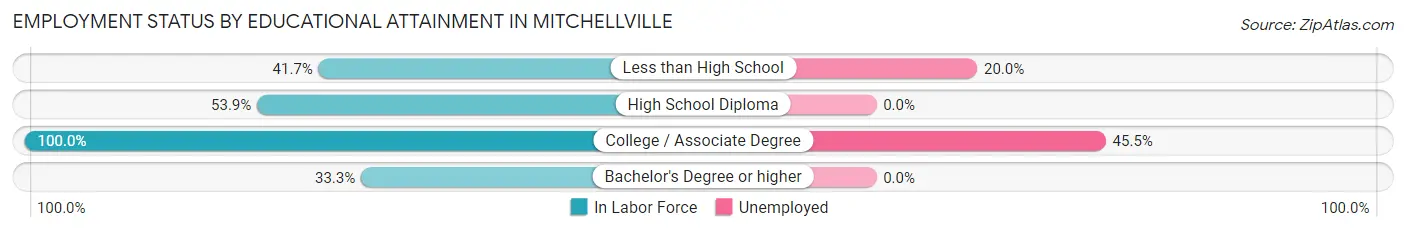
| Educational Attainment | In Labor Force | Unemployed |
| Less than High School | 5 (41.7%) | 2 (20.0%) |
| High School Diploma | 41 (53.9%) | 0 (0.0%) |
| College / Associate Degree | 11 (100.0%) | 5 (45.5%) |
| Bachelor's Degree or higher | 4 (33.3%) | 0 (0.0%) |
| Total | 61 (55.0%) | 11 (9.8%) |
Employment Occupations by Sex in Mitchellville
Management, Business, Science and Arts Occupations
The most common Management, Business, Science and Arts occupations in Mitchellville are Community & Social Service (7 | 11.1%), Education Instruction & Library (5 | 7.9%), and Education, Arts & Media (2 | 3.2%).
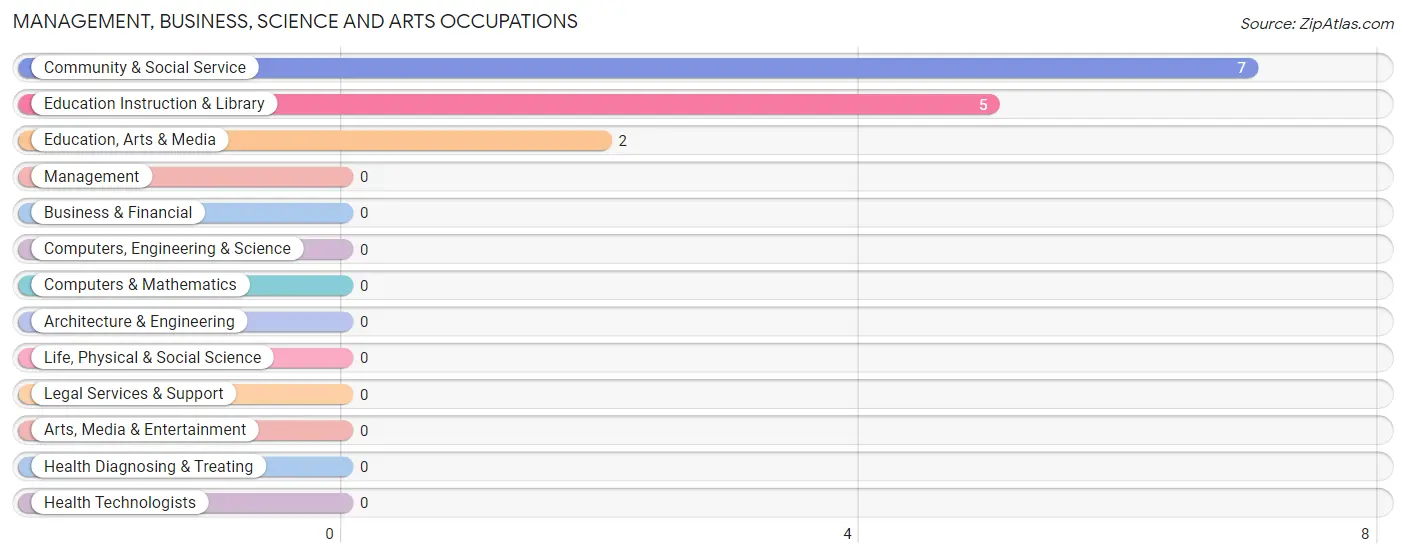
Management, Business, Science and Arts Occupations by Sex
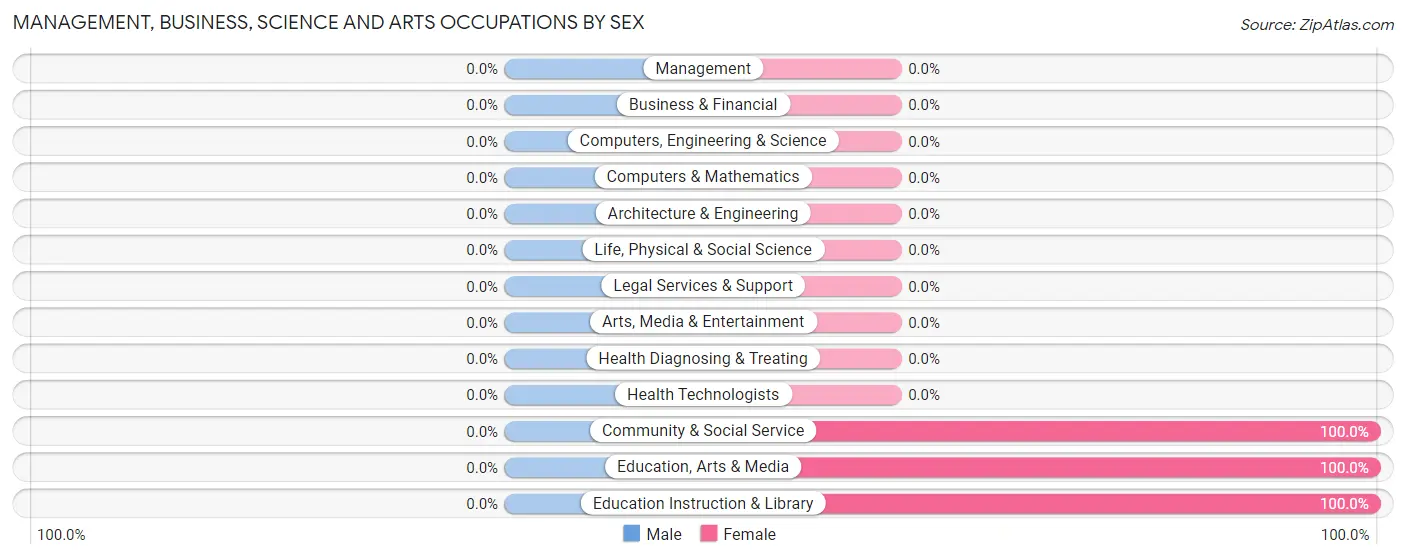
| Occupation | Male | Female |
| Management | 0 (0.0%) | 0 (0.0%) |
| Business & Financial | 0 (0.0%) | 0 (0.0%) |
| Computers, Engineering & Science | 0 (0.0%) | 0 (0.0%) |
| Computers & Mathematics | 0 (0.0%) | 0 (0.0%) |
| Architecture & Engineering | 0 (0.0%) | 0 (0.0%) |
| Life, Physical & Social Science | 0 (0.0%) | 0 (0.0%) |
| Community & Social Service | 0 (0.0%) | 7 (100.0%) |
| Education, Arts & Media | 0 (0.0%) | 2 (100.0%) |
| Legal Services & Support | 0 (0.0%) | 0 (0.0%) |
| Education Instruction & Library | 0 (0.0%) | 5 (100.0%) |
| Arts, Media & Entertainment | 0 (0.0%) | 0 (0.0%) |
| Health Diagnosing & Treating | 0 (0.0%) | 0 (0.0%) |
| Health Technologists | 0 (0.0%) | 0 (0.0%) |
| Total (Category) | 0 (0.0%) | 7 (100.0%) |
| Total (Overall) | 15 (23.8%) | 48 (76.2%) |
Services Occupations
The most common Services occupations in Mitchellville are Food Preparation & Serving (24 | 38.1%), Healthcare Support (3 | 4.8%), Security & Protection (2 | 3.2%), Firefighting & Prevention (2 | 3.2%), and Cleaning & Maintenance (1 | 1.6%).
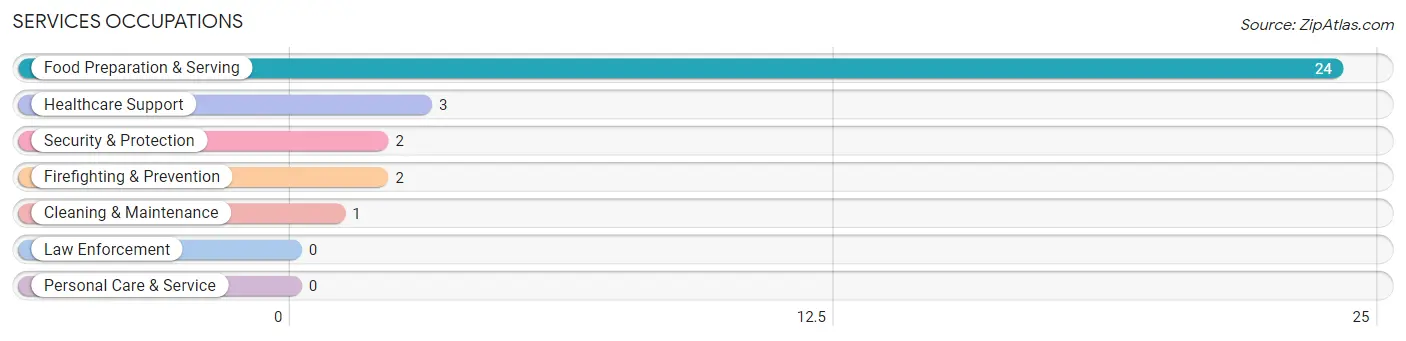
Services Occupations by Sex
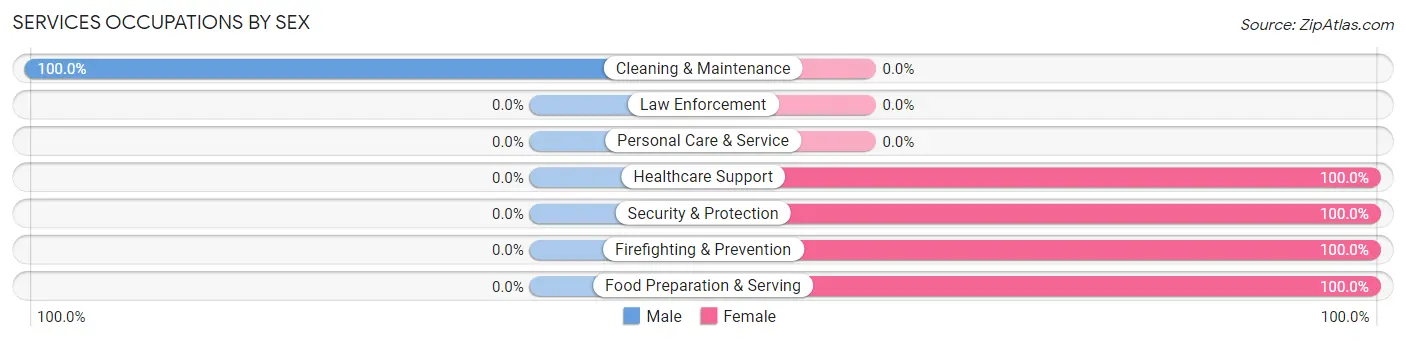
| Occupation | Male | Female |
| Healthcare Support | 0 (0.0%) | 3 (100.0%) |
| Security & Protection | 0 (0.0%) | 2 (100.0%) |
| Firefighting & Prevention | 0 (0.0%) | 2 (100.0%) |
| Law Enforcement | 0 (0.0%) | 0 (0.0%) |
| Food Preparation & Serving | 0 (0.0%) | 24 (100.0%) |
| Cleaning & Maintenance | 1 (100.0%) | 0 (0.0%) |
| Personal Care & Service | 0 (0.0%) | 0 (0.0%) |
| Total (Category) | 1 (3.3%) | 29 (96.7%) |
| Total (Overall) | 15 (23.8%) | 48 (76.2%) |
Sales and Office Occupations
The most common Sales and Office occupations in Mitchellville are Sales & Related (5 | 7.9%), and Office & Administration (2 | 3.2%).
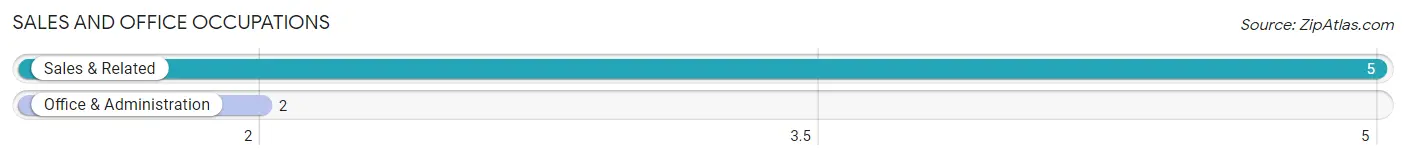
Sales and Office Occupations by Sex
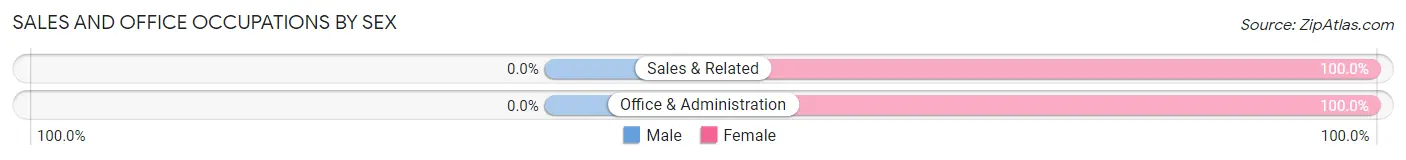
| Occupation | Male | Female |
| Sales & Related | 0 (0.0%) | 5 (100.0%) |
| Office & Administration | 0 (0.0%) | 2 (100.0%) |
| Total (Category) | 0 (0.0%) | 7 (100.0%) |
| Total (Overall) | 15 (23.8%) | 48 (76.2%) |
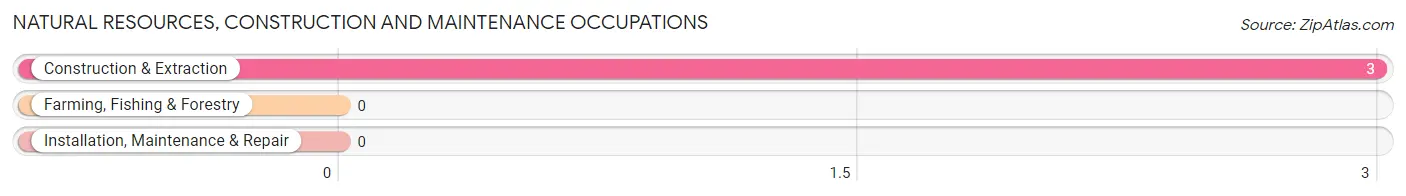
Natural Resources, Construction and Maintenance Occupations
The most common Natural Resources, Construction and Maintenance occupations in Mitchellville are , and Construction & Extraction (3 | 4.8%).
Natural Resources, Construction and Maintenance Occupations by Sex
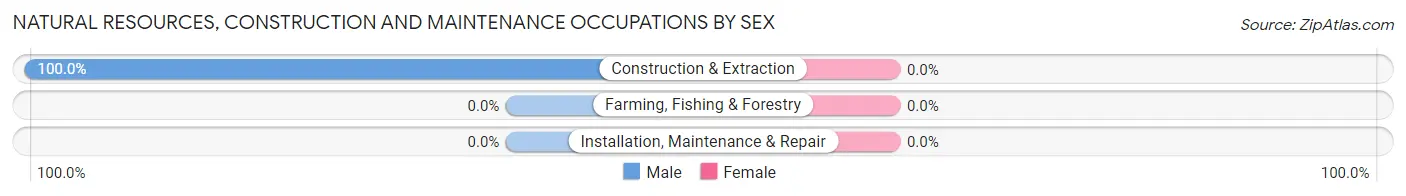
| Occupation | Male | Female |
| Farming, Fishing & Forestry | 0 (0.0%) | 0 (0.0%) |
| Construction & Extraction | 3 (100.0%) | 0 (0.0%) |
| Installation, Maintenance & Repair | 0 (0.0%) | 0 (0.0%) |
| Total (Category) | 3 (100.0%) | 0 (0.0%) |
| Total (Overall) | 15 (23.8%) | 48 (76.2%) |
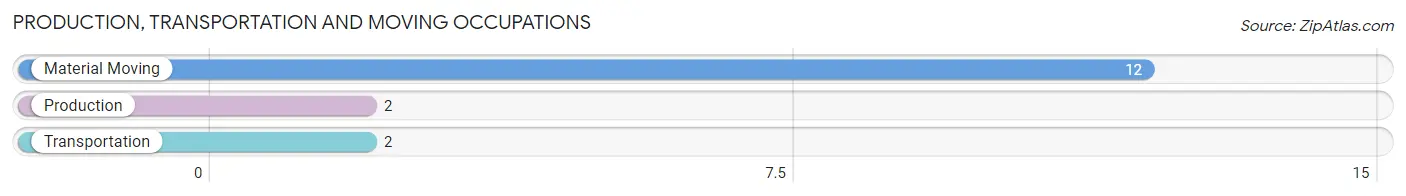
Production, Transportation and Moving Occupations
The most common Production, Transportation and Moving occupations in Mitchellville are Material Moving (12 | 19.1%), Production (2 | 3.2%), and Transportation (2 | 3.2%).
Production, Transportation and Moving Occupations by Sex
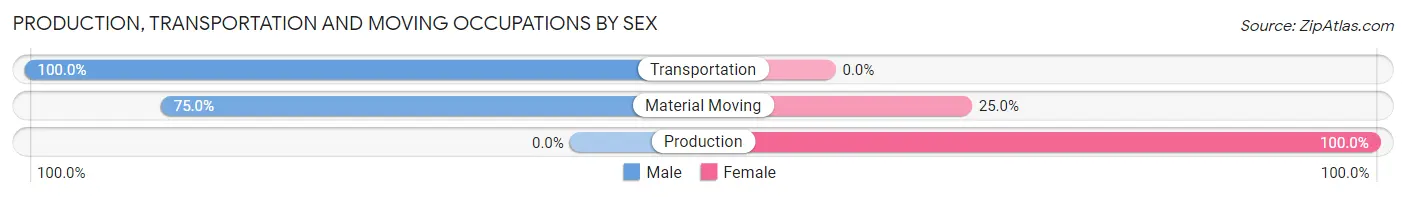
| Occupation | Male | Female |
| Production | 0 (0.0%) | 2 (100.0%) |
| Transportation | 2 (100.0%) | 0 (0.0%) |
| Material Moving | 9 (75.0%) | 3 (25.0%) |
| Total (Category) | 11 (68.8%) | 5 (31.2%) |
| Total (Overall) | 15 (23.8%) | 48 (76.2%) |
Employment Industries by Sex in Mitchellville
Employment Industries in Mitchellville
The major employment industries in Mitchellville include Health Care & Social Assistance (22 | 34.9%), Manufacturing (11 | 17.5%), Educational Services (10 | 15.9%), Retail Trade (5 | 7.9%), and Construction (3 | 4.8%).
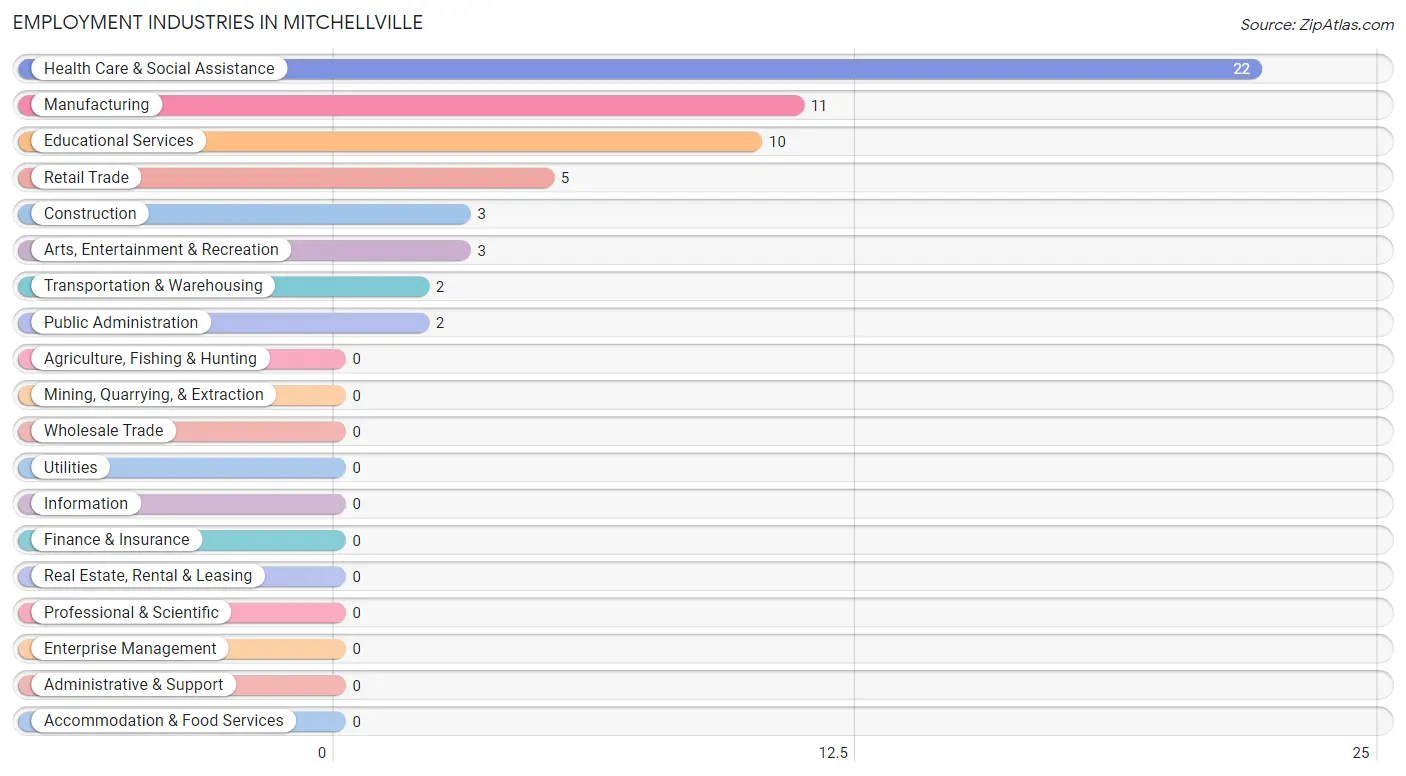
Employment Industries by Sex in Mitchellville
The Mitchellville industries that see more men than women are Construction (100.0%), Transportation & Warehousing (100.0%), and Arts, Entertainment & Recreation (100.0%), whereas the industries that tend to have a higher number of women are Retail Trade (100.0%), Educational Services (100.0%), and Public Administration (100.0%).
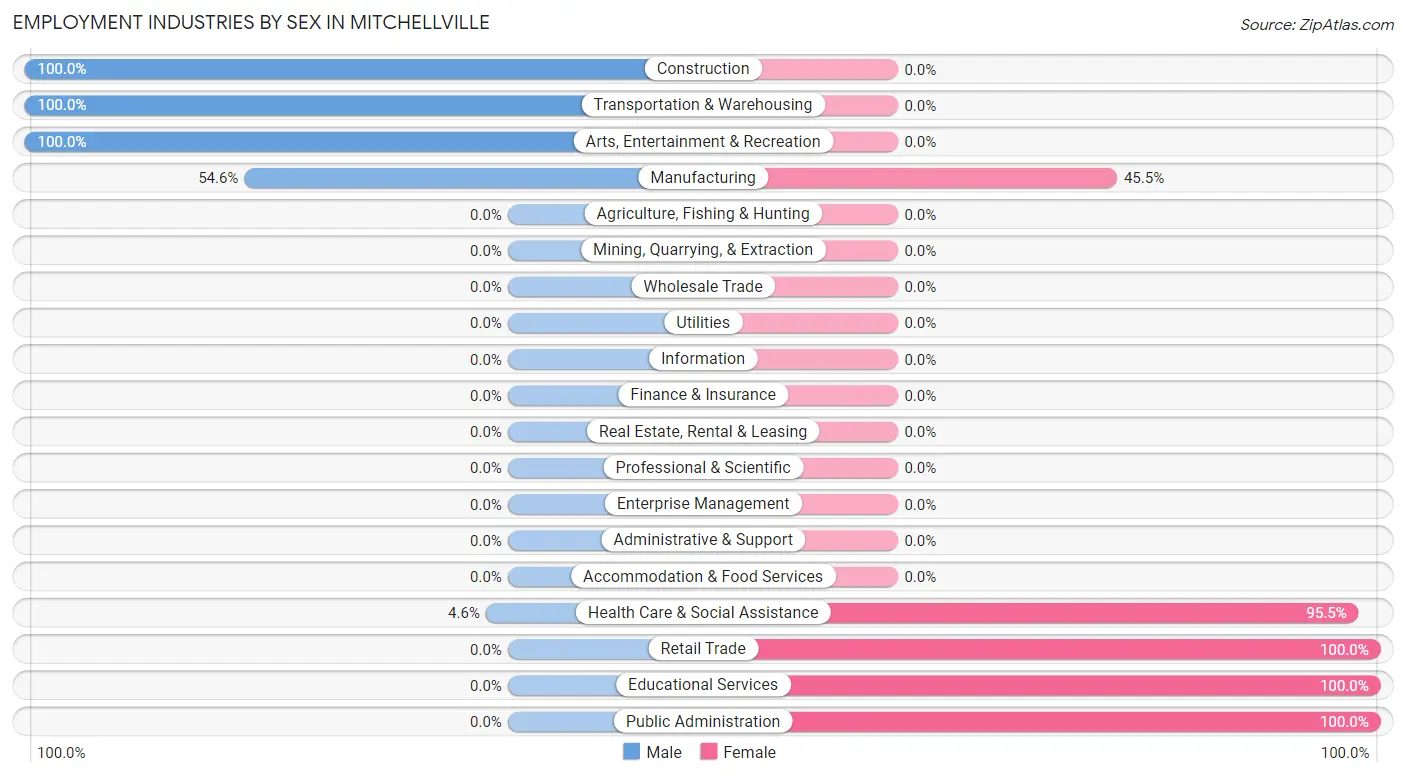
| Industry | Male | Female |
| Agriculture, Fishing & Hunting | 0 (0.0%) | 0 (0.0%) |
| Mining, Quarrying, & Extraction | 0 (0.0%) | 0 (0.0%) |
| Construction | 3 (100.0%) | 0 (0.0%) |
| Manufacturing | 6 (54.5%) | 5 (45.5%) |
| Wholesale Trade | 0 (0.0%) | 0 (0.0%) |
| Retail Trade | 0 (0.0%) | 5 (100.0%) |
| Transportation & Warehousing | 2 (100.0%) | 0 (0.0%) |
| Utilities | 0 (0.0%) | 0 (0.0%) |
| Information | 0 (0.0%) | 0 (0.0%) |
| Finance & Insurance | 0 (0.0%) | 0 (0.0%) |
| Real Estate, Rental & Leasing | 0 (0.0%) | 0 (0.0%) |
| Professional & Scientific | 0 (0.0%) | 0 (0.0%) |
| Enterprise Management | 0 (0.0%) | 0 (0.0%) |
| Administrative & Support | 0 (0.0%) | 0 (0.0%) |
| Educational Services | 0 (0.0%) | 10 (100.0%) |
| Health Care & Social Assistance | 1 (4.5%) | 21 (95.5%) |
| Arts, Entertainment & Recreation | 3 (100.0%) | 0 (0.0%) |
| Accommodation & Food Services | 0 (0.0%) | 0 (0.0%) |
| Public Administration | 0 (0.0%) | 2 (100.0%) |
| Total | 15 (23.8%) | 48 (76.2%) |
Education in Mitchellville
School Enrollment in Mitchellville
The most common levels of schooling among the 27 students in Mitchellville are elementary school (14 | 51.8%), middle school (9 | 33.3%), and high school (3 | 11.1%).
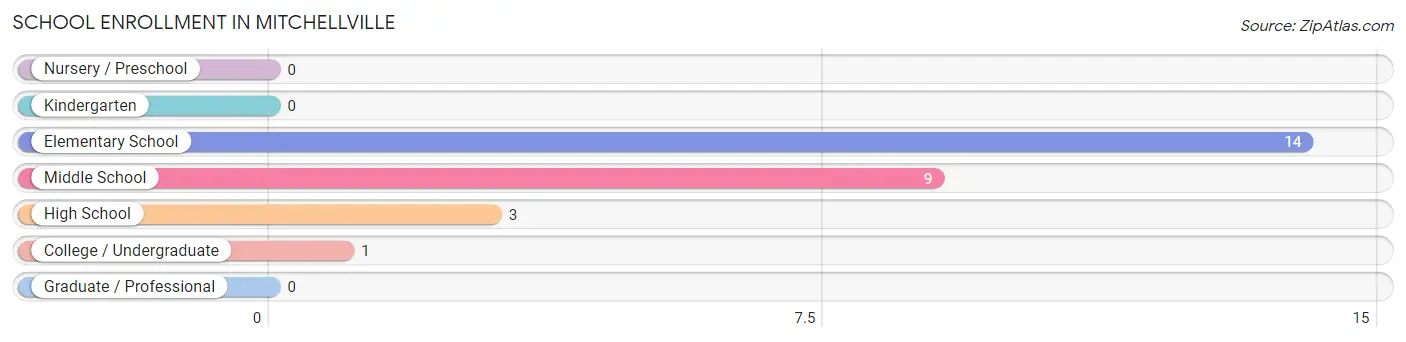
| School Level | # Students | % Students |
| Nursery / Preschool | 0 | 0.0% |
| Kindergarten | 0 | 0.0% |
| Elementary School | 14 | 51.8% |
| Middle School | 9 | 33.3% |
| High School | 3 | 11.1% |
| College / Undergraduate | 1 | 3.7% |
| Graduate / Professional | 0 | 0.0% |
| Total | 27 | 100.0% |
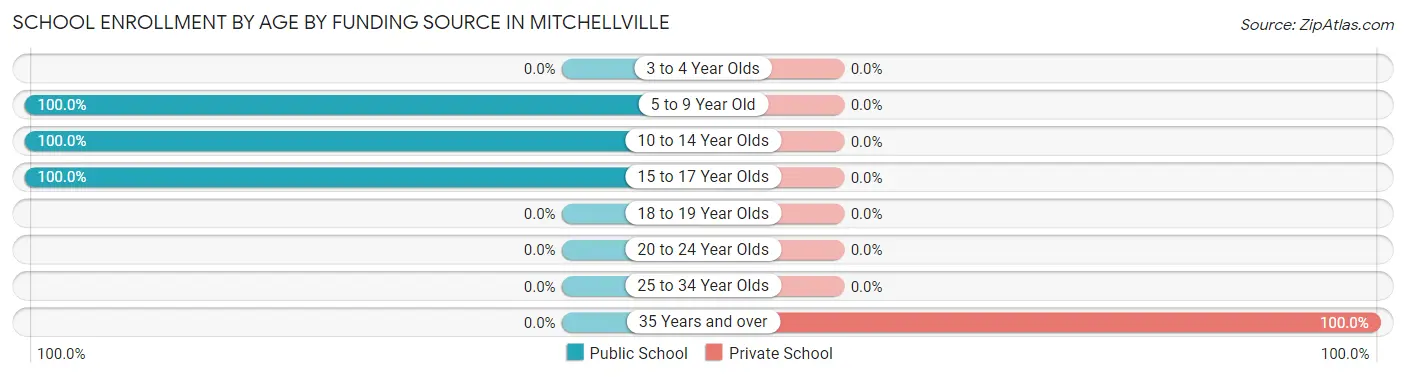
School Enrollment by Age by Funding Source in Mitchellville
Out of a total of 27 students who are enrolled in schools in Mitchellville, 1 (3.7%) attend a private institution, while the remaining 26 (96.3%) are enrolled in public schools. The age group of 35 years and over has the highest likelihood of being enrolled in private schools, with 1 (100.0% in the age bracket) enrolled. Conversely, the age group of 5 to 9 year old has the lowest likelihood of being enrolled in a private school, with 5 (100.0% in the age bracket) attending a public institution.
| Age Bracket | Public School | Private School |
| 3 to 4 Year Olds | 0 (0.0%) | 0 (0.0%) |
| 5 to 9 Year Old | 5 (100.0%) | 0 (0.0%) |
| 10 to 14 Year Olds | 18 (100.0%) | 0 (0.0%) |
| 15 to 17 Year Olds | 3 (100.0%) | 0 (0.0%) |
| 18 to 19 Year Olds | 0 (0.0%) | 0 (0.0%) |
| 20 to 24 Year Olds | 0 (0.0%) | 0 (0.0%) |
| 25 to 34 Year Olds | 0 (0.0%) | 0 (0.0%) |
| 35 Years and over | 0 (0.0%) | 1 (100.0%) |
| Total | 26 (96.3%) | 1 (3.7%) |
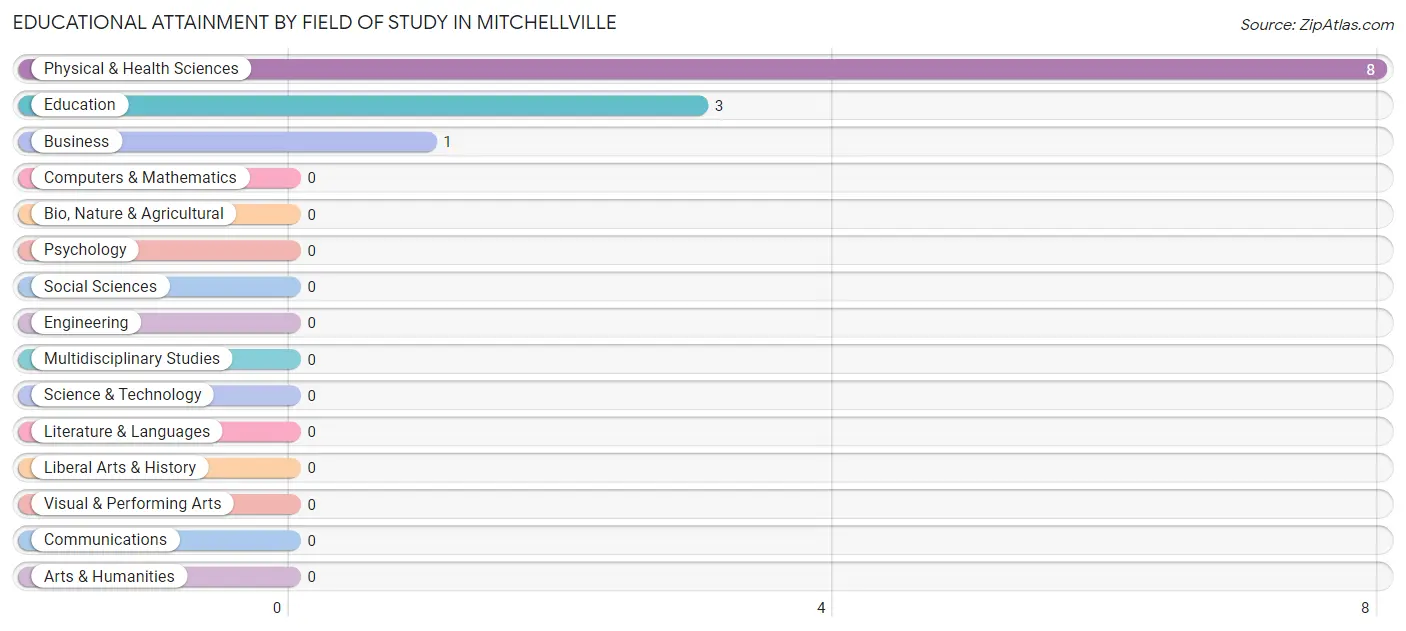
Educational Attainment by Field of Study in Mitchellville
Physical & health sciences (8 | 66.7%), education (3 | 25.0%), and business (1 | 8.3%) are the most common fields of study among 12 individuals in Mitchellville who have obtained a bachelor's degree or higher.
| Field of Study | # Graduates | % Graduates |
| Computers & Mathematics | 0 | 0.0% |
| Bio, Nature & Agricultural | 0 | 0.0% |
| Physical & Health Sciences | 8 | 66.7% |
| Psychology | 0 | 0.0% |
| Social Sciences | 0 | 0.0% |
| Engineering | 0 | 0.0% |
| Multidisciplinary Studies | 0 | 0.0% |
| Science & Technology | 0 | 0.0% |
| Business | 1 | 8.3% |
| Education | 3 | 25.0% |
| Literature & Languages | 0 | 0.0% |
| Liberal Arts & History | 0 | 0.0% |
| Visual & Performing Arts | 0 | 0.0% |
| Communications | 0 | 0.0% |
| Arts & Humanities | 0 | 0.0% |
| Total | 12 | 100.0% |
Transportation & Commute in Mitchellville
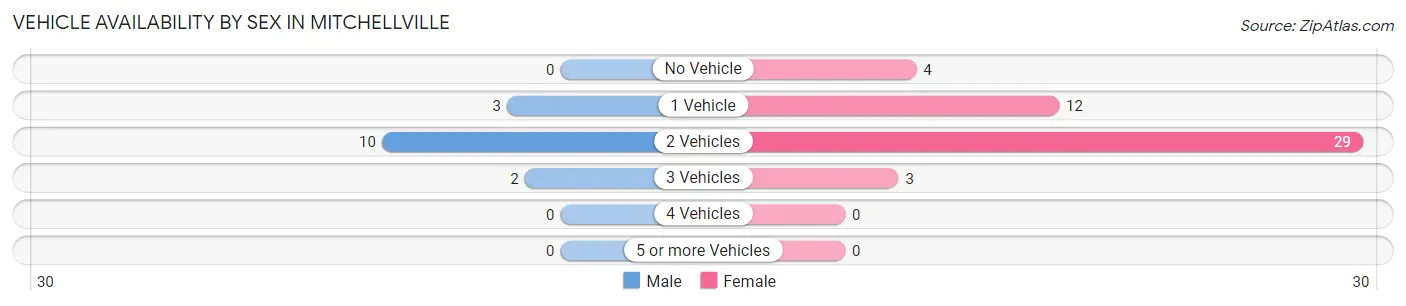
Vehicle Availability by Sex in Mitchellville
The most prevalent vehicle ownership categories in Mitchellville are males with 2 vehicles (10, accounting for 66.7%) and females with 2 vehicles (29, making up 20.8%).
| Vehicles Available | Male | Female |
| No Vehicle | 0 (0.0%) | 4 (8.3%) |
| 1 Vehicle | 3 (20.0%) | 12 (25.0%) |
| 2 Vehicles | 10 (66.7%) | 29 (60.4%) |
| 3 Vehicles | 2 (13.3%) | 3 (6.2%) |
| 4 Vehicles | 0 (0.0%) | 0 (0.0%) |
| 5 or more Vehicles | 0 (0.0%) | 0 (0.0%) |
| Total | 15 (100.0%) | 48 (100.0%) |
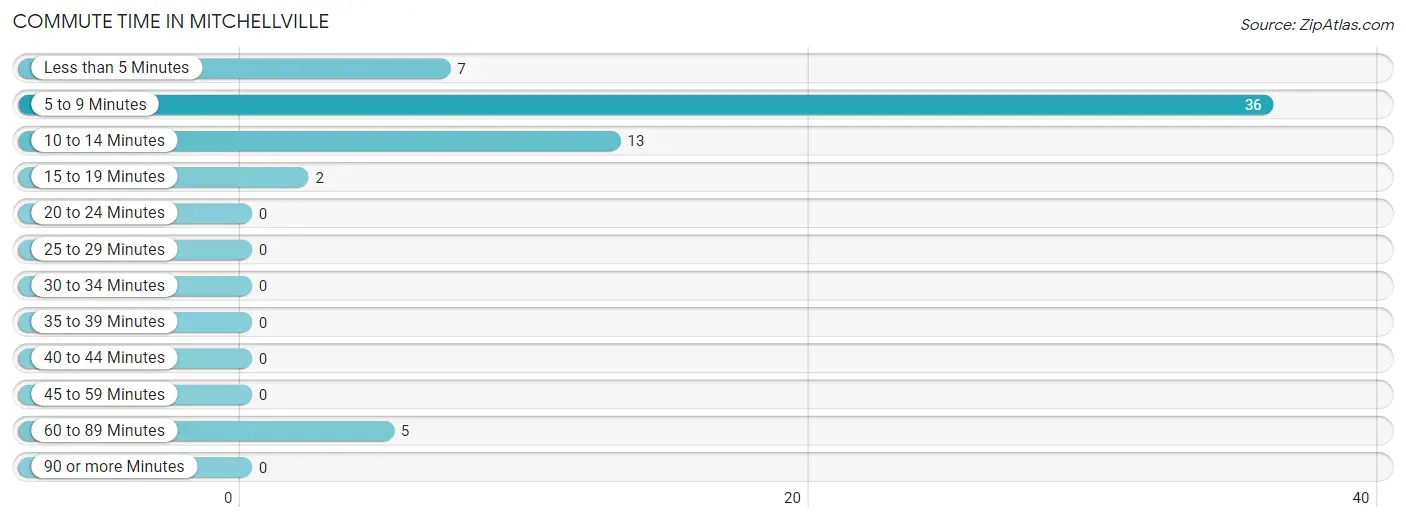
Commute Time in Mitchellville
The most frequently occuring commute durations in Mitchellville are 5 to 9 minutes (36 commuters, 57.1%), 10 to 14 minutes (13 commuters, 20.6%), and less than 5 minutes (7 commuters, 11.1%).
| Commute Time | # Commuters | % Commuters |
| Less than 5 Minutes | 7 | 11.1% |
| 5 to 9 Minutes | 36 | 57.1% |
| 10 to 14 Minutes | 13 | 20.6% |
| 15 to 19 Minutes | 2 | 3.2% |
| 20 to 24 Minutes | 0 | 0.0% |
| 25 to 29 Minutes | 0 | 0.0% |
| 30 to 34 Minutes | 0 | 0.0% |
| 35 to 39 Minutes | 0 | 0.0% |
| 40 to 44 Minutes | 0 | 0.0% |
| 45 to 59 Minutes | 0 | 0.0% |
| 60 to 89 Minutes | 5 | 7.9% |
| 90 or more Minutes | 0 | 0.0% |
Commute Time by Sex in Mitchellville
The most common commute times in Mitchellville are less than 5 minutes (6 commuters, 40.0%) for males and 5 to 9 minutes (30 commuters, 62.5%) for females.
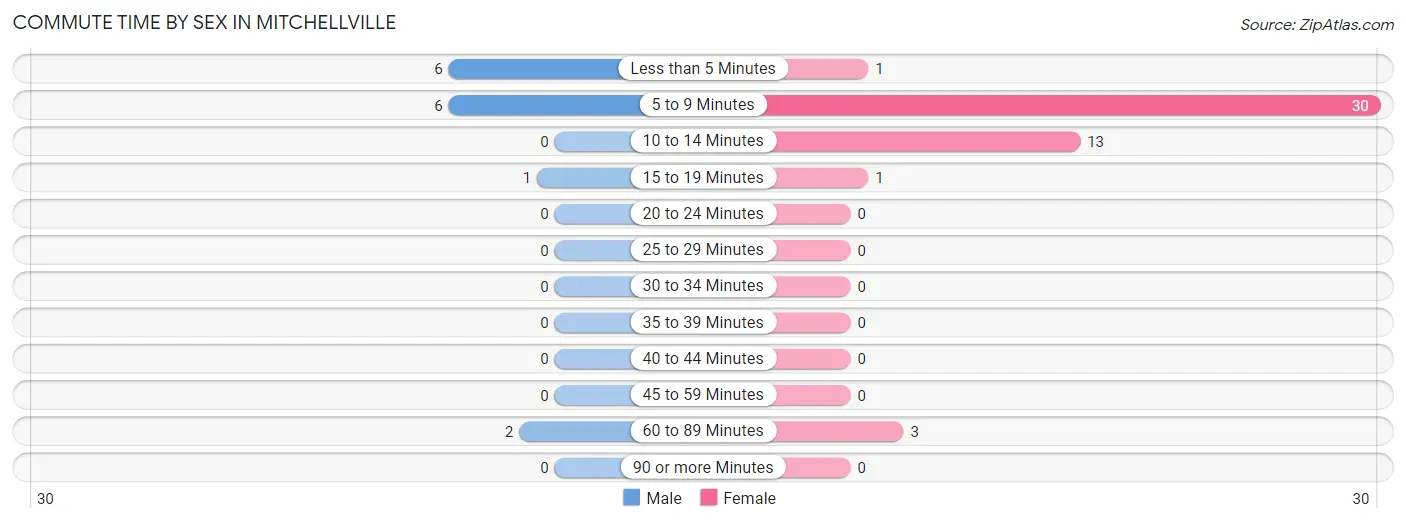
| Commute Time | Male | Female |
| Less than 5 Minutes | 6 (40.0%) | 1 (2.1%) |
| 5 to 9 Minutes | 6 (40.0%) | 30 (62.5%) |
| 10 to 14 Minutes | 0 (0.0%) | 13 (27.1%) |
| 15 to 19 Minutes | 1 (6.7%) | 1 (2.1%) |
| 20 to 24 Minutes | 0 (0.0%) | 0 (0.0%) |
| 25 to 29 Minutes | 0 (0.0%) | 0 (0.0%) |
| 30 to 34 Minutes | 0 (0.0%) | 0 (0.0%) |
| 35 to 39 Minutes | 0 (0.0%) | 0 (0.0%) |
| 40 to 44 Minutes | 0 (0.0%) | 0 (0.0%) |
| 45 to 59 Minutes | 0 (0.0%) | 0 (0.0%) |
| 60 to 89 Minutes | 2 (13.3%) | 3 (6.2%) |
| 90 or more Minutes | 0 (0.0%) | 0 (0.0%) |
Time of Departure to Work by Sex in Mitchellville
The most frequent times of departure to work in Mitchellville are 4:00 PM to 11:59 PM (6, 40.0%) for males and 6:30 AM to 6:59 AM (21, 43.8%) for females.
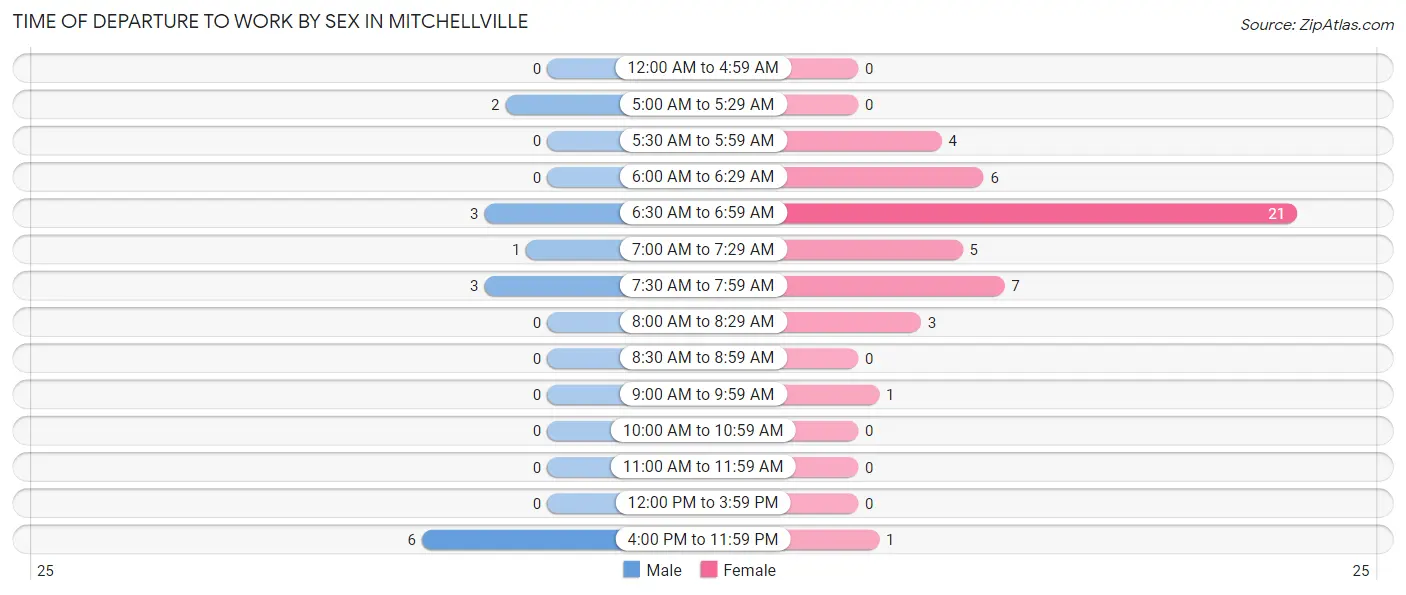
| Time of Departure | Male | Female |
| 12:00 AM to 4:59 AM | 0 (0.0%) | 0 (0.0%) |
| 5:00 AM to 5:29 AM | 2 (13.3%) | 0 (0.0%) |
| 5:30 AM to 5:59 AM | 0 (0.0%) | 4 (8.3%) |
| 6:00 AM to 6:29 AM | 0 (0.0%) | 6 (12.5%) |
| 6:30 AM to 6:59 AM | 3 (20.0%) | 21 (43.8%) |
| 7:00 AM to 7:29 AM | 1 (6.7%) | 5 (10.4%) |
| 7:30 AM to 7:59 AM | 3 (20.0%) | 7 (14.6%) |
| 8:00 AM to 8:29 AM | 0 (0.0%) | 3 (6.2%) |
| 8:30 AM to 8:59 AM | 0 (0.0%) | 0 (0.0%) |
| 9:00 AM to 9:59 AM | 0 (0.0%) | 1 (2.1%) |
| 10:00 AM to 10:59 AM | 0 (0.0%) | 0 (0.0%) |
| 11:00 AM to 11:59 AM | 0 (0.0%) | 0 (0.0%) |
| 12:00 PM to 3:59 PM | 0 (0.0%) | 0 (0.0%) |
| 4:00 PM to 11:59 PM | 6 (40.0%) | 1 (2.1%) |
| Total | 15 (100.0%) | 48 (100.0%) |
Housing Occupancy in Mitchellville
Occupancy by Ownership in Mitchellville
Of the total 113 dwellings in Mitchellville, owner-occupied units account for 62 (54.9%), while renter-occupied units make up 51 (45.1%).
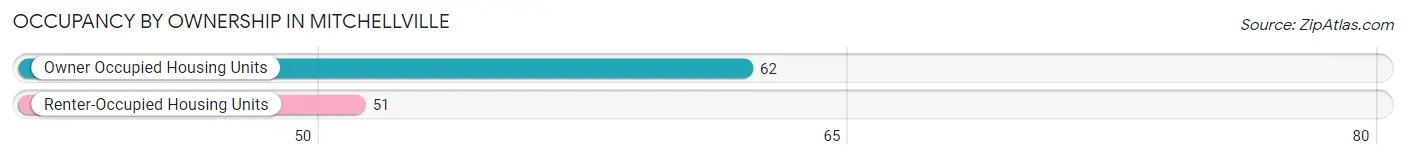
| Occupancy | # Housing Units | % Housing Units |
| Owner Occupied Housing Units | 62 | 54.9% |
| Renter-Occupied Housing Units | 51 | 45.1% |
| Total Occupied Housing Units | 113 | 100.0% |
Occupancy by Household Size in Mitchellville
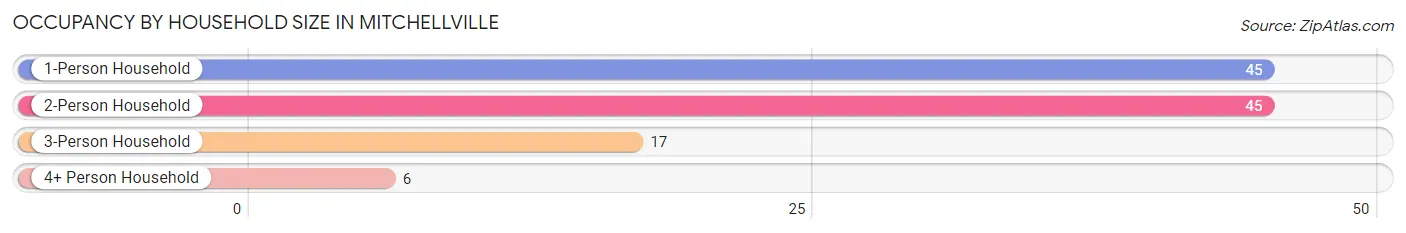
| Household Size | # Housing Units | % Housing Units |
| 1-Person Household | 45 | 39.8% |
| 2-Person Household | 45 | 39.8% |
| 3-Person Household | 17 | 15.0% |
| 4+ Person Household | 6 | 5.3% |
| Total Housing Units | 113 | 100.0% |
Occupancy by Ownership by Household Size in Mitchellville
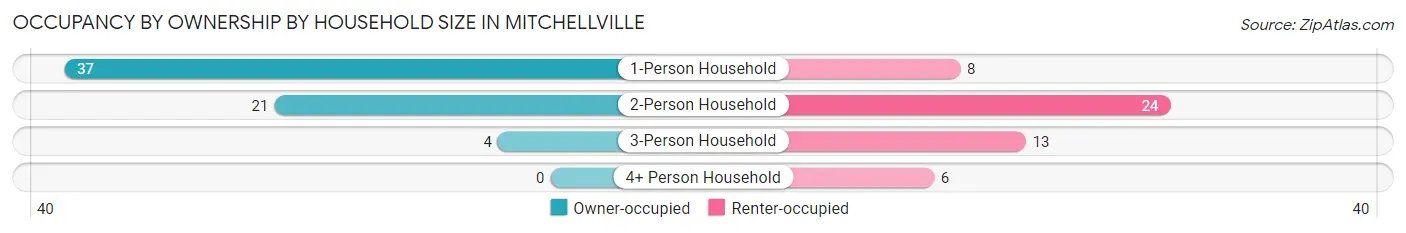
| Household Size | Owner-occupied | Renter-occupied |
| 1-Person Household | 37 (82.2%) | 8 (17.8%) |
| 2-Person Household | 21 (46.7%) | 24 (53.3%) |
| 3-Person Household | 4 (23.5%) | 13 (76.5%) |
| 4+ Person Household | 0 (0.0%) | 6 (100.0%) |
| Total Housing Units | 62 (54.9%) | 51 (45.1%) |
Occupancy by Educational Attainment in Mitchellville
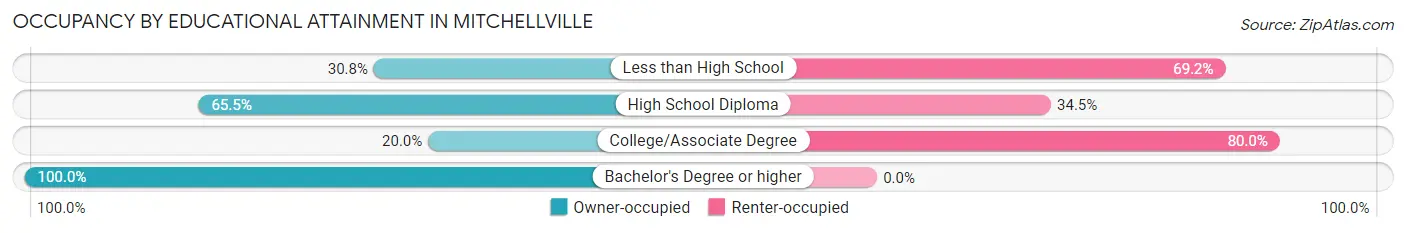
| Household Size | Owner-occupied | Renter-occupied |
| Less than High School | 12 (30.8%) | 27 (69.2%) |
| High School Diploma | 38 (65.5%) | 20 (34.5%) |
| College/Associate Degree | 1 (20.0%) | 4 (80.0%) |
| Bachelor's Degree or higher | 11 (100.0%) | 0 (0.0%) |
Occupancy by Age of Householder in Mitchellville
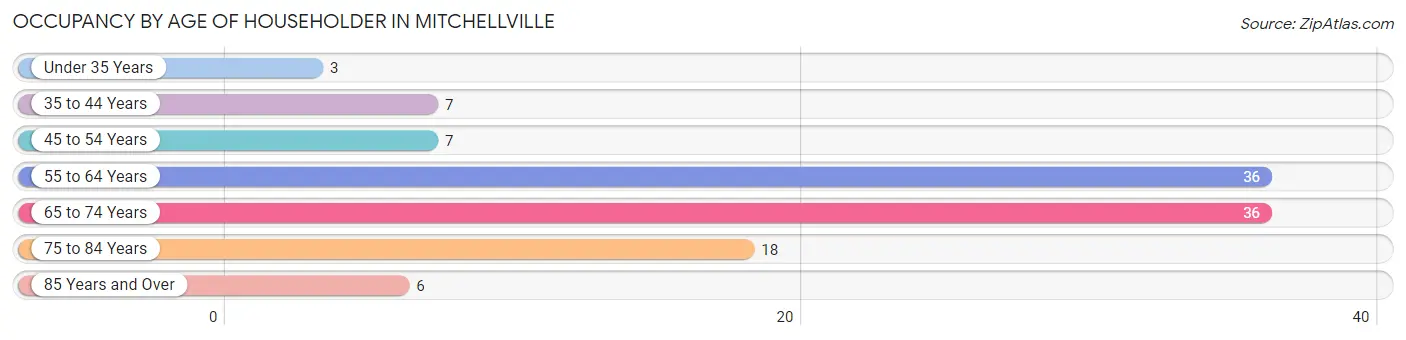
| Age Bracket | # Households | % Households |
| Under 35 Years | 3 | 2.6% |
| 35 to 44 Years | 7 | 6.2% |
| 45 to 54 Years | 7 | 6.2% |
| 55 to 64 Years | 36 | 31.9% |
| 65 to 74 Years | 36 | 31.9% |
| 75 to 84 Years | 18 | 15.9% |
| 85 Years and Over | 6 | 5.3% |
| Total | 113 | 100.0% |
Housing Finances in Mitchellville
Median Income by Occupancy in Mitchellville
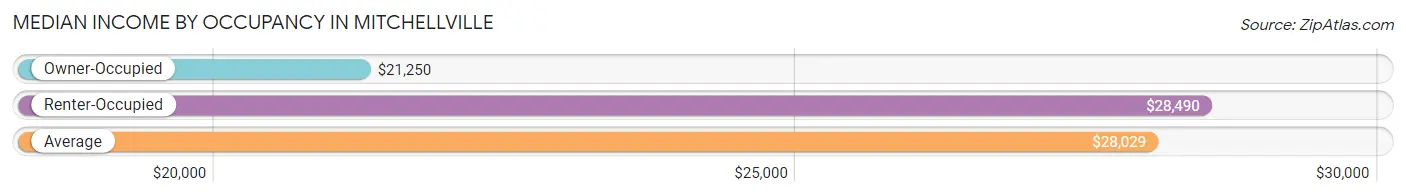
| Occupancy Type | # Households | Median Income |
| Owner-Occupied | 62 (54.9%) | $21,250 |
| Renter-Occupied | 51 (45.1%) | $28,490 |
| Average | 113 (100.0%) | $28,029 |
Occupancy by Householder Income Bracket in Mitchellville
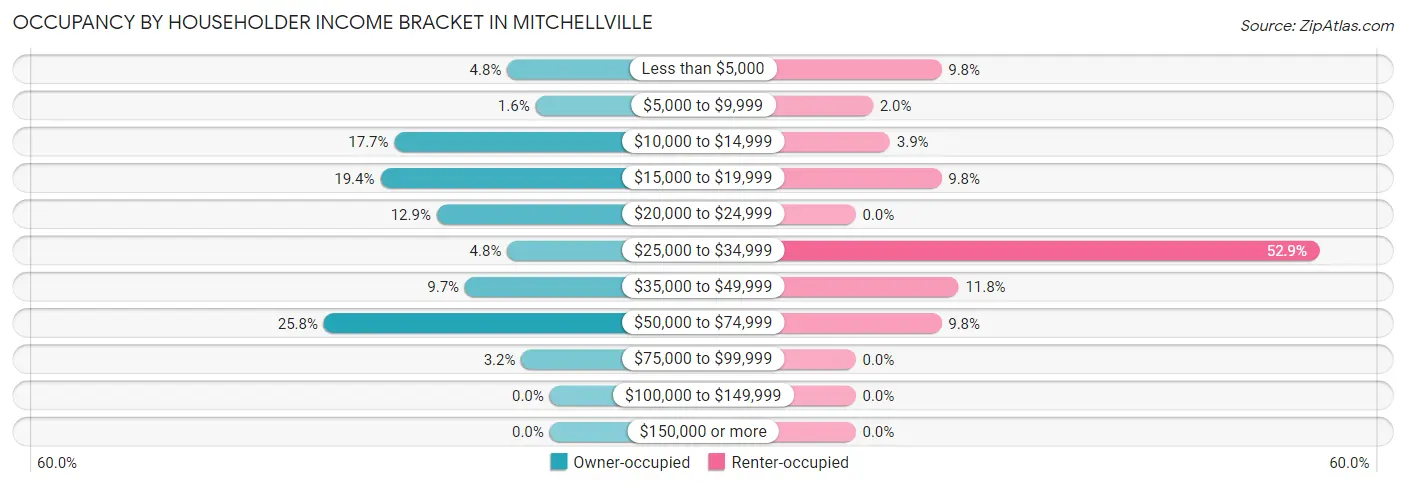
| Income Bracket | Owner-occupied | Renter-occupied |
| Less than $5,000 | 3 (4.8%) | 5 (9.8%) |
| $5,000 to $9,999 | 1 (1.6%) | 1 (2.0%) |
| $10,000 to $14,999 | 11 (17.7%) | 2 (3.9%) |
| $15,000 to $19,999 | 12 (19.4%) | 5 (9.8%) |
| $20,000 to $24,999 | 8 (12.9%) | 0 (0.0%) |
| $25,000 to $34,999 | 3 (4.8%) | 27 (52.9%) |
| $35,000 to $49,999 | 6 (9.7%) | 6 (11.8%) |
| $50,000 to $74,999 | 16 (25.8%) | 5 (9.8%) |
| $75,000 to $99,999 | 2 (3.2%) | 0 (0.0%) |
| $100,000 to $149,999 | 0 (0.0%) | 0 (0.0%) |
| $150,000 or more | 0 (0.0%) | 0 (0.0%) |
| Total | 62 (100.0%) | 51 (100.0%) |
Monthly Housing Cost Tiers in Mitchellville
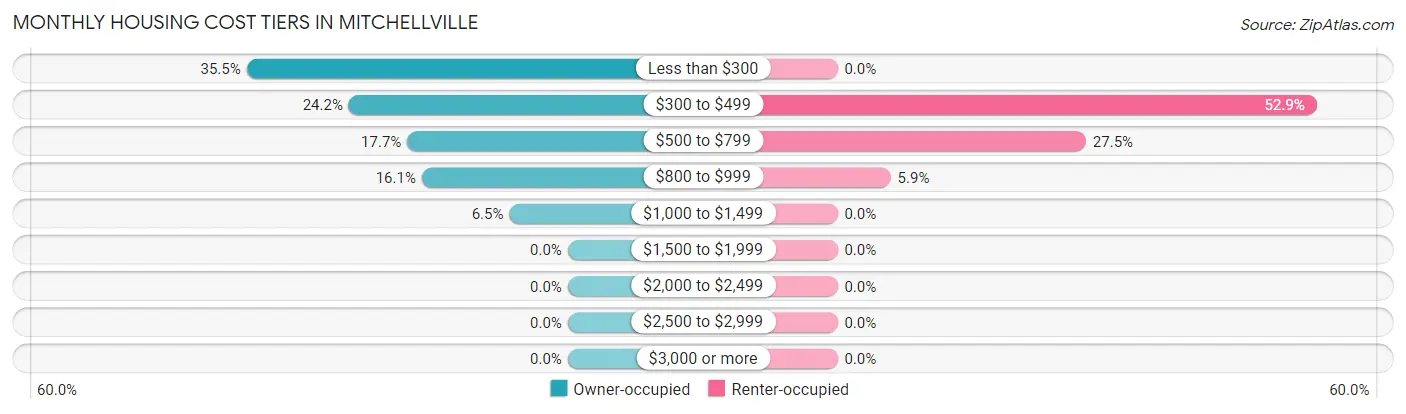
| Monthly Cost | Owner-occupied | Renter-occupied |
| Less than $300 | 22 (35.5%) | 0 (0.0%) |
| $300 to $499 | 15 (24.2%) | 27 (52.9%) |
| $500 to $799 | 11 (17.7%) | 14 (27.5%) |
| $800 to $999 | 10 (16.1%) | 3 (5.9%) |
| $1,000 to $1,499 | 4 (6.5%) | 0 (0.0%) |
| $1,500 to $1,999 | 0 (0.0%) | 0 (0.0%) |
| $2,000 to $2,499 | 0 (0.0%) | 0 (0.0%) |
| $2,500 to $2,999 | 0 (0.0%) | 0 (0.0%) |
| $3,000 or more | 0 (0.0%) | 0 (0.0%) |
| Total | 62 (100.0%) | 51 (100.0%) |
Physical Housing Characteristics in Mitchellville
Housing Structures in Mitchellville
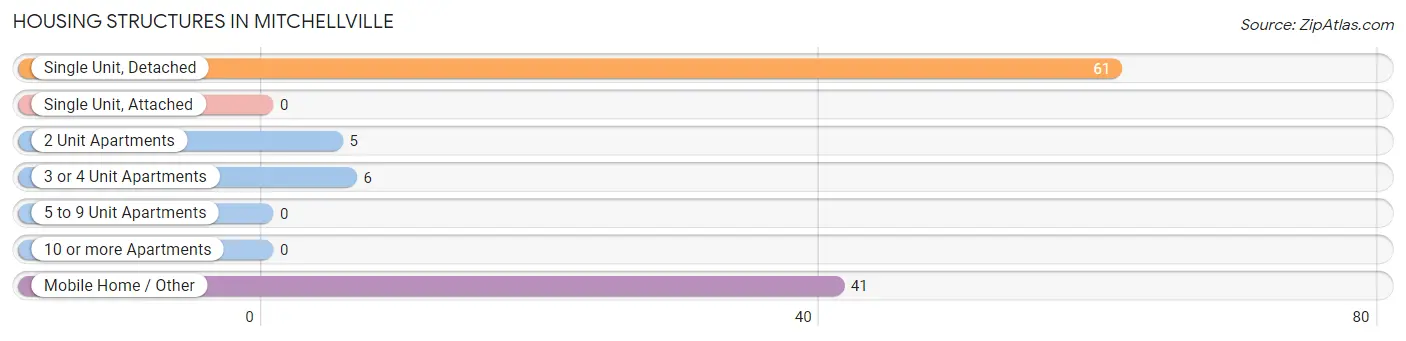
| Structure Type | # Housing Units | % Housing Units |
| Single Unit, Detached | 61 | 54.0% |
| Single Unit, Attached | 0 | 0.0% |
| 2 Unit Apartments | 5 | 4.4% |
| 3 or 4 Unit Apartments | 6 | 5.3% |
| 5 to 9 Unit Apartments | 0 | 0.0% |
| 10 or more Apartments | 0 | 0.0% |
| Mobile Home / Other | 41 | 36.3% |
| Total | 113 | 100.0% |
Housing Structures by Occupancy in Mitchellville
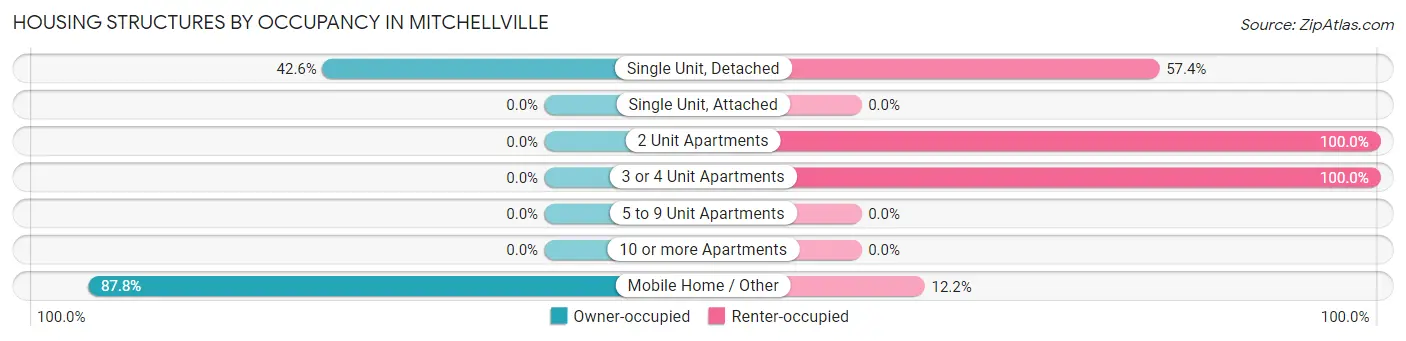
| Structure Type | Owner-occupied | Renter-occupied |
| Single Unit, Detached | 26 (42.6%) | 35 (57.4%) |
| Single Unit, Attached | 0 (0.0%) | 0 (0.0%) |
| 2 Unit Apartments | 0 (0.0%) | 5 (100.0%) |
| 3 or 4 Unit Apartments | 0 (0.0%) | 6 (100.0%) |
| 5 to 9 Unit Apartments | 0 (0.0%) | 0 (0.0%) |
| 10 or more Apartments | 0 (0.0%) | 0 (0.0%) |
| Mobile Home / Other | 36 (87.8%) | 5 (12.2%) |
| Total | 62 (54.9%) | 51 (45.1%) |
Housing Structures by Number of Rooms in Mitchellville
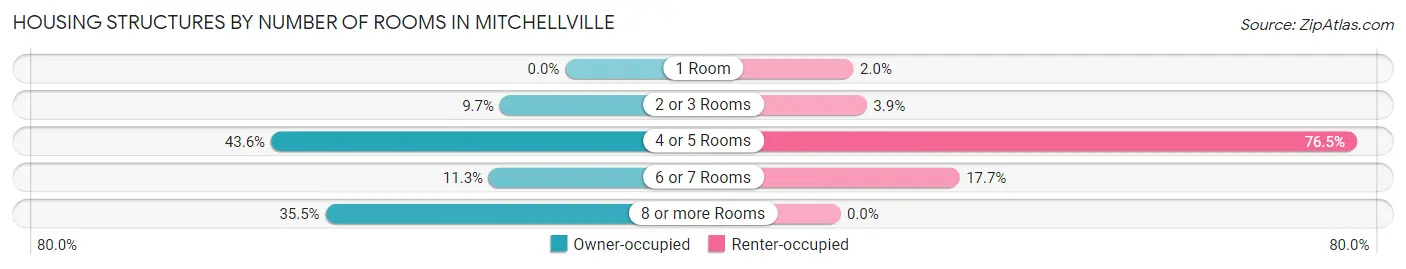
| Number of Rooms | Owner-occupied | Renter-occupied |
| 1 Room | 0 (0.0%) | 1 (2.0%) |
| 2 or 3 Rooms | 6 (9.7%) | 2 (3.9%) |
| 4 or 5 Rooms | 27 (43.5%) | 39 (76.5%) |
| 6 or 7 Rooms | 7 (11.3%) | 9 (17.6%) |
| 8 or more Rooms | 22 (35.5%) | 0 (0.0%) |
| Total | 62 (100.0%) | 51 (100.0%) |
Housing Structure by Heating Type in Mitchellville
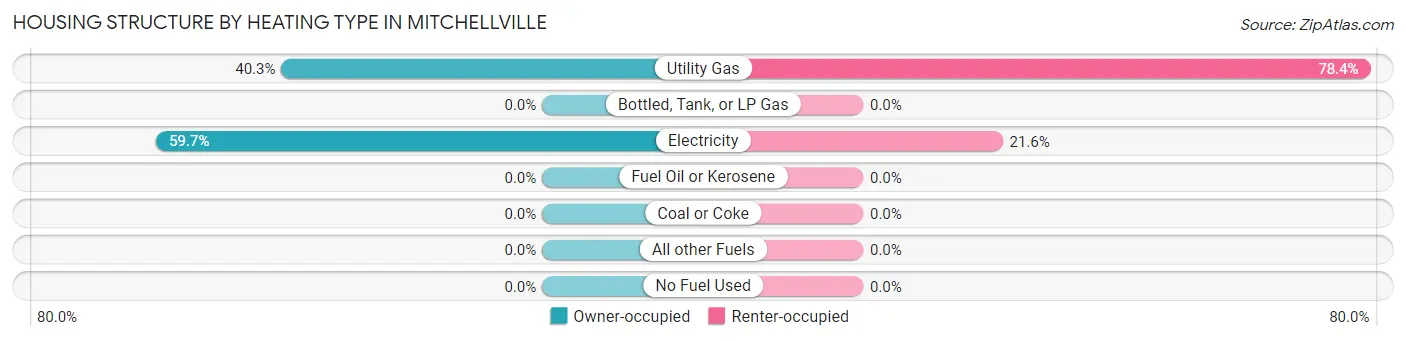
| Heating Type | Owner-occupied | Renter-occupied |
| Utility Gas | 25 (40.3%) | 40 (78.4%) |
| Bottled, Tank, or LP Gas | 0 (0.0%) | 0 (0.0%) |
| Electricity | 37 (59.7%) | 11 (21.6%) |
| Fuel Oil or Kerosene | 0 (0.0%) | 0 (0.0%) |
| Coal or Coke | 0 (0.0%) | 0 (0.0%) |
| All other Fuels | 0 (0.0%) | 0 (0.0%) |
| No Fuel Used | 0 (0.0%) | 0 (0.0%) |
| Total | 62 (100.0%) | 51 (100.0%) |
Household Vehicle Usage in Mitchellville
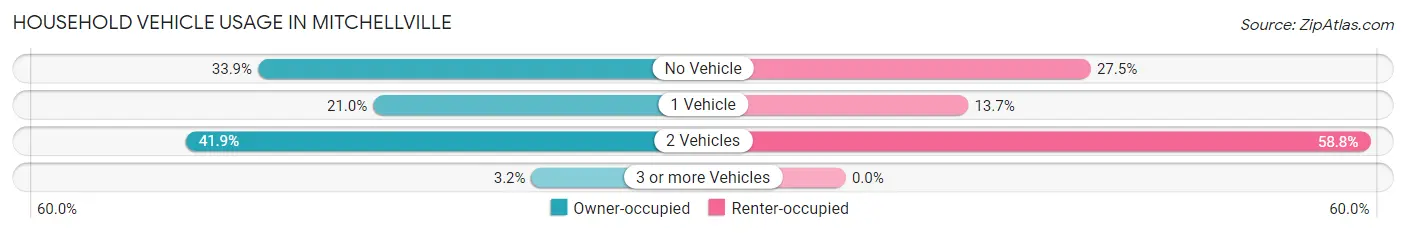
| Vehicles per Household | Owner-occupied | Renter-occupied |
| No Vehicle | 21 (33.9%) | 14 (27.5%) |
| 1 Vehicle | 13 (21.0%) | 7 (13.7%) |
| 2 Vehicles | 26 (41.9%) | 30 (58.8%) |
| 3 or more Vehicles | 2 (3.2%) | 0 (0.0%) |
| Total | 62 (100.0%) | 51 (100.0%) |
Real Estate & Mortgages in Mitchellville
Real Estate and Mortgage Overview in Mitchellville
| Characteristic | Without Mortgage | With Mortgage |
| Housing Units | 49 | 13 |
| Median Property Value | - | - |
| Median Household Income | $20,156 | $0 |
| Monthly Housing Costs | $325 | $0 |
| Real Estate Taxes | $300 | $0 |
Property Value by Mortgage Status in Mitchellville
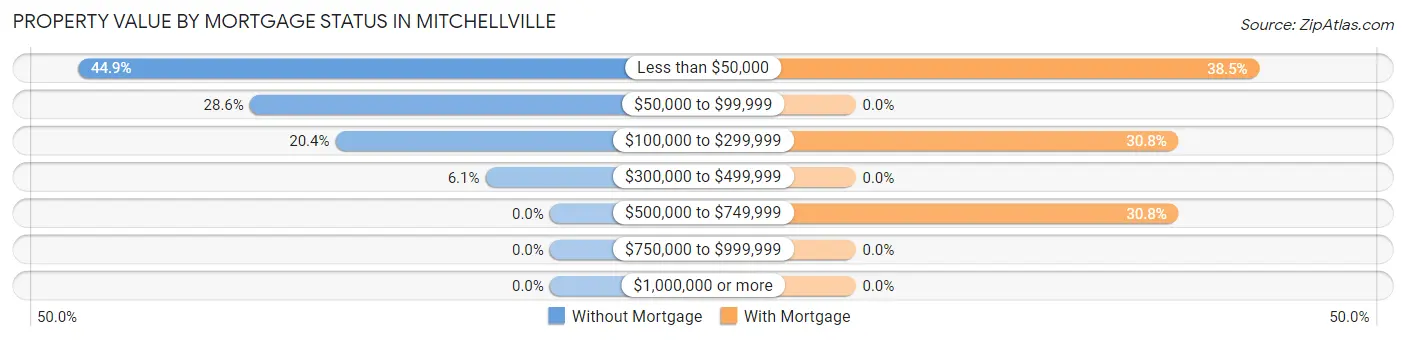
| Property Value | Without Mortgage | With Mortgage |
| Less than $50,000 | 22 (44.9%) | 5 (38.5%) |
| $50,000 to $99,999 | 14 (28.6%) | 0 (0.0%) |
| $100,000 to $299,999 | 10 (20.4%) | 4 (30.8%) |
| $300,000 to $499,999 | 3 (6.1%) | 0 (0.0%) |
| $500,000 to $749,999 | 0 (0.0%) | 4 (30.8%) |
| $750,000 to $999,999 | 0 (0.0%) | 0 (0.0%) |
| $1,000,000 or more | 0 (0.0%) | 0 (0.0%) |
| Total | 49 (100.0%) | 13 (100.0%) |
Household Income by Mortgage Status in Mitchellville
| Household Income | Without Mortgage | With Mortgage |
| Less than $10,000 | 1 (2.0%) | 0 (0.0%) |
| $10,000 to $24,999 | 31 (63.3%) | 3 (23.1%) |
| $25,000 to $34,999 | 1 (2.0%) | 0 (0.0%) |
| $35,000 to $49,999 | 2 (4.1%) | 2 (15.4%) |
| $50,000 to $74,999 | 14 (28.6%) | 4 (30.8%) |
| $75,000 to $99,999 | 0 (0.0%) | 2 (15.4%) |
| $100,000 to $149,999 | 0 (0.0%) | 2 (15.4%) |
| $150,000 or more | 0 (0.0%) | 0 (0.0%) |
| Total | 49 (100.0%) | 13 (100.0%) |
Property Value to Household Income Ratio in Mitchellville
| Value-to-Income Ratio | Without Mortgage | With Mortgage |
| Less than 2.0x | 32 (65.3%) | 39,375 (302,884.6%) |
| 2.0x to 2.9x | 3 (6.1%) | 2 (15.4%) |
| 3.0x to 3.9x | 0 (0.0%) | 0 (0.0%) |
| 4.0x or more | 14 (28.6%) | 4 (30.8%) |
| Total | 49 (100.0%) | 13 (100.0%) |
Real Estate Taxes by Mortgage Status in Mitchellville
| Property Taxes | Without Mortgage | With Mortgage |
| Less than $800 | 29 (59.2%) | 0 (0.0%) |
| $800 to $1,499 | 8 (16.3%) | 13 (100.0%) |
| $800 to $1,499 | 3 (6.1%) | 0 (0.0%) |
| Total | 49 (100.0%) | 13 (100.0%) |
Health & Disability in Mitchellville
Health Insurance Coverage by Age in Mitchellville
| Age Bracket | With Coverage | Without Coverage |
| Under 6 Years | 2 (100.0%) | 0 (0.0%) |
| 6 to 18 Years | 26 (100.0%) | 0 (0.0%) |
| 19 to 25 Years | 2 (50.0%) | 2 (50.0%) |
| 26 to 34 Years | 6 (100.0%) | 0 (0.0%) |
| 35 to 44 Years | 20 (87.0%) | 3 (13.0%) |
| 45 to 54 Years | 10 (90.9%) | 1 (9.1%) |
| 55 to 64 Years | 71 (100.0%) | 0 (0.0%) |
| 65 to 74 Years | 42 (100.0%) | 0 (0.0%) |
| 75 Years and older | 24 (100.0%) | 0 (0.0%) |
| Total | 203 (97.1%) | 6 (2.9%) |
Health Insurance Coverage by Citizenship Status in Mitchellville
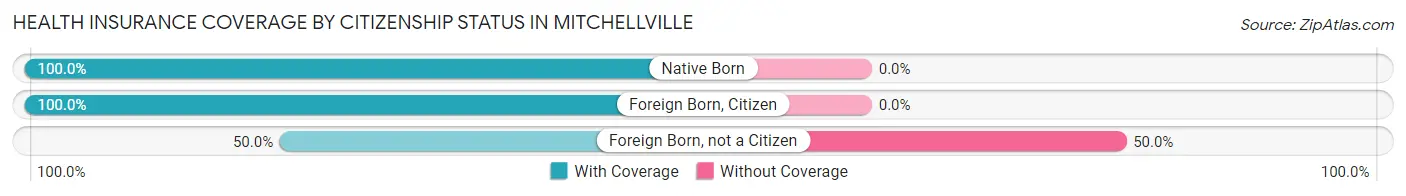
| Citizenship Status | With Coverage | Without Coverage |
| Native Born | 2 (100.0%) | 0 (0.0%) |
| Foreign Born, Citizen | 26 (100.0%) | 0 (0.0%) |
| Foreign Born, not a Citizen | 2 (50.0%) | 2 (50.0%) |
Health Insurance Coverage by Household Income in Mitchellville
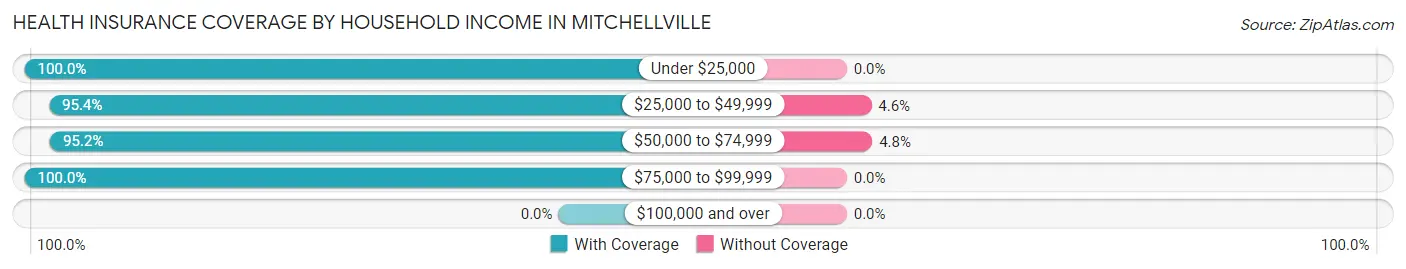
| Household Income | With Coverage | Without Coverage |
| Under $25,000 | 76 (100.0%) | 0 (0.0%) |
| $25,000 to $49,999 | 83 (95.4%) | 4 (4.6%) |
| $50,000 to $74,999 | 40 (95.2%) | 2 (4.8%) |
| $75,000 to $99,999 | 4 (100.0%) | 0 (0.0%) |
| $100,000 and over | 0 (0.0%) | 0 (0.0%) |
Public vs Private Health Insurance Coverage by Age in Mitchellville
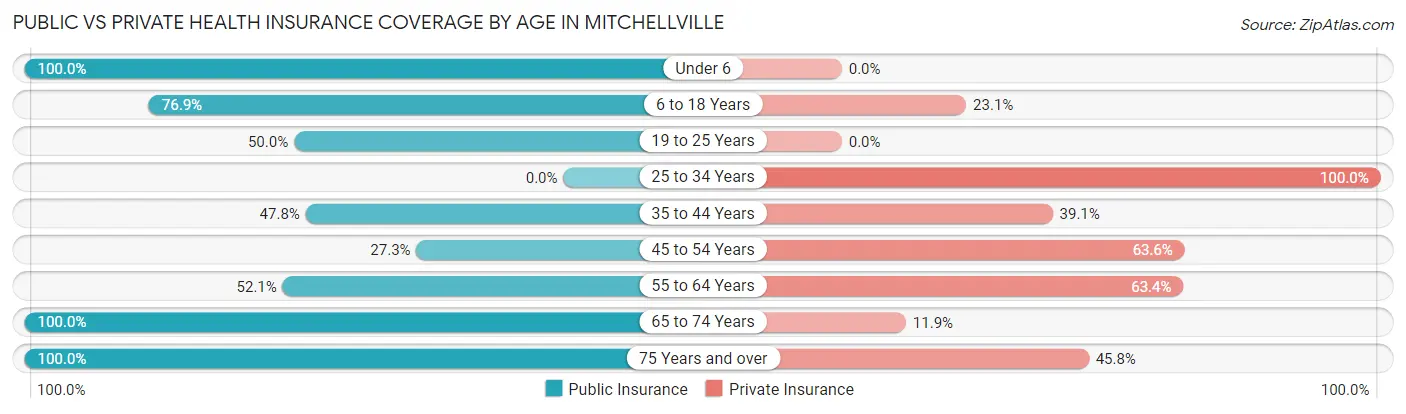
| Age Bracket | Public Insurance | Private Insurance |
| Under 6 | 2 (100.0%) | 0 (0.0%) |
| 6 to 18 Years | 20 (76.9%) | 6 (23.1%) |
| 19 to 25 Years | 2 (50.0%) | 0 (0.0%) |
| 25 to 34 Years | 0 (0.0%) | 6 (100.0%) |
| 35 to 44 Years | 11 (47.8%) | 9 (39.1%) |
| 45 to 54 Years | 3 (27.3%) | 7 (63.6%) |
| 55 to 64 Years | 37 (52.1%) | 45 (63.4%) |
| 65 to 74 Years | 42 (100.0%) | 5 (11.9%) |
| 75 Years and over | 24 (100.0%) | 11 (45.8%) |
| Total | 141 (67.5%) | 89 (42.6%) |
Disability Status by Sex by Age in Mitchellville
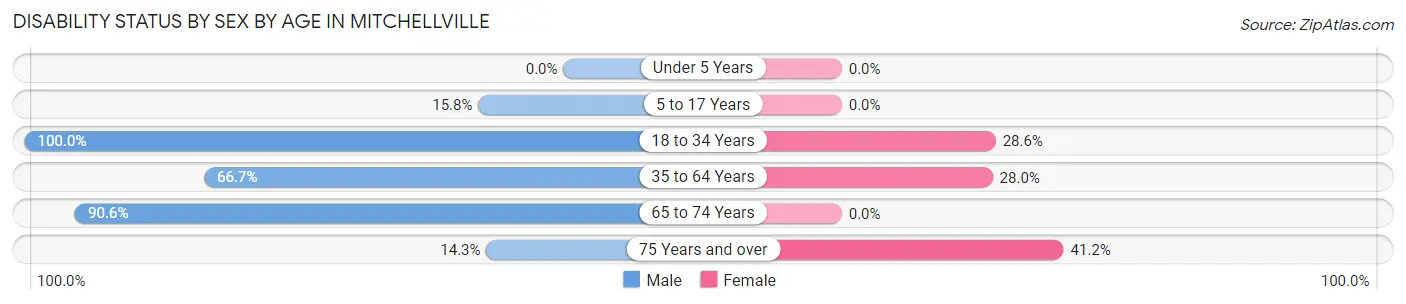
| Age Bracket | Male | Female |
| Under 5 Years | 0 (0.0%) | 0 (0.0%) |
| 5 to 17 Years | 3 (15.8%) | 0 (0.0%) |
| 18 to 34 Years | 3 (100.0%) | 2 (28.6%) |
| 35 to 64 Years | 20 (66.7%) | 21 (28.0%) |
| 65 to 74 Years | 29 (90.6%) | 0 (0.0%) |
| 75 Years and over | 1 (14.3%) | 7 (41.2%) |
Disability Class by Sex by Age in Mitchellville
Disability Class: Hearing Difficulty
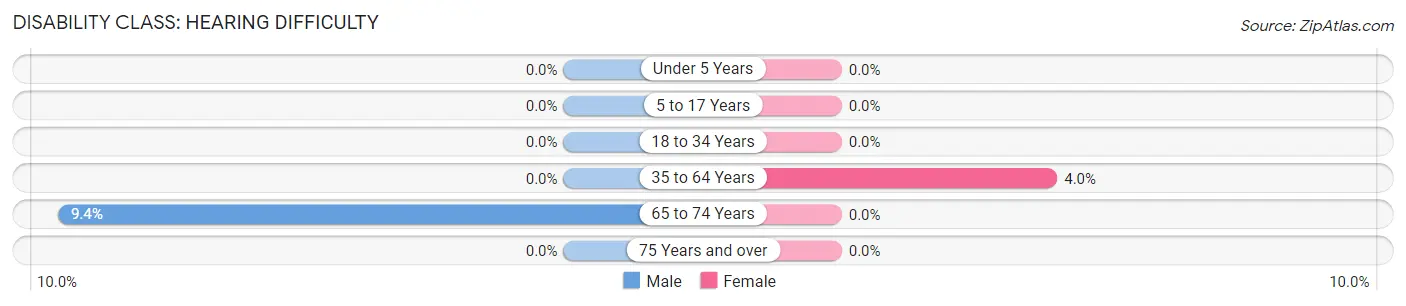
| Age Bracket | Male | Female |
| Under 5 Years | 0 (0.0%) | 0 (0.0%) |
| 5 to 17 Years | 0 (0.0%) | 0 (0.0%) |
| 18 to 34 Years | 0 (0.0%) | 0 (0.0%) |
| 35 to 64 Years | 0 (0.0%) | 3 (4.0%) |
| 65 to 74 Years | 3 (9.4%) | 0 (0.0%) |
| 75 Years and over | 0 (0.0%) | 0 (0.0%) |
Disability Class: Vision Difficulty
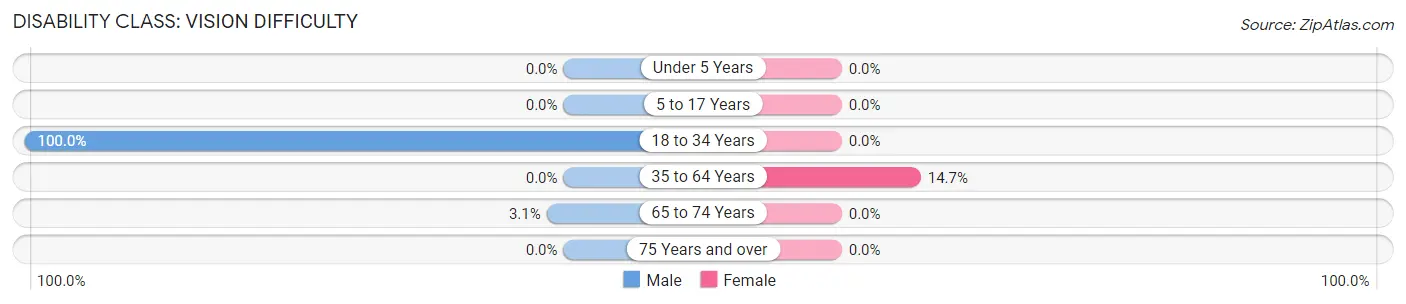
| Age Bracket | Male | Female |
| Under 5 Years | 0 (0.0%) | 0 (0.0%) |
| 5 to 17 Years | 0 (0.0%) | 0 (0.0%) |
| 18 to 34 Years | 3 (100.0%) | 0 (0.0%) |
| 35 to 64 Years | 0 (0.0%) | 11 (14.7%) |
| 65 to 74 Years | 1 (3.1%) | 0 (0.0%) |
| 75 Years and over | 0 (0.0%) | 0 (0.0%) |
Disability Class: Cognitive Difficulty
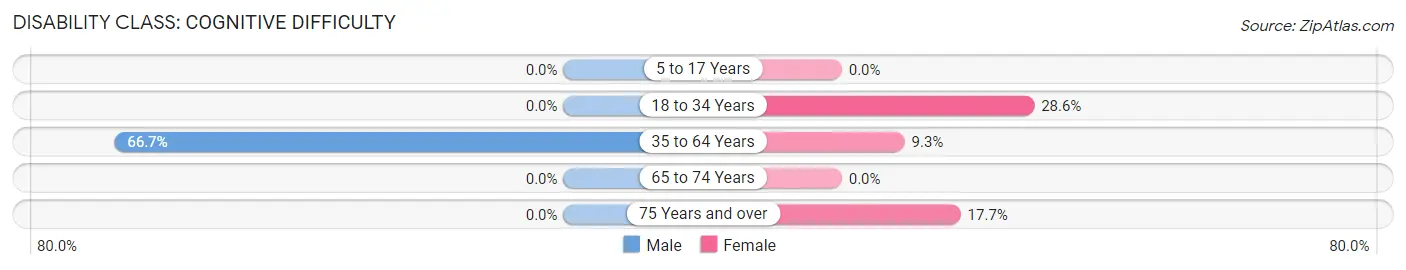
| Age Bracket | Male | Female |
| 5 to 17 Years | 0 (0.0%) | 0 (0.0%) |
| 18 to 34 Years | 0 (0.0%) | 2 (28.6%) |
| 35 to 64 Years | 20 (66.7%) | 7 (9.3%) |
| 65 to 74 Years | 0 (0.0%) | 0 (0.0%) |
| 75 Years and over | 0 (0.0%) | 3 (17.6%) |
Disability Class: Ambulatory Difficulty
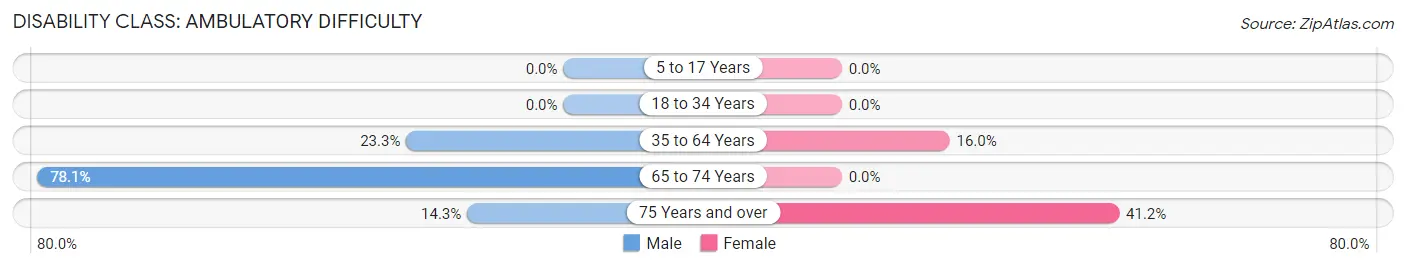
| Age Bracket | Male | Female |
| 5 to 17 Years | 0 (0.0%) | 0 (0.0%) |
| 18 to 34 Years | 0 (0.0%) | 0 (0.0%) |
| 35 to 64 Years | 7 (23.3%) | 12 (16.0%) |
| 65 to 74 Years | 25 (78.1%) | 0 (0.0%) |
| 75 Years and over | 1 (14.3%) | 7 (41.2%) |
Disability Class: Self-Care Difficulty
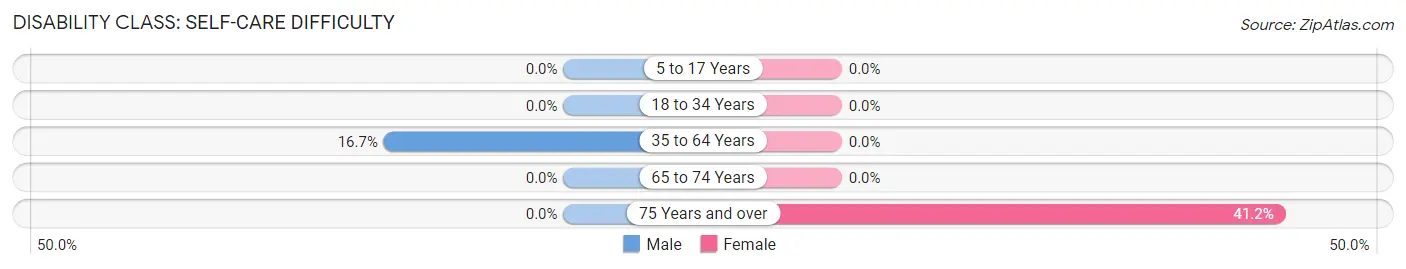
| Age Bracket | Male | Female |
| 5 to 17 Years | 0 (0.0%) | 0 (0.0%) |
| 18 to 34 Years | 0 (0.0%) | 0 (0.0%) |
| 35 to 64 Years | 5 (16.7%) | 0 (0.0%) |
| 65 to 74 Years | 0 (0.0%) | 0 (0.0%) |
| 75 Years and over | 0 (0.0%) | 7 (41.2%) |
Technology Access in Mitchellville
Computing Device Access in Mitchellville
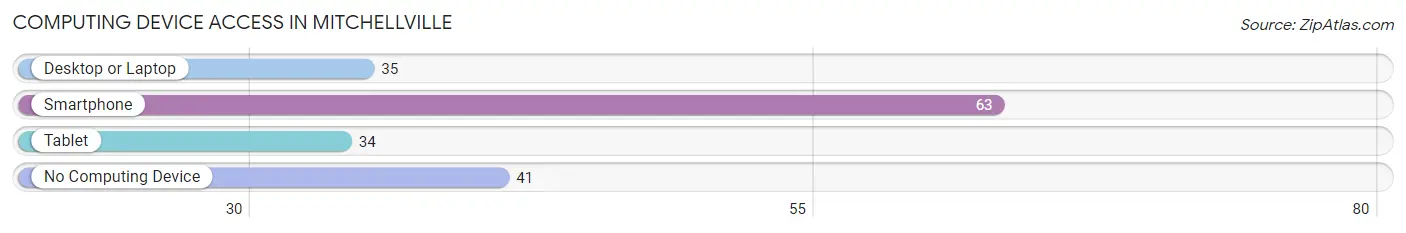
| Device Type | # Households | % Households |
| Desktop or Laptop | 35 | 31.0% |
| Smartphone | 63 | 55.7% |
| Tablet | 34 | 30.1% |
| No Computing Device | 41 | 36.3% |
| Total | 113 | 100.0% |
Internet Access in Mitchellville
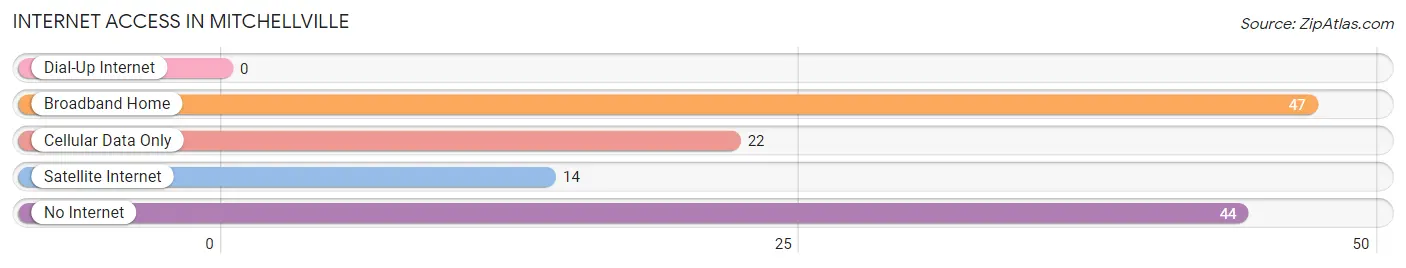
| Internet Type | # Households | % Households |
| Dial-Up Internet | 0 | 0.0% |
| Broadband Home | 47 | 41.6% |
| Cellular Data Only | 22 | 19.5% |
| Satellite Internet | 14 | 12.4% |
| No Internet | 44 | 38.9% |
| Total | 113 | 100.0% |
Mitchellville Summary
Mitchellville is a small town located in Arkansas, United States. It is situated in the northern part of the state, in the foothills of the Ozark Mountains. The town is located in Conway County, and is part of the Little Rock-North Little Rock-Conway Metropolitan Statistical Area. The population of Mitchellville was estimated to be 1,072 in 2019.
History
Mitchellville was founded in 1883 by William Mitchell, a former Confederate soldier. The town was named after him, and it was incorporated in 1887. The town was originally a farming community, and it was known for its production of cotton, corn, and other crops.
In the early 1900s, Mitchellville began to experience a period of growth and development. The town was connected to the railroad in 1906, and this allowed for the transportation of goods and people to and from the town. The town also had a post office, a bank, and a hotel.
In the 1920s, Mitchellville experienced a period of decline. The Great Depression caused many businesses to close, and the population of the town decreased. However, the town was able to recover in the 1940s and 1950s, and it experienced a period of growth and development.
Geography
Mitchellville is located in the northern part of Arkansas, in the foothills of the Ozark Mountains. The town is situated in Conway County, and it is part of the Little Rock-North Little Rock-Conway Metropolitan Statistical Area. The town is located at an elevation of 845 feet above sea level.
The climate in Mitchellville is humid subtropical, with hot summers and mild winters. The average annual temperature is around 64°F, and the average annual precipitation is around 48 inches.
Economy
The economy of Mitchellville is largely based on agriculture. The town is known for its production of cotton, corn, and other crops. The town also has a few small businesses, such as restaurants, stores, and service providers.
Demographics
As of 2019, the population of Mitchellville was estimated to be 1,072. The racial makeup of the town was 94.2% White, 2.7% Black or African American, 0.3% Native American, 0.3% Asian, 0.1% Pacific Islander, and 2.4% from other races. The median household income was $37,917, and the median family income was $45,000. The per capita income was $18,945.
Conclusion
Mitchellville is a small town located in Arkansas, United States. It is situated in the northern part of the state, in the foothills of the Ozark Mountains. The town was founded in 1883 by William Mitchell, and it was incorporated in 1887. The town has a humid subtropical climate, and its economy is largely based on agriculture. The population of Mitchellville was estimated to be 1,072 in 2019.
Common Questions
What is Per Capita Income in Mitchellville?
Per Capita income in Mitchellville is $15,926.
What is the Median Family Income in Mitchellville?
Median Family Income in Mitchellville is $29,271.
What is the Median Household income in Mitchellville?
Median Household Income in Mitchellville is $28,029.
What is Income or Wage Gap in Mitchellville?
Income or Wage Gap in Mitchellville is 36.1%.
Women in Mitchellville earn 63.9 cents for every dollar earned by a man.
What is Family Income Deficit in Mitchellville?
Family Income Deficit in Mitchellville is $13,836.
Families that are below poverty line in Mitchellville earn $13,836 less on average than the poverty threshold level.
What is Inequality or Gini Index in Mitchellville?
Inequality or Gini Index in Mitchellville is 0.35.
What is the Total Population of Mitchellville?
Total Population of Mitchellville is 209.
What is the Total Male Population of Mitchellville?
Total Male Population of Mitchellville is 91.
What is the Total Female Population of Mitchellville?
Total Female Population of Mitchellville is 118.
What is the Ratio of Males per 100 Females in Mitchellville?
There are 77.12 Males per 100 Females in Mitchellville.
What is the Ratio of Females per 100 Males in Mitchellville?
There are 129.67 Females per 100 Males in Mitchellville.
What is the Median Population Age in Mitchellville?
Median Population Age in Mitchellville is 61.1 Years.
What is the Average Family Size in Mitchellville
Average Family Size in Mitchellville is 2.4 People.
What is the Average Household Size in Mitchellville
Average Household Size in Mitchellville is 1.9 People.
How Large is the Labor Force in Mitchellville?
There are 69 People in the Labor Forcein in Mitchellville.
What is the Percentage of People in the Labor Force in Mitchellville?
37.5% of People are in the Labor Force in Mitchellville.
What is the Unemployment Rate in Mitchellville?
Unemployment Rate in Mitchellville is 8.7%.