Reed, AR Map & Demographics
Reed Map
Reed Overview
$18,389
PER CAPITA INCOME
$30,938
AVG FAMILY INCOME
$25,833
AVG HOUSEHOLD INCOME
27.7%
WAGE / INCOME GAP [ % ]
72.3¢/ $1
WAGE / INCOME GAP [ $ ]
0.38
INEQUALITY / GINI INDEX
159
TOTAL POPULATION
81
MALE POPULATION
78
FEMALE POPULATION
103.85
MALES / 100 FEMALES
96.30
FEMALES / 100 MALES
58.1
MEDIAN AGE
2.1
AVG FAMILY SIZE
1.7
AVG HOUSEHOLD SIZE
48
LABOR FORCE [ PEOPLE ]
30.6%
PERCENT IN LABOR FORCE
Income in Reed
Income Overview in Reed
Per Capita Income in Reed is $18,389, while median incomes of families and households are $30,938 and $25,833 respectively.
| Characteristic | Number | Measure |
| Per Capita Income | 159 | $18,389 |
| Median Family Income | 51 | $30,938 |
| Mean Family Income | 51 | $38,247 |
| Median Household Income | 96 | $25,833 |
| Mean Household Income | 96 | $31,704 |
| Income Deficit | 51 | $0 |
| Wage / Income Gap (%) | 159 | 27.73% |
| Wage / Income Gap ($) | 159 | 72.27¢ per $1 |
| Gini / Inequality Index | 159 | 0.38 |
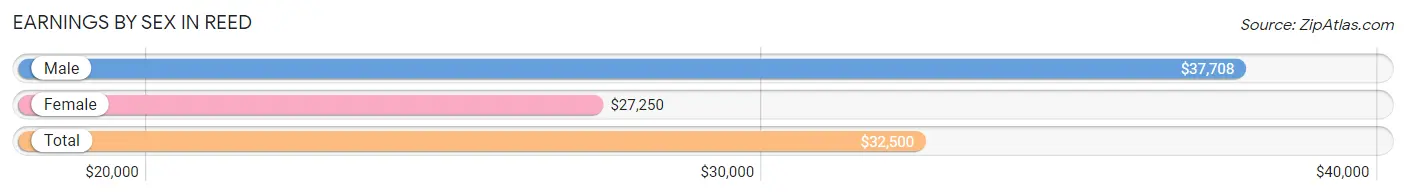
Earnings by Sex in Reed
Average Earnings in Reed are $32,500, $37,708 for men and $27,250 for women, a difference of 27.7%.
| Sex | Number | Average Earnings |
| Male | 29 (60.4%) | $37,708 |
| Female | 19 (39.6%) | $27,250 |
| Total | 48 (100.0%) | $32,500 |
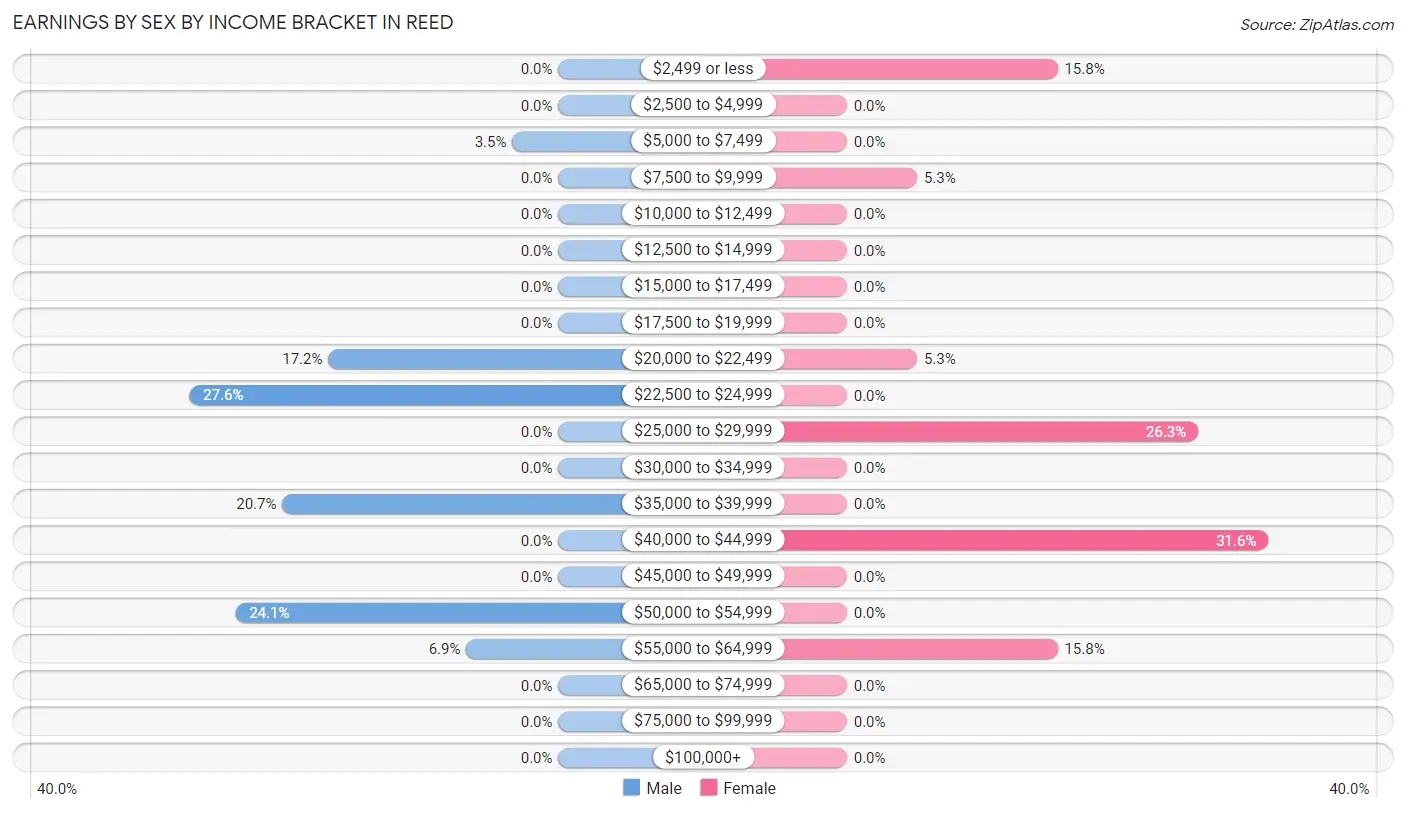
Earnings by Sex by Income Bracket in Reed
The most common earnings brackets in Reed are $22,500 to $24,999 for men (8 | 27.6%) and $40,000 to $44,999 for women (6 | 31.6%).
| Income | Male | Female |
| $2,499 or less | 0 (0.0%) | 3 (15.8%) |
| $2,500 to $4,999 | 0 (0.0%) | 0 (0.0%) |
| $5,000 to $7,499 | 1 (3.5%) | 0 (0.0%) |
| $7,500 to $9,999 | 0 (0.0%) | 1 (5.3%) |
| $10,000 to $12,499 | 0 (0.0%) | 0 (0.0%) |
| $12,500 to $14,999 | 0 (0.0%) | 0 (0.0%) |
| $15,000 to $17,499 | 0 (0.0%) | 0 (0.0%) |
| $17,500 to $19,999 | 0 (0.0%) | 0 (0.0%) |
| $20,000 to $22,499 | 5 (17.2%) | 1 (5.3%) |
| $22,500 to $24,999 | 8 (27.6%) | 0 (0.0%) |
| $25,000 to $29,999 | 0 (0.0%) | 5 (26.3%) |
| $30,000 to $34,999 | 0 (0.0%) | 0 (0.0%) |
| $35,000 to $39,999 | 6 (20.7%) | 0 (0.0%) |
| $40,000 to $44,999 | 0 (0.0%) | 6 (31.6%) |
| $45,000 to $49,999 | 0 (0.0%) | 0 (0.0%) |
| $50,000 to $54,999 | 7 (24.1%) | 0 (0.0%) |
| $55,000 to $64,999 | 2 (6.9%) | 3 (15.8%) |
| $65,000 to $74,999 | 0 (0.0%) | 0 (0.0%) |
| $75,000 to $99,999 | 0 (0.0%) | 0 (0.0%) |
| $100,000+ | 0 (0.0%) | 0 (0.0%) |
| Total | 29 (100.0%) | 19 (100.0%) |
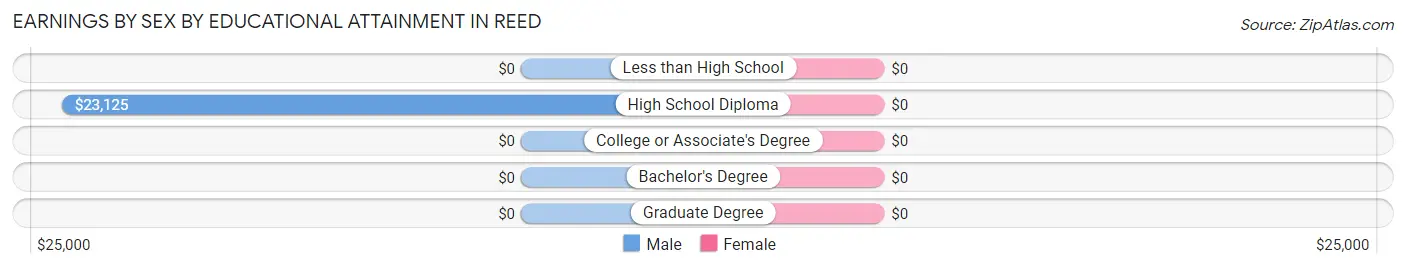
Earnings by Sex by Educational Attainment in Reed
| Educational Attainment | Male Income | Female Income |
| Less than High School | - | - |
| High School Diploma | $23,125 | $0 |
| College or Associate's Degree | - | - |
| Bachelor's Degree | - | - |
| Graduate Degree | - | - |
| Total | $37,708 | $27,250 |
Family Income in Reed
Family Income Brackets in Reed
According to the Reed family income data, there are 13 families falling into the $25,000 to $34,999 income range, which is the most common income bracket and makes up 25.5% of all families.
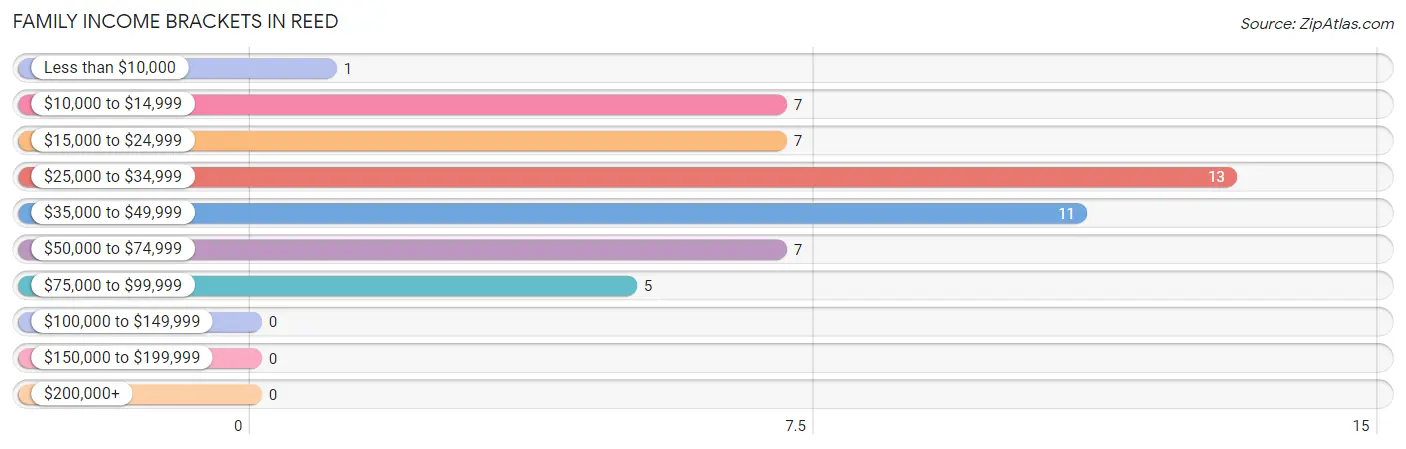
| Income Bracket | # Families | % Families |
| Less than $10,000 | 1 | 2.0% |
| $10,000 to $14,999 | 7 | 13.7% |
| $15,000 to $24,999 | 7 | 13.7% |
| $25,000 to $34,999 | 13 | 25.5% |
| $35,000 to $49,999 | 11 | 21.6% |
| $50,000 to $74,999 | 7 | 13.7% |
| $75,000 to $99,999 | 5 | 9.8% |
| $100,000 to $149,999 | 0 | 0.0% |
| $150,000 to $199,999 | 0 | 0.0% |
| $200,000+ | 0 | 0.0% |
Family Income by Famaliy Size in Reed
2-person families (49 | 96.1%) account for the highest median family income in Reed with $30,938 per family, while 2-person families (49 | 96.1%) have the highest median income of $15,469 per family member.
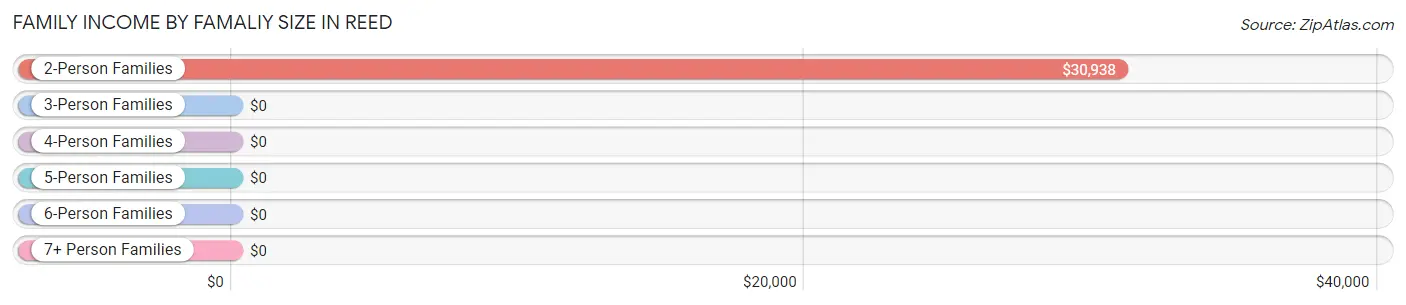
| Income Bracket | # Families | Median Income |
| 2-Person Families | 49 (96.1%) | $30,938 |
| 3-Person Families | 2 (3.9%) | $0 |
| 4-Person Families | 0 (0.0%) | $0 |
| 5-Person Families | 0 (0.0%) | $0 |
| 6-Person Families | 0 (0.0%) | $0 |
| 7+ Person Families | 0 (0.0%) | $0 |
| Total | 51 (100.0%) | $30,938 |
Family Income by Number of Earners in Reed
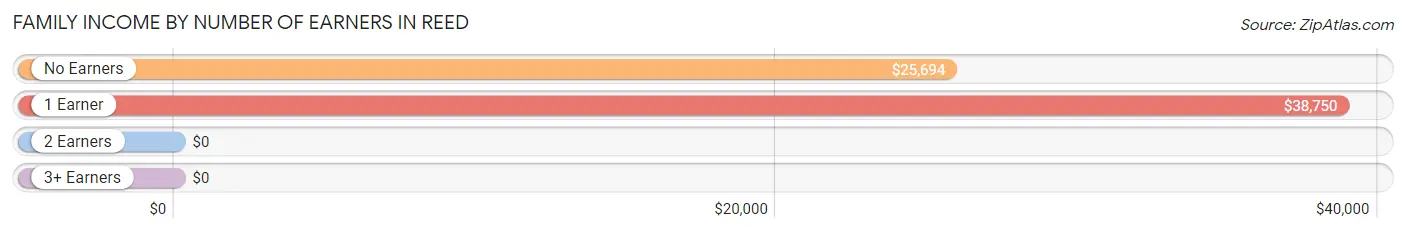
| Number of Earners | # Families | Median Income |
| No Earners | 33 (64.7%) | $25,694 |
| 1 Earner | 8 (15.7%) | $38,750 |
| 2 Earners | 10 (19.6%) | $0 |
| 3+ Earners | 0 (0.0%) | $0 |
| Total | 51 (100.0%) | $30,938 |
Household Income in Reed
Household Income Brackets in Reed
With 18 households falling in the category, the $10,000 to $14,999 income range is the most frequent in Reed, accounting for 18.8% of all households.
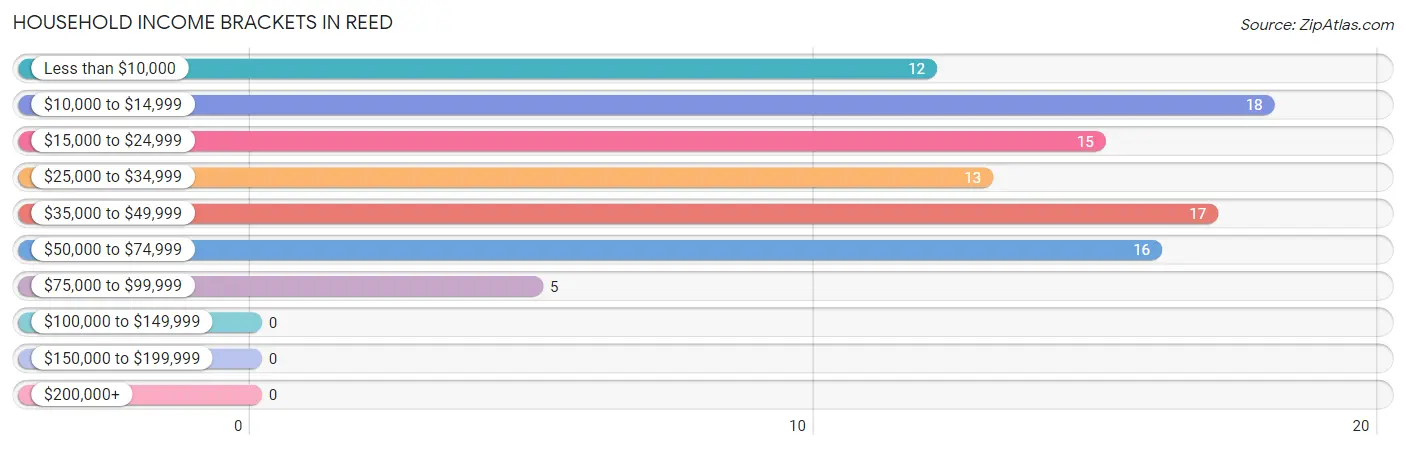
| Income Bracket | # Households | % Households |
| Less than $10,000 | 12 | 12.5% |
| $10,000 to $14,999 | 18 | 18.8% |
| $15,000 to $24,999 | 15 | 15.6% |
| $25,000 to $34,999 | 13 | 13.5% |
| $35,000 to $49,999 | 17 | 17.7% |
| $50,000 to $74,999 | 16 | 16.7% |
| $75,000 to $99,999 | 5 | 5.2% |
| $100,000 to $149,999 | 0 | 0.0% |
| $150,000 to $199,999 | 0 | 0.0% |
| $200,000+ | 0 | 0.0% |
Household Income by Householder Age in Reed
The median household income in Reed is $25,833, with the highest median household income of $25,417 found in the 65+ years age bracket for the primary householder. A total of 37 households (38.5%) fall into this category.
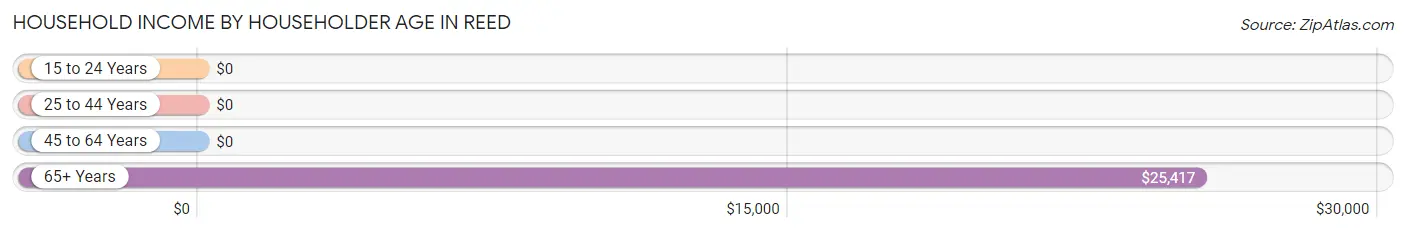
| Income Bracket | # Households | Median Income |
| 15 to 24 Years | 0 (0.0%) | $0 |
| 25 to 44 Years | 11 (11.5%) | $0 |
| 45 to 64 Years | 48 (50.0%) | $0 |
| 65+ Years | 37 (38.5%) | $25,417 |
| Total | 96 (100.0%) | $25,833 |
Poverty in Reed
Income Below Poverty by Sex and Age in Reed
With 18.5% poverty level for males and 35.9% for females among the residents of Reed, 55 to 64 year old males and 6 to 11 year old females are the most vulnerable to poverty, with 8 males (36.4%) and 2 females (100.0%) in their respective age groups living below the poverty level.
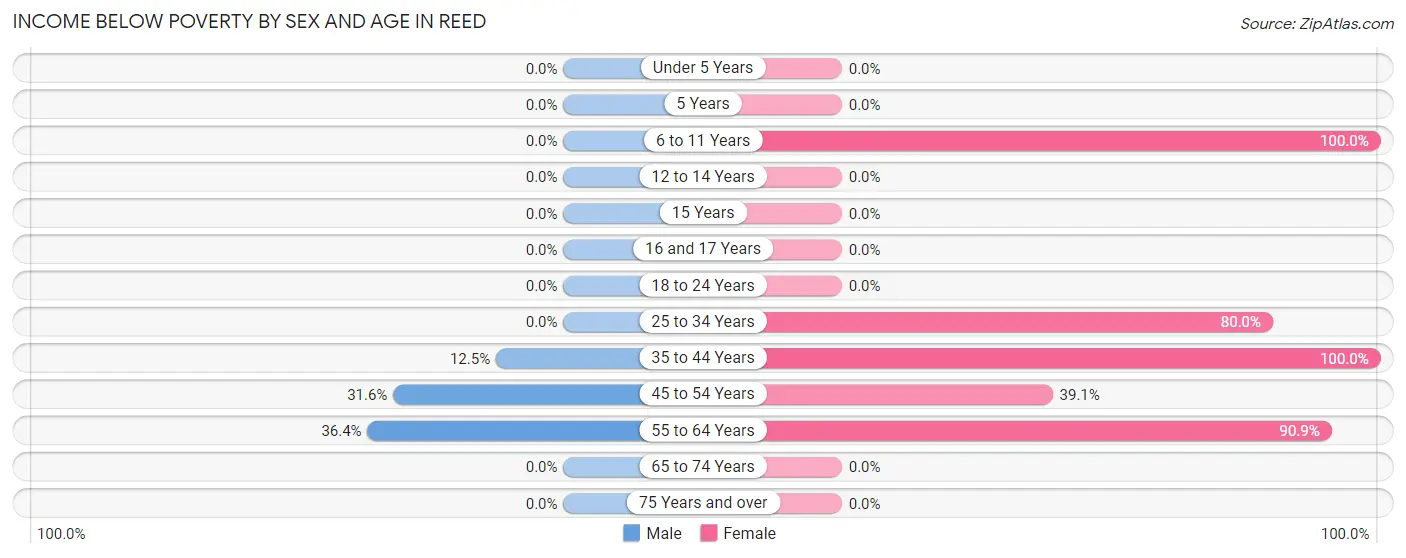
| Age Bracket | Male | Female |
| Under 5 Years | 0 (0.0%) | 0 (0.0%) |
| 5 Years | 0 (0.0%) | 0 (0.0%) |
| 6 to 11 Years | 0 (0.0%) | 2 (100.0%) |
| 12 to 14 Years | 0 (0.0%) | 0 (0.0%) |
| 15 Years | 0 (0.0%) | 0 (0.0%) |
| 16 and 17 Years | 0 (0.0%) | 0 (0.0%) |
| 18 to 24 Years | 0 (0.0%) | 0 (0.0%) |
| 25 to 34 Years | 0 (0.0%) | 4 (80.0%) |
| 35 to 44 Years | 1 (12.5%) | 3 (100.0%) |
| 45 to 54 Years | 6 (31.6%) | 9 (39.1%) |
| 55 to 64 Years | 8 (36.4%) | 10 (90.9%) |
| 65 to 74 Years | 0 (0.0%) | 0 (0.0%) |
| 75 Years and over | 0 (0.0%) | 0 (0.0%) |
| Total | 15 (18.5%) | 28 (35.9%) |
Income Above Poverty by Sex and Age in Reed
According to the poverty statistics in Reed, males aged 18 to 24 years and females aged 65 to 74 years are the age groups that are most secure financially, with 100.0% of males and 100.0% of females in these age groups living above the poverty line.
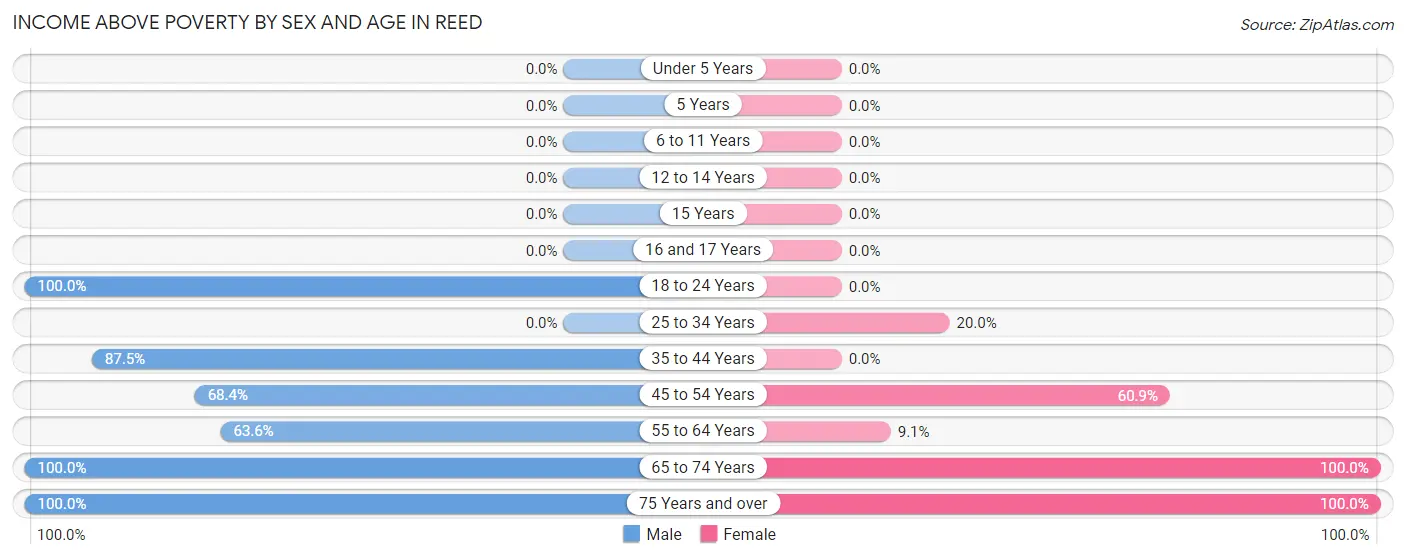
| Age Bracket | Male | Female |
| Under 5 Years | 0 (0.0%) | 0 (0.0%) |
| 5 Years | 0 (0.0%) | 0 (0.0%) |
| 6 to 11 Years | 0 (0.0%) | 0 (0.0%) |
| 12 to 14 Years | 0 (0.0%) | 0 (0.0%) |
| 15 Years | 0 (0.0%) | 0 (0.0%) |
| 16 and 17 Years | 0 (0.0%) | 0 (0.0%) |
| 18 to 24 Years | 9 (100.0%) | 0 (0.0%) |
| 25 to 34 Years | 0 (0.0%) | 1 (20.0%) |
| 35 to 44 Years | 7 (87.5%) | 0 (0.0%) |
| 45 to 54 Years | 13 (68.4%) | 14 (60.9%) |
| 55 to 64 Years | 14 (63.6%) | 1 (9.1%) |
| 65 to 74 Years | 10 (100.0%) | 9 (100.0%) |
| 75 Years and over | 13 (100.0%) | 25 (100.0%) |
| Total | 66 (81.5%) | 50 (64.1%) |
Income Below Poverty Among Married-Couple Families in Reed
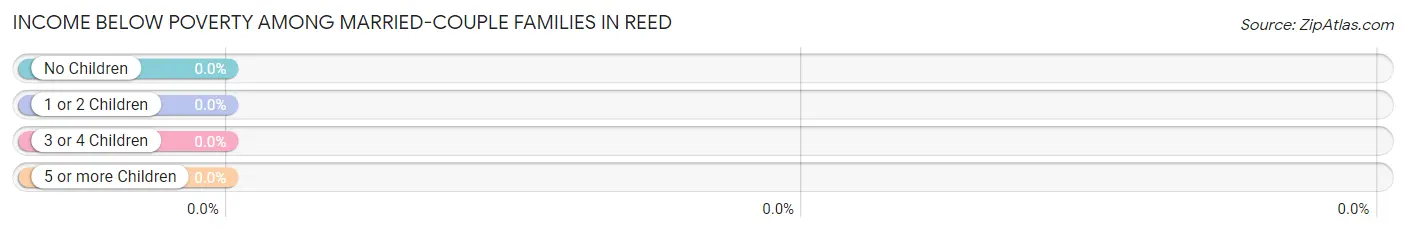
| Children | Above Poverty | Below Poverty |
| No Children | 31 (100.0%) | 0 (0.0%) |
| 1 or 2 Children | 0 (0.0%) | 0 (0.0%) |
| 3 or 4 Children | 0 (0.0%) | 0 (0.0%) |
| 5 or more Children | 0 (0.0%) | 0 (0.0%) |
| Total | 31 (100.0%) | 0 (0.0%) |
Income Below Poverty Among Single-Parent Households in Reed
According to the poverty data in Reed, 50.0% or 6 single-father households and 25.0% or 2 single-mother households are living below the poverty line. Among single-father households, those with no children have the highest poverty rate, with 6 households (50.0%) experiencing poverty. Likewise, among single-mother households, those with 1 or 2 children have the highest poverty rate, with 1 households (100.0%) falling below the poverty line.
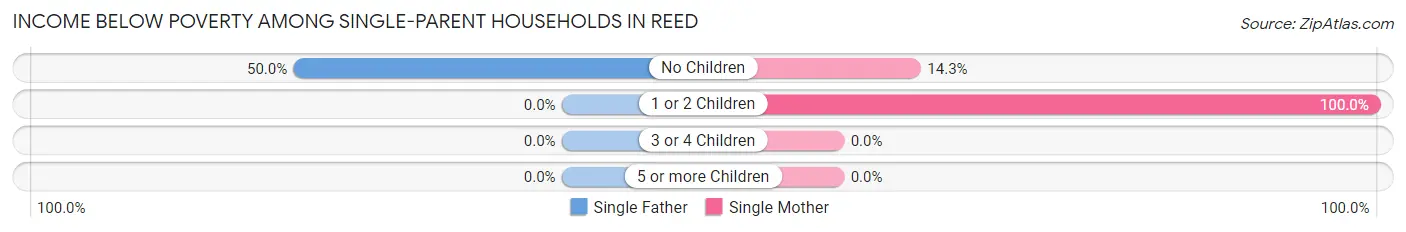
| Children | Single Father | Single Mother |
| No Children | 6 (50.0%) | 1 (14.3%) |
| 1 or 2 Children | 0 (0.0%) | 1 (100.0%) |
| 3 or 4 Children | 0 (0.0%) | 0 (0.0%) |
| 5 or more Children | 0 (0.0%) | 0 (0.0%) |
| Total | 6 (50.0%) | 2 (25.0%) |
Income Below Poverty Among Married-Couple vs Single-Parent Households in Reed
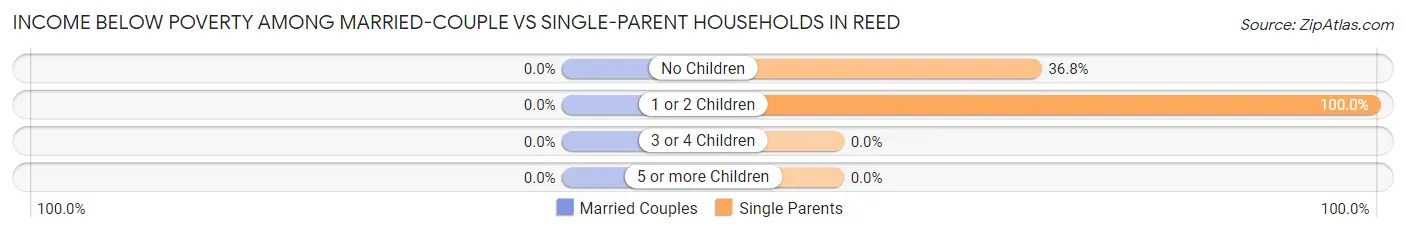
| Children | Married-Couple Families | Single-Parent Households |
| No Children | 0 (0.0%) | 7 (36.8%) |
| 1 or 2 Children | 0 (0.0%) | 1 (100.0%) |
| 3 or 4 Children | 0 (0.0%) | 0 (0.0%) |
| 5 or more Children | 0 (0.0%) | 0 (0.0%) |
| Total | 0 (0.0%) | 8 (40.0%) |
Race in Reed
The most populous races in Reed are Black / African American (157 | 98.7%), and Two or more Races (2 | 1.3%).
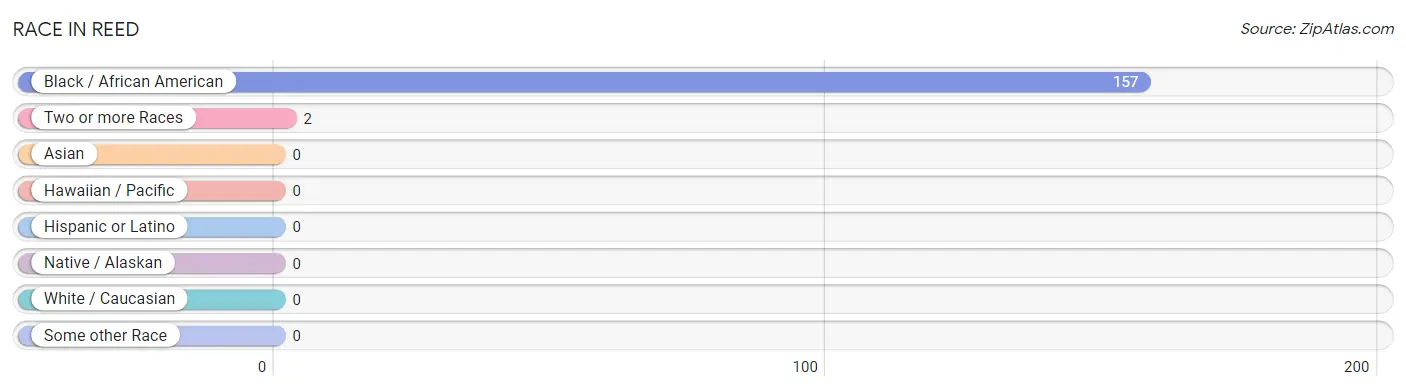
| Race | # Population | % Population |
| Asian | 0 | 0.0% |
| Black / African American | 157 | 98.7% |
| Hawaiian / Pacific | 0 | 0.0% |
| Hispanic or Latino | 0 | 0.0% |
| Native / Alaskan | 0 | 0.0% |
| White / Caucasian | 0 | 0.0% |
| Two or more Races | 2 | 1.3% |
| Some other Race | 0 | 0.0% |
| Total | 159 | 100.0% |
Ancestry in Reed
The most populous ancestries reported in Reed are African (7 | 4.4%), and Subsaharan African (7 | 4.4%), together accounting for 8.8% of all Reed residents.
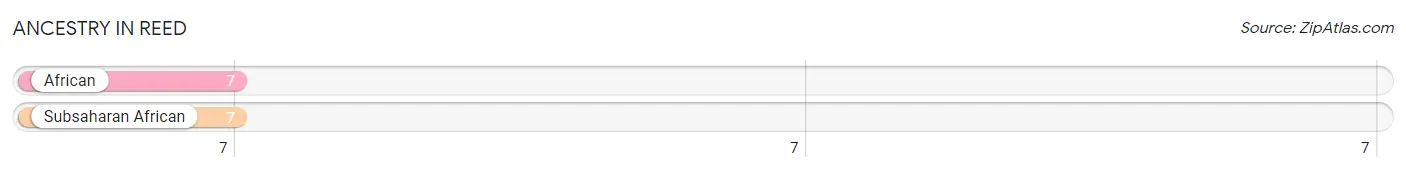
| Ancestry | # Population | % Population |
| African | 7 | 4.4% |
| Subsaharan African | 7 | 4.4% | View All 2 Rows |
Immigrants in Reed

| Immigration Origin | # Population | % Population | View All 0 Rows |
Sex and Age in Reed
Sex and Age in Reed
The most populous age groups in Reed are 55 to 59 Years (22 | 27.2%) for men and 75 to 79 Years (16 | 20.5%) for women.
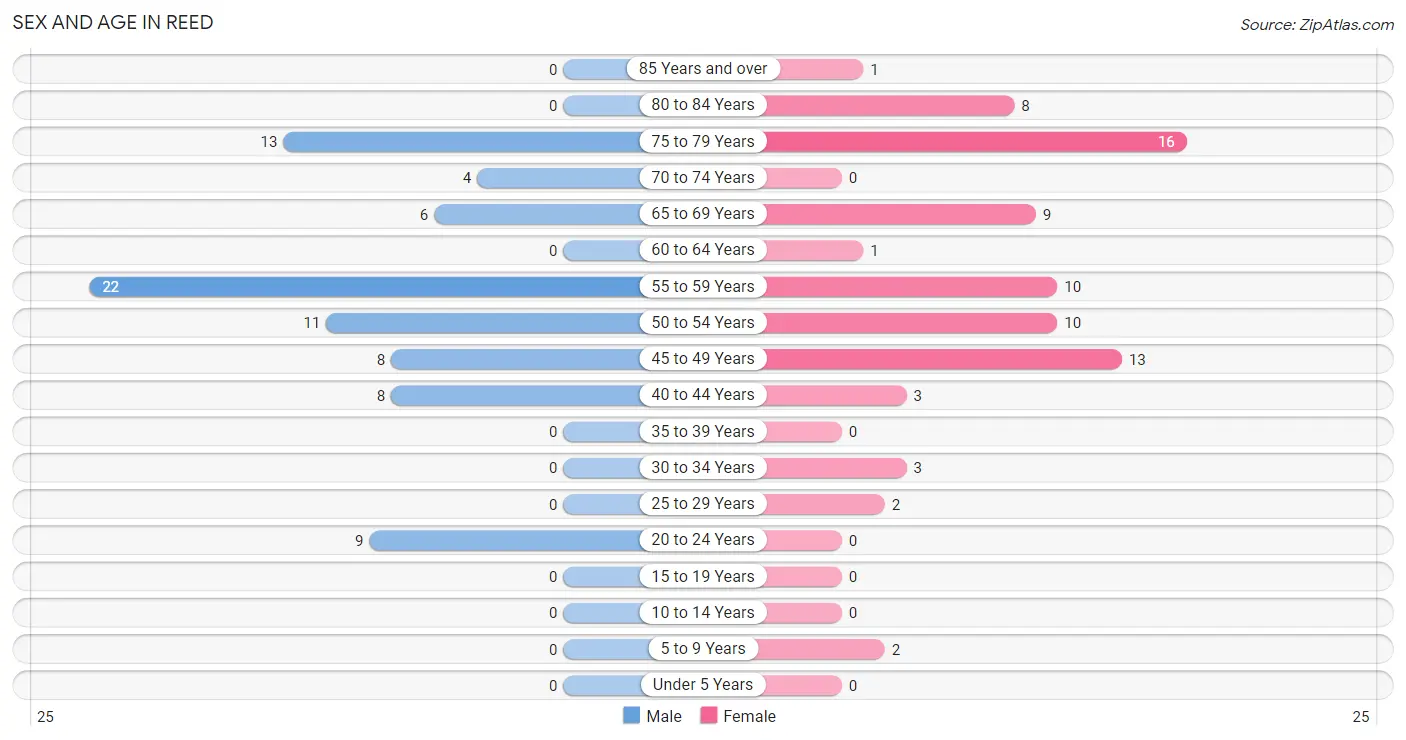
| Age Bracket | Male | Female |
| Under 5 Years | 0 (0.0%) | 0 (0.0%) |
| 5 to 9 Years | 0 (0.0%) | 2 (2.6%) |
| 10 to 14 Years | 0 (0.0%) | 0 (0.0%) |
| 15 to 19 Years | 0 (0.0%) | 0 (0.0%) |
| 20 to 24 Years | 9 (11.1%) | 0 (0.0%) |
| 25 to 29 Years | 0 (0.0%) | 2 (2.6%) |
| 30 to 34 Years | 0 (0.0%) | 3 (3.8%) |
| 35 to 39 Years | 0 (0.0%) | 0 (0.0%) |
| 40 to 44 Years | 8 (9.9%) | 3 (3.8%) |
| 45 to 49 Years | 8 (9.9%) | 13 (16.7%) |
| 50 to 54 Years | 11 (13.6%) | 10 (12.8%) |
| 55 to 59 Years | 22 (27.2%) | 10 (12.8%) |
| 60 to 64 Years | 0 (0.0%) | 1 (1.3%) |
| 65 to 69 Years | 6 (7.4%) | 9 (11.5%) |
| 70 to 74 Years | 4 (4.9%) | 0 (0.0%) |
| 75 to 79 Years | 13 (16.1%) | 16 (20.5%) |
| 80 to 84 Years | 0 (0.0%) | 8 (10.3%) |
| 85 Years and over | 0 (0.0%) | 1 (1.3%) |
| Total | 81 (100.0%) | 78 (100.0%) |
Families and Households in Reed
Median Family Size in Reed
The median family size in Reed is 2.10 persons per family, with single female/mother families (8 | 15.7%) accounting for the largest median family size of 3 persons per family. On the other hand, married-couple families (31 | 60.8%) represent the smallest median family size with 1.74 persons per family.
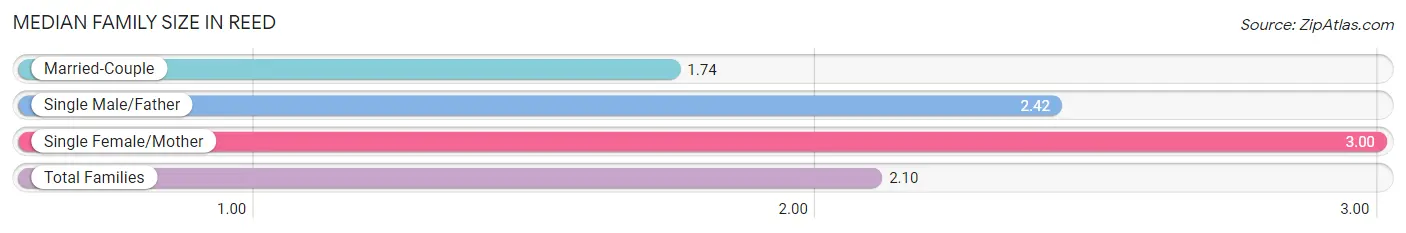
| Family Type | # Families | Family Size |
| Married-Couple | 31 (60.8%) | 1.74 |
| Single Male/Father | 12 (23.5%) | 2.42 |
| Single Female/Mother | 8 (15.7%) | 3.00 |
| Total Families | 51 (100.0%) | 2.10 |
Median Household Size in Reed
The median household size in Reed is 1.66 persons per household, with single female/mother households (8 | 8.3%) accounting for the largest median household size of 3 persons per household. non-family households (45 | 46.9%) represent the smallest median household size with 1.16 persons per household.
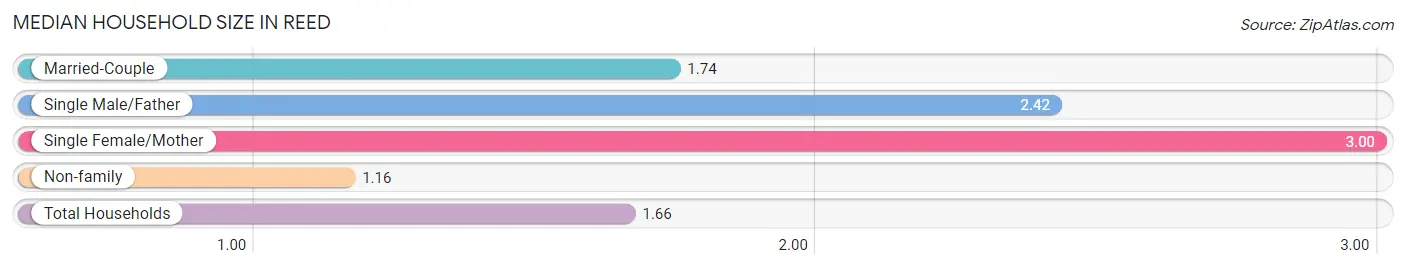
| Household Type | # Households | Household Size |
| Married-Couple | 31 (32.3%) | 1.74 |
| Single Male/Father | 12 (12.5%) | 2.42 |
| Single Female/Mother | 8 (8.3%) | 3.00 |
| Non-family | 45 (46.9%) | 1.16 |
| Total Households | 96 (100.0%) | 1.66 |
Household Size by Marriage Status in Reed
Out of a total of 96 households in Reed, 51 (53.1%) are family households, while 45 (46.9%) are nonfamily households. The most numerous type of family households are 2-person households, comprising 49, and the most common type of nonfamily households are 1-person households, comprising 39.
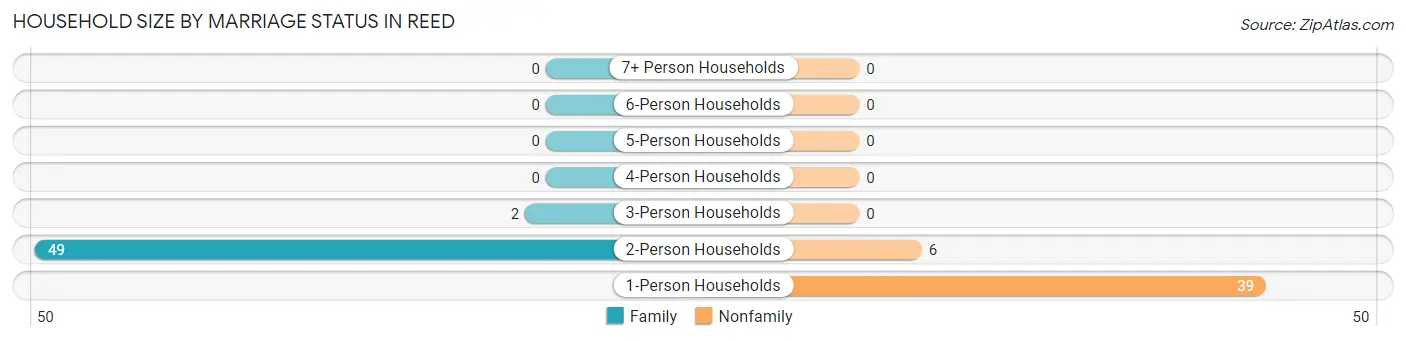
| Household Size | Family Households | Nonfamily Households |
| 1-Person Households | - | 39 (40.6%) |
| 2-Person Households | 49 (51.0%) | 6 (6.2%) |
| 3-Person Households | 2 (2.1%) | 0 (0.0%) |
| 4-Person Households | 0 (0.0%) | 0 (0.0%) |
| 5-Person Households | 0 (0.0%) | 0 (0.0%) |
| 6-Person Households | 0 (0.0%) | 0 (0.0%) |
| 7+ Person Households | 0 (0.0%) | 0 (0.0%) |
| Total | 51 (53.1%) | 45 (46.9%) |
Female Fertility in Reed
Fertility by Age in Reed
| Age Bracket | Women with Births | Births / 1,000 Women |
| 15 to 19 years | 0 (0.0%) | 0.0 |
| 20 to 34 years | 0 (0.0%) | 0.0 |
| 35 to 50 years | 0 (0.0%) | 0.0 |
| Total | 0 (0.0%) | 0.0 |
Fertility by Age by Marriage Status in Reed
| Age Bracket | Married | Unmarried |
| 15 to 19 years | 0 (0.0%) | 0 (0.0%) |
| 20 to 34 years | 0 (0.0%) | 0 (0.0%) |
| 35 to 50 years | 0 (0.0%) | 0 (0.0%) |
| Total | 0 (0.0%) | 0 (0.0%) |
Fertility by Education in Reed
| Educational Attainment | Women with Births | Births / 1,000 Women |
| Less than High School | 0 (0.0%) | 0.0 |
| High School Diploma | 0 (0.0%) | 0.0 |
| College or Associate's Degree | 0 (0.0%) | 0.0 |
| Bachelor's Degree | 0 (0.0%) | 0.0 |
| Graduate Degree | 0 (0.0%) | 0.0 |
| Total | 0 (0.0%) | 0.0 |
Fertility by Education by Marriage Status in Reed
| Educational Attainment | Married | Unmarried |
| Less than High School | 0 (0.0%) | 0 (0.0%) |
| High School Diploma | 0 (0.0%) | 0 (0.0%) |
| College or Associate's Degree | 0 (0.0%) | 0 (0.0%) |
| Bachelor's Degree | 0 (0.0%) | 0 (0.0%) |
| Graduate Degree | 0 (0.0%) | 0 (0.0%) |
| Total | 0 (0.0%) | 0 (0.0%) |
Employment Characteristics in Reed
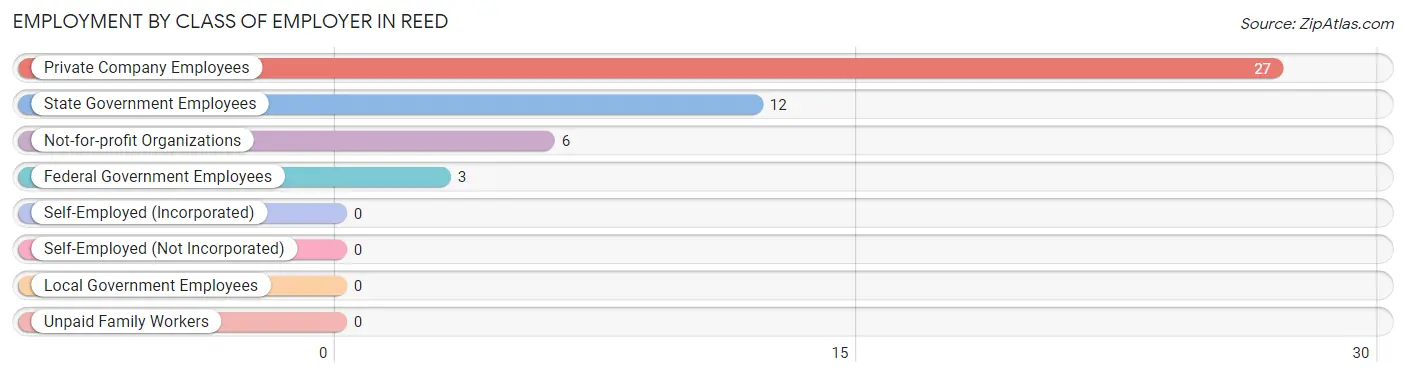
Employment by Class of Employer in Reed
Among the 48 employed individuals in Reed, private company employees (27 | 56.2%), state government employees (12 | 25.0%), and not-for-profit organizations (6 | 12.5%) make up the most common classes of employment.
| Employer Class | # Employees | % Employees |
| Private Company Employees | 27 | 56.2% |
| Self-Employed (Incorporated) | 0 | 0.0% |
| Self-Employed (Not Incorporated) | 0 | 0.0% |
| Not-for-profit Organizations | 6 | 12.5% |
| Local Government Employees | 0 | 0.0% |
| State Government Employees | 12 | 25.0% |
| Federal Government Employees | 3 | 6.2% |
| Unpaid Family Workers | 0 | 0.0% |
| Total | 48 | 100.0% |
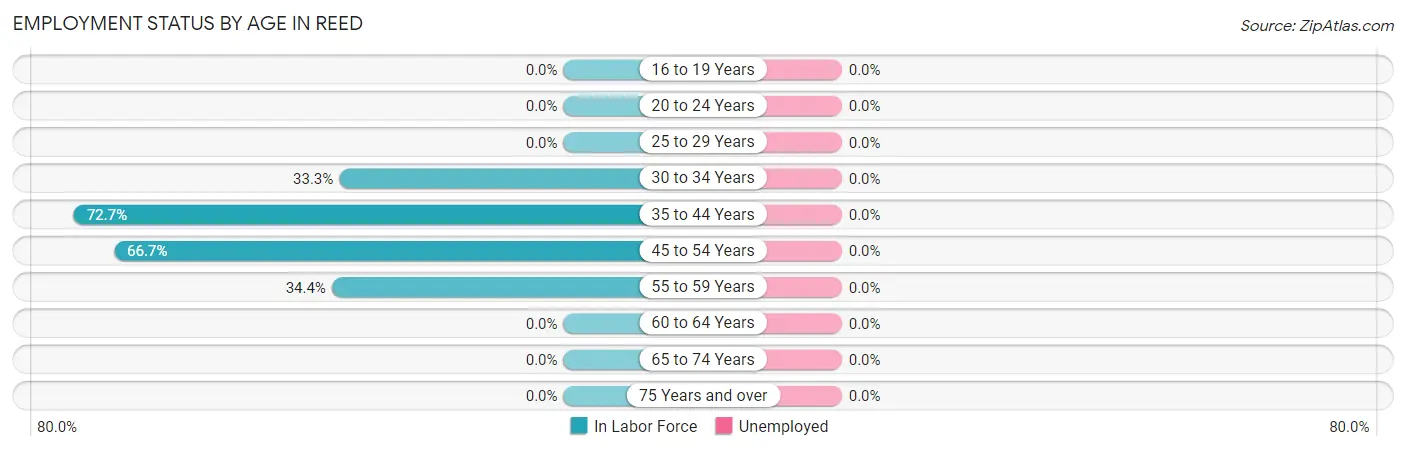
Employment Status by Age in Reed
| Age Bracket | In Labor Force | Unemployed |
| 16 to 19 Years | 0 (0.0%) | 0 (0.0%) |
| 20 to 24 Years | 0 (0.0%) | 0 (0.0%) |
| 25 to 29 Years | 0 (0.0%) | 0 (0.0%) |
| 30 to 34 Years | 1 (33.3%) | 0 (0.0%) |
| 35 to 44 Years | 8 (72.7%) | 0 (0.0%) |
| 45 to 54 Years | 28 (66.7%) | 0 (0.0%) |
| 55 to 59 Years | 11 (34.4%) | 0 (0.0%) |
| 60 to 64 Years | 0 (0.0%) | 0 (0.0%) |
| 65 to 74 Years | 0 (0.0%) | 0 (0.0%) |
| 75 Years and over | 0 (0.0%) | 0 (0.0%) |
| Total | 48 (30.6%) | 0 (0.0%) |
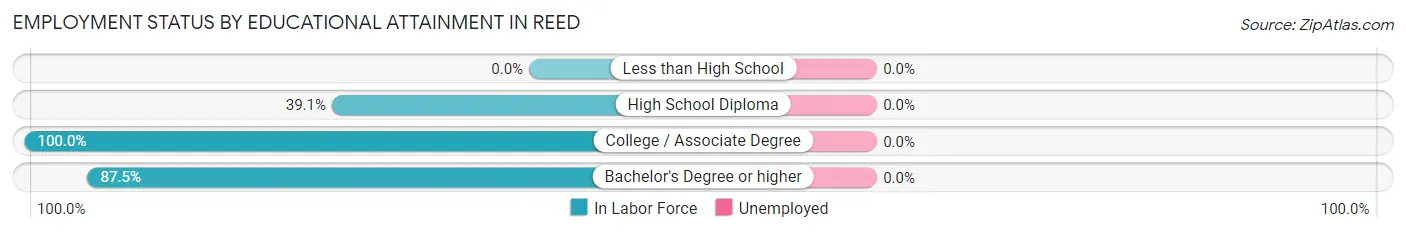
Employment Status by Educational Attainment in Reed
| Educational Attainment | In Labor Force | Unemployed |
| Less than High School | 0 (0.0%) | 0 (0.0%) |
| High School Diploma | 25 (39.1%) | 0 (0.0%) |
| College / Associate Degree | 16 (100.0%) | 0 (0.0%) |
| Bachelor's Degree or higher | 7 (87.5%) | 0 (0.0%) |
| Total | 48 (52.7%) | 0 (0.0%) |
Employment Occupations by Sex in Reed
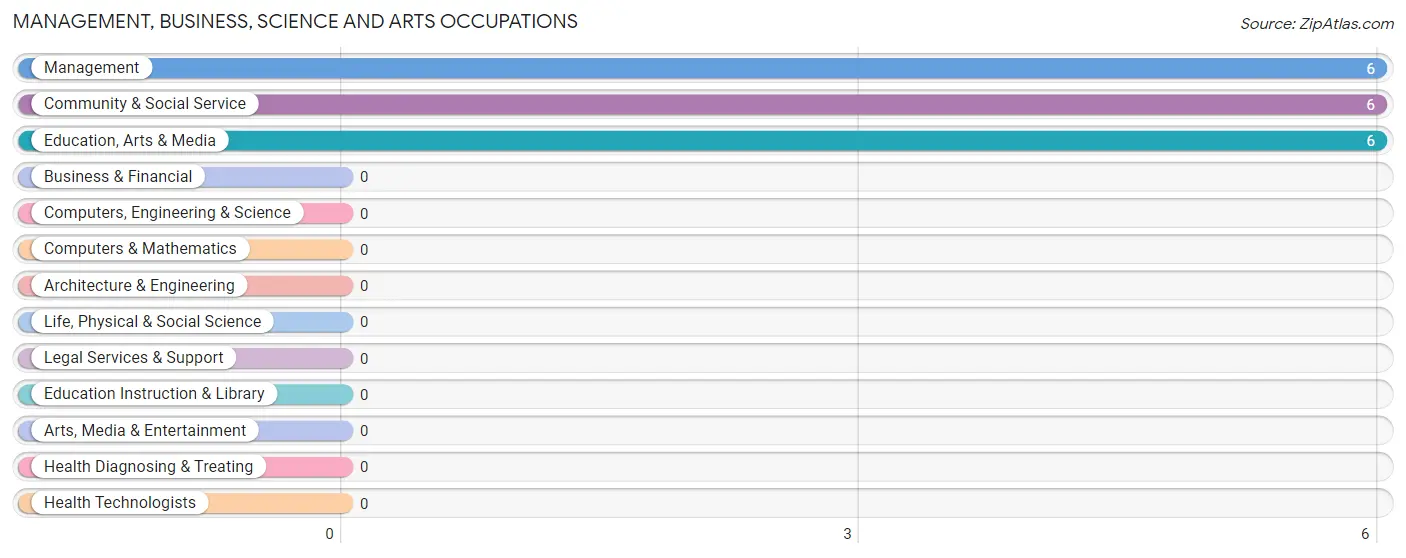
Management, Business, Science and Arts Occupations
The most common Management, Business, Science and Arts occupations in Reed are Management (6 | 12.5%), Community & Social Service (6 | 12.5%), and Education, Arts & Media (6 | 12.5%).
Management, Business, Science and Arts Occupations by Sex
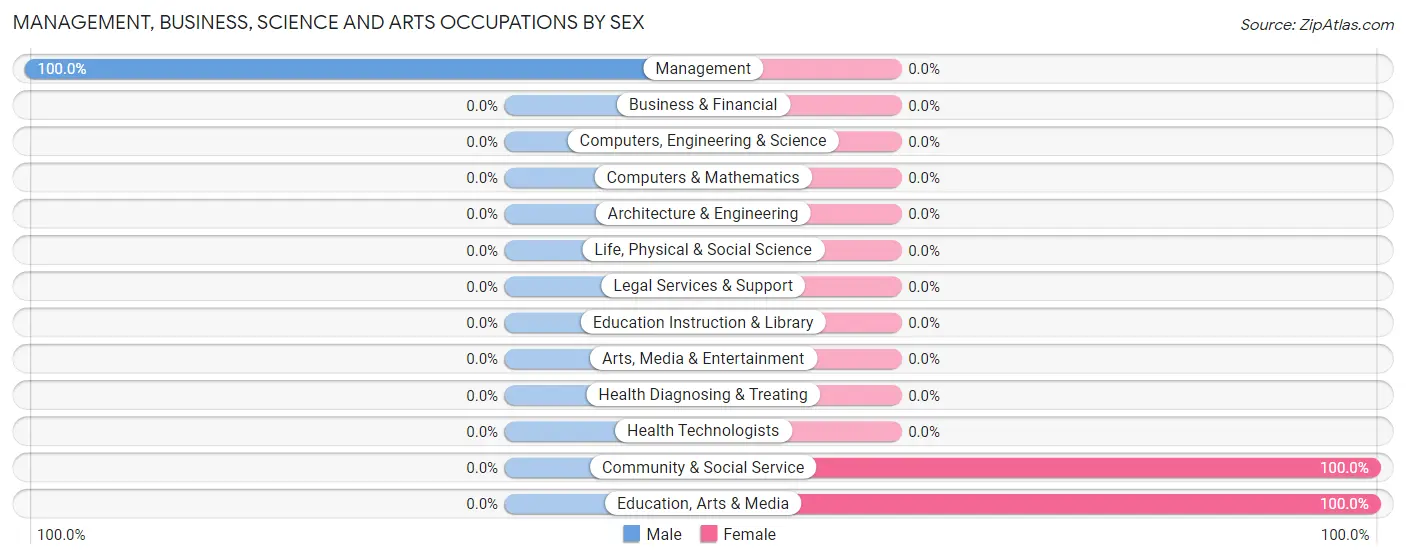
| Occupation | Male | Female |
| Management | 6 (100.0%) | 0 (0.0%) |
| Business & Financial | 0 (0.0%) | 0 (0.0%) |
| Computers, Engineering & Science | 0 (0.0%) | 0 (0.0%) |
| Computers & Mathematics | 0 (0.0%) | 0 (0.0%) |
| Architecture & Engineering | 0 (0.0%) | 0 (0.0%) |
| Life, Physical & Social Science | 0 (0.0%) | 0 (0.0%) |
| Community & Social Service | 0 (0.0%) | 6 (100.0%) |
| Education, Arts & Media | 0 (0.0%) | 6 (100.0%) |
| Legal Services & Support | 0 (0.0%) | 0 (0.0%) |
| Education Instruction & Library | 0 (0.0%) | 0 (0.0%) |
| Arts, Media & Entertainment | 0 (0.0%) | 0 (0.0%) |
| Health Diagnosing & Treating | 0 (0.0%) | 0 (0.0%) |
| Health Technologists | 0 (0.0%) | 0 (0.0%) |
| Total (Category) | 6 (50.0%) | 6 (50.0%) |
| Total (Overall) | 29 (60.4%) | 19 (39.6%) |
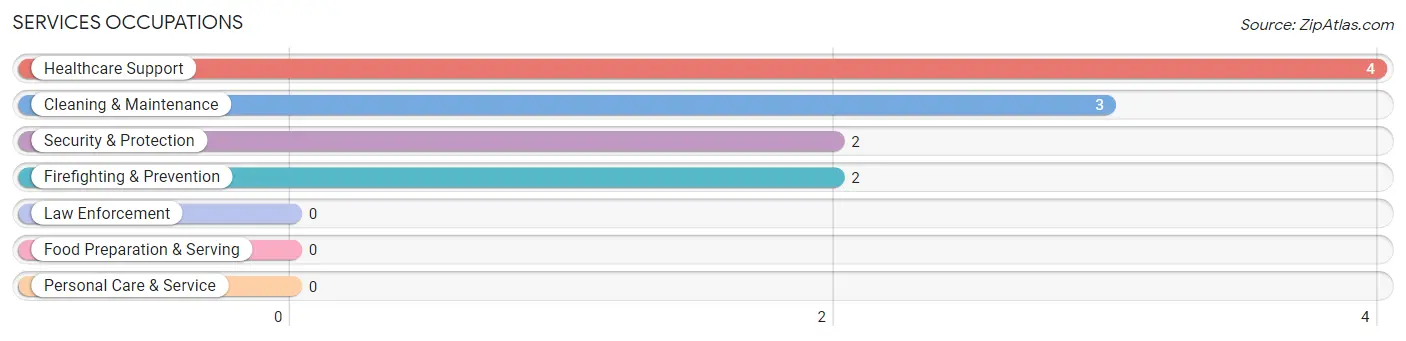
Services Occupations
The most common Services occupations in Reed are Healthcare Support (4 | 8.3%), Cleaning & Maintenance (3 | 6.2%), Security & Protection (2 | 4.2%), and Firefighting & Prevention (2 | 4.2%).
Services Occupations by Sex
Within the Services occupations in Reed, the most male-oriented occupations are Security & Protection (100.0%), and Firefighting & Prevention (100.0%), while the most female-oriented occupations are Healthcare Support (100.0%), and Cleaning & Maintenance (100.0%).
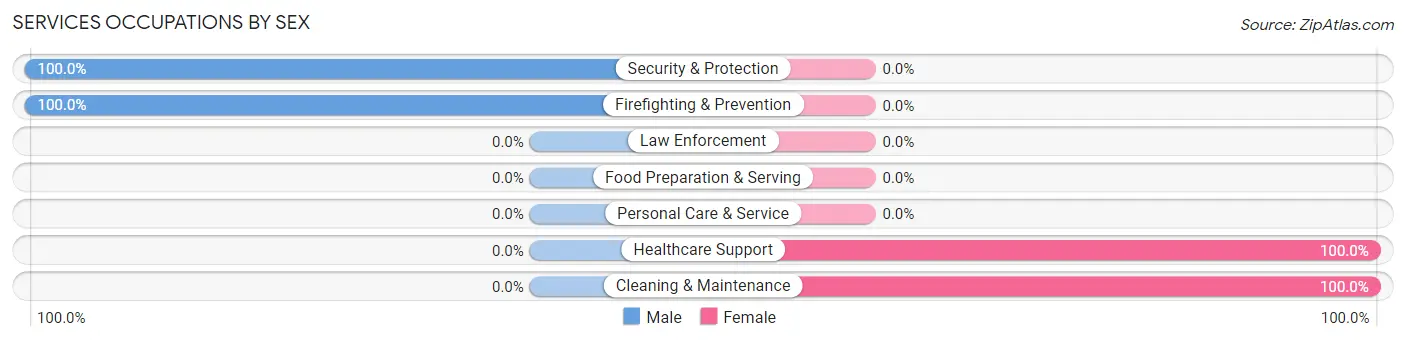
| Occupation | Male | Female |
| Healthcare Support | 0 (0.0%) | 4 (100.0%) |
| Security & Protection | 2 (100.0%) | 0 (0.0%) |
| Firefighting & Prevention | 2 (100.0%) | 0 (0.0%) |
| Law Enforcement | 0 (0.0%) | 0 (0.0%) |
| Food Preparation & Serving | 0 (0.0%) | 0 (0.0%) |
| Cleaning & Maintenance | 0 (0.0%) | 3 (100.0%) |
| Personal Care & Service | 0 (0.0%) | 0 (0.0%) |
| Total (Category) | 2 (22.2%) | 7 (77.8%) |
| Total (Overall) | 29 (60.4%) | 19 (39.6%) |
Sales and Office Occupations
The most common Sales and Office occupations in Reed are Sales & Related (8 | 16.7%), and Office & Administration (6 | 12.5%).
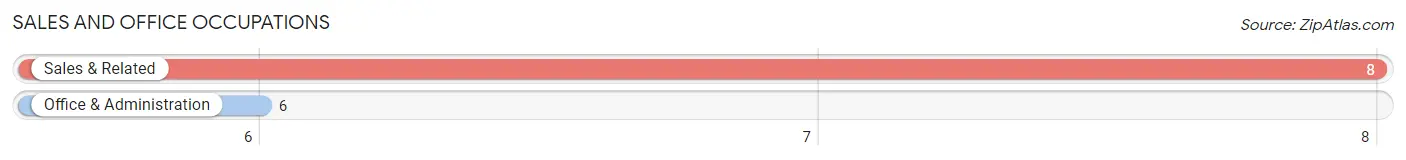
Sales and Office Occupations by Sex
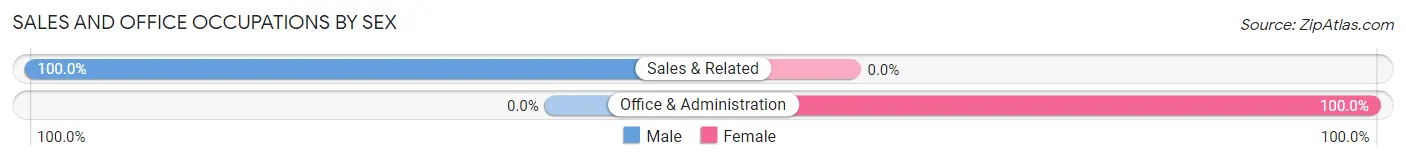
| Occupation | Male | Female |
| Sales & Related | 8 (100.0%) | 0 (0.0%) |
| Office & Administration | 0 (0.0%) | 6 (100.0%) |
| Total (Category) | 8 (57.1%) | 6 (42.9%) |
| Total (Overall) | 29 (60.4%) | 19 (39.6%) |
Natural Resources, Construction and Maintenance Occupations
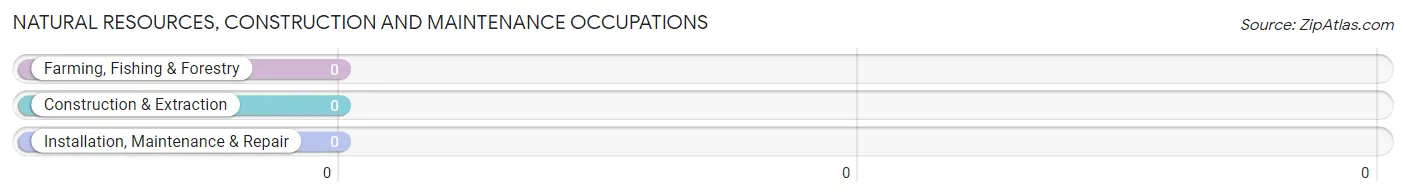
Natural Resources, Construction and Maintenance Occupations by Sex
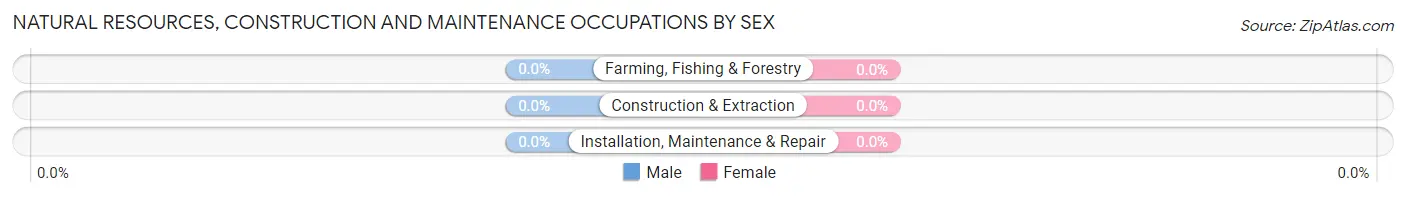
| Occupation | Male | Female |
| Farming, Fishing & Forestry | 0 (0.0%) | 0 (0.0%) |
| Construction & Extraction | 0 (0.0%) | 0 (0.0%) |
| Installation, Maintenance & Repair | 0 (0.0%) | 0 (0.0%) |
| Total (Category) | 0 (0.0%) | 0 (0.0%) |
| Total (Overall) | 29 (60.4%) | 19 (39.6%) |
Production, Transportation and Moving Occupations
The most common Production, Transportation and Moving occupations in Reed are , and Production (13 | 27.1%).
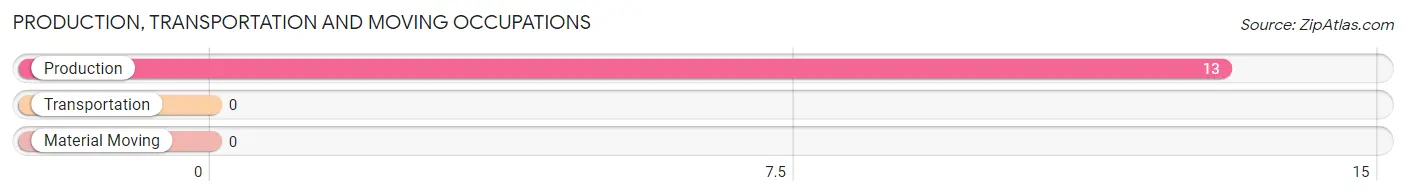
Production, Transportation and Moving Occupations by Sex
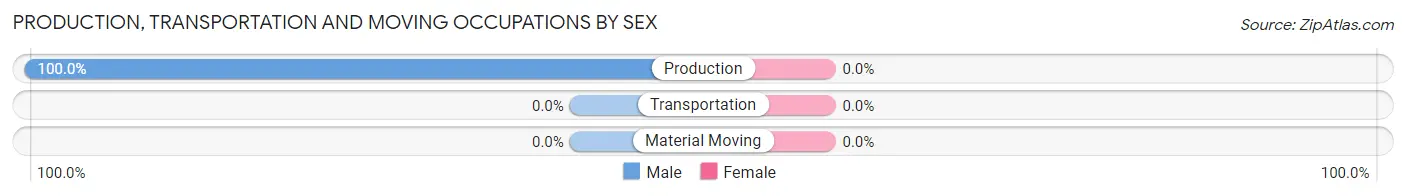
| Occupation | Male | Female |
| Production | 13 (100.0%) | 0 (0.0%) |
| Transportation | 0 (0.0%) | 0 (0.0%) |
| Material Moving | 0 (0.0%) | 0 (0.0%) |
| Total (Category) | 13 (100.0%) | 0 (0.0%) |
| Total (Overall) | 29 (60.4%) | 19 (39.6%) |
Employment Industries by Sex in Reed
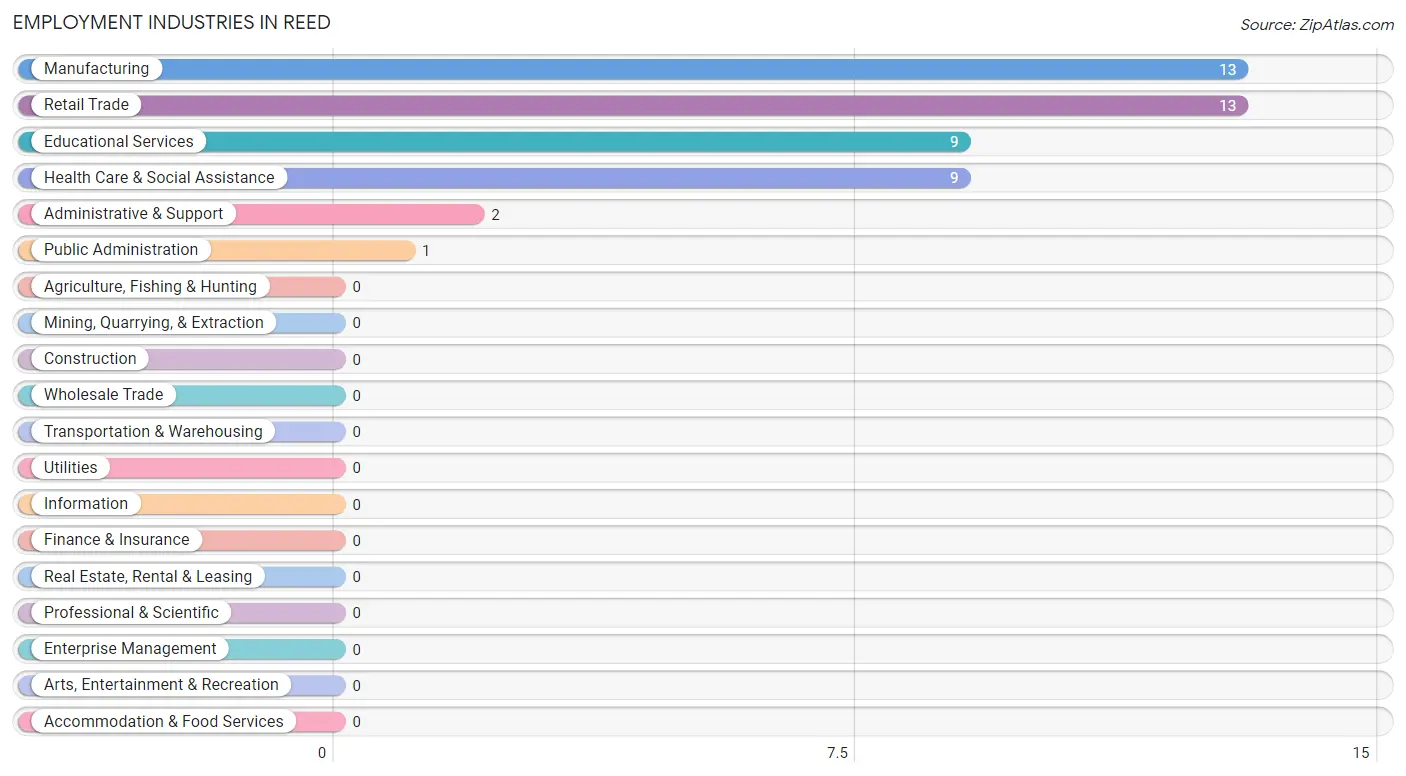
Employment Industries in Reed
The major employment industries in Reed include Manufacturing (13 | 27.1%), Retail Trade (13 | 27.1%), Educational Services (9 | 18.8%), Health Care & Social Assistance (9 | 18.8%), and Administrative & Support (2 | 4.2%).
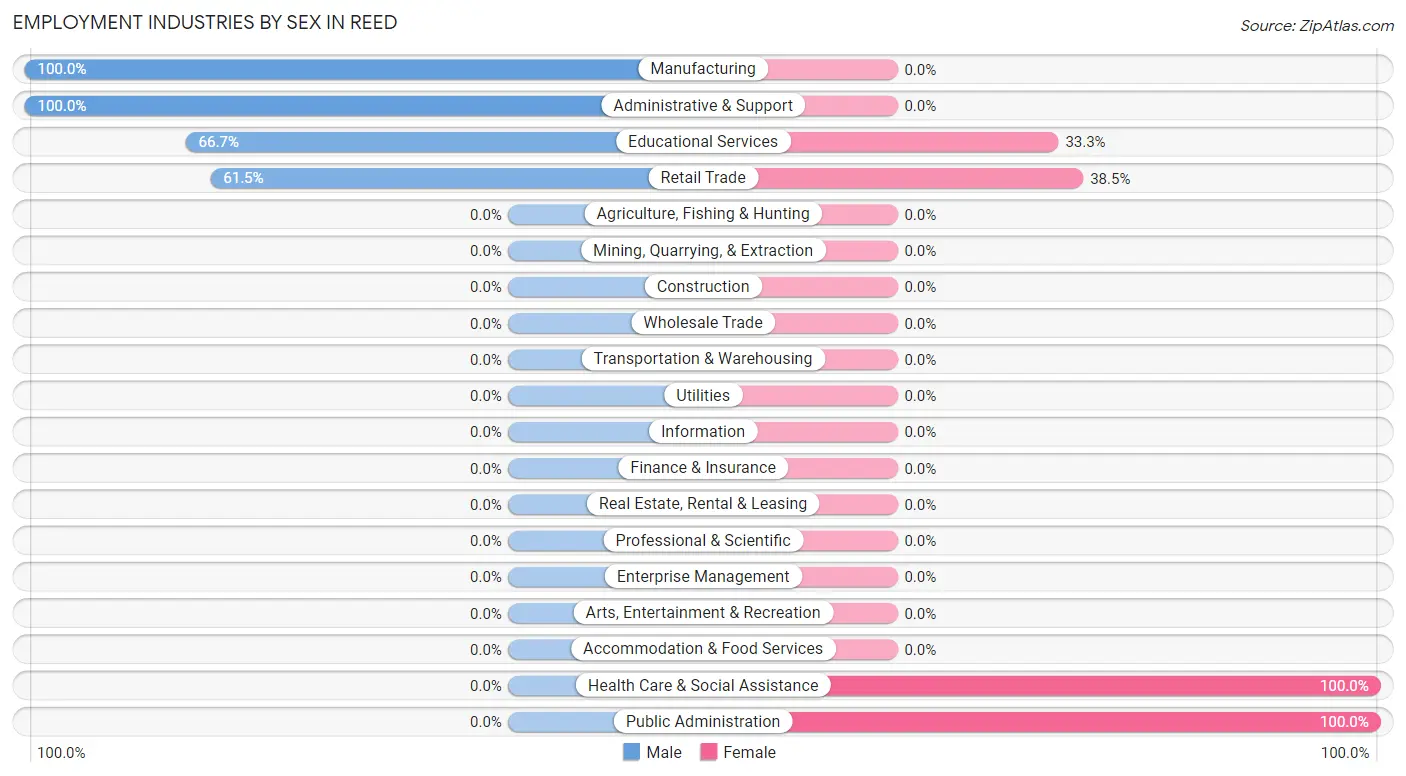
Employment Industries by Sex in Reed
The Reed industries that see more men than women are Manufacturing (100.0%), Administrative & Support (100.0%), and Educational Services (66.7%), whereas the industries that tend to have a higher number of women are Health Care & Social Assistance (100.0%), Public Administration (100.0%), and Retail Trade (38.5%).
| Industry | Male | Female |
| Agriculture, Fishing & Hunting | 0 (0.0%) | 0 (0.0%) |
| Mining, Quarrying, & Extraction | 0 (0.0%) | 0 (0.0%) |
| Construction | 0 (0.0%) | 0 (0.0%) |
| Manufacturing | 13 (100.0%) | 0 (0.0%) |
| Wholesale Trade | 0 (0.0%) | 0 (0.0%) |
| Retail Trade | 8 (61.5%) | 5 (38.5%) |
| Transportation & Warehousing | 0 (0.0%) | 0 (0.0%) |
| Utilities | 0 (0.0%) | 0 (0.0%) |
| Information | 0 (0.0%) | 0 (0.0%) |
| Finance & Insurance | 0 (0.0%) | 0 (0.0%) |
| Real Estate, Rental & Leasing | 0 (0.0%) | 0 (0.0%) |
| Professional & Scientific | 0 (0.0%) | 0 (0.0%) |
| Enterprise Management | 0 (0.0%) | 0 (0.0%) |
| Administrative & Support | 2 (100.0%) | 0 (0.0%) |
| Educational Services | 6 (66.7%) | 3 (33.3%) |
| Health Care & Social Assistance | 0 (0.0%) | 9 (100.0%) |
| Arts, Entertainment & Recreation | 0 (0.0%) | 0 (0.0%) |
| Accommodation & Food Services | 0 (0.0%) | 0 (0.0%) |
| Public Administration | 0 (0.0%) | 1 (100.0%) |
| Total | 29 (60.4%) | 19 (39.6%) |
Education in Reed
School Enrollment in Reed
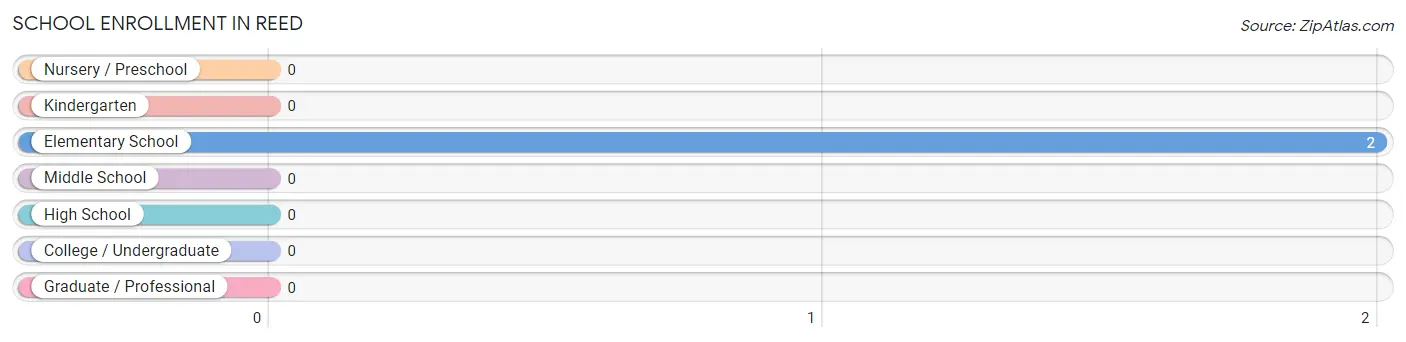
| School Level | # Students | % Students |
| Nursery / Preschool | 0 | 0.0% |
| Kindergarten | 0 | 0.0% |
| Elementary School | 2 | 100.0% |
| Middle School | 0 | 0.0% |
| High School | 0 | 0.0% |
| College / Undergraduate | 0 | 0.0% |
| Graduate / Professional | 0 | 0.0% |
| Total | 2 | 100.0% |
School Enrollment by Age by Funding Source in Reed
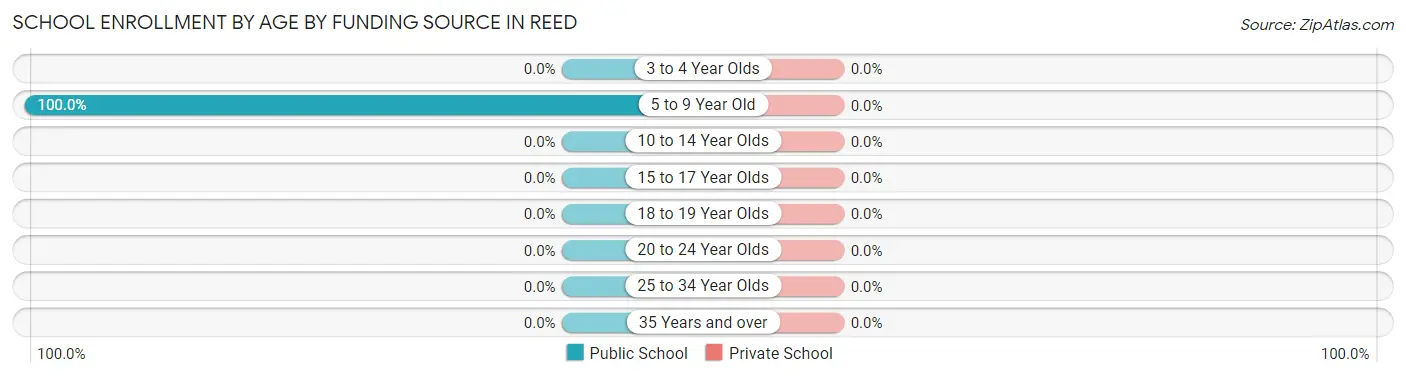
| Age Bracket | Public School | Private School |
| 3 to 4 Year Olds | 0 (0.0%) | 0 (0.0%) |
| 5 to 9 Year Old | 2 (100.0%) | 0 (0.0%) |
| 10 to 14 Year Olds | 0 (0.0%) | 0 (0.0%) |
| 15 to 17 Year Olds | 0 (0.0%) | 0 (0.0%) |
| 18 to 19 Year Olds | 0 (0.0%) | 0 (0.0%) |
| 20 to 24 Year Olds | 0 (0.0%) | 0 (0.0%) |
| 25 to 34 Year Olds | 0 (0.0%) | 0 (0.0%) |
| 35 Years and over | 0 (0.0%) | 0 (0.0%) |
| Total | 2 (100.0%) | 0 (0.0%) |
Educational Attainment by Field of Study in Reed
Science & technology (6 | 75.0%), business (1 | 12.5%), and education (1 | 12.5%) are the most common fields of study among 8 individuals in Reed who have obtained a bachelor's degree or higher.
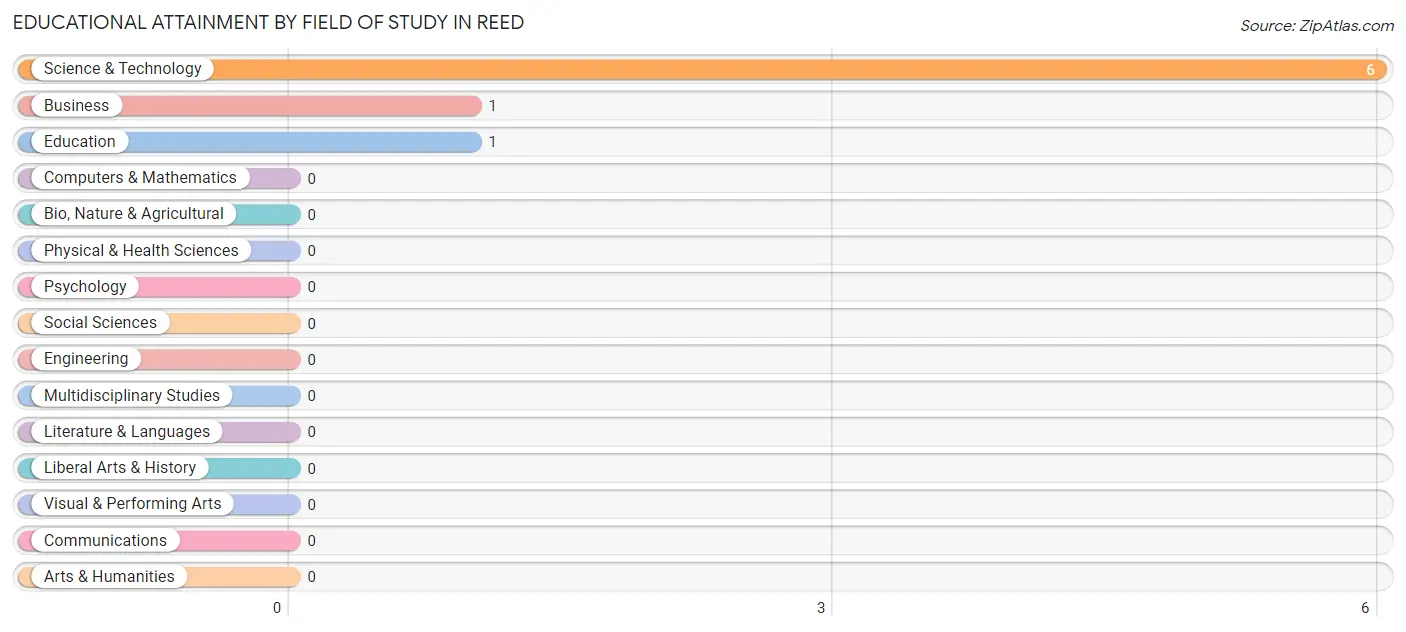
| Field of Study | # Graduates | % Graduates |
| Computers & Mathematics | 0 | 0.0% |
| Bio, Nature & Agricultural | 0 | 0.0% |
| Physical & Health Sciences | 0 | 0.0% |
| Psychology | 0 | 0.0% |
| Social Sciences | 0 | 0.0% |
| Engineering | 0 | 0.0% |
| Multidisciplinary Studies | 0 | 0.0% |
| Science & Technology | 6 | 75.0% |
| Business | 1 | 12.5% |
| Education | 1 | 12.5% |
| Literature & Languages | 0 | 0.0% |
| Liberal Arts & History | 0 | 0.0% |
| Visual & Performing Arts | 0 | 0.0% |
| Communications | 0 | 0.0% |
| Arts & Humanities | 0 | 0.0% |
| Total | 8 | 100.0% |
Transportation & Commute in Reed
Vehicle Availability by Sex in Reed
The most prevalent vehicle ownership categories in Reed are males with 2 vehicles (19, accounting for 65.5%) and females with 2 vehicles (9, making up 100.0%).
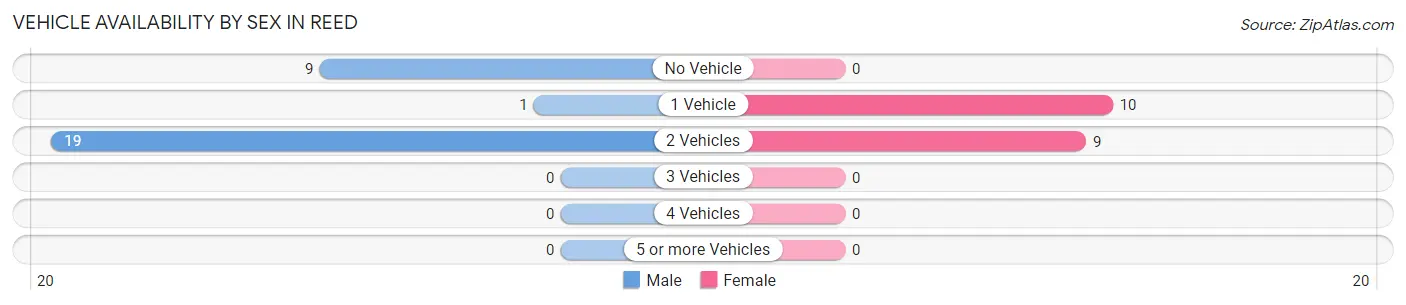
| Vehicles Available | Male | Female |
| No Vehicle | 9 (31.0%) | 0 (0.0%) |
| 1 Vehicle | 1 (3.5%) | 10 (52.6%) |
| 2 Vehicles | 19 (65.5%) | 9 (47.4%) |
| 3 Vehicles | 0 (0.0%) | 0 (0.0%) |
| 4 Vehicles | 0 (0.0%) | 0 (0.0%) |
| 5 or more Vehicles | 0 (0.0%) | 0 (0.0%) |
| Total | 29 (100.0%) | 19 (100.0%) |
Commute Time in Reed
The most frequently occuring commute durations in Reed are 10 to 14 minutes (16 commuters, 33.3%), 15 to 19 minutes (7 commuters, 14.6%), and 20 to 24 minutes (7 commuters, 14.6%).
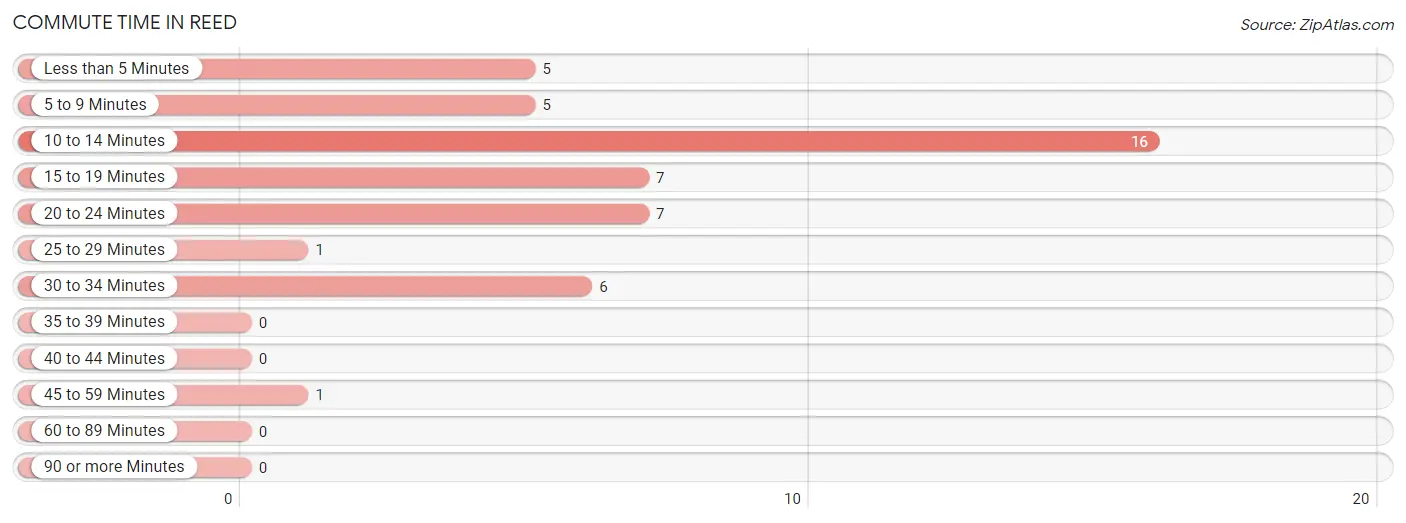
| Commute Time | # Commuters | % Commuters |
| Less than 5 Minutes | 5 | 10.4% |
| 5 to 9 Minutes | 5 | 10.4% |
| 10 to 14 Minutes | 16 | 33.3% |
| 15 to 19 Minutes | 7 | 14.6% |
| 20 to 24 Minutes | 7 | 14.6% |
| 25 to 29 Minutes | 1 | 2.1% |
| 30 to 34 Minutes | 6 | 12.5% |
| 35 to 39 Minutes | 0 | 0.0% |
| 40 to 44 Minutes | 0 | 0.0% |
| 45 to 59 Minutes | 1 | 2.1% |
| 60 to 89 Minutes | 0 | 0.0% |
| 90 or more Minutes | 0 | 0.0% |
Commute Time by Sex in Reed
The most common commute times in Reed are 10 to 14 minutes (8 commuters, 27.6%) for males and 10 to 14 minutes (8 commuters, 42.1%) for females.
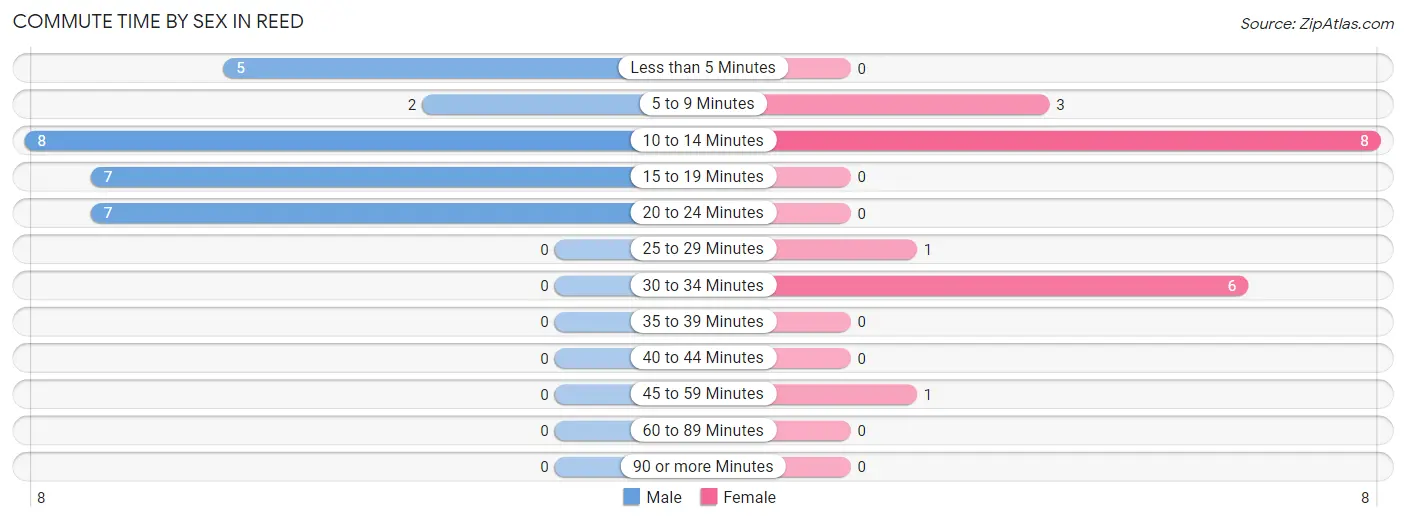
| Commute Time | Male | Female |
| Less than 5 Minutes | 5 (17.2%) | 0 (0.0%) |
| 5 to 9 Minutes | 2 (6.9%) | 3 (15.8%) |
| 10 to 14 Minutes | 8 (27.6%) | 8 (42.1%) |
| 15 to 19 Minutes | 7 (24.1%) | 0 (0.0%) |
| 20 to 24 Minutes | 7 (24.1%) | 0 (0.0%) |
| 25 to 29 Minutes | 0 (0.0%) | 1 (5.3%) |
| 30 to 34 Minutes | 0 (0.0%) | 6 (31.6%) |
| 35 to 39 Minutes | 0 (0.0%) | 0 (0.0%) |
| 40 to 44 Minutes | 0 (0.0%) | 0 (0.0%) |
| 45 to 59 Minutes | 0 (0.0%) | 1 (5.3%) |
| 60 to 89 Minutes | 0 (0.0%) | 0 (0.0%) |
| 90 or more Minutes | 0 (0.0%) | 0 (0.0%) |
Time of Departure to Work by Sex in Reed
The most frequent times of departure to work in Reed are 9:00 AM to 9:59 AM (8, 27.6%) for males and 6:30 AM to 6:59 AM (6, 31.6%) for females.
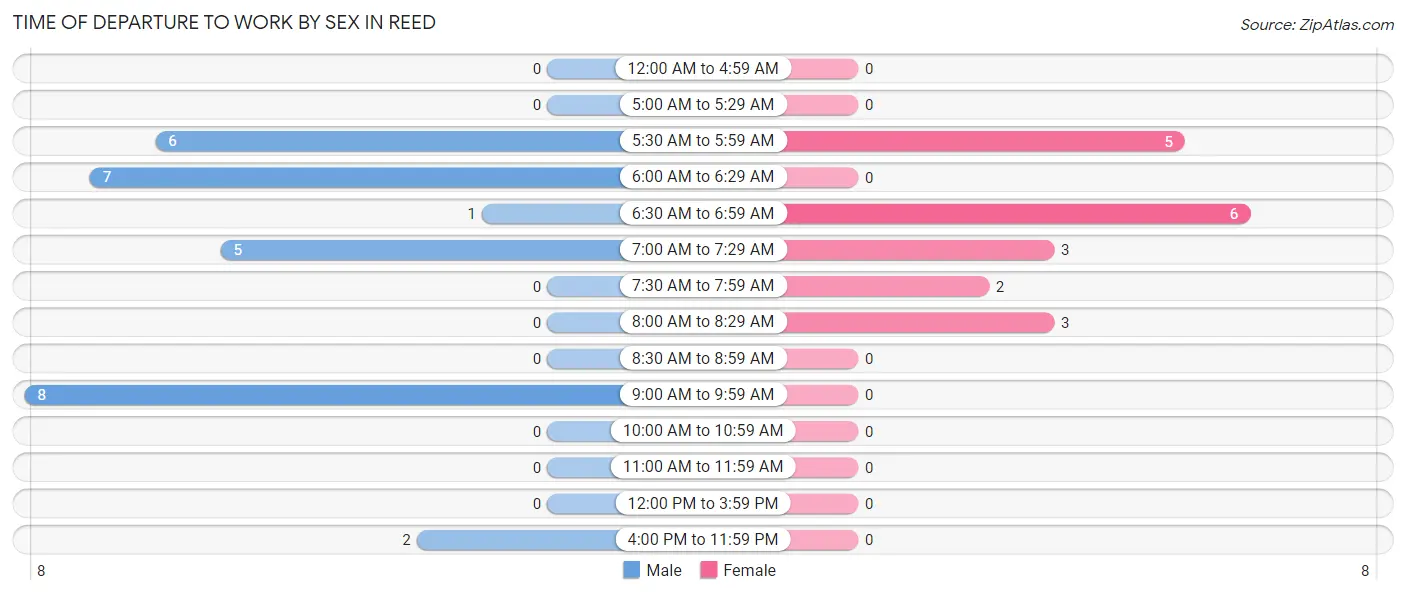
| Time of Departure | Male | Female |
| 12:00 AM to 4:59 AM | 0 (0.0%) | 0 (0.0%) |
| 5:00 AM to 5:29 AM | 0 (0.0%) | 0 (0.0%) |
| 5:30 AM to 5:59 AM | 6 (20.7%) | 5 (26.3%) |
| 6:00 AM to 6:29 AM | 7 (24.1%) | 0 (0.0%) |
| 6:30 AM to 6:59 AM | 1 (3.5%) | 6 (31.6%) |
| 7:00 AM to 7:29 AM | 5 (17.2%) | 3 (15.8%) |
| 7:30 AM to 7:59 AM | 0 (0.0%) | 2 (10.5%) |
| 8:00 AM to 8:29 AM | 0 (0.0%) | 3 (15.8%) |
| 8:30 AM to 8:59 AM | 0 (0.0%) | 0 (0.0%) |
| 9:00 AM to 9:59 AM | 8 (27.6%) | 0 (0.0%) |
| 10:00 AM to 10:59 AM | 0 (0.0%) | 0 (0.0%) |
| 11:00 AM to 11:59 AM | 0 (0.0%) | 0 (0.0%) |
| 12:00 PM to 3:59 PM | 0 (0.0%) | 0 (0.0%) |
| 4:00 PM to 11:59 PM | 2 (6.9%) | 0 (0.0%) |
| Total | 29 (100.0%) | 19 (100.0%) |
Housing Occupancy in Reed
Occupancy by Ownership in Reed
Of the total 96 dwellings in Reed, owner-occupied units account for 65 (67.7%), while renter-occupied units make up 31 (32.3%).
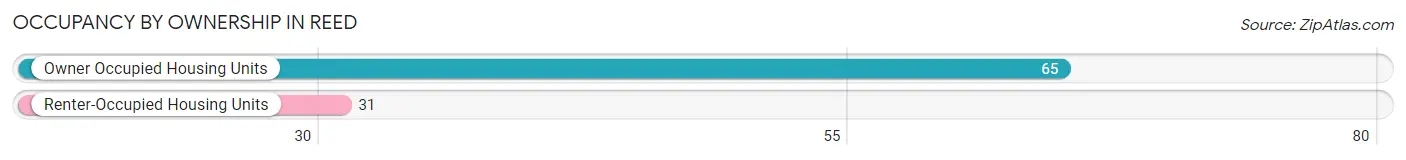
| Occupancy | # Housing Units | % Housing Units |
| Owner Occupied Housing Units | 65 | 67.7% |
| Renter-Occupied Housing Units | 31 | 32.3% |
| Total Occupied Housing Units | 96 | 100.0% |
Occupancy by Household Size in Reed
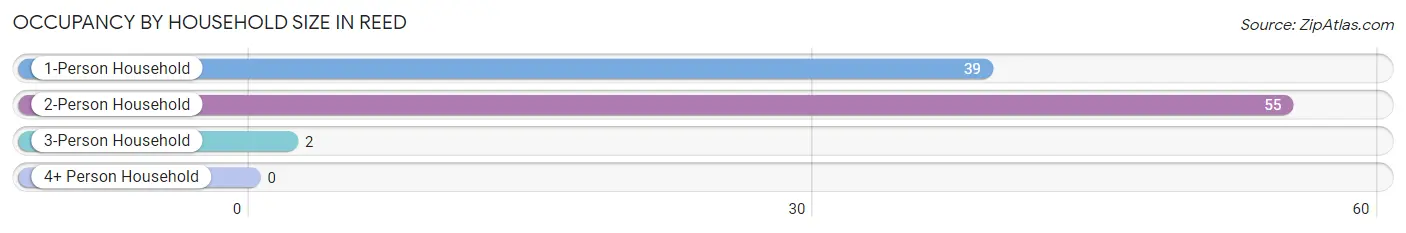
| Household Size | # Housing Units | % Housing Units |
| 1-Person Household | 39 | 40.6% |
| 2-Person Household | 55 | 57.3% |
| 3-Person Household | 2 | 2.1% |
| 4+ Person Household | 0 | 0.0% |
| Total Housing Units | 96 | 100.0% |
Occupancy by Ownership by Household Size in Reed
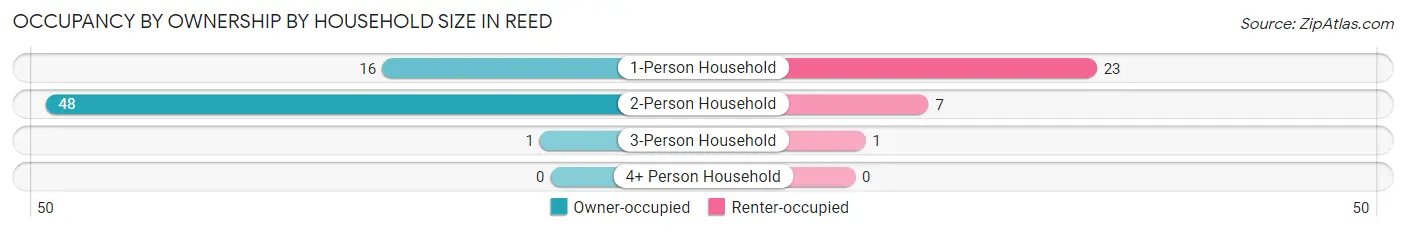
| Household Size | Owner-occupied | Renter-occupied |
| 1-Person Household | 16 (41.0%) | 23 (59.0%) |
| 2-Person Household | 48 (87.3%) | 7 (12.7%) |
| 3-Person Household | 1 (50.0%) | 1 (50.0%) |
| 4+ Person Household | 0 (0.0%) | 0 (0.0%) |
| Total Housing Units | 65 (67.7%) | 31 (32.3%) |
Occupancy by Educational Attainment in Reed
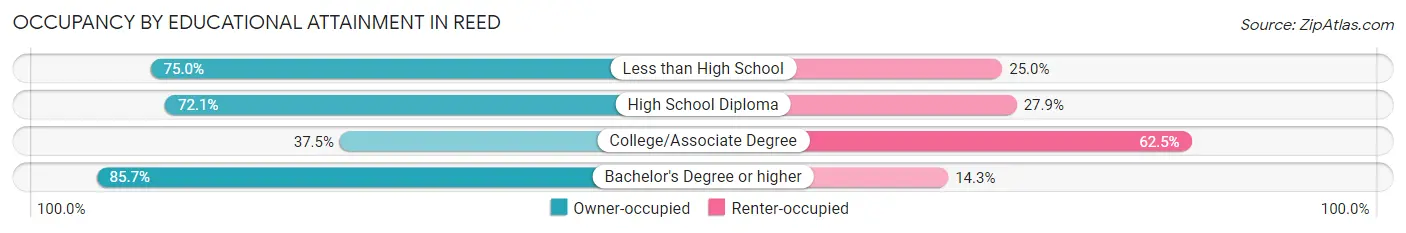
| Household Size | Owner-occupied | Renter-occupied |
| Less than High School | 9 (75.0%) | 3 (25.0%) |
| High School Diploma | 44 (72.1%) | 17 (27.9%) |
| College/Associate Degree | 6 (37.5%) | 10 (62.5%) |
| Bachelor's Degree or higher | 6 (85.7%) | 1 (14.3%) |
Occupancy by Age of Householder in Reed
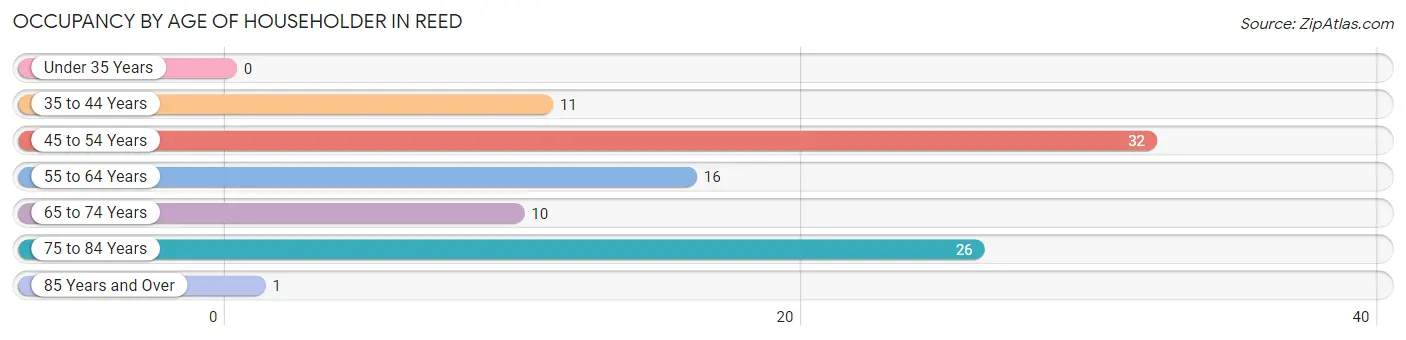
| Age Bracket | # Households | % Households |
| Under 35 Years | 0 | 0.0% |
| 35 to 44 Years | 11 | 11.5% |
| 45 to 54 Years | 32 | 33.3% |
| 55 to 64 Years | 16 | 16.7% |
| 65 to 74 Years | 10 | 10.4% |
| 75 to 84 Years | 26 | 27.1% |
| 85 Years and Over | 1 | 1.0% |
| Total | 96 | 100.0% |
Housing Finances in Reed
Median Income by Occupancy in Reed
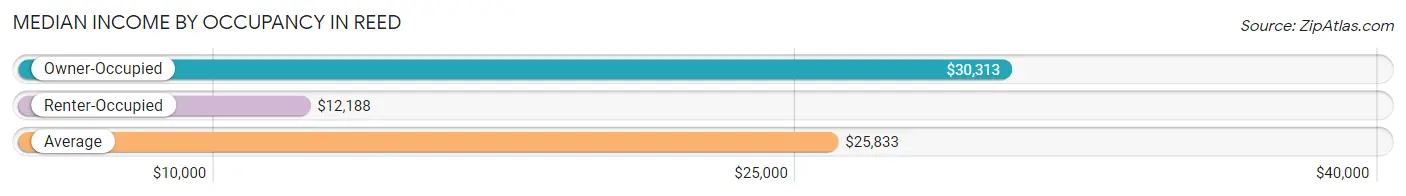
| Occupancy Type | # Households | Median Income |
| Owner-Occupied | 65 (67.7%) | $30,313 |
| Renter-Occupied | 31 (32.3%) | $12,188 |
| Average | 96 (100.0%) | $25,833 |
Occupancy by Householder Income Bracket in Reed
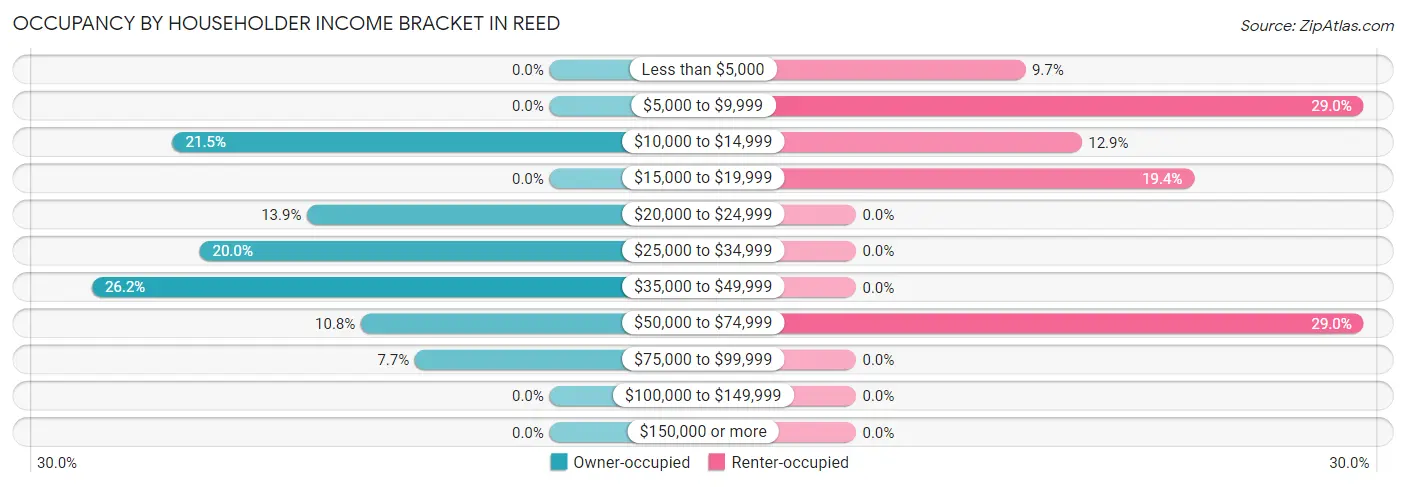
| Income Bracket | Owner-occupied | Renter-occupied |
| Less than $5,000 | 0 (0.0%) | 3 (9.7%) |
| $5,000 to $9,999 | 0 (0.0%) | 9 (29.0%) |
| $10,000 to $14,999 | 14 (21.5%) | 4 (12.9%) |
| $15,000 to $19,999 | 0 (0.0%) | 6 (19.4%) |
| $20,000 to $24,999 | 9 (13.9%) | 0 (0.0%) |
| $25,000 to $34,999 | 13 (20.0%) | 0 (0.0%) |
| $35,000 to $49,999 | 17 (26.2%) | 0 (0.0%) |
| $50,000 to $74,999 | 7 (10.8%) | 9 (29.0%) |
| $75,000 to $99,999 | 5 (7.7%) | 0 (0.0%) |
| $100,000 to $149,999 | 0 (0.0%) | 0 (0.0%) |
| $150,000 or more | 0 (0.0%) | 0 (0.0%) |
| Total | 65 (100.0%) | 31 (100.0%) |
Monthly Housing Cost Tiers in Reed
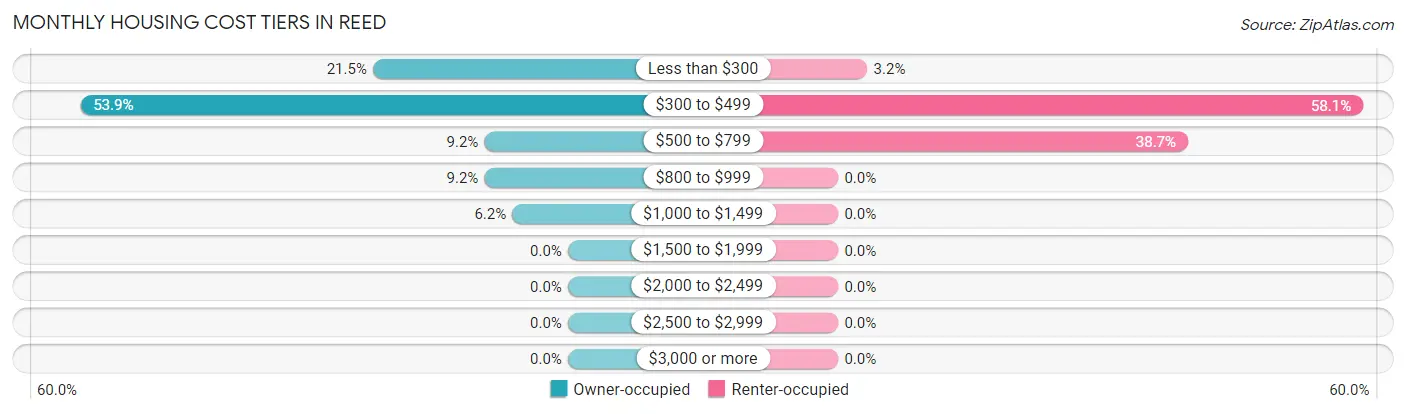
| Monthly Cost | Owner-occupied | Renter-occupied |
| Less than $300 | 14 (21.5%) | 1 (3.2%) |
| $300 to $499 | 35 (53.8%) | 18 (58.1%) |
| $500 to $799 | 6 (9.2%) | 12 (38.7%) |
| $800 to $999 | 6 (9.2%) | 0 (0.0%) |
| $1,000 to $1,499 | 4 (6.1%) | 0 (0.0%) |
| $1,500 to $1,999 | 0 (0.0%) | 0 (0.0%) |
| $2,000 to $2,499 | 0 (0.0%) | 0 (0.0%) |
| $2,500 to $2,999 | 0 (0.0%) | 0 (0.0%) |
| $3,000 or more | 0 (0.0%) | 0 (0.0%) |
| Total | 65 (100.0%) | 31 (100.0%) |
Physical Housing Characteristics in Reed
Housing Structures in Reed
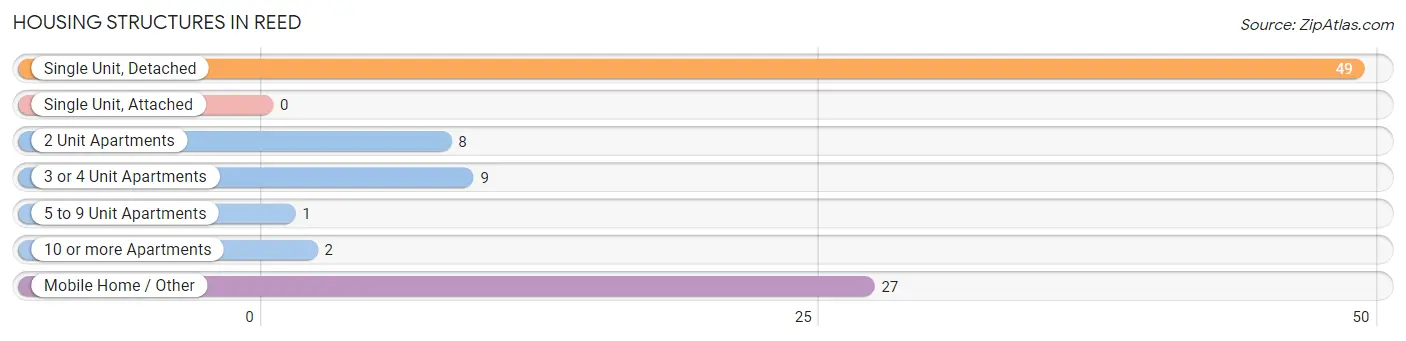
| Structure Type | # Housing Units | % Housing Units |
| Single Unit, Detached | 49 | 51.0% |
| Single Unit, Attached | 0 | 0.0% |
| 2 Unit Apartments | 8 | 8.3% |
| 3 or 4 Unit Apartments | 9 | 9.4% |
| 5 to 9 Unit Apartments | 1 | 1.0% |
| 10 or more Apartments | 2 | 2.1% |
| Mobile Home / Other | 27 | 28.1% |
| Total | 96 | 100.0% |
Housing Structures by Occupancy in Reed
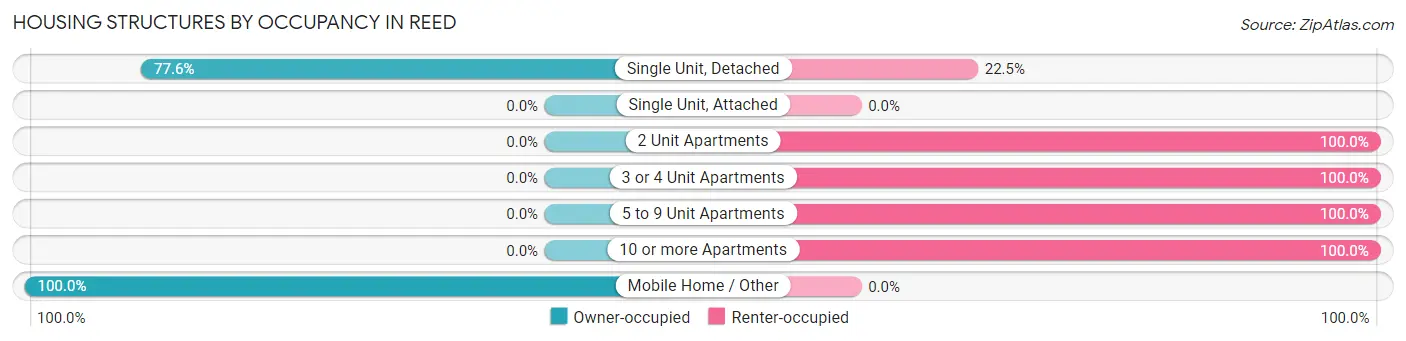
| Structure Type | Owner-occupied | Renter-occupied |
| Single Unit, Detached | 38 (77.5%) | 11 (22.5%) |
| Single Unit, Attached | 0 (0.0%) | 0 (0.0%) |
| 2 Unit Apartments | 0 (0.0%) | 8 (100.0%) |
| 3 or 4 Unit Apartments | 0 (0.0%) | 9 (100.0%) |
| 5 to 9 Unit Apartments | 0 (0.0%) | 1 (100.0%) |
| 10 or more Apartments | 0 (0.0%) | 2 (100.0%) |
| Mobile Home / Other | 27 (100.0%) | 0 (0.0%) |
| Total | 65 (67.7%) | 31 (32.3%) |
Housing Structures by Number of Rooms in Reed
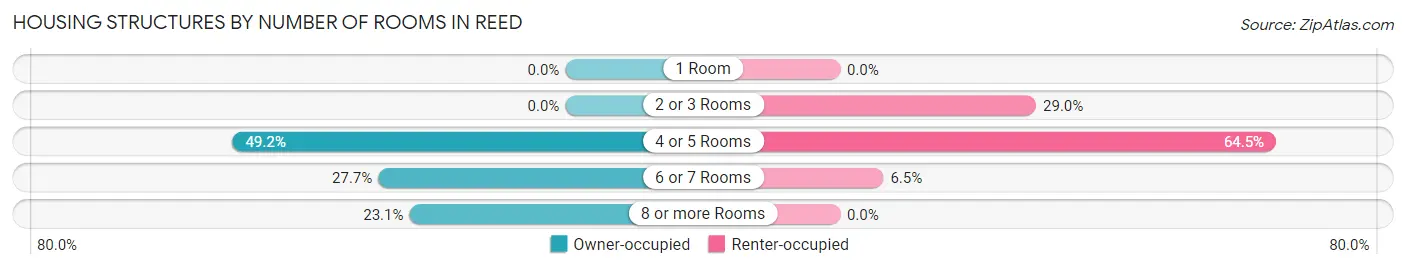
| Number of Rooms | Owner-occupied | Renter-occupied |
| 1 Room | 0 (0.0%) | 0 (0.0%) |
| 2 or 3 Rooms | 0 (0.0%) | 9 (29.0%) |
| 4 or 5 Rooms | 32 (49.2%) | 20 (64.5%) |
| 6 or 7 Rooms | 18 (27.7%) | 2 (6.5%) |
| 8 or more Rooms | 15 (23.1%) | 0 (0.0%) |
| Total | 65 (100.0%) | 31 (100.0%) |
Housing Structure by Heating Type in Reed
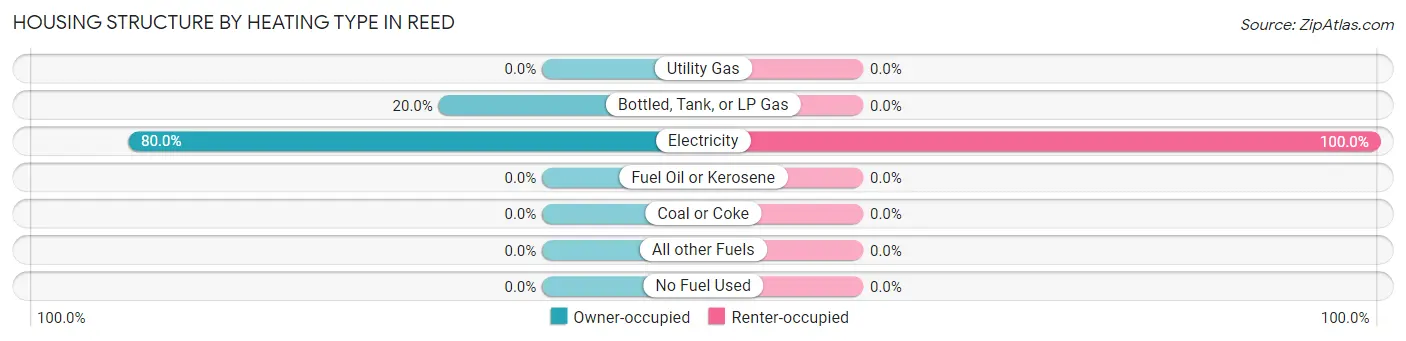
| Heating Type | Owner-occupied | Renter-occupied |
| Utility Gas | 0 (0.0%) | 0 (0.0%) |
| Bottled, Tank, or LP Gas | 13 (20.0%) | 0 (0.0%) |
| Electricity | 52 (80.0%) | 31 (100.0%) |
| Fuel Oil or Kerosene | 0 (0.0%) | 0 (0.0%) |
| Coal or Coke | 0 (0.0%) | 0 (0.0%) |
| All other Fuels | 0 (0.0%) | 0 (0.0%) |
| No Fuel Used | 0 (0.0%) | 0 (0.0%) |
| Total | 65 (100.0%) | 31 (100.0%) |
Household Vehicle Usage in Reed
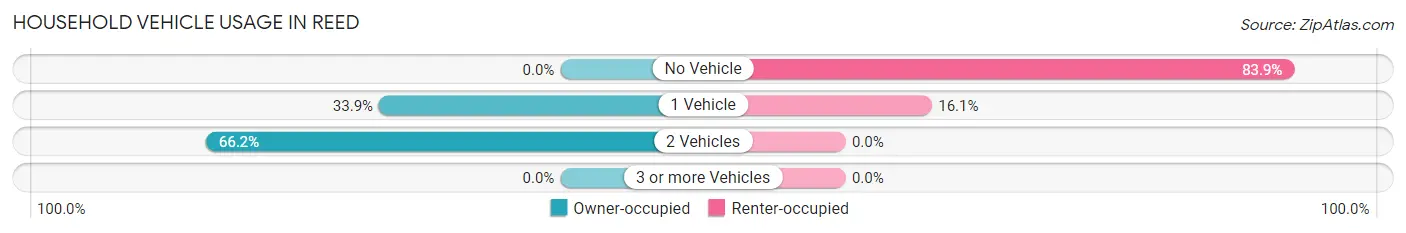
| Vehicles per Household | Owner-occupied | Renter-occupied |
| No Vehicle | 0 (0.0%) | 26 (83.9%) |
| 1 Vehicle | 22 (33.9%) | 5 (16.1%) |
| 2 Vehicles | 43 (66.1%) | 0 (0.0%) |
| 3 or more Vehicles | 0 (0.0%) | 0 (0.0%) |
| Total | 65 (100.0%) | 31 (100.0%) |
Real Estate & Mortgages in Reed
Real Estate and Mortgage Overview in Reed
| Characteristic | Without Mortgage | With Mortgage |
| Housing Units | 55 | 10 |
| Median Property Value | $81,000 | $0 |
| Median Household Income | $26,250 | $0 |
| Monthly Housing Costs | $407 | $0 |
| Real Estate Taxes | - | - |
Property Value by Mortgage Status in Reed
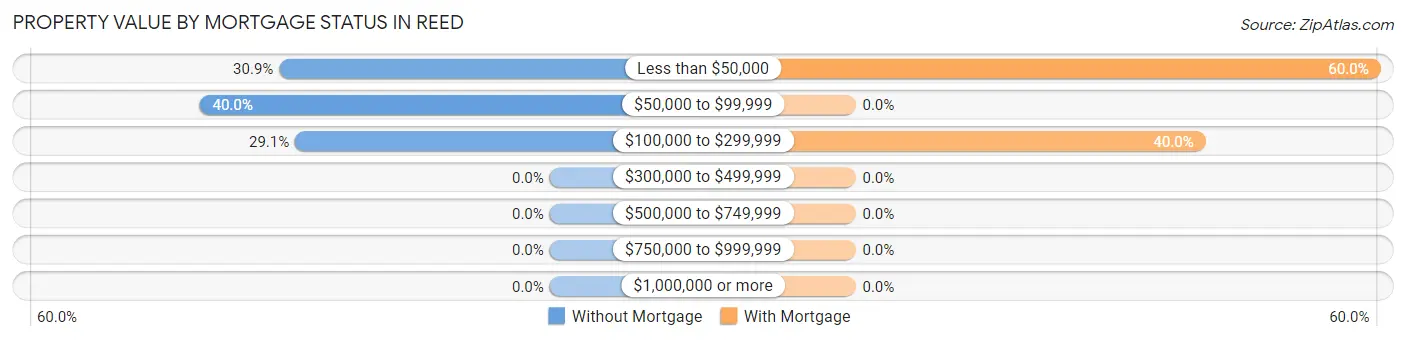
| Property Value | Without Mortgage | With Mortgage |
| Less than $50,000 | 17 (30.9%) | 6 (60.0%) |
| $50,000 to $99,999 | 22 (40.0%) | 0 (0.0%) |
| $100,000 to $299,999 | 16 (29.1%) | 4 (40.0%) |
| $300,000 to $499,999 | 0 (0.0%) | 0 (0.0%) |
| $500,000 to $749,999 | 0 (0.0%) | 0 (0.0%) |
| $750,000 to $999,999 | 0 (0.0%) | 0 (0.0%) |
| $1,000,000 or more | 0 (0.0%) | 0 (0.0%) |
| Total | 55 (100.0%) | 10 (100.0%) |
Household Income by Mortgage Status in Reed
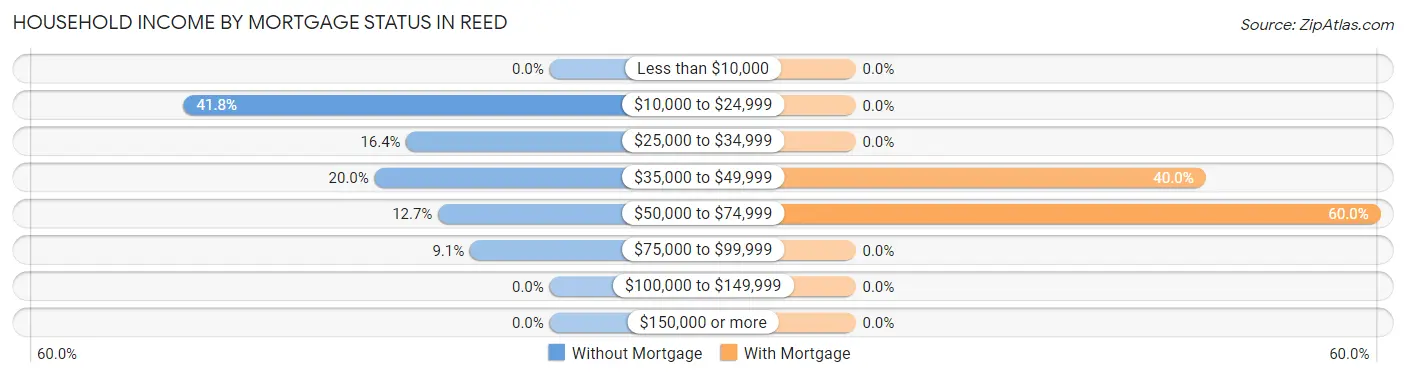
| Household Income | Without Mortgage | With Mortgage |
| Less than $10,000 | 0 (0.0%) | 0 (0.0%) |
| $10,000 to $24,999 | 23 (41.8%) | 0 (0.0%) |
| $25,000 to $34,999 | 9 (16.4%) | 0 (0.0%) |
| $35,000 to $49,999 | 11 (20.0%) | 4 (40.0%) |
| $50,000 to $74,999 | 7 (12.7%) | 6 (60.0%) |
| $75,000 to $99,999 | 5 (9.1%) | 0 (0.0%) |
| $100,000 to $149,999 | 0 (0.0%) | 0 (0.0%) |
| $150,000 or more | 0 (0.0%) | 0 (0.0%) |
| Total | 55 (100.0%) | 10 (100.0%) |
Property Value to Household Income Ratio in Reed
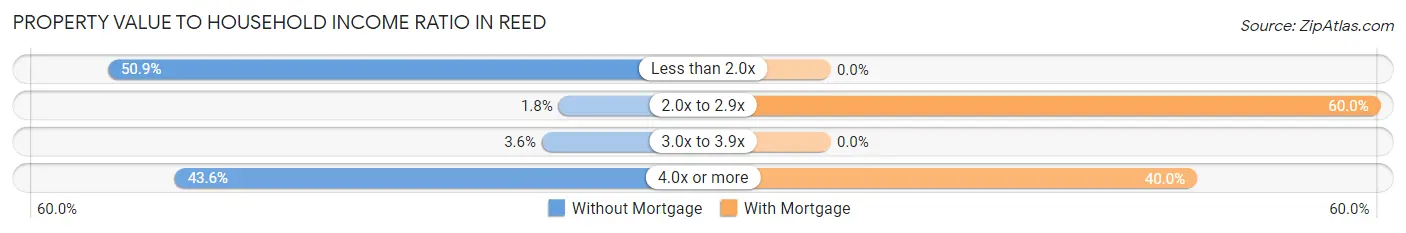
| Value-to-Income Ratio | Without Mortgage | With Mortgage |
| Less than 2.0x | 28 (50.9%) | 0 (0.0%) |
| 2.0x to 2.9x | 1 (1.8%) | 6 (60.0%) |
| 3.0x to 3.9x | 2 (3.6%) | 0 (0.0%) |
| 4.0x or more | 24 (43.6%) | 4 (40.0%) |
| Total | 55 (100.0%) | 10 (100.0%) |
Real Estate Taxes by Mortgage Status in Reed
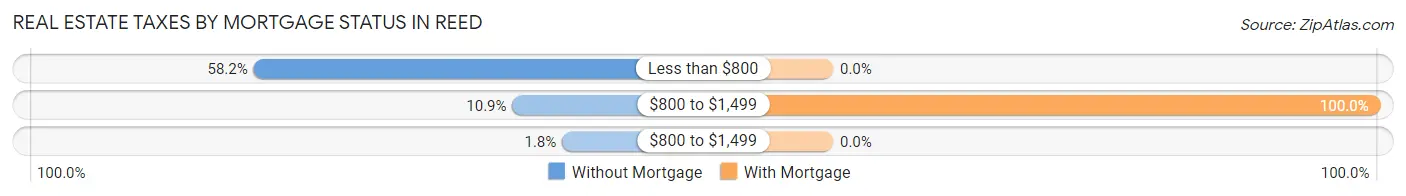
| Property Taxes | Without Mortgage | With Mortgage |
| Less than $800 | 32 (58.2%) | 0 (0.0%) |
| $800 to $1,499 | 6 (10.9%) | 10 (100.0%) |
| $800 to $1,499 | 1 (1.8%) | 0 (0.0%) |
| Total | 55 (100.0%) | 10 (100.0%) |
Health & Disability in Reed
Health Insurance Coverage by Age in Reed
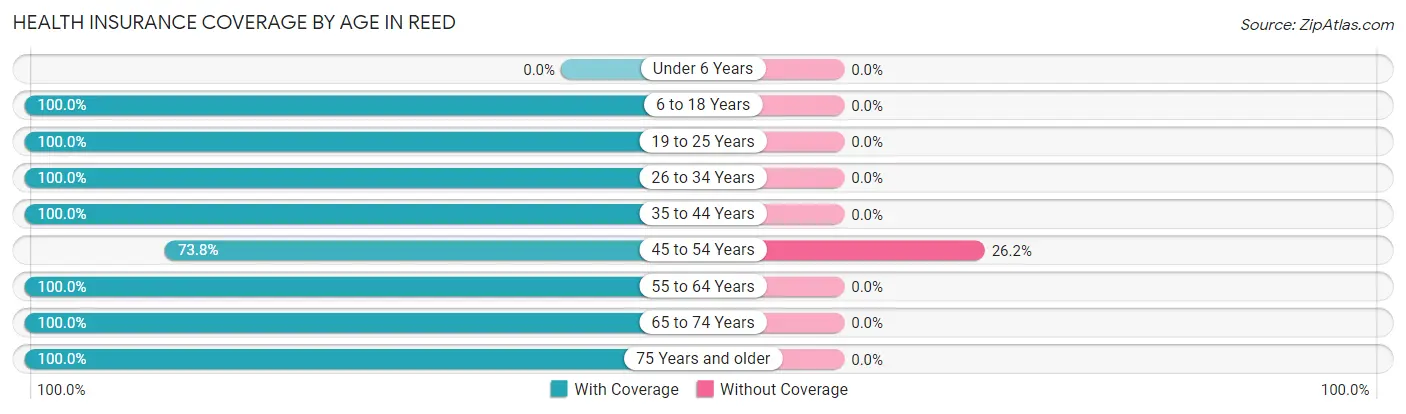
| Age Bracket | With Coverage | Without Coverage |
| Under 6 Years | 0 (0.0%) | 0 (0.0%) |
| 6 to 18 Years | 2 (100.0%) | 0 (0.0%) |
| 19 to 25 Years | 11 (100.0%) | 0 (0.0%) |
| 26 to 34 Years | 3 (100.0%) | 0 (0.0%) |
| 35 to 44 Years | 11 (100.0%) | 0 (0.0%) |
| 45 to 54 Years | 31 (73.8%) | 11 (26.2%) |
| 55 to 64 Years | 33 (100.0%) | 0 (0.0%) |
| 65 to 74 Years | 19 (100.0%) | 0 (0.0%) |
| 75 Years and older | 38 (100.0%) | 0 (0.0%) |
| Total | 148 (93.1%) | 11 (6.9%) |
Health Insurance Coverage by Citizenship Status in Reed
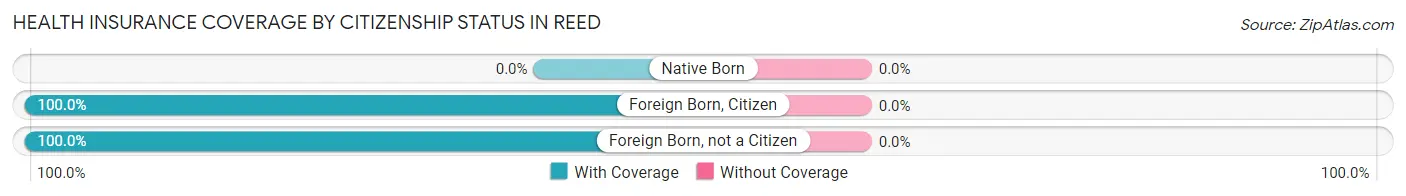
| Citizenship Status | With Coverage | Without Coverage |
| Native Born | 0 (0.0%) | 0 (0.0%) |
| Foreign Born, Citizen | 2 (100.0%) | 0 (0.0%) |
| Foreign Born, not a Citizen | 11 (100.0%) | 0 (0.0%) |
Health Insurance Coverage by Household Income in Reed
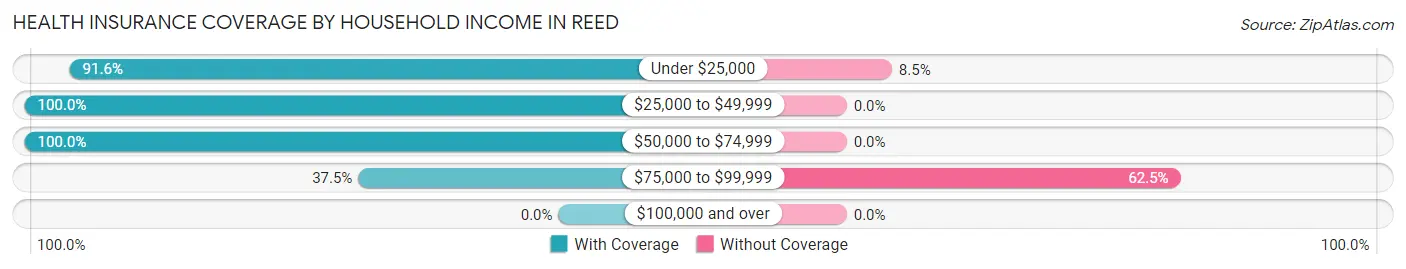
| Household Income | With Coverage | Without Coverage |
| Under $25,000 | 65 (91.5%) | 6 (8.5%) |
| $25,000 to $49,999 | 57 (100.0%) | 0 (0.0%) |
| $50,000 to $74,999 | 23 (100.0%) | 0 (0.0%) |
| $75,000 to $99,999 | 3 (37.5%) | 5 (62.5%) |
| $100,000 and over | 0 (0.0%) | 0 (0.0%) |
Public vs Private Health Insurance Coverage by Age in Reed
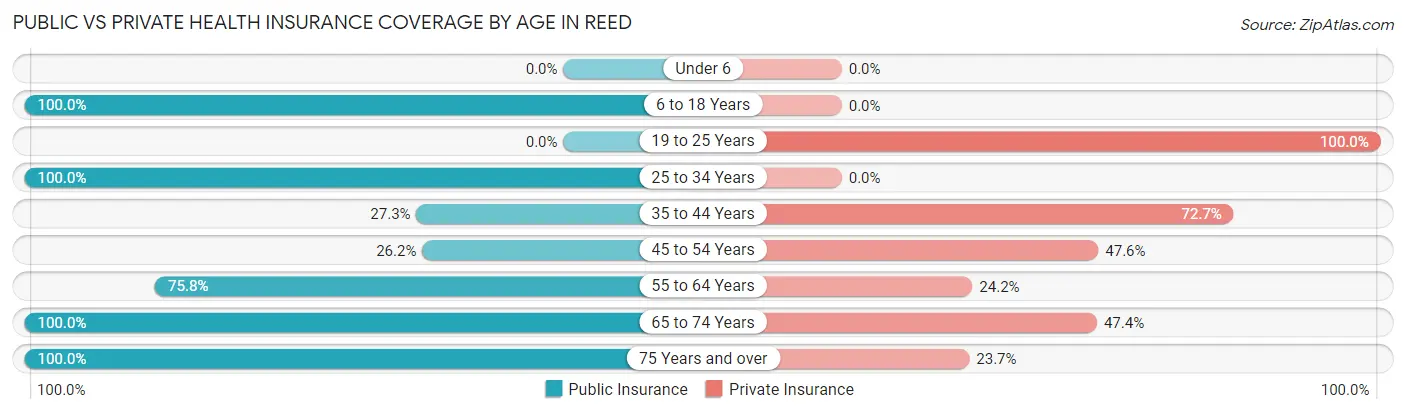
| Age Bracket | Public Insurance | Private Insurance |
| Under 6 | 0 (0.0%) | 0 (0.0%) |
| 6 to 18 Years | 2 (100.0%) | 0 (0.0%) |
| 19 to 25 Years | 0 (0.0%) | 11 (100.0%) |
| 25 to 34 Years | 3 (100.0%) | 0 (0.0%) |
| 35 to 44 Years | 3 (27.3%) | 8 (72.7%) |
| 45 to 54 Years | 11 (26.2%) | 20 (47.6%) |
| 55 to 64 Years | 25 (75.8%) | 8 (24.2%) |
| 65 to 74 Years | 19 (100.0%) | 9 (47.4%) |
| 75 Years and over | 38 (100.0%) | 9 (23.7%) |
| Total | 101 (63.5%) | 65 (40.9%) |
Disability Status by Sex by Age in Reed
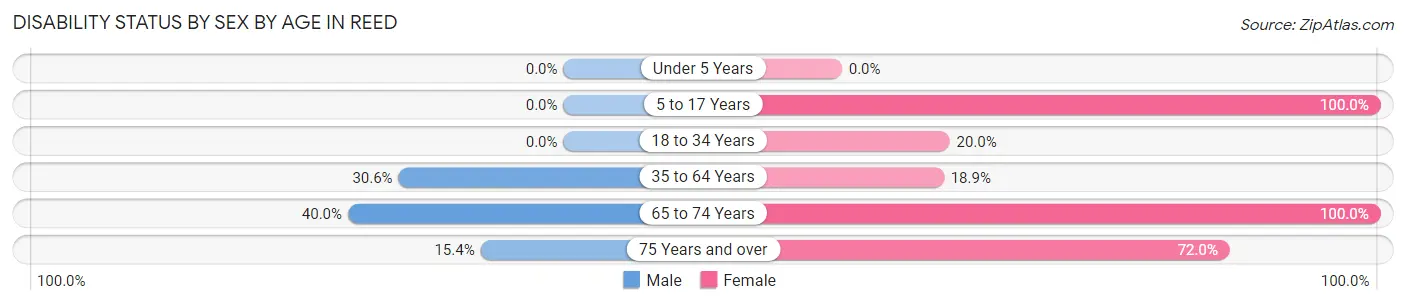
| Age Bracket | Male | Female |
| Under 5 Years | 0 (0.0%) | 0 (0.0%) |
| 5 to 17 Years | 0 (0.0%) | 2 (100.0%) |
| 18 to 34 Years | 0 (0.0%) | 1 (20.0%) |
| 35 to 64 Years | 15 (30.6%) | 7 (18.9%) |
| 65 to 74 Years | 4 (40.0%) | 9 (100.0%) |
| 75 Years and over | 2 (15.4%) | 18 (72.0%) |
Disability Class by Sex by Age in Reed
Disability Class: Hearing Difficulty
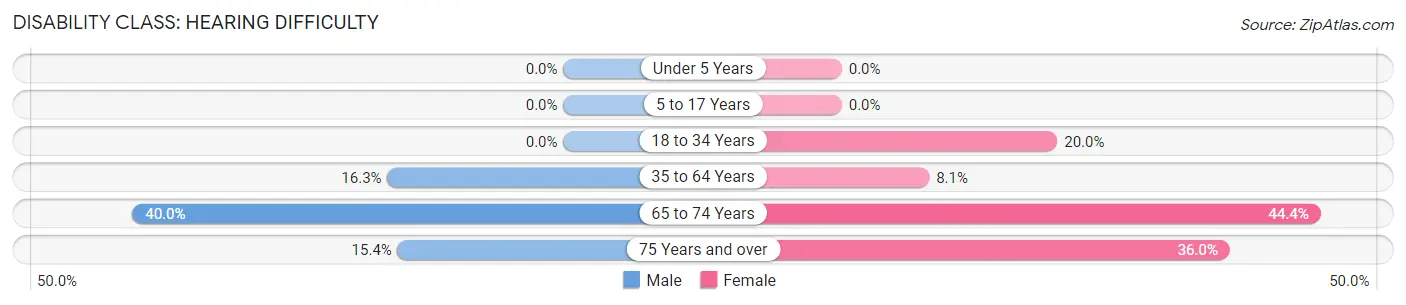
| Age Bracket | Male | Female |
| Under 5 Years | 0 (0.0%) | 0 (0.0%) |
| 5 to 17 Years | 0 (0.0%) | 0 (0.0%) |
| 18 to 34 Years | 0 (0.0%) | 1 (20.0%) |
| 35 to 64 Years | 8 (16.3%) | 3 (8.1%) |
| 65 to 74 Years | 4 (40.0%) | 4 (44.4%) |
| 75 Years and over | 2 (15.4%) | 9 (36.0%) |
Disability Class: Vision Difficulty
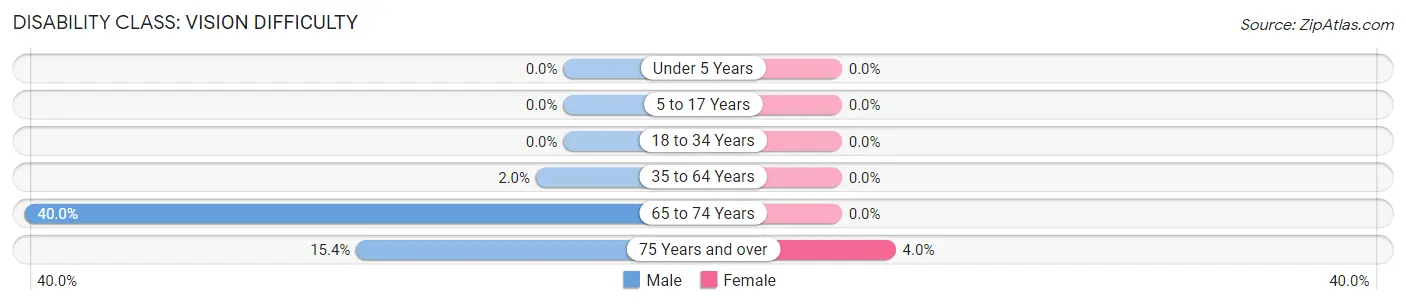
| Age Bracket | Male | Female |
| Under 5 Years | 0 (0.0%) | 0 (0.0%) |
| 5 to 17 Years | 0 (0.0%) | 0 (0.0%) |
| 18 to 34 Years | 0 (0.0%) | 0 (0.0%) |
| 35 to 64 Years | 1 (2.0%) | 0 (0.0%) |
| 65 to 74 Years | 4 (40.0%) | 0 (0.0%) |
| 75 Years and over | 2 (15.4%) | 1 (4.0%) |
Disability Class: Cognitive Difficulty
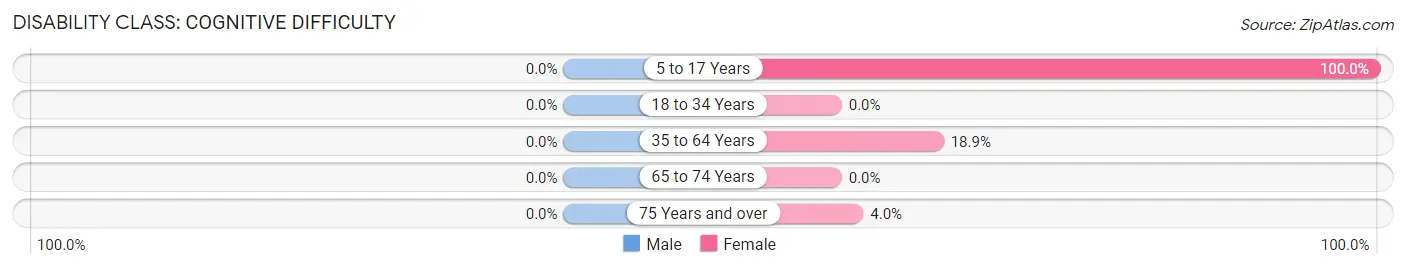
| Age Bracket | Male | Female |
| 5 to 17 Years | 0 (0.0%) | 2 (100.0%) |
| 18 to 34 Years | 0 (0.0%) | 0 (0.0%) |
| 35 to 64 Years | 0 (0.0%) | 7 (18.9%) |
| 65 to 74 Years | 0 (0.0%) | 0 (0.0%) |
| 75 Years and over | 0 (0.0%) | 1 (4.0%) |
Disability Class: Ambulatory Difficulty
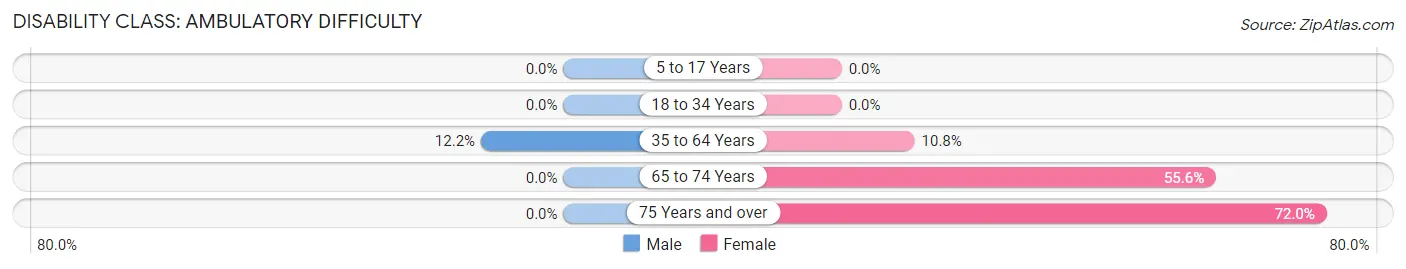
| Age Bracket | Male | Female |
| 5 to 17 Years | 0 (0.0%) | 0 (0.0%) |
| 18 to 34 Years | 0 (0.0%) | 0 (0.0%) |
| 35 to 64 Years | 6 (12.2%) | 4 (10.8%) |
| 65 to 74 Years | 0 (0.0%) | 5 (55.6%) |
| 75 Years and over | 0 (0.0%) | 18 (72.0%) |
Disability Class: Self-Care Difficulty
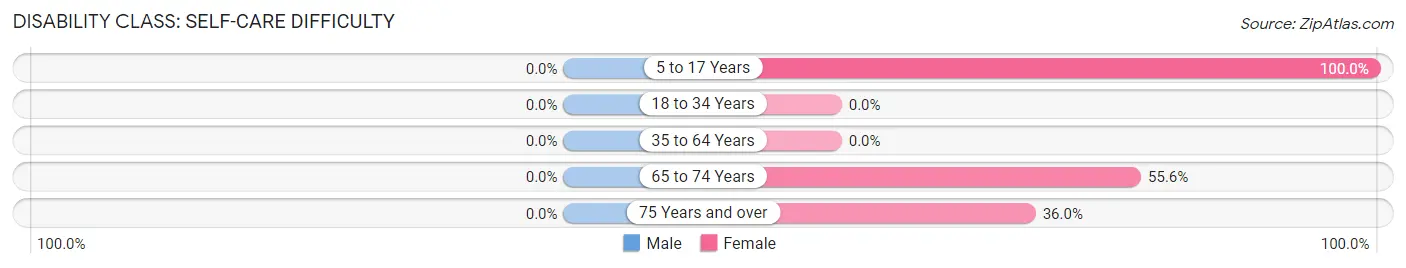
| Age Bracket | Male | Female |
| 5 to 17 Years | 0 (0.0%) | 2 (100.0%) |
| 18 to 34 Years | 0 (0.0%) | 0 (0.0%) |
| 35 to 64 Years | 0 (0.0%) | 0 (0.0%) |
| 65 to 74 Years | 0 (0.0%) | 5 (55.6%) |
| 75 Years and over | 0 (0.0%) | 9 (36.0%) |
Technology Access in Reed
Computing Device Access in Reed
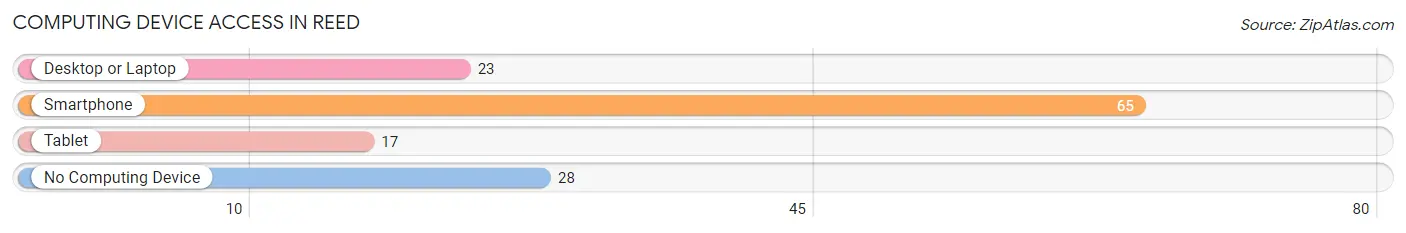
| Device Type | # Households | % Households |
| Desktop or Laptop | 23 | 24.0% |
| Smartphone | 65 | 67.7% |
| Tablet | 17 | 17.7% |
| No Computing Device | 28 | 29.2% |
| Total | 96 | 100.0% |
Internet Access in Reed
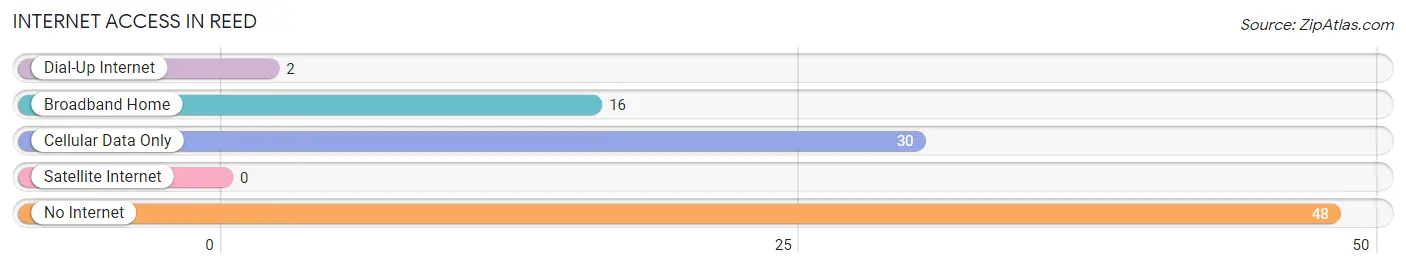
| Internet Type | # Households | % Households |
| Dial-Up Internet | 2 | 2.1% |
| Broadband Home | 16 | 16.7% |
| Cellular Data Only | 30 | 31.2% |
| Satellite Internet | 0 | 0.0% |
| No Internet | 48 | 50.0% |
| Total | 96 | 100.0% |
Reed Summary
Reed is a small town located in the state of Arkansas, in the United States. It is situated in the northwest corner of the state, in the Ozark Mountains. The town is located in Madison County, and is part of the Fayetteville-Springdale-Rogers Metropolitan Statistical Area. As of the 2010 census, the population of Reed was 1,072.
History
Reed was founded in 1883 by a group of settlers from Missouri. The town was named after a local family, the Reeds. The town was originally a farming community, and the main crops grown were cotton, corn, and wheat. In the early 1900s, the town began to grow and develop, and by the 1920s, it had become a thriving community.
In the 1950s, the town began to experience a decline in population, as many of the residents moved away in search of better economic opportunities. However, in the late 1970s, the town began to experience a resurgence, as new businesses and industries began to move into the area. Today, Reed is a small but vibrant community, with a variety of businesses and services.
Geography
Reed is located in the northwest corner of Arkansas, in the Ozark Mountains. The town is situated in Madison County, and is part of the Fayetteville-Springdale-Rogers Metropolitan Statistical Area. The town is located at an elevation of 1,072 feet above sea level.
The town is located near the White River, which provides a variety of recreational activities, such as fishing and boating. The town is also located near the Ozark National Forest, which provides a variety of outdoor activities, such as hiking, camping, and hunting.
Economy
Reed is a small town, and the economy is largely based on agriculture and tourism. The town is home to a variety of small businesses, such as restaurants, shops, and services. The town is also home to a number of manufacturing companies, such as a furniture factory and a plastics factory.
The town is also home to a variety of tourist attractions, such as the Ozark National Forest, the White River, and the Ozark Mountains. These attractions draw visitors from all over the country, and provide a boost to the local economy.
Demographics
As of the 2010 census, the population of Reed was 1,072. The racial makeup of the town was 95.3% White, 0.7% African American, 0.3% Native American, 0.3% Asian, 0.1% Pacific Islander, and 2.3% from other races. The median household income was $35,000, and the median family income was $41,000. The per capita income was $17,000.
Conclusion
Reed is a small town located in the northwest corner of Arkansas, in the Ozark Mountains. The town is home to a variety of businesses and services, and is a popular tourist destination. The town has a population of 1,072, and the median household income is $35,000. The town is largely based on agriculture and tourism, and provides a variety of recreational activities, such as fishing and boating.
Common Questions
What is Per Capita Income in Reed?
Per Capita income in Reed is $18,389.
What is the Median Family Income in Reed?
Median Family Income in Reed is $30,938.
What is the Median Household income in Reed?
Median Household Income in Reed is $25,833.
What is Income or Wage Gap in Reed?
Income or Wage Gap in Reed is 27.7%.
Women in Reed earn 72.3 cents for every dollar earned by a man.
What is Inequality or Gini Index in Reed?
Inequality or Gini Index in Reed is 0.38.
What is the Total Population of Reed?
Total Population of Reed is 159.
What is the Total Male Population of Reed?
Total Male Population of Reed is 81.
What is the Total Female Population of Reed?
Total Female Population of Reed is 78.
What is the Ratio of Males per 100 Females in Reed?
There are 103.85 Males per 100 Females in Reed.
What is the Ratio of Females per 100 Males in Reed?
There are 96.30 Females per 100 Males in Reed.
What is the Median Population Age in Reed?
Median Population Age in Reed is 58.1 Years.
What is the Average Family Size in Reed
Average Family Size in Reed is 2.1 People.
What is the Average Household Size in Reed
Average Household Size in Reed is 1.7 People.
How Large is the Labor Force in Reed?
There are 48 People in the Labor Forcein in Reed.
What is the Percentage of People in the Labor Force in Reed?
30.6% of People are in the Labor Force in Reed.